1. Introduction
Given the repaid growth of China’s economy, reducing carbon emissions appears to be quite challenging. In response to environmental concerns and in adherence to the Paris Agreement, the Chinese government has established a specific timeline for achieving crucial targets for carbon emissions. China will peak carbon emissions, reduce carbon intensity by 60% to 65% relative to GDP before 2030 and become carbon neutral before 2060 [
1]. Nevertheless, China is confronted with unparalleled hurdles in attaining its crucial targets. Presently, China boasts the largest carbon emissions globally, as highlighted by the World Energy Yearbook 2021, which accredits China with contributing to a substantial 45% of global carbon emissions. Furthermore, China’s process of industrialization and urbanization remains incomplete, augmenting the already challenging backdrop of elevated carbon emissions and intensified carbon intensity, thereby compounding the complexities associated with accomplishing these targets. The study found that carbon emission intensity and GDP have maintained growth in the past decade, and the GDP growth rate has been declining, but the overall growth rate is still higher than the carbon emissions. Therefore, there is a trend of decreasing carbon emission intensity year by year, but the rate of decline in carbon emission intensity has been slowing down in recent years.
At present, the development of a new generation of general technology and the new infrastructure, which is driven by the new development concept and technological innovation, can provide digital transformation, intelligent upgrading, and other services for almost all industries to meet the demand for high-quality development based on the development of information networks. New infrastructure, mainly including 5G infrastructure, artificial intelligence, industrial Internet, big data centers, intercity high-speed railway and intercity rail transit, and a new energy vehicle charging pile. New infrastructure has become an important carrier for the development of China’s digital economy. It plays a pivotal role in ensuring stable economic operation, stimulating investment, promoting sustainable growth, stimulating consumption, and promoting the stable and orderly development of China’s economy [
2,
3]. It also drives the penetration and derivation of digital technology, promotes the intelligent development of traditional industries, improves the utilization rate of new energy, and improves the traditional energy consumption structure [
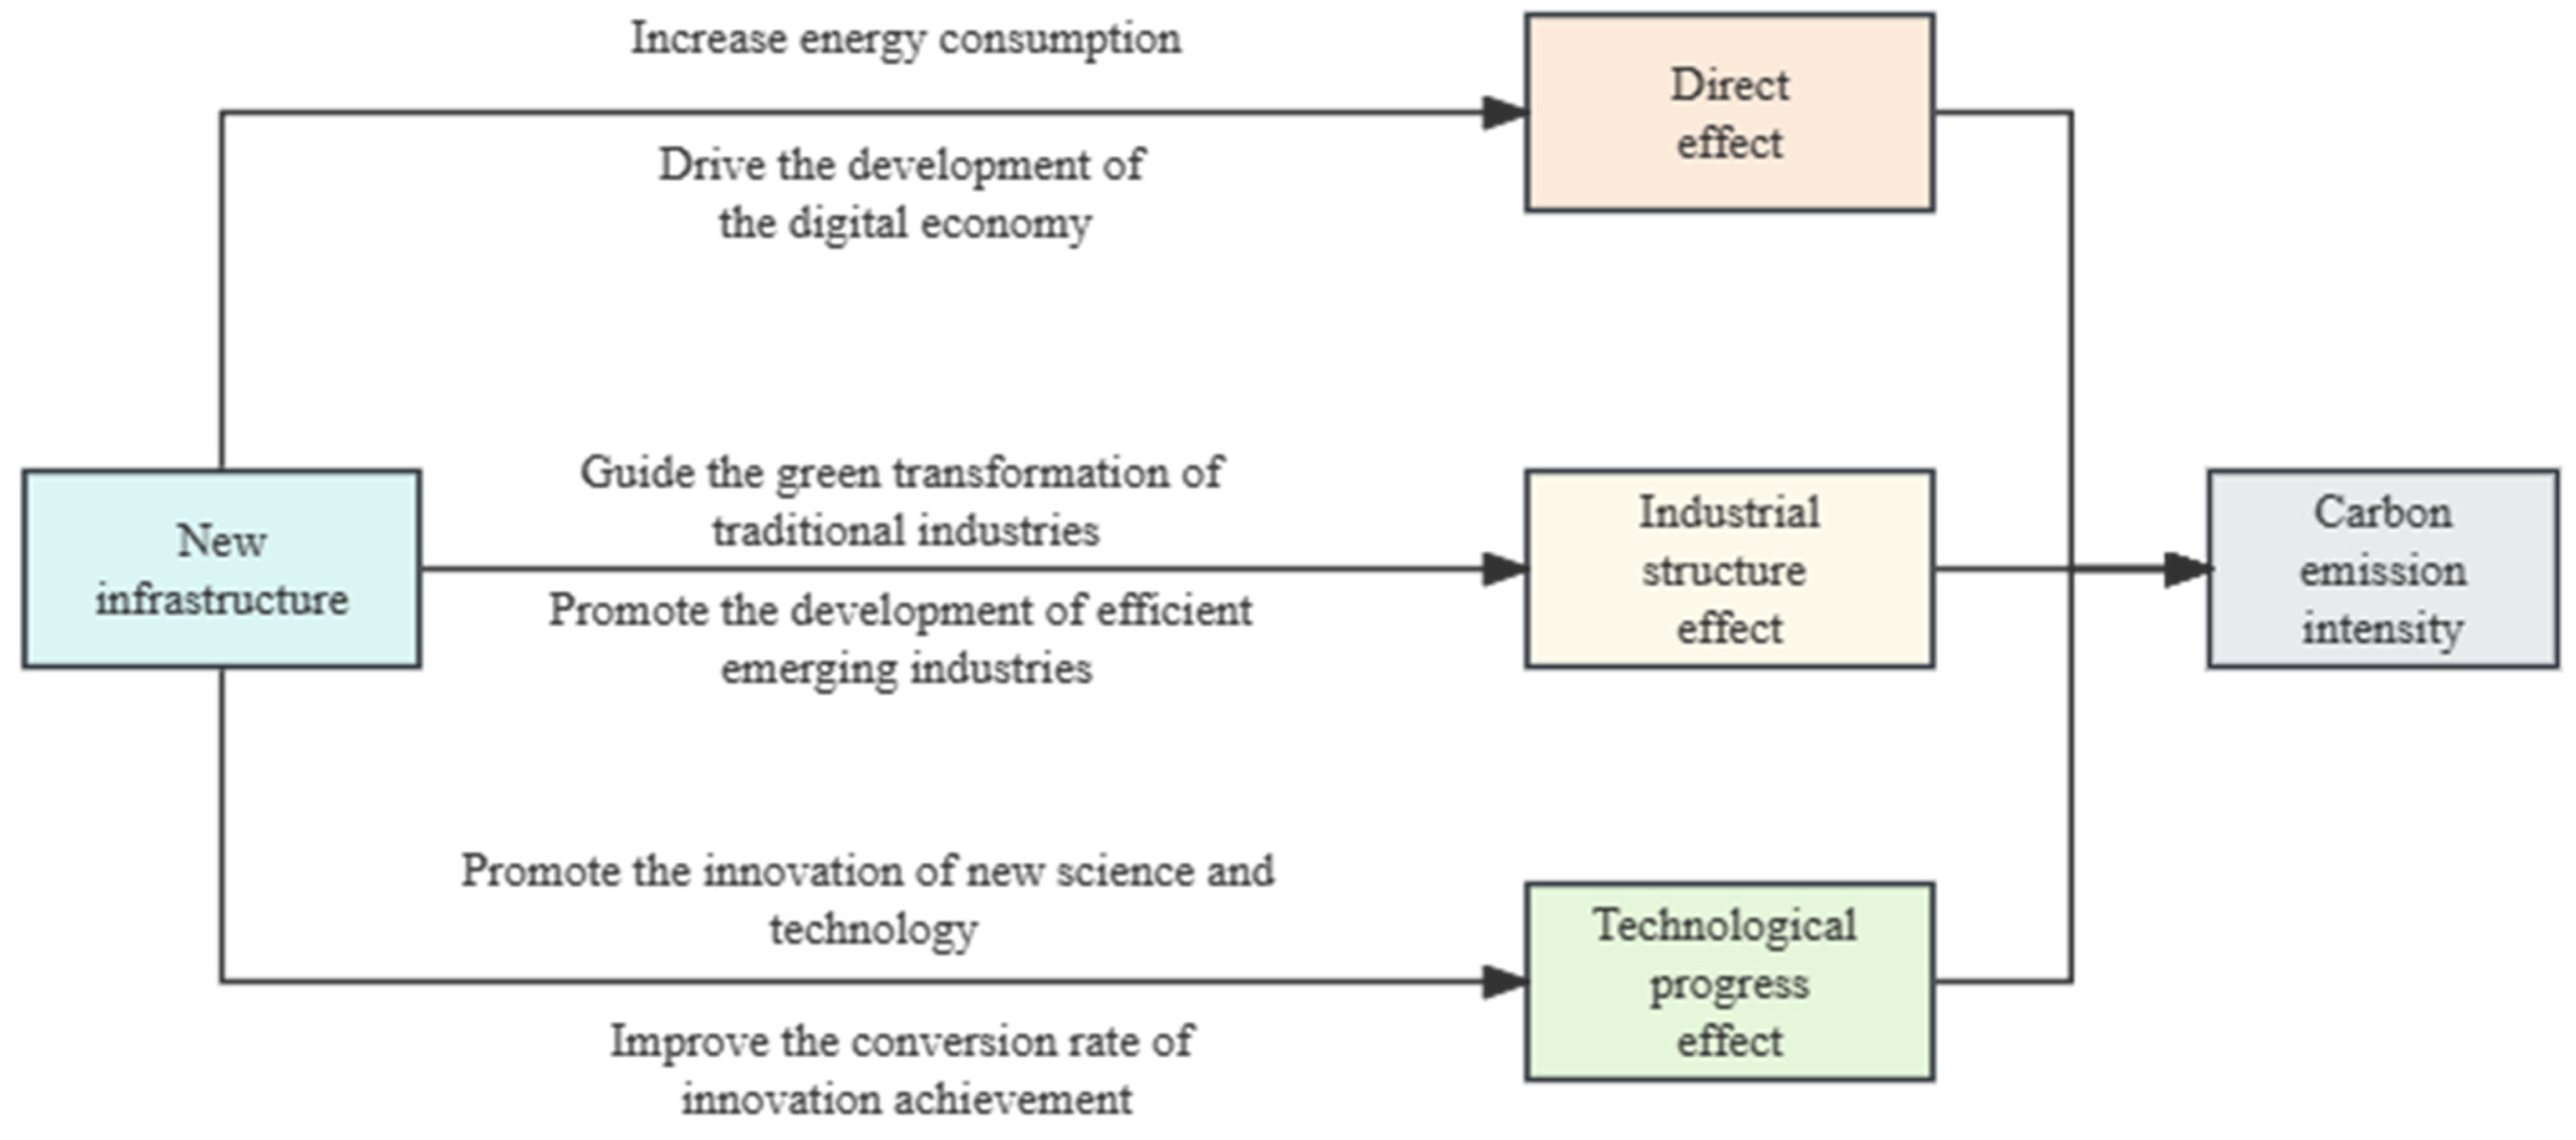
4]. Therefore, new infrastructure can improve energy efficiency, industrial structure transformation, technological innovation capabilities; it can also offer other ways to affect carbon emissions, economic growth, and changes in carbon emission intensity. At present, China is facing the dual pressures of economic restructuring and reducing carbon emissions. While actively promoting new infrastructure, attention should be paid to its impact on carbon intensity. Studying the impact of new infrastructure on regional carbon intensity is an important reference and urgent need for regional low-carbon development.
For a long time, China has been implementing an extensive economic development model, resulting in the concentration of production factors such as labor, capital, and technology in cities that are more open to coastal areas due to uneven resource distribution. This situation hinders the coordinated development of the regional environment and leads to significant differences in carbon emission intensity among regions. In response, China has actively adjusted its regional development policies to achieve coordinated regional development and has made certain achievements. The rapid development of new infrastructure, such as artificial intelligence technology, big data, and cloud computing, along with the flourishing digital economy, which is different from the traditional internet economy, has created new development opportunities and facilitated the coordinated development of the regional environment [
5]. By understanding the effect of new infrastructure on carbon emission intensity in different regions and implementing carbon emission reduction targets accordingly, we can provide scientific suggestions for targeted regional carbon emission reduction efforts.
The contributions of this study are as follows: At the theoretical level, this study uses structure and technology as the starting point to illustrate how new infrastructure affects carbon emission intensity. This study hypothesizes that new infrastructure affects carbon emission intensity by improving energy structure, promoting industrial structure upgrading, and enhancing technological innovation capabilities, but this effect has nonlinear variation characteristics and regional heterogeneity. At the empirical level, based on China’s interprovincial panel data from 2011 to 2020, this study provides evidence on the impact of new infrastructure on carbon intensity from three perspectives: scale, structural and technical role, and evaluates its mechanism. In this study, nonlinear changes were also examined, and heterogeneity analysis and spatial effect observations were performed from the perspective of regional characteristics. The novelty of this study is as follows: the impact of new infrastructure on regional carbon intensity is evaluated from both theoretical and empirical perspectives; the role of new infrastructure is included in the analysis framework of carbon intensity influencing factors, and the impact mechanism is comprehensively analyzed from three dimensions: scale, structure, and technology. As a result, this study provides new insights into how new infrastructure affects carbon intensity. Due to the high degree of isomorphism in the economic development models and structures of large developing countries [
6], the findings of this paper are of great significance for the sustainable economic development of other developing countries, especially emerging economies.
The remainder of this paper is organized as follows:
Section 2 analyzes the existing literature.
Section 3 describes the methods and data.
Section 4 presents the empirical findings with a discussion.
Section 5 concludes and proposes policy implications.
4. Methodology and Data
4.1. Econometric Methodology
Based on a qualitative analysis of theoretical assumptions, this study will use quantitative methods to verify whether the hypotheses are valid. This section uses econometric models to analyze the study samples, using fixed-effect models as benchmarks to test hypotheses (H1) and structural equation models to test hypotheses (H2) and (H3). During the analysis, the total study sample was divided into three subsamples by geography to determine the regional heterogeneity influencing the effect. Finally, a spatial econometric model is used to test whether there is a spatial spillover effect.
- (1)
Dynamic panel model
In this study, the STIRPAT model was used to construct an empirical model to detect the impact of new infrastructure on regional carbon emission intensity and test the hypothesis (H1) [
47]. Since this study sample is based on a macro-panel data set, a fixed-effect model (FE) was used for benchmark regression. Fixed-effect models make invisible individual and temporal differences visible by introducing both individual heterogeneity and temporal heterogeneity into the model as dummy variables [
48]. Therefore, the endogenous nature of explanatory variables is eliminated to a certain extent, and heterogeneity is better controlled. In this study, logarithms were taken for all variables to reduce the heteroscedasticity of the data. The following benchmark model is constructed (1):
In the equation, i denotes the district and t denotes the time, α and β denote the estimated parameters. CI denotes the carbon intensity, NI denotes the new infrastructure scale effect, and NI2 denotes the quadratic term of the new infrastructure scale effect. X denotes the control variables, including economic density E, population size P, economic size A, and energy mix S. m is a constant term, k denotes the control variable, and ε is the error term.
- (2)
Intermediary model
Furthermore, by incorporating theoretical analysis, research hypotheses, the concept of mediating effects, and the stepwise regression method, we can effectively explain the pathways through which new infrastructure impacts carbon emission intensity and establish mediating models as follows (2) and (3):
In these equations, Z denotes the mediating variables, the industry optimization effect NS and the technological progress effect NT.
- (3)
Spatial model
Spatial autocorrelation refers to the statistical correlation between attribute values of neighboring spatially distributed objects. When attribute values tend to cluster, they exhibit positive spatial correlation, while attribute values that are dispersed show negative spatial correlation. To measure spatial autocorrelation in this study, we employ Moran’s I index, which is calculated using the following formula:
where
, and
xi denotes the carbon intensity of Province
i;
n is the number of regions; and W is the spatial weight matrix. Moran’s I has a range of values of
. The closer
I is to 1, the stronger the spatial positive correlation between regions. The closer
I is to −1, the stronger the negative spatial correlation; the closer
I is to 0, the more spatial autocorrelation there is no spatial correlation between regions; that is, there is an irregular random distribution in space. For the results of the Moran’s I index, the significance level of spatial autocorrelation can be tested using the standardized statistic
Z.
Spatial weight matrix: The spatial weight matrix quantifies the level of interdependence between the values of specific economic or geographical attributes of different spatial units. In this study, a contiguity spatial weight matrix is employed. It assigns a value of either 0 or 1 to represent the bordering relationship between geographic units, with 0 indicating non-contiguity and 1 indicating contiguity. It should be noted that certain provinces, such as Hainan, are considered isolated areas but have a close neighboring relationship with Guangdong Province.
Spatial econometric model: In the first step, spatial autocorrelation is tested. If spatial autocorrelation is detected, spatial dependence needs to be incorporated into the econometric model. The spatial lag model (SAR) and the spatial error model (SEM) are two approaches that account for the endogenous autocorrelation effect between explanatory variables and the autocorrelation effect between error terms in the model, respectively. Scholars have also developed the spatial Durbin model (SDM), which considers the spatial autocorrelation of both explanatory and dependent variables, leading to more robust estimation results [
49]. In the equation, W is the spatial weight matrix.
4.2. Data Sources and Description
4.2.1. Data Sources
China was chosen as the research object because China’s infrastructure investment has accelerated, based on a series of policies. It can be a point of reference for developing countries. Due to data limitations, this study focuses on 30 provinces and cities in China, excluding Tibet, Hong Kong, Macau, and Taiwan. The research period spans from 2011 to 2020. The data used in this study were obtained from the National Science and Technology Expenditure Statistics Bulletin. To ensure consistency, GDP and industrial output are adjusted to constant prices in 2010.
In this study, the researchers focused on analyzing and comparing the carbon emission intensity and new infrastructure development across China’s 30 provinces and cities. To better understand the regional disparities, the researchers divided these areas into three regions: eastern, central, and western. The eastern region includes Beijing, Tianjin, Hebei, Liaoning, Shanghai, Jiangsu, Zhejiang, Fujian, Shandong, Guangdong, and Hainan; the central region includes Shanxi, Inner Mongolia, Jilin, Heilongjiang, Anhui, Jiangxi, Henan, Hubei, Hunan, and Guangxi; and the western region includes Chongqing, Sichuan, Guizhou, Yunnan, Shaanxi, Gansu, Qinghai, Ningxia, and Xinjiang.
4.2.2. Explanatory Variable: Carbon Emission Intensity (CI)
Carbon emission intensity refers to the amount of carbon emissions per unit of GDP. In this study, carbon emissions are first calculated using the carbon emission coefficient method. The carbon emissions of each province and city are then divided by their respective GDP values to derive the carbon emission intensity. The primary energy sources discussed in this study include coal, coke, crude oil, gasoline, paraffin, diesel, fuel oil, and natural gas. According to the estimation method proposed by the IPCC (2006) [
50], the carbon emission coefficients are derived from the average low-level heat content of these energy sources, the standard coal conversion factor, the carbon content per unit calorific value of energy sources, and the carbon oxidation rate. The findings of this study suggest that China’s GDP has been steadily growing, accompanied by a continuous increase in carbon emissions. However, the intensity of carbon emissions has gradually decreased over the past decade. By 2020, the average carbon emission intensity of each province and city had reduced to 3.82 tons per billion yuan.
4.2.3. Core Explanatory Variable: The Scale of New Infrastructure (NI)
The scale efficiency of new infrastructure applies to the capital stock of new infrastructure. Based on investment data, the perpetual inventory method is used to account for the capital stock of new infrastructure. New infrastructure investment includes seven major areas: 5G, intercity high-speed rail and rail transit, UHV, new energy vehicle charging piles, big data centers, artificial intelligence, and industrial Internet, which are expressed by selecting fixed asset investment in different industries. According to the seven major areas of new infrastructure corresponding to different industry investment, the use of telecommunications, radio and television and satellite transmission services, railway transportation fixed industry, electric power, heat production and supply industry, electrical machinery and equipment manufacturing, professional and technical services, Internet and related services, science and technology promotion, and application services industry fixed asset investment to calculate the level of new infrastructure development. This paper uses the new infrastructure investment in 2010 divided by 10% as the base year of new infrastructure capital stock and 6.9% as the depreciation rate, and the price index selects the fixed asset investment price index from 2011 to 2020 [
51].
Based on the data provided in
Table 1, we can observe that the level of new infrastructure construction varies among the 30 provinces and cities analyzed. The eastern coastal regions, such as Guangdong, Jiangsu, Liaoning, Shandong, and other economically developed eastern coastal areas, generally have a high level of new infrastructure development, but Beijing and Tianjin have a low level of new infrastructure construction and relatively complete urban construction, which is resistant to the development of new infrastructure construction. The capital stock of new infrastructure in the central region is basically at a medium level, with Inner Mongolia and Henan having a higher level of new infrastructure. Most of the western regions have a relatively backward level of new infrastructure development, but Sichuan and Yunnan have a relatively high level of new infrastructure. The results show that the differences in economic level, industrial structure, and technological level between regions lead to different levels of new infrastructure development. However, each region has a part with a high level of new infrastructure, and this leading part can actively eliminate traditional industries, continuously develop new infrastructure construction, and pursue industrial upgrading.
By calculation, the overall carbon emission intensity is higher in the West, with the difference between the East and West reaching 52%, and there are large regional differences in both new infrastructure and carbon emission intensity. The overall new infrastructure development level is higher in Central, with a difference of 37% from the West.
4.2.4. Mediating Variables
Industry structure optimization effect (NS): To measure this effect, the share of real GDP in the tertiary sector is chosen as an indicator. The tertiary sector includes service industries such as finance, healthcare, education, and entertainment.
Technological progress effect (NT): To quantify this effect, the number of domestic patents granted per year is selected as a representative measure. Patents represent new inventions and technological discoveries, indicating the level of technological progress and the ability of a country to innovate.
4.2.5. Control Variables
Economic density (E): expressed as the ratio of the output value of secondary and tertiary industries to the area of construction land. Economic density is measured by the output per unit area of land in cities. Since urban economic activities are more dependent on non-agricultural industries, they are more focused on the economic agglomeration of secondary and tertiary industries.
Population size (P): expressed as the total population of each province and city at the end of the year.
Economic size (A): expressed as GDP per capita, representing the scale of regional economic development.
Energy structure (S): expressed as the percentage of coal consumption in total energy consumption. This is because coal consumption has the largest proportion in China and is used to measure the energy structure.
5. Results and Discussion
5.1. Basic Regression Results
This study aims to analyze the impact of new infrastructure on carbon intensity using panel data. Regression analysis was conducted using Stata software 17 to examine the model. To account for individual differences in the panel data, a fixed effects model was employed for subsequent analyses. The study further divides the 30 provinces and cities in China into three regions: eastern, central, and western. The evolution of carbon emission intensity within and between these regions is analyzed. To ensure consistency in the panel data analysis, a fixed-effects model is used.
Table 2 shows the results of the baseline regression of Equation (1). At the national level, the scale of new infrastructure exhibits an inverted U-shaped non-linear relationship with carbon emission intensity. Specifically, the scale of new infrastructure initially has a positive effect on carbon emission intensity, but it effectively suppresses the growth of carbon emission intensity in the later stages. This finding supports the hypothesis (H1) of this study.
However, in the eastern and central regions, the scale of new infrastructure demonstrates a linear negative effect on carbon emission intensity. On the other hand, the effect of the new infrastructure scale on carbon emission intensity in the western region is not statistically significant. These findings suggest that the impact of new infrastructure on carbon emission intensity varies across different regions. It implies that the level of new infrastructure construction influences the regional economy and carbon dioxide emissions, consequently affecting regional carbon emission intensity.
In terms of control variables, the impact of economic density on carbon emission intensity is more pronounced in the eastern and central regions. This can be attributed to the fact that urban agglomerations in the eastern region are more economically developed, and the central region has experienced effective development in recent years. The construction of transportation networks has also played a role in driving regional economic agglomeration and improving energy consumption efficiency. On the other hand, in the western region, economic density promotes carbon emissions due to the vast size of the region and the large amount of energy consumed to build economic agglomerations.
The negative effect of population size on carbon emission intensity is only significant at the national level and in the eastern region. This can be attributed to the industrial development in the east, which attracts more skilled personnel, fosters greater low-carbon awareness among residents, and leads to significant agglomeration and more efficient energy consumption. Additionally, Guangdong and Zhejiang provinces have experienced a significant increase in population size, which results in higher population density and lower energy consumption per capita.
At the national level and in each region, the negative effect of economic scale on carbon emission intensity is significant. The increase in GDP per capita signifies improved affluence and a higher level of low-carbon awareness among the population. This leads to actions such as choosing high-speed rail and new energy vehicles for transportation, ultimately reducing carbon emission intensity.
The significance of coal burning as the main source of energy consumption is likely due to the fact that China still heavily relies on coal as its primary energy source. The significant increase in carbon dioxide emissions from coal consumption underscores the need for China to continue upgrading its energy structure to reduce carbon emissions and carbon emission intensity. This can be achieved by adopting cleaner and more sustainable energy sources, such as hydrogen, which can replace traditional fossil fuels in the future.
5.2. Intermediary Effect Test
Based on the above baseline regression, Equations (2) and (3) were further regressed to test the mediating and aggregate effects of new infrastructure on carbon emission intensity.
Table 3 shows the results of the test for the mediating effect of industrial optimization, which reveals that the mediating effect of industrial optimization is not significant at the national level but is significant at the regional level.
At the national level, new infrastructure can promote the optimization of industrial structure and present a negative and then positive role under the role of new infrastructure, first the continuous expansion of industry, and then turn to the industrial Internet under the advanced transformation of industry while driving the expansion of the tertiary industry. However, after adding the industrial optimization effect, the relationship between new infrastructure and carbon emission intensity becomes weaker, and neither new infrastructure nor industrial optimization can inhibit the growth of carbon emission intensity, which is caused by the role of new infrastructure on the industrial structure in the early stage, so the intermediary effect of industrial optimization does not exist at the national level, and the role of other intermediary effects should be considered [
52].
In the eastern region, new infrastructure significantly promotes industrial structure optimization. The relationship between new infrastructure and carbon emission intensity shows a U-shaped pattern when the effect of industrial optimization is added. New infrastructure and industrial optimization together suppress the growth of carbon emission intensity in the east. However, at a later stage, the effect of industrial optimization diminishes, and new infrastructure starts to have a positive impact on carbon emission intensity.
In the central region, the development of new infrastructure is at a high level, and the role of industrial agglomeration and resource optimization has weakened. New infrastructure inhibits the promotion of industrial optimization in the central region, leading to a positive impact on carbon emission intensity in the late stage. The mediating effect of industrial optimization in the central region acts as a masking effect.
In the western region, new infrastructure optimizes the existing industrial structure by promoting the development of the tertiary sector. Unlike the central region, the masking effect in the western region indicates that the carbon emission reduction effect of new infrastructure becomes significant when the industrial optimization term is included. The low overall level of new infrastructure in the west and its continuous expansion stage directly increases energy consumption. However, in some regions, the development of the tertiary industry and the optimization of industrial structure with the help of new infrastructure contribute to curbing carbon emission intensity.
In summary, the results validate the hypothesis (H2) that new infrastructure curbs the growth of carbon intensity by promoting the optimization of industrial structure at the regional level. The intermediary effect of industrial optimization is manifested as a partial intermediary effect in the eastern region and a concealing effect in the central and western regions.
Table 4 shows the results of the tests for the mediating effect of technological progress, which can be seen to be present at the national level and in the central region, but not at the level of the eastern and western regions. The results of all four regressions of the mediating effect show that the relationship between new infrastructure and technological progress passes the significance test and that all show a non-linear relationship. The relationship between new infrastructure and technological progress at the national level shows an inverted U-shape, with new infrastructure development being able to drive knowledge spillovers across the country as a whole, but regional differentiation needs to be captured at a later stage, with advance warning of impediments to green innovation efficiency. The relationship between new infrastructure and technological progress in the eastern, central, and western regions shows a positive U-shaped relationship. As new infrastructure continues to be built, the early stage is in the research stage, and the application of results is not significant due to high investment, while the later stage of new infrastructure can promote technological progress, drive socio-economic development, improve energy efficiency, and reduce regional carbon emission intensity. In the results of the total effect, only the primary term of new infrastructure in the east passed the significance test, indicating that the total effect of the other three levels was not significant. Thus, for the national level and the central region, there is a full mediation effect between new infrastructure and carbon emission intensity, while the variables of technological progress in the eastern and western regions were not significant in the total effect, indicating that there is no mediation effect of technological progress.
At the national level, both the direct effect of new infrastructure and the mediating effect of technological progress contribute to the reduction of carbon emission intensity. The total effect of new infrastructure on carbon emission intensity is not significant, indicating that the positive effect of technological progress is stronger. This suggests a fully mediating effect, where the impact of new infrastructure on carbon emission intensity is achieved through the strengthening of technological progress.
In the central region, new infrastructure has a direct negative effect on carbon emission intensity. Additionally, the effect of new infrastructure on technological progress initially shows a negative and then a positive relationship. The inhibitory effect of new infrastructure on technological progress is reflected in the total effect, where only technological progress promotes the growth of carbon emission intensity. This indicates a fully mediating effect, although this effect may change in later stages. When entering the stage of new infrastructure application, it is important to pay attention to the practical implementation of technology and strengthen the transformation of technological innovation results. This will allow technology to become an effective tool for the development of a green economy.
In summary, technological progress exerts a fully mediating effect at the national level and in the central region. New infrastructure effectively curbs the growth of carbon intensity by driving technological progress, supporting the hypothesis (H3).
5.3. Spatial Effects Test
- (1)
Spatial correlation test
To examine the spatial effect of new infrastructure on carbon emission intensity, it is essential to first test for a spatial correlation in carbon emission intensity. The Moran’s I index was used to conduct this test. The results of the Moran’s test are presented in
Table 5. During the study period, Moran’s values for carbon dioxide emissions were consistently positive and passed the 1% significance level test. This indicates a significant positive spatial correlation in carbon emission intensity.
- (2)
Spatial model selection
In this study, the LM test, Wald test, and LR test were conducted. The results of these tests all passed the 1% significance level, leading to the rejection of the original hypothesis of using the SLM model or SEM model. This indicates the simultaneous existence of a spatial error term and a spatial lag term. Consequently, the spatial Durbin model was employed for the analysis in this study. To account for potential estimation bias arising from regional differences and time factors, as well as the suitability of fixed effects models for analyzing specific individuals, a two-way fixed effects spatial Durbin model was used for estimation in this study.
- (3)
Empirical analysis of spatial effects
The empirical results of the spatial Durbin model are shown in
Table 6. Examining the table, we observe that the coefficients of the primary and secondary terms of new infrastructure are negative, and both pass the significance test. This suggests that the impact of the digital economy on carbon emissions follows an inverted U-shaped pattern, consistent with previous empirical findings.
The total effect can be divided into direct and indirect effects. The direct effects represent the average impact of the explanatory variable on the region itself, while the indirect effects represent the average impact on adjacent regions. Regarding the direct effects of the primary and secondary terms of new infrastructure, we find that they are significant. This indicates a non-linear relationship between new infrastructure and carbon emissions in the region. However, the total effect of new infrastructure on carbon emissions only shows significance at the 10% level for the primary term. Overall, new infrastructure presents a suppressive effect on carbon emission intensity.
Furthermore, we find that the spatial spillover effect of new infrastructure on carbon emissions is not significant. The non-linear effect of new infrastructure in neighboring regions on carbon emissions in the region is minimal. When considering the control variables, except for population size, all variables show significant direct, indirect, and total effects. Economic density and energy structure are found to influence the carbon emission intensity of the region and adjacent areas. On the other hand, the impact of economic scale on neighboring regions is not significant.
5.4. Robustness Check
To verify the robustness of the model, all hypotheses were tested using a random-effects model. After changing the method, the empirical results were basically consistent with the influence direction of the above variables, and the regression coefficients were different. First, in the benchmark results, the primary and secondary items of the scale of new infrastructure were verified at a significant level of 1%, which still verified the inverted U-shaped relationship between new infrastructure and carbon emission intensity. Secondly, the mediation effect regression model shows that the new infrastructure optimizes the industrial structure to a certain extent and promotes the development of technological progress. After adding the intermediary variable, the coefficient of new infrastructure is partially significant, which proves that the effect of industrial structure optimization and technological progress has a mediating effect in some regions, which is consistent with the previous results.
After replacing the data, the empirical results largely align with the original findings in terms of the direction of influence of the variables. However, there are some differences observed in the regression coefficients, as presented in
Table 7. The benchmark results demonstrate that the magnitude and significance of the primary and secondary terms related to the scale of new infrastructure remain consistent, reaffirming the presence of an inverted U-shaped relationship between new infrastructure and carbon emission intensity. Furthermore, the mediation analysis reveals that new infrastructure contributes to the optimization of the industrial structure and the advancement of technological progress to a certain extent. Upon introducing the mediating variables, the coefficient of new infrastructure becomes partially significant, indicating that the effects of industrial structure optimization and technological progress are mediated in certain regions. This finding is consistent with the previous results obtained.
5.5. Discussion
At the national level, the scale of new infrastructure has a positive effect on carbon emission intensity in the early stages and can effectively curb the growth of carbon emission intensity in the later stages. This is because infrastructure construction consumes a lot of resources in the early stages, increases carbon emissions, and effectively promotes economic growth and efficient energy use in the later stages, reducing carbon intensity [
53]. The effect of industrial optimization at the national level is not reflected. The carbon intensity impact of new infrastructure is achieved through enhanced technological advances. This is because the new infrastructure breaks down barriers for technological innovation exchanges and provides rich application scenarios and broad market demand for improving the transformation efficiency of scientific and technological achievements.
In the eastern region, the scale of new infrastructure construction shows a linear negative impact on carbon emission intensity. New infrastructure and industrial optimization can curb the growth of carbon emission intensity, but the role of industrial optimization in the later stage gradually weakens, and new infrastructure will have a positive impact on carbon emission intensity. This may be because the construction of eastern cities is generally relatively perfect, the expansion of urban construction is gradually slowing, and the role of industrial optimization of new infrastructure is gradually weakening.
In the central region, the scale of new infrastructure also showed a negative impact on carbon emission intensity. The industrial optimization effect manifests itself as a masking effect in the central part. The average level of new infrastructure development is relatively high, and its role in industrial agglomeration and resource optimization has weakened. Therefore, the new infrastructure has inhibited the promotion of industrial optimization. Due to this influencing effect, the total effect of new infrastructure has a positive impact on carbon emission intensity in the later stage. Technological progress plays a completely mediating role. This role may change at a later stage, and with the transformation of technological achievements, new infrastructure can play a role in suppressing carbon emission intensity through technological progress.
In the western region, the scale effect of new infrastructure construction is not significant. New infrastructure has been able to optimize the existing industrial structure by promoting the development of the tertiary industry. The industrial structure in the west shows a veiling effect. This may be because, driven by the optimization of the industrial structure, the carbon emission reduction role of new infrastructure can be played, the overall level of new infrastructure is low, and the scale is still expanding, which directly increases energy consumption. However, some regions have been able to promote the development of the tertiary industry, optimize the existing industrial structure, and develop a low-carbon economy with the help of new infrastructure, thereby curbing carbon emission intensity, and the direct effect of new infrastructure is not significant.
6. Conclusion and Policy Implication
6.1. Conclusions
In this study, we examined the impact of new infrastructure on regional carbon emission intensity by analyzing its mechanism and constructing the STIRPAT model with appropriate variables. We also investigated the mediating effect of industrial optimization and technological progress using the stepwise regression method. We placed particular emphasis on regional differences and explored the spatial spillover effect of new infrastructure. Based on our analysis, we draw the following conclusions.
(1) From 2011 to 2020, China experienced a general decrease in carbon emission intensity on a yearly basis. The average carbon emission intensity for each province and city decreased to 3.82 tons/billion yuan in 2020. Currently, the western regions exhibit higher overall carbon emission intensity, highlighting regional discrepancies in both carbon emission intensity and new infrastructure development.
(2) The relationship between new infrastructure and regional carbon emission intensity is complex. It is not a simple linear relationship. The introduction of new infrastructure can lead to industrial structure optimization and technological advancements, which in turn can reduce carbon emission intensity at the regional level. However, the impact of technological advancements is more significant at the national level and in the central region. In the early stages of development, the construction and operation of new infrastructure consume a significant amount of energy, resulting in increased carbon emissions. The initial boost to the economy from new infrastructure is not enough to offset the carbon emissions caused by energy consumption. Over time, as industrial optimization and technological progress occur, the carbon emission intensity is significantly reduced. Currently, the development of new infrastructure in China does not have a noticeable impact on the carbon emission intensity of surrounding areas.
(3) From a regional perspective, there are obvious differences in the performance of the different effects brought about by new infrastructure in different regions. The effect of industrial structure optimization is partly mediated in the eastern and central regions, which not only indirectly suppresses the growth of carbon emission intensity through industrial structure optimization but also directly reduces carbon emission intensity, while in the western region it is a masking effect, and the carbon emission reduction effect of new infrastructure is significant after adding the mediating effect. The effect of technological progress manifests itself as a complete mediation in the central region.
6.2. Policy Implications
Based on the findings of this study, the following countermeasures are suggested for new infrastructure development and regional carbon reduction.
(1) The eastern region should accelerate the integration of old and new infrastructure and promote the use of clean energy.
For the eastern region, it is crucial to continue implementing the structural effects brought about by the application of new infrastructure. This entails promoting the upgrading and transformation of secondary industries and increasing the proportion of tertiary industries, particularly in Beijing, Tianjin, and Hainan. The aim is to expedite the integration of old and new infrastructure, strengthen the development of a low-carbon economy, facilitate the successive transformation of old and new dynamics, and foster resource, facility, and space sharing between new and old infrastructure. The upgrading of industrial structures, facilitated by new infrastructure, can effectively mitigate the growth of carbon emissions intensity. However, it is essential to effectively control the carbon emissions associated with this development. This can be achieved by promoting the use of clean energy sources, such as advocating for the adoption of new energy vehicles. This approach weakens the positive effect of the energy consumption structure on carbon emission intensity while reducing regional carbon emissions. Additionally, promoting the use of energy-saving technologies to enhance energy efficiency and minimize energy losses can also help reduce carbon emissions.
(2) The central region should promote the development of new service industries and urban agglomeration development.
For the central region, the relationship between new infrastructure and carbon emission intensity is influenced by the optimization of industrial structure. It is crucial to strengthen the role of new infrastructure in promoting industrial transformation and upgrading. This can be achieved by developing new service industries that leverage regional advantages and align with new infrastructure construction. Additionally, it is important to continue the construction of intercity high-speed railways and promote the development of urban clusters. These efforts have multiple benefits: they stimulate regional economic growth, enhance people’s quality of life, and contribute to a sense of social well-being. Moreover, they improve the efficiency of resource allocation and reduce energy consumption, thereby facilitating regional carbon emission reduction. By prioritizing the integration of new infrastructure and the optimization of industrial structure, the central region can effectively address carbon emission intensity while capitalizing on the economic and social advantages of new infrastructure development.
(3) The western region should improve the application of new infrastructure and strengthen the development of a low-carbon economy.
For the western region, it is vital to actively focus on the level of application of new infrastructure, continue to promote the construction of new infrastructure, and accelerate its application in all areas of the secondary and tertiary industries while continuing to promote technological innovation, upgrade the energy structure, and promote the use of clean energy. The western region should also seize opportunities during the development of new infrastructure, actively build platforms to attract talent and technology, optimize factor allocation, and promote high-quality economic development and the direct and indirect effects of the new infrastructure.
Although this study is conducted based on data from China, it also has certain reference values for other developing countries. Similar to China, most emerging economies are still in the early stages of new infrastructure construction while placing a strong focus on the country’s low-carbon development. Modest new infrastructure planning will have a significant impact on sustainable economic growth and low-carbon development in these countries. This study detected the different impacts of new infrastructure on carbon emissions in different regions and tried to discover the impact mechanism of new infrastructure on carbon emissions. However, we have not fully considered the impact of new infrastructure on carbon emissions in a specific region. In addition, we will further detect the impact of new infrastructure on carbon emissions in specific industries.


