Article

Measurement of CO2 Emissions Efficiency and Analysis of Influencing Factors of the Logistics Industry in Nine Coastal Provinces of China

1
School of Management, Hebei GEO University, Shijiazhuang 050031, China
2
Strategy and Management Base of Mineral Resources in Hebei Province, Hebei GEO University, Shijiazhuang 050031, China
*
Author to whom correspondence should be addressed.
Sustainability 2023, 15(19), 14423; https://doi.org/10.3390/su151914423
Submission received: 31 August 2023 / Revised: 24 September 2023 / Accepted: 30 September 2023 / Published: 1 October 2023
(This article belongs to the Special Issue Green Economy, Resource Efficiency and Sustainable Development)

Abstract

:
The surge in CO2 emissions affects global climate change and the development of society. The logistics industry, being a swiftly advancing industry, demonstrates an escalating trend in CO2 emissions. Therefore, this paper selects the more developed coastal provinces (districts) in China’s logistics industry and takes 2011–2020 as the research period. Using the Super-SBM model and the Malmquist index model, the article analyzes the changes in the carbon emission efficiency of the logistics industry from the static and dynamic perspectives and then explores the factors affecting it using the panel model and the mediating effect model. Findings from research indicate that: (1) The CO2 emission efficiency of the logistics industry is generally moderate when viewed from a static perspective. (2) Taking a dynamic viewpoint, there is a slight declining trend in the overall CO2 emission efficiency. (3) As environmental regulations become more stringent, the CO2 emission efficiency follows the “U”-shaped pattern, initially declining and then rising. Environmental regulations can influence CO2 emission efficiency by affecting technological innovation. Additionally, energy efficiency plays a positive role in promoting CO2 emission efficiency. Recommendations: Implement differentiated environmental regulations tailored to local conditions. Emphasize technological innovations. Enhance the energy efficiency.

1. Introduction

Global warming has emerged as a critical threat, endangering sustainable economic and social progress as well as the well-being and security of humanity. Countries worldwide have started prioritizing effective control and reduction of CO2 emissions. With the establishment and development of international exchanges, the UK Emissions Trading Group, the Chicago Climate Exchange in the United States, and the National Trust of Australia are gradually forming carbon trading markets [1]. Scholars have also begun to study carbon emissions to find a path to low-carbon development. For example, Pattak et al. explored the factors affecting CO2 emissions in Italy by using the STIRPAT model [2]. Mohammad et al. explored the relationship between increased usage, tourism, economic growth, and carbon productivity in Kuwait [3]. Wang et al. explored the impact of technological innovation on carbon efficiency to promote low-carbon development in China [4]. As per the BP Statistical Yearbook of World Energy, China holds the top position in CO2 emissions as of 2020. Being a substantial energy consumer, China’s impact on global green growth is substantial. China has given high priority to CO2 emissions. Recently, China’s booming economy and the Internet revolution have fueled the logistics industry’s rapid expansion, improving people’s lives but resulting in a worrisome trend of increasing energy consumption in this industry. Future urban development will inevitably cause a rise in CO2 emissions from the logistics industry. Therefore, finding ways to enhance energy efficiency while maintaining a balance between logistics scale and green development becomes crucial for future logistics advancements in every city. It also serves as an effective strategy for facilitating low-carbon and eco-friendly growth in China’s logistics industry. China’s coastal region mainly comprises nine provinces and an autonomous region, most of which exhibit greater economic prosperity. Additionally, the coastal area benefits from its favorable geographical position, enabling the logistics industry to flourish promptly in these regions. By researching the trend of carbon emission efficiency of the logistics industry in China’s coastal areas, we can fully understand its current development status. We can also explore the path of the low-carbon logistics industry from the perspective of influencing factors. This can provide theoretical references for China’s coastal provinces (districts) to enhance the carbon emission efficiency of the logistics industry and the green development planning of the logistics industry in other regions.
In recent years, the importance of constructing efficient logistics systems and managing complex logistics activities has made logistics efficiency a significant and intricate undertaking. Scholars commonly employ the data envelopment analysis (DEA) model, enabling the exploration of both regional variations in logistics efficiency and the factors that impact it. The efficiency of the logistics industry is determined primarily by factors such as economic development [5], foreign trade [6], and informationization [7]. Qiuping et al. used the DEA-BCC model to measure the logistics efficiency of the new land–sea corridor in western China, and the results show that it is generally at a medium level [8]. Yuhang et al. used the SBM model to measure logistics efficiency in Shaanxi Province and further found that the industrial structure and the level of resource utilization had the most significant effect using the Tobit model [9].
Additionally, recent years have witnessed a heightened focus on environmental protection in the region, prompting various industries to embark on endeavors for low-carbon development. DEA or its derivative models have been widely adopted in numerous industries to evaluate the efficiency of CO2 emissions. In a study conducted by Ruili et al. [10], the Super-SBM model was employed to assess the efficiency of agricultural CO2 emissions within Henan Province. A comprehensive analysis was conducted to explore the intricate interplay between efficiency in CO2 emissions and food security. Ying et al. [11] conducted an additional research endeavor focusing on evaluating the efficiency of CO2 emissions within China’s pharmaceutical manufacturing industry by implementing the SBM model. The findings exhibited a steady improvement in efficiency, along with disparities in regional distribution, while further investigating the underlying factors. In their research, Hongtao et al. [12] evaluated the effectiveness of reducing CO2 emissions in industries across cities within the Pearl River Basin using the Super-SBM model. Utilizing panel data spanning several years, they employed the Super-SBM model for analysis. The findings conveyed a consistent improvement in the efficiency of industrial CO2 emissions in these cities.
In recent years, the logistics industry has been dedicated to pursuing the path of low-carbon progress. This encompasses employing methodologies like DEA and its related models to calculate the CO2 emissions efficiency of the logistics industry. Additionally, scholars such as Zijing et al. [13] have focused on measuring the CO2 emissions efficiency of the logistics industry. The researchers employed a comprehensive evaluation index system. An analysis was conducted to investigate the static disparities and dynamic variations in low-carbon logistics efficiency within Jiangsu Province. By adopting a transportation strategy perspective, Xiaohong et al. [14] successfully measured the efficiency of CO2 emissions. Their findings showcased the superior effectiveness of the Super-SBM model in evaluating this crucial aspect, surpassing the capabilities of the traditional SBM model. This research provides valuable insights into enhancing the sustainability and environmental performance of logistics operations. Based on their findings, the researchers proposed policy recommendations to enhance the CO2 emissions efficiency. These suggestions prioritize a robust transportation strategy, particularly for the second type of pilot district.
As previously mentioned, researchers have examined the efficiency of CO2 emissions in various districts or industries. On one hand, they have employed DEA or derivative models, as well as the Malmquist index, to analyze this efficiency from static and dynamic perspectives. On the other hand, scholars have focused on studying the factors that influence CO2 emissions efficiency, including foreign direct investment, industrial structure, urbanization level, market size, population density, and more [15,16,17,18,19]. Regarding environmental regulation, its strategic implementation can serve as an effective tool in enhancing CO2 emissions efficiency. Nevertheless, the academic community lacks consensus regarding the correlation between environmental regulation and production efficiency. There are three main perspectives. Firstly, some scholars argue for the existence of a “green paradox” resulting from environmental regulation. Strict environmental regulations impose additional anticipated costs on companies, and setting unreasonable taxes stimulates current consumption, thereby suppressing efficiency. This viewpoint is supported by Qinglin et al. [20], and Shengnan et al. [21]. Their study indicates a negative correlation between cost-based environmental regulations and the efficiency of regional green technology innovation. Furthermore, both mandatory environmental regulations and market-based incentives restrain energy ecological efficiency. Haijun et al. found that fee-based environmental regulation inhibits eco-efficiency [22]. Secondly, certain scholars propose that implementing reasonable environmental regulation can act as a catalyst for enterprises and industries, motivating them to enhance their levels of technological innovation to boost efficiency. Research conducted by Hongxing et al. [23] and Ying et al. [24] demonstrated the favorable influence of environmental regulations on both environmental efficiency and energy efficiency. Thirdly, the connection between environmental regulation and efficiency exhibits a nonlinear trend. Wenfei et al. [25] have concluded that the influence of environmental regulations on energy efficiency follows a U-shaped pattern. In contrast, according to the findings presented by Shuangliang et al. [26], the correlation between environmental regulations and the efficiency of the green economy follows a curvilinear pattern, resembling an inverted “U” shape. These findings highlight the intricate dynamics, emphasizing the need for nuanced and flexible policies that strike a balance between regulation and efficiency.
The investigation concerning the correlation between environmental regulation and the efficiency of CO2 emissions has been approached from varying perspectives among scholars. Chengyuan et al. [27] have been investigating the relationship between these two variables, and their study reveals that overall, the intensity of environmental regulation across 23 provinces and cities in China positively influences CO2 emissions efficiency. Regional variability exists in terms of the degree of impact, with the highest positive influence observed in districts with medium CO2 emissions, followed by low-emission districts, and the least positive influence in high-CO2-emission districts. Dong et al. also argue that environmental regulation has a role in promoting energy carbon efficiency [28]. Furthermore, Sangliang et al. [29] and Chaoxia et al. [30] have separately observed that environmental regulation promotes CO2 emissions efficiency in urban and manufacturing industries. Within the realm of the grain production industry, Bin et al. [31] reveal the relationship between formal environmental regulations and CO2 emissions efficiency, forming a “U” curve. Furthermore, a U-shaped correlation between marine environmental regulations and carbon efficiency has been uncovered by Qiang et al. [32]. They think that through the mechanisms of optimizing resource allocation efficiency and industrial structure, marine environmental regulations have the potential to indirectly enhance the efficiency of CO2 emissions. Jiesheng et al. used the Super-SBM model and the center of gravity model to investigate the carbon emission efficiency of China’s ten major urban agglomerations, which shows a trend of rising, then falling, then rising, and the center of gravity of its distribution shows an east-northward shift, and they found that there is a U-shape relationship between environmental regulations and the carbon emission efficiency of the tourism industry [33]. Kunlian et al. used a threshold effect model to find that environmental regulation intensity above the threshold enhances the carbon emission efficiency of logistics firms, while environmental regulation intensity below the threshold suppresses the carbon emission efficiency of logistics firms [34].
Through a comprehensive review and summary of relevant research findings, we find that scholars do not have a consistent understanding of the relationship between environmental regulations and production efficiency and that the relationship between the two may manifest itself differently depending on the external environment. Similarly, the relationship between environmental regulations and carbon emission efficiency is yet to be explored. Different industries and regions may affect the relationship between the two. Environmental regulation may promote, inhibit, or have a nonlinear relationship with carbon emission efficiency. Current research by scholars focuses on exploring regional carbon emission efficiency, with limited depth in measuring industry carbon emission efficiency. On the other hand, it also focuses on exploring the impact of different environmental regulation tools on carbon emission efficiency, ignoring the research on the role of the path of environmental regulation and its effects on carbon emission efficiency. In contrast, this paper explores the current situation of carbon emission efficiency in the logistics industry more comprehensively from both static and dynamic perspectives and also explores the role of technological innovation as a mechanism between environmental regulation and carbon emission efficiency. The article will explore the trend of the carbon emission efficiency of the logistics industry in China’s coastal areas from both static and dynamic perspectives, to fully understand the development status of the logistics industry. From the perspective of environmental regulation and energy efficiency, the article will explore the paths that affect the carbon emission efficiency of the logistics industry, to provide theoretical references for improving the carbon emission efficiency of the logistics industry. The article can provide a certain reference for other scholars to understand the carbon emission efficiency of the logistics industry, as well as provide a new perspective for the study of its influencing factors. It can also provide a theoretical basis for exploring the path of low-carbon logistics.

2. Methods and Data

2.1. Research Methods

2.1.1. Super-SBM Model

When assessing multiple inputs and outputs, data envelopment analysis (DEA) emerges as a powerful approach for evaluating the relative efficiency of decision-making units [35]. One advantage of the DEA model is that it can handle varying scales between indicators and does not require knowledge of the specific form of the frontier function. However, traditional DEA models fail to address redundancies and deficiencies in input and output factors, which makes it challenging to differentiate between decision units with efficiency values of one [36]. To overcome this limitation, Tone introduced the SBM model that incorporates non-expected outputs. Nevertheless, the SBM model faces challenges in effectively discerning discrepancies among decision units that share identical efficiency values of 1. Drawing upon these two methodologies, Tone introduced the Super-SBM model, encompassing the consideration of slack variables to facilitate a heightened precision in distinguishing decision units. To accurately evaluate the efficiency of CO2 emissions in China’s coastal logistics industry, this research employs the Super-SBM model, which incorporates non-anticipated outputs. Thus, the model is specifically expressed as follows:
Min ρ = 1 m i = 1 m x ¯ x i k 1 r 1   +   r 2 s = 1 r 1 y d ¯ y s k d ¯ + q = 1 r 2 y u ¯ y q k d ¯
S . t . X ¯ j = 1 , k n X i j λ j y d ¯ j = 1 , k n y s j d λ j y d ¯ j = 1 , k n y q j u λ j X ¯ X k ; y d ¯ y k d ; y u ¯ y k u ; λ j 0 , j = 1 , 2 , , n i = 1 , 2 , , m ; s = 1 , 2 , , r 1 ; q = 1 , 2 , , r 2 ;
m denotes inputs, r1 denotes desired outputs, r2 denotes non-desired outputs, X is the matrix of input indexes, the matrix of desired output indexes is yd, and the matrix of non-desired output indexes is yu.

2.1.2. Malmquist Index Model

Rolf Fare et al. proposed the Malmquist production index in their study [37]. This index allows for the analysis of efficiency changes from period t to period t + 1. To evaluate the dynamic efficiency of CO2 emissions, the Malmquist index model can be employed. This model can be decomposed into two components: the index of technical efficiency change (EC) and the index of technical progress change (TC). The index of technical efficiency change (EC) can be further divided into the pure technical efficiency change index (PEC) and the scale efficiency change index (SEC). The index of technical efficiency change (EC) compares the actual output with the ideal output while keeping the inputs of the decision-making unit constant. It reflects the technical capacity available to the decision-making unit. On the other hand, the technological change index (TC) captures the changes in the production technology of the decision-making unit. The index of technical efficiency can shed light on issues such as the reasonableness of management methods and the correctness of organizational decisions. The formula can be expressed as follows:
M ( x t + 1 , y t + 1 , x t , y t ) = D t ( x t + 1 , y t + 1 ) D t ( x t , y t ) × D t ( x t , y t ) D t + 1 ( x t , y t )
In Equation (3), the (xt,yt) denotes the input–output relationship in period t, and Dt(xt,yt) denotes the distance function of the decision-making unit in period t using the technology level in year t as a reference.

2.1.3. Construction of Econometric Models

  • Panel data models
We examined the impact of environmental regulation and energy efficiency on the CO2 emissions efficiency of the logistics industry in coastal provinces (autonomous region). Firstly, the model was tested by the Hausman test, and the p-value was obtained to be 0.0626, which indicates that the use of the fixed effect model is better than the random effect, and considering the research of related scholars, this paper adopts the bidirectional fixed model, and the econometric model is as follows:
C E E i t = α 0 + α 1 E R i t + α 2 S E R i t + α k X i t + c i + γ t + ε i t
C E E i t = β 0 + β 1 E E i t + + β k X i t + c i + γ t + ε i t
where i denotes the province, t denotes the year, CEE denotes the CO2 emissions efficiency of the logistics industry, ER denotes the strength of environmental regulation, SER denotes the square of the strength of environmental regulation, EE denotes the energy efficiency and denotes the control variables. α 0 , α 1 , α 2 , α k are the parameters to be estimated, c i is the province fixed effect, γ t is the time fixed effect, and ε i t is the random error term.
2.
Mediated effects modeling
The three-step mediation test proposed by Baron and Kenny is used to test the path of technological innovations affecting CO2 emissions efficiency in the logistics industry [38]; the model is as follows:
C E E i t = α 0 + α 1 E R i t + α 2 S E R i t + α k X i t + c i + γ t + ε i t
T I i t = β 0 + β 1 E R i t + + β k X i t + c i + γ t + ε i t
C E E i t = χ 0 + χ 1 E R i t + χ 2 S E R i t + χ 3 T I + χ k X i t + c i + γ t + ε i t
The mediating variable Ti is technological innovations. Firstly, we create a nonlinear regression model with the explanatory variable of environmental regulation and the explained variable of CO2 emissions efficiency. Secondly, we create a regression model with the explanatory variable of environmental regulation and the explained variable of technological innovations. Finally, we create a regression model with the mediating variable of technological innovations and environmental regulation as the explanatory variable and CO2 emissions efficiency as the explained variable. If the explanatory variables are found to be significant through the significance test, then the existence of a mediating effect is determined.

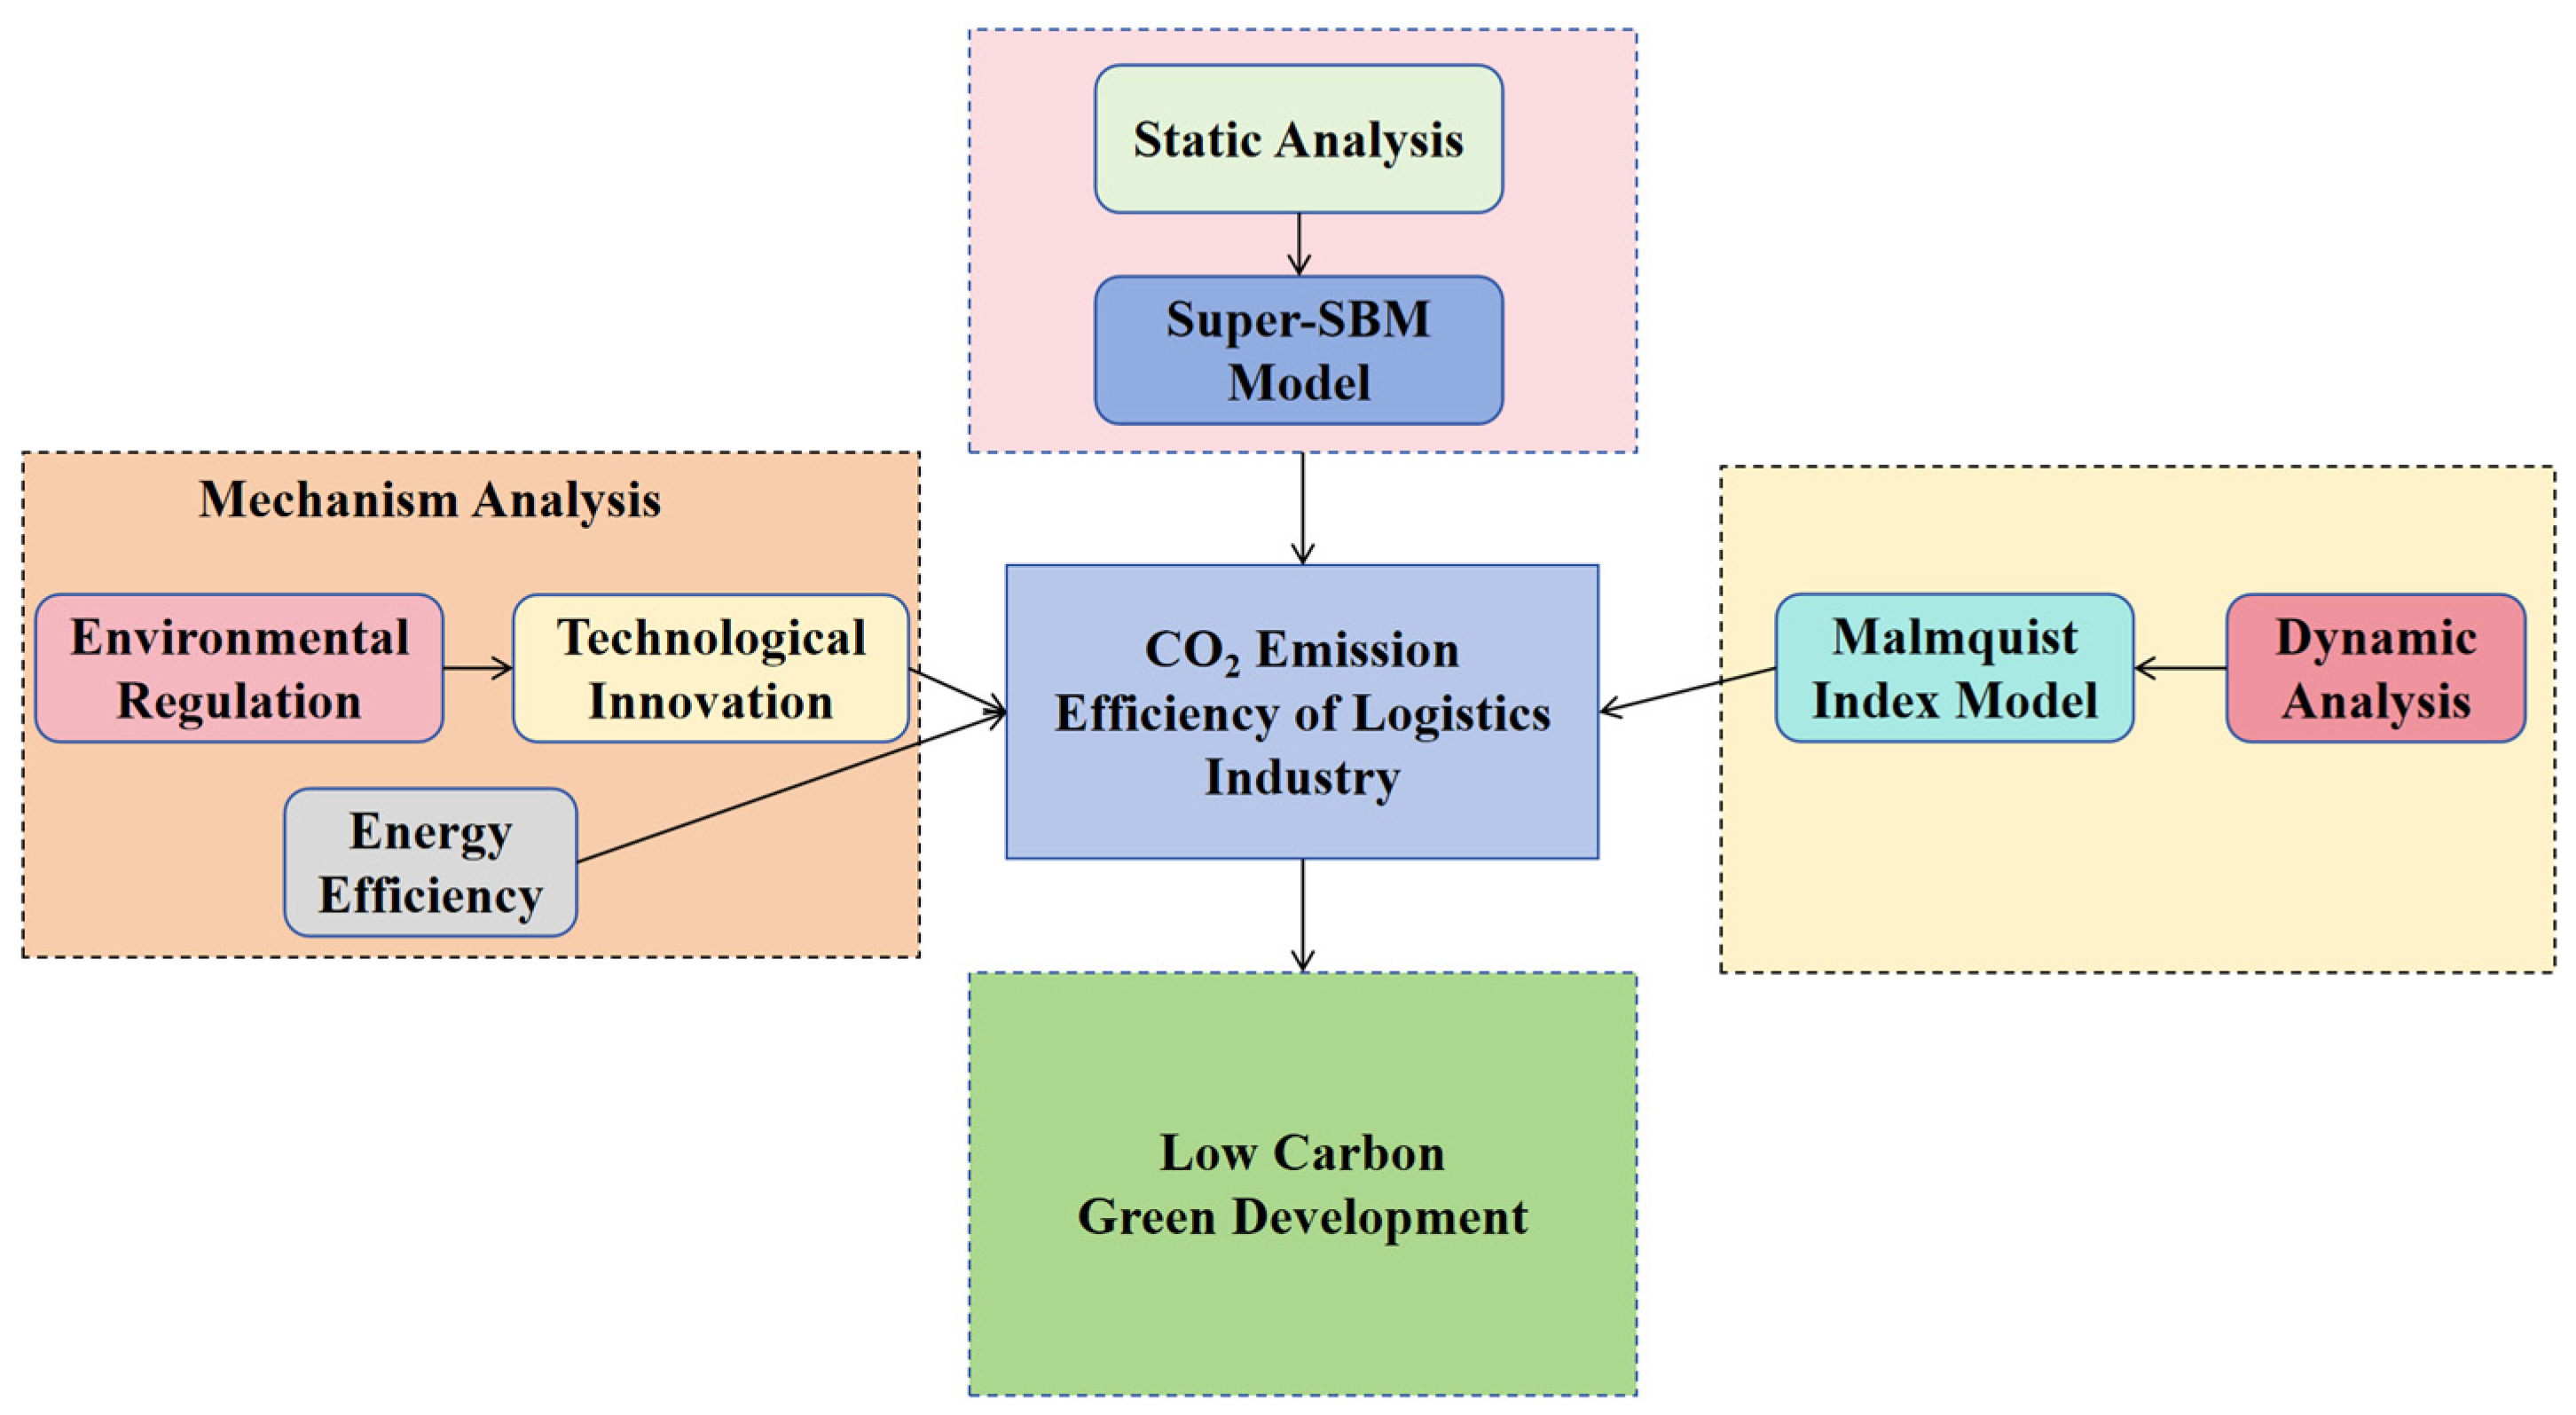
2.1.4. Research Framework

This thesis first analyzed the current situation of the carbon emission efficiency of the logistics industry in the coastal area and the differences between different provinces (district) from the static perspective by using the Super-SBM model. Then, on the basis of the calculated carbon emission efficiency, the Malmquist index model was used to analyze the carbon emission efficiency from a dynamic perspective to explore the dynamic changes in carbon emission efficiency in coastal areas. Finally, based on the panel model, the effects of environmental regulation and technological innovation on carbon emission efficiency were explored, and the mechanism played by technological innovation between environmental regulation and carbon emission efficiency was investigated based on the mediation effect model. The research framework of this paper is shown in Figure 1.

2.2. Sample Selection

The article uses the panel data of nine coastal provinces (autonomous region) in China from 2011 to 2020 as the research sample, namely Guangdong Province, Fujian Province, Guangxi Zhuang Autonomous Region, Hainan Province, Zhejiang Province, Hebei Province, Jiangsu Province, Shandong Province, and Liaoning Province. The main data come from the China Statistical Yearbook, the China Tertiary Industry Statistical Yearbook, and the corresponding statistical yearbooks of each region. To eliminate the effect of heteroscedasticity, some data are logarithmically processed, and individual missing data are filled in using interpolation.

2.3. Selection of Indicators for Calculating CO2 Emissions Efficiency

At present, there are no special statistics on the logistics industry. Considering the research of Qinmei et al., the total contribution of China’s transportation, warehousing, and postal industries to the total value added by the logistics industry has reached more than 85%, so this paper defines the transportation, warehousing, and postal industries as the logistics industry [39].
In this study, the carbon emission efficiency of decision-making units was first measured using the Super-SBM model. We used the data of input indicators, desired output indicators, and undesired output indicators. These decision-making units consist of nine coastal regions. The input indicators include fixed asset investments, employee count, and energy consumption in the logistics industry. The desired output is the value added by the logistics industry in each province (based on the year of 2011, and using the GDP index for deflating treatment), while the non-desired output refers to the CO2 emissions [40]. The relevant definitions of the indicators are displayed in Table 1. The descriptive statistics of the indicators are as follows in Table 2.
Regarding fixed asset investment, this research considers the investment made in the logistics industry as capital stock. The base period for capital stock calculation was set as 2011, and the deflation treatment was performed using the GDP index. The perpetual inventory method introduced by Goldsmith was applied to calculate the capital stock [41]. The value of the capital depreciation rate was determined as 9.6% with reference to the study of Jun et al. [42].
Due to the unavailability of direct data on CO2 emissions from the logistics industry in each coastal province of China, alternative methods were employed in this study. Specifically, the CO2 emission coefficient method was utilized to estimate the respective CO2 emissions [43]. By analyzing the primary energy consumption, the corresponding CO2 emissions can be deduced.
By adopting the Super-SBM model and collecting relevant data, this research aims to provide a more precise evaluation of CO2 emissions efficiency. The findings will contribute to a better understanding of the efficiency levels in China’s coastal region and offer insights for enhancing sustainability in the logistics industry.

3. Results of CO2 Emissions Efficiency

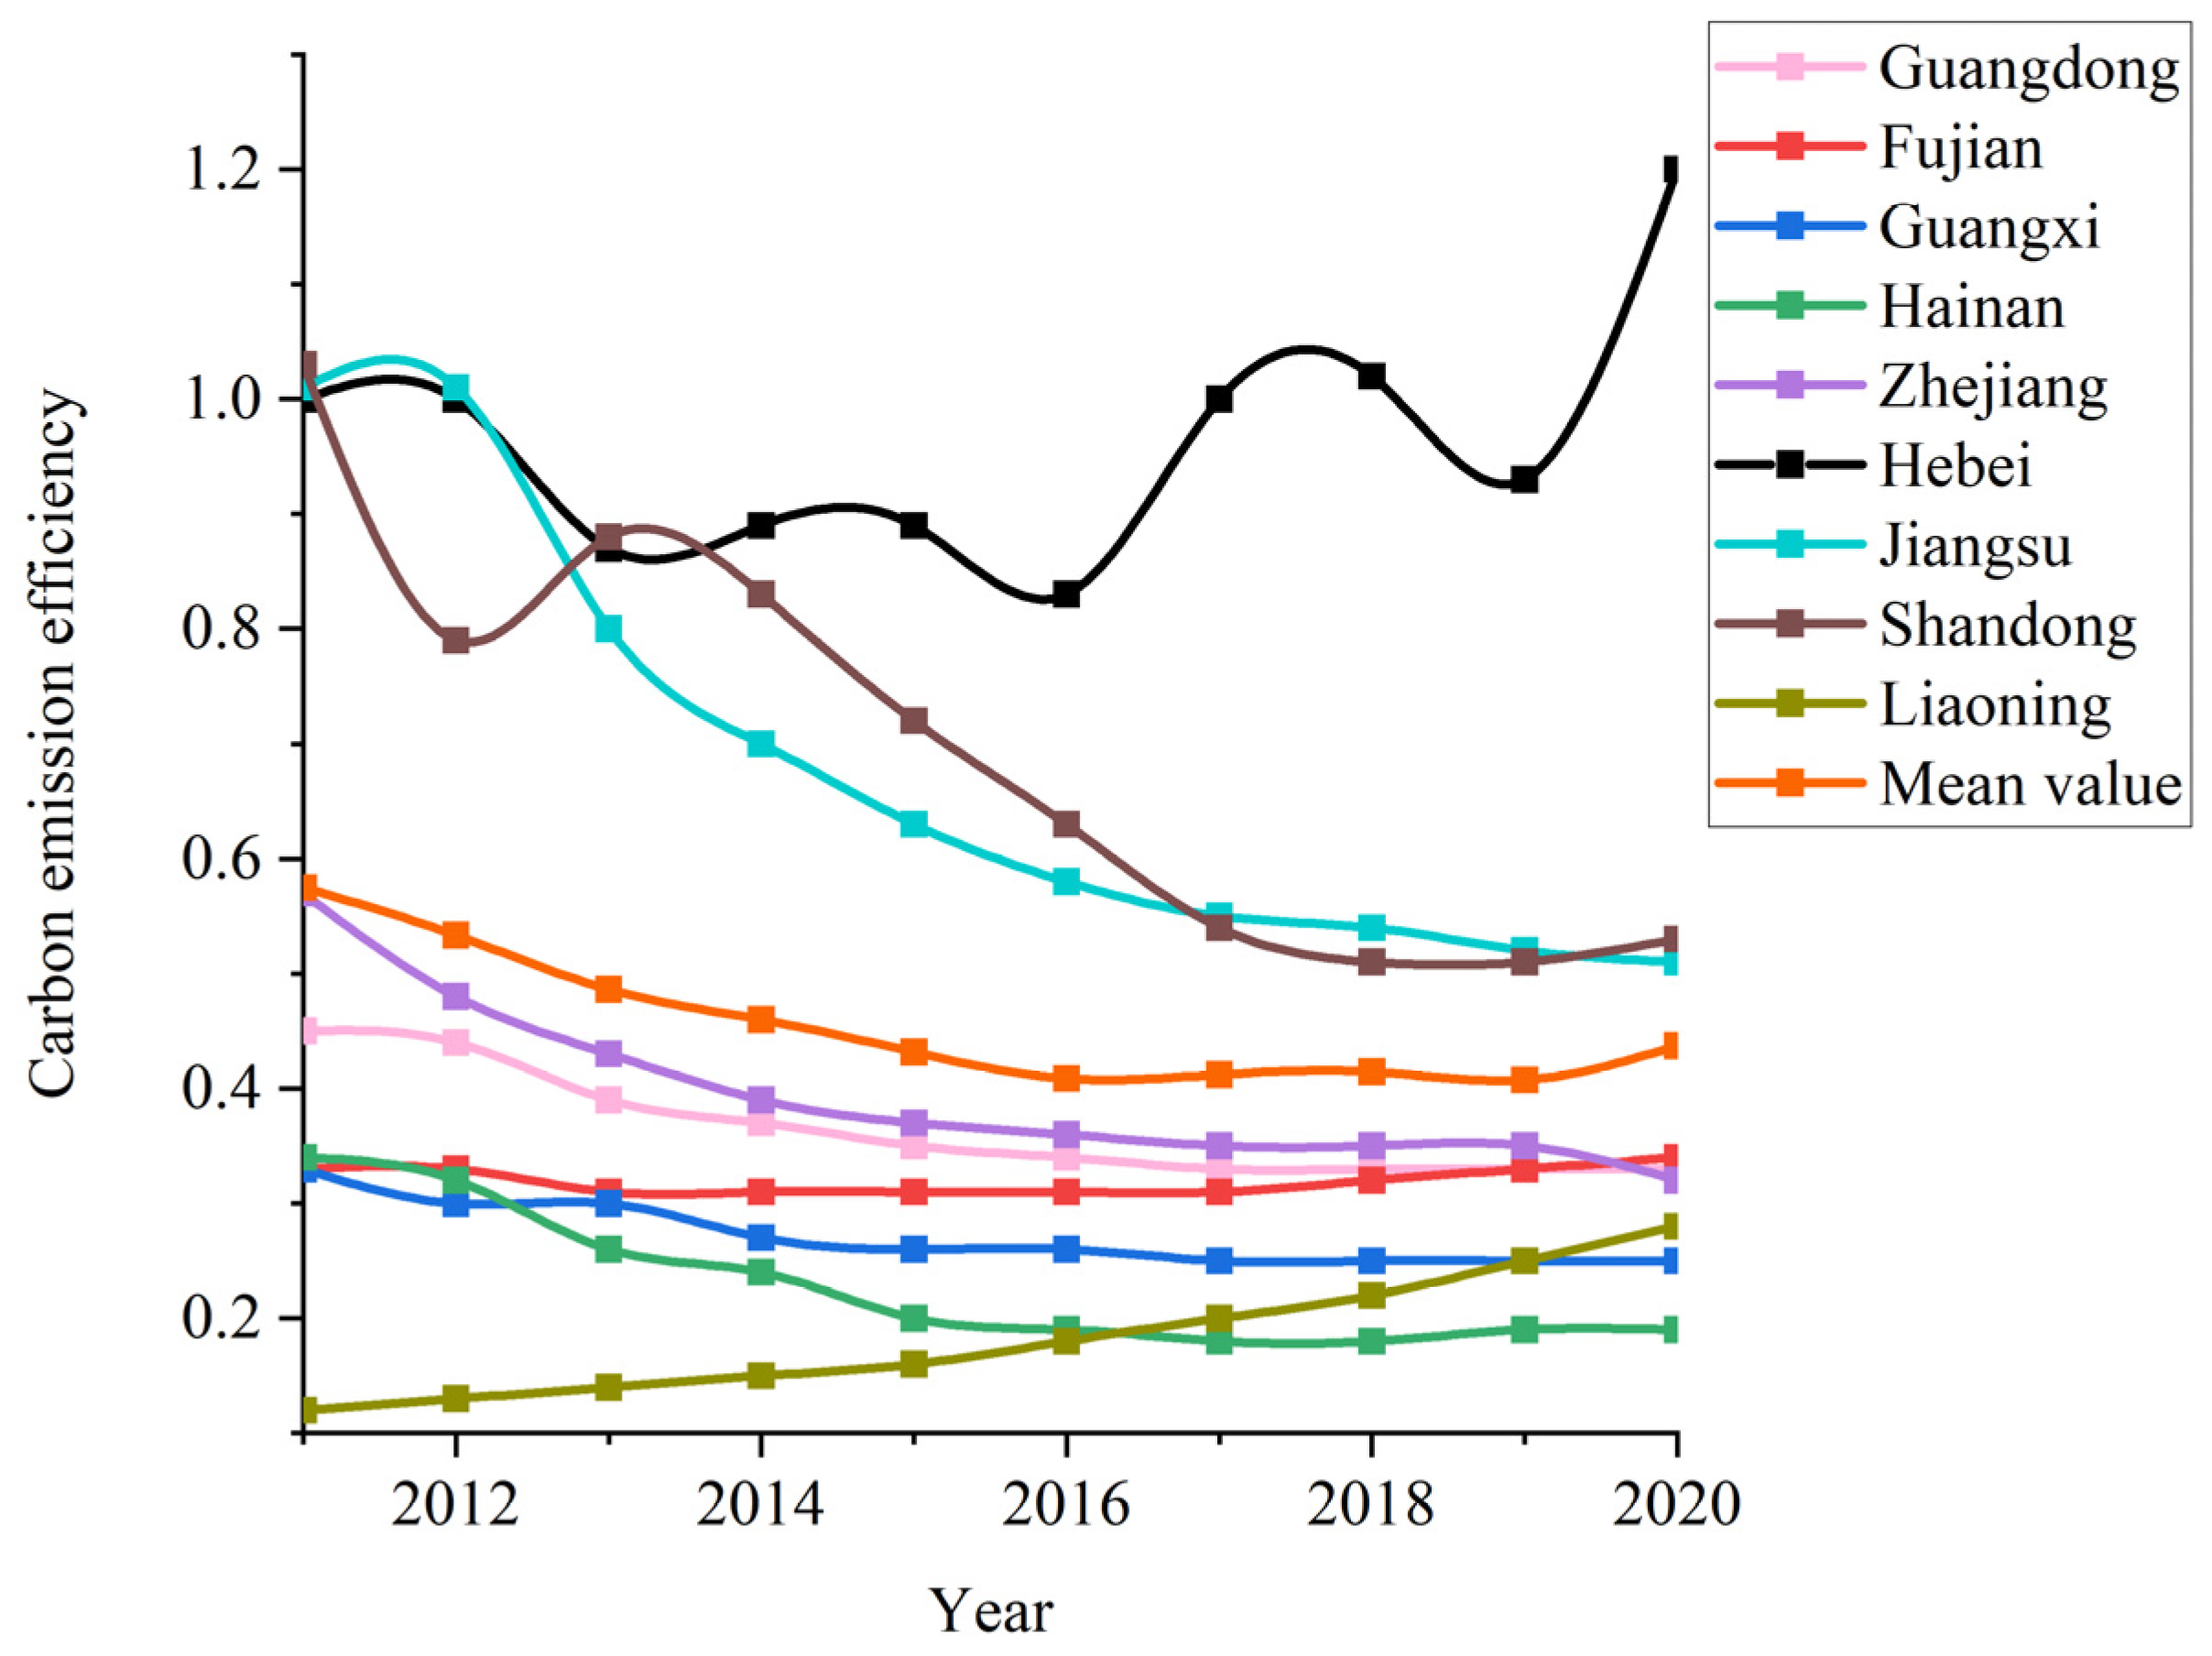
3.1. Static Analysis

From a static point of view, the carbon emission efficiency of the logistics industry is calculated by utilizing the Super-SBM model for input indicators, desired output indicators, and non-desired indicators. The corresponding results are presented in Table 3, while Figure 2 provides the specific trends.
Upon careful examination of Figure 2 and Table 3, it becomes apparent that the efficiency of CO2 emissions demonstrates an initial decline, followed by a subsequent stabilization pattern. Notably, there is an upward trend observed during the years 2019–2020. Throughout the study period, the overall mean efficiency value stands at 0.46. This finding indicates that the logistics industry’s CO2 emissions efficiency has not yet reached its optimal level, leaving substantial room for improvement. Observing Figure 2 and Table 2 reveals that Hebei Province, Jiangsu Province, and Shandong Province are the only regions demonstrating higher CO2 emissions efficiency compared to the overall efficiency of the coastal area. This observation indicates that the efficiency of CO2 emissions collectively remains relatively low.
In detail, only Hebei Province exhibits a CO2 emissions efficiency close to 1. The CO2 emissions efficiency values for Jiangsu Province and Shandong Province stand at 0.68 and 0.70, respectively, representing a moderate level of efficiency for CO2 emissions. Notably, in certain years, the efficiency values even surpass 1. Upon closer examination, it becomes evident that the efficiency of CO2 emissions within the logistics industry in Liaoning Province has reached its lowest point, registering a maximum value of merely 0.28 during the previous decade. Likewise, other provinces’ logistics industries also exhibit comparatively low efficiency in CO2 emissions. This significant disparity underscores the difficulty in achieving effective CO2 emissions efficiency within the logistics industry. These findings indicate that when these provinces prioritize economic development, they tend to emphasize increasing desired outputs while neglecting the influence of non-desired outputs. Consequently, the CO2 emissions efficiency of the logistics industry in these provinces significantly lags behind the desired DEA efficiency, presenting ample room for improvement.

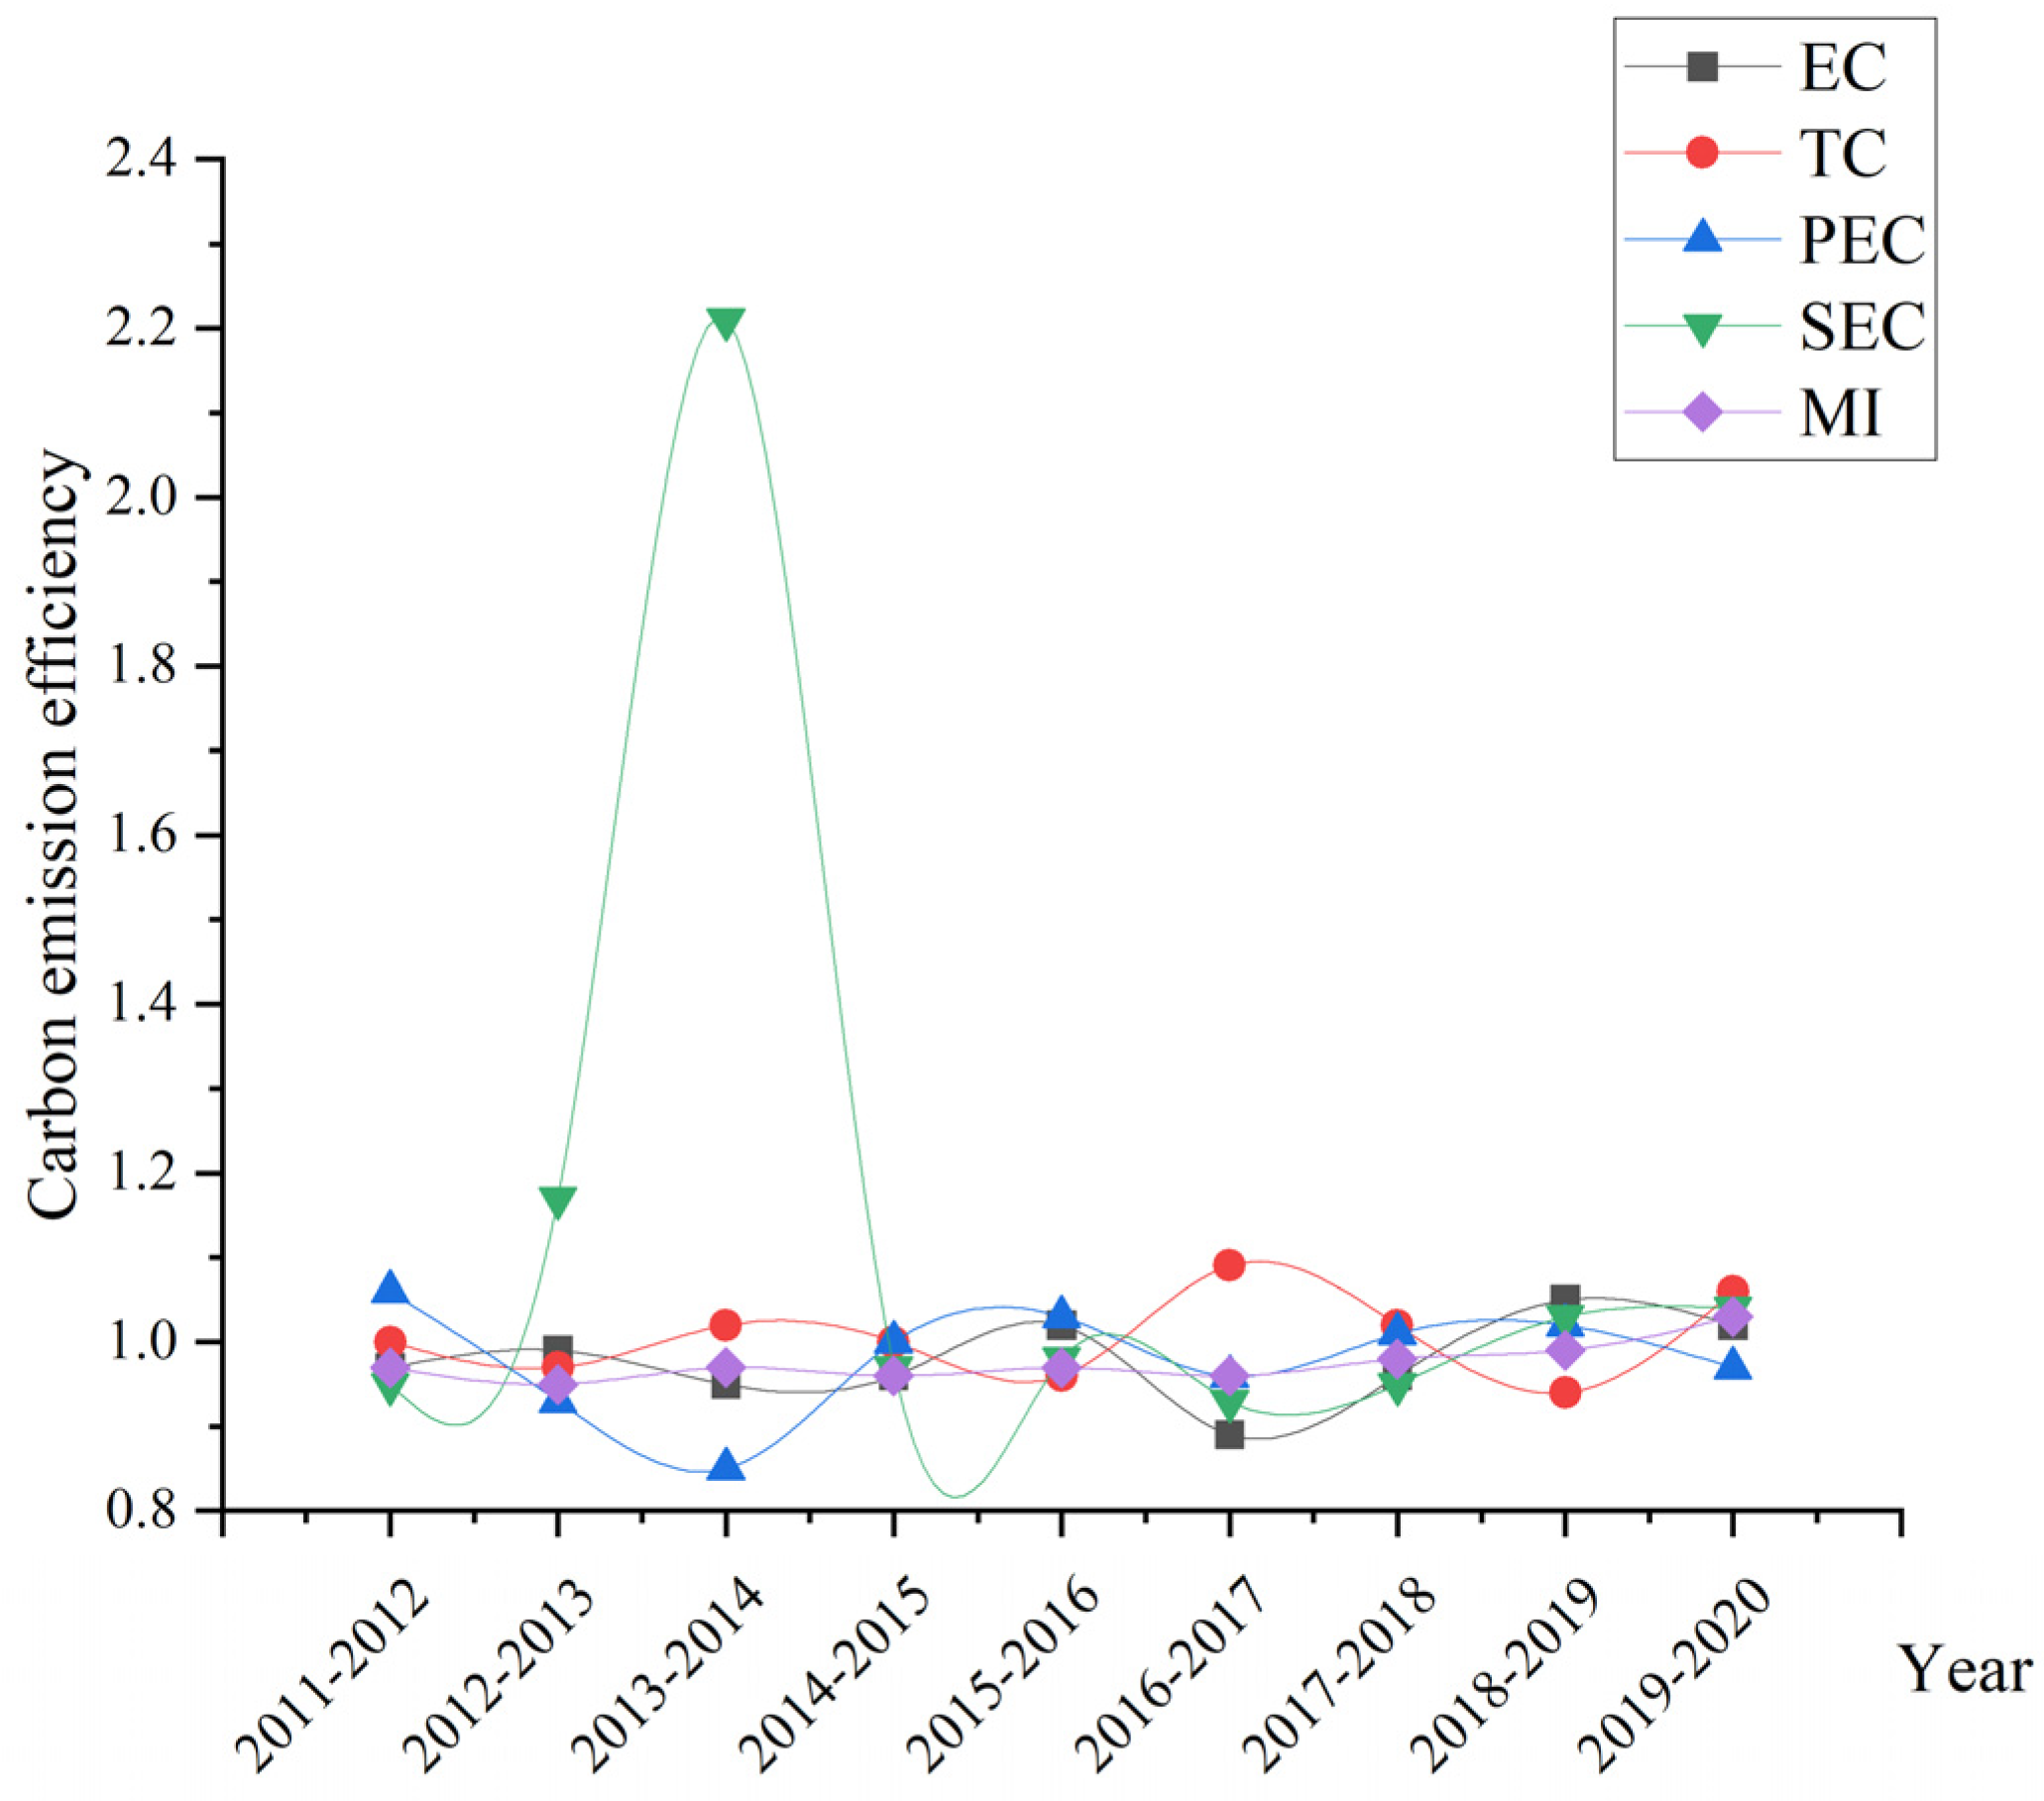
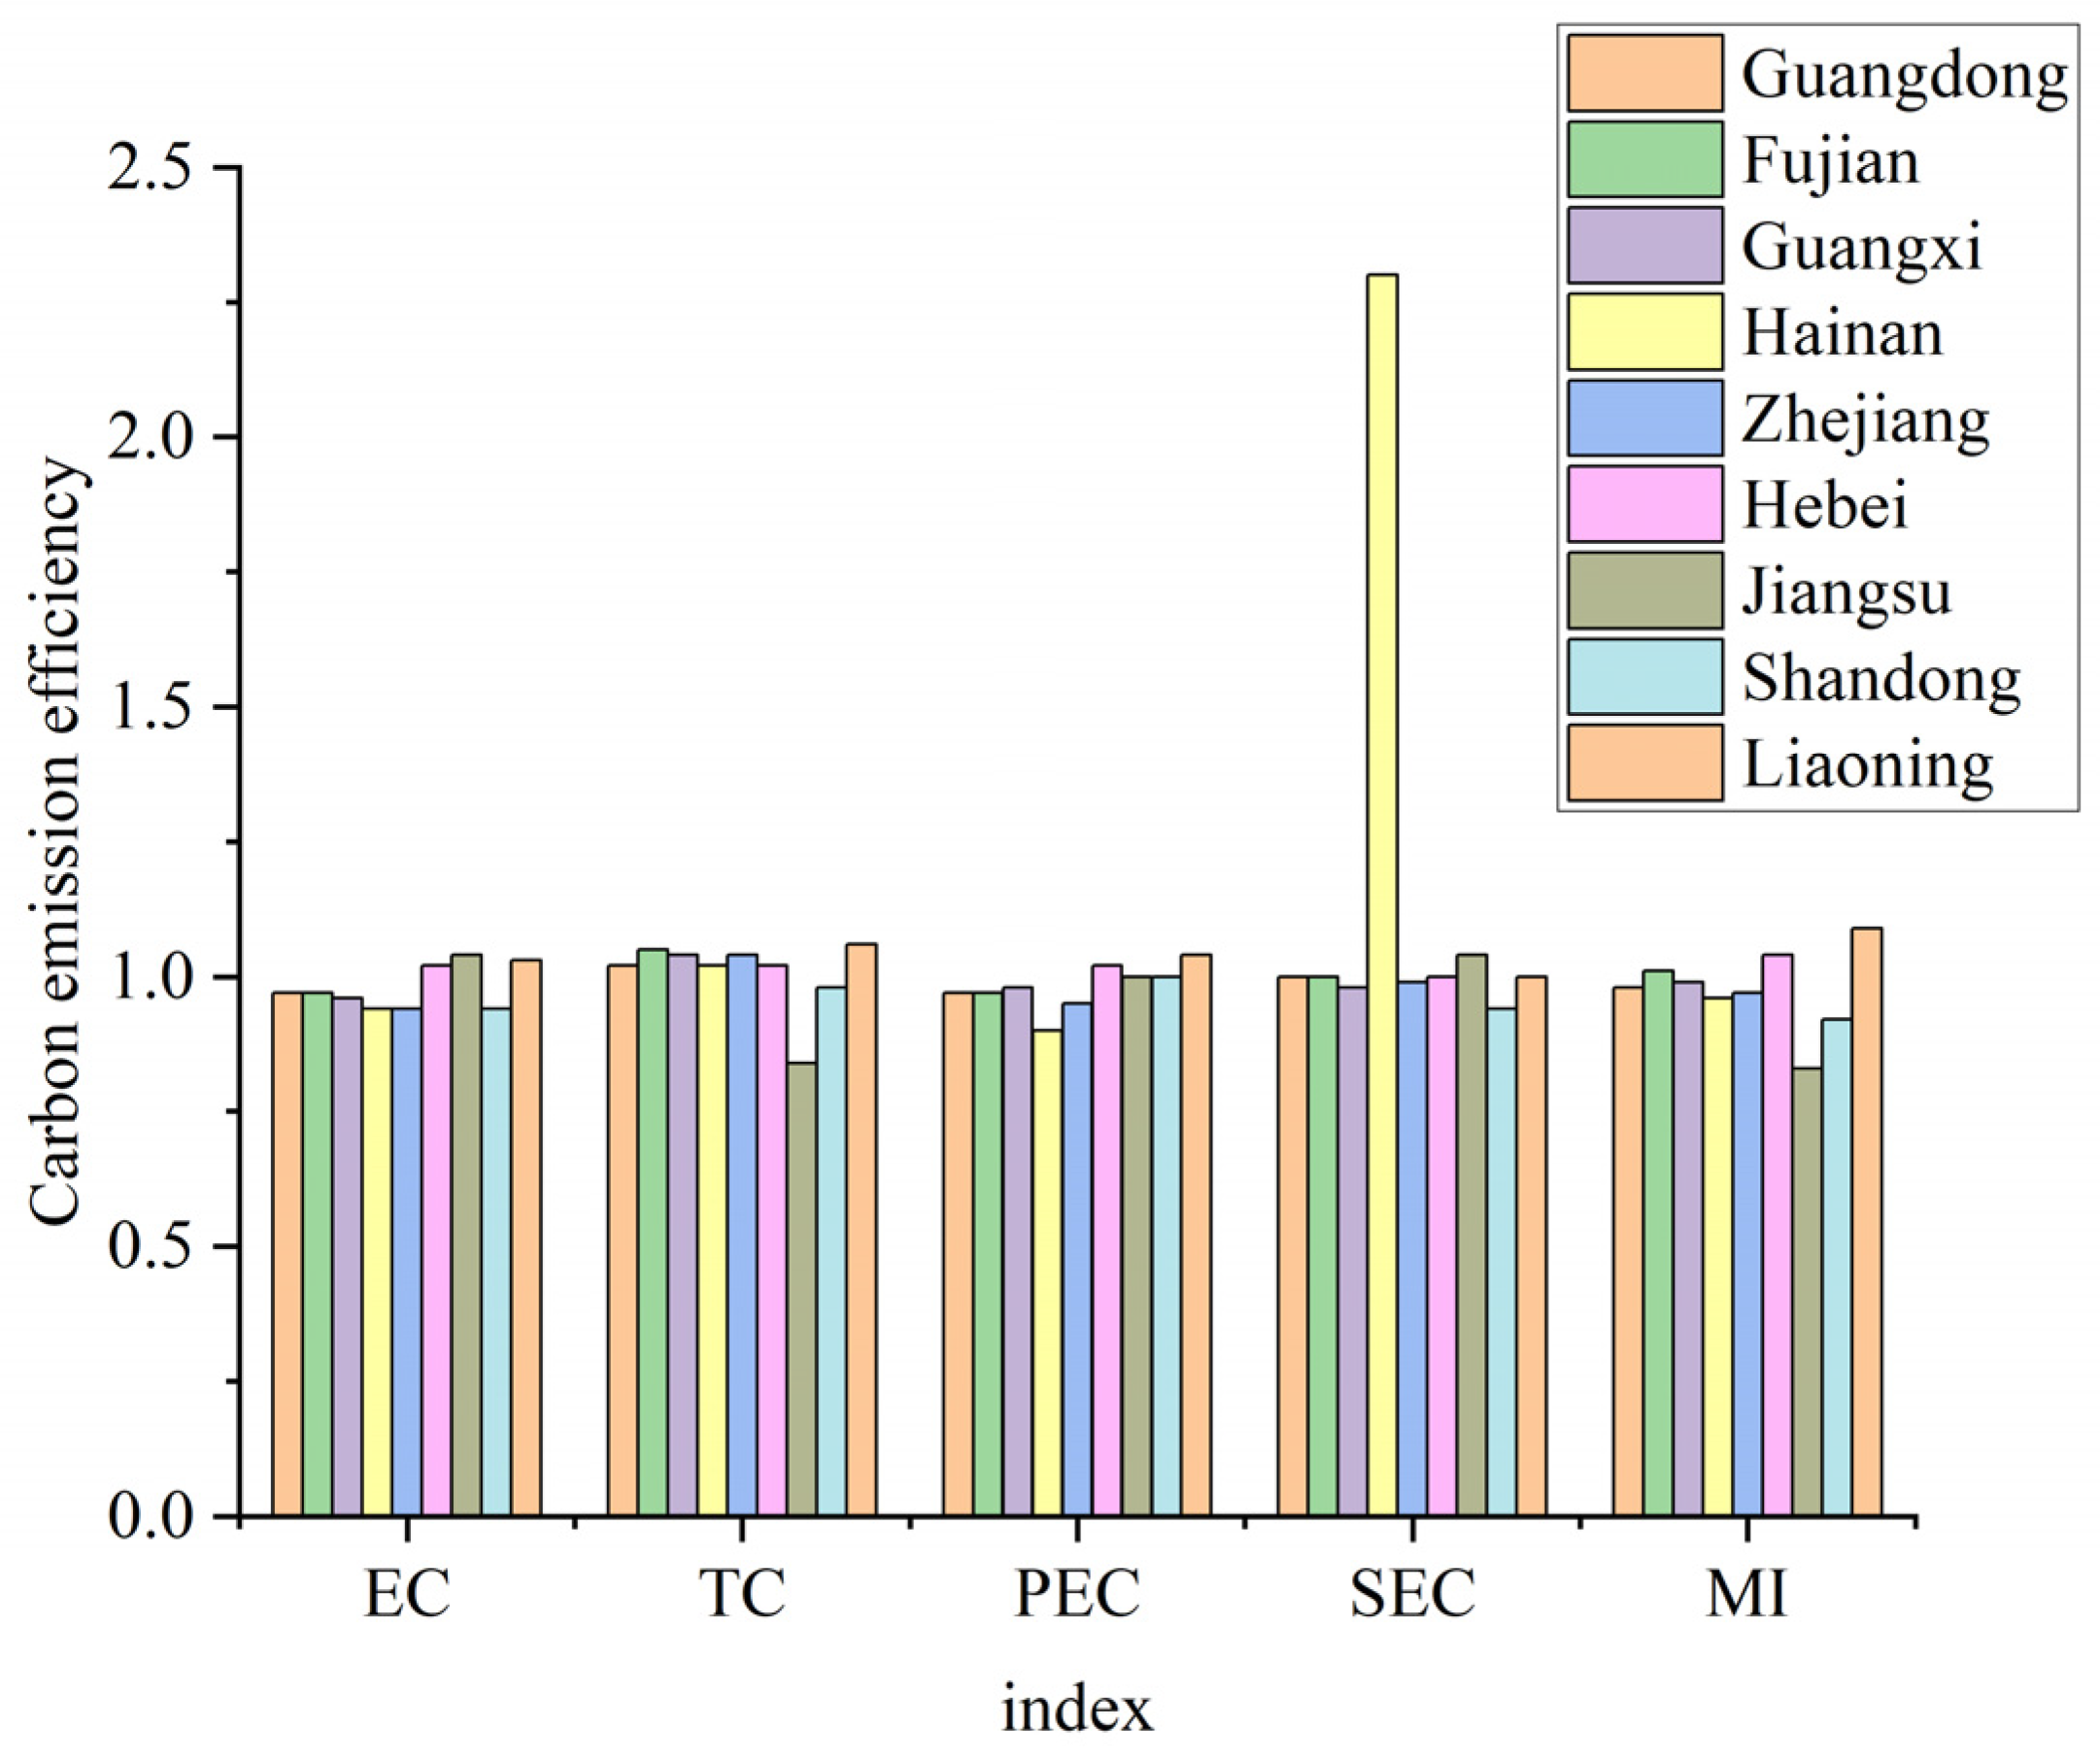
3.2. Dynamic Analysis

In the previous section, in-depth explorations were performed utilizing the Super-SBM model. Based on calculating the carbon emission efficiency data using the Super-SBM model, we further adopted the Malmquist index model to study its dynamic trend. The technical efficiency change (EC) index and the technical progress change (TC) index can be calculated using the Malmquist index model. The technical efficiency change index (EC) can be further decomposed into the pure technical efficiency change index (PEC) and the scale efficiency change index (SEC).
Table 4 and Figure 3 present an overview of the Malmquist index (MI) and its decomposition regarding CO2 emissions efficiency. It reveals that a majority of the CO2 emissions efficiency indexes fall below 1, indicating an overall declining trend in the dynamic efficiency of CO2 emissions. Notably, an upward trend was observed specifically during 2019–2020. Based on the data depicted in Figure 3, we can deduce that the predominant cause behind this is predominantly attributed to the decline in the technical efficiency change index (EC). Decomposing the technical efficiency change index (EC) further unveils that both the pure technical efficiency change index (PEC) and the scale efficiency change index (SEC) have experienced alternating downward changes in their values, exerting negative impacts. Hence, it becomes crucial to enhance both the pure technical efficiency and the scale efficiency, which will subsequently improve the CO2 emissions efficiency. The value of the index decomposition indicates an improvement in technical progress and scale efficiency. However, the declining trend in pure technical efficiency suggests the existence of significant room for improvement, particularly in terms of technical capacity.
According to the findings presented in Table 5 and Figure 4, the Malmquist index (MI) reveals variations among different provinces. Specifically, Fujian, Hebei, and Liaoning provinces exhibit values greater than 1, while the remaining six provinces (autonomous region) show values below 1. Notably, among these provinces, Liaoning demonstrates the most substantial growth in CO2 emissions efficiency, with an average growth rate of 9%. This growth can be attributed to a 6% improvement in technological progress and a 3% enhancement in technological efficiency, indicating significant advancements in Liaoning’s technological capability. On the other hand, Jiangsu Province experienced the largest reduction in CO2 emissions, with an average reduction rate of 17%, which can be attributed to the decline in the technological progress change index (TC). This suggests relatively slower technological advancements in the logistics industry of Jiangsu Province. Analyzing the technical progress change index (TC), only Jiangsu Province and Shandong Province showcase values below 1, indicating that the production technology in these coastal areas is developing well.

4. Analysis of Influencing Factors

4.1. Theoretical Analysis and Research Hypotheses

Environmental regulation is a constraining force and standard with the objective of environmental protection, targeting individuals or organizations, and existing in the form of tangible systems or intangible awareness [44]. Over time, the concept of environmental regulation has evolved. Due to the adverse externalities associated with the environment, governments regulate the economic operations of enterprises and organizations, among others, formulating appropriate environmental policies and implementing corresponding measures to ensure harmonious economic efficiency and environmental advancement [45]. On one hand, environmental regulation imposes pressure on logistics enterprises, compelling them to enhance their technology and production methods. It prompts a shift in allocating resources that were previously used for production purposes towards environmental management, thus leading to a “crowding out” effect on production inputs. On the other hand, when reinforcing environmental management practices, organizations must invest in purchasing new equipment and engaging in regular maintenance. Consequently, this raises their operational costs, negatively impacting their profitability and subsequently reducing CO2 emission efficiency. However, as environmental regulations strengthen, the market will progressively transition towards cleaner production approaches, gradually phasing out energy-intensive and highly polluting activities. To fulfill the government’s energy conservation and emission reduction requirements, enterprises are compelled to introduce and develop technologies that reduce emissions and make improvements to their technological processes, thereby decreasing CO2 emissions and enhancing emission efficiency. Subsequently, a research hypothesis, H1, is formulated.
H1. 
With the increasing intensity of environmental regulation, the efficiency of CO2 emissions in the logistics industry demonstrates a U-shaped trend, initially decreasing and then increasing.
Technological innovations play a central role in social development and act as a pivotal force for enterprises to achieve sustainable growth. When the government implements environmental governance measures, it stimulates enterprises to innovatively invest in science and technology research and development, aiming to enhance their performance. As environmental regulations strengthen, enterprises, in order to maintain competitiveness, normalize the integration of innovation in science and technology, and fortify technological advancements to mitigate the impact of production processes on the environment [46]. By fostering scientific and technological advancements, the logistics industry enables enterprises to develop new processes and technologies that efficiently manage pollutants and reduce their emissions, thus effectively improving CO2 emission efficiency. This realization leads to the proposition of research hypothesis H2.
H2. 
Environmental regulations can influence carbon emission efficiency by affecting technological innovation.
Energy efficiency serves as a measure of how effectively energy is utilized. By prioritizing environmental protection during the development process, the logistics industry can implement measures to reduce energy consumption and adopt specific technologies to maximize energy efficiency, resulting in the simultaneous achievement of low energy usage and high income. Enhancing energy efficiency levels ultimately contributes to the improvement of CO2 emissions efficiency within the logistics industry. Hence, research hypothesis H3 is put forward.
H3. 
Energy efficiency within the logistics industry positively influences carbon emissions efficiency.

4.2. Definition of Variables

  • Explained variable: CO2 emissions efficiency of the logistics industry (CEE). Calculated from above based on Super-SBM model.
  • Explanatory variables:
Environmental regulation (ER). Existing research has not formed unified environmental regulation indicators; this study refers to the basis of related research [47,48], combined with the actual situation of the logistics industry, expressed by the product of each region’s investment in the ecological protection and environmental governance industry (IEP) and the proportion of the GDP of the logistics industry to the gross domestic product (LIGDP/GDP). Investment in the ecological protection and environmental governance industry can reflect the government’s strength of environmental protection governance, and the whole can reflect the government’s strength in terms of each region’s environmental governance of the logistics industry. The specific formula is as follows:
E R = I E P × L I G D P G D P
where IEP denotes regional investment in the ecological protection and environmental governance industry, LIGDP denotes the gross product of the logistics industry, and GDP denotes the gross domestic product of the region.
Energy efficiency (EE): The ratio of energy consumption in the logistics industry to the gross product of the logistics industry is utilized to express energy efficiency, as outlined in the relevant literature [49]. Energy intensity represents the efficiency of energy utilization, and a higher value indicates greater energy utilization efficiency in the logistics industry.
3.
Mediating variable: Technological innovations (TI). Drawing upon available literature and data, TI is represented as the product of the number of patent filings in each region and the share of logistics industry output value in total GDP. The number of patent applications serves as an indicator of technological innovations to some extent. An increased number of patent applications signifies a higher level of technological innovation.
4.
Control variables:
This study includes several control variables: the level of external openness (EO), advanced industrial structure (AIS), economic development (ED), and population density (PD). As shown in Table 6.

4.3. Benchmark Regression Results

As demonstrated in Table 7, this study initially incorporated the environmental regulation into the model simultaneously, and Table 7 presents the outcomes of the regression analysis in columns (1) and (2). After accounting for time and region effects, the study examined the linear association between environmental regulation and the efficiency of CO2 emissions. The statistical tests of significance indicate that the observed relationship does not hold, regardless of the inclusion of control variables. This suggests that there is no linear relationship between environmental regulations and the carbon emission efficiency of the logistics industry. Subsequently, to further investigate the relationship, this study introduced the square of environmental regulation into model (3), and the corresponding regression outcomes are provided in column (3) of Table 7. The primary and secondary terms of environmental regulation have coefficients of −0.019 and 0.001, respectively. Both coefficients have successfully passed significance tests at the 1% and 5% levels, and they also satisfy the U test. With the addition of control variables to model (3), the regression results are similar to those without control variables and pass the U test; the results are shown in column (4) of Table 7. Thus, the empirical results verify Hypotheses 1. The findings imply a U-shaped relation between environmental regulation and CO2 emissions efficiency in the logistics industry.
We used model (4) to investigate whether there is a linear relationship between energy efficiency and carbon emission efficiency. The results show that the primary term coefficient of energy efficiency is 0.109 and passes the 1% significance test. With the addition of control variables in model (4), the regression results are similar to those without control variables and pass the significance test; the results are shown in column (6) of Table 7. This indicates that energy efficiency has a positive contribution to carbon emission efficiency in the logistics industry. Thus, the empirical results verify Hypothesis 3.

4.4. Mechanism Testing

To examine the mediating role of technological innovations between environmental regulation and the efficiency of CO2 emissions, the mediation model discussed in the previous section was employed.
Using model (5), the relationship between environmental regulation and carbon emission efficiency was first investigated, and the results are shown in column (1) of Table 8. Then, using model (6), the relationship between environmental regulation and technological innovation was explored, and the results are shown in column (2) of Table 8. The coefficient of the primary term related to energy efficiency is 6.982, surpassing the 5% significance level. This implies that environmental regulation positively influences technological innovations within the logistics industry. The implementation of relevant environmental regulations by the government is expected to stimulate the scientific and technological advancement of enterprises. This would enhance their competitiveness and ensure sustainable development. Finally, model (7) was utilized to explore the impact on carbon emission efficiency using environmental regulation and technological innovation as explanatory variables, and the results are shown in column (3) of Table 8. It is observed that even after incorporating the mediator variable of technological innovations, the relationship between environmental regulation and the efficiency of CO2 emissions retains a significant U-shaped pattern. Specifically, the coefficients for the primary term and quadratic term of environmental regulation are −0.021 and 0.001, respectively. These coefficients exhibit significance at the 1% and 5% levels, confirming the U-shaped relationship. It is evident that the implementation of environmental regulation fosters the advancement of technological innovations. However, during the initial phase of environmental regulation, there is a reduction in the CO2 emissions efficiency of the logistics industry due to the effect known as “crowding out”. Furthermore, as environmental regulations become more stringent, they actively encourage the development of technological innovations. This, in turn, leads to the emergence of new processes and technologies that enhance the CO2 emissions efficiency of the logistics industry. As a result, Hypothesis 2 is substantiated.

4.5. Robustness Tests

In order to assess the robustness of the aforementioned findings, this study conducted a thorough examination of the benchmark regression results. Drawing upon existing literature, several strategies were employed to carry out this robustness check.
Firstly, the explained variable was substituted. Instead of CO2 emissions efficiency, we utilized carbon production efficiency (CPE). This measure represents the ratio of the logistics industry’s output value to its CO2 emissions. The corresponding outcomes are demonstrated in columns (1) and (2) of Table 9. As can be seen in column (1) of Table 8, the coefficients of the primary and secondary terms of environmental regulation are −0.032 and 0.002, respectively, and pass the 10% and 1% significance levels, respectively, and pass the U test. It shows that there is a significant U-shaped relationship between environmental regulation and carbon productivity efficiency. As can be seen in column (2) of Table 9, the coefficient of the primary term of energy efficiency is 0.896 and passes the 1% significance level, indicating that energy efficiency positively contributes to carbon production efficiency. Secondly, additional control variables were incorporated. Informatization development levels also exert an influence on CO2 emissions efficiency. Higher levels of informatization generally correlate with stronger support for the logistics industry’s growth. The results of including these control variables are presented in columns (3) and (4) of Table 9. Thirdly, adjustments were made to the sample. To minimize the potential impact of data outliers on the regression results, a truncation of approximately 1% was applied to the sample data. The corresponding results are displayed in Table 9, specifically in columns (5) and (6) of Table 9. As can be seen from the results in columns (3)–(6) of Table 9, by adding control variables and adjusting the sample period, the regression results are consistent with the baseline regression results in Table 7, which not only pass the test of significance, but also wherein the positive and negative values of the coefficients remain unchanged. After reviewing the results above, it is clear that the robustness of the benchmark regression results is verified.

5. Discussion and Recommendations

5.1. Discussion

The empirical results necessitate a thorough analysis and exploration of the underlying reasons. This section provides a detailed discussion of several significant empirical findings. Firstly, when examining the CO2 emissions efficiency of the logistics industry in the coastal area from both static and dynamic perspectives, it becomes evident that it remains at a moderate level without displaying any growth trends. A careful examination of the current situation suggests a plausible explanation: China’s logistics industry has experienced rapid development in recent years. In particular, the logistics industry in the coastal area is having faster growth with a relatively weak emphasis on environmental protection. Moreover, the expansion of the logistics infrastructure has amplified energy consumption. Efforts to enhance CO2 emissions efficiency through research and development of technology have imposed additional costs. Consequently, the CO2 emissions efficiency is to some extent maintained at a medium level.
In the upcoming years, with the strengthening of environmental consciousness and the implementation of relevant technologies, we anticipate enhancements in the effectiveness of CO2 emissions controls. From the viewpoint of individual provinces, certain regions have attained effective levels of carbon emission efficiency within the logistics sector during specific time periods. This effectiveness is influenced by factors such as technology and scale. It is essential for different provinces to analyze the reasons behind the maintenance of efficient CO2 emissions and learn from these experiences to enhance emissions efficiency in the logistics industry. For instance, Hebei Province witnessed an improvement in efficiency during 2019–2020. On analyzing the index decomposition, this improvement can be attributed to technological advancements, while the impact of scale hindered the enhancement of CO2 emissions efficiency. Based on these findings, Hebei Province should continue investing in the research and development of technical factors, examine the reasons for the negative impact of scale, initiate suitable improvements, and mitigate the inhibitory effect that scale has on CO2 emissions efficiency.
Analyzing the environmental impact on CO2 emission efficiency from a logistics industry’s environmental regulation perspective, early-stage implementation of environmental regulations compels enterprises to prioritize environmental protection issues and increase their investment in relevant technologies. This increased investment leads to a “crowding out” effect on the enterprise’s input resources. Consequently, logistics enterprises reduce capital investment in the production process, resulting in decreased output levels and reduced CO2 emission efficiency in the logistics industry. Furthermore, investing in research and development of related technologies enhances CO2 emissions efficiency. Environmental regulations can influence CO2 emission efficiency through technological innovations. A similar argument was made by Hailiang et al. [50] and Sanliang et al. [51]. The current research of scholars, on the one hand, tends to explore the carbon emissions of the region, and there is no in-depth research on the carbon emission efficiency of the industry; on the other hand, scholars have explored the relationship between different environmental regulatory tools and carbon emission efficiency in the region. This paper explores the current situation of carbon emission efficiency in the logistics industry in depth and also finds that environmental regulation can affect the carbon emission efficiency of the logistics industry through the path of technological innovation. Additionally, enhancing energy efficiency contributes to improved CO2 emission efficiency. Analyzing energy efficiency reflects the benefits derived from reduced energy consumption in the logistics industry, thereby advancing the goal of achieving green development and efficiency in the logistics industry.
During the period of COVID-19, the economy of China and the development of various industries were affected. As can be seen from the data, it can be found that the growth rate of the capital stock of the logistics industry slows down, energy consumption decreases, the growth rate of the output value of the logistics industry slows down, and the carbon dioxide emissions of the logistics industry decrease in 2019–2020. This is due to the fact that this paper uses the calculation of the carbon emission efficiency of the logistics industry, taking into account the changes in the input indicators, output indicators, and non-desired output indicators. When the volume of input indicators is reduced or the growth rate is slowed down, the desired output growth rate is slowed down and the non-desired output is reduced, which will not make the carbon emission efficiency of the logistics industry change too much.

5.2. Recommendations

Following the preceding analysis, variations can be observed among different regions concerning the carbon emission efficiency in coastal areas, suggesting substantial potential for enhancement. Considering the aspects of environmental regulations and energy utilization efficiency, the CO2 emissions efficiency of the logistics industry demonstrates the “U”-shaped pattern, characterized by a decline followed by an increase. Furthermore, the influence of environmental regulations on technological innovation can impact the carbon emission efficiency within the logistics industry. Furthermore, the enhancement of energy efficiency actively contributes to the advancement of carbon emission efficiency. Therefore, the following suggestions are proposed:
Implement differentiated environmental regulations tailored to local conditions. Based on the aforementioned analysis, it becomes apparent that increasing the intensity of environmental regulation can act as a driving force for enhancing CO2 emissions efficiency in the logistics industry of the nine provinces (autonomous region). The government should gradually intensify the implementation of environmental regulation policies to raise awareness among enterprises regarding environmental protection. This will encourage companies to reduce the consumption of highly energy-consuming and highly polluting materials while adopting new processes and technologies. Promoting the adoption of clean energy and green innovative technologies should be an active initiative undertaken by the district to guide logistics enterprises. This can be achieved by expediting the removal of highly energy-consuming equipment while encouraging and supporting the utilization of low-carbon and energy-saving alternatives. Additionally, the district should prioritize the expansion of green logistics enterprises. Environmental regulations must be integrated into the city’s development planning, accompanied by increased implementation of policies such as tax incentives and financial subsidies. These measures will incentivize enterprises to engage in technological innovations, compensating for the associated costs and ultimately enhancing CO2 emission efficiency. It is crucial, however, for the government to implement differentiated environmental regulations based on the uniqueness of each location. Districts with lower environmental intensity should witness an increase in the stringency of regulations to reinforce CO2 emissions efficiency. On the other hand, districts with higher environmental intensity should maintain the existing regulatory intensity while exploring other avenues to enhance CO2 emissions efficiency.
Emphasize technological innovations. Continuous innovation and the adoption of advanced technology are critical to achieving sustainable development within the logistics industry. The industry should prioritize the integration of new technologies in operations such as warehousing, transportation, and distribution endpoints. This can be realized through the use of new equipment, new energy sources, and innovative materials. By adopting these strategies, the logistics industry can effectively mitigate environmental impacts, reduce CO2 emissions, and contribute to the industry’s long-term sustainability. To facilitate the transition towards a green and low-carbon logistics industry, it is crucial to establish a comprehensive framework comprising eco-friendly products, sustainable enterprises, and an environmentally conscious environment.
To enhance the energy efficiency of the logistics industry, it is crucial for logistics enterprises to prioritize improving energy utilization efficiency during their development. This involves various measures such as augmenting technological innovation and incorporating advanced science, technology, and equipment. By adopting advanced management concepts from the logistics industry at home and abroad, the regional logistics industry can upgrade its operations to utilize more efficient and environmentally friendly energy sources. Simultaneously, the growth and development of the logistics industry should not solely focus on expanding the industry scale while ignoring energy consumption. Instead, it should emphasize the optimal allocation of scale and energy, aiming to minimize the adverse effects resulting from scale expansion. This can be achieved through the promotion of natural gas, high-quality coal, clean coal, and other green energy sources. Additionally, active research into energy-saving and emission reduction projects should be conducted in the logistics industry, alongside the formulation of feasible and practical policies related to low-carbon and energy aspects. These initiatives will improve energy utilization efficiency within the logistics industry and consequently enhance the efficiency of CO2 emissions.

6. Conclusions

The study utilized panel data from nine provinces (autonomous region) in China’s coastal region, spanning the years 2011 to 2020, as the research sample. The CO2 emissions efficiency was measured by an innovative method using the Super-SBM model, taking into account undesired outputs. The analysis also adopted a dynamic perspective using the Malmquist index model. In the final stage, this research utilized panel models to assess the influence of environmental regulations and energy utilization efficiency. Additionally, mediation analysis models were employed to explore the mechanisms through which technological innovation contributes to the relationship between environmental regulations and carbon emission efficiency. The research findings indicate the following:
(1) During the period under examination, a static analysis of CO2 emissions efficiency in the logistics industry across various regions reveals that the overall level of such efficiency in coastal areas of China exhibited fluctuations of approximately 0.46, having significant room for improvement. From an individual province standpoint, Hebei Province exhibited a relatively high CO2 emissions efficiency of 0.96, nearing peak effectiveness. Jiangsu Province and Shandong Province achieved CO2 emissions efficiency levels of 0.68 and 0.70, respectively, representing a moderate level of efficiency. In certain years, the efficiency values of these three provinces even exceeded 1. However, the remaining provinces showcased lower levels of CO2 emissions efficiency. Notably, the logistics industry in Liaoning Province displayed the lowest efficiency level, with a maximum value of only 0.28 over the past decade, indicating a substantial gap in achieving effective CO2 emissions efficiency within the logistics industry.
(2) The dynamic analysis of CO2 emissions efficiency within the logistics industry across different regions reveals significant findings during the sample period. Overall, the logistics industry in China’s coastal district achieved a CO2 emissions efficiency of 0.98, indicating proximity to a stable state. However, there was no observable growth trend. Notably, Fujian Province, Hebei Province, and Liaoning Province demonstrated some level of improvement, with the latter displaying the most substantial progress among the three provinces. Conversely, the remaining districts experienced a lack of improvement, experiencing a certain degree of recession. This can be attributed mainly to the alternating declines in both the pure technical efficiency index and scale efficiency index, which created a drag effect. Upon further examination of the index decomposition, the logistics industry in the coastal region showcased improvements in the technical progress index and scale efficiency index. However, the pure technical efficiency index exhibited a decline, implying ample room for enhancing technical capacity and further optimization.
(3) Consider both nonlinear and linear perspectives. The study investigates the impact of environmental regulations and energy efficiency on the efficiency of CO2 emissions in industry. The article delves into the mediating function of technological advancements in the relationship between environmental regulations and the efficiency of CO2 emissions. The findings reveal several key insights. Firstly, as the magnitude of environmental regulations intensifies, the CO2 emissions efficiency of the logistics industry demonstrates a “U”-shaped pattern, characterized by a decline followed by an increase. Secondly, environmental regulations within the logistics industry exert an impact on CO2 emissions efficiency by influencing technological innovations. Lastly, in enhancing CO2 emissions efficiency, the logistics industry benefits from the positive influence of energy efficiency.

7. Research Deficiencies and Future Prospects

Research on the carbon emission efficiency of the logistics industry is conducive to providing theoretical references for its green development programming. There are still some deficiencies in the study: (1) When calculating the carbon emission efficiency of the logistics industry, only the output value of the logistics industry is taken into account when considering the desired output index, and some other indexes, such as transportation mileage, can be considered to be added in the future. (2) This paper considers the impact of environmental regulation, technological innovation, and energy efficiency on the carbon emission efficiency of the logistics industry. Factors such as the level of the digital economy and the strength of government investment will affect the carbon emission efficiency of the logistics industry, which can be further added in the future. (3) This paper takes the data of the decade 2011–2020 as the research sample, which is restricted in terms of the collection of relevant data, making the sample period one with certain limitations, and the data of the last two years can be added in the future to promote the development of the low-carbon logistics industry.

Author Contributions

Conceptualization, H.W. and Y.L.; methodology, W.L.; software, W.L.; validation, H.W. and Y.L.; formal analysis, H.W.; investigation, H.W.; resources, Y.L.; data curation, W.L.; writing—original draft preparation, H.W.; writing—review and editing, H.W., Y.L. and W.L.; supervision, H.W. and Y.L.; funding acquisition, H.W. All authors have read and agreed to the published version of the manuscript.

Funding

This work is supported by Hebei Province Philosophy and Social Science Planning and Research Project (No. HB21YJ004), Hebei Province Graduate Education Teaching Reform Project (No. YJG2023098), Science Foundation of Ministry of Education of China (No. 21YJC630072), and the Humanities and Social Science Research Project of Hebei Education Department, China (No. BJS2023003).

Institutional Review Board Statement

Not applicable.

Informed Consent Statement

Not applicable.

Data Availability Statement

Not applicable.

Conflicts of Interest

The authors declare no conflict of interest.

References

  1. Wang, Z.H.; Wang, C. How carbon offsetting scheme impacts the duopoly output in production and abatement: Analysis in the context of carbon cap-and-trade. J. Clean. Prod. 2015, 103, 715–723. [Google Scholar] [CrossRef]
  2. Pattak, D.C.; Tahrim, F.; Salehi, M.; Voumik, L.C.; Akter, S.; Ridwan, M.; Sadowska, B.; Zimon, G. The Driving Factors of Italy’s CO2 Emissions Based on the STIRPAT Model: ARDL, FMOLS, DOLS, and CCR Approaches. Energies 2023, 16, 5845. [Google Scholar] [CrossRef]
  3. Mohammad, A.K.; Uzma, K.; Sana, N.; Shaha, F. Role of energy consumption, tourism and economic growth in carbon emission: Evidence from Kuwait. Cogent Econ. Financ. 2023, 11, 2218680. [Google Scholar]
  4. Zhao, X.C.; Long, L.C.; Yin, S.; Zhou, Y. How technological innovation influences carbon emission efficiency for sustainable development? Evidence from China. Res. Environ. Sustain. 2023, 14, 100135. [Google Scholar] [CrossRef]
  5. Ran, W.X.; Liu, R.L.; Liu, S.W. Area Differences in Regional Logistics Efficiency and the Law Governing Its Temporal and Spatial Evolution. J. Adv. Transp. 2022, 2022, 14. [Google Scholar] [CrossRef]
  6. Li, H.; Jiang, L.; Liu, J.; Su, D. Research on the Evaluation of Logistics Efficiency in Chinese Coastal Ports Based on the Four-Stage DEA Model. J. Mar. Sci. Eng. 2022, 10, 1147. [Google Scholar] [CrossRef]
  7. Zhou, T.Y.; Li, W.X. Analysis on Logistics Efficiency Measurement of New Western Land-Sea Corridor under the Background of "Double Carbon" and Ecological Environment Protection. J. Environ. Public. Health. 2023, 2023, 8642841. [Google Scholar] [CrossRef]
  8. Lin, Q.P.; Wang, Y.Y.; Li, S.R. Spatio-temporal evolution and influencing factors of green low-carbon logistics efficiency in the new western land and sea corridor. J. Wuhan B. Sch. 2023, 37, 27–35. [Google Scholar]
  9. Ge, Y.H.; Yao, D.L. Dynamic analysis of logistics efficiency and influencing factors in Shaanxi Province based on DEA-Tobit. J. Xi’an Pet. Univ. (Soc. Sci. Ed.) 2023, 32, 52–59. [Google Scholar]
  10. Gu, R.L.; Duo, L.H.; Guo, X.F.; Zou, Z.L.; Zhao, D.X. Spatiotemporal heterogeneity between agricultural carbon emission efficiency and food security in Henan, China. Environ. Sci. Pollut. Res. Int. 2023, 30, 49470–49486. [Google Scholar] [CrossRef] [PubMed]
  11. Cui, Y.; Chu, S.Z. Study on Carbon Emission Efficiency Evaluation and Influencing Factors of Chinese Pharmaceutical Manufacturing Industry. Pharmacol. Pharm. 2023, 14, 98–111. [Google Scholar] [CrossRef]
  12. Jiang, H.T.; Yin, J.; Qiu, Y.H.; Zhang, B.; Ding, Y.; Xia, R.C. Industrial Carbon Emission Efficiency of Cities in the Pearl River Basin: Spatiotemporal Dynamics and Driving Forces. Land 2022, 11, 1129. [Google Scholar] [CrossRef]
  13. Liang, Z.J.; Chiu, Y.H.; Guo, Q.; Liang, Z. Low-carbon logistics efficiency: Analysis on the statistical data of the logistics industry of 13 cities in Jiangsu Province, China. Res. Transp. Bus. Manag. 2022, 43, 100740. [Google Scholar] [CrossRef]
  14. Jiang, X.H.; Ma, J.X.; Zhu, H.Z.; Guo, X.C.; Huang, Z.G. Evaluating the Carbon Emissions Efficiency of the Logistics Industry Based on a Super-SBM Model and the Malmquist Index from a Strong Transportation Strategy Perspective in China. Int. J. Environ. Res. Public Health 2020, 17, 8459. [Google Scholar] [CrossRef] [PubMed]
  15. Wang, Q.Z.; Zhang, Q. Foreign Direct Investment and Carbon Emission Efficiency: The Role of Direct and Indirect Channels. Sustainability 2022, 14, 13484. [Google Scholar] [CrossRef]
  16. Li, J.; Liu, S.W.; Liu, Q.; Ding, J.L. Agricultural carbon emission efficiency evaluation and influencing factors in Zhejiang province. China Front. Environ. Sci. 2022, 10, 2208. [Google Scholar] [CrossRef]
  17. Guo, H.P.; Li, S.; Pan, C.L.; Xu, S.; Lei, Q.Y. Analysis of spatial and temporal characteristics of carbon emission efficiency of pig farming and the influencing factors in China. Front. Public Health 2023, 11, 1073902. [Google Scholar] [CrossRef]
  18. Liu, Q.Z.; Hao, J. Regional Differences and Influencing Factors of Carbon Emission Efficiency in the Yangtze River Economic Belt. Sustainability 2022, 14, 4814. [Google Scholar] [CrossRef]
  19. Sun, W.; Huang, C.C. Predictions of carbon emission intensity based on factor analysis and an improved extreme learning machine from the perspective of carbon emission efficiency. J. Clean. Prod. 2022, 338, 130414. [Google Scholar] [CrossRef]
  20. Bao, Q.L.; Chai, H.Q. Environmental Regulation, Financial Resource Allocation, and Regional Green Technology Innovation Efficiency. Discrete. Dyn. Nat. Soc. 2022, 2022, 7415769. [Google Scholar] [CrossRef]
  21. Cui, S.N.; Wang, Y.Q.; Zhu, Z.W.; Zhu, Z.H.; Yu, C.Y. The impact of heterogeneous environmental regulation on the energy eco-efficiency of China’s energy-mineral cities. J. Clean. Prod. 2022, 350, 131553. [Google Scholar] [CrossRef]
  22. Ren, H.J.; Yao, Y.H. Analysis of the impact of environmental regulation on eco-efficiency under the perspective of resource dependence—Based on SBM super-efficiency model. Soft Sci. 2016, 30, 35–38. [Google Scholar]
  23. Tu, H.X.; Dai, W.; Fang, Y.; Xiao, X. Environmental Regulation, Technological Innovation and Industrial Environmental Efficiency: An Empirical Study Based on Chinese Cement Industry. Sustainability 2022, 14, 11326. [Google Scholar] [CrossRef]
  24. Su, Y.; Gao, X.W. Environmental regulation and its influence on energy efficiency and environmental performance: Do technological innovation and financial efficiency matter? Environ. Sci. Pollut. Res. 2023, 30, 50013–50021. [Google Scholar] [CrossRef] [PubMed]
  25. Song, W.F.; Han, X.F. A bilateral decomposition analysis of the impacts of environmental regulation on energy efficiency in China from 2006 to 2018. Energy Strategy Rev. 2022, 43, 100931. [Google Scholar] [CrossRef]
  26. Yao, S.L.; Su, X. Research on the Nonlinear Impact of Environmental Regulation on the Efficiency of China’s Regional Green Economy: Insights from the PSTR Model. Discret. Dyn. Nat. Soc. 2021, 2021, 1–13. [Google Scholar] [CrossRef]
  27. Zhang, C.Y.; Lin, J. An empirical study of environmental regulation on carbon emission efficiency in China. Energy Sci. Eng. 2022, 10, 4756–4767. [Google Scholar] [CrossRef]
  28. Wang, D.; Li, J.Y. Environmental regulation, technological progress and energy carbon emission efficiency. Tech. Econ. Manag. Res. 2022, 7, 31–36. [Google Scholar]
  29. Jiang, S.L.; Lu, C.B. Research on multiple pathways and threshold modeling of environmental regulation on carbon efficiency. Tech. Econ. 2023, 42, 117–129. [Google Scholar]
  30. Wu, C.X.; Zhang, Z.Y. Research on the impact of environmental regulation on total factor productivity in China’s manufacturing industry. J. Xiangtan Univ. (Phil. S. Sci. Ed.) 2016, 40, 77–81. [Google Scholar]
  31. Fan, B.; Li, M.Y. The Effect of Heterogeneous Environmental Regulations on Carbon Emission Efficiency of the Grain Production Industry: Evidence from China’s Inter-Provincial Panel Data. Sustainability 2022, 14, 14492. [Google Scholar] [CrossRef]
  32. Wang, Q.; Zhang, C.; Li, R.R. Does environmental regulation improve marine carbon efficiency? The role of marine industrial structure. Mari. Pollut. Bull. 2023, 188, 114669. [Google Scholar] [CrossRef] [PubMed]
  33. Cheng, J.S.; Lei, J.X. Spatio-temporal dynamics of environmental regulation on carbon emission efficiency of ecotourism industry in national-level city clusters. J. Cntrl. S. Forest. Univ. Sci. Tech. 2023, 43, 175–186. [Google Scholar]
  34. Yu, K.L.; Zhong, X.Q. Impact of environmental regulation on carbon emission efficiency of logistics enterprises. Hebei Financ. 2023, 4, 44–49. [Google Scholar]
  35. Zhang, H.J.; Xu, Y.W.; Cheng, K.; Zhang, R.; Yin, C.X. A review of research hotspots in data envelopment analysis. Comp. Eng. Apps. 2018, 54, 219–228. [Google Scholar]
  36. Tone, K.R. A slacks-based measure of efficiency in data envelopment analysis. Eur. J. Oper. Res. 2001, 130, 498–509. [Google Scholar] [CrossRef]
  37. Zhou, P.; Ang, B.W.; Han, J.Y. Total factor carbon emission performance: A Malmquist index analysis. Energy Econ. 2010, 32, 194–201. [Google Scholar] [CrossRef]
  38. Baron, R.M.; Kenny, D.A. The moderator-mediator variable distinction in social psychological research: Conceptual, strategic, and statistical considerations. J. Pers. Soc. Psychol. 1986, 51, 1173–1182. [Google Scholar] [CrossRef] [PubMed]
  39. Wang, Q.M.; Tan, C.E. An empirical study on logistics efficiency and its influencing factors in Xi’an city--an analysis based on DEA model and Tobit regression model. Soft Sci. 2013, 27, 70–74. [Google Scholar]
  40. Liu, L.; Li, M.Y.; Gong, X.J.; Jiang, P.; Zhang, Y.H. Influence Mechanism of Different Environmental Regulations on Carbon Emission Efficiency. Int. J. Environ. Res. Public Health 2022, 19, 13385. [Google Scholar] [CrossRef]
  41. Goldsmith, R.W. A Perpetual Inventory of National Wealth. In Studies in Income and Wealth; NBER: Cambridge, MA, USA, 1951; Volume 14, pp. 5–73. [Google Scholar]
  42. Zhang, J.; Wu, G.Y.; Zhang, J.P. Estimation of interprovincial physical capital stock in China: 1952–2000. Econ. Res. 2004, 10, 35–44. [Google Scholar]
  43. Wu, J.X.; Guo, Z.Y. Convergence analysis of carbon emissions in China based on the continuum dynamic distribution method. Stat. Res. 2016, 33, 54–60. [Google Scholar]
  44. Tu, G.; Zhao, Y.G. Study on Strategic Behavior Choices of Corporate Development under Environmental Regulatory Constraints. Econ. Issue 2011, 7, 86–89. [Google Scholar]
  45. Zhao, H. Cost-benefit analysis of environmental regulation—Experience and revelation of the United States. Shandong Econ. 2006, 02, 115–120. [Google Scholar]
  46. Huang, D. Green finance, environmental regulation, and regional economic growth: From the perspective of low-carbon technological progress. Environ. Sci. Pollut. Res. 2022, 29, 33698–33712. [Google Scholar] [CrossRef] [PubMed]
  47. Zhang, J.X.; Jin, W.X.; Philbin, S.P.; Lu, Q.C.; Ballesteros, P.P.; Skitmore, M.; Li, H. Impact of environmental regulations on carbon emissions of transportation infrastructure: China’s evidence. Clean. Responsible Consum. 2021, 2, 100010. [Google Scholar] [CrossRef]
  48. Shen, N. Environmental Efficiency, Industry Heterogeneity and Optimal Regulatory Intensity: A Nonlinear Test on Panel Data of Chinese Industrial Sectors. China Ind. Econ. 2012, 03, 56–68. [Google Scholar]
  49. Wang, D.; Li, J.Y. A quasi-natural experimental study on the impact of western development on carbon emissions. Ecolo. Econ. 2023, 39, 19–25+34. [Google Scholar]
  50. Ma, H.L.; Dong, S.L. Impacts of different types of environmental regulations on carbon emission efficiency. J. Beijing Inst. Tech. (Soc. Sci. Ed.) 2020, 22, 1–10. [Google Scholar]
  51. Jiang, S.L.; Lu, C.B. Externalities and Heterogeneity of Environmental Regulation Affecting Carbon Emission Efficiency-An Analysis Based on the Clustering Synergy of Productive Service Industries. E. China Econ. Manag. 2022, 36, 56–69. [Google Scholar]
Figure 1. Research framework.
Sustainability 15 14423 g001
Figure 2. CO2 emissions efficiency of the logistics industry in nine provinces (autonomous region) in the coastal region, 2011–2020.
Sustainability 15 14423 g002
Figure 3. Trends in Malmquist index and decomposition index of the logistics industry in the coastal region, 2011–2020.
Sustainability 15 14423 g003
Figure 4. Trends in Malmquist index and decomposition index of the logistics industry in nine provinces (autonomous region) in the coastal region, 2011–2020.
Sustainability 15 14423 g004
Table 1. Input–output indicator system for CO2 emissions efficiency in the logistics industry.
Primary
Indicators
Secondary IndicatorsVariable SymbolInterpretation of Indicators
Input indicatorsCapital stock X 1 Capital investment in logistics/billion dollars
Number of employees X 2 Labor input in logistics/ten thousand people
Energy consumption X 3 Energy inputs to the logistics industry/ten thousand tons of standard coal
Expected output indicatorsValue added to the logistics industry Y 1 Results of productive activities in the logistics industry/billions of dollars
Indicator of non-expected outputsCO2 emissions Y 2 CO2 generated by production activities in the logistics industry/ten thousand tons
Table 2. Descriptive statistical analysis of the input and output indicators.
Primary
Indicators
IndicatorsAverageMedianStandard DeviationMaximumMinimum
Input indicatorsCapital stock137.408115.169107.477524.1994.736
Number of employees34.38630.63020.20086.4094.514
Energy consumption1516.2861446.896826.0173549.373276.595
Expected output indicatorsValue added to the logistics industry1947.5491913.3821105.6214091.022119.740
Indicator of non-expected outputsCO2 emissions993.204939.074528.7272357.046168.364
Table 3. CO2 emissions efficiency of the logistics industry in China’s coastal provinces (autonomous region), 2011–2020.
YearGuangdongFujianGuangxiHainanZhejiangHebeiJiangsuShandongLiaoningMean Value
20110.450.330.330.340.571.001.011.030.120.57
20120.440.330.300.320.481.001.010.790.130.53
20130.390.310.300.260.430.870.800.880.140.49
20140.370.310.270.240.390.890.700.830.150.46
20150.350.310.260.200.370.890.630.720.160.43
20160.340.310.260.190.360.830.580.630.180.41
20170.330.310.250.180.351.000.550.540.200.41
20180.330.320.250.180.351.020.540.510.220.41
20190.330.330.250.190.350.930.520.510.250.41
20200.330.340.250.190.321.200.510.530.280.44
Average value0.360.320.270.230.400.960.680.700.180.46
Rankings567841329
Table 4. Changes in Malmquist index and decomposition index of the logistics industry in China’s coastal provinces (autonomous region), 2011–2020.
YearTCECPECSECMI
2011–20121.000.971.060.950.97
2012–20130.970.990.931.170.95
2013–20141.020.950.852.210.97
2014–20151.000.961.000.970.96
2015–20160.961.021.030.980.97
2016–20171.090.890.960.930.96
2017–20181.020.961.010.950.98
2018–20190.941.051.021.030.99
2019–20201.061.020.971.041.03
Table 5. Changes in Malmquist index and decomposition index of logistics industry by provinces (autonomous region) in China’s coastal region, 2011–2020.
ProvincesTCECPECSECMI
Guangdong1.020.970.971.000.98
Fujian1.050.970.971.001.01
Guangxi1.040.960.980.980.99
Hainan1.020.940.902.300.96
Zhejiang1.040.940.950.990.97
Hebei1.021.021.021.001.04
Jiangsu0.841.041.001.040.83
Shandong0.980.941.000.940.92
Liaoning1.061.031.041.001.09
Average value1.010.980.981.140.98
Table 6. Definition of variables.
VariableDefinition of Variables
EOThe ratio of the total annual import and export amount to the gross regional product
AISThe ratio between the value added by the tertiary industry and the value added by the secondary industry
EDThe logarithm of the per capita GDP of each region (based on the year of 2011, and using the GDP index for deflating treatment)
PDThe logarithm of the ratio of the total population to the administrative area of each region
Table 7. Benchmark regression results.
(1)(2)(3)(4)(5)(6)
CEECEECEECEECEECEE
ER−0.0020.000−0.019 ***−0.015 *
(0.003)(0.003)(0.007)(0.008)
SER 0.001 **0.000 *
(0.000)(0.000)
EE 0.109 ***0.092 **
(0.039)(0.041)
_cons0.583 *** 0.637 ***7.3570.463 ***11.116 ***
(0.032) (0.037)(4.628)(0.050)(3.707)
Control variableNoYesNoYesNoYes
Control
area
YesYesYesYesYesYes
Control
year
YesYesYesYesYesYes
R20.323 0.3830.3960.3830.404
Note: t-statistics are in parentheses and ***, **, and * represent 1%, 5%, and 10% significance levels, respectively.
Table 8. Mediated effects test.
(1)(2)(3)
CEEEVCEE
ER−0.015 * −0.021 ***
(0.008) (0.008)
SER0.000 * 0.001 **
(0.000) (0.000)
STI 6.982 **0.222 ***
(2.647)(0.059)
_cons7.357−209.87822.611 ***
(4.628)(271.481)(5.885)
Control variableYesNoYes
Control areaYesYesYes
Control yearYesYesYes
R20.3960.6410.501
Note: t-statistics are in parentheses and ***, **, and * represent 1%, 5%, and 10% significance levels, respectively.
Table 9. Robustness test results.
(1)(2)(3)(4)(5)(6)
CPECPECEECEECEECEE
ER−0.032 * −0.015 * −0.015 *
(0.016) (0.008) (0.008)
SER0.002 *** 0.000 * 0.000*
(0.000) (0.000) (0.000)
EE 0.896 *** 0.096 ** 0.092 **
(0.030) (0.042) (0.041)
_cons5.832−0.0757.56911.526 ***7.35711.116 ***
(9.292)(2.660)(4.697)(3.770)(4.628)(3.707)
Control variableYesYesYesYesYesYes
Control areaYesYesYesYesYesYes
Control yearYesYesYesYesYesYes
R20.7570.9690.3970.4080.3960.404
Note: t-statistics are in parentheses and ***, **, and * represent 1%, 5%, and 10% significance levels, respectively.
Disclaimer/Publisher’s Note: The statements, opinions and data contained in all publications are solely those of the individual author(s) and contributor(s) and not of MDPI and/or the editor(s). MDPI and/or the editor(s) disclaim responsibility for any injury to people or property resulting from any ideas, methods, instructions or products referred to in the content.

