Article

Ensemble Learning Based Sustainable Approach to Carbonate Reservoirs Permeability Prediction

1
Department of Computer Science, College of Computer Science and Information Technology, Imam Abdulrahman Bin Faisal University, P.O. Box 1982, Dammam 31441, Saudi Arabia
2
Department of Computer Engineering, College of Computer Science and Information Technology, Imam Abdulrahman Bin Faisal University, P.O. Box 1982, Dammam 31441, Saudi Arabia
*
Author to whom correspondence should be addressed.
Sustainability 2023, 15(19), 14403; https://doi.org/10.3390/su151914403
Submission received: 23 August 2023 / Revised: 17 September 2023 / Accepted: 25 September 2023 / Published: 30 September 2023

Abstract

:
Permeability is a crucial property that can be used to indicate whether a material can hold fluids or not. Predicting the permeability of carbonate reservoirs is always a challenging and expensive task while using traditional techniques. Traditional methods often demand a significant amount of time, resources, and manpower, which are sometimes beyond the limitations of under developing countries. However, predicting permeability with precision is crucial to characterize hydrocarbon deposits and explore oil and gas successfully. To contribute to this regard, the current study offers some permeability prediction models centered around ensemble machine learning techniques, e.g., the gradient boost (GB), random forest (RF), and a few others. In this regard, the prediction accuracy of these schemes has significantly been enhanced using feature selection and ensemble techniques. Importantly, the authors utilized actual industrial datasets in this study while evaluating the proposed models. These datasets were gathered from five different oil wells (OWL) in the Middle Eastern region when a petroleum exploration campaign was conducted. After carrying out exhaustive simulations on these datasets using ensemble learning schemes, with proper tuning of the hyperparameters, the resultant models achieved very promising results. Among the numerous tested models, the GB- and RF-based algorithms offered relatively better performance in terms of root means square error (RMSE), mean absolute error (MAE), and coefficient of determination (R2) while predicting permeability of the carbonate reservoirs. The study can potentially be helpful for the oil and gas industry in terms of permeability prediction in carbonate reservoirs.

1. Introduction

In a general context, the term permeability is a characteristic given to a material indicating the ease of flow of a fluid through such material [1]. In petroleum engineering, it is known as the ability of porous rocks to pass through oil and/or gas [2,3,4,5]. Notably, it is not always necessary for a porous rock to be permeable. For a rock to be permeable and for the oil and/or gas to penetrate through it, the pore spaces between the grains in the relevant rock must be connected. This implies that permeability is a measure of the ability of oil and/or gas to penetrate through a rock [6]. In this regard, one of the most widely used classification systems for carbonate rock porosity by petroleum geologists was introduced by Choquette and Pray in 1970 [7]. This classification nomenclature is available in numerous books published on carbonate classification, for instance, Tucker and Wright (1990) [8]. It has been cited as a main system for classifying porosity in carbonates.
Permeability is an essential reservoir property and a basic element of reservoir characteristics and the simulation process. This input is generally used to determine hydrocarbon production, recovery estimates, optimal well location, pressure, fluid contact classification, and so forth. More accurate predictions of reservoir permeability surely improve the overall exploration and discovery processes in the concerned area. Studies in the literature reveal that a more accurate prediction of coreless reservoir penetration is still a challenge in the oil and gas industry and needs significant concentration [3,4,5]. It is also known that an accurate estimation of the permeability rate of a target reservoir is essential for the probable oil and gas repository in that reservoir [2,3,4,5,9]. It may help in assessing the realistically achievable percentage of oil and gas, flow rate, estimation of future exploration, and the appropriate and correct design of exploration equipment.
Though permeability seems easy to realize, there exist several variables that may affect it, for example, the dynamic viscosity of the fluid, applied pressure difference, and rock/reservoir properties, such as grain size, sorting, and the pore’s throats [10,11]. Permeability can be measured in many ways [10,11]. In the beginning, it was primarily measured involving numerous parameters, such as the gamma-ray, neutron porosity, bulk density, resistance, sonic waves, spontaneous potential, well size, and/or reservoir depth. However, a standard method for determining permeability is performed using conventional core analysis (CCA) and/or the porosity permeability-relationship (PPR) while determining a non-linear relationship between porosity and permeability [11]. Though traditional well testing, core analysis, and well-log evaluation can predict the permeability of carbonate reservoirs, these conventional methods are not only costly but also time-consuming. This is because the relevant persons make multiple visits to the laboratory to test target samples and predict permeability [12]. In addition, estimating permeability in heterogeneous carbonate reservoirs are also a great challenge, which must be handled carefully to guarantee precise prediction [10,11]. As stated earlier, the permeability of a material is its capacity to allow fluids to flow through it. It is measured in the Darcy/Square-meter (Darcy/m2), which is defined as the volume of fluid passing through a surface in the unit time under the surface pressure gradient at the point where flow passes through it [1].
ML has inevitably been used in permeability prediction and found quite promising. For instance, a study conducted in [13] employed white-box ML approach to model permeability from heterogeneous carbonate reservoirs in Iran. The algorithms are k-nearest neighbors (kNN), genetic programming (GP), and modified group modeling data handling (GMDH). The proposed study outperformed zone-specific permeability, index-based empirical, or data-driven models already investigated in the literature with R2 values of 0.99 and 0.95 against GMDH and GP, respectively [13]. The study was organized motivated by a study by the same authors in [14], where they employed a supervised machine learning algorithm known as Extreme Gradient Boosting (XGB) on heterogeneous reservoir data to predict permeability. The output of the algorithm is a modified formation zone index (FZIM*), based on which the permeability was estimated as R2 values of 0.97. The study further investigated the k-mean clustering algorithm to classify/categorize petrophysical rock typing (PRT) to study their properties.
Machine learning is a subfield of computer science and artificial intelligence that focuses on the development of algorithms that enable computers to learn from and make decisions or predictions based on data [15]. The main objective is to model the probable relationship between a set of observable quantities (inputs) and another set of variables related to them (outputs) [16]. Usually, all ML algorithms require large amounts of data for training and learning. This implies that collecting many of the representative training examples and saving them in a format suitable for computational purposes is an essential step [16]. In general, target data are not ready to use because they may contain irrelevant attributes, missing attributes, redundant attributes, attribute-value noise, and class-label noise. The observable quantities that are usually fed to ML algorithms are called “features”. During training, a target algorithm struggles to learn to associate these features with the desired output variables, thereby fitting the model’s parameters. This implies that features must be relevant to predict outcomes with precision [16]. This implies that pre-processing target data is an indispensable task. In this regard, several preprocessing techniques have been developed in the literature to handle various types of data. These include images, audio, text, video, and their combination. Accordingly, various techniques have been utilized to eliminate noisy and unwanted data [16]. For instance, handling missing values, normalization for numeric data and scaling, filtering, and denoising are commonly used in images [16].
The current study aims to develop an ensemble machine learning model for permeability prediction based on a diverse real-life dataset collected from a renowned, Middle Eastern company. Contributions of the proposed work are, firstly, conducting a literature review in permeability detection in carbonate reservoirs using machine learning techniques and finding a potential research gap. Second, based on the literature review, it was evident that machine learning has been frequently utilized; however, ensemble learning methods have yet to be investigated for the said problem, which is the aim of the study. Third, various preprocessing techniques have been employed to the real-life dataset prior to fetching it to the model and finally evaluating the model based on the well-known metrics used in the literature and contrasting the findings.
The rest of this paper is organized as follows. Section 2 is centered around the related work. It briefly describes the ML model’s enhancement techniques, e.g., feature selection and ensemble techniques. Section 3 elaborates the ML algorithms used in this study. Section 4 describes the target oil well dataset. In addition, it details the experimental setup and subsequent experimentations. Section 5 discusses the experimental setup and Section 6 provides results and discussion. Lastly, Section 7 concludes this study and provides future recommendations.

2. Related Work

This section reviews different ML techniques used to predict the permeability of carbonate reservoirs. It is worth mentioning that the correlation coefficient has been used as a potential figure of merit to evaluate the studies in the literature pertaining to permeability prediction.

2.1. Artificial Neural Network (ANN)

Akande et al. [12] used ANN while generalizing the performance and predictive capability of ANN by implementing an innovative correlation-based feature extraction technique. They used their data, which was gathered from five distinct wells located in the Middle Eastern region and obtained an improvement in the coefficient of correlation using the ANN correlation-based technique with 93.76%. Abusurra [17] used ANN while developing a new method to predict the vertical and horizontal stress for Marcellus shale well drilled in the County of Monongalia, West Virginia. The data used is from the drilling surface calibration measurements combined with the recorded well logging data over time. Such data have been used to predict an average correlation coefficient of 87.5%.
Al-Khalifah et al. [18] compared the effectiveness of using ANN and GA to predict the permeability of tight carbonate rocks. This work also compared different ML approaches with seven traditional equations to predict permeability. It was experimentally observed that the genetic algorithm technique was more useful while gaining more insight into which parameters control predicted permeability. The dataset consisted of 130 samples derived from the Portland Formation. Ahrimankosh et al. [19] also used an ANN-based technique to predict permeability using log-data in the Hydraulic Flow Units (HFUs). HFU is a permeability estimation method that depends on the flow-zone indicator (FZI). The data samples were collected from different areas of the Iranian heterogeneous carbonate reservoir. ANN was developed for FZI prediction, and variables with the highest correlation with the target were selected for input variables. The resultant model exhibited 98.72% accuracy and an average absolute error of 9.8%. Moreover, the authors developed ANN-based models for permeability prediction without using FZI. Though this model successfully predicted permeability with 98.17% accuracy and an average absolute error less than 10.9%, the use of the FZI data point and ANN was relatively better.
Ursula and Parra [20] involved ANN while estimating the reservoir’s properties for two applications having two different datasets gathered from south-eastern Florida and northeast Texas, US. While the first application used the multi-attributes from surface seismic data with well-log permeability and porosity, the second one only used the well-log data. The results obtained were a correlation of 90.6% for the first application and 76.5% for the second one. Mohebbi et al. [21] endeavored to improve the performance of the current methods in one of Iran’s heterogeneous oil fields to predict permeability based on drilling log-data, thereby zoning the reservoir based on geological characteristics and subsequent data classification. Th results obtained from logging wells with ANNs were compared with the permeability measured in core analysis experiments. The corresponding compatibility of the results confirmed the validation of the proposed method. The upper part of the different zones was successfully extended to the entire reservoir using the kriging method. The overall success of trained networks demonstrated the effectiveness of the analysis of variance technique for reservoir zoning. Successful results of trained networks for different regions are good reasons for the compatibility of rivers with geological types and lithological properties of the deposits. For Zone 21, the network performed better, with R2 values of 0.94, 0.89, and 0.85 for the training, testing, and cross-validation data, respectively. The scheme was also promising in terms of other figures of merit.

2.2. Support Vector Machines (SVM)

Akande et al. [12] applied an improved SVM model while predicting the permeability of carbonate reservoirs. The dataset used was obtained from some of the Middle East oil and gas wells. The result of this improved SVM model is promising, as it achieved 97% accuracy on this dataset. Gholami et al. [22] also applied the SVM model while predicting the permeability of hydrocarbon reservoirs using a dataset of three gas wells located in the Southern Pars field. It was experimentally observed that the SVM model was suitable for permeability prediction, which was relatively better than the general regression neural network. This model achieved 97% accuracy on this dataset. A study conducted by Al-Anazi and Gates [23] showed that SVM was the best version of the Electrical Text platform followed by PNN. In addition, SVM exhibited better performance compared with other contemporary methods. The dataset used in this study was the core data. Permeability predictions based on core- or kernel-based clustering were slightly better than those for log-based clustering.

2.3. Other Contemporary ML Models

Gu et al. [24] used a hybrid of the SVR and particle swarm optimization (PSO) with deep learning (DL) to enhance the SVR’s computational ability. Method validation data were recorded from three wells located at the LULA oil field. From the validation data, two experiments were designed. Experimental results showed that the proposed method can predict better results than the SVRs and PSO-SVRs if used individually. This implies that this hybrid model is more effective for predicting permeability when processing real-world data. Compared to traditional regression methods, SVR is more efficient in solving a nonlinear fit problem due to the advantage of the main function. PSO can dramatically improve SVR computing capabilities, as PSO works to supply an optimal initial parameter setting for SVR. Mehdi et al. [5] used the Gaussian process regression model, which is a state-of-the-art ML algorithm, to estimate the permeability of carbonate reservoirs. It showed the supremacy of the proposed GPR strategies over some contemporary schemes. The validity of the used database and reliability of the GPR version changed into additional illustration through making use of outlier analysis. It changed and found that the irreducible water saturation has the very best and bad effect on permeability estimation. Finally, it is shown that GPR provides the highest precision with a mean relative error of (MMRE) and an adjusted R-squared of 38% and 0.98, respectively.
Salaheldin et al. [11] used three different models, ANN, SVM, and ANFIS, while predicting the permeability of heterogeneous carbonate reservoirs. “Adaptive neuro-fuzzy inference system (ANFIS) is the combination of the neural network and fuzzy logic”. ANFIS can take advantage of the two AI techniques mentioned above on a single platform. The data used in this study had 1500 actual well’s log-data measurements. The data were used to construct and test mathematical equations for permeability prediction. In addition, they used a new term called the mobility index, which can be effective in predicting permeability. The term mobility index is derived from the mobile oil saturation that has occurred due to the penetration of drilling fluid seeps. The accuracy achieved in this study was 95%, with an RMSE less than 28%.
Based on the literature review, it is evident that there is still room for improvement in the permeability prediction based on real-time and real field reservoir data, although various machine learning approaches have been developed and investigated in this regard. Moreover, several ML algorithms have been investigated and are promising in terms of various figures of merits. The current study intends to bridge this gap by means of investigating ensemble machine learning algorithms where the decision is not based on a single machine but a group (ensemble) of machines. That consensus-based decision has been proven promising in various other fields, such as medical and healthcare [25]. The major motivation behind the study is to provide a sustainable permeability prediction model, which is much needed in the Kingdom of Saudi Arabia, an oil-rich country with various industries relying on such studies [26].

3. Materials and Methods

This section proposes two ML schemes to predict the permeability of carbonate reservoirs with high precision. The following text elaborates on each of these schemes.

3.1. Random Forest

RF is an ensemble learning method, which is often used for classification, regression, and other tasks that work by constructing multiple decision trees during training. For classification, the output of RF is a class selected by most of the trees. For regression, the mean or mean prediction of individual trees is returned [27]. RF or random decision forest is an ensemble ML technique that is used for classification and regression problems. RF works by constructing a multitude of decision trees.
This study uses regression RF, which returns the output of the mean or average prediction of individual trees to improve predictability and control overfitting, if any [27]. In brief, RF is a collection of the tree-predictors representing the perceived input (vector) covariate of length with related random vectors and independently and uniformly distributed random vectors. As mentioned earlier, this study used a regression setting with a numerical outcome. The observed (training) data were drawn independently of the joint distribution and were composed of the tuples. For regression, RF prediction is an unweighted average over collection [28].

3.2. Gradient Boost

The gradient boosting regressor (GBR) is one of the most popular ML techniques. It is a robust algorithm for finding any nonlinear relationship. Notably, it is capable of handling outliers and missing values. Gradient boosting (GB) is an ensemble technique that creates multiple weak models and combines them to achieve better performance. GB is an ML technique that is used for many tasks but especially for regression and classification. It gives a predictive model in the form of an ensemble of weak predictive models. This is usually a decision tree. If a decision tree is a “weak learner”, this results in an algorithm that is called gradient boosted trees (GBT), which usually performs better than the RF algorithm. Furthermore, GBT models are built with stages, similar to many other boosting methods. However, it generalizes other methods by allowing the optimization of the differentiable loss functions [29,30].
GB is usually compared with the AdaBoost algorithm. This is because both use the decision trees while creating trees in an order where each tree depends on the previous tree’s errors to produce better results. However, unlike AdaBoost, GB starts by making a single leaf instead of a tree or a stump. This leaf represents an initial guess for the weights of all samples, which is an average value when used to predict a continuous value. After that, GB builds a tree that depends on errors of the previous tree. Another difference between AdaBoost and GB is that AdaBoost builds level-one trees with a single root node and two leaves. However, unlike AdaBoost, this tree is usually larger than a stump; the gradient boost still restricts the size of a tree, with most people setting the maximum number of leaves between 8 and 32. Thus, similar to AdaBoost, GB builds fixed-sized trees based on previous tree’s errors, but unlike AdaBoost, each tree can be larger than a stump [29,30].
Like other boosting methods, GB combines “weak learners” into a single strong learner in an iterative fashion. A gradient boost can use any cost/loss function such as the mean squared error, to measure its performance. Consider a gradient boosting algorithm with M stages. At each stage, m (1 ≤ m ≤ M), of the gradient boosting, suppose some imperfect model (Fm) to improve Fm, the proposed algorithm should add some new estimator, hm(x) with v m as the learning rate [31]. This can be written as Equation (1):
F m + 1 x = F m x + v m h m x = y
h m x = ( y F m x ) / v m

3.3. Extreme Gradient Boost (XGB)

XGB is a specific implementation and a more regularized form of the GBR method. It uses more accurate approximations to find the best tree model. It utilizes several intelligent techniques that make it remarkably effective, especially with structured data. The most significant are calculating second-order gradients, i.e., second partial derivatives of the cost function, which presents more knowledge about the direction of gradients and to obtain minima. Secondly, it uses advanced regularization, which improves model generalization. Additionally, XGB possesses fast convergence and is compatible with parallel and distributed structures [32].

3.4. AdaBoost

AdaBoost combines a lot of weak learners to predict the target value. It makes many level one trees that are only composed of a root node and two leaf nodes. These trees are allowed to vote, but their votes are weighed differently depending on their performance [32].

3.5. Linear Regression

A linear regression is a relationship between two attributes, one for the input variable and one for the output variable. Calculated by combining the linear equations for both parameters, it has three steps: use least-square to fit a line to the data, calculate R2, and calculate p-value for R2 [32].

3.6. Support Vector Machine (SVM)

SVM has many unique characteristics, including a sound mathematical foundation, non-convergence to local minima, and accurate generalization and predictive ability when trained on small datasets. In classification problems, SVM engages in the use of the optimal separation principle. This principle selects (among a set of infinite classifiers) a hyperplane with the highest margin between linearly separable classes. However, SVM seeks a hyperplane with the highest margin and reduces the quantity proportionally to several misclassification errors for non-separable classes. It is considered a supervised machine learning algorithm [33].

4. Proposed Approach

4.1. Dataset

The oil well (OWL) dataset used in this study is a real industrial dataset, which was obtained during petroleum exploration expeditions from five different oil wells located in the Middle East. The total number of instances and features for each OWL is presented in Table 1, which includes many geophysical descriptions of the oil wells. A great way of gaining insight into each variable and how they change between measurements is to perform a statistical analysis of the dataset before training target models. This statistical analysis consists of many measurements, such as the standard deviation (std), which measures the variation of data points for each predictor. The rest of the measures for this statistical analysis included the mean, minimum, and maximum. Table 2 provides the dataset description for each used feature from all four wells. Similarly, Table 3 shows a complete statistical analysis for each OWL, including the minimum value, maximum value, mean, and standard deviation. There were a total of 1652 samples in the dataset from all wells. It is worth mentioning that OWL-E contains a relatively smaller number of instances compared to OWL A–D, while OWL-A and OWL-D have the same number of instances at 388. OWL-B also has a considerable number of instances at 357, while OWL-C contains the highest number of samples at 478.

4.2. Preprocessing

This section details the pre-processing steps taken while cleaning the target well data before feature extraction and subsequent classification. Feature selection is an essential task. If it is performed effectively, then it can improve the model’s accuracy with less training time and resource consumption. The feature selection task is applied to the target dataset, which is based on the correlation between each feature and the target feature (permeability). The selected attributes were correlated with (0.3 to 0.69) correlation “moderate correlation” and (0.7 to 0.99) correlation “strong correlation”. Outlier removal is an essential step in the pre-processing stage. This study implemented the standard deviation method while detecting and removing outliers. This method depends on how much the individual data points are spread out from the mean. Based on this, a few outliers were removed from each oil well dataset instance to improve the model’s performance. As a result, the root mean squared error (RMSE) was significantly reduced, and the subsequent model’s misleading was also prevented.

5. Experimental Setup

In this study, the proposed algorithm was implemented, validated, and tested in Python 3.10.4 (Jupyter). Since the OWL dataset possesses large and small values in the same records, the OWL datasets were normalized to ensure all data fall within the same range. However, this act does not affect the model’s judgment. The target OWL datasets are divided into nonoverlapping training and testing sets in a ratio of 8:2, respectively. Moreover, the authors applied cross-validation using the k-fold technique with five folds for each OWL.
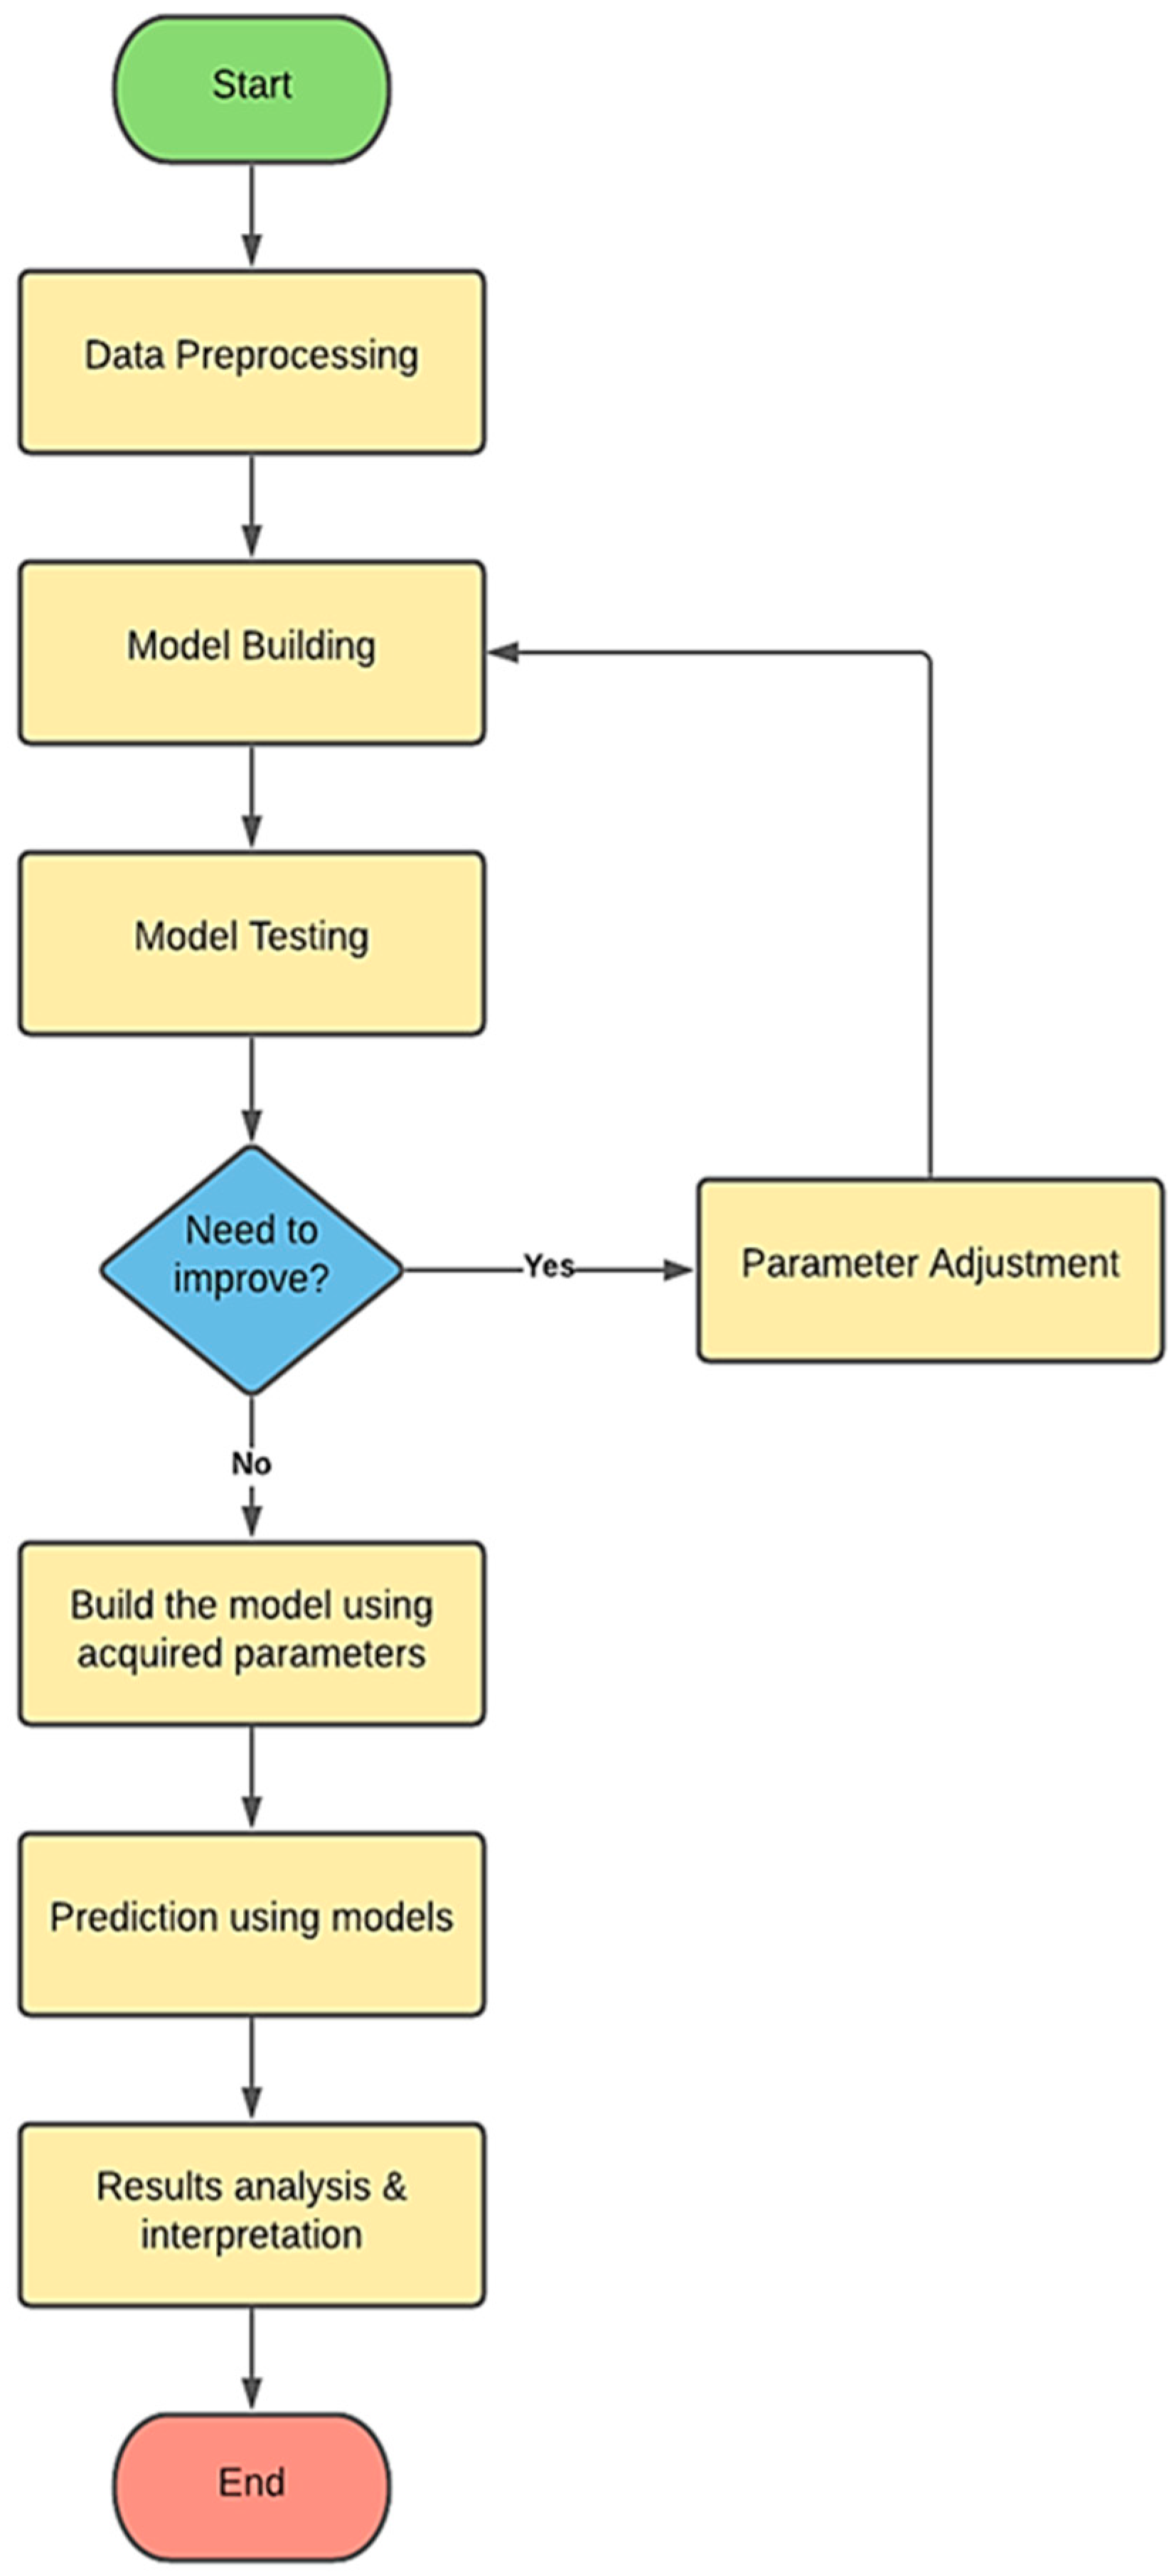
Furthermore, training data were used to create the models and test the models’ predictability. If a model still needed refinement after testing, the model’s hyperparameters were adjusted until optimum results were achieved. In this way, feature selection was conducted to improve performance [34]. Finally, once satisfactory test results were obtained, the model was created using the obtained optimized hyperparameters. For instance, the parameters for the RF model (n_estimators = 100, random_state = 10); for AdaBoost (n_estemators = 30, Learning rate = 1, loss = ‘linear’, Random_state = 142) and for GB ((n_estemators = 100, Learning rate = 1, Random_state = 142) were used. After the model was validated, new data were used to make predictions. Predictions’ results were then analyzed and compared to identify the most effective model for RMSE value and other metrics. Figure 1 shows the main phases of developing the machine learning prediction models.

5.1. Evaluation Criteria

This section elaborates the metrics utilized to measure the performance of the proposed scheme [35,36,37,38].

5.1.1. Root Mean-Squared Error (RMSE)

The RMSE is a primary statistical measurement that is often used to assess a regression ML model while deciding its performance. It is calculated by taking the mean of the square of difference of the value predicted by the model and the actual value of the target sample. It is given in Equation (2).
R M S E =   x 1 y 1 2 + x 2 y 2 2 + + x n y n 2 n
where n is the size of the dataset (number of instances).

5.1.2. Mean Absolute Error (MAE)

The MAE is also a statistical measurement used to assess a model’s performance. It shows the difference between every predicted value and its corresponding actual target value. In addition, a relative error is calculated as the ratio of mean of absolute values of error and mean value of predicted target value as given in Equation (3):
M A E =   i = 1 n y i x i n = i = 1 n e i n

5.1.3. Coefficient of Determination (R2)

The R 2 is a statistical measure in which an independent variable or variable(s) explains the variance of a dependent variable in a regression model. R 2 explains how much variance in one variable explains variance in another, while correlation explains the strength of the relationship between one independent variable and another independent one, e.g., velocity (dependent) and time (independent). The formula for calculating the correlation coefficient is given in Equation (4) [39,40]:
r = n ( x y ) ( x ) ( y ) n x 2 ( x ) 2 n y 2 ( y ) 2
The coefficient of determination is the square of the correlation coefficient.

6. Results and Discussion

All experiments were performed using the following:
  • Training models using the whole dataset obtained from exploration fields.
  • Training models after applying the pre-processing steps on the dataset.
  • Results of testing are presented rather than training, which is more realistic because the test data is distinct.
As stated earlier, all data samples were first normalized, and then outliers were removed using the standard deviation-based method. Relevant features were selected based on their correlation with the target attribute, i.e., permeability. The measure of performance was done by monitoring three major measurements: R
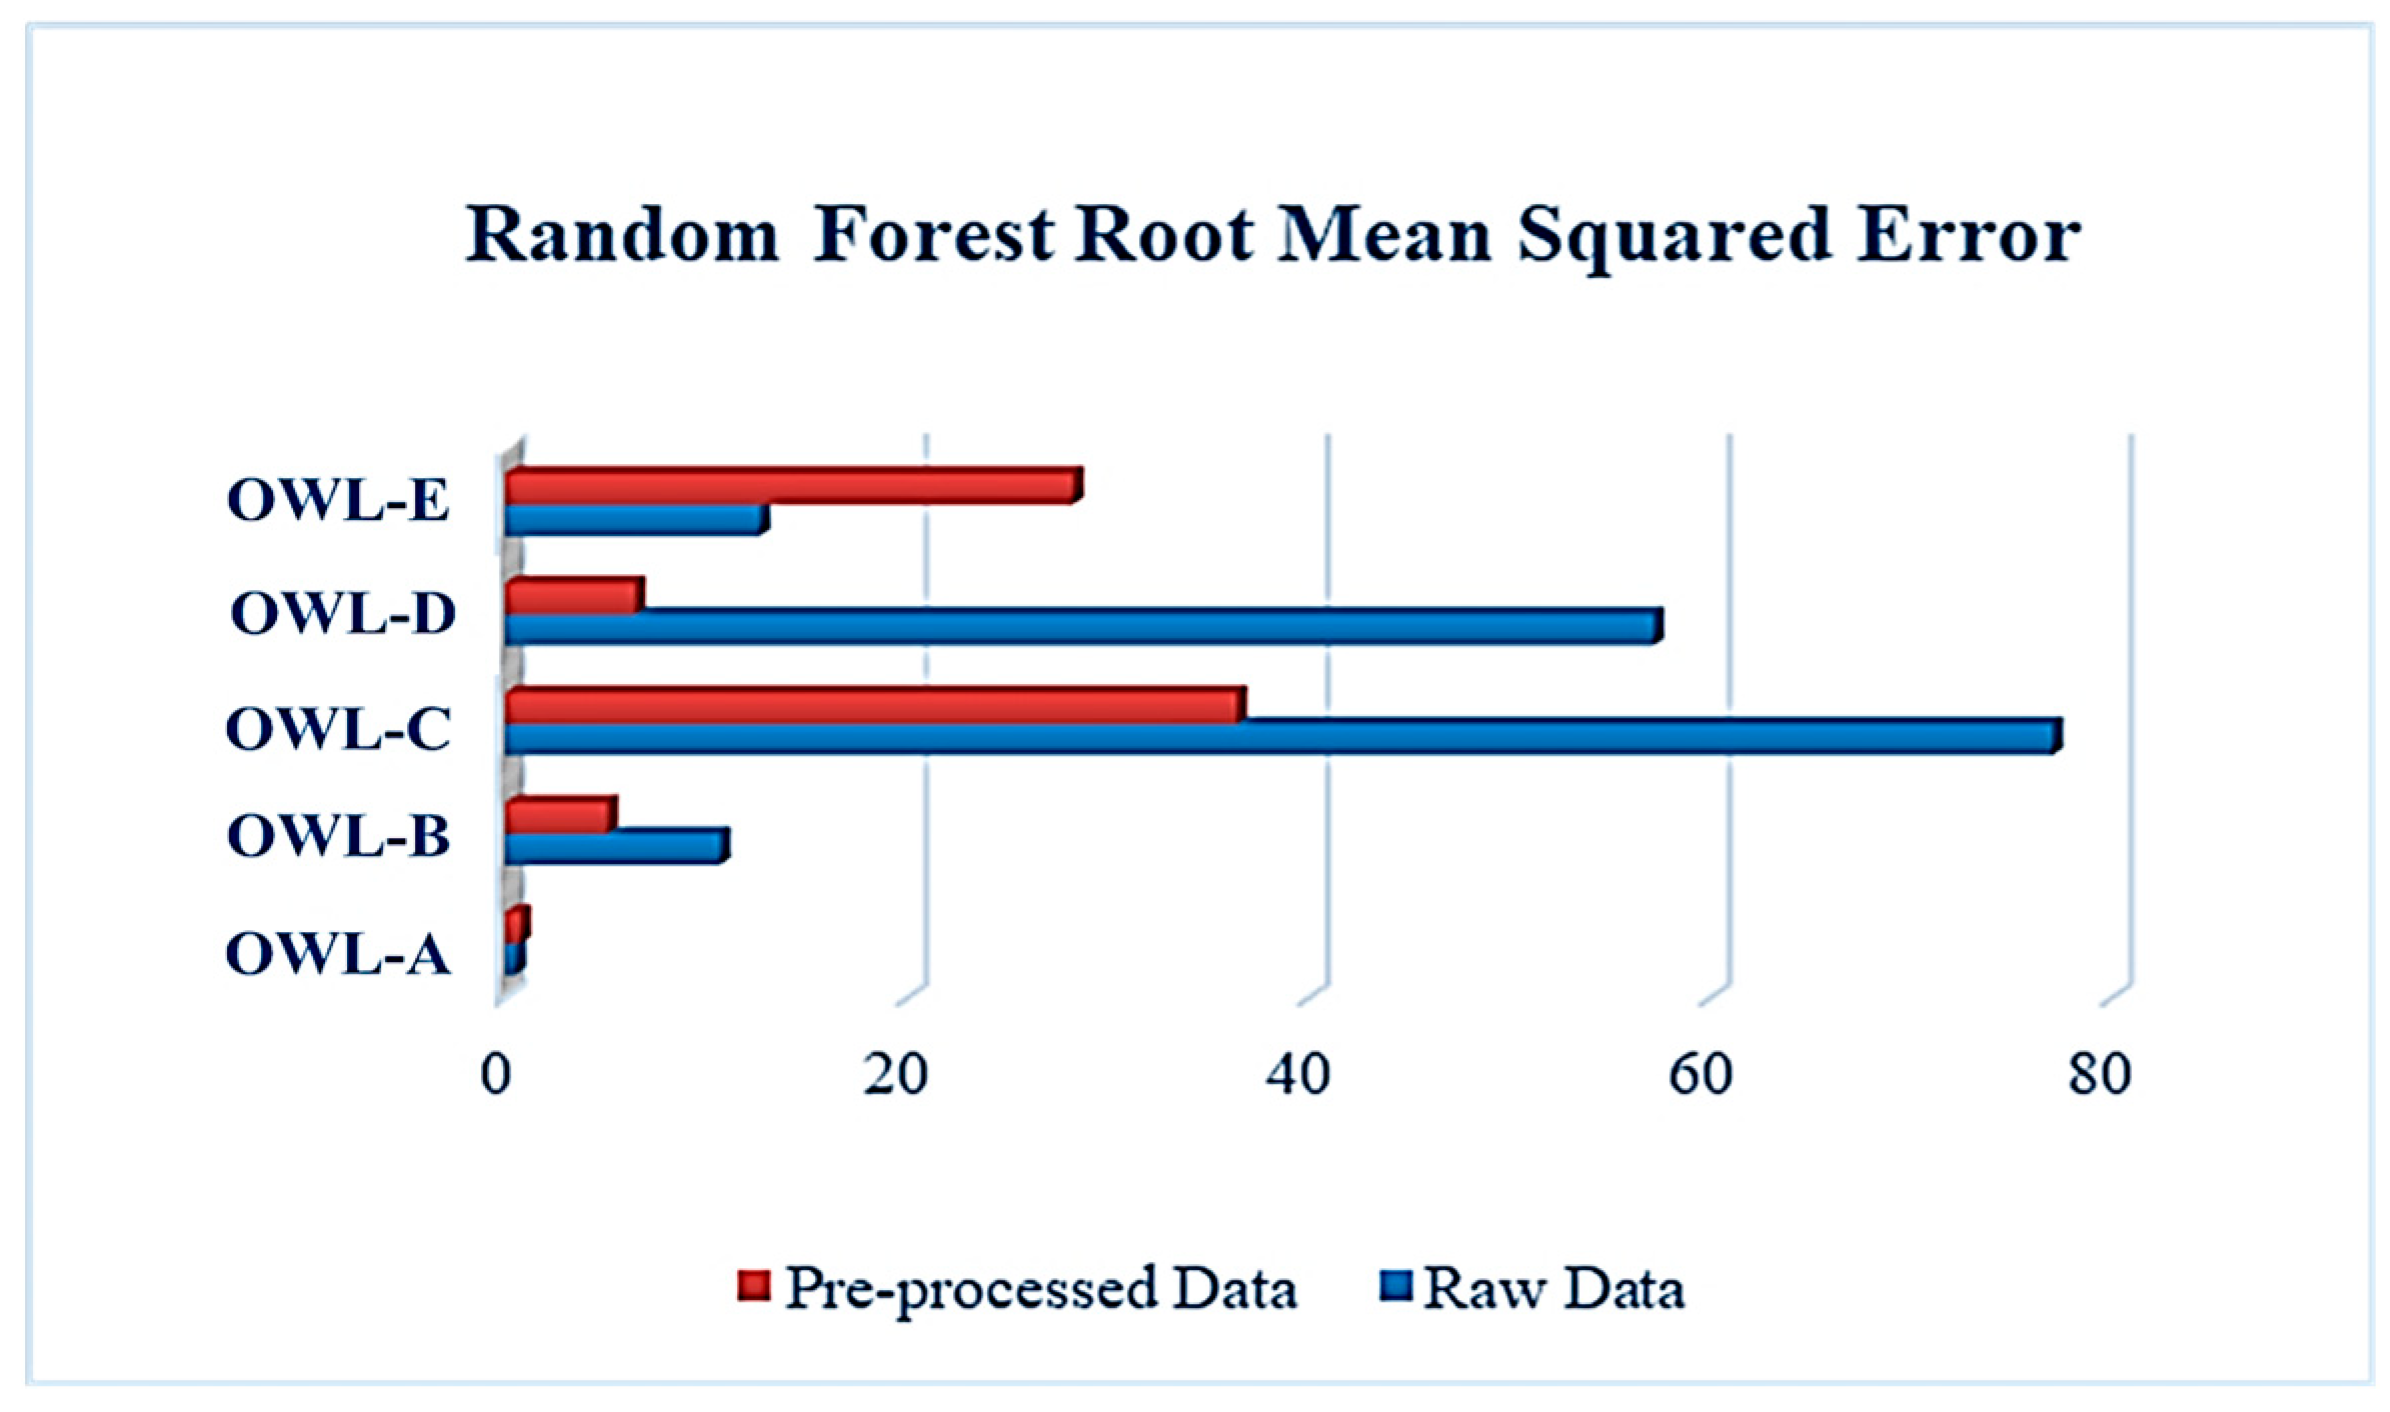
2, RMSE, and MAE. These metrics represent the coefficient of correlation, root mean squared error, and mean absolute error, respectively. As for the correlation coefficient, the higher its value, the better the model’s performance. This is the opposite for the RMSE and MAE, measuring the error of the model’s performance. Thus, the lower the value of RMSE and MAE, the better the model’s performance would be. From Figure 2, it can be inferred that the RF model performed marginally better when used with the pre-processed data for most OWL, with the RMSE value decreasing from 57.195 to 6.468 in OWL-D alone in addition to OWL-C. The value dropped from 77.054 to 36.422 and OWL-B went down from 10.697 to 5.087. These facts show that this improvement in performance is proof that the used pre-processing techniques were more effective and had a great impact on the model’s learning capability.
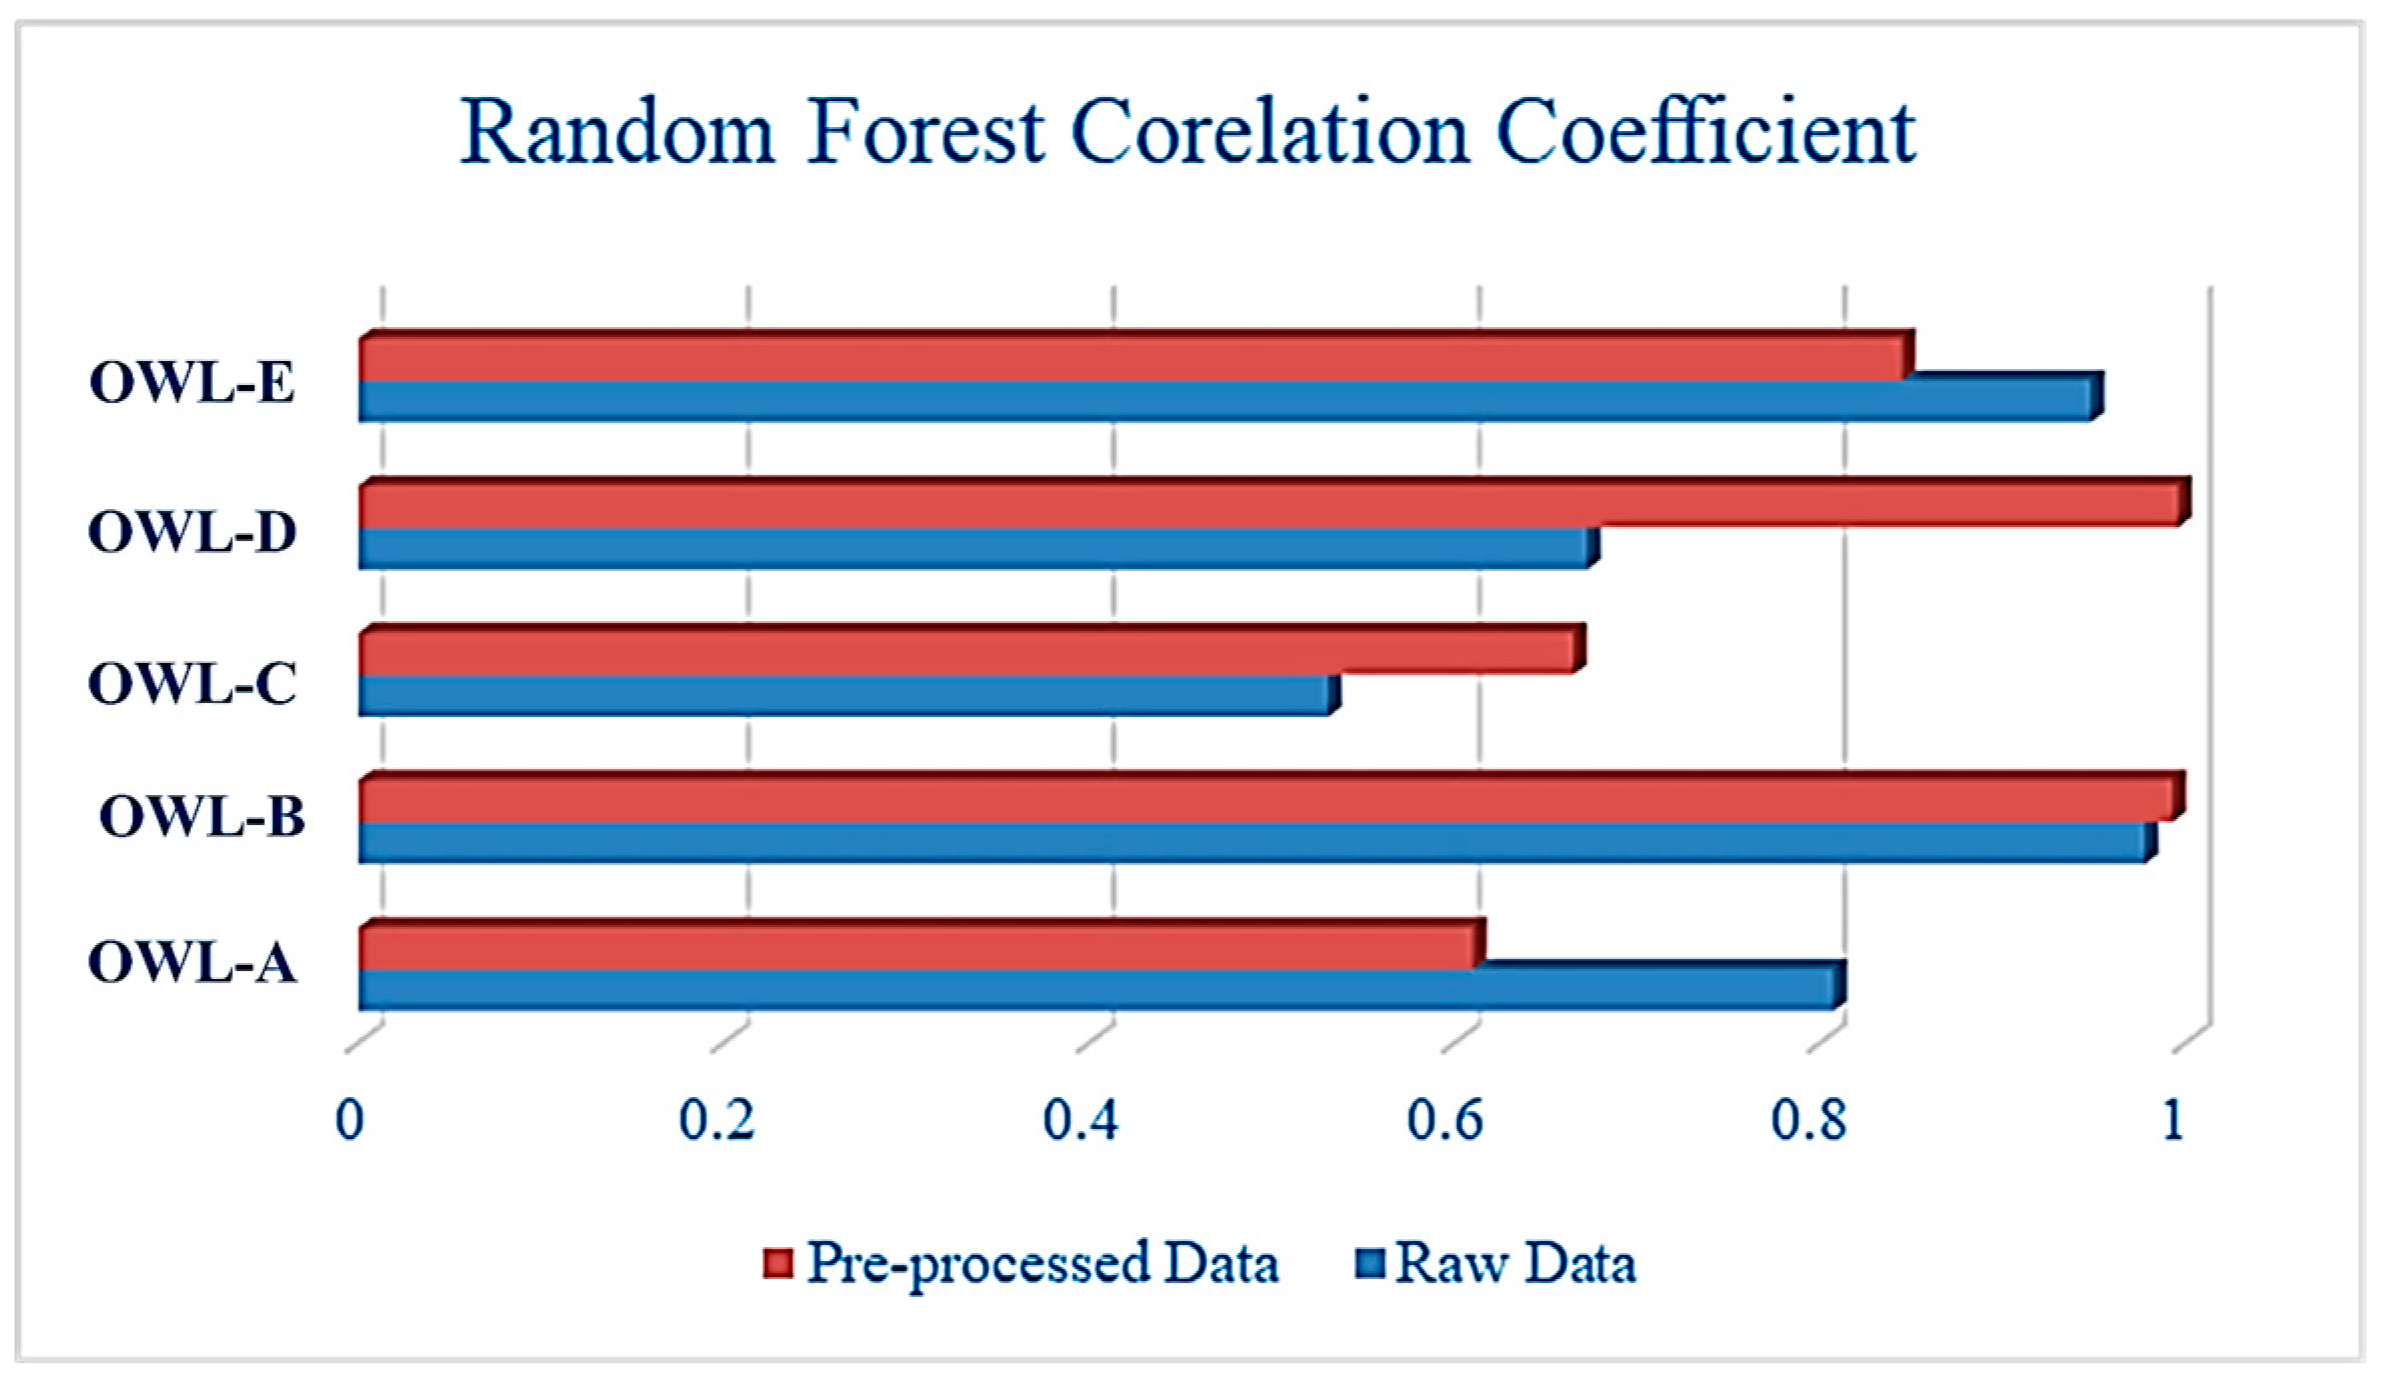
 Figure 2 and Figure 3 provide a comprehensive look into the performance of the raw and pre-processed data for the same model by means of RMSE and correlation coefficient.
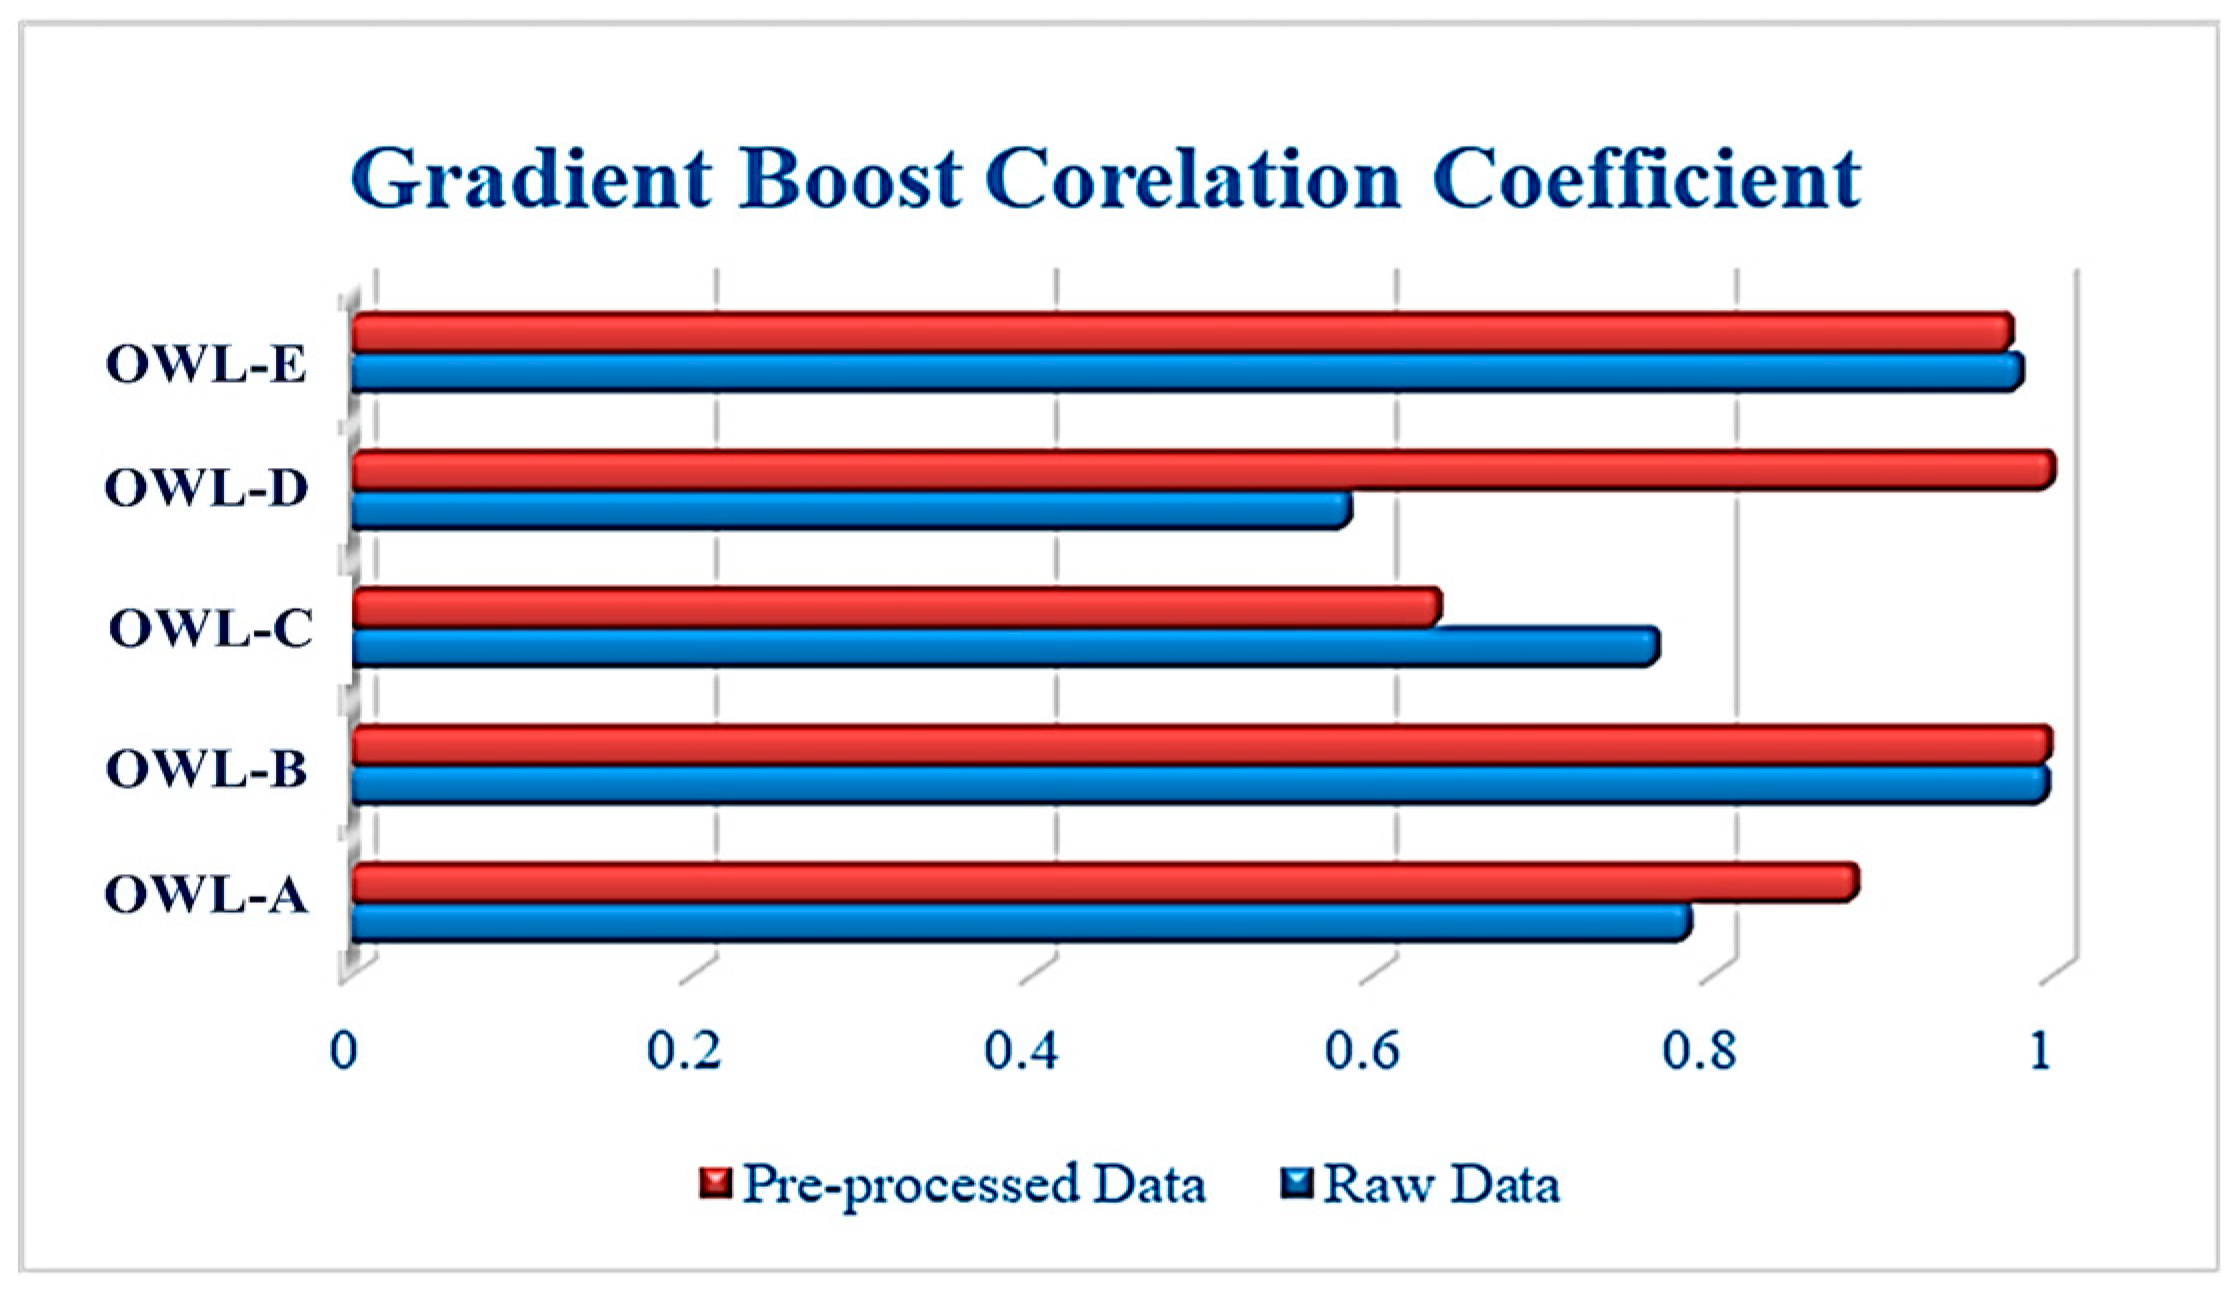
According to Figure 4, the GB algorithm achieves the highest value of correlation coefficient at 99.8% for OWL-B for both raw and preprocessed data. This means that for this OWL, GB was robust against the raw data vulnerability. Similarly, it exhibited the same results for OWL-D but for preprocessed data only, while for its raw data counterpart its performance was below 60%. The main reason behind such differences is the nature of the data obtained from each well. For OWL-E again, the performance was remarkably good, as the value of correlation coefficients was 98.2% and 98% for raw and preprocessed data, respectively.
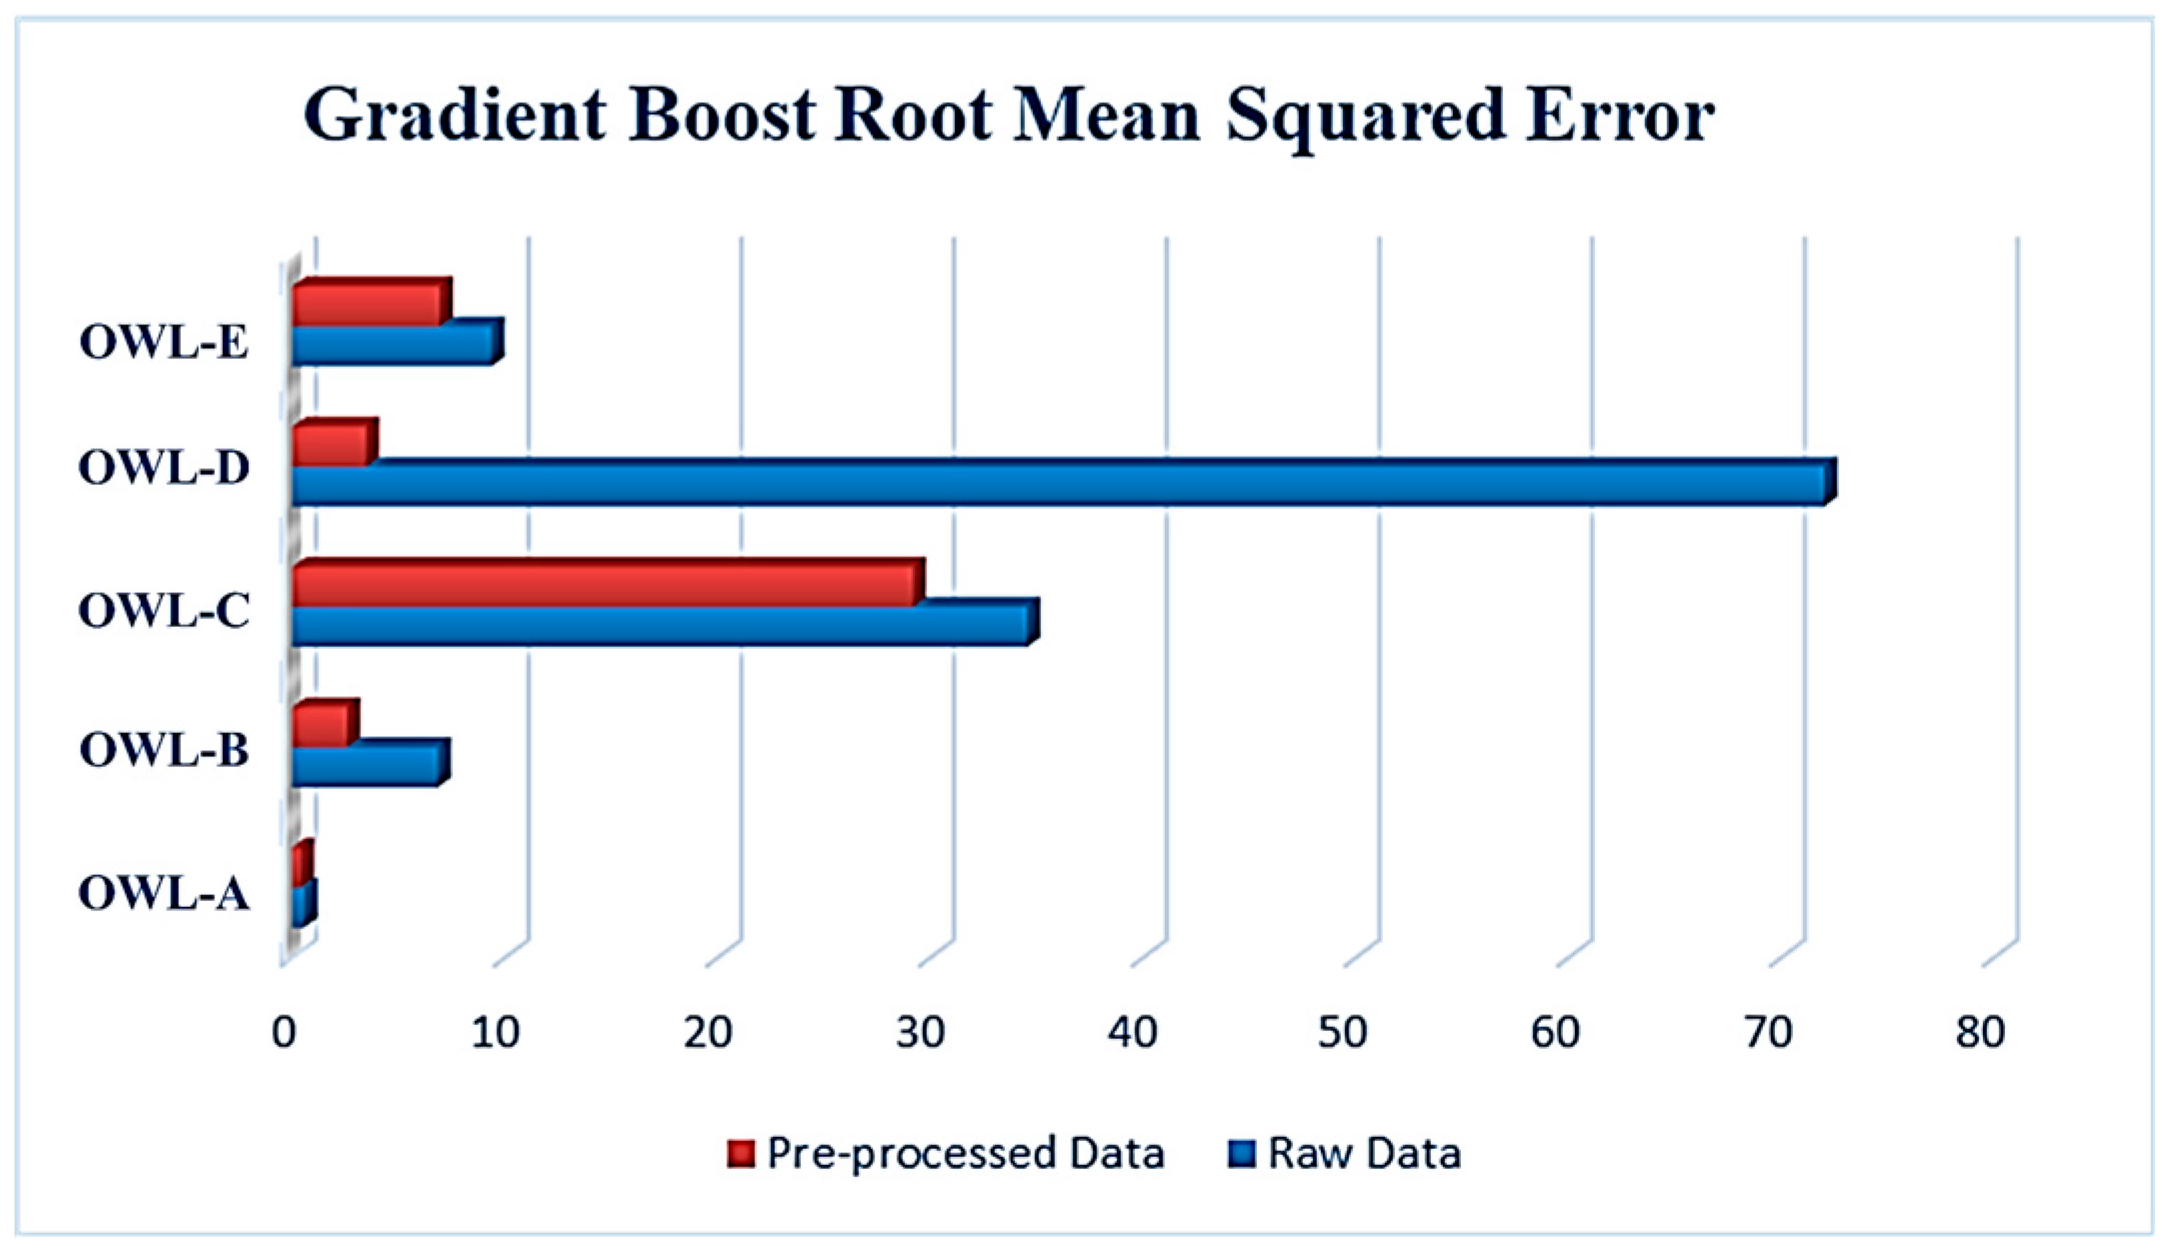
Figure 5 reports the RMSE analysis for the GB algorithm with and without preprocessed data. The results were quite interesting, as OWL-A with raw data significantly outperformed all other OWL with a negligible error, followed by OWL-B and OWL-E. Nonetheless, OWL-D with raw data exhibited an RMSE of 72. The effects of pre-processing techniques can be seen on all OWLs when using the gradient boost algorithm. The performance indicators clearly show this effect in Figure 5. The value of the RMSE of OWL-D sharply decreased from 72.007 to 3.465. Furthermore, the RMSE values of OWL-C and OWL-E shrank from 34.55 and 9.367 to 29.177 and 6.931, respectively. For OWL-A, the RMSE decreased slightly from 0.57 to 0.398. This slight decrease in OWL-A’s value was expected because most of the models performed great with OWL-A in the first place.
Table 4 shows the RMSE values for each algorithm. It was concluded that the best performing algorithm was GB with an average RMSE value of 8.506, followed by RF with an average RMSE value of 15.399. In addition to the previously discussed algorithms (GB, RF), multiple algorithms were trained and tested on the same OWL dataset, preprocessing, and using the same experimental setup. These algorithms included AdaBoost, XGB, SVR, and LR. However, the results gained from these algorithms were not sufficient even after tuning their hyperparameters. These algorithms were excluded due to unsatisfying performance, supported by the fact that their performance measures showed fairly high RMSE and MAE values, as well as low values of correlation coefficient. Referring to Table 4, it can be deduced that the average values of RMSE were between 16.965 and 97.6, which was a considerably high value compared to the performance of both GB and RF models. Though pre-processing techniques used in this project enhanced the performance of some ML models, a few models did not produce satisfying results, which may be caused by the nature of the data, or the nature of the algorithms being investigated.

6.1. Comparison with State-of-the-Art

The authors in [10,12] used the same OWL dataset to train, validate, and test their proposed models to predict permeability. They applied the SVM algorithm in [10] and ANN in [12]. When applied to the same OWL dataset, the proposed gradient boosting regressor scheme proved its superiority over the two algorithms mentioned above. It obtained a lower RMSE for all OWLs, except OWL-C. Table 5 and Table 6 offer a comparative analysis of these algorithms. Overall, the proposed scheme outperformed state-of-the-art techniques in the literature for the same dataset. One potential reason that GBR outperforms ANN is due to its nature that it is more suitable for the numeric datatype.

6.2. Limitations of the Study

As far as limitations of the study are concerned, firstly, there were five wells’ data with an unequal number of instances, and data were unbalanced. Some data balancing techniques, such as the synthetic minority oversampling technique (SMOTE), can be applied to balance the dataset prior to modeling. That can further fine-tune the results. Moreover, according to Table 1, there is a slight difference in the number of attributes in each well.

7. Conclusions

To conclude, traditional methodologies used to determine the permeability of carbonate reservoirs are not only costly but also time consuming. To address this issue, this study proposed effective machine learning (ML) techniques supplemented with efficient pre-processing steps to properly clean the oil well data, e.g., removing outliers. The authors trained, validated, and tested the proposed schemes on real oil well data, which was acquired during an oil and gas exploration campaign made in the Middle East a few decades ago. Although the authors involved numerous ML schemes in this study, the gradient boost (GB) and random forest (RF) based ensemble ML algorithms exhibited relatively better performance while predicting the permeability of the carbonate reservoirs. Due to their excellent and reliable performance, these two algorithms are a safe replacement to traditional methodologies used for measuring the permeability of carbonate reservoirs. The study can be potentially helpful in permeability prediction for the oil and gas industry as a sustainable solution to carbonate reservoirs. In the future, data balancing techniques such as SMOTE can be applied prior to model building. Moreover, deep learning, especially transfer learning, can be investigated to further fine-tune the results in terms of various figures of merits.

Author Contributions

Conceptualization, D.A.M.; Data curation, F.S.A. and R.A.A.; Formal analysis, B.K.A., F.J. and A.R.; Funding acquisition, A.R.; Investigation, S.O.O., B.K.A. and S.K.A.; Methodology, S.O.O., A.A.A., R.A.A. and S.K.A.; Project administration, D.A.M. and F.J.; Resources, B.K.A., F.S.A., and S.K.A.; Software, A.A.A., A.S.A., B.K.A., F.S.A. and R.A.A.; Supervision, D.A.M. and K.A.A.-M.; Validation, S.O.O., A.S.A. and K.A.A.-M.; Visualization, F.S.A.; Writing—original draft, A.A.A., A.S.A. and S.K.A.; Writing—review & editing, F.J., A.R. and K.A.A.-M. All authors have read and agreed to the published version of the manuscript.

Funding

This research received no external funding.

Institutional Review Board Statement

Not applicable.

Informed Consent Statement

Not applicable.

Data Availability Statement

Data can be requested from the corresponding author.

Conflicts of Interest

The authors declare no conflict of interest.

References

  1. Darcy, H. Les Fontaines Publiques de la Ville de Dijon: Exposition et Application des Principes à Suivre et des Formules à Employer Dans les Questions de Distribution d’eau; Victor Dalmont: Paris, France, 1856. [Google Scholar]
  2. Olatunji, S.; Selamat, A.; Raheem, A. Improved sensitivity based linear learning method for permeability prediction of carbonate reservoir using interval type-2 fuzzy logic system. Appl. Soft Comput. 2014, 14, 144–155. [Google Scholar] [CrossRef]
  3. Xu, P.; Zhou, H.; Liu, X.; Chen, L.; Xiong, C.; Lyu, F.; Zhou, J.; Liu, J. Permeability prediction using logging data in a heterogeneous carbonate reservoir: A new self-adaptive predictor. Geoenergy Sci. Eng. 2023, 224, 211635. [Google Scholar] [CrossRef]
  4. Sheykhinasab, A.; Mohseni, A.A.; Barahooie Bahari, A.; Naruei, E.; Davoodi, S.; Aghaz, A.; Mehrad, M. Prediction of permeability of highly heterogeneous hydrocarbon reservoir from conventional petrophysical logs using optimized data-driven algorithms. J. Pet. Explor. Prod. Technol. 2023, 13, 661–689. [Google Scholar] [CrossRef]
  5. Mahdaviara, M.; Rostami, A.; Keivanimehr, F.; Shahbazi, K. Accurate determination of permeability in carbonate reservoirs using Gaussian Process Regression. J. Pet. Sci. Eng. 2021, 196, 107807. [Google Scholar] [CrossRef]
  6. Ayan, C.; Hafez, H.; Hurst, S.; Kuchuk, F.; O’Callaghan, A.; Peffer, J.; Pop, J.; Zeybek, M. Characterizing Permeability with Formation Testers. Oilfield Rev. 2001, 13, 2–23. [Google Scholar]
  7. Choquette, P.W.; Pray, L.C. Geologic Nomenclature and Classification of Porosity in Sedimentary Carbonates1. AAPG Bull. 1970, 54, 207–250. [Google Scholar]
  8. Carbonate Sedimentology. Available online: https://onlinelibrary.wiley.com/doi/book/10.1002/9781444314175 (accessed on 30 June 2023).
  9. Li, S.; Liu, M.; Hanaor, D.; Gan, Y. Dynamics of Viscous Entrapped Saturated Zones in Partially Wetted Porous Media. Transp. Porous Media 2018, 125, 193–210. [Google Scholar] [CrossRef]
  10. Akande, K.; Owolabi, T.; Olatunji, S. Investigating the effect of correlation-based feature selection on the performance of support vector machines in reservoir characterization. J. Nat. Gas Sci. Eng. 2015, 22, 515–522. [Google Scholar] [CrossRef]
  11. Elkatatny, S.; Mahmoud, M.; Tariq, Z.; Abdulraheem, A. New insights into the prediction of heterogeneous carbonate reservoir permeability from well logs using artificial intelligence network. Neural Comput. Appl. 2018, 30, 2673–2683. [Google Scholar] [CrossRef]
  12. Akande, K.O.; Owolabi, T.O.; Olatunji, S.O. Investigating the effect of correlation-based feature selection on the performance of neural network in reservoir characterization. J. Nat. Gas Sci. Eng. 2015, 27, 98–108. [Google Scholar] [CrossRef]
  13. Zhao, L.; Guo, Y.; Mohammadian, E.; Hadavimoghaddam, F.; Jafari, M.; Kheirollahi, M.; Rozhenko, A.; Liu, B. Modeling Permeability Using Advanced White-Box Machine Learning Technique: Application to a Heterogeneous Carbonate Reservoir. ACS Omega 2023, 8, 22922–22933. [Google Scholar] [CrossRef]
  14. Mohammadian, E.; Kheirollahi, M.; Liu, B.; Ostadhassan, M.; Sabet, M. A case study of petrophysical rock typing and permeability prediction using machine learning in a heterogenous carbonate reservoir in Iran. Sci. Rep. 2022, 12, 4505. [Google Scholar] [CrossRef] [PubMed]
  15. Mitchell, T. Machine Learning; McGraw-Hill Education: New York, NY, USA, 1997; Volume 1. [Google Scholar]
  16. Baştanlar, Y.; Ozuysal, M. Introduction to machine learning. Methods Mol. Biol. 2014, 1107, 105–128. [Google Scholar] [PubMed]
  17. Abusurra, M.S.M. Using Artificial Neural Networks to Predict Formation Stresses for Marcellus Shale with Data from Drilling Operations. Master’s Thesis, West Virginia University, Morgantown, WV, USA, 2017; p. 5023. [Google Scholar] [CrossRef]
  18. Al Khalifah, H.; Glover, P.W.J.; Lorinczi, P. Permeability prediction and diagenesis in tight carbonates using machine learning techniques. Mar. Pet. Geol. 2020, 112, 104096. [Google Scholar] [CrossRef]
  19. Ahrimankosh, M.; Kasiri, N.; Mousavi, S. Improved Permeability Prediction of a Heterogeneous Carbonate Reservoir Using Artificial Neural Networks Based on the Flow Zone Index Approach. Pet. Sci. Technol. 2011, 29, 2494–2506. [Google Scholar] [CrossRef]
  20. Iturraran-Viveros, U.; Parra, J. Artificial Neural Networks applied to estimate permeability, porosity and intrinsic attenuation using seismic attributes and well-log data. J. Appl. Geophys. 2014, 107, 45–54. [Google Scholar] [CrossRef]
  21. Mohebbi, A.; Kamalpour, R.; Keyvanloo, K.; Sarrafi, A. The Prediction of Permeability from Well Logging Data Based on Reservoir Zoning, Using Artificial Neural Networks in One of an Iranian Heterogeneous Oil Reservoir. Pet. Sci. Technol. 2012, 30, 1998–2007. [Google Scholar] [CrossRef]
  22. Gholami, R.; Shahraki, A.R.; Jamali Paghaleh, M. Prediction of Hydrocarbon Reservoirs Permeability Using Support Vector Machine. Math. Probl. Eng. 2012, 2012, 670723. [Google Scholar] [CrossRef]
  23. Al-Anazi, A.F.; Gates, I. Support vector regression for porosity prediction in a heterogeneous reservoir: A comparative study. Comput. Geosci. 2010, 36, 1494–1503. [Google Scholar] [CrossRef]
  24. Gu, Y.; Bao, Z.; Song, X.; Wei, M.; Zang, D.; Niu, B.; Lu, K. Permeability prediction for carbonate reservoir using a data-driven model comprising deep learning network, particle swarm optimization, and support vector regression: A case study of the LULA oilfield. Arab. J. Geosci. 2019, 12, 622. [Google Scholar] [CrossRef]
  25. Alotaibi, S.M.; Rahman, A.; Basheer, M.I.; Khan, M.A. Ensemble machine learning based identification of pediatric epilepsy. Comput. Mater. Contin. 2021, 68, 149–165. [Google Scholar]
  26. Ibrahim, N.M.; Alharbi, A.A.; Alzahrani, T.A.; Abdulkarim, A.M.; Alessa, I.A.; Hameed, A.M.; Albabtain, A.S.; Alqahtani, D.A.; Alsawwaf, M.K.; Almuqhim, A.A. Well Performance Classification and Prediction: Deep Learning and Machine Learning Long Term Regression Experiments on Oil, Gas, and Water Production. Sensors 2022, 22, 5326. [Google Scholar] [CrossRef] [PubMed]
  27. Tin Kam, H. Random decision forests. In Proceedings of the 3rd International Conference on Document Analysis and Recognition, Montreal, QC, Canada, 14–16 August 1995; Volume 271, pp. 278–282. [Google Scholar]
  28. Segal, M. Machine Learning Benchmarks and Random Forest Regression; Technical Report; Center for Bioinformatics & Molecular Biostatistics, University of California: San Francisco, CA, USA, 2003. [Google Scholar]
  29. Hastie, T.; Tibshirani, R.; Friedman, J. The Elements of Statistical Learning: Data Mining, Inference, and Prediction, 2nd ed.; Springer Series in Statistics; Springer: New York, NY, USA, 2009. [Google Scholar]
  30. Friedman, J.H. Greedy function approximation: A gradient boosting machine. Ann. Statist. 2001, 29, 1189–1232. [Google Scholar] [CrossRef]
  31. Wakjira, T.G.; Ibrahim, M.; Ebead, U.; Alam, M.S. Explainable machine learning model and reliability analysis for flexural capacity prediction of RC beams strengthened in flexure with FRCM. Eng. Struct. 2022, 255, 113903. [Google Scholar] [CrossRef]
  32. Erofeev, A.; Orlov, D.; Ryzhov, A.; Koroteev, D. Prediction of Porosity and Permeability Alteration Based on Machine Learning Algorithms. Transp. Porous Media 2019, 128, 677–700. [Google Scholar] [CrossRef]
  33. Rahman, A.U.; Sultan, K.; Naseer, I.; Majeed, R.; Musleh, D.; Gollapalli, M.A.S.; Chabani, S.; Ibrahim, N.; Siddiqui, S.Y.; Khan, M.A. Supervised machine learning-based prediction of COVID-19. Comput. Mater. Contin. 2021, 69, 21–34. [Google Scholar]
  34. Wakjira, T.G.; Abushanab, A.; Ebead, U.; Alnahhal, W. FAI: Fast, accurate, and intelligent approach and prediction tool for flexural capacity of FRP-RC beams based on super-learner machine learning model. Mater. Today Commun. 2022, 33, 104461. [Google Scholar] [CrossRef]
  35. Ahmed, M.S.; Rahman, A.; AlGhamdi, F.; AlDakheel, S.; Hakami, H.; AlJumah, A.; AlIbrahim, Z.; Youldash, M.; Alam Khan, M.A.; Basheer Ahmed, M.I. Joint Diagnosis of Pneumonia, COVID-19, and Tuberculosis from Chest X-ray Images: A Deep Learning Approach. Diagnostics 2023, 13, 2562. [Google Scholar] [CrossRef]
  36. Ahmed, M.I.B.; Alotaibi, R.B.; Al-Qahtani, R.A.; Al-Qahtani, R.S.; Al-Hetela, S.S.; Al-Matar, K.A.; Al-Saqer, N.K.; Rahman, A.; Saraireh, L.; Youldash, M.; et al. Deep Learning Approach to Recyclable Products Classification: Towards Sustainable Waste Management. Sustainability 2023, 15, 11138. [Google Scholar] [CrossRef]
  37. Sharma, R.; Mahanti, G.K.; Panda, G.; Rath, A.; Dash, S.; Mallik, S.; Hu, R. A Framework for Detecting Thyroid Cancer from Ultrasound and Histopathological Images Using Deep Learning, Meta-Heuristics, and MCDM Algorithms. J. Imaging 2023, 9, 173. [Google Scholar] [CrossRef]
  38. Gollapalli, M. Ensemble Machine Learning Model to Predict the Waterborne Syndrome. Algorithms 2022, 15, 93. [Google Scholar] [CrossRef]
  39. Musleh, D.A.; Al Metrik, M.A. Machine Learning and Bagging to Predict Midterm Electricity Consumption in Saudi Arabia. Appl. Syst. Innov. 2023, 6, 65. [Google Scholar] [CrossRef]
  40. Al Metrik, M.A.; Musleh, D.A. Machine learning empowered electricity consumption prediction. Comput. Mater. Contin. 2022, 72, 1427–1444. [Google Scholar] [CrossRef]
Figure 1. Proposed Methodology.
Sustainability 15 14403 g001
Figure 2. RMSE of the RF algorithm.
Sustainability 15 14403 g002
Figure 3. Correlation Coefficient of the RF Algorithm.
Sustainability 15 14403 g003
Figure 4. Correlation Coefficient of the Gradient Boost Algorithm.
Sustainability 15 14403 g004
Figure 5. RMSE of the Gradient Boost Algorithm.
Sustainability 15 14403 g005
Table 1. Total number of instances and features for each OWL.
OWL-CodeSamplesAvailable Well-Log Data (Predictors)
OWL-A388MSFL, DT, NPHI, PHIT, RHOB, SWT, CALI, CT, DRHO, GR, RT
OWL-B357CPERM, CPOR, MSFL, NPHI, PHIT, RHOB, SWT, CALI, CT, DRHO, GR, RT
OWL-C478MSFL, DT, NPHI, PHIT, RHOB, SWT, CALI, CT, DRHO, GR, RT
OWL-D388CPERM, CPOR, MSFL, DT, NPHI, PHIT, RHOB, SWT, CALI, CT, DRHO, GR, RT
OWL-E41CPERM, CPOR, DT, NPHI, PHIT, RHOB, SWT, CALI, CT, DRHO, GR, RT
Table 2. Dataset description.
Attribute Description
Micro Spherically Focused Log (MSFL)Gowell’s MSFL tool measures the flushed zone resistivity (Rxo) with a single axis.
Neutron Porosity (NPHI)By measuring the falloff of neutrons between the two detectors, the tool determines the size of the neutron cloud.
Total Porosity (PHIT)The total porosity of clean (clay-free) sand and Vd are expressions of the volume of clay dispersed within the pores of the sand.
Water Saturation (SWT)The fraction of formation water in the quiet zone unless otherwise stated.
Sonic Travel Time (DT)It provides information to support and calibrate seismic data and derives the porosity of a formation.
Resistivity (RT)It refers to the level of resistance to the flow of electric current a material exhibit.
Bulk Density Correction (DRHO)It is calculated from the difference between the short- and long-spaced density measurements and further indicates the quality of the bulk density data.
Electrical Conductivity (CT)It measures the ease at which an electric charge or heat can pass through a material.
Log10_Core Permeability (CPERM)A geometric mean regression goes through the center of a log10 Permeability cloud and therefore seeks the.
Log10_Core Porosity (CPOR)Most equations use it as a fraction, and in core analysis studies, it is expressed as a percentage.
Caliper (CALI)It has two curved, hinged legs and is used to measure both thickness and distance.
Gamma-Ray (GR)The radioactivity of rocks has been used to help derive lithologies.
Table 3. Complete statistical analysis for each OWL.
OWLPERMNPHIPHITRHOBSWTCALICTDRHOGRRTMSFLDTCPERMCPOR
OWL-A
Mean0.7390.1260.1432.4590.336.140.0590.01711.0423.911.75965.736
Std1.1830.0620.0780.1410.3440.0190.0280.0333.74722.4950.2829.948
Max3.4360.240.2872.74516.3110.1680.32922.983165.3352.77583.833
Min−1.6090.010.0112.2050.0416.1340.00603.4885.9621.23750.009
OWL-B
Mean47.1360.1370.1532.4370.1708.4110.0500.05714.7931310.8401.176 0.4840.157
Std102.5310.0520.0680.1420.1780.1040.0300.0283.9783313.0760.458 1.2440.080
Max642.0430.2610.2912.6681.0008.4890.1120.13031.03510,000.0002.437 2.9850.310
Min0.0270.0300.0342.1810.0408.1560.0000.0036.0408.9240.538 −1.8120.041
OWL-C
Mean41.9440.1390.1412.4710.5026.0760.2050.04115.93051.9051.24964.813
Std115.9150.0610.0670.1240.2590.0630.1930.0204.070444.9180.2988.915
Max1083.1160.2380.2592.7011.0006.2360.7430.09930.2067507.5571.85181.129
Min0.0200.0170.0152.2540.0406.0020.0000.0039.7261.3450.45049.280
OWL-D
Mean46.1230.1270.1372.4720.2696.2680.0550.01416.86426.3731.95565.0630.6370.139
Std118.0940.0570.0690.1260.2590.1600.0310.0115.15722.1200.4778.2481.1720.067
Max862.5230.2730.2992.7301.0007.0930.1790.09735.821146.1044.02882.6803.2070.292
Min0.0120.0210.0182.1860.0446.1880.0070.0008.7215.6011.13251.216−1.6990.003
OWL-E
Mean46.2700.1360.1392.4880.5736.3900.1740.03516.40422.815 62.7540.1830.116
Std86.9480.0900.0830.1550.3740.0210.2240.0304.61623.450 9.6271.1690.069
Max457.6490.4310.2762.7311.0006.4600.7620.18728.69879.007 79.7532.8250.240
Min0.0180.0300.0222.2210.0466.3730.0090.0058.5331.472 46.770−1.6990.008
Abbreviations: Micro-spherically-focused log (MSFL), neutron porosity (NPHI), total porosity (PHIT), bulk density (RHOB), water saturation (SWT), and sonic travel time (DT), resistivity (RT), bulk density correction (DRHO), electrical conductivity (CT), log10_core permeability (CPERM), log10_core porosity (CPOR), caliper (CALI), gamma-ray (GR).
Table 4. RMSE values for each ML algorithm.
AlgorithmOWL-AOWL-BOWL-COWL-DOWL-E
Support Vector Regression (SVR)1.111946.017980.687860.509785.3826
Random Forest (RF)0.7595.086836.42156.46828.2614
Gradient Boost (GB)0.3982.56329.1773.4656.931
Extreme Gradient Boost (XGB)0.72868.212931.8118.240650.5381
AdaBoost0.80827.652240.346817.034218.9856
Linear Regression (LR)0.763534.041141.395841.838639.6621
Table 5. ANN versus GBR.
AlgorithmOWLs
ABCDE
ANN [12]1.2014.1620.08215.82421.904
GBR (proposed)0.3982.56329.1773.4656.931
RMSE reduced by:0.8031.599−29.09512.35914.973
Table 6. SVM versus GBR.
AlgorithmOWLs
ABCDE
SVM [10]0.9917.490.1320.7413.18
GBR (proposed)0.3982.56329.1773.4656.931
RMSE reduced by:0.59214.927−29.04717.2756.249
Disclaimer/Publisher’s Note: The statements, opinions and data contained in all publications are solely those of the individual author(s) and contributor(s) and not of MDPI and/or the editor(s). MDPI and/or the editor(s) disclaim responsibility for any injury to people or property resulting from any ideas, methods, instructions or products referred to in the content.

