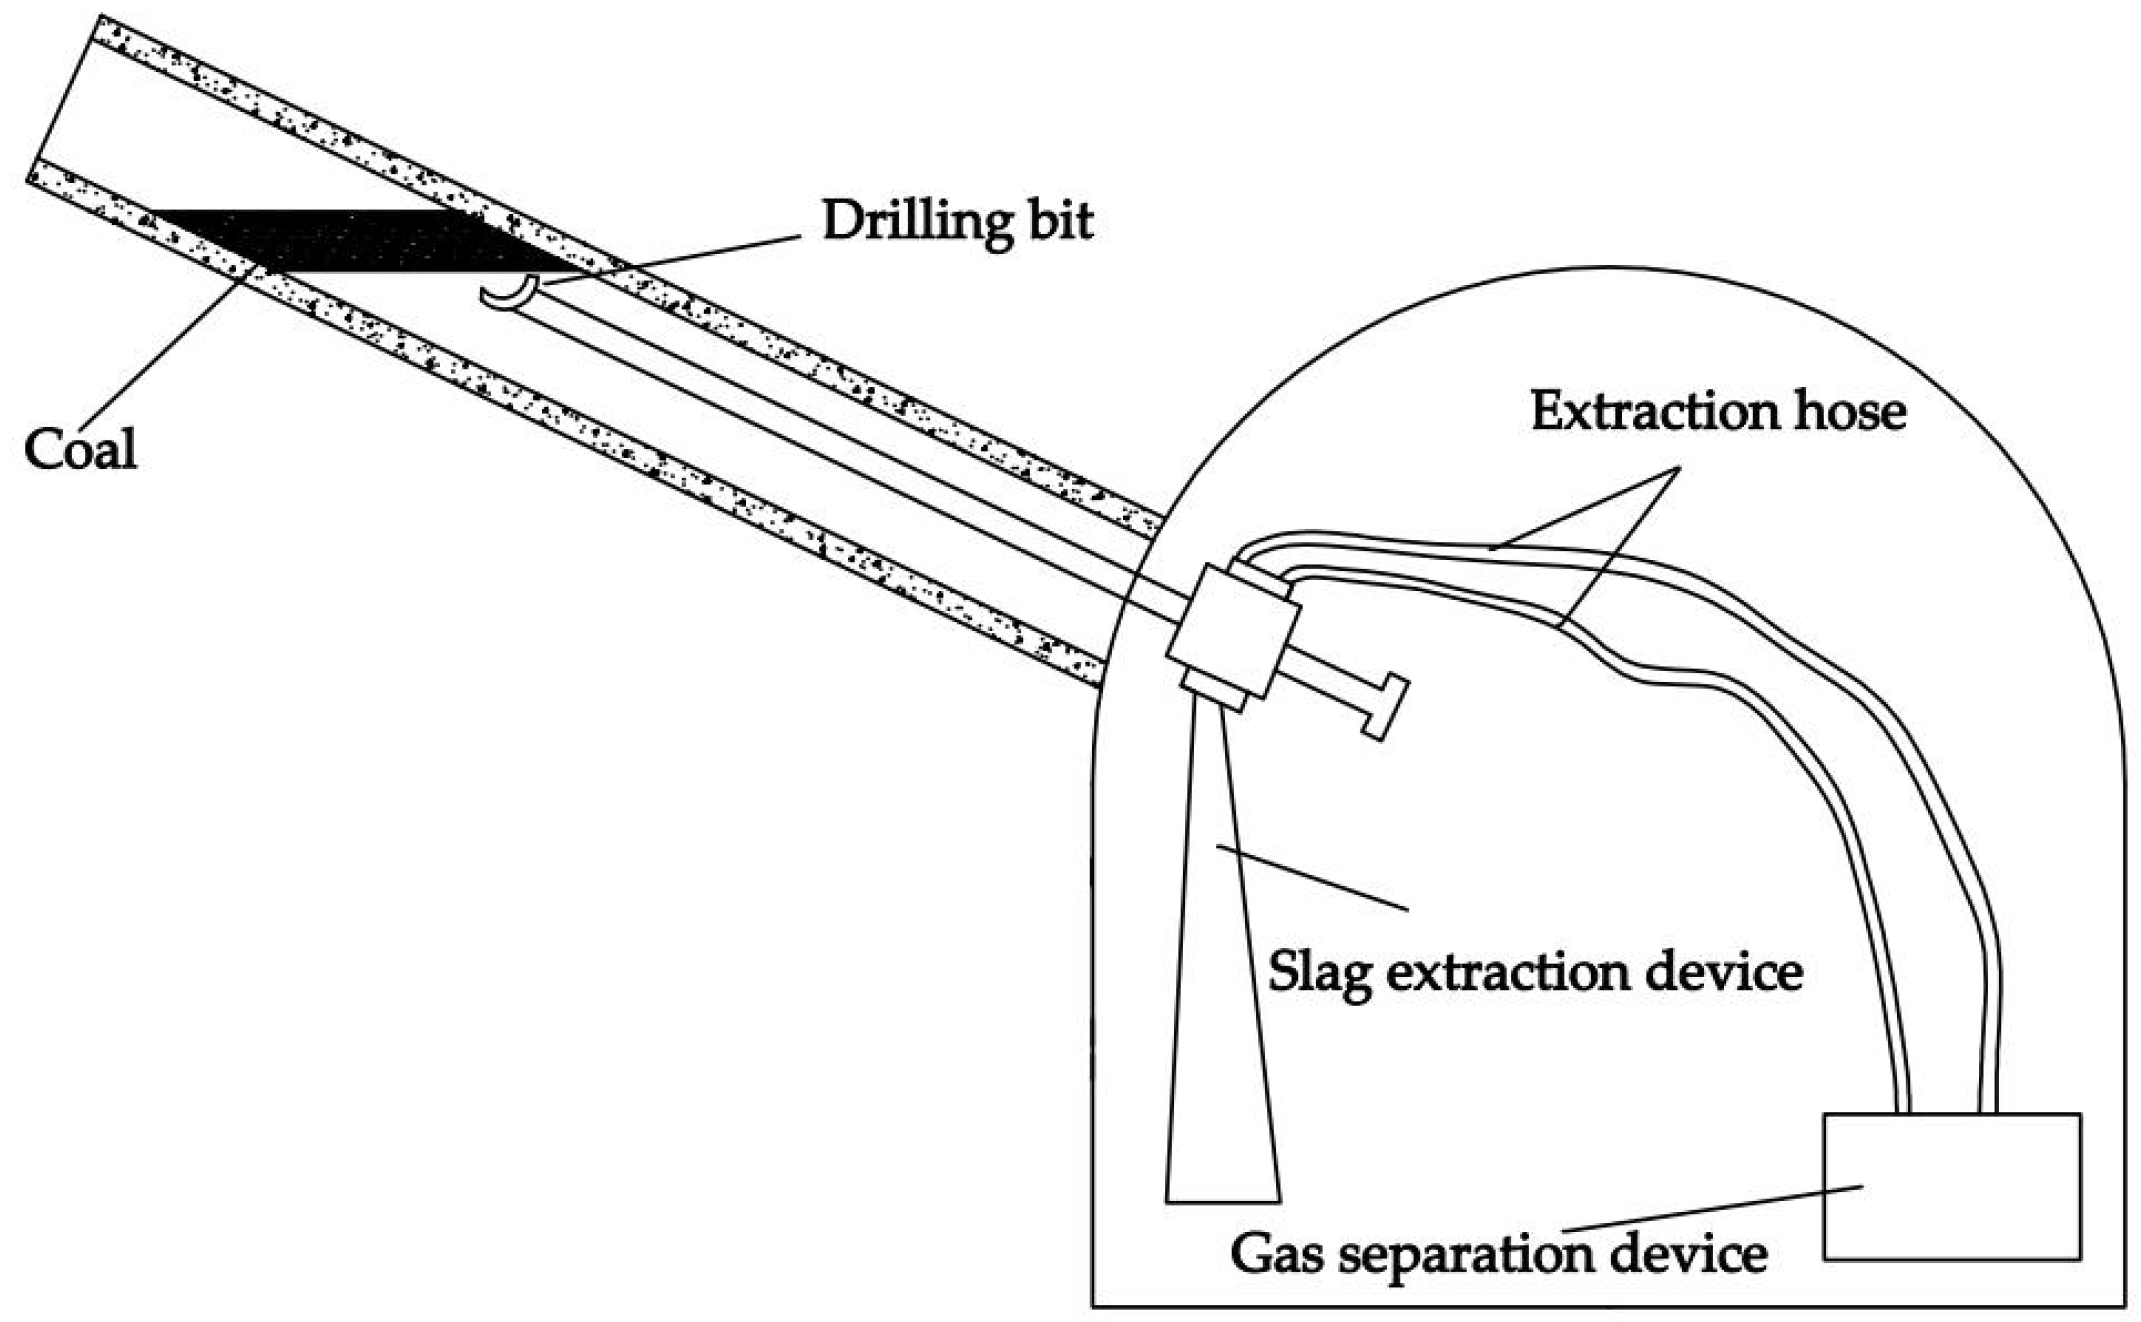
Figure 1.
Gas Extraction Diagram.
Figure 1.
Gas Extraction Diagram.
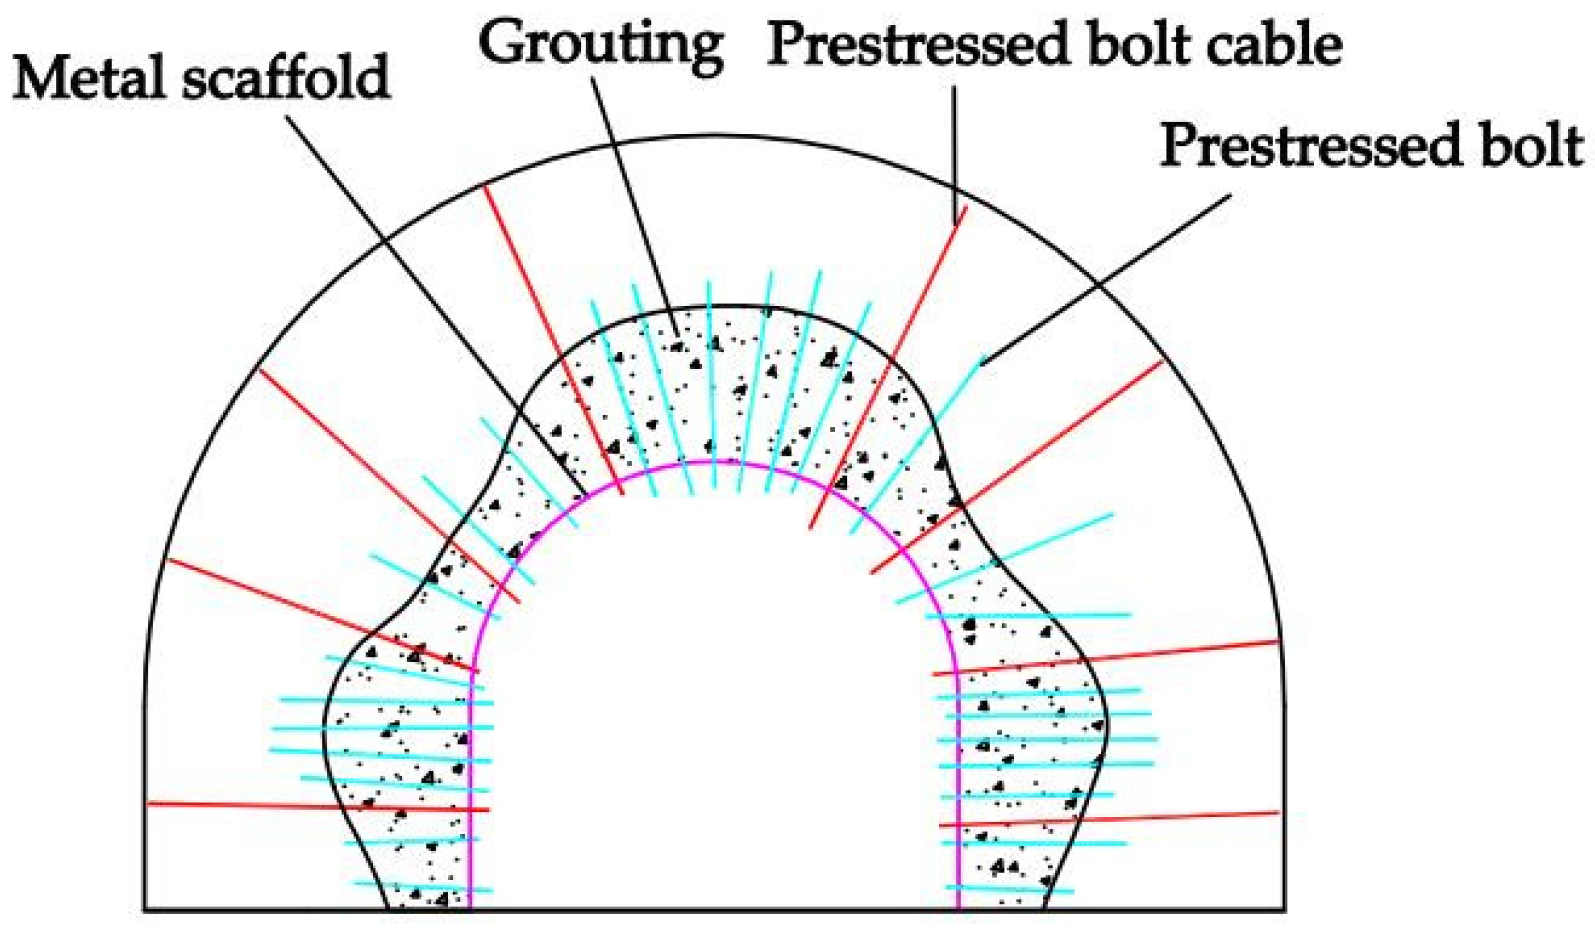
Figure 2.
Schematic of the roadway support measure.
Figure 2.
Schematic of the roadway support measure.
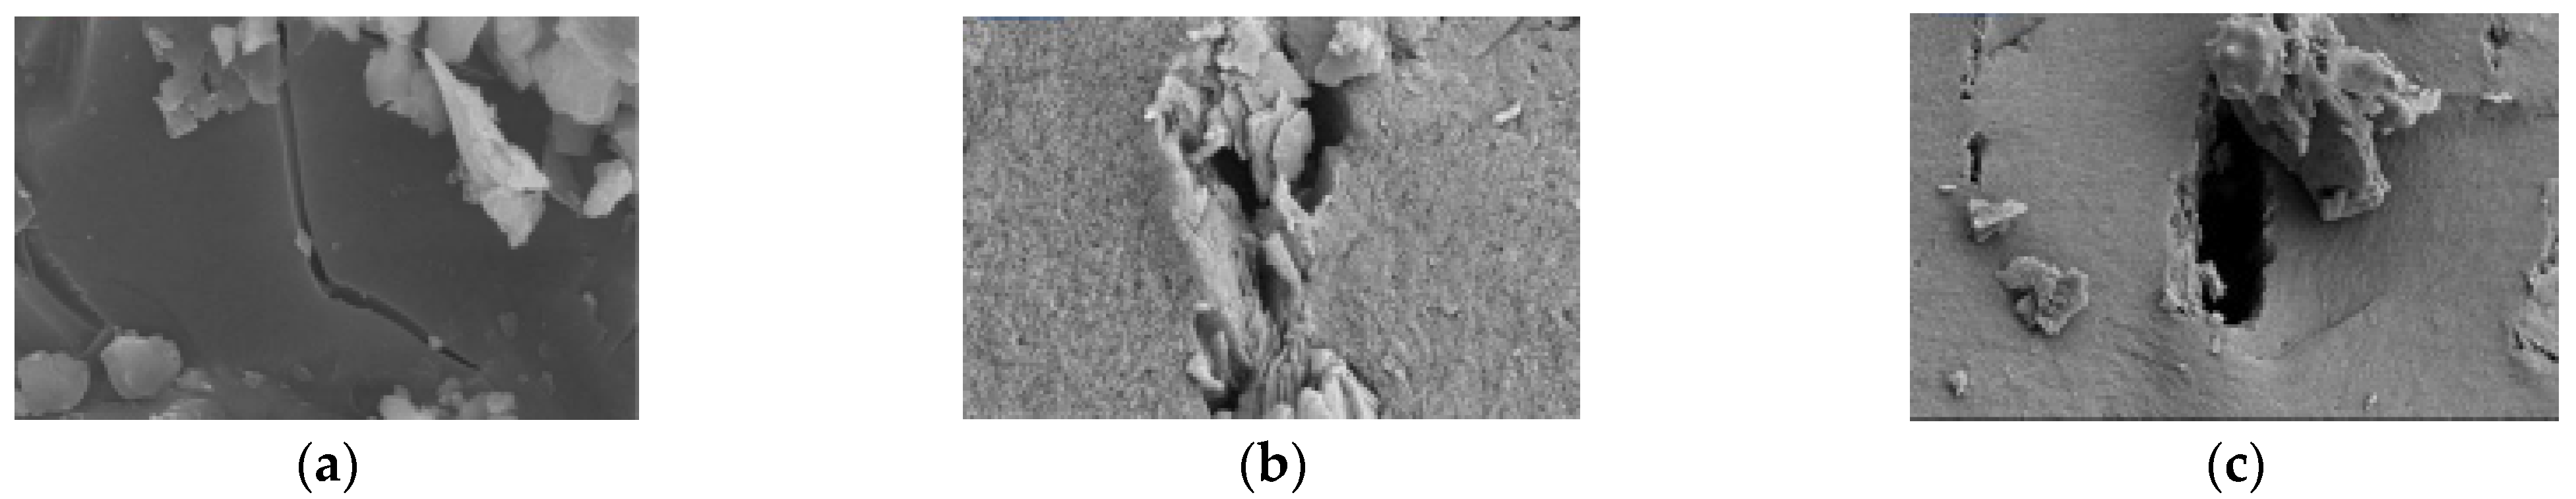
Figure 3.
Microstructure of coal rock. (a) Coal sample one, (b) Coal sample two, (c) Coal sample three.
Figure 3.
Microstructure of coal rock. (a) Coal sample one, (b) Coal sample two, (c) Coal sample three.
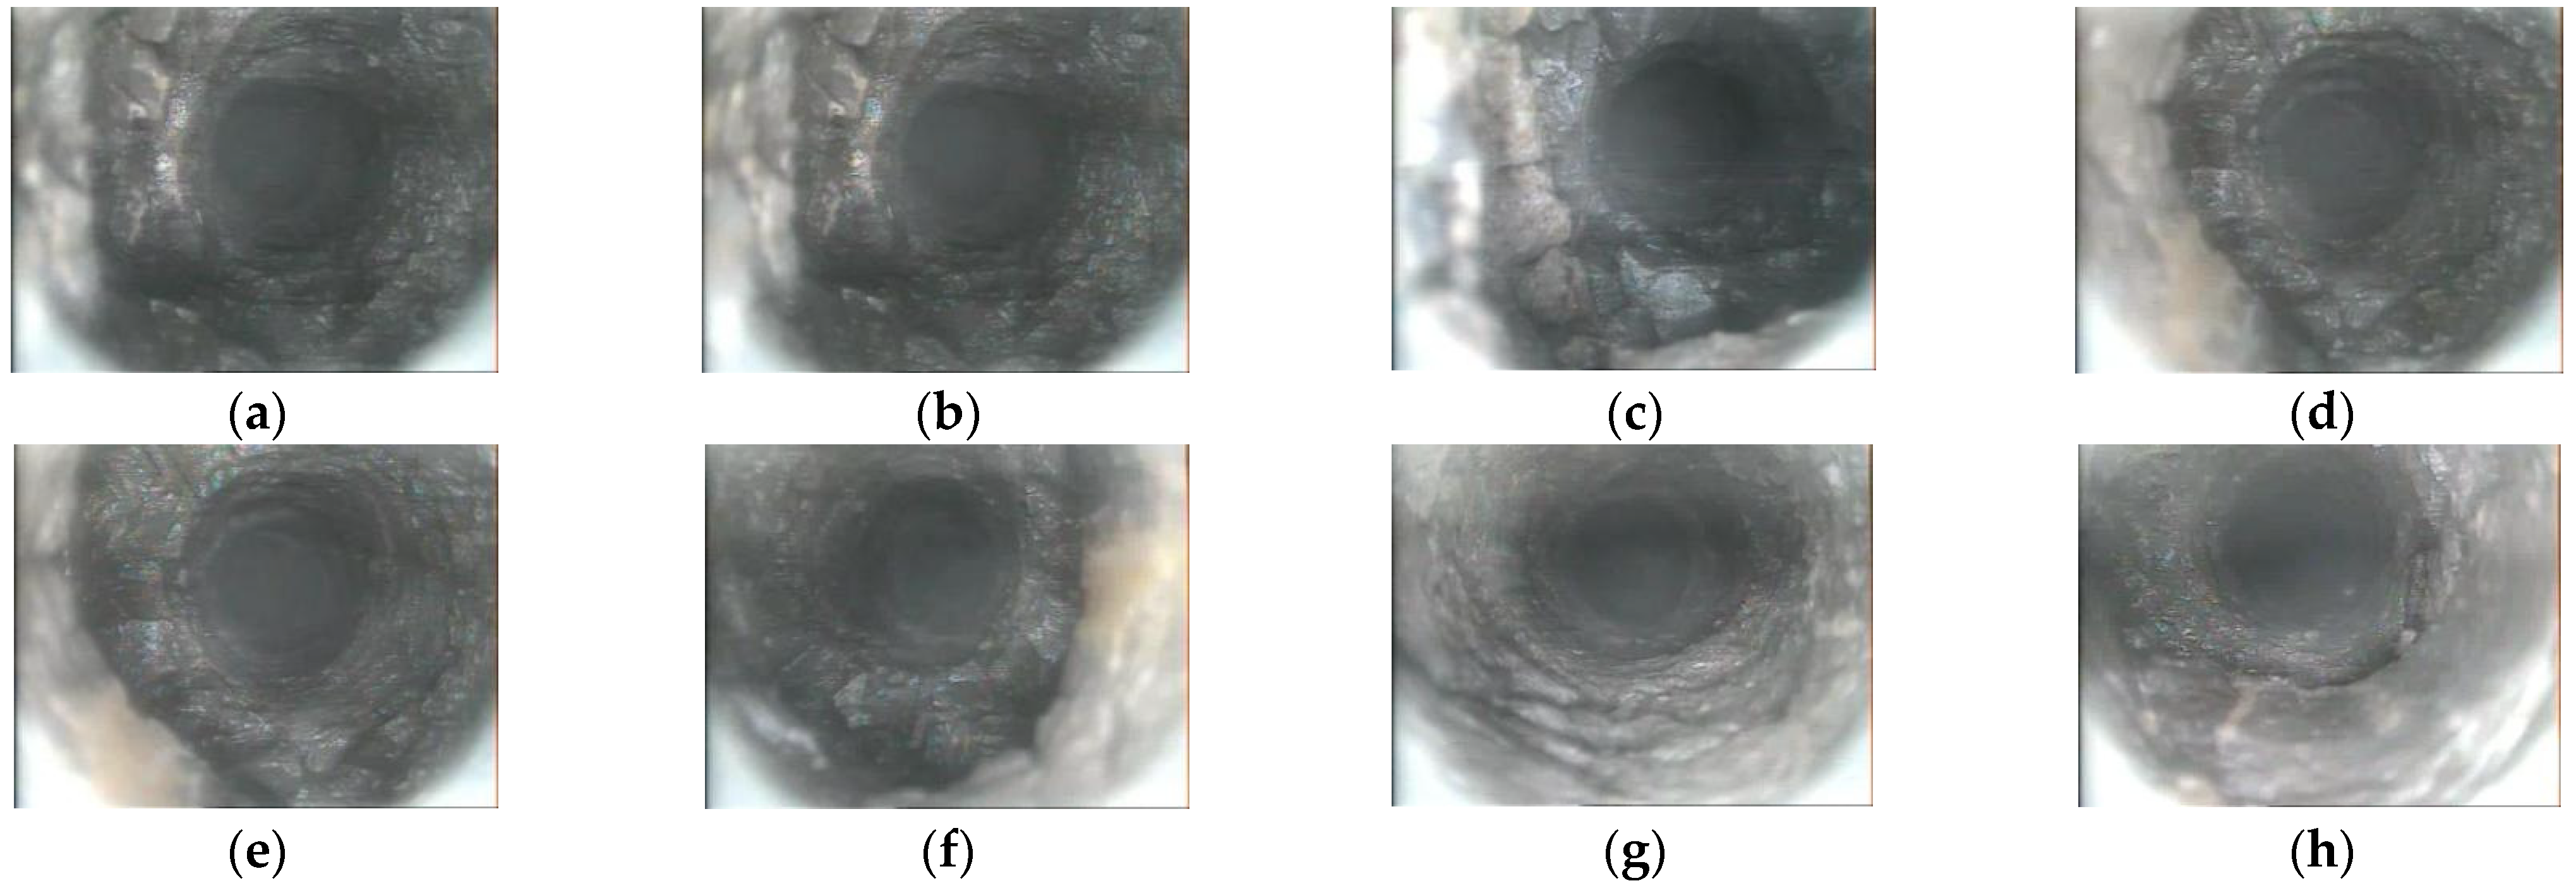
Figure 4.
Microstructure of the surrounding rock in a typical coal rock roadway. (a) S = 0.5 m, (b) S = 0.8 m, (c) S = 1.2 m, (d) S = 1.5 m, (e) S = 2.0 m, (f) S = 2.5 m, (g) S = 3.0 m, (h) S = 3.5 m.
Figure 4.
Microstructure of the surrounding rock in a typical coal rock roadway. (a) S = 0.5 m, (b) S = 0.8 m, (c) S = 1.2 m, (d) S = 1.5 m, (e) S = 2.0 m, (f) S = 2.5 m, (g) S = 3.0 m, (h) S = 3.5 m.
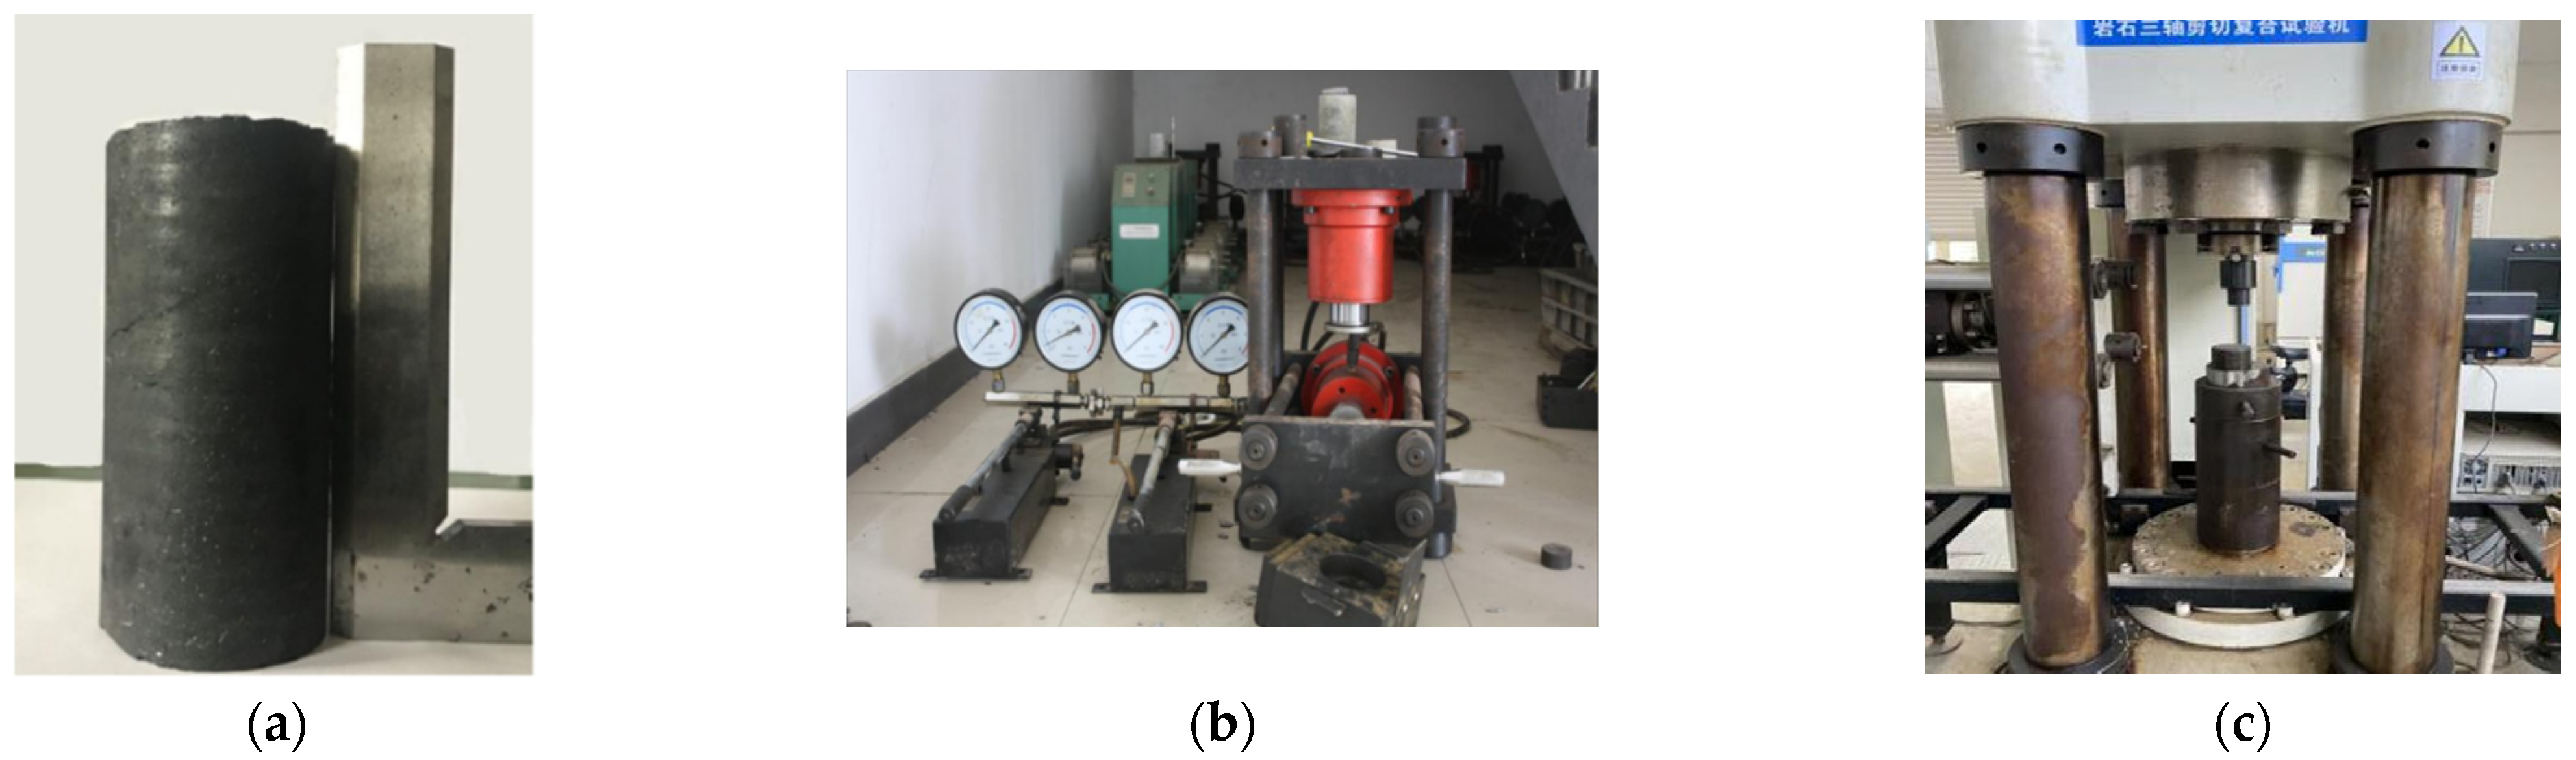
Figure 5.
Configuration of the test setup and briquette specimen. (a) Prepared standard briquette specimen; (b) YDS soil mechanical performance test apparatus; (c) Rock triaxial testing apparatus.
Figure 5.
Configuration of the test setup and briquette specimen. (a) Prepared standard briquette specimen; (b) YDS soil mechanical performance test apparatus; (c) Rock triaxial testing apparatus.
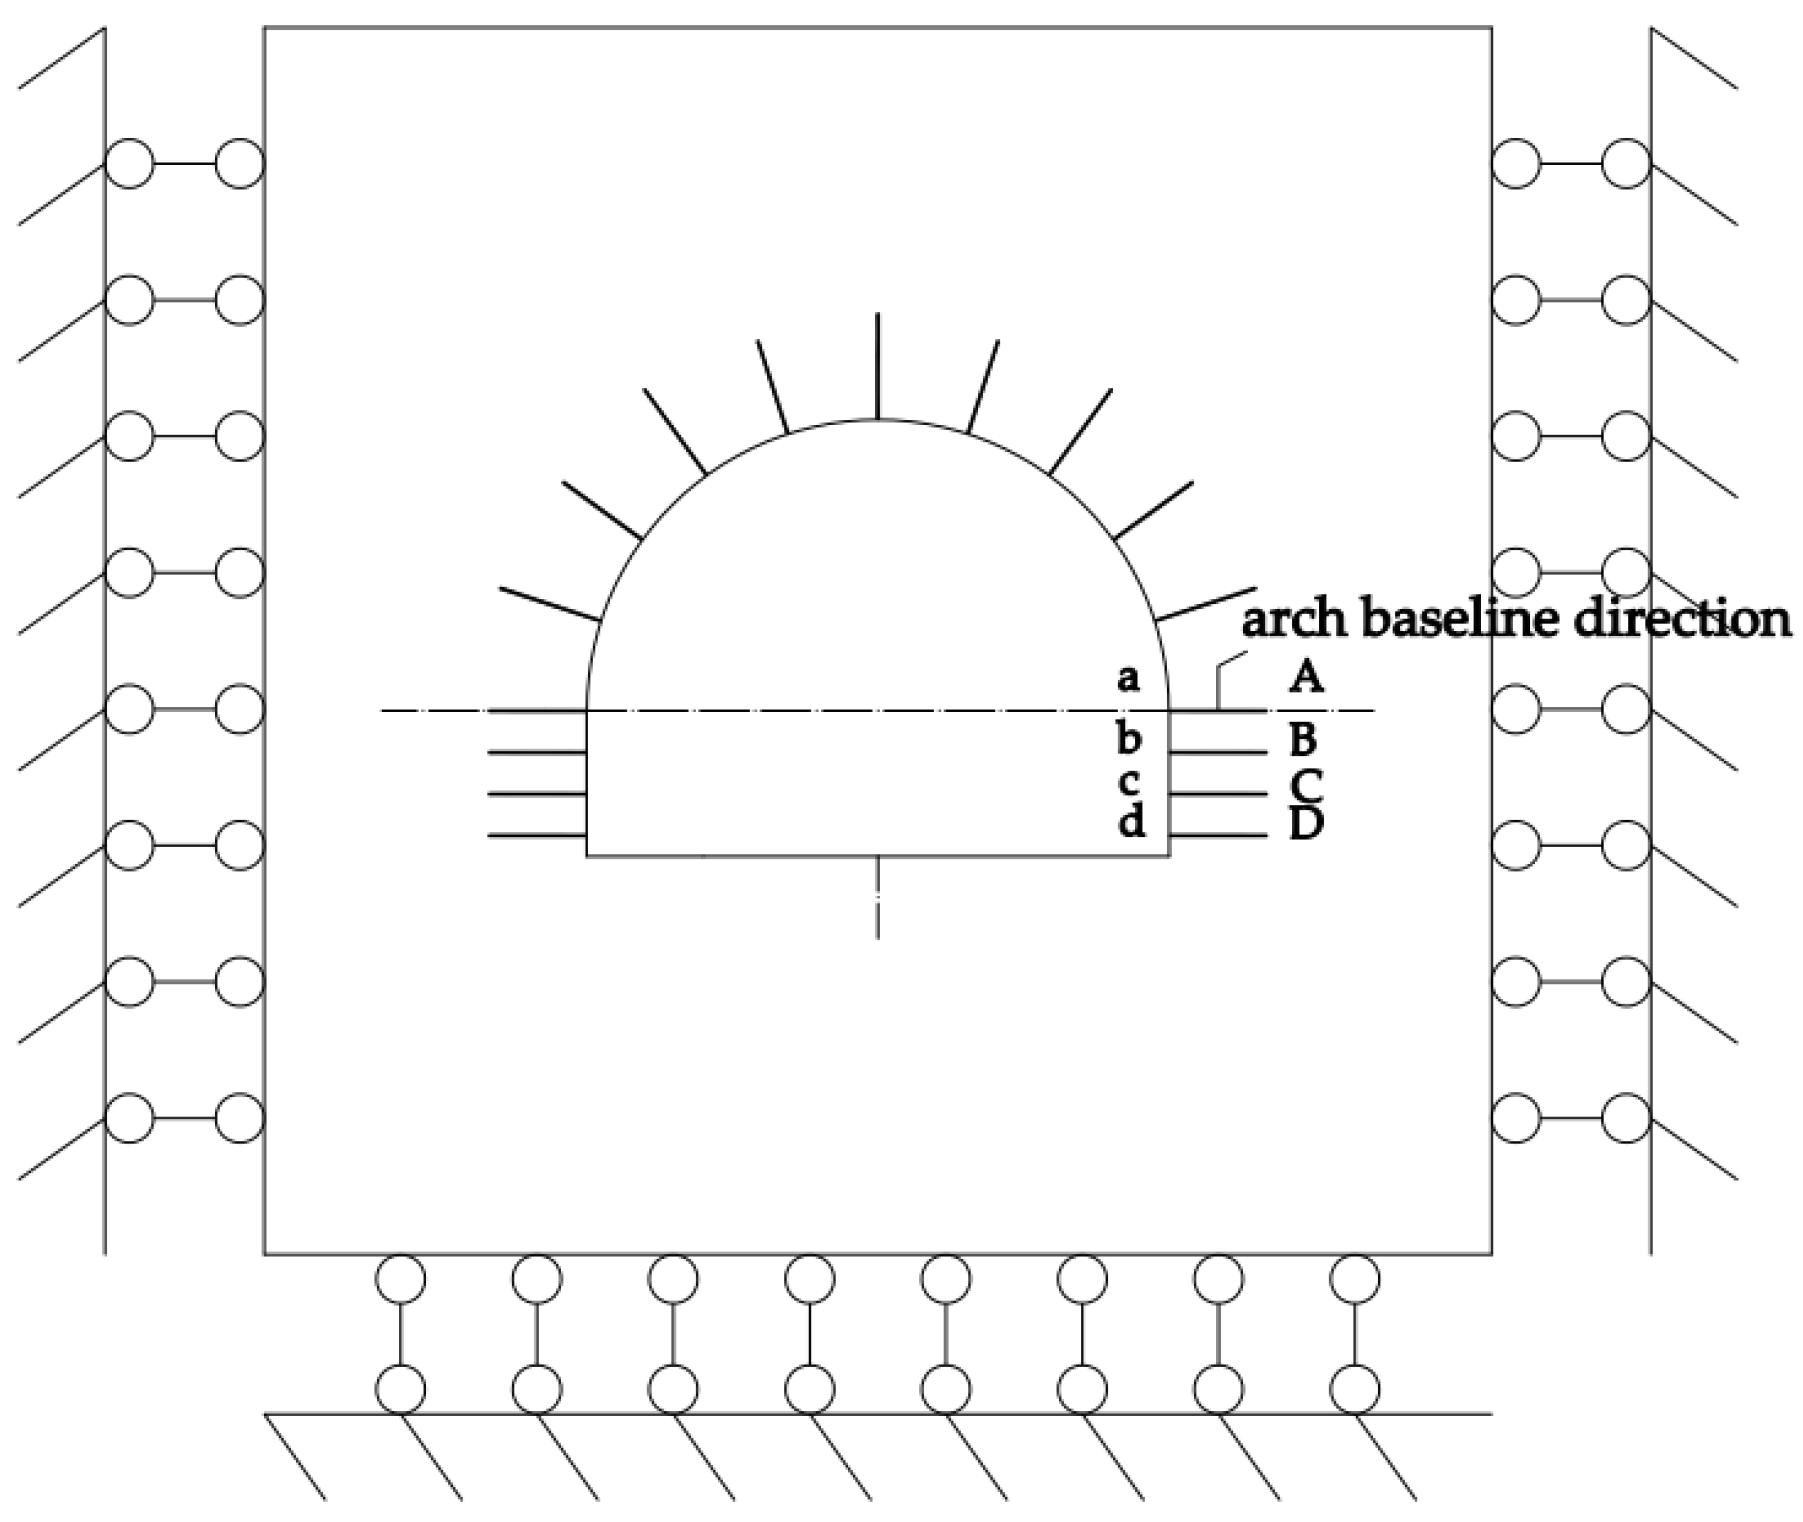
Figure 6.
Calculation model.
Figure 6.
Calculation model.
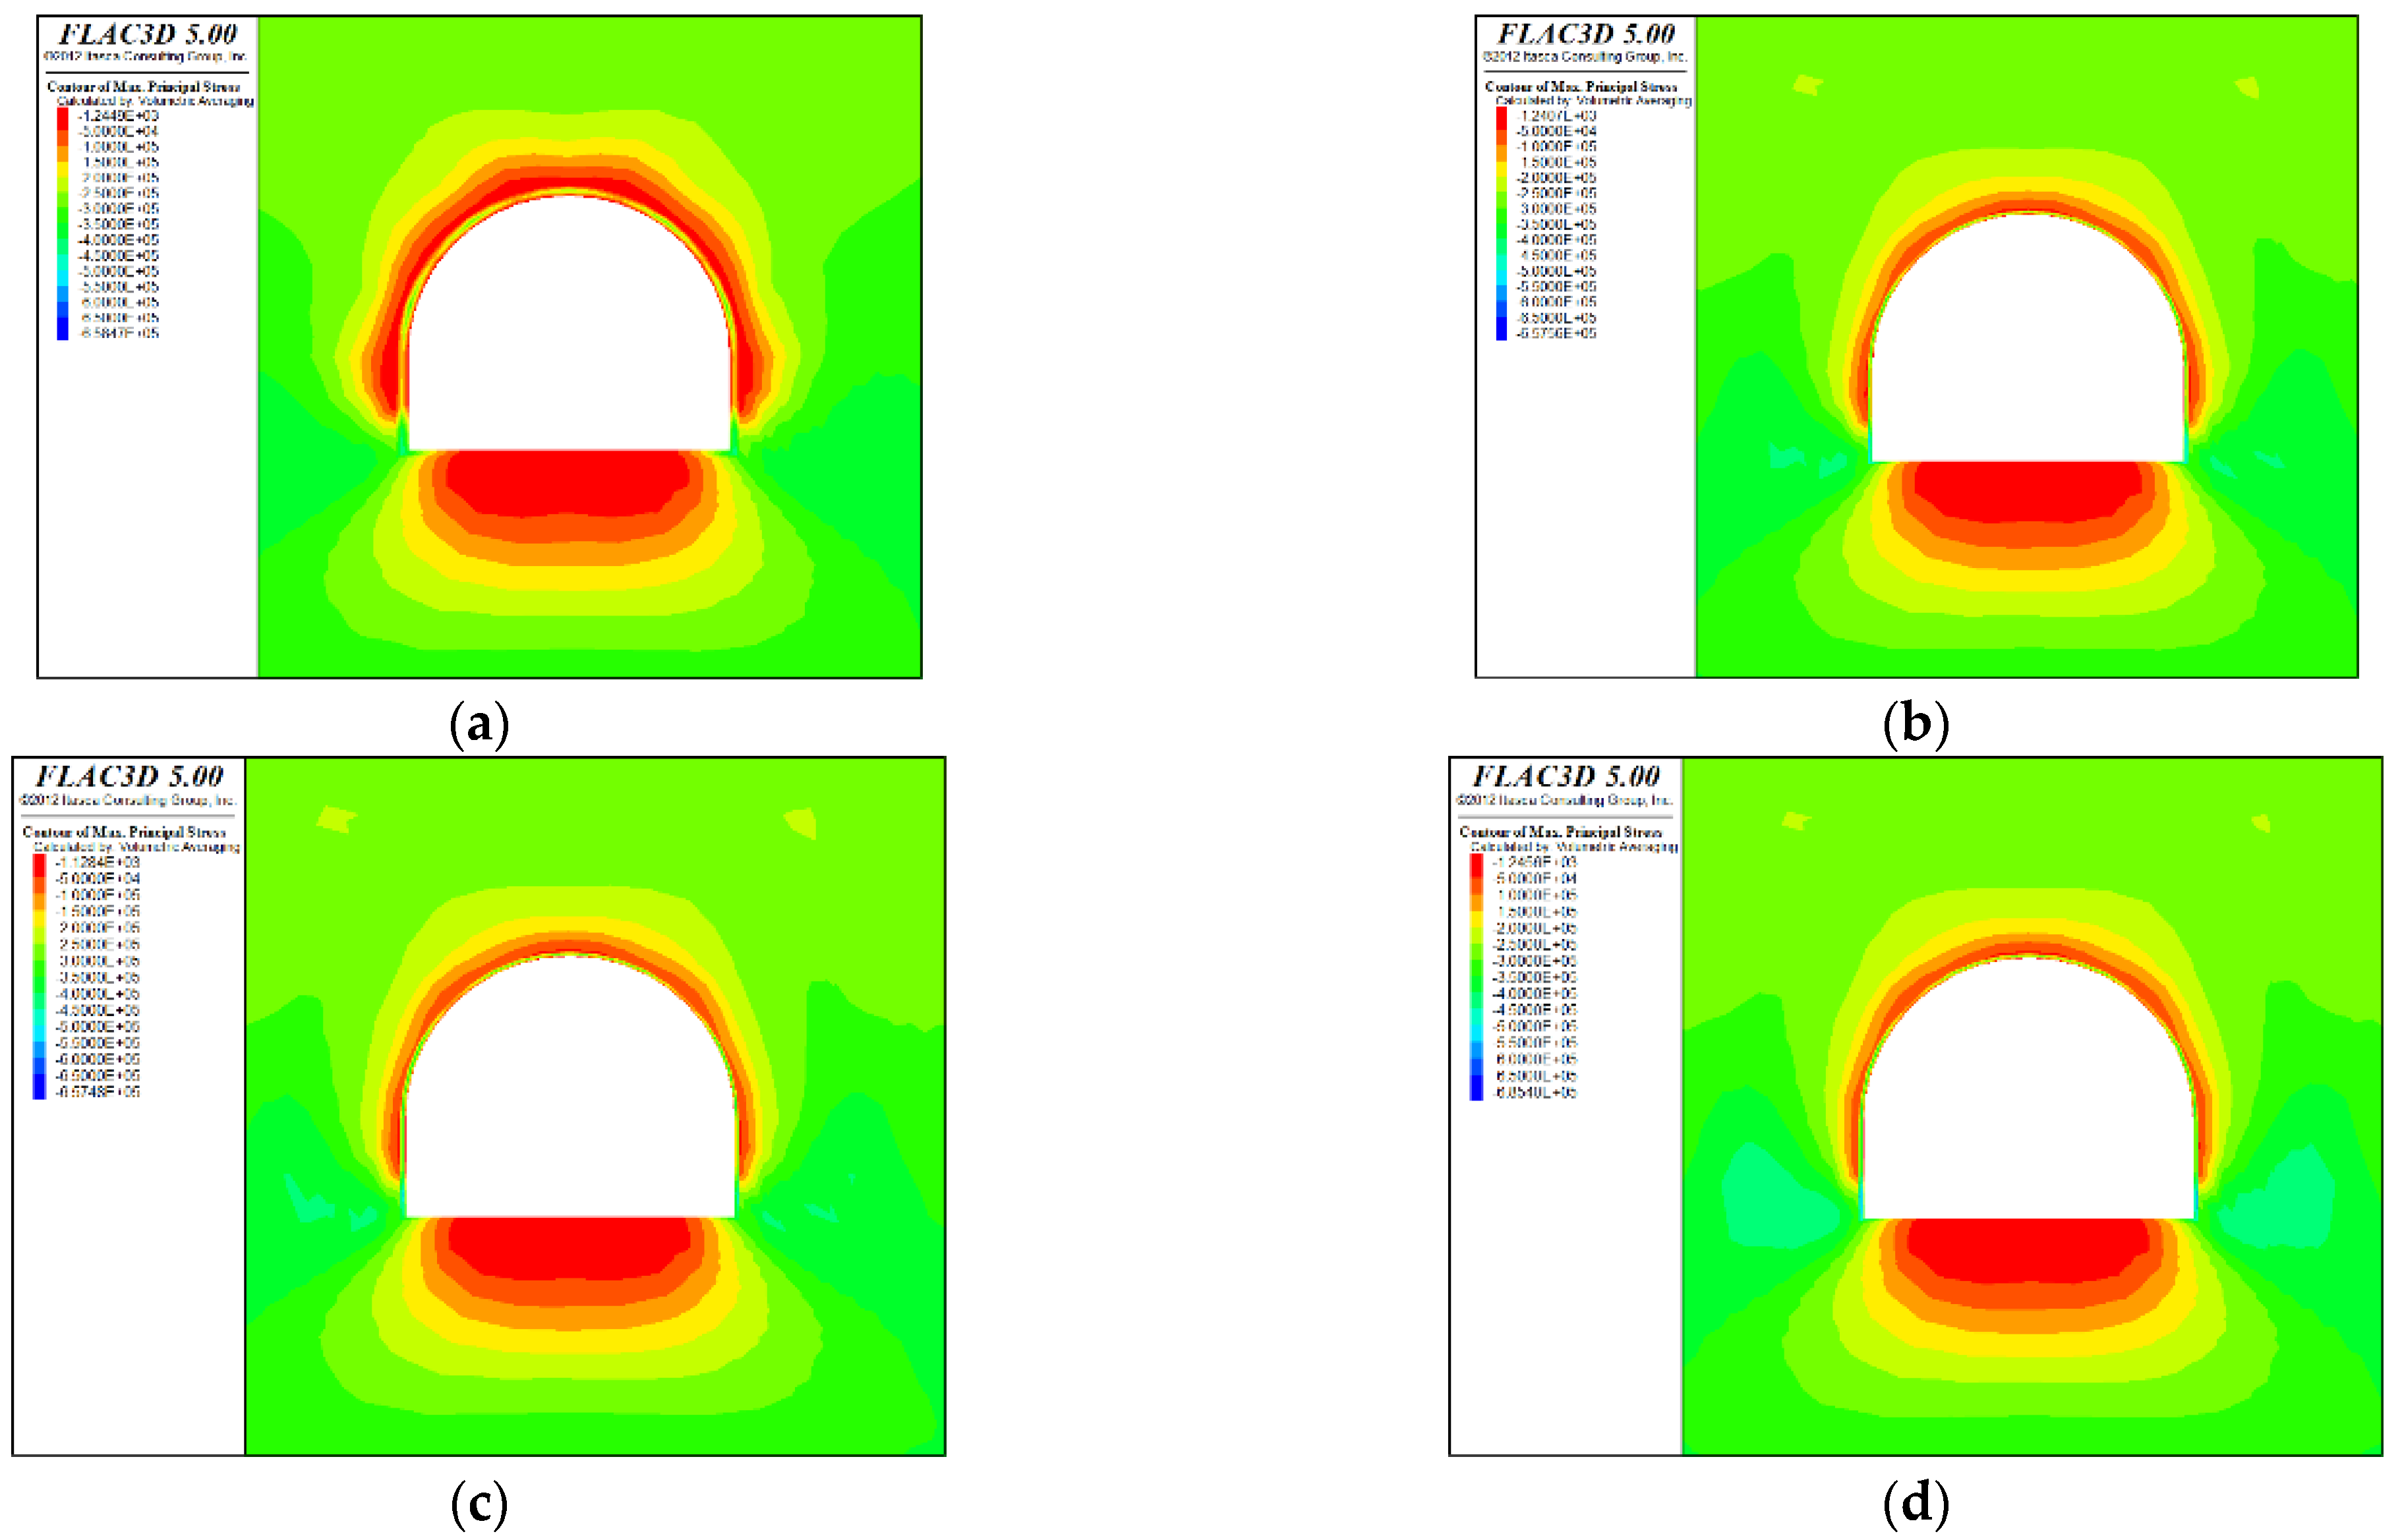
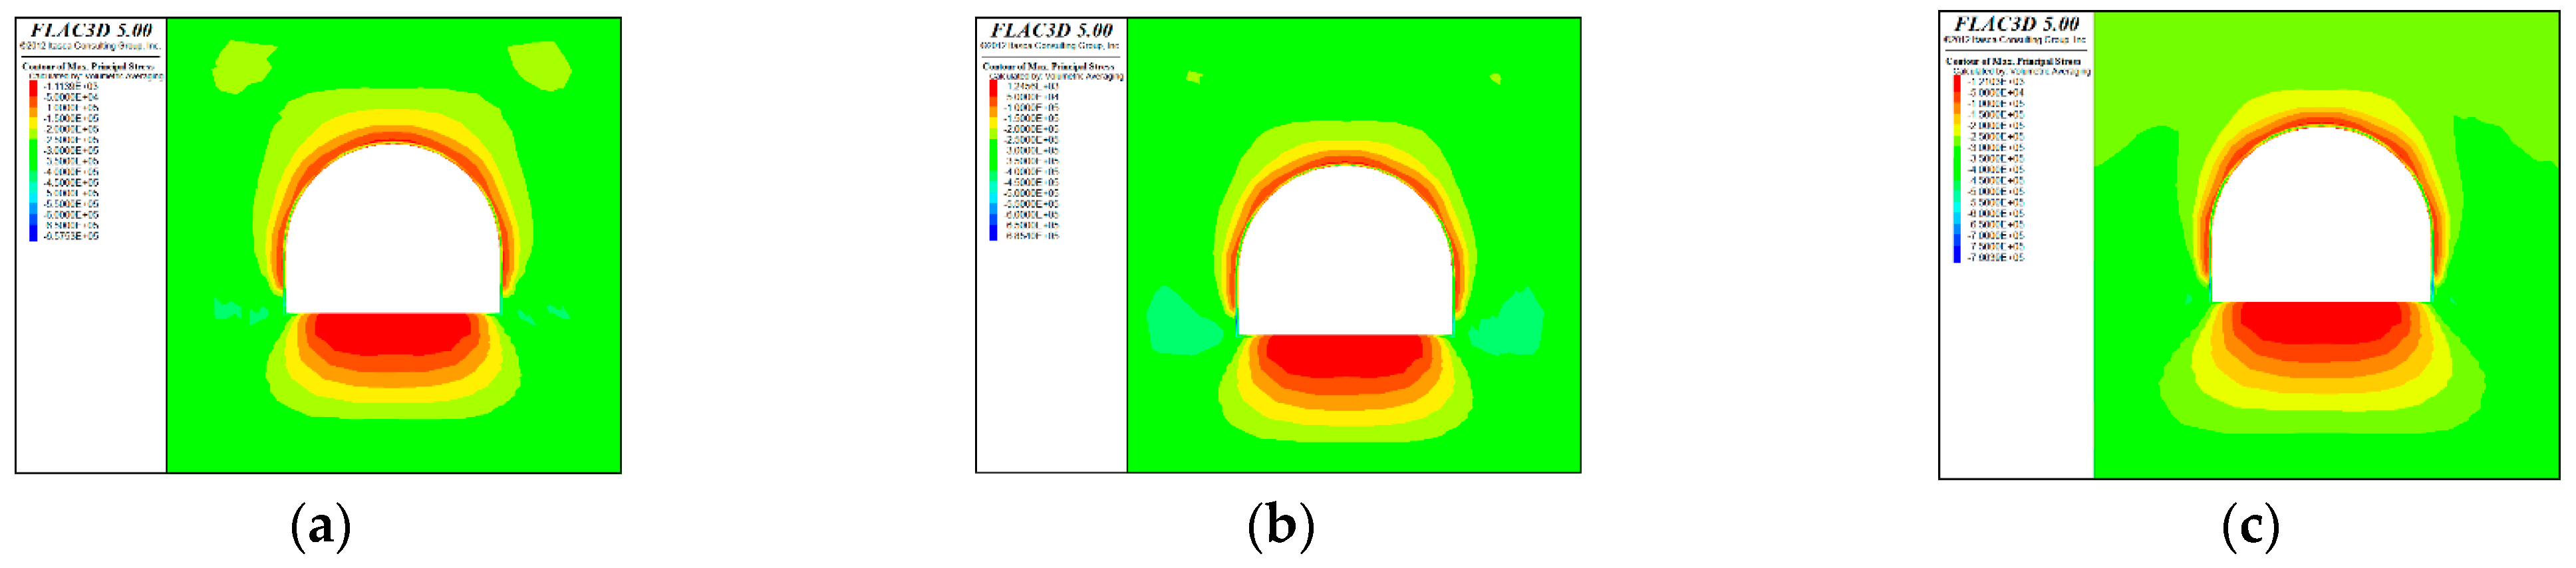
Figure 7.
Contours of additional stress in surrounding rock under different bolt spacing. (a) 800 mm × 800 mm, (b) 600 mm × 600 mm, (c) 500 mm × 500 mm, (d) 400 mm × 400 mm.
Figure 7.
Contours of additional stress in surrounding rock under different bolt spacing. (a) 800 mm × 800 mm, (b) 600 mm × 600 mm, (c) 500 mm × 500 mm, (d) 400 mm × 400 mm.
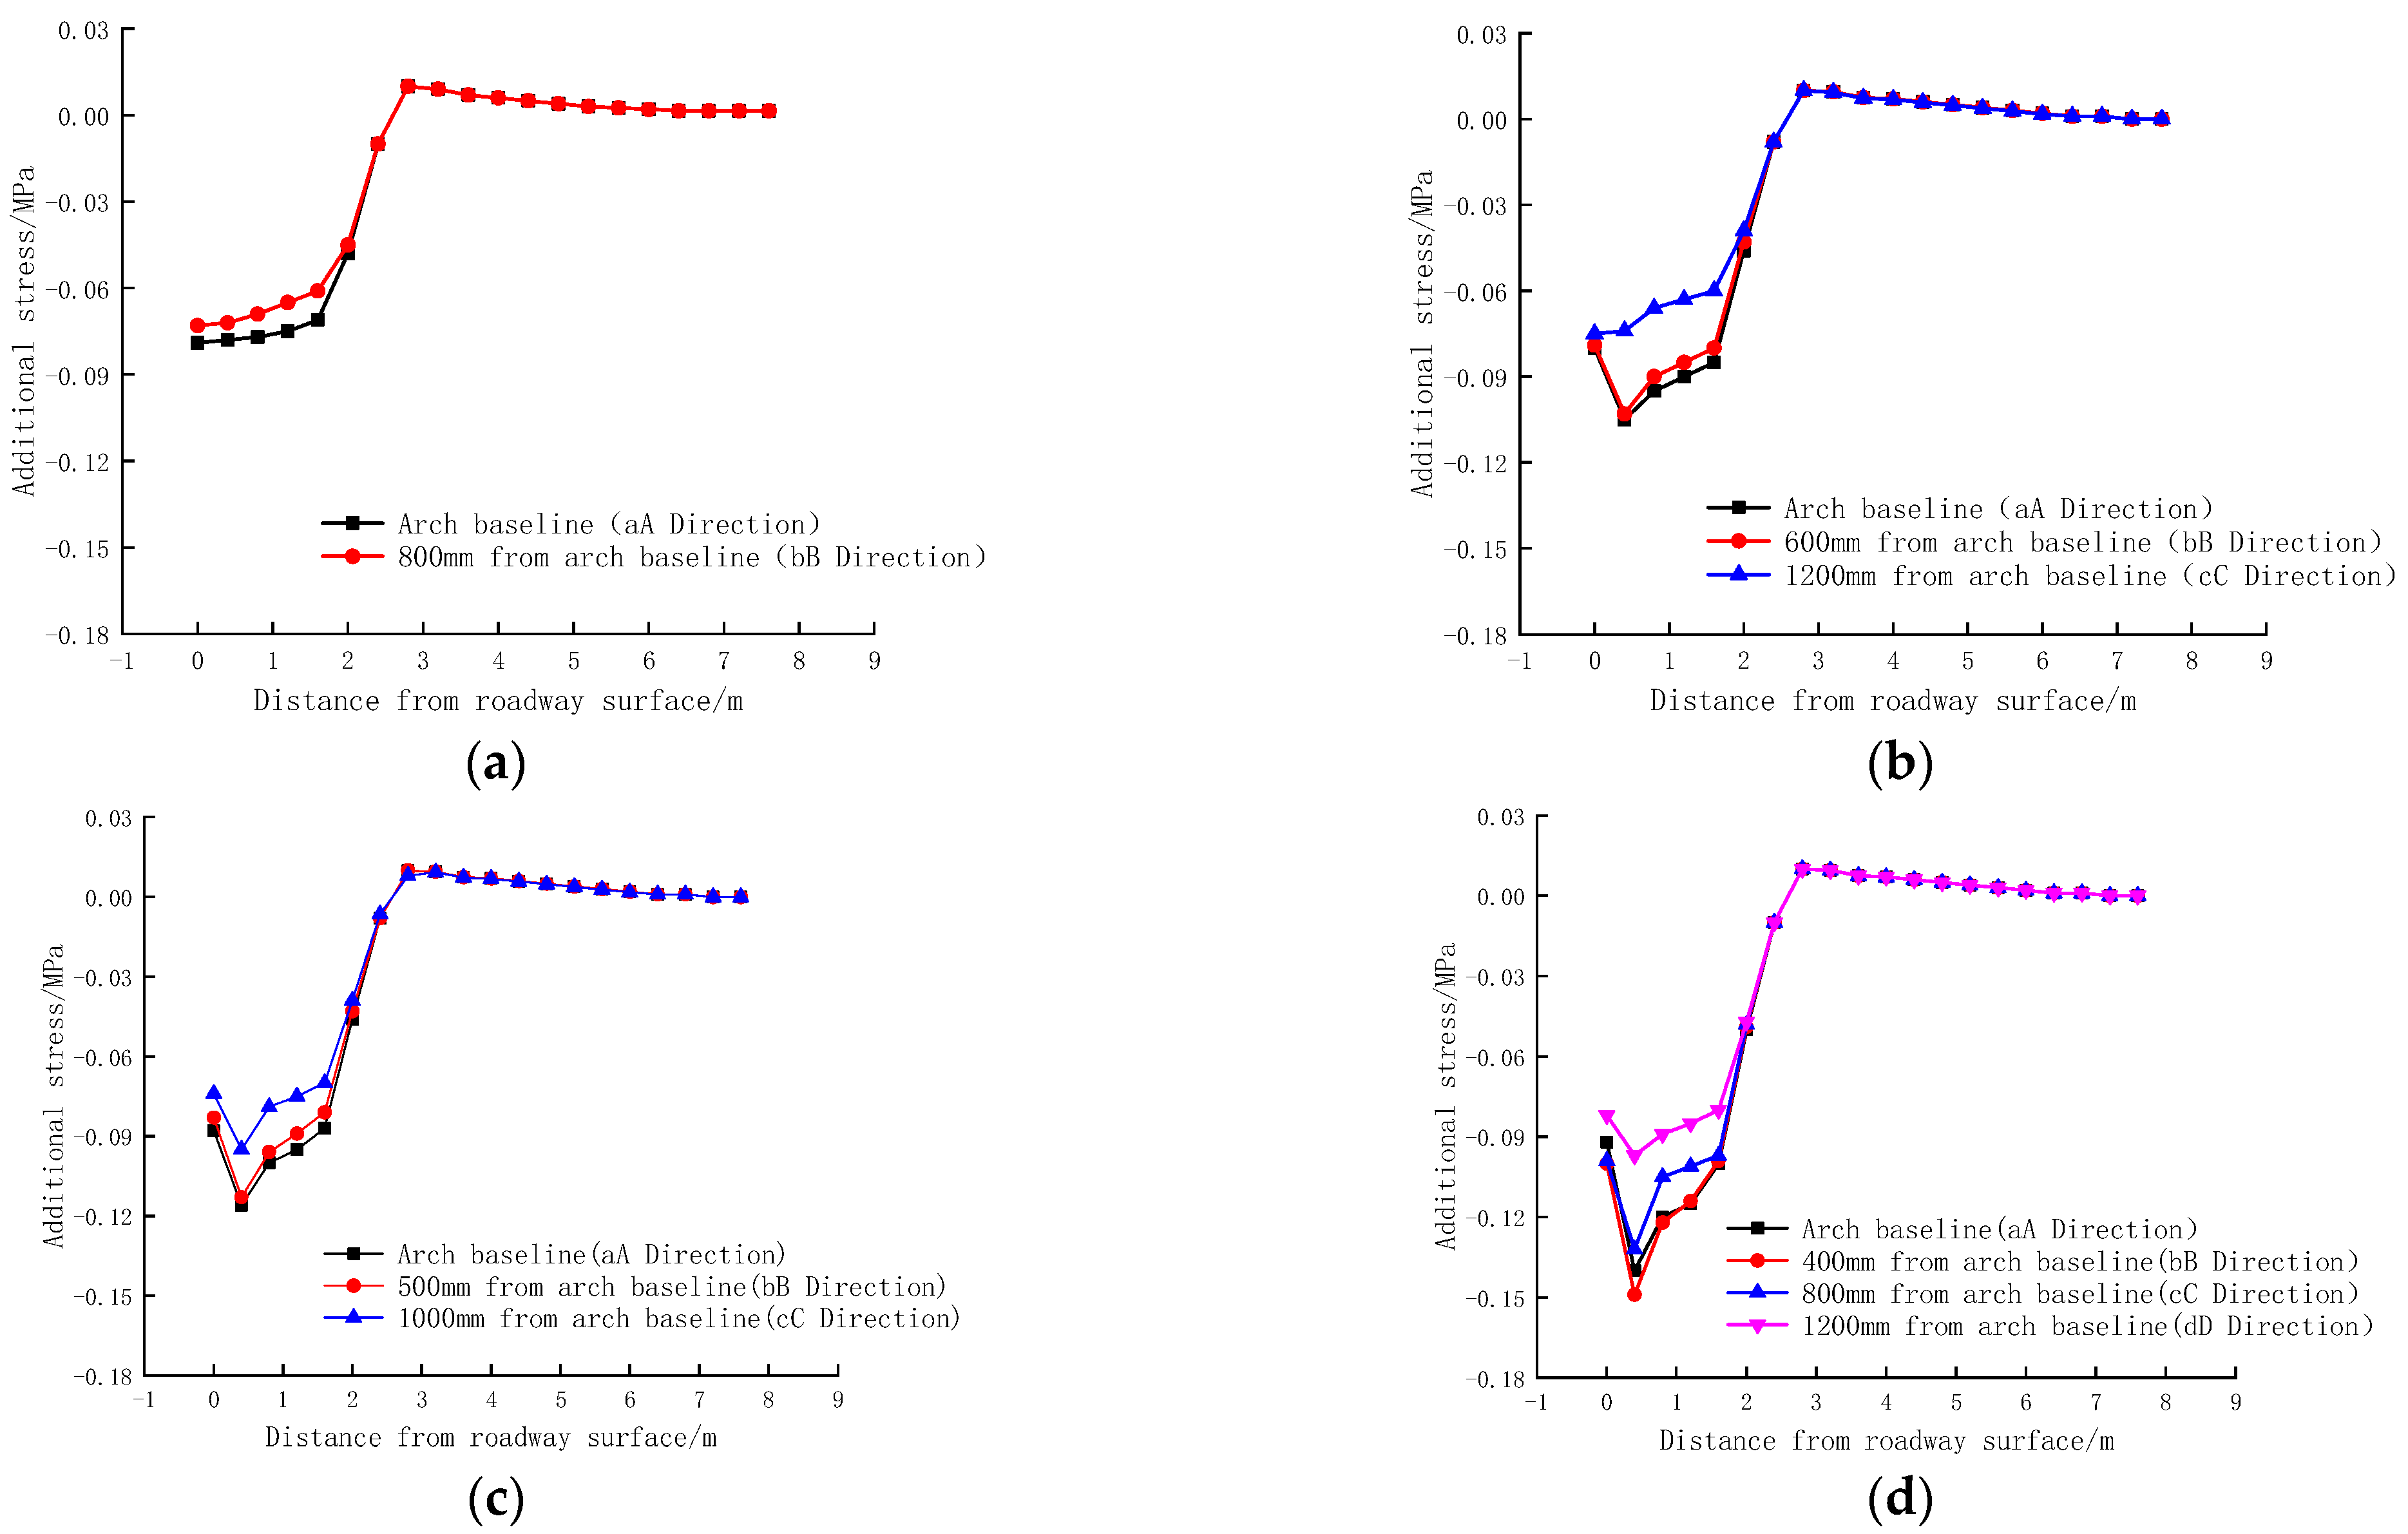
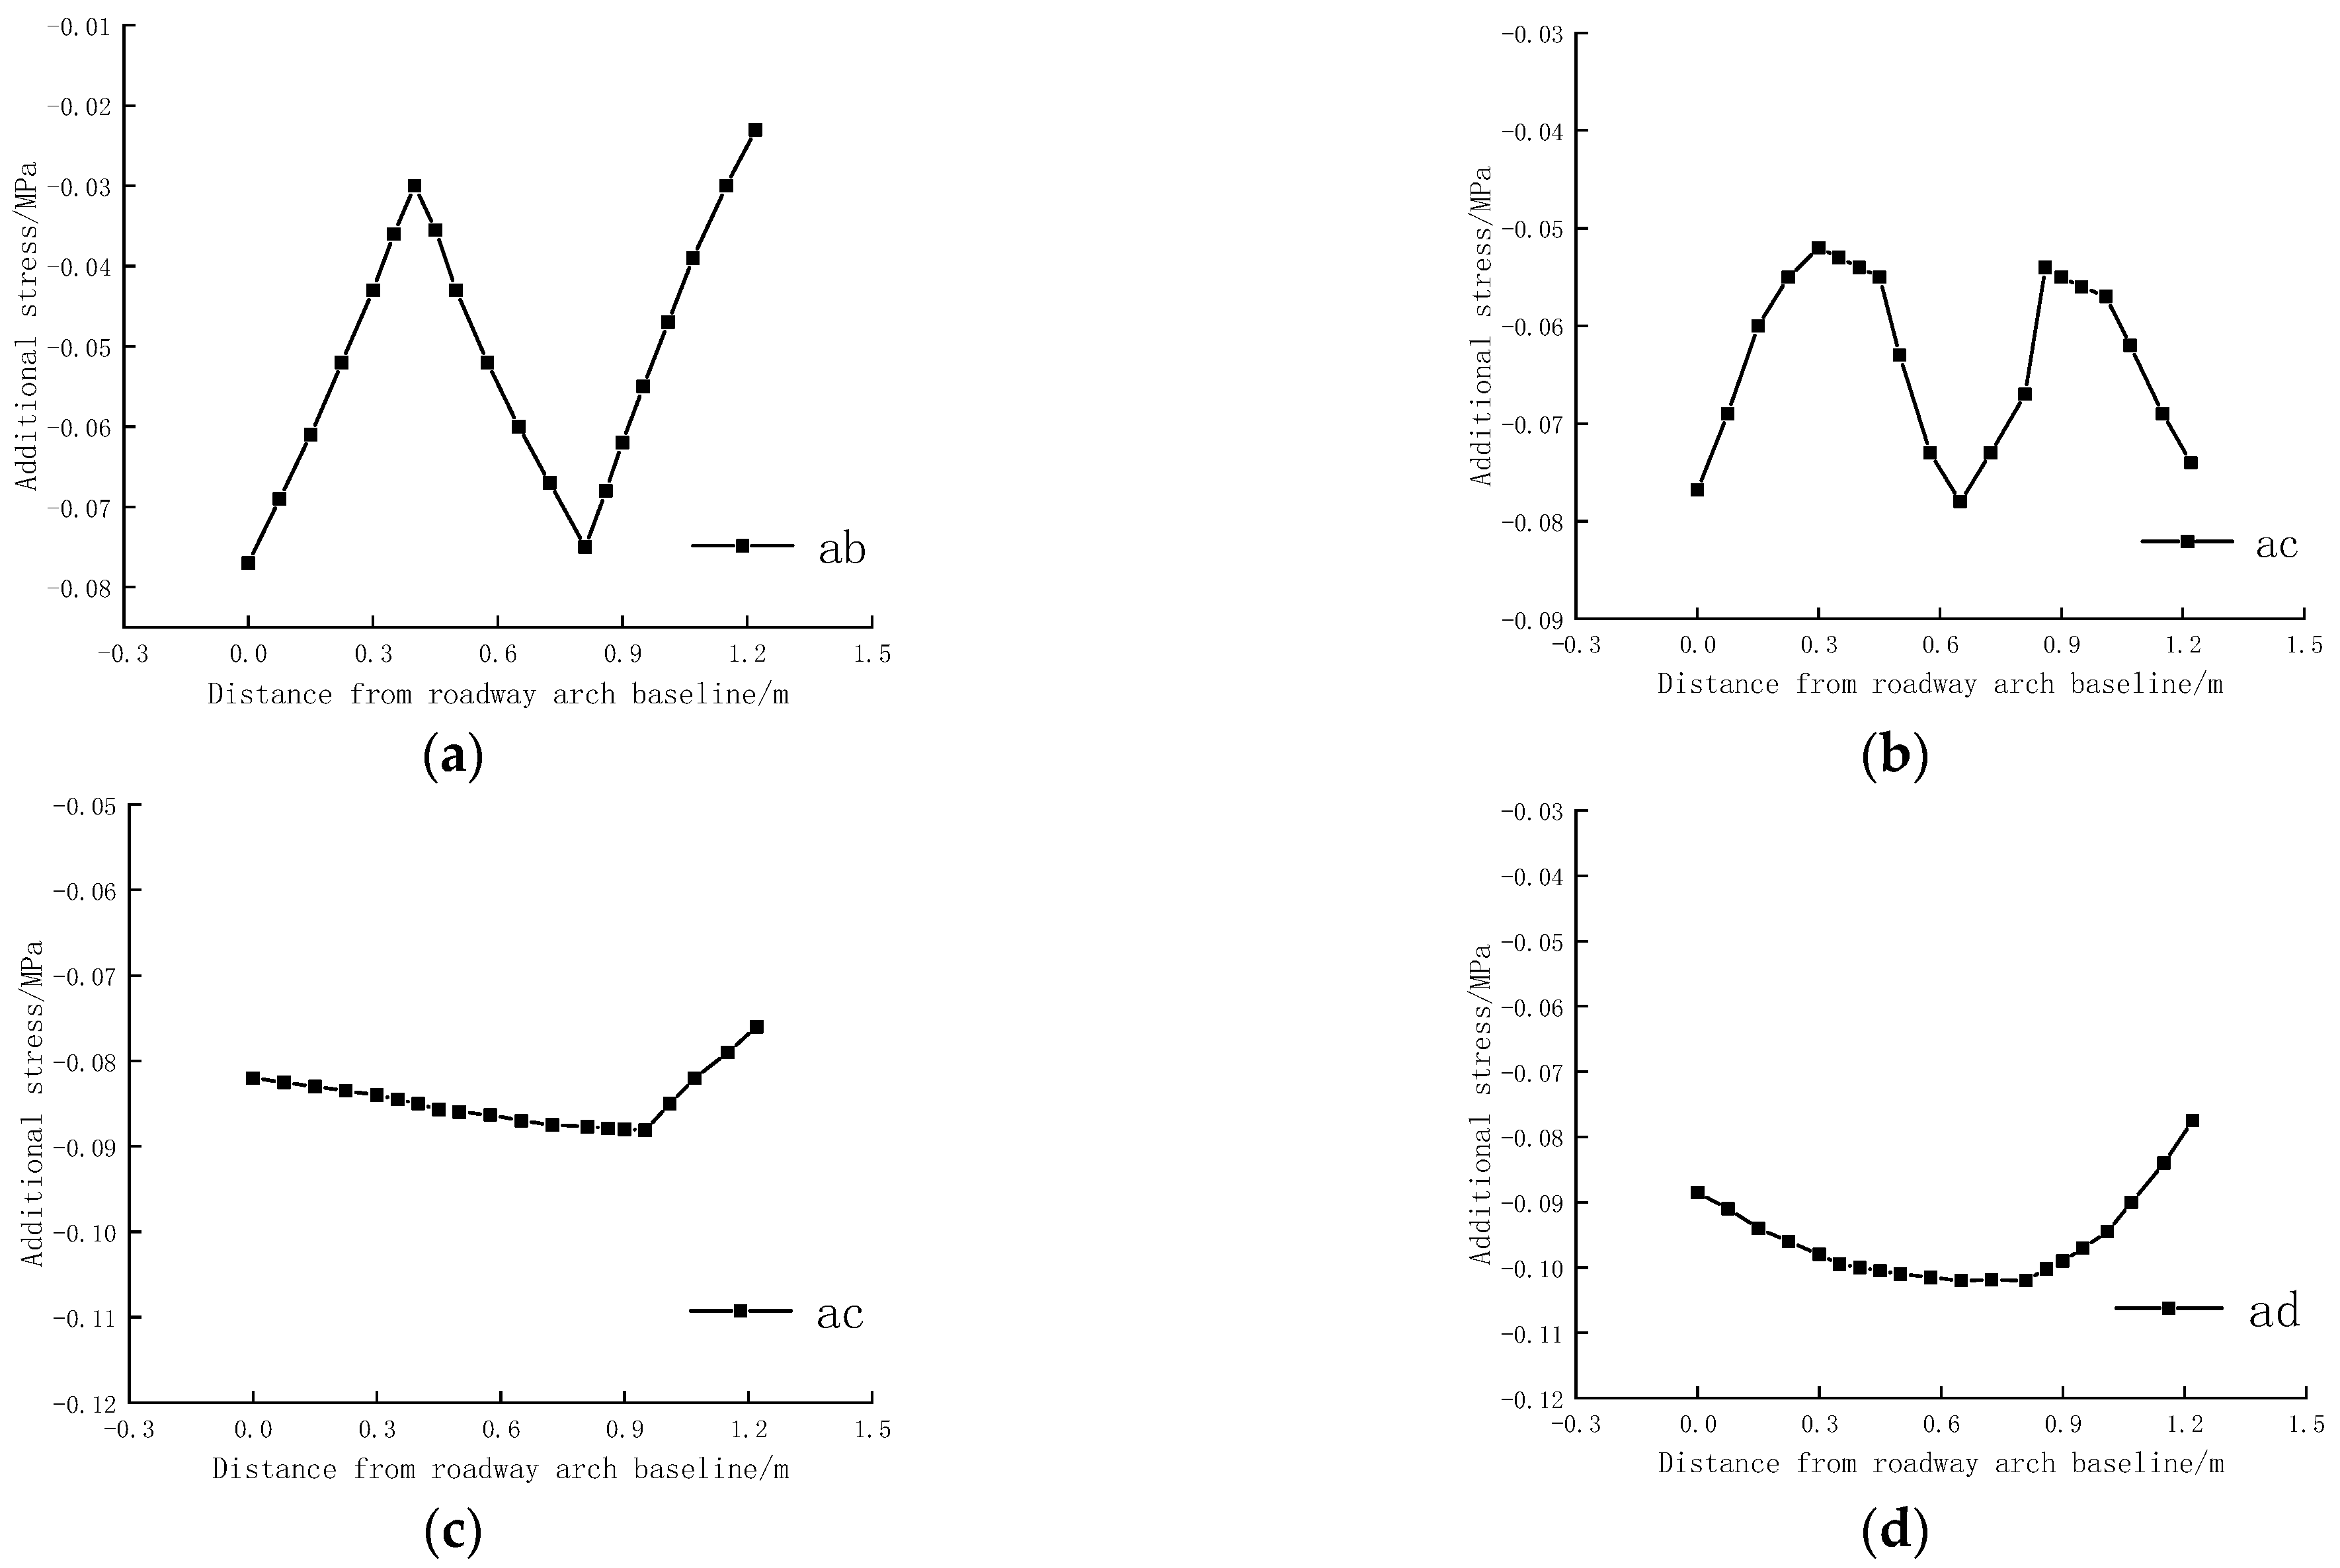
Figure 8.
Distribution of the additional stress in typical parts of the surrounding rock under different bolt spacing. (a) 800 mm × 800 mm, (b) 600 mm × 600 mm, (c) 500 mm × 500 mm, (d) 400 mm × 400 mm.
Figure 8.
Distribution of the additional stress in typical parts of the surrounding rock under different bolt spacing. (a) 800 mm × 800 mm, (b) 600 mm × 600 mm, (c) 500 mm × 500 mm, (d) 400 mm × 400 mm.
Figure 9.
Distribution of the additional stress on the surface of a straight wall under different bolt spacing. (a) 800 mm × 800 mm, (b) 600 mm × 600 mm, (c) 500 mm × 500 mm, (d) 400 mm × 400 mm.
Figure 9.
Distribution of the additional stress on the surface of a straight wall under different bolt spacing. (a) 800 mm × 800 mm, (b) 600 mm × 600 mm, (c) 500 mm × 500 mm, (d) 400 mm × 400 mm.
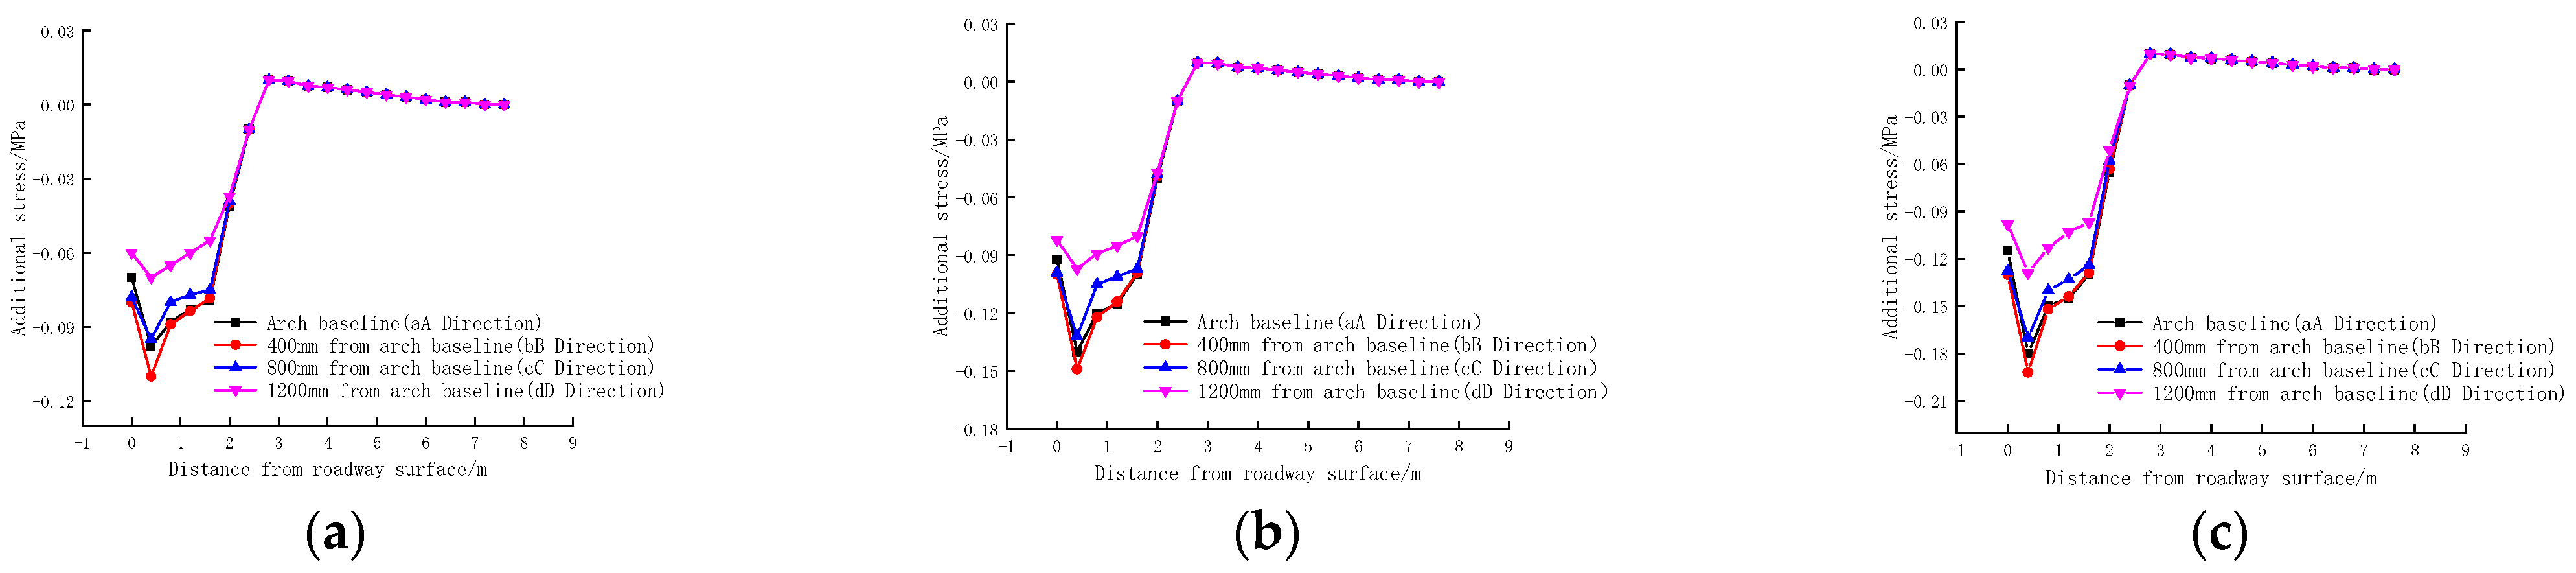
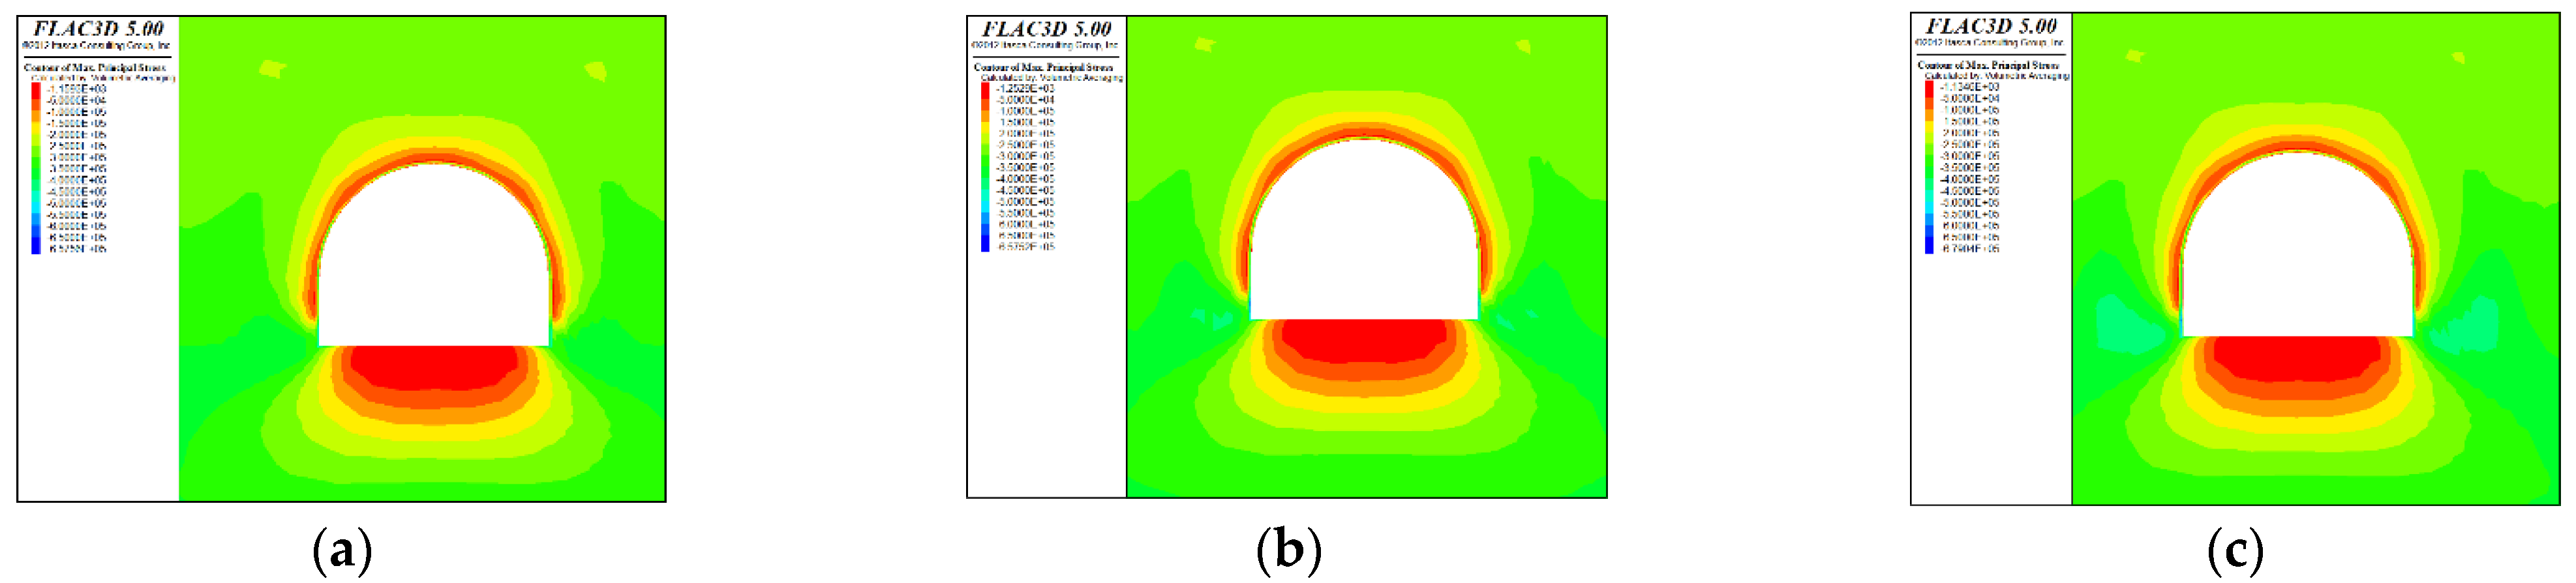
Figure 10.
Contours of additional stress in the surrounding rock under different bolt pre-tightening force. (a) F = 50 kN, (b) F = 70 kN, (c) F = 90 kN.
Figure 10.
Contours of additional stress in the surrounding rock under different bolt pre-tightening force. (a) F = 50 kN, (b) F = 70 kN, (c) F = 90 kN.
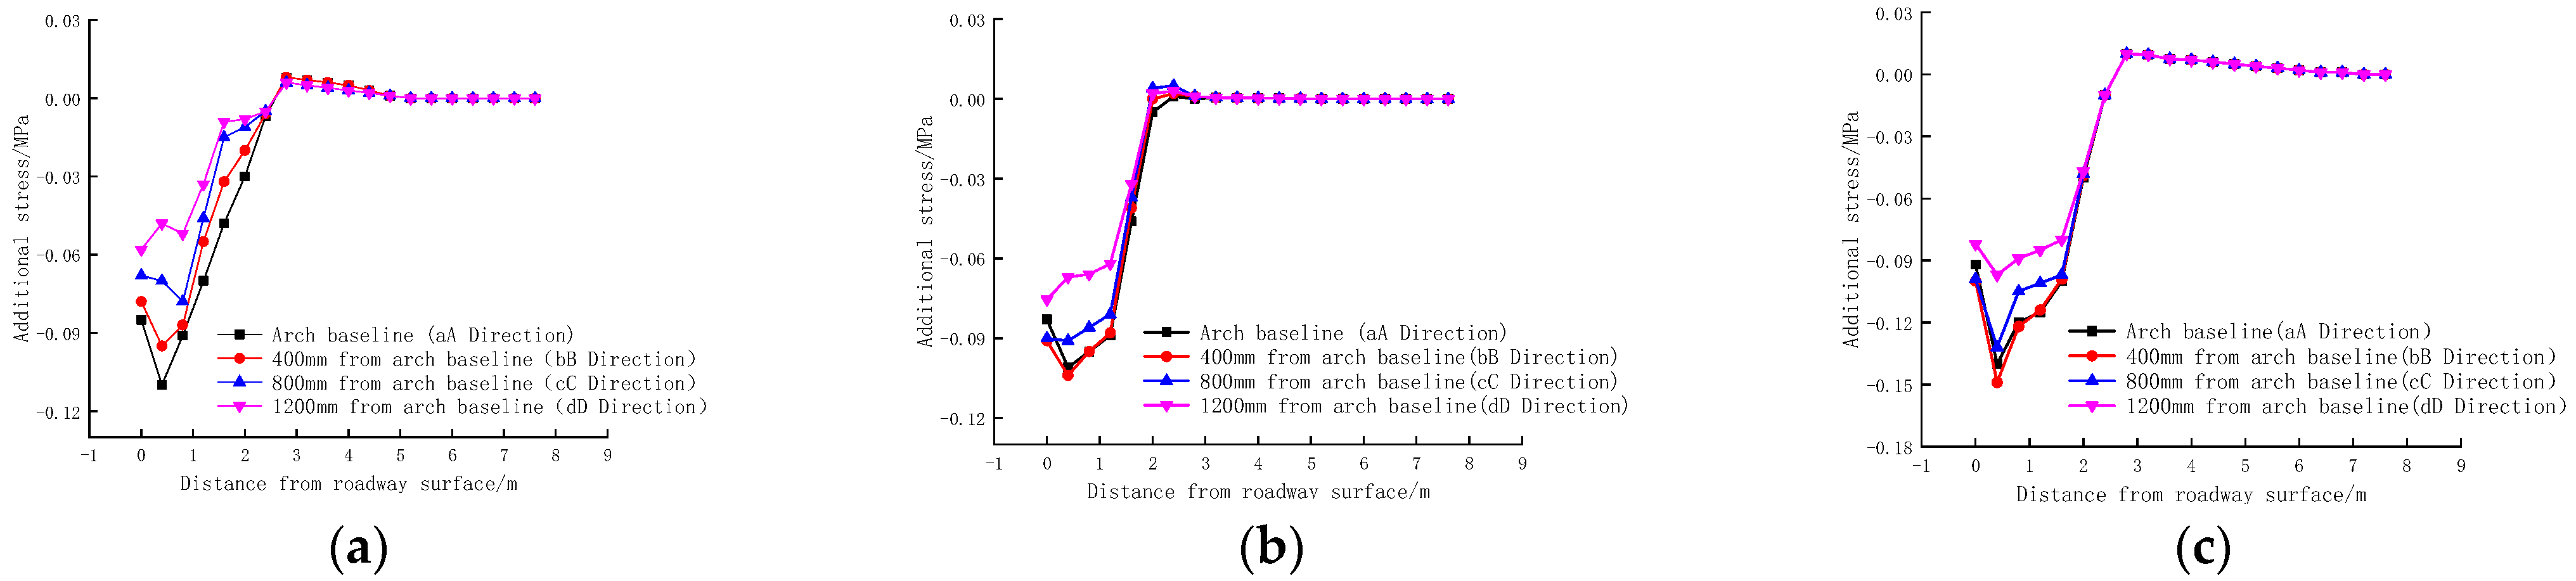
Figure 11.
Distribution of additional stress in typical parts of the surrounding rock under different bolt pre-tightening force. (a) F = 50 kN, (b) F = 70 kN, (c) F = 90 kN.
Figure 11.
Distribution of additional stress in typical parts of the surrounding rock under different bolt pre-tightening force. (a) F = 50 kN, (b) F = 70 kN, (c) F = 90 kN.
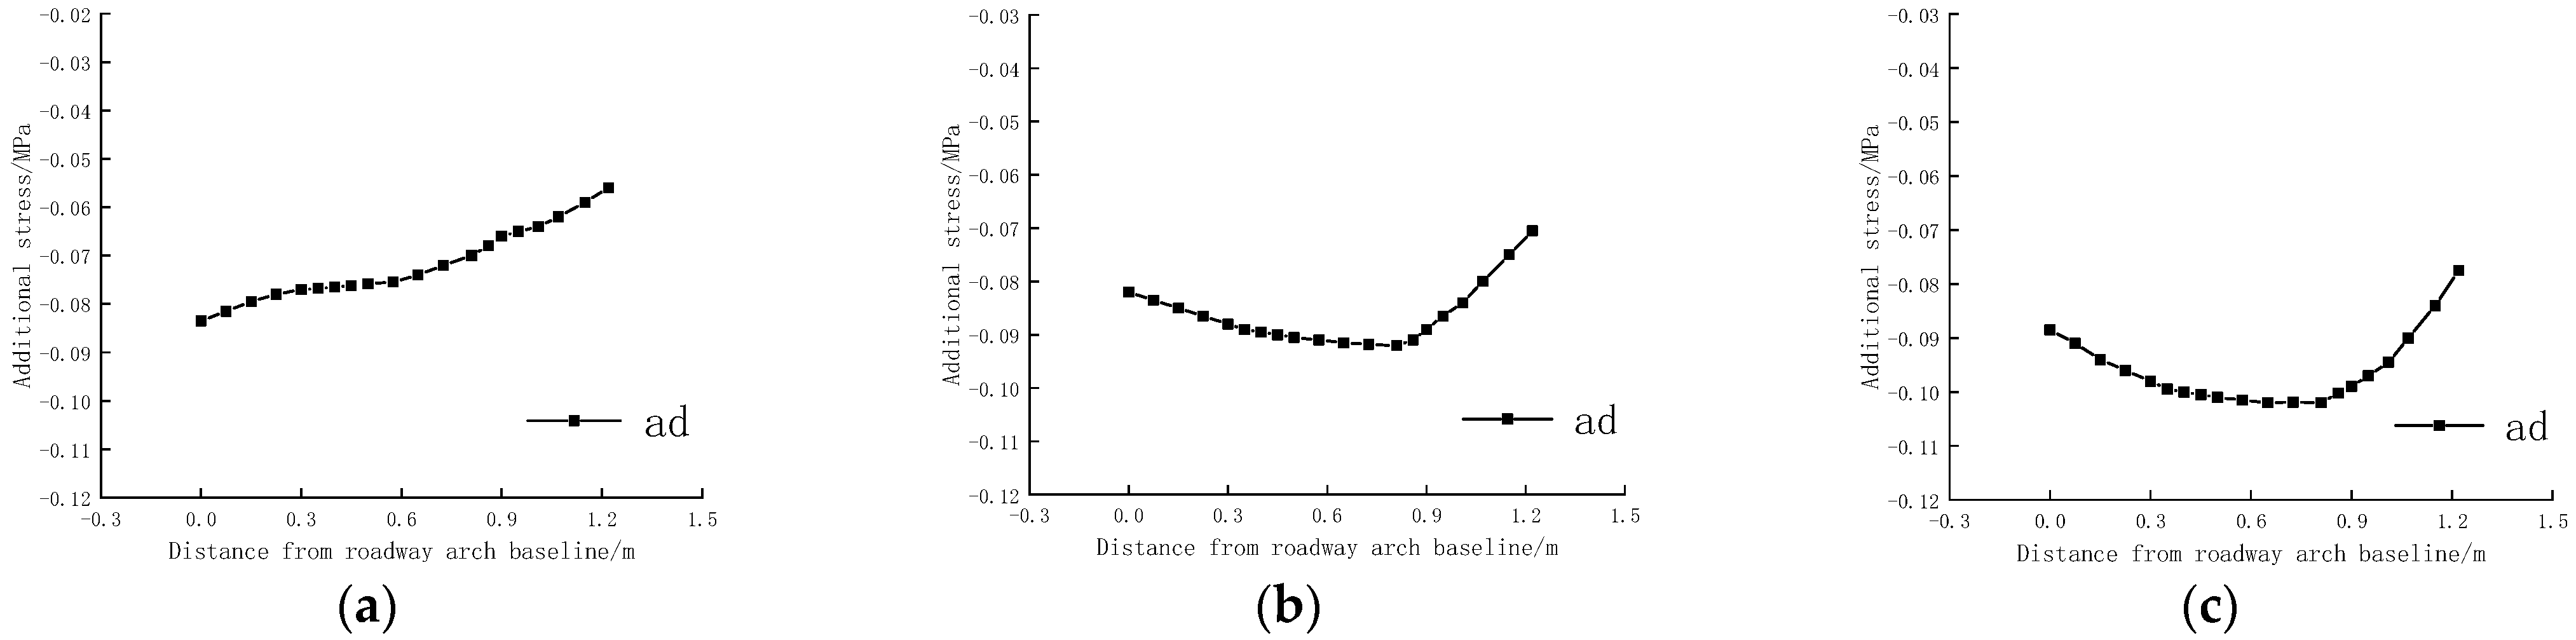
Figure 12.
Distribution of additional stress on the surface of the straight wall under different bolt pre-tightening force. (a) F = 50 kN, (b) F = 70 kN, (c) F = 90 kN.
Figure 12.
Distribution of additional stress on the surface of the straight wall under different bolt pre-tightening force. (a) F = 50 kN, (b) F = 70 kN, (c) F = 90 kN.
Figure 13.
Contours of additional stress in the surrounding rock under different bolt lengths. (a) L = 1500 mm, (b) L = 2000 mm, (c) L = 2400 mm.
Figure 13.
Contours of additional stress in the surrounding rock under different bolt lengths. (a) L = 1500 mm, (b) L = 2000 mm, (c) L = 2400 mm.
Figure 14.
Distribution of additional stress in typical parts of the surrounding rock under different bolt lengths. (a) L = 1500 mm, (b) L = 2000 mm, (c) L = 2400 mm.
Figure 14.
Distribution of additional stress in typical parts of the surrounding rock under different bolt lengths. (a) L = 1500 mm, (b) L = 2000 mm, (c) L = 2400 mm.
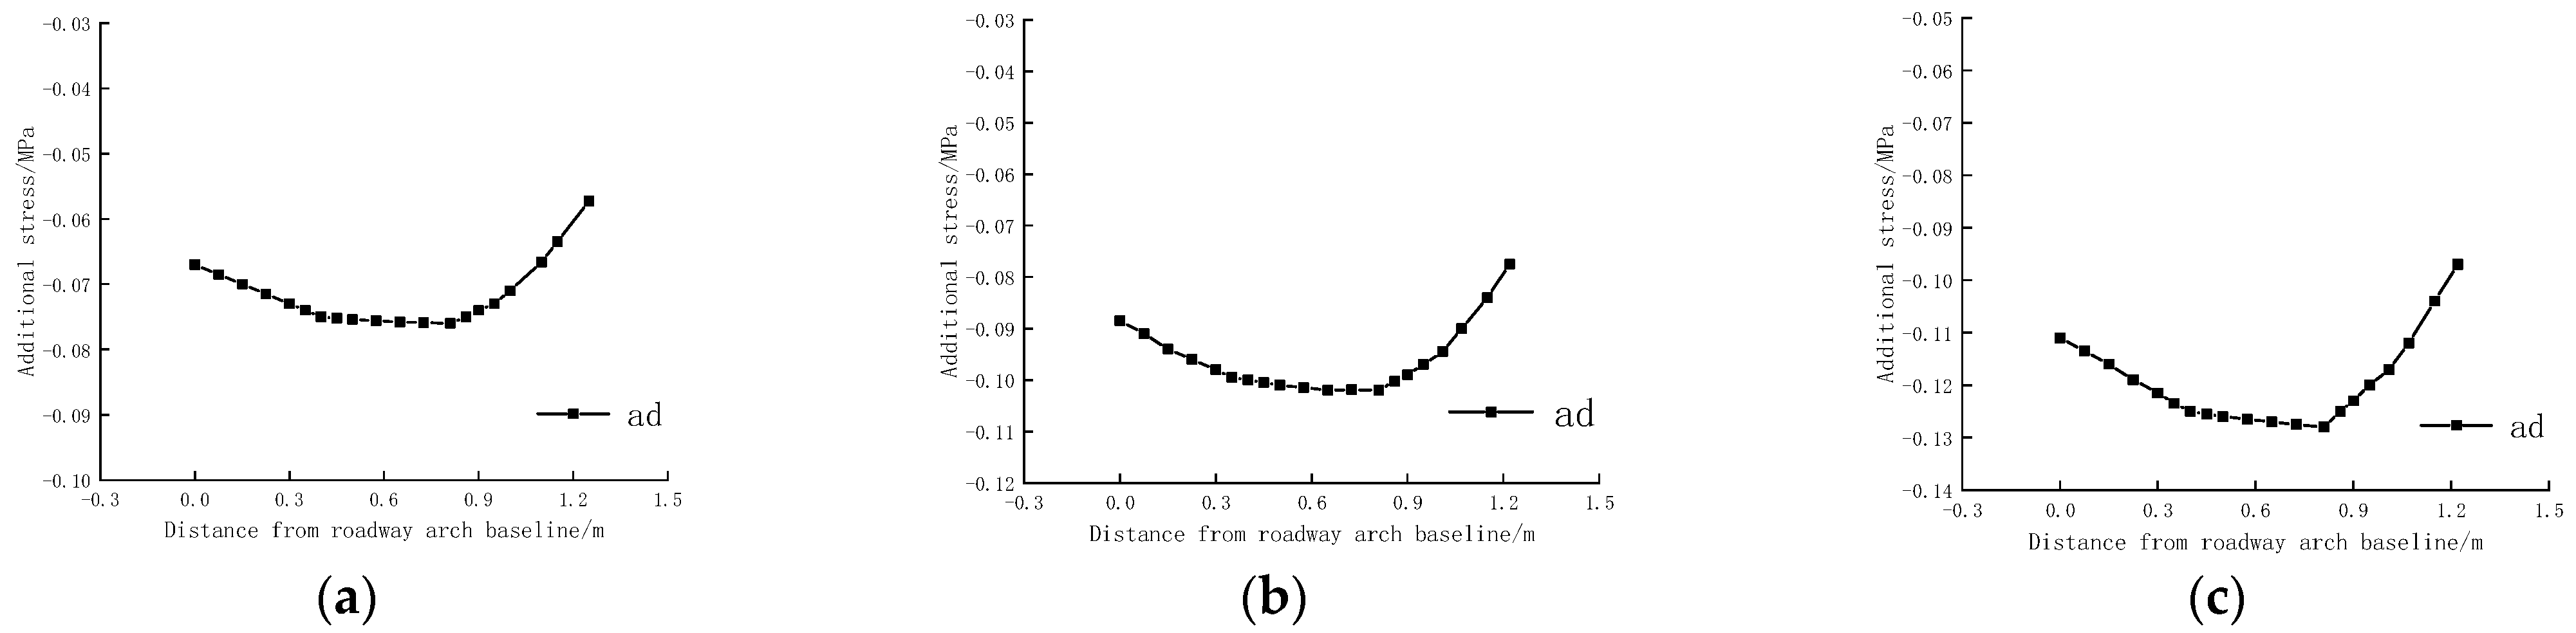
Figure 15.
Distribution of additional stress on the wall surface along the a-d direction under different bolt lengths. (a) L = 1500 mm, (b) L = 2000 mm, (c) L = 2400 mm.
Figure 15.
Distribution of additional stress on the wall surface along the a-d direction under different bolt lengths. (a) L = 1500 mm, (b) L = 2000 mm, (c) L = 2400 mm.
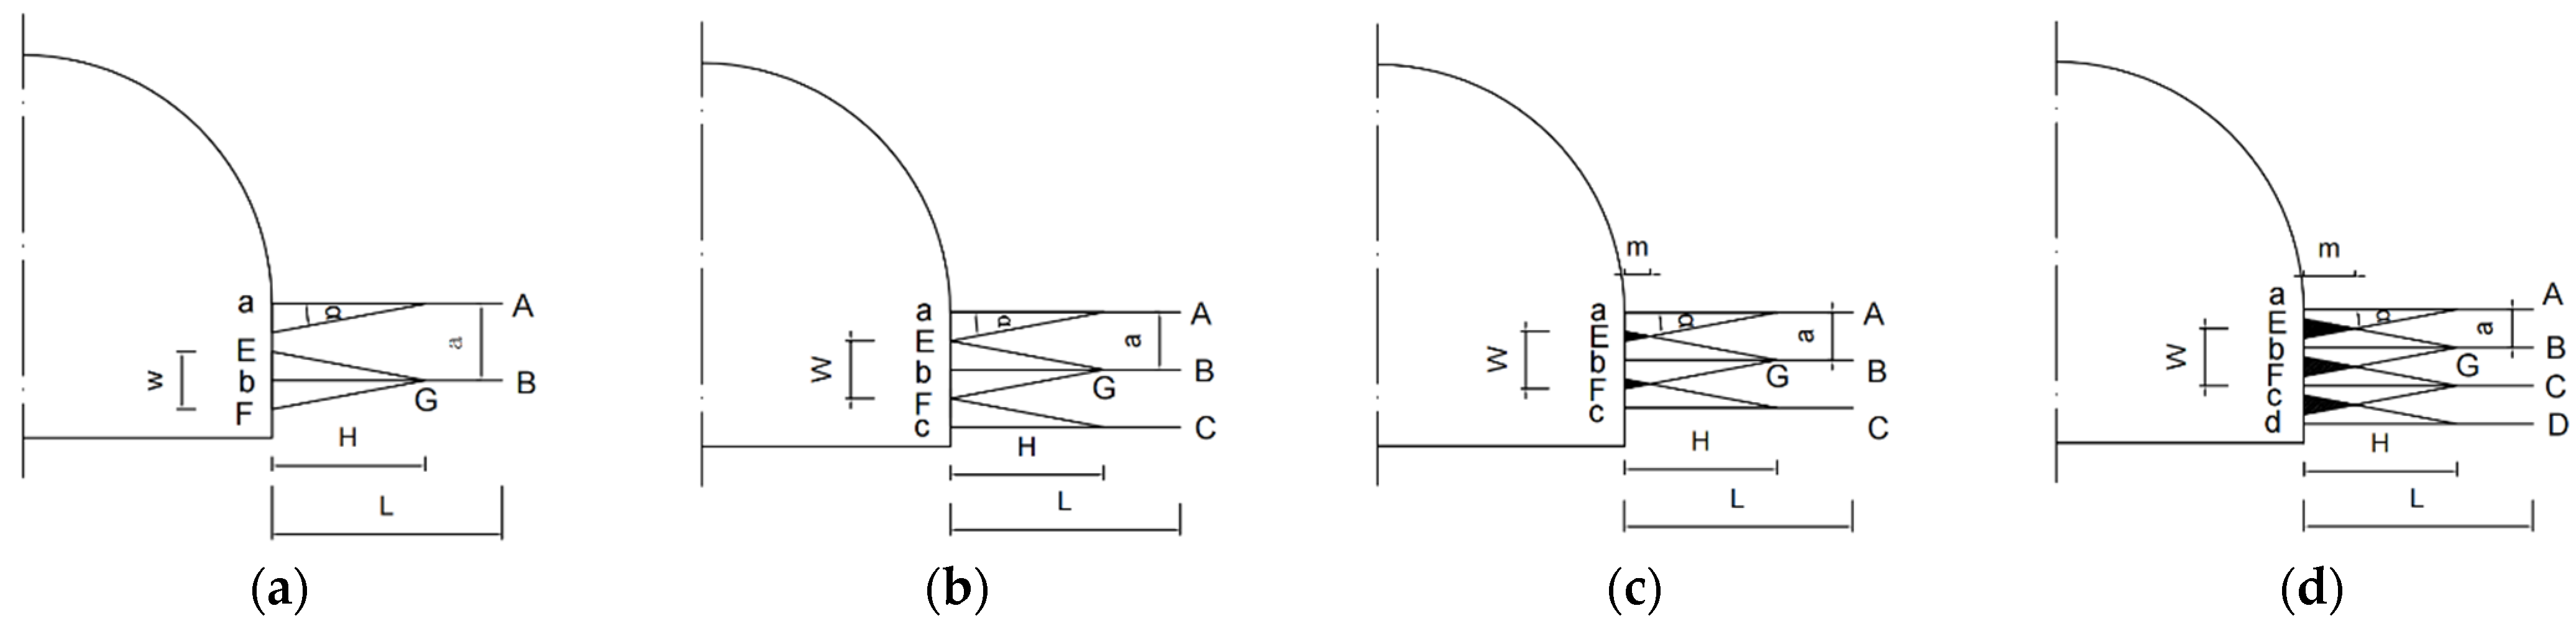
Figure 16.
Distribution and superimposition of additional compressive stresses in multiple bolts of the surrounding rock under different bolt spacing. (a) 800 mm × 800 mm, (b) 600 mm × 600 mm, (c) 500 mm × 500 mm, (d) 400 mm × 400 mm.
Figure 16.
Distribution and superimposition of additional compressive stresses in multiple bolts of the surrounding rock under different bolt spacing. (a) 800 mm × 800 mm, (b) 600 mm × 600 mm, (c) 500 mm × 500 mm, (d) 400 mm × 400 mm.
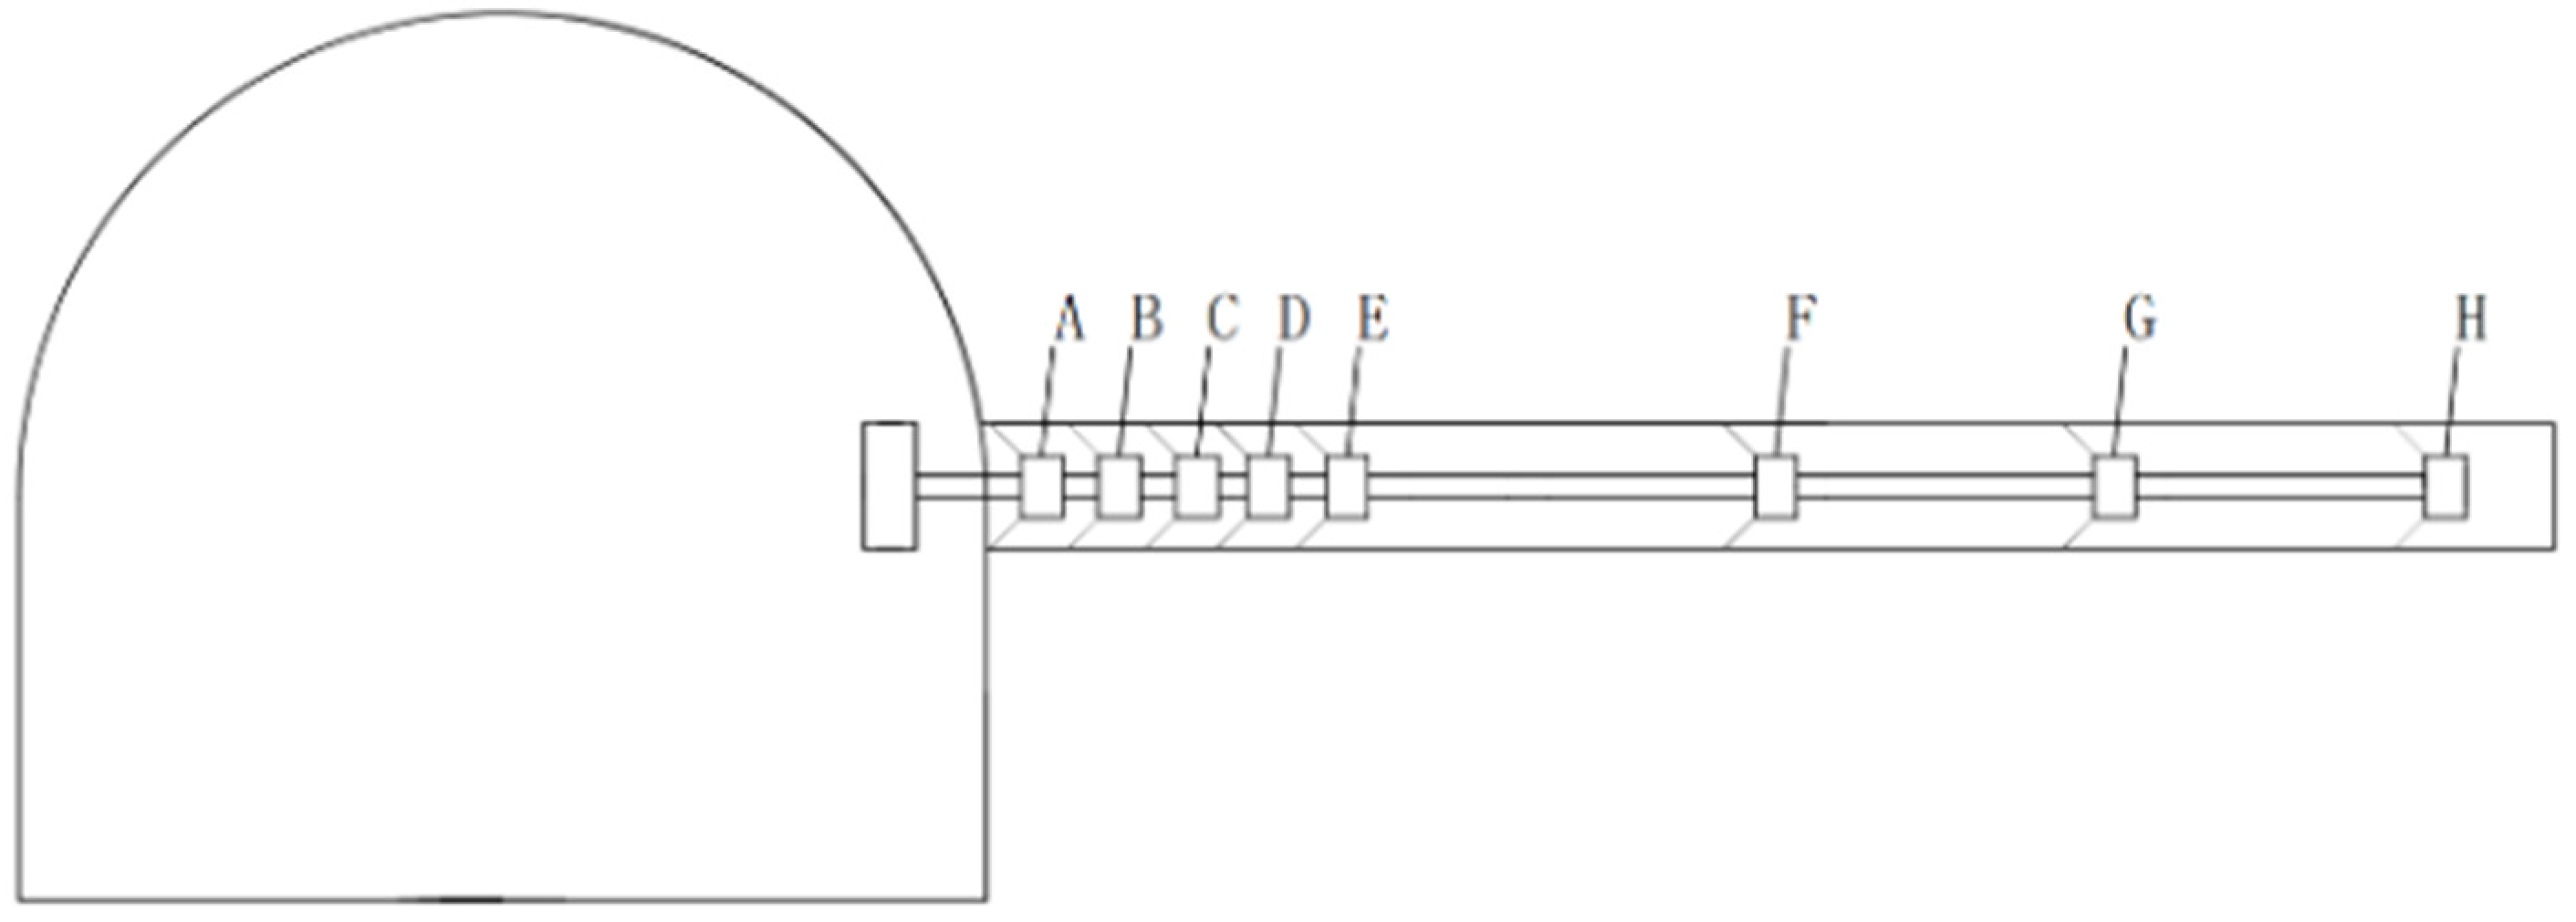
Figure 17.
Layout of multi-point displacement gauges.
Figure 17.
Layout of multi-point displacement gauges.
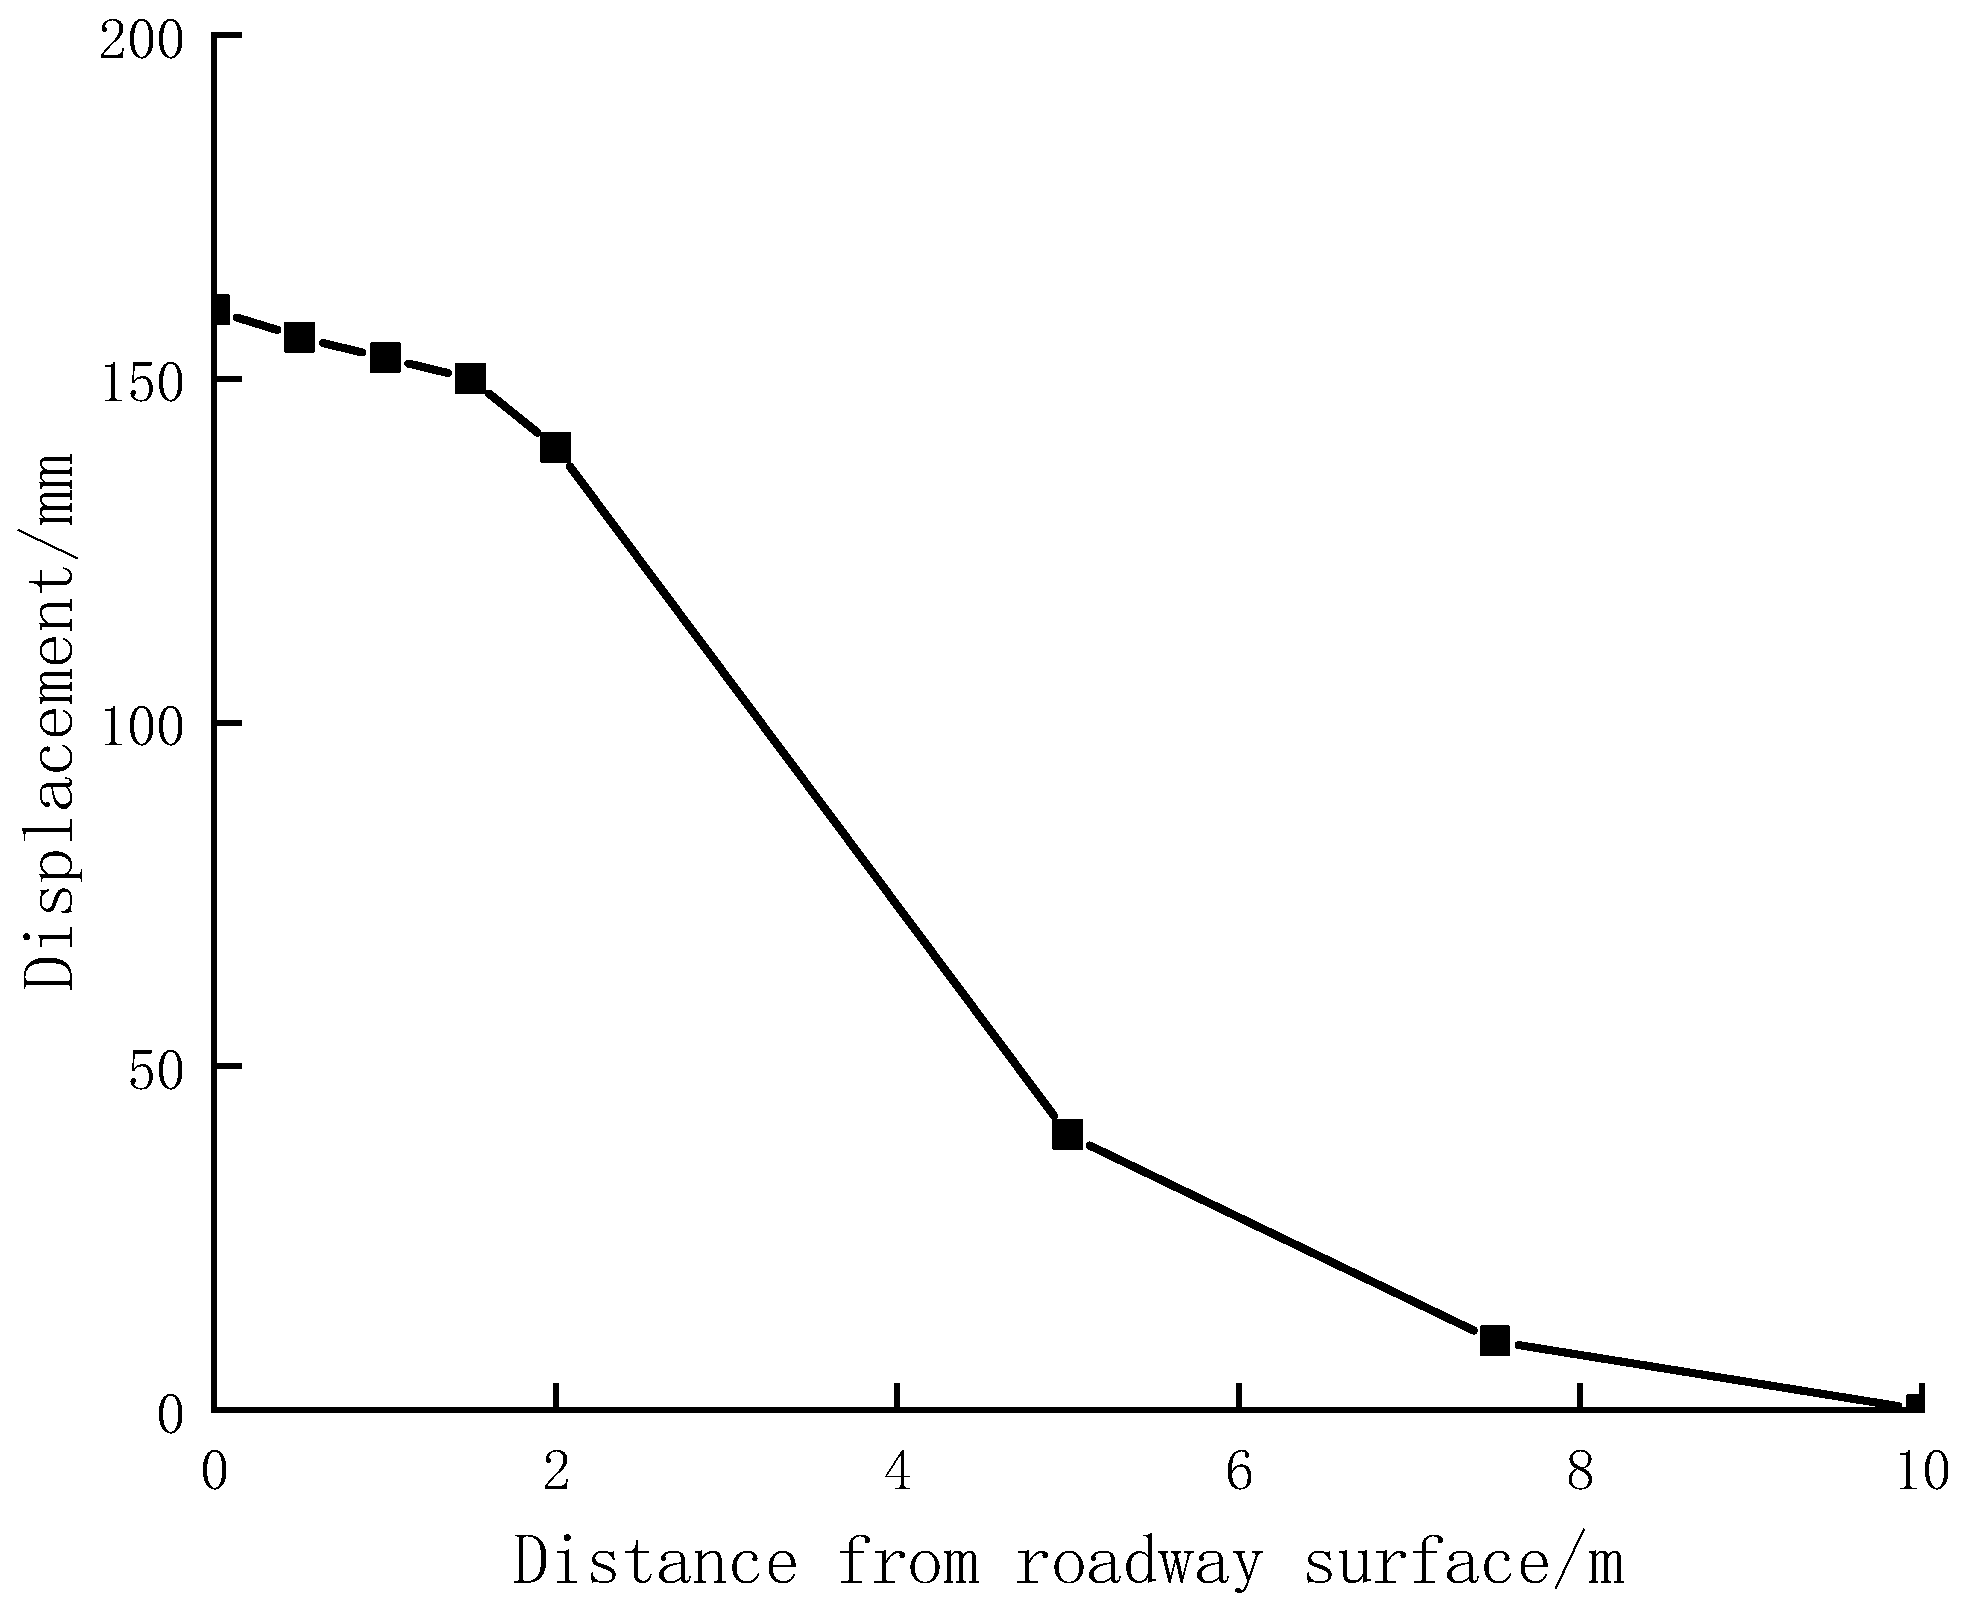
Figure 18.
Displacement of the measuring points against the distance from the roadway surface.
Figure 18.
Displacement of the measuring points against the distance from the roadway surface.
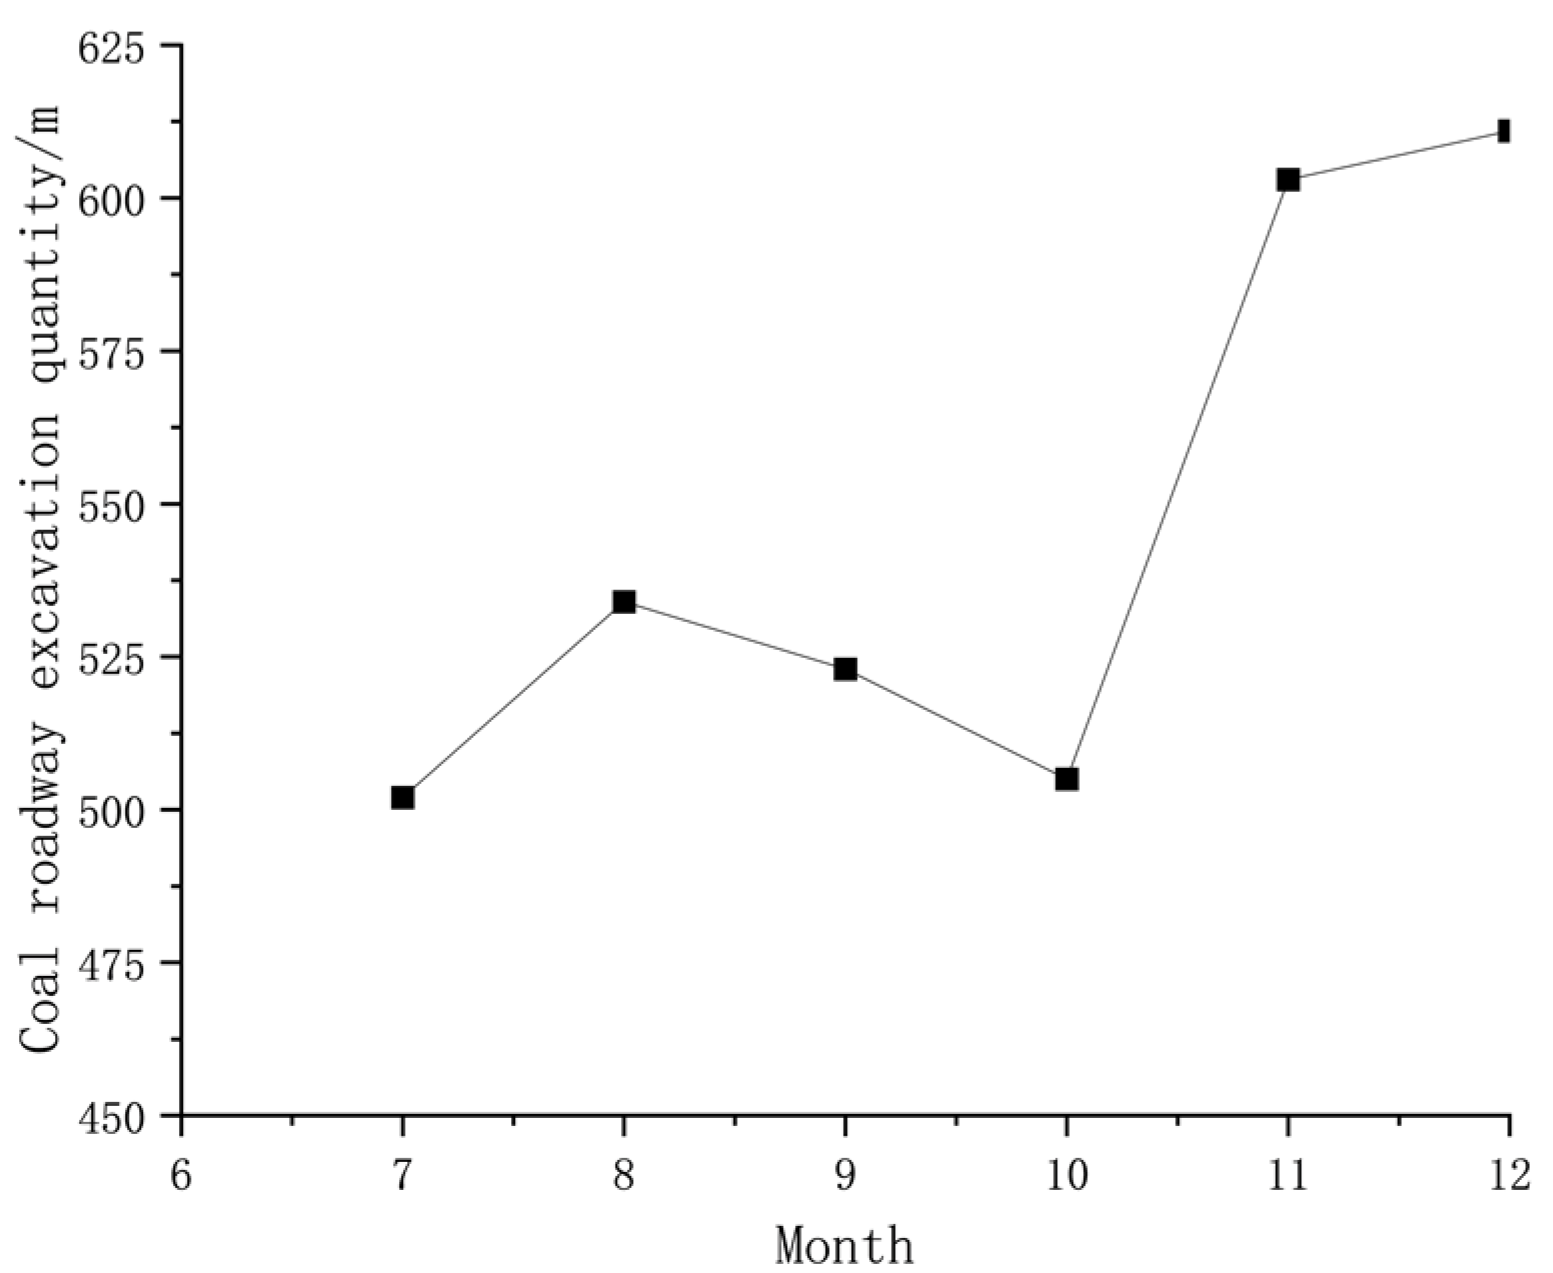
Figure 19.
July to December coal roadway excavation quantity line chart.
Figure 19.
July to December coal roadway excavation quantity line chart.
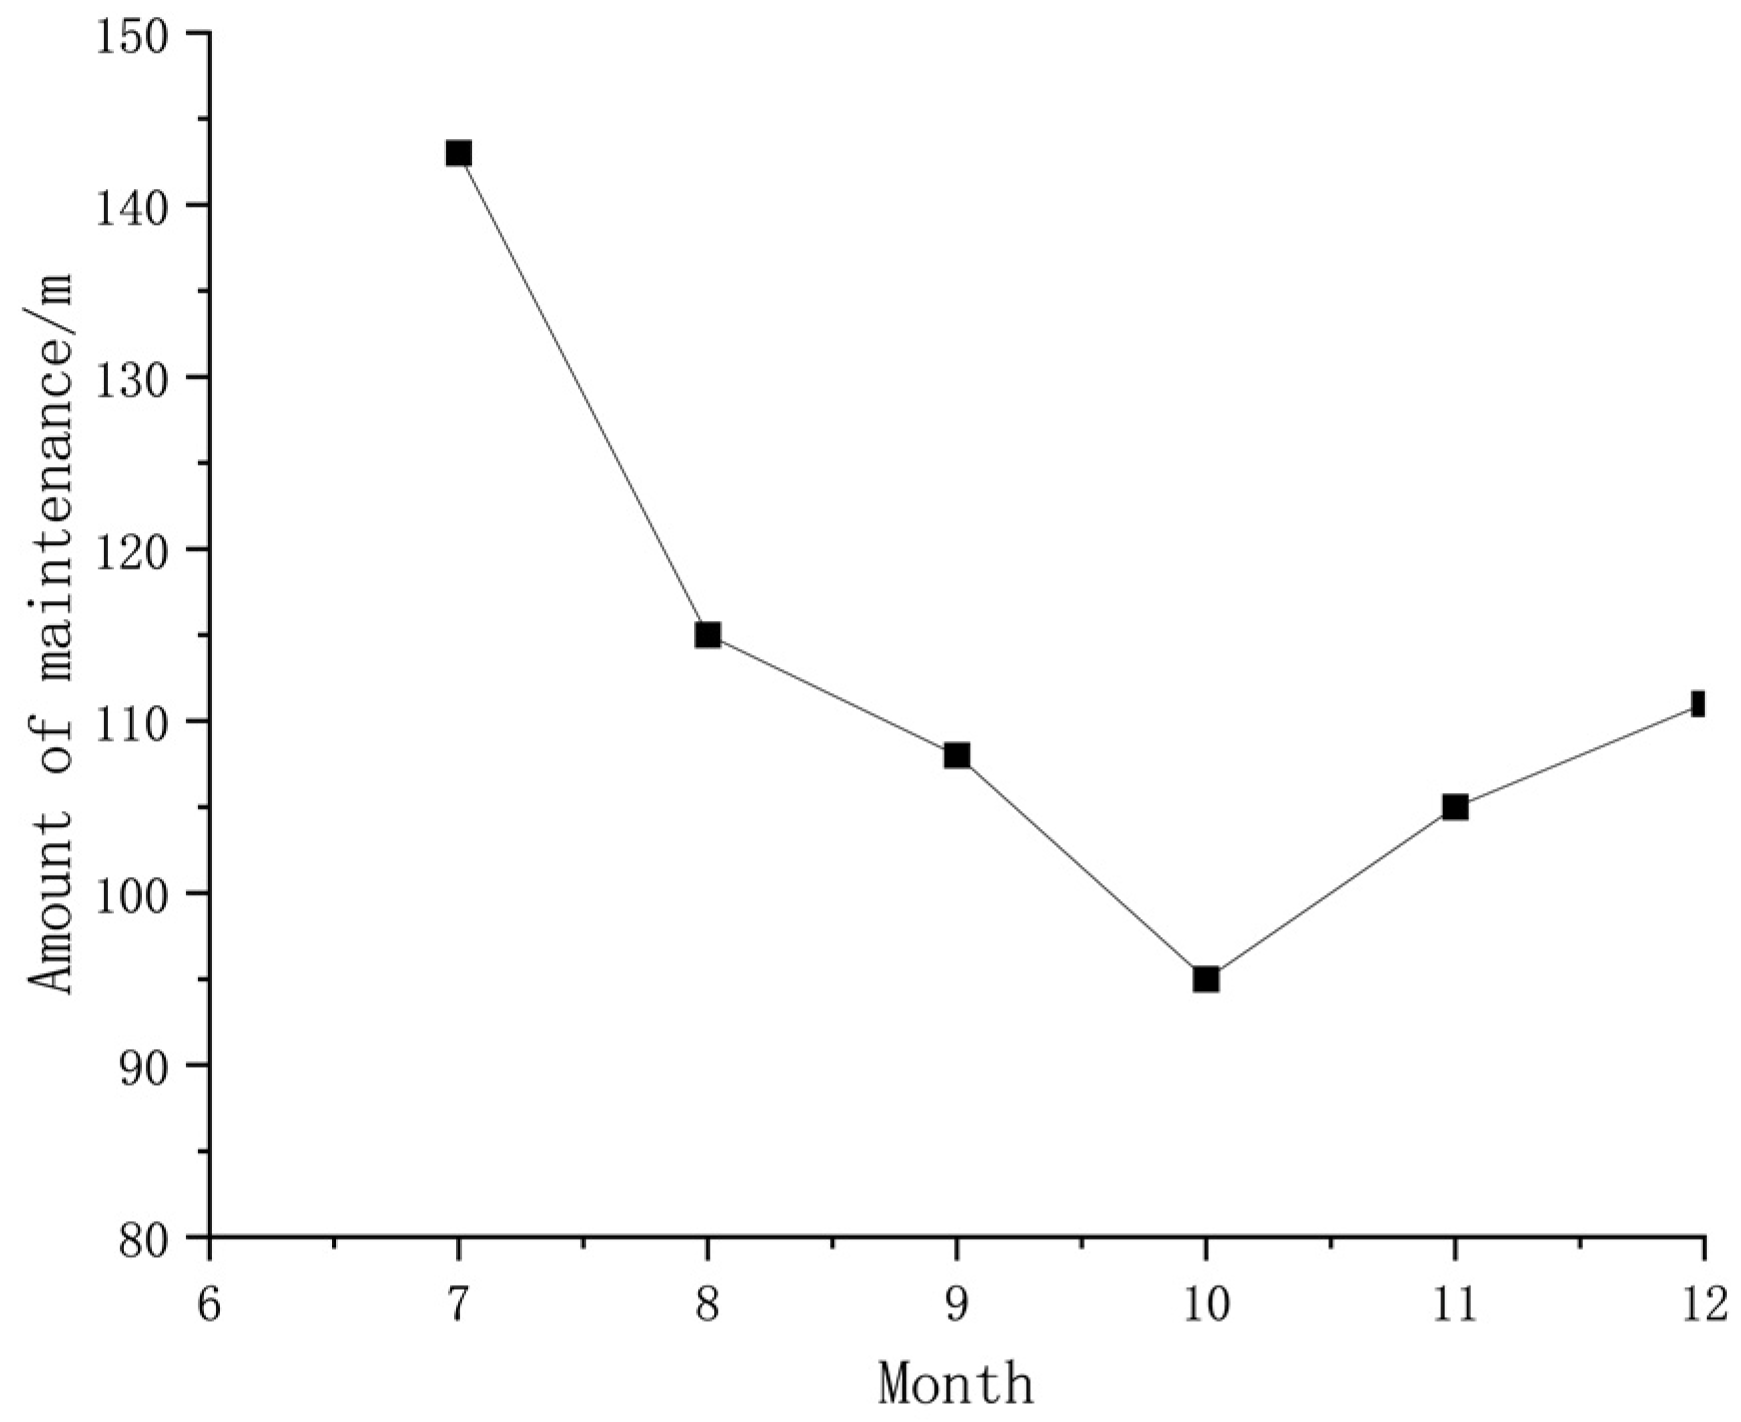
Figure 20.
Extraction roadway maintenance line chart from July to December.
Figure 20.
Extraction roadway maintenance line chart from July to December.
Table 1.
Mechanical parameters of typical coal rocks.
Table 1.
Mechanical parameters of typical coal rocks.
| Cohesion c (MPa) | Internal Friction Angle
| Poisson’s Ratio γ | Elastic Modulus E (MPa) | Shear Modulus G (MPa) |
|---|
| 0.5 | 16 | 0.36 | 952 | 350 |
Table 2.
Distribution of the additional compressive stress in the surrounding rock of the roadway with different bolt spacing.
Table 2.
Distribution of the additional compressive stress in the surrounding rock of the roadway with different bolt spacing.
| Bolt Spacing a × b (mm) | Uniform Distribution Range (mm)
| Distribution Interval (Mpa)
| Distribution Interval (Mpa)
|
|---|
| aA Direction | bB Direction | cC Direction | dD Direction |
|---|
| 800 × 800 | 1600 | −0.071~−0.078 | −0.061~−0.073 | - | - | −0.021~−0.076 |
| 600 × 600 | 1600 | −0.08~−0.105 | −0.079~−0.103 | −0.06~−0.075 | - | −0.052~−0.078 |
| 500 × 500 | 1600 | −0.087~−0.116 | −0.081~−0.113 | −0.07~−0.095 | - | −0.078~−0.089 |
| 400 × 400 | 1600 | −0.092~−0.115 | −0.099~−0.149 | −0.097~−0.132 | −0.08~−0.097 | −0.078~−0.102 |
Table 3.
Distribution of the additional compressive stress in the surrounding rock of the roadway with different bolt pre-tightening force.
Table 3.
Distribution of the additional compressive stress in the surrounding rock of the roadway with different bolt pre-tightening force.
| Bolt Pre-Tightening Force F (kN) | Uniform Distribution Range (mm)
| Distribution Interval (Mpa)
| Distribution Interval (Mpa)
|
|---|
| aA Direction | bB Direction | cC Direction | dD Direction |
|---|
| 50 | 1600 | −0.07~−0.098 | −0.079~−0.11 | −0.075~−0.095 | −0.055~−0.07 | −0.057~−0.076 |
| 70 | 1600 | −0.092~−0.115 | −0.099~−0.149 | −0.097~−0.132 | −0.08~−0.097 | −0.078~−0.102 |
| 90 | 1600 | −0.115~−0.18 | −0.129~−0.192 | −0.124~−0.17 | −0.097~−0.098 | −0.097~−0.128 |
Table 4.
Distribution of the additional compressive stress in the surrounding rock of the roadway with different bolt length.
Table 4.
Distribution of the additional compressive stress in the surrounding rock of the roadway with different bolt length.
| Bolt Length L (mm) | Uniform Distribution Range (mm)
| Distribution Interval (Mpa)
| Distribution Interval (Mpa)
|
|---|
| aA Direction | bB Direction | cC Direction | dD Direction |
|---|
| 1500 | 800 | −0.085~−0.11 | −0.078~−0.095 | −0.068~−0.078 | −0.048~−0.058 | −0.056~−0.084 |
| 2000 | 1200 | −0.083~−0.101 | −0.088~−0.104 | −0.081~−0.091 | −0.062~−0.076 | −0.071~−0.092 |
| 2400 | 1600 | −0.092~−0.115 | −0.099~−0.149 | −0.097~−0.132 | −0.08~−0.097 | −0.078~−0.102 |
Table 5.
Pre-stressed bolt compression arch thickness.
Table 5.
Pre-stressed bolt compression arch thickness.
| Support Parameters of the Bolt | Thickness of Pre-Stressed Bolt Compression Arch (mm) |
|---|
| 70 kN, a × b = 800 mm × 800 mm, L = 2400 mm | No arch is formed |
| 70 kN, a × b = 600 mm × 600 mm, L = 2400 mm | 0 |
| 70 kN, a × b = 500 mm × 500 mm, L = 2400 mm | 266.67 |
| 70 kN, a × b = 400 mm × 400 mm, L = 2400 mm | 533.33 |
| 70 kN, a × b = 400 mm × 400 mm, L = 1500 mm | 266.67 |
| 70 kN, a × b = 400 mm × 400 mm, L = 2000 mm | 400 |
Table 6.
Strength and cohesion of the surrounding rock in the compression arch.
Table 6.
Strength and cohesion of the surrounding rock in the compression arch.
| Support Parameters of Bolt | (MPa) | (MPa) | (MPa) |
|---|
| 70 kN, a × b = 800 mm × 800 mm, L = 2400 mm | - | - | - |
| 70 kN, a × b = 600 mm × 600 mm, L = 2400 mm | - | - | - |
| 70 kN, a × b = 500 mm × 500 mm, L = 2400 mm | −0.092 | −1.489 | 0.551 |
| 70 kN, a × b = 400 mm × 400 mm, L = 2400 mm | −0.117 | −1.533 | 0.567 |
| 50 kN, a × b = 400 mm × 400 mm, L = 2400 mm | −0.088 | −1.482 | 0.548 |
| 90 kN, a × b = 400 mm × 400 mm, L = 2400 mm | −0.149 | −1.589 | 0.588 |
| 70 kN, a × b = 400 mm × 400 mm, L = 1500 mm | 0.087 | −1.48 | 0.547 |
| 70 kN, a × b = 400 mm × 400 mm, L = 2000 mm | −0.095 | −1.494 | 0.553 |


