1. Introduction
Worldwide, great efforts are being made to limit climate change and the interlinked rise in temperature to a maximum of 1.5 to 2 °C. By this, the impact of the man-made greenhouse gas effect shall be reduced or at least be under control. In 2019, the total primary energy consumption worldwide was more than 606,000,000 TJ [
1], of which only 14% comprised renewable sources such as biofuels and waste, hydro-energy, and other renewables. The majority was supplied by crude oil (33%), coal (27%), and natural gas (23%). This highlights the demand for a radical change and justifies all efforts and requirements.
In the EU-27, policy initiatives are summarized within the Green Deal [
2], a package “aiming to set the EU on the path to a green transition” and achieving climate neutrality by 2050. It is essential to address the challenges through a holistic and cross-sectoral approach including energy, transport, industry, agriculture, and finally financing. Climate change is a challenge in terms of investments but can be a business case for all involved stakeholders. For the industrial sector, the strategies (i) biodiversity for 2030, (ii) farm to fork, (iii) European industry, (iv) circular economy action plan (v) clean, affordable, and secure energy, and (vi) EU chemicals strategy for sustainability are the most important ones. These build upon the Energy Efficiency Directive including the Energy Service Directive 2006/32/EG, the core document of the Energy Efficiency Directive 2012/27/EU, and its amendment 2018/2002 [
3]. In 2012, the EU initiated measures to achieve annual energy savings of more than 1.5%, significant renovations leading to at least 3% increased energy efficiency in buildings owned and occupied by central governments, obligated yearly energy savings of 1.5% by energy companies, and mandatory energy audits in large companies at least every 4 years.
Within the amendment in 2018, the energy efficiency target was increased to at least 32.5% by 2030. The allowed energy consumption for 2030 was defined to be less than 1128 Mtoe of primary energy and less than 846 Mtoe of final energy. In the past several decades, efforts to increase the energy efficiency and integration of renewable energy were mainly focused on buildings and the mobility sector, while the industrial sector was not addressed in a proper way, though the industry sector in 2020 accounted for 26.1% of the total final energy consumption in EU [
4]. This situation has been improved with the Energy Efficiency Directive coming into effect, which is obviously necessary, keeping in mind that the industrial sector stands for about 27% of the final energy consumption in the EU-27 in 2021 [
5]. Some countries even have a significantly higher share of energy consumed by this sector, e.g., Norway, with about 35%. In the industrial sector, the final energy supply is still mainly fossil fuel-driven. For the EU-27, natural gas represents 32.7% of the final energy consumption in the sector, being at the same level as electricity, considering the fact that fossil fuels play an important role in the generation of electricity. Of course, these figures vary significantly looking at different countries. Renewable energy is more important in countries such as Austria and especially in Scandinavian countries such as Sweden or Finland.
Regarding absolute figures instead of relative evaluation criteria, Germany consumes by far the most energy, with 2,338,979 TJ in the industrial sector in 2021, followed by France with 1,139,568 TJ [
4]. This is caused by the dominance of energy-intensive sectors (energy costs stand for more than 30 to 40% of the total product costs) such as the production of chemicals, pulp and paper, non-metallic mineral products, and iron and steel. Besides energy-extensive sectors, the food and beverage industry, with 1,147,000 TJ [
4] (11.9% of total industrial energy consumption in 2020), consumes a significant share of energy. Large amounts of energy consumed are allocated to thermal energy demand and are still provided via fossil fuels [
6].
The difference between intensive and extensive sectors, besides the energy demand factor, is the structure of the involved companies. In the intensive sectors, many large companies represent most of the industry, while small and medium companies are dominant in the other sectors. Large companies, consuming a lot of energy, dedicate specific resources (personal) to this topic, leading to a structural approach of energy efficiency measures and the integration of renewable energy, including available investments enabled by top management. Small and medium companies, totaling 290,000 SMEs in the EU’s food industry [
7], often do not have these resources and, by this, struggle with a lack of know-how and available tools and methodologies. The main topic addressed in this research is the optimized design and operation of the energy system, combining demand and supply, of the food industry toward enabling a 100% substitution of fossil energy carriers. The applied methods are new in this field.
2. Status Quo
Typical for industry is a simple energy supply, based on fossil fuels and electricity from the grid. To ensure cost-efficient and reliable energy supply in the future, industry is heading more and more towards hybridization of their energy systems by means of fulfilling their energy demand via multiple paths. Electricity can be drawn from the grid, with an on-site CHP unit or volatile decentralized technologies (photovoltaics, wind). Instead of fossil fuels (e.g., gas), renewable solar thermal and heat pump technologies can be integrated for heat supply. This leads to higher fluctuations in both energy supply and demand and increases the need to adopt energy consumption measures towards more flexible demand. Here, demand- and supply-side management are two possible approaches.
Demand-side management (DSM) for industry includes all demand-side measures that influence the type and level of energy demand. These measures can be divided into four categories: energy efficiency (EE), time of use (TOU), demand response (DR), and spinning reserve (SR) [
8] While EE aims for permanently reducing demand for energy, SR, DR, and TOU focus on the time-dependent operational level [
9]. The concept of DSM in industry is not new. Nevertheless, challenges remain for broader adoption, including a lack of communication infrastructure, limited understanding of benefits, on-site complexity, and an inadequate market structure with insufficient incentives [
10]. Supply-side management (SSM) includes measures to ensure energy generation, transmission, and distribution in an efficient and reliable manner. SSM often refers to utility companies. Measures include the exploration of ways to alter load profiles to minimize the utilization of the least efficient generating equipment, while maximizing the use of high-efficiency equipment [
11].
Typically, industry concentrates on DSM techniques, but exploring SSM options, like on-site energy generation via renewable energy sources like biomass, soar thermal, etc., is worthwhile. In the literature, SSM and DSM are mainly associated with electricity [
12]. Integrated approaches taking all energy carriers into account are rare. Methodologies for combining DSM and SSM and including different energy sources are totally missing.
3. Materials and Methods
The content of this paper derives from work of AEE INTEC elaborated within the framework of the projects “CORES—Integration of combined renewable energy systems for industry” and “DSM_Opt—Demand Side Management: Operation Optimization of Industrial Energy Systems”.
Within this paper, a standardized methodology is proposed as a structural optimization approach to realize energy efficiency measures and the integration of renewable energy by combining the supply side (SS) and demand side (DS) of industrial processes—see
Figure 1. The approach is described in the following chapters and is generally valid for all industrial sectors. The showcase in Chapter 4 is presented based on examples from the food industry.
3.1. Data Acquisition and Evaluation of the Status Quo (SS and DS)
To guide the industry on its way to decarbonization, first, data acquisition and evaluation of the status quo represent an important step that SS as well as DS have in common. Easily applicable methodologies and comprehensive tools are necessary and must be based on reliable data describing the production and demand of energy, both their quantity and quality (energy carrier and temperature). In Europe, the DIN EN 16247 standard [
13], defines in detail how an energy audit shall be done on a high-quality level, who is allowed to do this, and what is necessary to fulfil all requirements from a legal perspective. Furthermore, the international standard ISO 50001 [
14] on energy management systems describes comparable process steps and ensures that worldwide energy service providers and companies follow the same standards. Basically, the process starts with acquiring energy- and production-relevant data over a representative production period. The standards mainly focus on the energy supply side (utilities), but a match with the demand side is helpful in identifying optimization measures on this level. This is the challenging and tricky part of this approach, as in most cases, detailed information on the energy demand, load profiles over a certain period, and the allocation of the demand to at least the majority of relevant production steps are unavailable. As mentioned above, large companies have already achieved a great deal in data acquisition but are also often still lacking these data. For small and medium companies, the challenge is significantly higher. Based on the available, measured, calculated, and estimated data, a detailed evaluation of the status quo is performed. The standards, as well as the Energy Efficiency Directive so far (status as of April 2023), do not require requests for any optimization measure on the levels of energy efficiency or decarbonization of the energy supply from industrial companies themselves. But the idea is that, with the data available, obvious optimization potentials are identified, leading to an automatic implementation of these based on the economic, technical, and ecologic criteria applied.
3.2. Demand-Side Management
3.2.1. Optimization at the Process Level
After completing the first two steps, namely the acquisition of data and evaluation of the status quo, the optimization process starts by zooming in on the demand side. Within demand-side management (DSM), a series of techniques and measures exist aimed at modifying the demand-side energy consumption pattern to enable and better foster efficiencies and operations in energy systems. The first consideration to be made is energy efficiency measures (“efficiency is the first fuel”). In simple terms, implementing energy efficiency measures means using less energy to perform the same task, which takes many forms in industrial food production. Taking a step back to the supply level, well-known and implemented measures focus mainly on utilities: improved insulation and tighter seals on doors of cooling systems, minimizing leakage in compressed air systems, and insulation of boilers. Furthermore, there are methods from the field of digitalization geared towards energy efficiency. Examples include automated production planning to reduce energy losses or intelligent control algorithms for machinery and production plants. Artificial intelligence shows great potential to aid in achieving energy efficiency by performing energy management tasks in an automated manner and exploiting its strengths concerning foresight and learning [
15]. Consequent to these simple and easily realizable no-regret measures, the system is optimized on the process level: technologies and process parameters are evaluated from the perspectives of energy demand and, consequently, technological optimization via the implementation of efficient technologies; increasing process efficiency helps to reduce the energy demand. Simple examples are reductions in process temperatures or necessary supply medium flows, operating the processes in full load, and avoiding partial-load phases. In the food industry, product quality, especially taste, is of utmost importance, which often causes natural reluctance to implement new processing technologies. Tradition and recipes passed down over generations are generally favored new and upcoming technology. But recently addressed approaches are focusing on the demand load profiles themselves. Examples are optimized load management of all processes, avoiding peak load demand at certain times and considering production planning. Cascade control, comprising both time and temperature, offers a constant demand with a positive impact on the supply of utilities. Additionally, the potential flexibility of processes in terms of production times and operated process parameters are considered.
3.2.2. Optimization at the System Level
The next step is to look at energy optimization from a systemic point of view, where the focus is on excess heat recovery and usage. In the industrial sector, the potential for this application is relevant and achieves energy savings of at least 10% but is, in most cases, significantly more, as previous projects have proven [
16,
17,
18,
19]. Excess heat sources come from processes (excess heat bound to product, water, air, etc.) as well from utilities (boilers, chillers, compressors, etc.). It is obvious that using excess heat from a process leads to a lower demand to be supplied by utilities, resulting in a lower operation mode. The consequence is a reduced available excess heat stream from utilities, which must be considered in the planning of these measures and is the key for optimized systems. The above-mentioned potential of between 10 and 25% savings by process and system optimization is based on experiences from more than 650 detailed energy audits, fulfilling acceptable economic criteria with payback periods of less than 5 years. Of course, this potential is reduced in case companies have already implemented several measures in the last years.
3.2.3. Optimization Load Profile (DS)
The last step towards optimizing load profiles from the demand-side perspective (and, by this, achieving savings through optimized operation utilities) is the implementation of demand response systems focusing on optimal interaction with energy supply systems. Applied strategies provide the flexibility needed to handle volatile energy sources while reducing the strains on energy infrastructure (e.g., electricity grid) by optimal scheduling in industrial plants. As an additional advantage, the total energy consumption and the required storage capacities can be reduced.
3.3. Supply-Side Management
3.3.1. Selection of Technology Configuration for Renewable Supply Systems
At this point, the focus switches to the supply side, where the fossil fuel-driven supply systems mainly applied in industry up until now can be optimized, meaning both the (i) optimization of the performance of existing utilities (boilers, chillers, compressors) and (ii) the substitution of these utilities from an exergetic point of view and by considering renewable technologies and their potential reasonable combination. The available and state-of-the-art technologies include solar thermal (SHIP—solar heat for industrial processes), heat pump, biomass, biogas, geothermal, PV, and PVT technologies, which all are well described and evaluated regarding their potentials in Austrian national and European projects but also in international projects including relevant tasks in IEA TCPs. As the energy demand of processes and the availability of renewable energy carriers often do not match in terms of time and availability, it is obvious that storages are dominant in setting carbon-free supply systems. A tailor-made approach combines different renewable technologies such as excess heat, heat pump (supplied by PV), PVT, and solar thermal (connected via storage) technologies as shown in the Austrian-funded project CORES. By this, the advantages of single technologies are combined and even increased, while disadvantages such as temporal/seasonal availabilities or long payback times are significantly reduced. The optimized design and operation of such systems represent the following challenges: (i) size/capacity of each technology, (ii) selection of the most feasible type of one technology matching perfectly with the others, (iii) tailor-made control strategies increasing the advantages of each technology, and (iv) the optimized link of the supply technologies to the demand profiles including potential changes with no negative impact on the product quality or productivity of the company.
3.3.2. Simulation, Optimization, and Validation
For combining technologies, a hydraulic schema of different technology configurations is defined at a conceptual level, which is the basis for building up promising energy concepts in modeling platforms like Modelica (
https://modelica.org/ (accessed on 23 May 2023)). Single-technology models from open-source and/or commercial libraries and self-developed models can be combined in the setup of energy supply systems based on defined specific configurations.
The models are used for parameter studies to simulate and evaluate system configurations. The main design (e.g., installation sizes of single technologies) and control parameters (e.g., mass flow rates) are varied in simulations over the production period of at least one year. The number of parameters to be considered depends on each specific energy concept. The parameter ranges are defined reasonably based on known constraints (e.g., limited available surface for solar technologies like ST/PV/PVT; the HP nominal power is limited by process requirements, i.e., load and temperatures). Methodologies like Latin Hypercube Sampling ([
20]) can be used to guarantee an even distribution of the samples over the high-dimensional parameter space and sufficiently reflect the true underlying distribution.
To obtain optimum energy supply systems, evaluation and validation of results based on key performance indicators (KPIs) are recommended. KPIs include parameters like share of renewables, emissions of CO2 equivalents, yearly cost and energy savings (defined as the difference between yearly costs of the case considered and a reference case where, e.g., gas boilers, merely produce heat), and a calculation of levelized cost of heat. Furthermore, the list of simulation runs (parameter sets) and main simulation results (KPIs) can be used to train a Gaussian Process Emulator of the model. The resulting emulator predicts simulation results in a very time-efficient manner and, hence, facilitates an extensive global sensitivity analysis to, in the end, define the optimum supply system.
3.3.3. Optimized Control Strategy
The parameter study and sensitivity analysis are the basis for discussions and further concretizations of the most feasible and optimal energy concept for the industry. On one side, the results of the parameter study are analyzed to find out which energy concepts and specific designs are performing better (based on the KPIs defined). On the other side, the sensitivity analysis provides information about the impact of single parameters on each KPI. It, thus, aids in the decision of which parameters are most relevant and need to be considered for further optimization approaches including control strategies and which parameters can be neglected and, hence, set to a fixed value.
4. Results
The methodology described above has been showcased based on real examples from the food industry within the Austrian nationally funded projects DSM_OPT and CORES. Selected results are presented to demonstrate the applicability and potential of the proposed methodology.
4.1. Initial Situation in the Food Industry
The food industry is a good example of the status quo of a fossil fuel-based supply system, as the major energy supply is still provided by fossil fuels (e.g., natural gas) feeding a steam boiler to provide steam for a single centralized steam distribution network. Exemplary for the food industry,
Figure 2 shows these energy flows based on evaluations from the Austrian food industry (the year 2020).
In the food industry, steam is still the main heat carrier, supplying processes at all temperature ranges (low (<100 °C), medium (from 100 to 400 °C), and high (>400 °C)) but typically between 30 and 250 °C in food industry. Processes supplied include unit operations like cleaning, drying, evaporation and distillation, pasteurization, sterilization, cooking, blanching, and general process heating (boiler feed water). If there is a hot water network available in addition to the steam network, it is mainly used for warm water production for cleaning purposes or space heating and heating of production halls and buildings.
4.2. Data Acquisition
To reflect the status quo, initially pre-existing data are collected and processed to clean individual data sets and organize them. Consequently, the existing database was surveyed to identify gaps in the current data acquisition system. On this basis, a plan for implementing additional measuring equipment at strategically important sites can be developed if needed to guarantee a sufficiently large and detailed database for further research activities. This step includes information on the supply utilities as well as the production plans linked to specific product categories, having significant differences in the demand both on quantity and quality (exergy, temperature) levels. The challenge is that, in most cases, there is no easy-to-access data set reflecting detailed information on both the supply and the demand. Detailed discussion and support from the production team is necessary to overcome this.
4.3. Evaluation of Status Quo
The next step is to evaluate the status quo based on the available data using descriptive statistics and data visualization. Concurrently, a qualitative analysis of the production process involves on-site inspections and close cooperation and discussion between the research/audit team and the technical staff at the production site. The methods used include estimation of the energy consumption of different sub-processes, generation of flow diagrams of the production processes, and identification of bottlenecks and potentials for energy efficiency measures and are based on measured data from the past as well as branch-specific expertise and the experience of the experts involved.
The progression of energy demand profiles for specific time frames (week, month, year) in the form of load profiles is illustrated for different temperature levels. This serves as a basis for the subsequent demand-side optimization and modeling for the energy supply system.
Subsequently, a few exemplary practices showing the data analysis process are discussed. In a first step, the energy demand profiles are analyzed over a whole year, providing insight into seasonal changes. In
Figure 3, the typical gas and power demands are depicted, using descriptive statistics and data visualization. On average, the gas demand peaks in the winter months, while the power demand peaks in the summer. This can be attributed to the fact that gas is often used for processes such as drying and heating in general. At the same time, the cooling demand is covered using power and has its typical peaks in summer. As previously said, energy demand for both heating and cooling is dependent on the ambient temperature and, consequently, energy efficiency measures regarding insulation and appropriate usage of the facilities (e.g., opening doors) are recommendable.
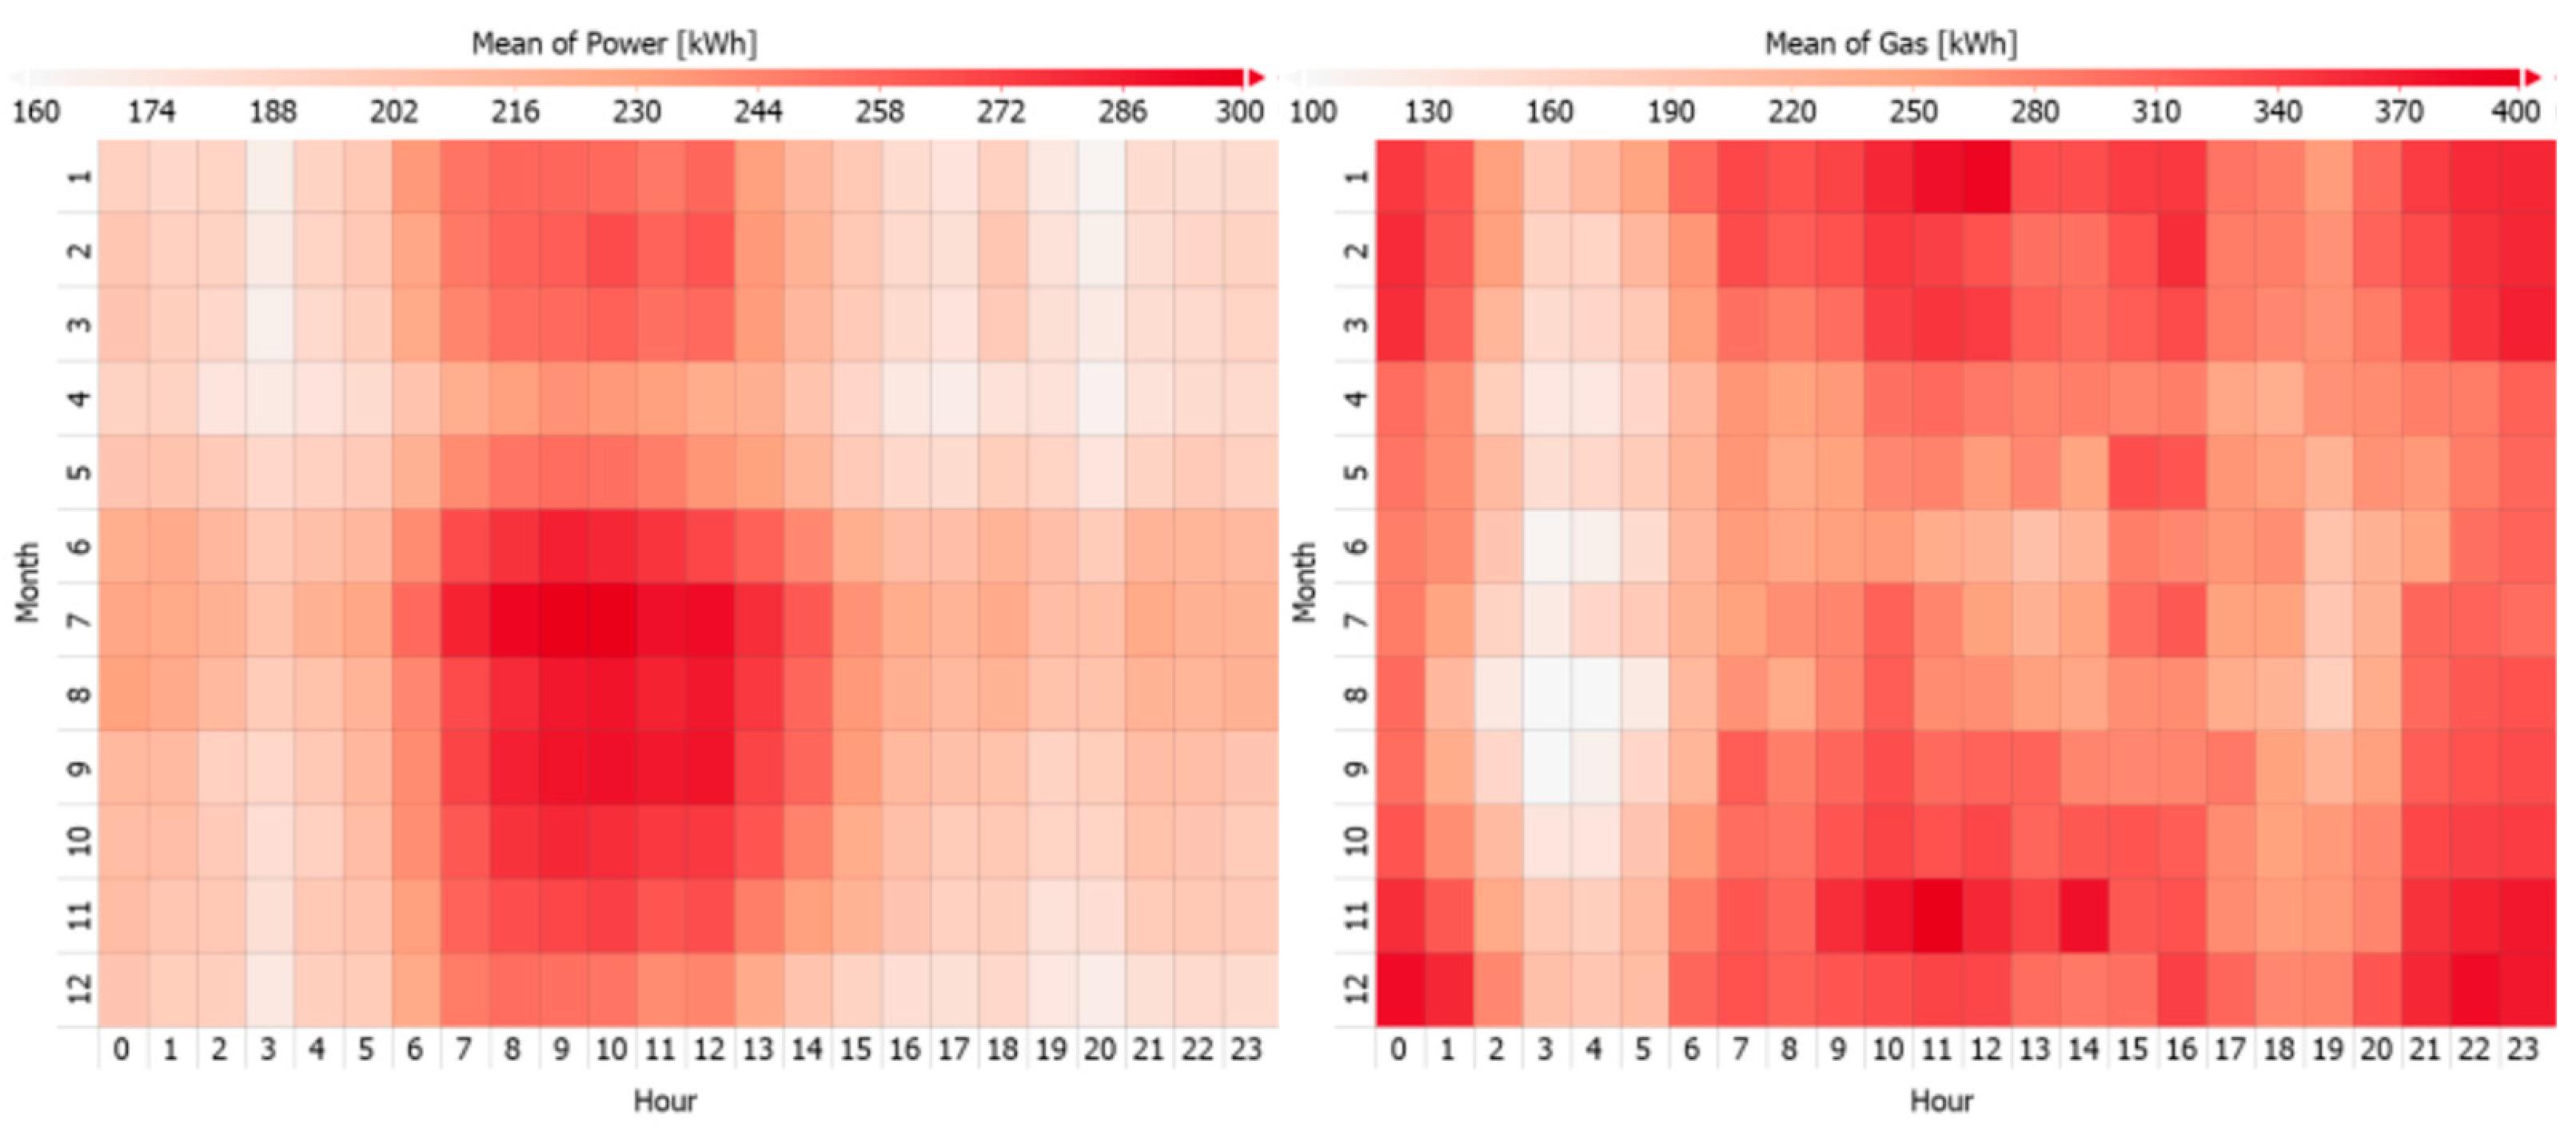
The heat maps in
Figure 4 show the color-coded gas/power consumption in two dimensions: month and hour of day. Utilizing this visualization technique can give a more consistent view of production processes. On the one hand, seasonal fluctuations related to ambient temperature (as discussed above) can be seen; on the other hand, the daily load profile is depicted. The heatmap depicting power consumption shows a peak in the morning hours until noon, which could indicate increased usage of the cooling systems in this period, e.g., frequent opening and closing of cooling facilities’ doors cause higher energy demand, or that the ambient temperature is considerably higher during these hours due to heating processes near the cooling facilities. The heat map showing gas demand displays opposite seasonal changes (peaks in winter) to the heat map showing power demand. Additionally, one can see two peaks in gas demand: one during the day (hours 8 to 17) and one at night (hours 21 to 2), especially in winter months (October to March). The intensity of the red color indicates this demand, pointing towards a two-shift production process: one day shift and one night shift, both utilizing gas-powered production plants. The processes seem to have a certain dependency on the ambient temperature, which is quite typical in this sector.
In
Figure 5, the distributions of hourly gas and power demand are depicted. The distribution of hourly gas demand exhibits two peaks, one around 30 kWh and another at 300 kWh, again suggesting two distinct modes of operation. The distribution of hourly power demand has a peak around 220 kWh. Compared to the heat maps, this visualization allows for a comparison of different production years, while the daily and seasonal fluctuations are not directly visible.
For a deeper understanding of the system, the knowledge of the impact of different factors on important key performance indicators (KPIs) such as energy demand and CO2 emissions or economic parameters such as levelized cost of heat (LCOH) is indispensable. For such a cause, system simulations and sensitivity analysis can be informative. These measures require increased effort and are only worthwhile if the resulting models can be used for additional tasks, such as designing a new production system or predicting the effects of changes in the existing system.
4.4. Energy Efficiency Measures towards Optimization (Process, System)
Based on the findings of the evaluation of the status quo, energy efficiency measures are derived. In our example, based on the dependence on ambient temperature, better insulation of supply and distribution utilities is the first energy efficiency measure proposed at the supply level. Based on the details of the evaluation, measures like different usages and loads of the cooling system rely on the demand and, by this, on reducing the frequent opening and closing of facility doors; different door options could be a possible solution. Additionally, the operation can often be optimized, for instance, using a production planning tool using optimization techniques. For this cause, the production system must be analyzed to identify the potential for flexibility in the production process and determine possible variables for optimization. This means the main energy consumers and flexibility in their operation must be identified. If there is flexibility regarding operating times, optimal scheduling strategies can be employed. Often, flexibility is found in heating systems rather than in cooling systems. The main reason is that cooling process demand is typically achieved within storage or interim storages, which are normally operated non-stop at constant temperature levels. The optimization potential, by this, focuses on logistics and behavior before the cooling itself, resulting in the avoidance of peak demands of cooling. Examples are free cooling of products outside cooling chambers.
4.4.1. Optimization on Process Level
In process optimization, different approaches, depending on the applied sector, are possible. Some examples listed below are:
Optimization of operational management: optimization of process load, reductions in shutdowns, optimized energetic operating sequence of cold and hot processes, changing from batch to continuous processes, etc;
Optimization of directly heated processes: load optimization during heating processes, heat recovery during the process, thermal insulation, etc;
Optimization of indirectly heated processes: condensate utilization, heat supply coordination and demand.
4.4.2. Optimization on System Level
In terms of the system level, optimized heat integration plays a major role. A methodological approach, already approved for all industrial sectors as well as district heating systems and, by this, of course, also for food and beverage industry [
22], is the pinch analysis. Therein, excess heat streams (hot streams) are interlinked with heat demand streams (cold streams) on a methodological basis, resulting in a heat exchanger network system, evaluated by exegetical (no waste of energy flows at high temperatures), power (ensuring maximum heat exchanger sizes), and energetical (transferable heat amount at highest possible operating hours) criteria. Potential excess heat sources are hot water/air from processes used to (pre-) heat process and supply streams, like exhaust air from drying processes or wastewater streams. Further important potentials of excess heat from utilities can be used, such as from boilers (flue gas), chillers (hot water/air), or compressors (hot water/air). Although the methodology is well defined and requires a clear follow-up, i.e., process optimization followed by system optimization and finally the optimization of supply utilities and the integration of renewables, it is important to consider all measures at once as they influence each other and might result in positive and negative impacts. Measures on existing utilities are, in most cases, useful, as increasing their efficiency positively influences their overall heat demand and/or excess heat availability.
4.5. Optimum Demand-Side System
At this point, the demand-side profile is already optimized to a high degree. Depending on the strategies applied across the different optimization steps, models and simulation tools to predict demand-side load profiles may already exist, for example, from developing a scheduling tool for optimized energy efficient production. The next step is to investigate further flexibility in the production system regarding shifting loads of demand and supply. After these flexibilities are identified, a demand response optimization tool can be designed. This tool consequently adapts the demand-side load profile within the given framework conditions to be optimally compatible with the supply-side control. Within the scope of demand response, the availability of renewable energy sources depending on daily and seasonal weather conditions can be optimally exploited and, hence, the need for storage capacity is reduced. Additionally, demand response systems can ease the strain on electric grids and can save costs by taking advantage of variable tariffs and avoiding peak loads.
4.6. Selection of a Technology Configuration
After following the optimization approach at the process level and setting up measures to substitute supply utilities from an exergetic point of view, a supply system considering renewable technologies and their combination can be set up. The available and state-of-the-art technologies include solar thermal (SHIP—solar heat for industrial processes), heat pump (HP), biomass, biogas, geothermal, photovoltaic (PV), and photovoltaic thermal hybrid (PVT) technologies. To represent the combination of these technologies in an energy system, physical models of the individual technologies are linked to form a system model. Due to the modular structure of technologies in the system, each of the individual technology models reflects exactly the behavior of the technology based on input parameters that are also a result of the performance of other technologies. The I/O interfaces (input/output) are clearly defined. By this, each model acts as a stand-alone part in the system and the interconnection of the individual technologies is well reflected.
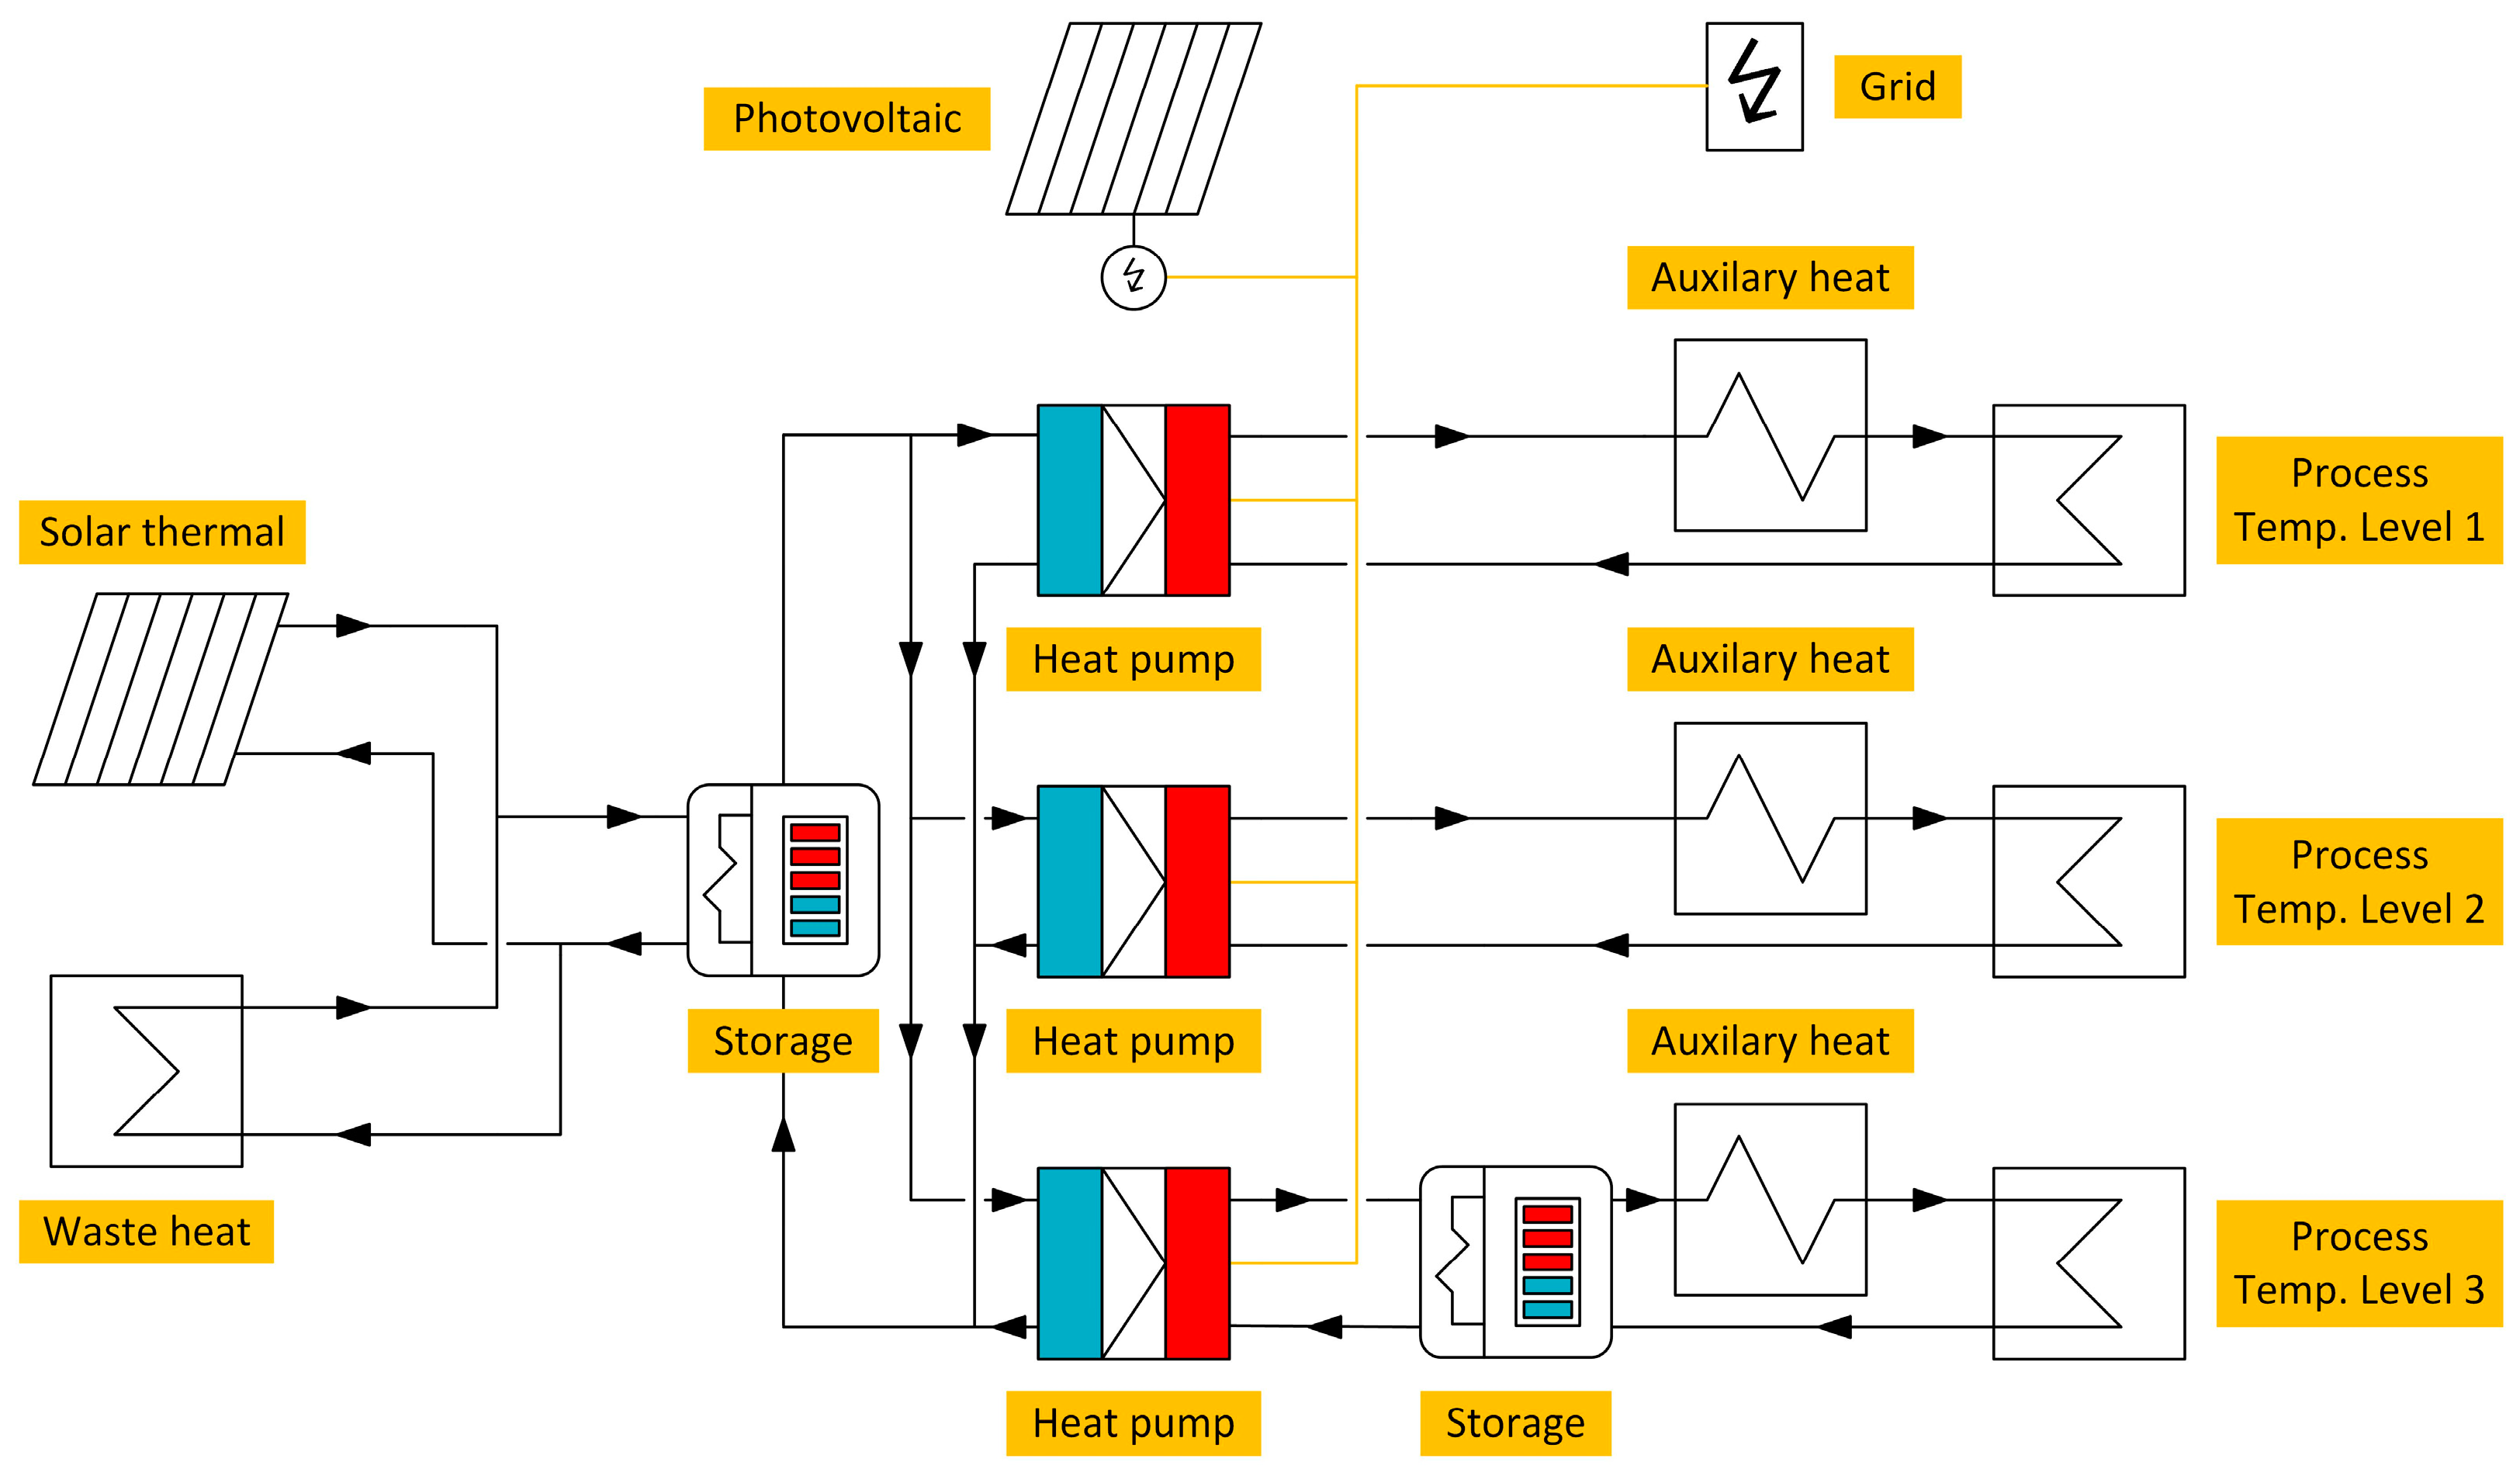
Different examples of technology combinations have been elaborated within the Austrian project “CORES”. The project dealt with the integration of combined renewable energy systems for industry. An example for a technology configuration is shown in
Figure 6. More details can also be taken from.
The configuration shows the combined integration of solar thermal, waste heat, heat pumps and storages to supply three consumers at different temperature levels 1 to 3. The three heat pumps (one heat pump per consumer), to raise the temperature of the energy flows to the demanded level, are connected in parallel. The source for the heat pump is provided by solar thermal technology and excess heat, feeding into a thermal storage tank to smooth fluctuations. Since the investigation focuses on the industrial process’s heat supply, a photovoltaic system is just used for the electrical supply of the heat pumps. As a back-up for heat and electricity, secondary supplies (=auxiliary heat and grid) are considered.
4.7. Simulation of the Supply System
The modeling for the supply system is set up based on the hydraulic scheme of potential and feasible energy concepts—example shown in
Figure 5. Models for the single technologies are combined into a supply system and are based on commercial and open-source Modelica libraries, e.g., TIL Library [
24] and IBPSA Project library [
25] as well as own developments (within the project CORES f.i. developments for PVT, PV, heat pump have been made). The models can be used to carry out parameter studies. Here main design parameters (e.g., installation size) and control parameters (e.g., mass flow rates) can be varied in yearly simulations. Some information-relevant assumptions for system evaluation are emission factors, boiler efficiency, and gas and electricity prices—those need to be defined for the evaluation and validation of the supply system. Gas emissions are derived from the yearly heat supplied under the assumption of an average boiler efficiency. Here a typical efficiency value for boilers is 0.9. The amount of CO
2 equivalents emitted from gas and electricity must be set based on emission numbers. Electricity and gas costs are set depending on actual prize evolutions. Furthermore, scenarios with CO
2 pricing for emissions from gas can be included.
4.8. Evaluation and Validation of the Supply System
In addition to the simulation of different technology combinations, a comprehensible and meaningful evaluation of these is necessary. In doing so, technical as well as economic and ecological aspects play an important role. Key performance indicators (KPIs) to implement the evaluation include:
Investment costs;
Payback period;
CO2 emissions;
Levelized cost of heat;
Heat production costs.
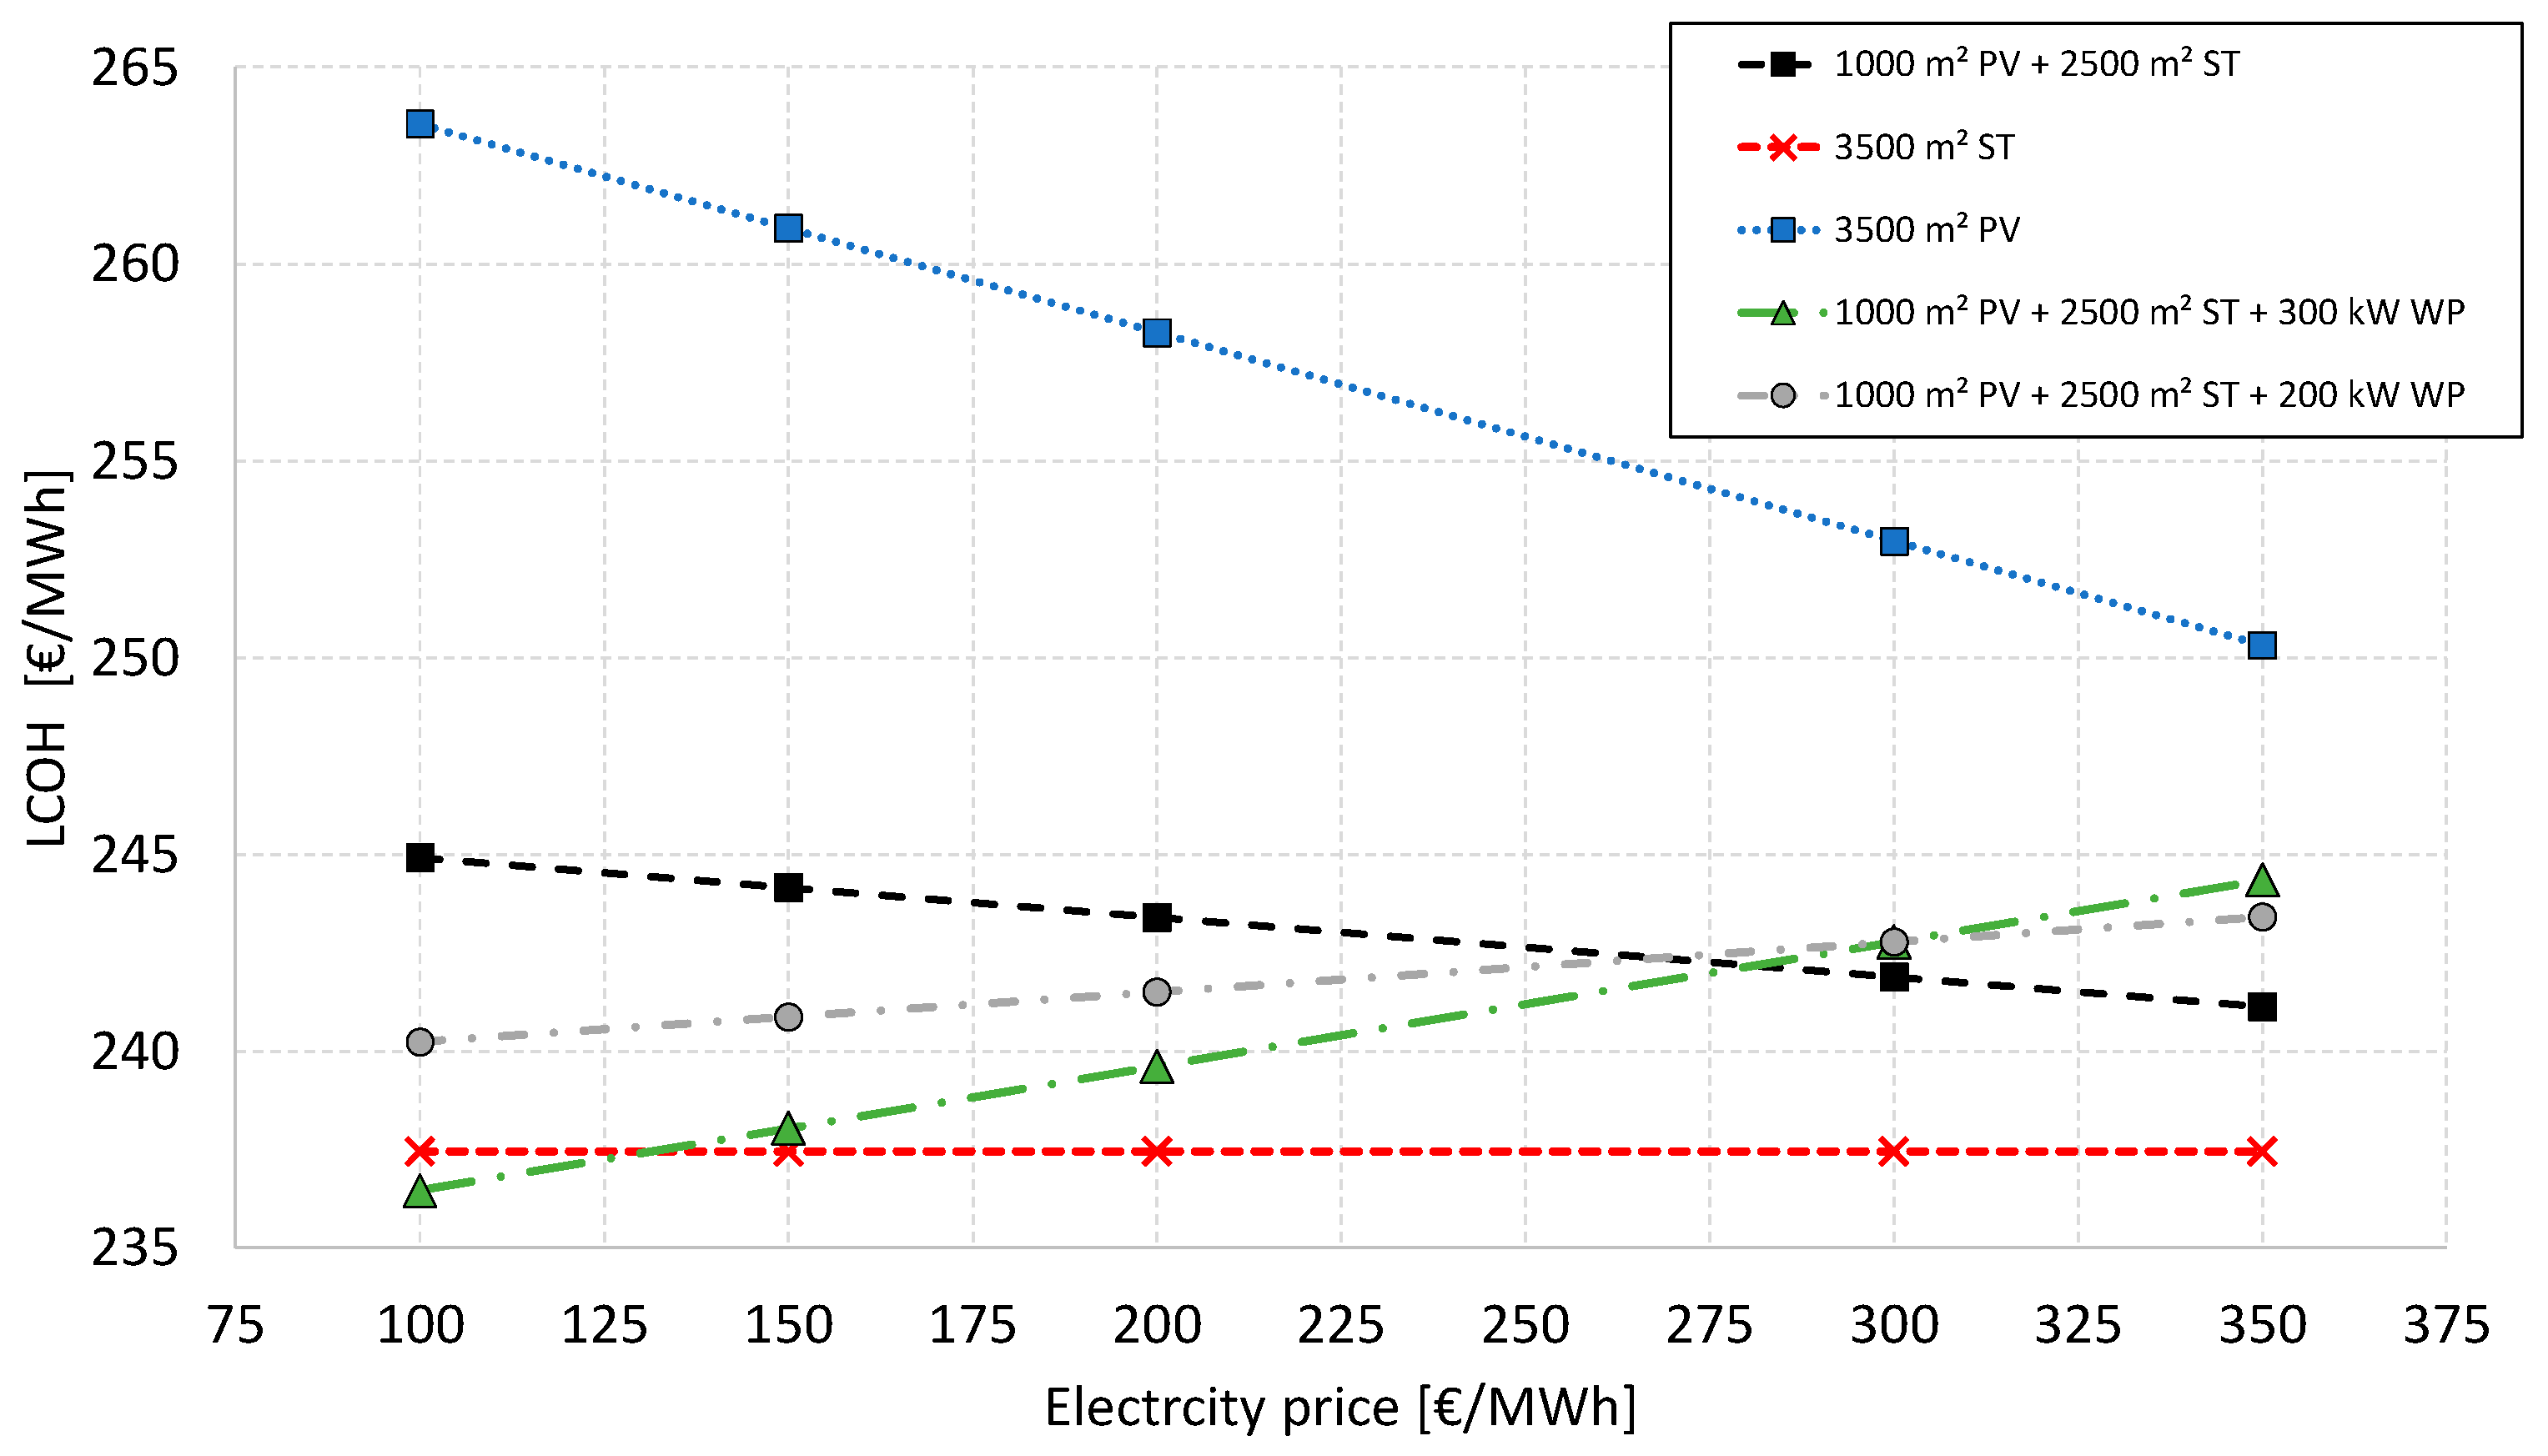
These KPIs serve as an evaluation basis for technology combinations. For dimensioning the KPIs of individual components, different diagrams are created as a basis for decision making. Based on the requirements of this process, KPIs can be weighted differently and, by this, applied as must- and nice-to-have decision criteria. An example of this is shown in
Figure 7. The diagram shows the comparison of four considered configurations depending on the electricity costs in EUR per MWh. The results for the specific configurations considered highlight, that with increasing electricity prices, especially for configurations including a heat pump, higher heat production costs are to be expected. Configurations that mainly include solar thermal energy, on the other hand, have a positive effect on heat production costs when electricity prices increase.
Based on the data analysis from the system simulation and graphical illustration, (1) the optimum configuration for specific use cases and (2) optimization in terms of the technologies used can be drawn.
5. Discussion and Conclusions
The key to optimized production design and operation is the availability of high-quality data on the demand and supply sides of an industrial production. With the available data, problems leading to inefficiencies can be detected and addressed. Furthermore, data availability enables the use of tailor-made models and system simulations which aid in optimizing the production system and efficiently integrating renewables. Digitalization and the buzzword digital twin are well known and linked to industry 4.0, but the effort to gain the data and the derived impact of this are often unclear. Live measurements cause costs and do not make sense for all production processes or are impossible to implement for many companies, especially smaller ones. The solution is a standardized methodology for decarbonizing industrial production sites within the food and beverage production branch, which is as straightforward and simple as possible, while providing the flexibility needed to succeed within the steps defined. With such a methodology, best practices, common pitfalls, typical load profiles, and fitted models for common processes can be collected and reused in cases with low data availability. A standardized methodology, therefore, aids in the development of digital models and twins, the setup of system simulations, and the evaluation of key performance indicators, enabling the optimized design and operation of such hybrid supply systems (combination of different supply technologies, mainly driven by renewables). This allows the multiplication of generated tools and the implementation of these on the side of plant manufacturers without the demand for detailed expertise on modeling and, more importantly, with a significantly reduced effort in applying the results in other companies and sectors. By this, not only large companies gain an advantage, but small and medium enterprises are also supported in the decarbonization of their energy supply systems and in achieving set climate goals.
Based on this, the proposed article aimed to demonstrate a possible version of such a methodology for demand- and supply-side management, first discussing the concept in theory and presenting an exemplary showcase implementing the methodology.
Subsequently, the main challenges encountered during the implementation process are summarized. The first obstacle encountered is data availability, since complete data acquisition is poor in small- and medium-sized companies. Hence, incomplete data availability commonly requires retrofitting of the data acquisition system and branch-specific knowledge and expertise to validate the reliability of existing data. The next crucial step is to develop a good understanding of the status quo of the production system to design the modeling framework. Since the industrial food and beverage sector comprises many different processes with specific energy demands (quality, quantity) and energy supply strategies, this results in a wide variety of energy and production systems. The behavior of these industrial systems is determined by many different process-related factors and their interactions. Due to this fact, a high degree of individualized modeling and model fitting is often required, which is costly in terms of time, expertise, and resources. For optimization purposes, a quantitative assessment of the system is needed; hence, KPIs are calculated. Depending on the case at hand, the choice of KPIs used for optimization can be highly non-trivial and lead to major differences in outcome.
Different than in the existing literature, it is important to explore the topics of DSM and SSM for different energy sources, not focusing merely on electricity. Further, it is important to consider both sides in a holistic combined approach as is suggested in the paper. To manage this, the authors believe that future research projects should target the following: First and foremost, an efficient strategy for data acquisition, following the principle as little as possible but as much as necessary, should be developed and implemented extensively for the whole industrial sector. Hand in hand with this development, the expansion of expertise in companies through targeted training for decarbonization should be stepped up. Regarding modeling and simulation, research focus must be on further development towards more standardized and flexible simulation tools and software libraries that can easily be adapted for various production systems. Finally, standardized definitions and guidelines regarding KPIs for decarbonization are needed. Efforts in this direction have been made in the scope of the IEA IETS Task 18 and published work [
26,
27].
Although decarbonization is without question a challenging task, there have been major advances in the past decade. There is no doubt that this development will continue in the future especially since stakeholders show great interest in pushing research and implementation of decarbonization strategies. Authors should discuss their results and how they can be interpreted from the perspective of previous studies and the working hypotheses. The findings and their implications should be discussed in the broadest context possible. Future research directions may also be highlighted.
Author Contributions
Draft preparation—J.F., S.M. and J.R.; Conceptualization, J.R. and S.M.; Background, J.F.; Methodology—S.M., J.R. and J.F.; Supply-Side Management—S.M., J.F. and C.R.T.; Demand-Side Management—J.R. and J.F. All authors have read and agreed to the published version of the manuscript.
Funding
This research was funded by the Austrian Climate and Energy Funds within the projects “CORES” (project number 871669; coordination and coordination of two use cases AEE INTEC) and “DSM_Opt” (project number 880772; use case coordination AEE INTEC).
Institutional Review Board Statement
Not applicable.
Informed Consent Statement
Informed consent was obtained from all subjects involved in the study.
Data Availability Statement
All raw data included in this study are private.
Conflicts of Interest
The authors declare no conflict of interest.
References
- IEA. World Energy Balances: Overview, Paris, License: CC BY 4.0. 2021. Available online: https://www.iea.org/reports/world-energy-balances-overview (accessed on 10 August 2023).
- Fetting, C. The European Green Deal; ESDN Office: Vienna, Austria, 2020; Available online: https://www.esdn.eu/fileadmin/ESDN_Reports/ESDN_Report_2_2020.pdf (accessed on 10 August 2023).
- European Commission. Energy Efficiency Directive. Available online: https://energy.ec.europa.eu/topics/energy-efficiency/energy-efficiency-targets-directive-and-rules/energy-efficiency-directive_en#the-2012-energy-efficiency-directive (accessed on 19 April 2023).
- Eurostat. Final Energy Consumption in Industry—Detailed Statistics, November 2022. Available online: https://ec.europa.eu/eurostat/statistics-explained/index.php?title=Final_energy_consumption_in_industry_-_detailed_statistics (accessed on 10 August 2023).
- Eurostat. Energy Efficiency Statistics; European Union: Brussels, Belgium, 2023. [Google Scholar]
- Ladha-Sabur, A.; Bakalis, S.; Fryer, P.J.; Lopez-Quiroga, E. Mapping energy consumption in food manufacturing. Trends Food Sci. Technol. 2019, 86, 270–280. [Google Scholar] [CrossRef]
- Fooddrink Europe. SMES Small Scale, Big Impact, 16 November 2020. Available online: https://www.fooddrinkeurope.eu/policy-area/smes/ (accessed on 10 August 2023).
- Palensky, P.; Dietrich, D. Demand Side Management: Demand Response, Intelligent Energy Systems, and Smart Loads. IEEE Trans. Ind. Inform. 2011, 7, 381–388. [Google Scholar] [CrossRef]
- Voytas, R.; Reynolds, J.M.; Masiello, J.; Pratt, D.; Hughes, J.P.; Zarruk, E. Data Collection for Demand-Side Management: For Quantifying Its Influence on Reliability; NERC: Atlanta, GA, USA, 2007. [Google Scholar]
- Strbac, G. Demand side management: Benefits and challenges. Energy Policy 2008, 36, 4419–4426. [Google Scholar] [CrossRef]
- Supply Side Management, 13 Modul 2008. Available online: https://www.unido.org/sites/default/files/2009-02/Module13_0.pdf (accessed on 10 August 2023).
- Mohamed, A.; Khan, M.T. A review of electrical energy management techniques: Supply and consumer side (industries). J. Energy S. Afr. 2009, 20, 14–21. [Google Scholar] [CrossRef]
- DIN EN 16247-1:2022-11; Energy Audits—Part 1: General Requirements; German version EN_16247-1:2022. Beuth Verlag GmbH: Berlin, Germany, 2022.
- DIN EN ISO 50001:2018-12; Energiemanagementsysteme_Anforderungen mit Anleitung zur Anwendung (ISO_50001:2018); Deutsche Fassung EN_ISO_50001:2018. Beuth Verlag GmbH: Berlin, Germany, 2018. [CrossRef]
- Kuzior, A.; Sira, M.; Brozek, P. Using Blockchain and Artificial Intelligence in Energy Management as a Tool to Achieve Energy Efficiency. Virtual Econ. 2022, 5, 69–90. [Google Scholar] [CrossRef] [PubMed]
- AEE INTEC. Greenfoods. Available online: https://www.aee-intec.at/greenfoods-122 (accessed on 10 August 2023).
- AEE INTEC. Fraunhofer ISE, Reenag, Eceee, Universidade de Évora, Ainia TrustEE—Report on Current Status of Process Heat in Europe: Sectors, Processes, Geographical Distribution, System Layouts and Energy Sources. 2016. Available online: https://www.trust-ee.eu/files/otherfiles/0000/0008/TrustEE_D1_1.pdf (accessed on 10 August 2023).
- AEE INTEC. Solarthermie-Branchenkonzepte Für Die Lebensmittelindustrie—Solar Foods. Available online: https://www.aee-intec.at/solarthermie-branchenkonzepte-fuer-die-lebensmittelindustrie-solar-foods-p139 (accessed on 10 August 2023).
- AEE INTEC. SolarAutomotive–Solare Prozesswärme Für Die Automobil- und Zulieferindustrie. Available online: https://www.aee-intec.at/solarautomotive-n-solare-prozesswaerme-fuer-die-automobil-und-zulieferindustrie-p189 (accessed on 10 August 2023).
- Iwanaga, T.; Usher, W.; Herman, J. Toward SALib 2.0: Advancing the accessibility and interpretability of global sensitivity analyses. Socio-Environ. Syst. Model. 2022, 4, 18155. [Google Scholar] [CrossRef]
- AIT (Austrian Institute of Technology). NEAT-Tool. Available online: https://industries.ait.ac.at/ (accessed on 10 August 2023).
- Muster-Slawitsch, B.; Brunner, C.; Fluch, J. Application of an advanced pinch methodology for the food and drink production. WIREs Energy Environ. 2014, 3, 561–574. [Google Scholar] [CrossRef]
- Dusek, S.; Seliger, D.; Meitz, S.; Wilk, V.; Ponweiser, K. Decarbonization of the Industrial Process Heat Supply through the Combination of Renewable and Efficiency-Enhancing Technologies. Nachhalt. Technol. Z. Von AEE-Intec 2022, 1, 8–11. [Google Scholar]
- TLK-Thermo GmbH. 2022. Available online: https://www.tlk-thermo.com (accessed on 7 March 2022).
- Wetter, M.; van Treeck, C.; Helsen, L.; Maccarini, A.; Saelens, D.; Robinson, D.; Schweiger, G. IBPSA Project 1: BIM/GIS and Modelica framework for building and community energy system design and operation—Ongoing developments, lessons learned and challenges. IOP Conf. Ser. Earth Environ. Sci. 2019, 323, 012114. [Google Scholar] [CrossRef]
- Jesper, M.; Pag, F.; Vajen, K.; Jordan, U. Hybrid solar thermal and heat pump systems in industry: Model based development of globally applicable design guidelines. Sol. Energy Adv. 2023, 3, 100034. [Google Scholar] [CrossRef]
- Kubart, O. Entwicklung, Validierung UND Vereinfachung Lokaler UND Globaler Bewertungskriterien Für Nachhaltige Energiesysteme in Der Industrie; Masterarbeit; FH Burgenland: Pinkafeld, Austria, 2021. [Google Scholar]
| Disclaimer/Publisher’s Note: The statements, opinions and data contained in all publications are solely those of the individual author(s) and contributor(s) and not of MDPI and/or the editor(s). MDPI and/or the editor(s) disclaim responsibility for any injury to people or property resulting from any ideas, methods, instructions or products referred to in the content. |
© 2023 by the authors. Licensee MDPI, Basel, Switzerland. This article is an open access article distributed under the terms and conditions of the Creative Commons Attribution (CC BY) license (https://creativecommons.org/licenses/by/4.0/).


