
Feasibility Study of a Reverse Osmosis Desalination Unit Powered by Photovoltaic Panels for a Sustainable Water Supply in Algeria

Abstract
:1. Introduction
2. Materials and Methods
2.1. Solar Desalination System PV-RO
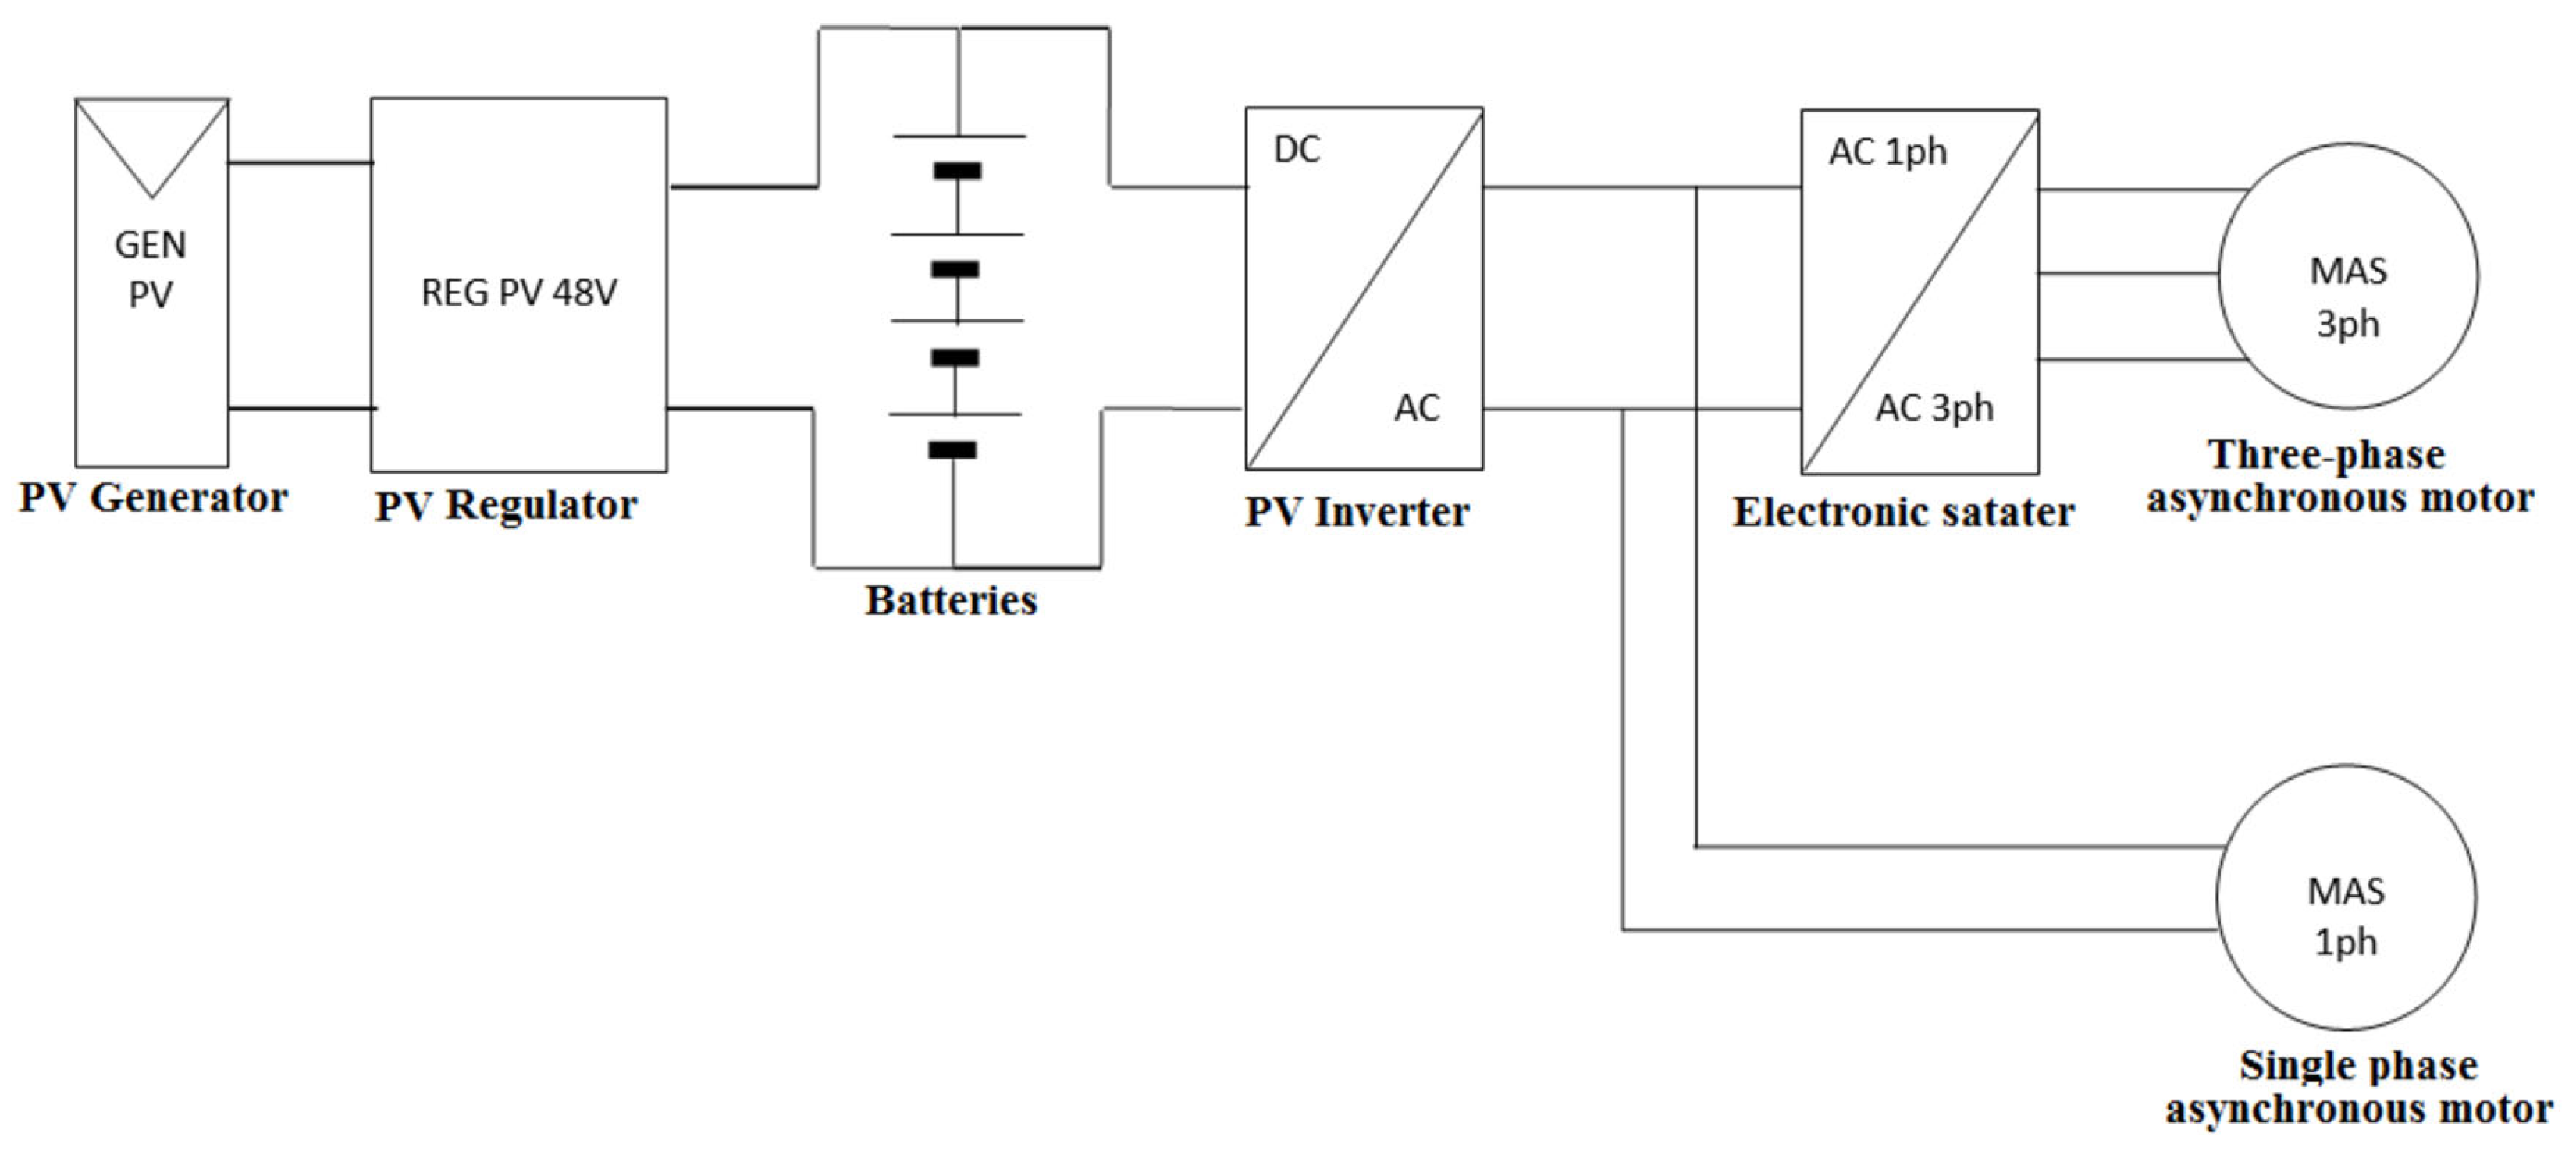
2.2. Photovoltaic Power System
2.2.1. Design and Sizing of a PV System
- -
- Latitude of the Bou-Ismail site in degrees: 36.64°;
- -
- Longitude of the Bou-Ismail site in degrees: 2.69007°.
- -
- PV generator tilt angle in degrees: 36°;
- -
- The average global solar irradiation incident on the inclined plane of the PV generator of the worst month of the Bou-Ismail site is of the order of Gdg = 2800 Wh/m2/day; (measurement made at the UDES weather station).
2.2.2. PV System Operation
3. Results and Discussion
3.1. RO Membrane Performance
3.2. Renewable Energy Supply and Consumption
4. Conclusions
Author Contributions
Funding
Institutional Review Board Statement
Informed Consent Statement
Data Availability Statement
Conflicts of Interest
References
- United Nations; Food and Agriculture Organization (FAO). Coping with Water Scarcity: An Action Framework for Agriculture and Food Security; FAO Water Report 38; Food and Agriculture Organization (FAO): Rome, Italy, 2012. [Google Scholar]
- Semiat, R.; Sutzkover, I.; Hasson, D. Characterization of the effectiveness of silica anti-scalants. Desalination 2003, 159, 11–19. [Google Scholar] [CrossRef]
- Aghababaei, N. Reverse osmosis design with IMS design software to produce drinking water in Bandar Abbas, Iran. J. Appl. Res. Water Wastewater 2017, 4, 314–318. [Google Scholar]
- Ibrahim, A.G.M.; Dincer, I. A solar desalination system: Exergetic performance assessment. Energy Convers. Manag. 2015, 101, 379–392. [Google Scholar] [CrossRef]
- Tigrine, Z.; Aburideh, H.; Chekired, F.; Belhout, D.; Tassalit, D. New solar still with energy storage: Application to the desalination of groundwater in the Bou-Ismail region. Water Supply 2021, 21, 4627–4640. [Google Scholar] [CrossRef]
- Belhout, D.; Tigrine, Z.; Mosnegutu, E.F.; Benabdelaziz, F.K. Management of reverse osmosis concentrate by solar distillation. Water Supply 2022, 22, 6490–6503. [Google Scholar] [CrossRef]
- Diaf, A.; Cherfa, A.; Karadaniz, A.; Tigrine, Z. A technical–economical study of solar desalination. Desalin. J. 2016, 377, 123–127. [Google Scholar] [CrossRef]
- Tigrine, Z.; Aburideh, H.; Abbas, M.; Zioui, D.; Bellatreche, R.; Kasbadji Merzouk, N.; Hout, S.; Belhout, D. Experimental investigations on a multi-stage water desalination prototype. Desalin. Water Treat. 2015, 56, 2612–2617. [Google Scholar] [CrossRef]
- Hadji, A.; KasbadjiMerzouk, N.; Merzouk, M.; Spiros, A.; Tigrine, Z. Study of a Modified Multiple Effect Distillation (MED) Brackish Water, System for a Minimal Water Footprint. Desalin. Water Treat. 2021, 213, 44–52. [Google Scholar] [CrossRef]
- Tigrine, Z.; Aburideh, H.; Abbas, M.; Hout, S.; Kasbadji Merzouk, N.; Zioui, D.; Khateb, M. Membrane Desalination Technology in Algeria: Reverse Osmosis for Coastal Areas. In Exergy for a Better Environment and Improved Sustainability; Part of the Green Energy and Technology Book Series (GREEN); Springer: Berlin/Heidelberg, Germany, 2018; Volume 2, pp. 197–218. [Google Scholar]
- Tigrine, Z.; Kasbadji Merzouk, N.; Aburideh, H.; Abbas, M.; Zioui, D.; Belhout, D.; Hout, S. Pilot-scale reverse osmosis for brackish and seawater desalination coupled with renewable energy. Int. J. Environ. Sci. 2016, 1, 2367–8941. [Google Scholar]
- Hout, S.; Salem, Z.; Tassalit, D.; Tigrine, Z.; Aburidah, H.; Hafida, B. Assessing desalination pretreatment conditions towards pilot scale up using Box-Behnken experimental design. Water Environ. J. 2020, 35, 473–485. [Google Scholar] [CrossRef]
- Nassrullah, H.; Anis, S.F.; Shaikeh, R.; Hilal, N. Energy for desalination: A state-of-the-art review. Desalination 2020, 491, 114569. [Google Scholar] [CrossRef]
- Ruiz-García, A.; Nuez, I.; Carrascosa-Chisvert, M.D.; Santana, J.J. Simulations of BWRO systems under different feedwater characteristics. Analysis of operation windows and optimal operating points. Desalination 2020, 491, 114582. [Google Scholar] [CrossRef]
- Xevgenos, D.; Moustakas, K.; Malamis, D.; Loizidou, M. An overview on desalination & sustainability: Renewable energy-driven desalination and brine management. Desalin. Water Treat. 2016, 57, 2304–2314. [Google Scholar] [CrossRef]
- Eke, J.; Yusuf, A.; Giwa, A.; Sodiq, A. The global status of desalination: An assessment of current desalination technologies, plants and capacity. Desalination 2020, 495, 114633. [Google Scholar] [CrossRef]
- Ghaffour, N.; Missimer, T.M.; Amy, G.L. Technical review and evaluation of the economics of water desalination: Current and future challenges for better water supply sustainability. Desalination 2013, 309, 197–207. [Google Scholar] [CrossRef]
- Mahmoudi, H.; Abdellah, O.; Ghaffour, N. Capacity building strategies and policy for desalination using renewable energies in Algeria. Renew. Sustain. Energy Rev. 2009, 13, 921–926. [Google Scholar] [CrossRef]
- Shokri, A.; Sanavi Fard, M. Techno-economic assessment of water desalination: Future outlooks and challenges. Process Saf. Environ. Prot. 2023, 69, 564–578. [Google Scholar] [CrossRef]
- Aghahosseini, A.; Bogdanov, D.; Breyer, C. Towards sustainable development in the MENA region: Analysing the feasibility of a 100% renewable electricity system in 2030. Energy Strategy Rev. 2020, 28, 100466. [Google Scholar] [CrossRef]
- Kim, J.S.; Chen, J.; Garcia, H.E. Modeling, control, and dynamic performance analysis of a reverse osmosis desalination plant integrated within hybrid energy systems. Energy 2016, 112, 52–66. [Google Scholar] [CrossRef]
- El-Ghzizel, S.; Tahaikt, M.; Dhiba, D.; Elmidaouia, A.; Taky, M. Desalination and Water Treatment. Desalin. Water Treat. 2021, 231, 1–15. [Google Scholar] [CrossRef]
- Sayed, E.T.; Olabi, A.G.; Elsaid, K.; Al Radi, M.; Alqadi, R.; Abdelkareem, M.A. Recent progress in renewable energy based-desalination in the Middle East and North Africa MENA region. J. Adv. Res. 2022, 13, 125–156. [Google Scholar] [CrossRef]
- Ajjur, S.B.; Sami, G. Al-Ghamdi.Towards sustainable energy, water and food security in Qatar under climate change and anthropogenic stresses. Energy Rep. 2022, 8, 514–518. [Google Scholar] [CrossRef]
- Shawky, H.A.; Fatah, A.A.A.; Elfadl, M.M.S.A.; El-Aassar, H.M. Design of a small mobile PV driven RO water desalination plant to be deployed at the northwest coast of Egypt. Desalin. Water Treat. 2015, 55, 3755–3766. [Google Scholar] [CrossRef]
- Herold, D.; Neskakis, A. A small PV-driven reverse osmosis desalination plant on the island of Gran Canaria. Desalination 2001, 137, 285–292. [Google Scholar] [CrossRef]
- Shen, J.; Mkongo, G.; Abbt-Braune, G.; Ceppi, S.L.; Richards, B.S.; Schäfer, A.I. Renewable energy powered membrane technology: Fluoride removal in a rural community in northern Tanzania. Sep. Purif. Technol. 2015, 149, 349. [Google Scholar] [CrossRef]
- Li, S.; Schäfer, A.I.; Richards, B.S. Renewable energy powered membrane technology: A review of the reliability of photovoltaic-powered membrane system components for brackish water desalination. Appl. Energy 2019, 253, 113524. [Google Scholar] [CrossRef]
- Helal, A.M. Economic feasibility of alternative designs of a PV-RO desalination unit for remote areas in the United Arab Emirates. Desalination 2008, 221, 1–16. [Google Scholar] [CrossRef]
- Ghaffour, N.; Reddy, V.K.; Abu-Arabi, M. Technology development and application of solar energy in desalination: MEDRC contribution. Renew. Sustain. Energy Rev. 2011, 15, 4410–4415. [Google Scholar] [CrossRef]
- Bilal, H.; Alami, A.H.; Farooq, M.; Qamar, A.; Siddiqui, F.A. The economic analysis of portable photo-voltaic reverse osmosis (PVRO) system. Tech. J. 2016, 21, 1–6. [Google Scholar]
- Mostafaeipour, A.; Qolipour, M.; Rezaei, M.; Tirkolaeeb, E.B. Investigation of off-grid photovoltaic systems for a reverse osmosis desalination system: A case study. Desalination 2019, 454, 91–103. [Google Scholar] [CrossRef]
- Ghafoor, A.; Ahmed, T.; Munir, A.; Arslan, C.; Ahmad, S.A. Techno-economic feasibility of solar based desalination through reverse osmosis. Desalination 2020, 485, 114464. [Google Scholar] [CrossRef]
- Shalaby, S.M.; Sharshir, S.W.; Kabeel, A.E.; Kandeal, A.W.; Abosheiasha, H.F.; Abdelgaied, M.; Hamed, M.H.; Yang, N. Reverse osmosis desalination systems powered by solar energy: Preheating techniques and brine disposal challenges—A detailed review. Energy Convers. Manag. 2022, 251, 114971. [Google Scholar] [CrossRef]
- Maftouh, A.; El Fatni, O.; Bouzekri, S.; Rajabi, F.; Sillanpää, M.; Butt, M.H. Economic feasibility of solar-powered reverse osmosis water desalination: A comparative systemic review. Environ. Sci. Pollut. Res. 2023, 30, 2341–2354. [Google Scholar] [CrossRef]
- Monjezi, A.A.; Chen, Y.; Vepa, R.; Kashyout, A.E.H.B.; Hassan, G.; El-Banna Fath, H.; Kassem, A.E.W.; Shaheed, M.H. Development of an off-grid solar energy powered reverse osmosis desalination system for continuous production of freshwater with integrated photovoltaic thermal (PVT) cooling. Desalination 2020, 495, 114679. [Google Scholar] [CrossRef]
- Ruiz-García, A.; Nuez, I. On-Off Control Strategy in a BWRO System under Variable Power and Feedwater Concentration Conditions. Appl. Sci. 2020, 10, 4748. [Google Scholar] [CrossRef]
- Ruiz-García, A.; Nuez, I. Long-term intermittent operation of a full-scale BWRO desalination plant. Desalination 2020, 489, 114526. [Google Scholar] [CrossRef]
- Leijon, J.; Salar, D.; Engström, J.; Leijon, M.; Boström, C. Variable renewable energy sources for powering reverse osmosis desalination, with a case study of wave powered desalination for Kilifi, Kenya. Desalination 2020, 494, 114669. [Google Scholar] [CrossRef]
- Ruiz-García, A.; Nuez, I. Performance evaluation and boron rejection in a SWRO system under variable operating conditions. Comput. Chem. Eng. 2021, 153, 107441. [Google Scholar] [CrossRef]
- Mito, M.T.; Ma, X.; Albuflasa, H.; Davies, P. Variable operation of a renewable energy-driven reverse osmosis system using model predictive control and variable recovery: Towards large-scale implementation. Desalination 2022, 532, 115715. [Google Scholar] [CrossRef]
- Cai, Y.H.; Burkhardt, C.J.; Schäfer, A.I. Renewable energy powered membrane technology: Impact of osmotic backwash on organic fouling during solar irradiance fluctuation. J. Membr. Sci. 2022, 647, 120286. [Google Scholar] [CrossRef]
- Himri, Y.; Rehman, S.; Mostafaeipour, A.; Himri, S.; Mellit, A.; Merzouk, M.; KasbadjiMerzouk, N. Overview of the Role of Energy Resources in Algeria’s Energy Transition. Energies 2022, 15, 4731. [Google Scholar] [CrossRef]
- Mahmoudi, H.; Spahis, N.; Goosen, M.F.; Ghaffour, N.; Drouiche, N.; Ouagued, A. Application of geothermal energy for heating and freshwater production in a brackish water greenhouse desalination unit: A case study from Algeria. Renew Sustain Energy Rev. 2010, 14, 512–517. [Google Scholar] [CrossRef]
- Drouiche, N.; Ghaffour, N.; Naceur, M.; Mahmoudi, H.; Ouslimane, T. Reasons for the Fast Growing Seawater Desalination Capacity in Algeria. Water Resour. Manag. 2011, 25, 2743–2754. [Google Scholar] [CrossRef]
- Hamiche, A.M.; Stambouli, A.B.; Flazi, S. A review on the water and energy sectors in Algeria: Current forecasts, scenario and sustainability issues. Renew. Sustain. Energy Rev. 2015, 41, 261–276. [Google Scholar] [CrossRef]
- Hamiche, A.M.; Stambouli, A.B.; Flazi, S.; Tahri, A.; Koinuma, H. Desalination in Algeria: Current State and Recommendations for Future Projects. In Thermo-Mechanics Applications and Engineering Technology; Springer: Cham, Switzerland, 2018; ISBN 978-3-319-70956-7. [Google Scholar]
- Drouiche, N.; Villarreal, O.R.; Oualie, S.; Lebouachera, S.E.L.; Soni, R. Role of desalination technologies in water-energy-food nexus: An opportunity for Algeria. Desalin. Water Treat. 2022, 261, 83–93. [Google Scholar] [CrossRef]
- Touitou, M.; Abul Quasem, E.A. Economic and Environmental Studies. Climate change and water resources in Algeria: Vulnerability. Impact Adapt. Strategy 2018, 18, 411–429. [Google Scholar]
- Himri, Y.; Malik, A.S.; Stambouli, A.B.; Himri, S.; Draoui, B. Review and use of the Algerian renewable energy for sustainable development. Renew. Sustain. Energy Rev. 2009, 13, 1584–1591. [Google Scholar] [CrossRef]
- Ministère de l’Energie. Energies Nouvelles, Renouvelables et Maitrise de l’Energie. Energy.gov.dz. 2018. Available online: https://www.energy.gov.dz/?rubrique=energies-nouvelles-Renouvelables-et-maitrise-de-lrenergie#518 (accessed on 10 January 2023).
- García-Rodríguez, L. Renewable energy applications in desalination: State of the art. Sol. Energy 2003, 75, 381–393. [Google Scholar] [CrossRef]
- Kalogirou, S.A. Seawater desalination using renewable energy sources. Prog. Energy Combust. Sci. 2005, 31, 242–281. [Google Scholar] [CrossRef]
- Atia, A.A.; Fthenakis, V. Active-salinity-control reverse osmosis desalination as a flexible load Resource. Desalination 2019, 468, 114062. [Google Scholar] [CrossRef]
- Delgado-Torres, A.M.; García-Rodríguez, L.; del Moral, M.J. Preliminary assessment of innovative seawater reverse osmosis (SWRO) desalination powered by a hybrid solar photovoltaic (PV)—Tidal range energy system. Desalination 2020, 477, 114247. [Google Scholar] [CrossRef]
- Veerman, J.; Saakes, M.; Metz, S.J.; Harmsen, G.J. Electrical power from sea and river water by reverse electrodialysis: A first step from the laboratory to a real power plant. Environ. Sci. Technol. 2010, 44, 9207–9212. [Google Scholar] [CrossRef] [PubMed]
- World Health Organization. Guidelines for Drinking-Water Quality: Fourth Edition Incorporating the First and Second Addenda; World Health Organization: Geneva, Switzerland, 2022. [Google Scholar]
- World Health Organization. A Global Overview of National Regulations and Standards for Drinking-Water Quality, 2nd ed.; World Health Organization: Geneva, Switzerland, 2021; Available online: https://apps.who.int/iris/handle/10665/350981 (accessed on 9 August 2023).


| Electrical and Mechanical Characteristics | |||
|---|---|---|---|
| Cell Type | Monocrystalline Cell with Anti-Reflection | Junction Box and Connector | IP65, 3 Bypass Diodes and Compatible Cables with MC4 Connector |
| Number of cells per module | 36 cells (4 × 9) | Operating temperature | 40 bar at 85 °C |
| Cell sizes | 156 × 156 mm | Nominal power (W) | 150 |
| Module dimensions | 1482 × 674 × 45 mm | Open circuit voltage Vco (V) | 22.35 |
| Module weight | 12 kg | Short-circuit current ISC (A) | 9.005 |
| Panel frame | Anodisedaluminum alloy | Tension mppVmmp (V) | 18.54 |
| Type of glass | Tempered glass, 3.2 mm thick | Curent mppImmp (I) | 8.29 |
| Characteristics of the Batteries (Condor) | Charge Controller (Condor) | Single-Phase Stand-Alone PV Inverter (Victron) |
|---|---|---|
| Manufacturing technology: AGM-Gel battery. Nominal voltage of a battery: 12 V. Storage capacity: 250 Ah. Nominal voltage of the battery pack: 48 V. Autonomy day(s): 2 days. | Charge controller with MPPT. Nominal voltage: 24/48 V. Nominal current: 50 A. | Inverter with MPPT. Nominal apparent output power: 5 Va. Nominal input DC voltage: 48 V dc. Nominal AC output voltage: 230 Vac single-phase. |
| Physico-Chemical Parameters | Unity | Water 1 | Water 2 | Water 3 | Water 4 | Water 5 |
|---|---|---|---|---|---|---|
| pH | - | 7.40 | 7.10 | 7.56 | 7.40 | 7.60 |
| Conductivity | µS/cm | 2231.00 | 10,600.00 | 21,200.00 | 33,700.00 | 50,000.00 |
| Turbidity | NTU | 0.30 | 0.37 | 0.49 | 0.40 | 0.61 |
| TDS | mg/L | 1115.00 | 5700.00 | 11,700.00 | 20,100.00 | 35,200.00 |
| Salinity | g/L | 1.00 | 5.00 | 12.00 | 20.00 | 35.00 |
| Durety | mg/L CaCO3 | 894.00 | 910.00 | 930.00 | 960.00 | 1010.00 |
| Alcalinity | mg/L CaCO3 | 171.00 | 170.00 | 167.00 | 175.00 | 162.00 |
| Magnesium | mg/L | 675.56 | 695.17 | 697.54 | 705.10 | 748.68 |
| Calcium | mg/L | 218.44 | 214.83 | 232.46 | 254.10 | 261.32 |
| Chloride | mg/L | 165.92 | 2268.99 | 5530.67 | 7941.47 | 18,337.64 |
| Parameters Sought (UFC) | Maximum Allowable Concentration | Well Water | RO Water at 55 Bars |
|---|---|---|---|
| Total coliforms/100 mL | 0 | 10 | 0 |
| Faecal coliforms/100 mL | 0 | 10 | 0 |
| Sulphite-reducing anaerobes/20 mL | 0 | 5 | 0 |
| Fecalenterococcus/Intestinal enterococcus/100 mL | 0 | 9 | 0 |
| Parameter | Permeate Water | Retentate Water |
|---|---|---|
| Salinity (g/L) | 0 | 65 |
| M.E.S | 4 | 79.5 |
| Ammonium (mg/L) | 0.0555 | 0.0635 |
| Nitrites (mg/L) | 0.1017 | 0.1585 |
| Nitrates (mg/L) | 1.29 | 11.0184 |
| Phosphates (mg/L) | 0.3416 | 0.3271 |
| Chlorides (mg/L) | 0 | 36,675.200 |
| Carbonates (mg/L) | 0.0097 | 0.0675 |
| Calcium (mg/L) | 7.711 | 275.49 |
| Sulphates (mg/L) | 346.90 | 2.884 |
| Total coliforms | Absence | Absence |
| Fecalcoliform | Absence | Absence |
| Escherichia coli | Absence | Absence |
| Salmonella | Absence | Absence |
| Pressure (Bar) | Power kW (Salinity 5 g/L) | Power kW (Salinity 12 g/L) | Power kW (Salinity 20 g/L) | Power kW (Salinity 35 g/L) |
|---|---|---|---|---|
| 5 | 0.391 | 0.374 | 0.391 | 0.366 |
| 10 | 0.479 | 0.465 | 0.384 | 0.458 |
| 15 | 0.568 | 0.560 | 0.479 | 0.574 |
| 20 | 0.667 | 0.676 | 0.564 | 0.654 |
| 25 | 0.777 | 0.779 | 0595 | 0.779 |
| 30 | 0.884 | 0.884 | 0.698 | 0.896 |
| 35 | 1.020 | 1.000 | 0.867 | 1.029 |
| 40 | 1.161 | 1.144 | 0.988 | 1.123 |
| 45 | 1.268 | 1.266 | 1.153 | 1.254 |
| 50 | 1.379 | 1.399 | 1.295 | 1.394 |
| 55 | 1.592 | 1.553 | 1.396 | 1.592 |
| 60 | 1.739 | 1.667 | 1.543 | 1.680 |
| 65 | 1.907 | 1.855 | 1.855 | 1.859 |
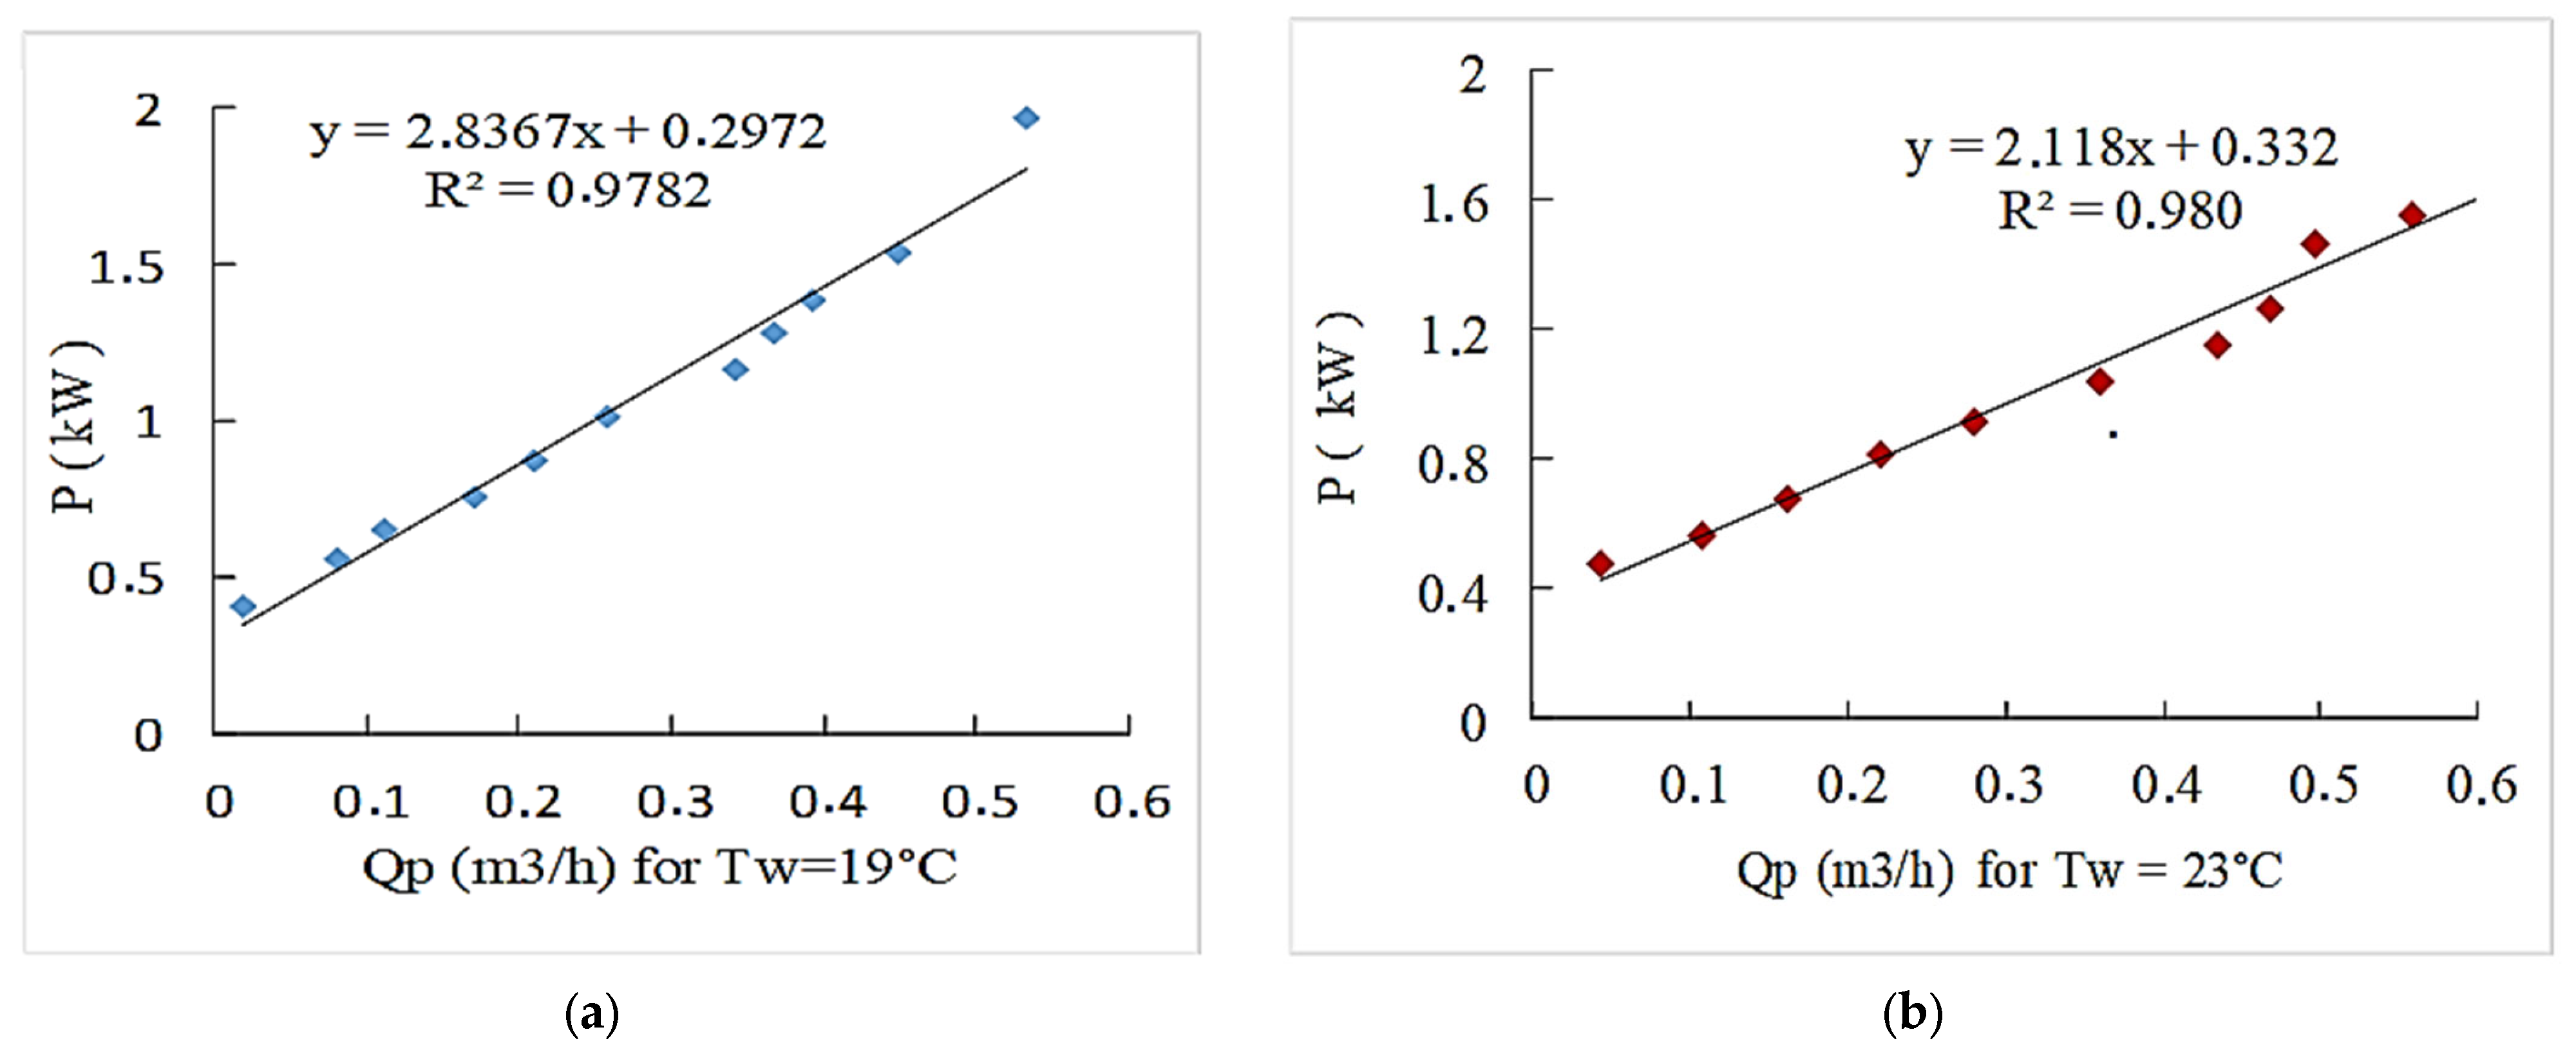
| Pressure (Bar) | kW Ta = 19 °C | kW Ta = 23 °C |
|---|---|---|
| 10 | 0.408 | 0.478 |
| 20 | 0.652 | 0.679 |
| 30 | 0.876 | 0.906 |
| 40 | 1.160 | 1.151 |
| 50 | 1.388 | 1.351 |
| 55 | 1.543 | 1.554 |
| 60 | 1.968 | 1.675 |
| Parameter | Unit | RO Water Measured by Experimental | RO Water Predicted by Theory |
|---|---|---|---|
| Recovery rate Y | (%) | 31.920 | 31.920 |
| Permeate flow QP | (m3/h) | 0.230 | 0.230 |
| Supply pressure PA | (bar) | 65 | 64.800 |
| Feed rate QA | (m3/h) | 0.711 | 0.7400 |
| Retentate flow QR | (m3/h) | 0.512 | 0.5100 |
| Electrical power Pe | (kW) | 1.800 | 1.700 |
| Electrical conductivity σ | (μs/cm) | 387 | 300 |
| TDS | (mg/L) | 197 | 161 |
Disclaimer/Publisher’s Note: The statements, opinions and data contained in all publications are solely those of the individual author(s) and contributor(s) and not of MDPI and/or the editor(s). MDPI and/or the editor(s) disclaim responsibility for any injury to people or property resulting from any ideas, methods, instructions or products referred to in the content. |
© 2023 by the authors. Licensee MDPI, Basel, Switzerland. This article is an open access article distributed under the terms and conditions of the Creative Commons Attribution (CC BY) license (https://creativecommons.org/licenses/by/4.0/).
Share and Cite
Tigrine, Z.; Aburideh, H.; Zioui, D.; Hout, S.; Sahraoui, N.; Benchoubane, Y.; Izem, A.; Tassalit, D.; Yahiaoui, F.Z.; Khateb, M.; et al. Feasibility Study of a Reverse Osmosis Desalination Unit Powered by Photovoltaic Panels for a Sustainable Water Supply in Algeria. Sustainability 2023, 15, 14189. https://doi.org/10.3390/su151914189
Tigrine Z, Aburideh H, Zioui D, Hout S, Sahraoui N, Benchoubane Y, Izem A, Tassalit D, Yahiaoui FZ, Khateb M, et al. Feasibility Study of a Reverse Osmosis Desalination Unit Powered by Photovoltaic Panels for a Sustainable Water Supply in Algeria. Sustainability. 2023; 15(19):14189. https://doi.org/10.3390/su151914189
Chicago/Turabian StyleTigrine, Zahia, Hanene Aburideh, Djamila Zioui, Sarra Hout, Naima Sahraoui, Yasmine Benchoubane, Amina Izem, Djilali Tassalit, Fatma Zohra Yahiaoui, Mohamed Khateb, and et al. 2023. "Feasibility Study of a Reverse Osmosis Desalination Unit Powered by Photovoltaic Panels for a Sustainable Water Supply in Algeria" Sustainability 15, no. 19: 14189. https://doi.org/10.3390/su151914189