Article

Study on the Impact of Different Parameters on Prediction of Crown Deformations in Underground Caverns

by
Kadiyala Sudhakar
1,*,
Rabindra Kumar Sinha
1 and
Sripad Ramachandra Naik
2
1
Department of Mining Engineering, Indian Institute of Technology (Indian School of Mines), Dhanbad 826004, India
2
National Institute of Rock Mechanics, Bengaluru 560070, India
*
Author to whom correspondence should be addressed.
Sustainability 2023, 15(17), 12851; https://doi.org/10.3390/su151712851
Submission received: 5 July 2023 / Revised: 17 August 2023 / Accepted: 21 August 2023 / Published: 25 August 2023
(This article belongs to the Special Issue Advances in Rock Mechanics and Geotechnical Engineering)

Abstract

:
Crown deformation is a major concern in the design and construction of underground caverns. It can lead to damage to the cavern structure and surrounding infrastructure and can also pose a safety hazard to workers. This paper studies the factors affecting crown deformation in underground caverns. A parametric study was conducted to investigate the effects of seven parameters on crown deformation: rock mass rating (RMR), uniaxial compressive strength (UCS), Young’s modulus of intact rock (Ei), Poisson’s ratio (υ), tensile strength (σt), angle of internal friction (φ), and cohesion (C). The results of the parametric study showed that the following parameters significantly affected crown deformation: RMR, UCS, Ei, and Φ. A multiple linear regression analysis was conducted to develop a regression equation to predict crown deformation. The coefficient of determination (R2) for the regression equation is 92.92%, which indicates that the equation is a good predictor of crown deformation. The parametric study results and the regression analysis can be used to improve the design and construction of underground caverns. By considering the factors that affect crown deformation, engineers can design more stable caverns that are less likely to experience deformations. The results of the study can be used to improve the design and construction of caverns, making them safer and more sustainable.

1. Introduction

Underground caverns are widely used for various purposes, such as housing hydroelectric machinery, storing crude oil, gas, and radioactive waste, conducting scientific research, and providing leisure amenities. Due to limited space availability and environmental concerns, construction of underground structures rapidly increased worldwide between the late 20th and early 21st century. Underground caverns have several advantages over surface structures, such as reduced land occupation, higher security, lower cost, and increased environmental benefits. From a sustainability perspective, underground caverns offer several advantages over surface structures: they can help to reduce land occupation, which can help to preserve natural habitats and reduce the impact of development on the environment; they can also help to reduce noise and air pollution; and they can provide a more secure environment for storing hazardous materials. As the world population continues to grow and the demand for resources increases, underground caverns are likely to play an increasingly important role in sustainable development.
However, the stability of these caverns is a critical concern, as most of them are constructed in complex geology and stress conditions, which influences the deformation pattern of the caverns, which, in turn, can lead to structural failure and safety hazards. Sometimes, larger crown failures in caverns hamper the project time, escalate the cost, and cause overruns. Hence, the study of the behavior of the crown prior to the excavation of caverns is essential. The stability of the crown of the cavern is an important consideration as the deformation is influenced by several parameters, such as the size and shape of the cavern, the rock cover, the rock type, the in situ stress field, the geology and rock mass properties, and the construction practices. Therefore, it is essential to understand how these parameters affect crown deformation and to develop reliable methods for predicting and controlling it.
Previous studies have investigated some aspects of crown deformation in underground caverns, such as the effect of cavern geometry, rock cover, rock type, in situ stress, geology and rock mass properties, and construction practices [1,2,3,4]. However, most of these studies have focused on specific cases or locations and have not provided a comprehensive and systematic analysis of the impact of different parameters on crown deformation. Moreover, most of these studies have used empirical or analytical methods that have limitations in capturing the complex behavior of rock masses and caverns.
In this paper, we present a unique study on the impact of different parameters on the prediction of crown deformation in underground caverns. We use a numerical modeling approach based on the finite element method (FEM), which can account for the nonlinear and heterogeneous characteristics of rock masses and caverns. We consider a wide range of parameters that cover various aspects of cavern design and site conditions. We conduct a series of parametric analyses to examine how each parameter affects the crown deformation and to identify the most influential ones. A comprehensive statistical analysis with multiple linear regression models was carried out to bring out the most important factors affecting crown deformation.
The advantage of this research is that the empirical equation developed for predicting crown deformation may become a handy tool for practicing engineers in the estimation of the behavior of crowns prior to excavation. The crown deformations predicted in this study can assist in selecting the optimal range of the instruments. The predicted deformations are helpful in setting the warning limits in deformation monitoring and reviewing the planned support systems. Overall, it can be beneficial in terms of project cost savings and the safety of manpower and machinery during construction time. Hence, study of the cavern crown areas is essential. The results of the study can be used to improve the design and construction of caverns, making them safer and more sustainable.

2. Overview of Factors Affecting Crown Deformation

The size and shape of an underground cavern are important factors that affect its crown deformation. Arch-shaped crowns with straight high walls are the most common shape for underground caverns [2]; this shape provides good stability and minimizes stress concentration. However, larger hydro caverns are being constructed as the demand for power increases. These larger caverns may be more susceptible to crown deformation due to their increased span, height, and length.
Another factor affecting crown deformation is the rock cover over the cavern. Caverns at shallow depths with reasonably good-strength rock mass evidence instabilities observed in the form of small wedges [3]. These wedges are formed by intersecting joints or fractures in the rock mass and may detach from the roof under gravity or water pressure. Caverns at deeper depths with low-strength rock mass may experience large-scale failure or collapse due to high stress and low confinement.
Rock mass properties, such as the rock mass rating (RMR), density, strength parameters, and friction angle, are also important factors affecting an underground cavern’s crown deformation.
The in situ stress field is another important factor affecting an underground cavern’s crown deformation. It is influenced by tectonic forces, gravity, topography, and geological structures. Generally, the long axis of the caverns is aligned in the direction of the major principal stress to reduce stress concentration and optimize stability. However, the magnitude and direction of in situ stresses can vary depending on the location of the cavern. The maximum stress concentration factor in the pillar owing to vertical stress is unaffected by cavern orientation [5].
The geology and rock type of the area where the cavern is being constructed are also important factors that affect its crown deformation. Strong, well-bonded rock is generally more stable than weak, fractured rock; for example, an underground cavern built at India’s Peninsular Gneissic complex has a rock type of granitic gneiss, which is strong to extremely strong and traversed by three–four sets of notable discontinuities, including a sub-horizontal joint set of dolerite dykes. The dolerite dykes are weak to medium strong, closely joined with several sets of joints, and brittle. This may significantly modify stresses and displacements in underground openings [3].
The underground powerhouse located in Deccan basalt flows intruded by dolerite dykes and sill seems to be good for tunneling. However, during the construction stage, geotechnical problems such as wedge-type roof falls and vertical and horizontal cracks were observed on sides of the roof and walls [6].

Methodologies Used for the Prediction of Displacements

The prediction of crown deformations in large underground caverns is a complex problem that can be addressed using a variety of methodologies. These methodologies can be broadly categorized into three main groups: analytical, numerical, and empirical.
Analytical methods are based on theoretical models of rock mechanics that can estimate the magnitude and distribution of deformations under idealized conditions. However, these methods have limitations in accounting for the complex geological and geotechnical conditions encountered in real-world projects. One of the most common analytical methods for predicting crown deformation is the convergence–confinement method. This method assumes that the rock mass behaves elastically and that the deformations are governed by the in situ stresses and the geometry of the opening. The convergence–confinement method can estimate the overall convergence of an underground opening but it cannot be used to predict the distribution of deformations within the opening.
Numerical methods are based on computational models that can simulate the excavation of underground caverns and the subsequent deformation of the surrounding rock mass. Numerical methods can account for a wide range of factors, such as the geometry of the cavern, the properties of the rock mass, and the in situ stresses. One of the most widely used numerical methods for predicting crown deformation is the finite element method (FEM). The FEM is a powerful numerical method that can capture complex phenomena and interactions in underground structures. FEM models can be used to account for a wide range of factors, including the geometry of the cavern, the properties of the rock mass, and the in situ stresses. However, FEM models can be computationally expensive to develop and run and can be sensitive to input parameters.
The patterns of deformation, stress status, and distribution of plastic areas for the stability of the huge underground caverns were analyzed and assessed using Rocscience RS2-FEM software [7]. In Greece, the convergence of shallow tunnels (30–120 m overburden thickness) built in various rock bodies has been evaluated as a function of the geological strength index (GSI classification). Maximum vertical and horizontal convergence predictions were made using the FEM and the ‘characteristic line’ theory during or shortly after tunnel excavation. They were found to be in good accord, with geodetic observations of convergence taken about two months following the excavation [8]. The cavern behavior was investigated using 3D numerical modeling (FEM analysis) and geotechnical instrumentation monitoring to study the sensitive parameters for prediction of convergence [5]. The horseshoe cavern stability was studied using 3DEC under various scenarios in terms of deformations at various points. The dynamic nature of underground construction and rock mass behavior, as well as timing and interpretation (installation of monitoring target and recorded data), are critical for understanding the stability of excavated structures [9].
The effect of the lateral-stress-to-vertical-stress ratio, cavern height, overburden depth, and deformation modulus was investigated and produced as an elastoplastic displacement prediction equation for the cavern’s high side wall. This method was used to determine the deformation key sites for a cavern [10].
Empirical methods for predicting the crown deformation of underground caverns are based on observational data and empirical relationships that can predict deformations based on previous experiences and cases. Empirical methods can provide practical and simple solutions for predicting crown deformation, but they may not be applicable to all situations and conditions. This approach is often used in conjunction with analytical or numerical methods to improve the accuracy of predictions.
One of the most common empirical methods for predicting crown deformation is regression analysis. Regression analysis can be used to fit a mathematical equation to a set of data points. The equation can then be used to predict crown deformations for new projects with similar characteristics. Another empirical method for predicting crown deformation is the neural network. Neural networks are machine learning algorithms that can learn complex relationships between variables. Neural networks have been used to predict crown deformations by training them on datasets that contain information about crown deformation and the factors that affect it. Once a neural network is trained, it can be used to predict crown deformation for new projects.
Alongside the above-mentioned methodologies, other methods have been used to predict crown deformations in underground caverns. These methods include the following:
  • Support vector machines (SVMs): SVMs are machine learning algorithms that can classify data or predict continuous values. SVMs have been used to predict crown deformations by developing models that relate deformation to various parameters, such as rock mass properties, in situ stresses, and excavation methods.
  • Artificial neural networks (ANNs): ANNs are another type of machine learning algorithm that can be used to predict crown deformations. ANNs are trained on datasets that contain information about crown deformation and the factors that affect it. Once an ANN is trained, it can be used to predict crown deformation for new projects.
  • Monte Carlo simulation: Monte Carlo simulation is a statistical method that can be used to estimate the probability of various outcomes. Monte Carlo simulation has been used to predict crown deformations by simulating the excavation of an underground cavern multiple times with different random values for the input parameters. The results of the simulations can then be used to estimate the probability of different levels of crown deformation.
Some examples of empirical methods applied to specific cases are as follows.
An evolutionary SVM approach was devised using a combination of SVM and the genetic algorithm for generating a time series analysis of nonlinear slope deformation. The results demonstrate that the established SVMs can accurately describe the evolutionary law of geomaterial deformation at depth and predict the following 6–10 time steps with sufficient accuracy and confidence [11]. ANN approaches were used to thoroughly combine information from monitoring observations and investigations to create two dimensionless indices. The first indicates the predisposition of a portion of the rock mass to destruction, dislocation, and deformation—CPRF—coefficient of roof fall—predisposition, and the second represents the predisposition and possibility of maintaining the working—CMRF coefficient of roof fall—maintenance [12].
The surrounding rock stability of an underground cavern group is an essential issue in the process of cavern excavation, which has the characteristics of large displacement, discontinuity, and uneven deformation, making computation and analysis difficult. By observing the destruction process of a jointed rock mass, the discontinuous deformation analysis for the rock failure approach was used to analyze the stability of the surrounding rock [13]. A support vector machine (SVM) is used to forecast the allowed deformation of surrounding rock. One-hundred sets of multi-factor and multi-level orthogonal experiments are constructed and simulated using ABAQUS-based two-dimensional numerical models. Three parameters are considered: rock mass categorization, cavern buried depth, and cavern size. The mapping association between permitted deformation and the three influencing factors described above is established [13].
The choice of methodology for crown deformation prediction will depend on several factors, including the size and complexity of the cavern, the availability of data, and the desired level of accuracy. A combination of analytical, numerical, and empirical methods is often used to achieve the most reliable results.

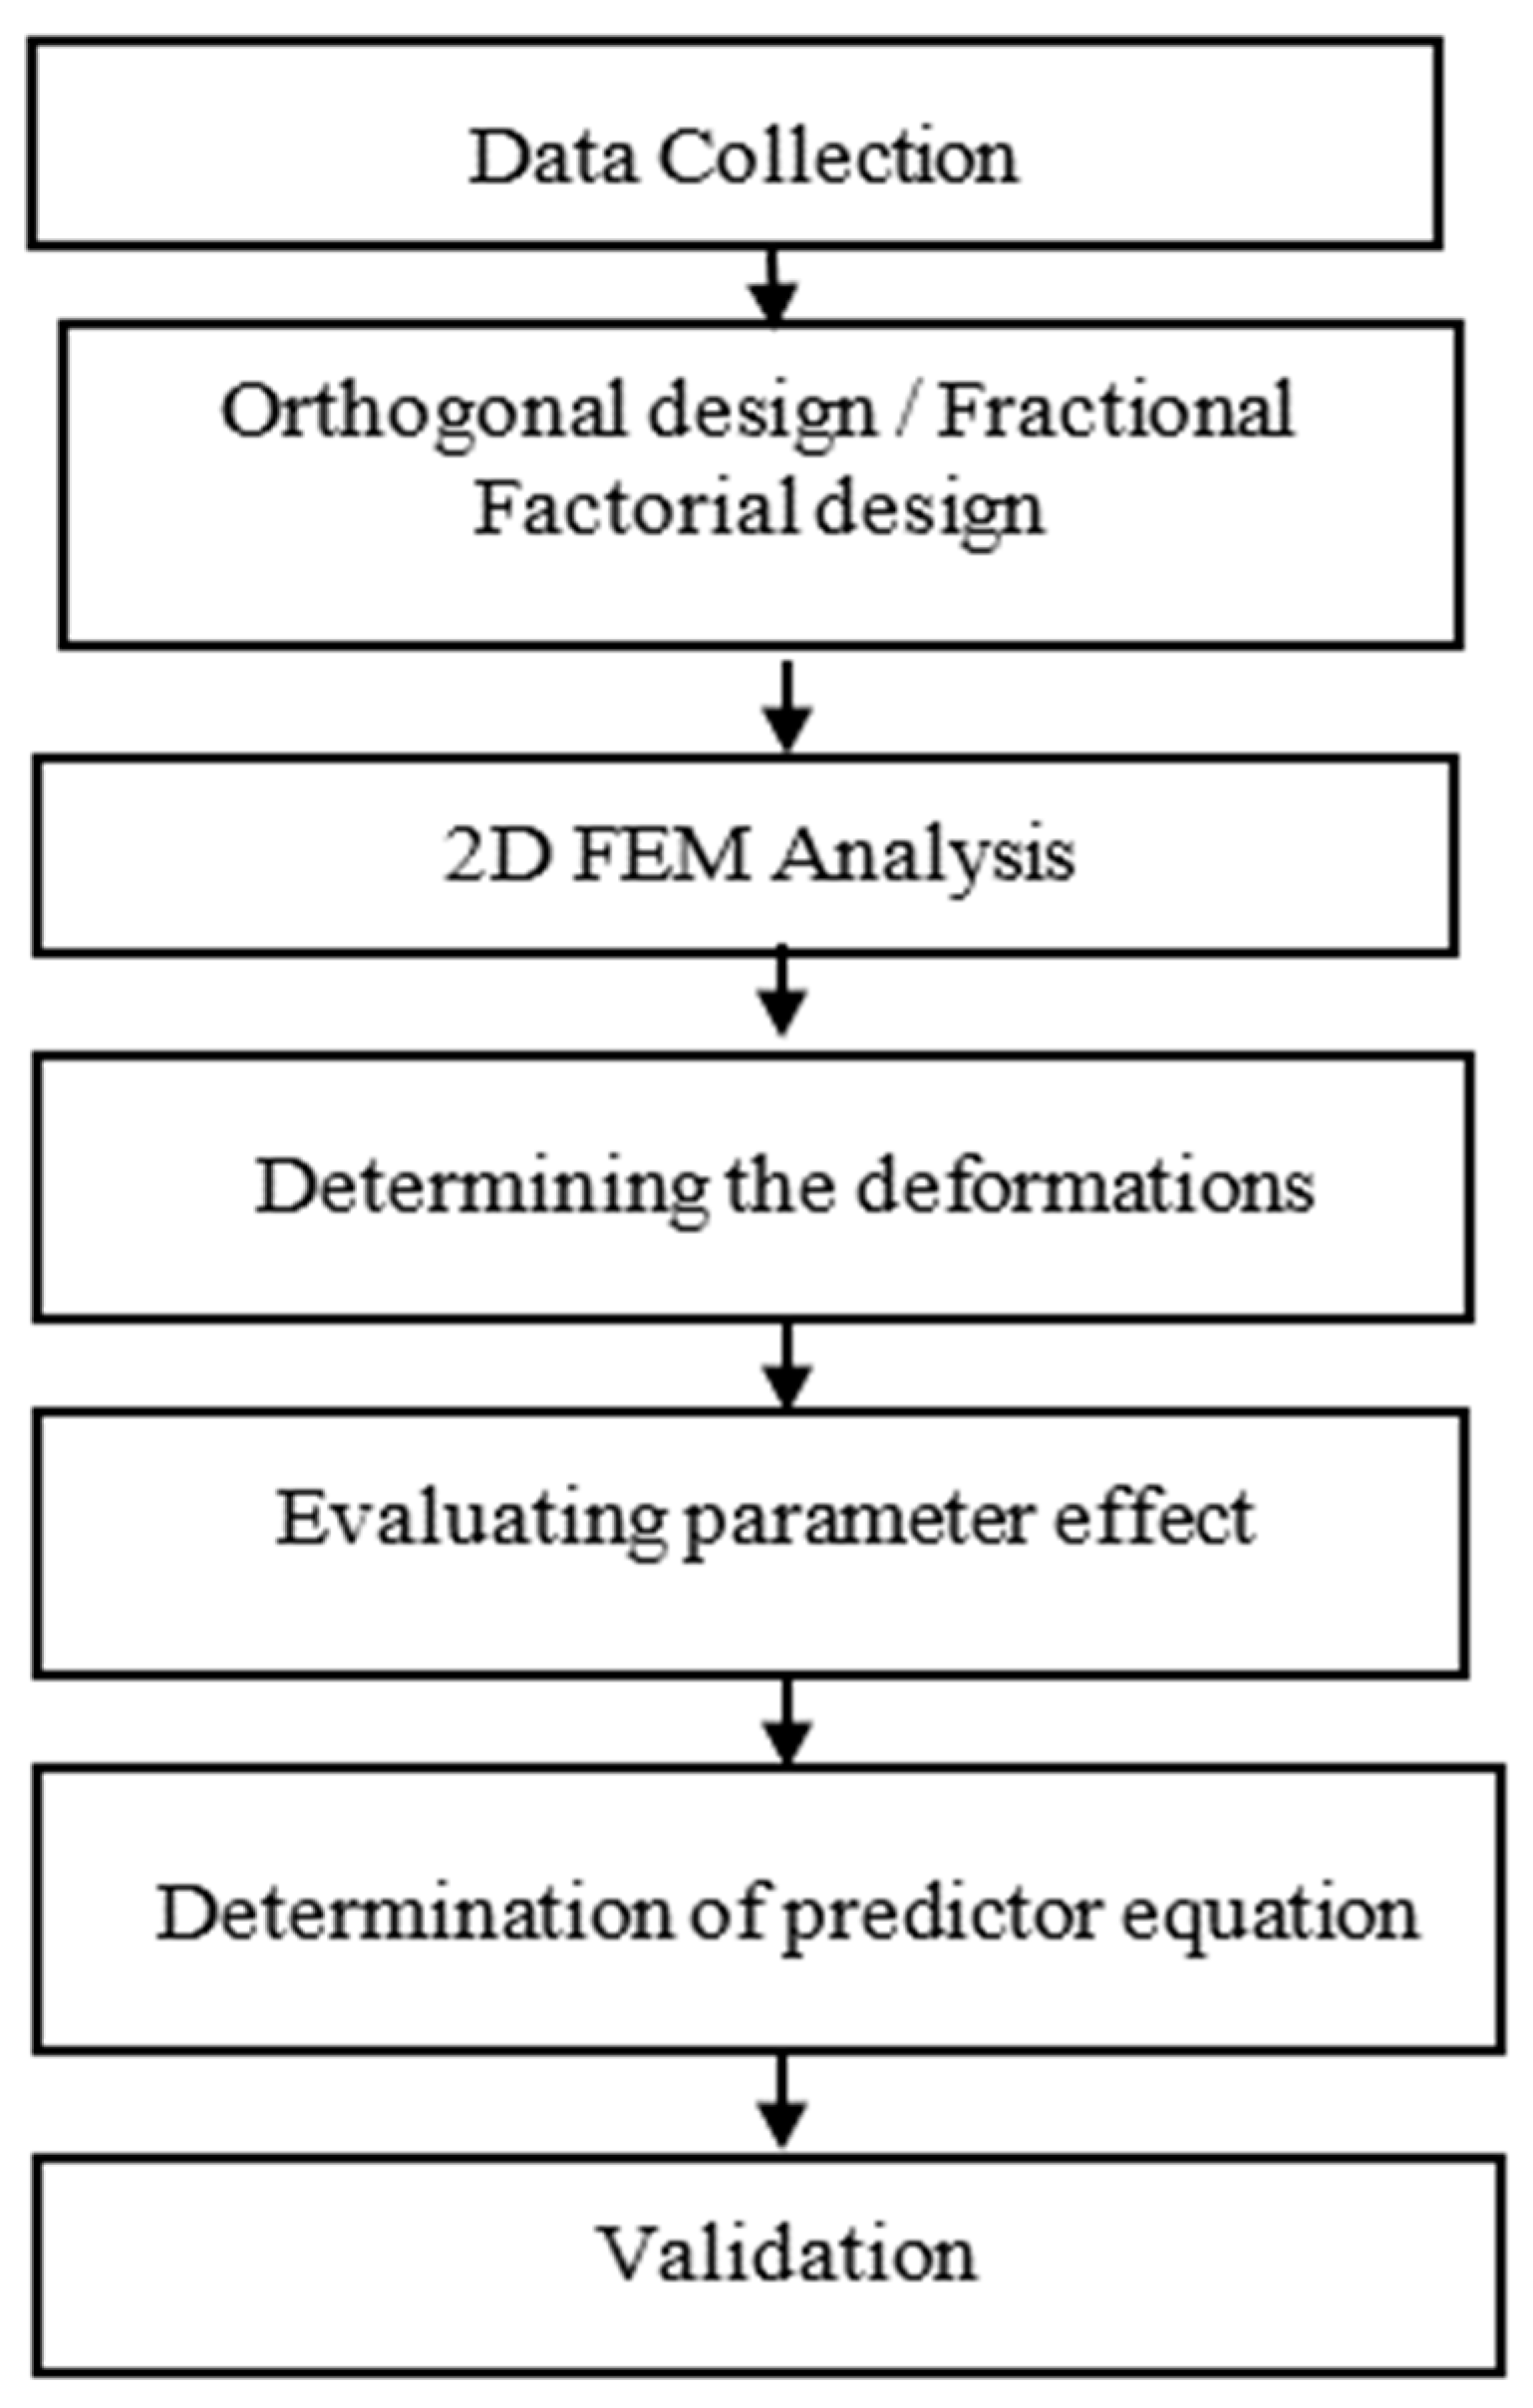
3. Study Methodology

The current study examines the stability analysis of underground structures based on factors for rock mass utilizing various prediction techniques. The study methodology is shown in Figure 1.

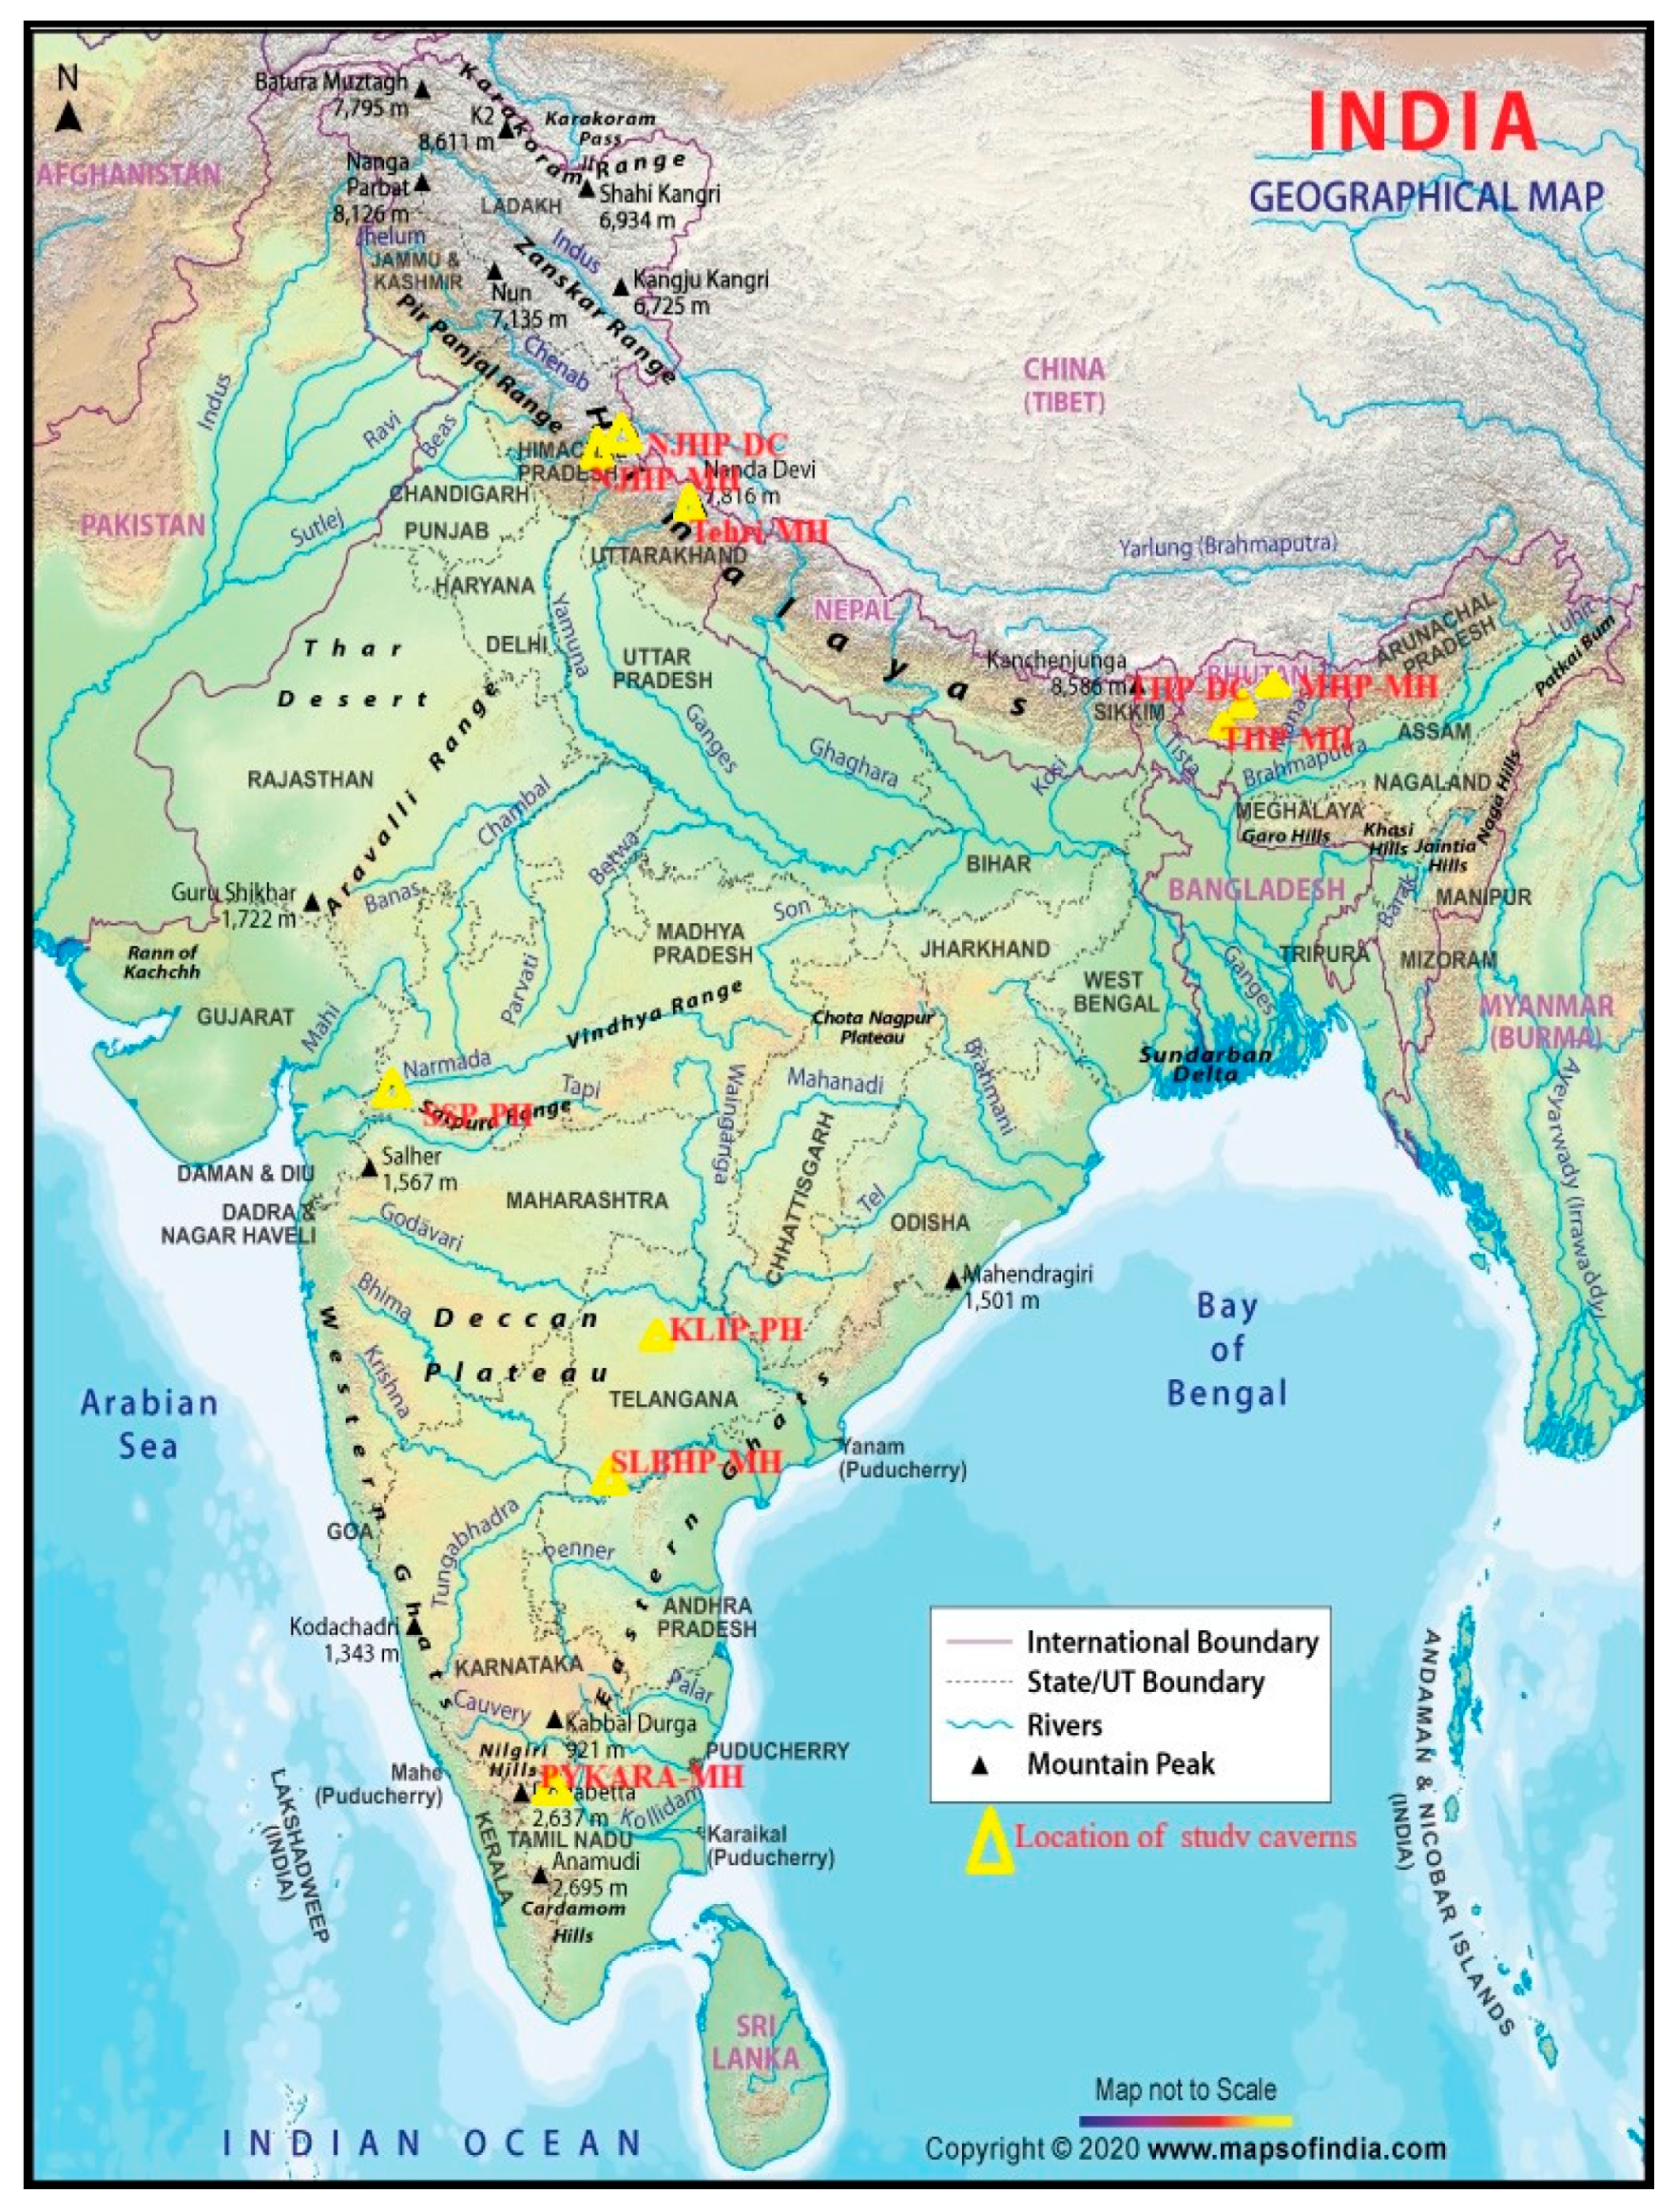
3.1. Data Collection

The first step in the study methodology is to collect data from case studies of underground caverns in various geological contexts. The data collected include the following:
  • Geometrical data include the size and shape of the cavern, the rock cover, and the in situ stress conditions;
  • Rock mass properties include the rock mass rating, the strength parameters for compression, tension, cohesion, friction angle, and Poisson’s ratio;
  • Mechanical characteristics of intact rock samples, such as the uniaxial compressive strength and the tensile strength;
  • Instrumentation data; in particular, the measurements of crown displacement made with extensometers.
The data for this study were collected from a variety of sources, including previous research papers, government reports, and industry databases.
The next step in the study methodology is to develop an empirical relationship for the prediction of crown displacements. This relationship will be based on the data collected from the case studies. The relationship will be developed using numerical and statistical methods such as design of experiments (DOE) and regression analysis. Once the empirical relationship has been developed, it was validated using data from additional case studies. The validation process will involve comparing the predicted crown displacements to the actual crown displacements that were measured in the case studies. The final step in the study methodology is to draw conclusions about the effectiveness of the empirical relationship. The conclusions will be based on the results of the validation process.
The study methodology outlined above is a rigorous and systematic approach to develop and validate empirical relationships for predicting crown displacements in underground caverns. The methodology can be used to develop empirical relationships for a variety of underground caverns, regardless of the geological context.
About three–four instrumented sections of data were collected at each cavern. Figure 2 depicts the precise location information for the caverns considered for this investigation. Table 1 displays the parameter’s possible range used in this investigation and to study the deformations.

3.2. Description and Overview of the Data Collected

The data collected for this study include the following:
  • Geometry: The dimensions of the caverns range from 100 to 525 m in length, 14 to 26 m in width, and 18.55 to 57 m in height.
  • Overburden depth: The rock cover of the caverns ranges from 42 to 532 m.
  • Rock type: The surrounding rock of the caverns ranges from soft rock to medium-hard rocks, such as phyllites and charnockite. The amygdaloidal and porphyritic basalt flows that make up the rocks of the Sardar Sarovar Project underground powerhouse cavern are separated by pockets of agglomerate [6]. The Tala Powerhouse Cavern is located on the southern slopes of the eastern Himalayas, not far from the MCT (Main Central Thrust). This major thrust zone is the boundary between the Lesser and Higher Himalayas. Most of the rocks in the powerhouse are phyllitic quartzite, quartzite, phyllites, and amphibolite schist.
  • Physico-mechanical properties: The specimens were prepared from intact rock samples from the project sites. Following ISRM guidelines, specimens were examined at the NIRM laboratory to determine their physical and mechanical characteristics during cavern design and construction [26]. These are needed as input data for numerical modelling.
  • The following are the physico-mechanical properties of the intact rock samples:
  • Uniaxial compressive strength (UCS): The UCS ranges from 34 to 250 MPa for undamaged rock samples;
  • Young’s modulus (Ei): The intact rock’s Young’s modulus ranges from 20 to 100 GPa;
  • Poisson’s ratio (υ) and tensile strength (σt): These parameters range from 0.16 to 0.38 and 0.03 to 1.7 MPa, respectively;
  • Internal friction has an angle (φ) ranging from 32.84° to 68.41°;
  • Cohesion (c): The samples’ cohesion values range from 0.48 to 3.09 MPa.

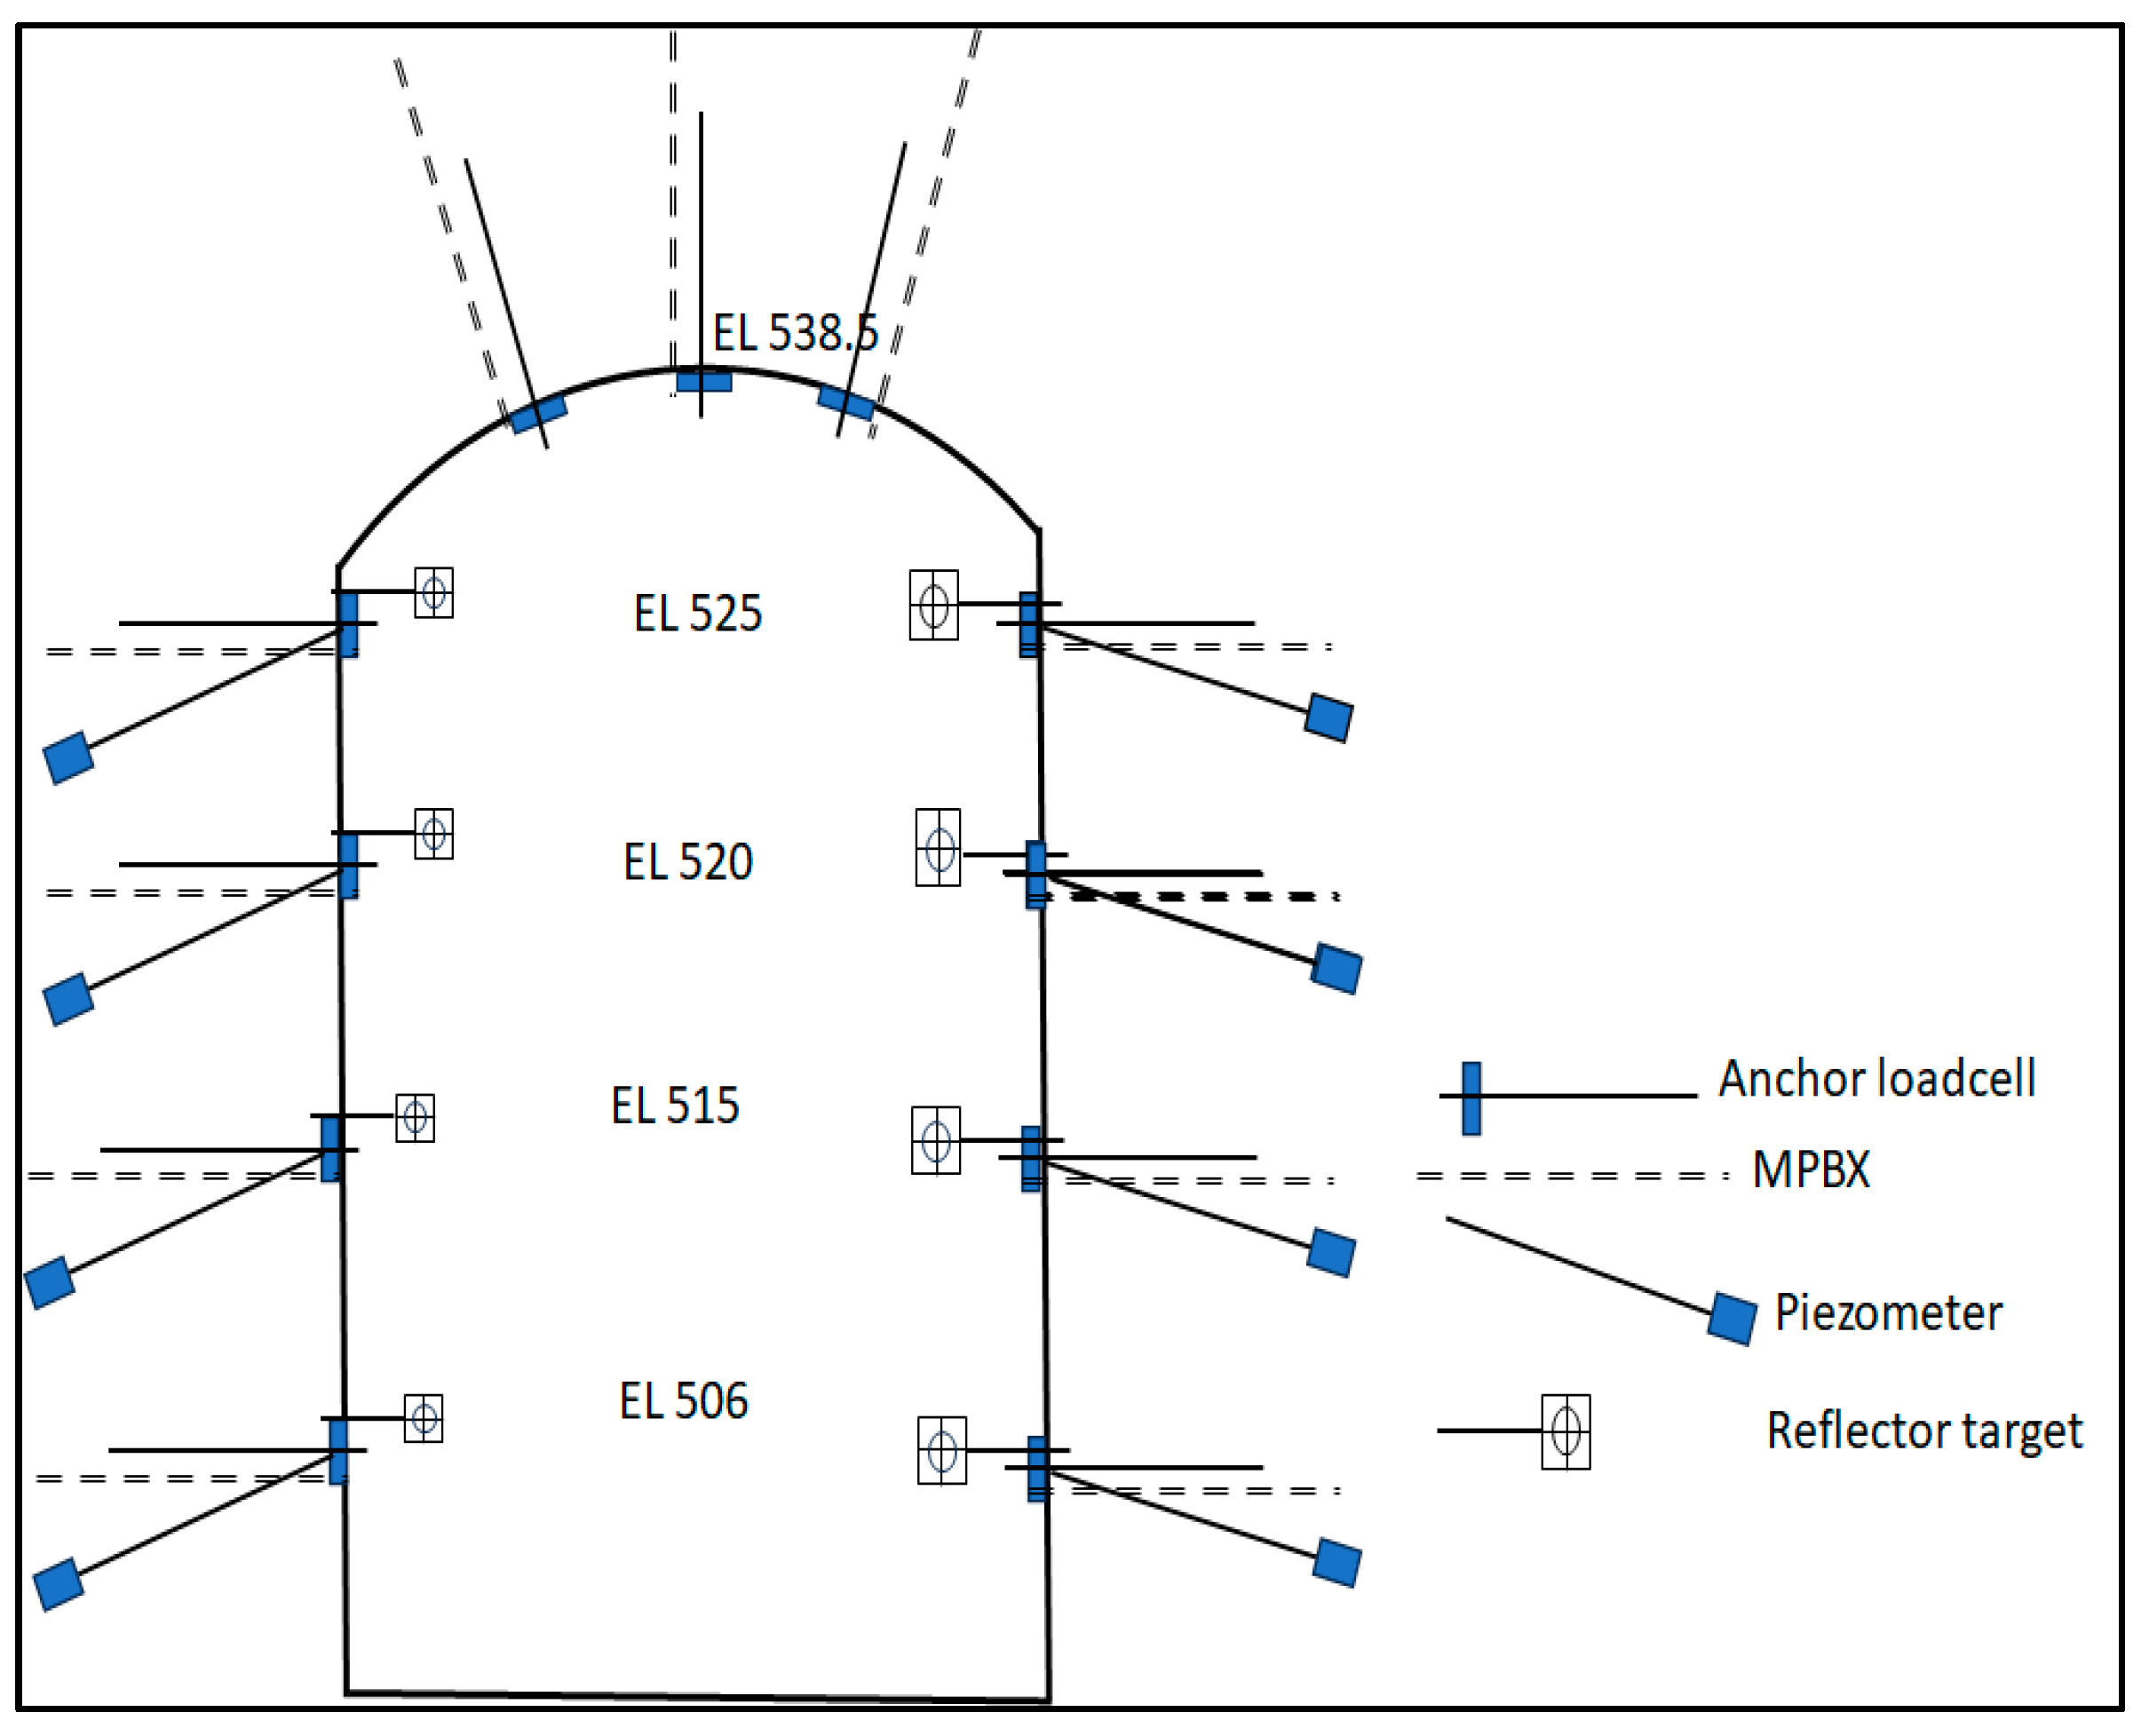
4. Instrumentation and Monitoring

Instrumentation and monitoring play a vital role in the construction and operation of underground caverns. They help to ensure the safety and stability of the structure by providing data on rock movement, pore water pressure, and the load on support elements.
The instrumentation layout for large underground caverns typically includes the following:
  • Extensometers: These devices measure deformations in the surrounding rock mass;
  • Anchor load cells: These devices measure the load on support elements, such as bolts and anchors;
  • Piezometers: These devices measure pore water pressure in the rock mass;
  • Convergence targets: These devices measure the convergence of the roof and side walls of the cavern;
  • Rock bolt stress meters: These devices measure the stress buildup along the length of rock bolts.
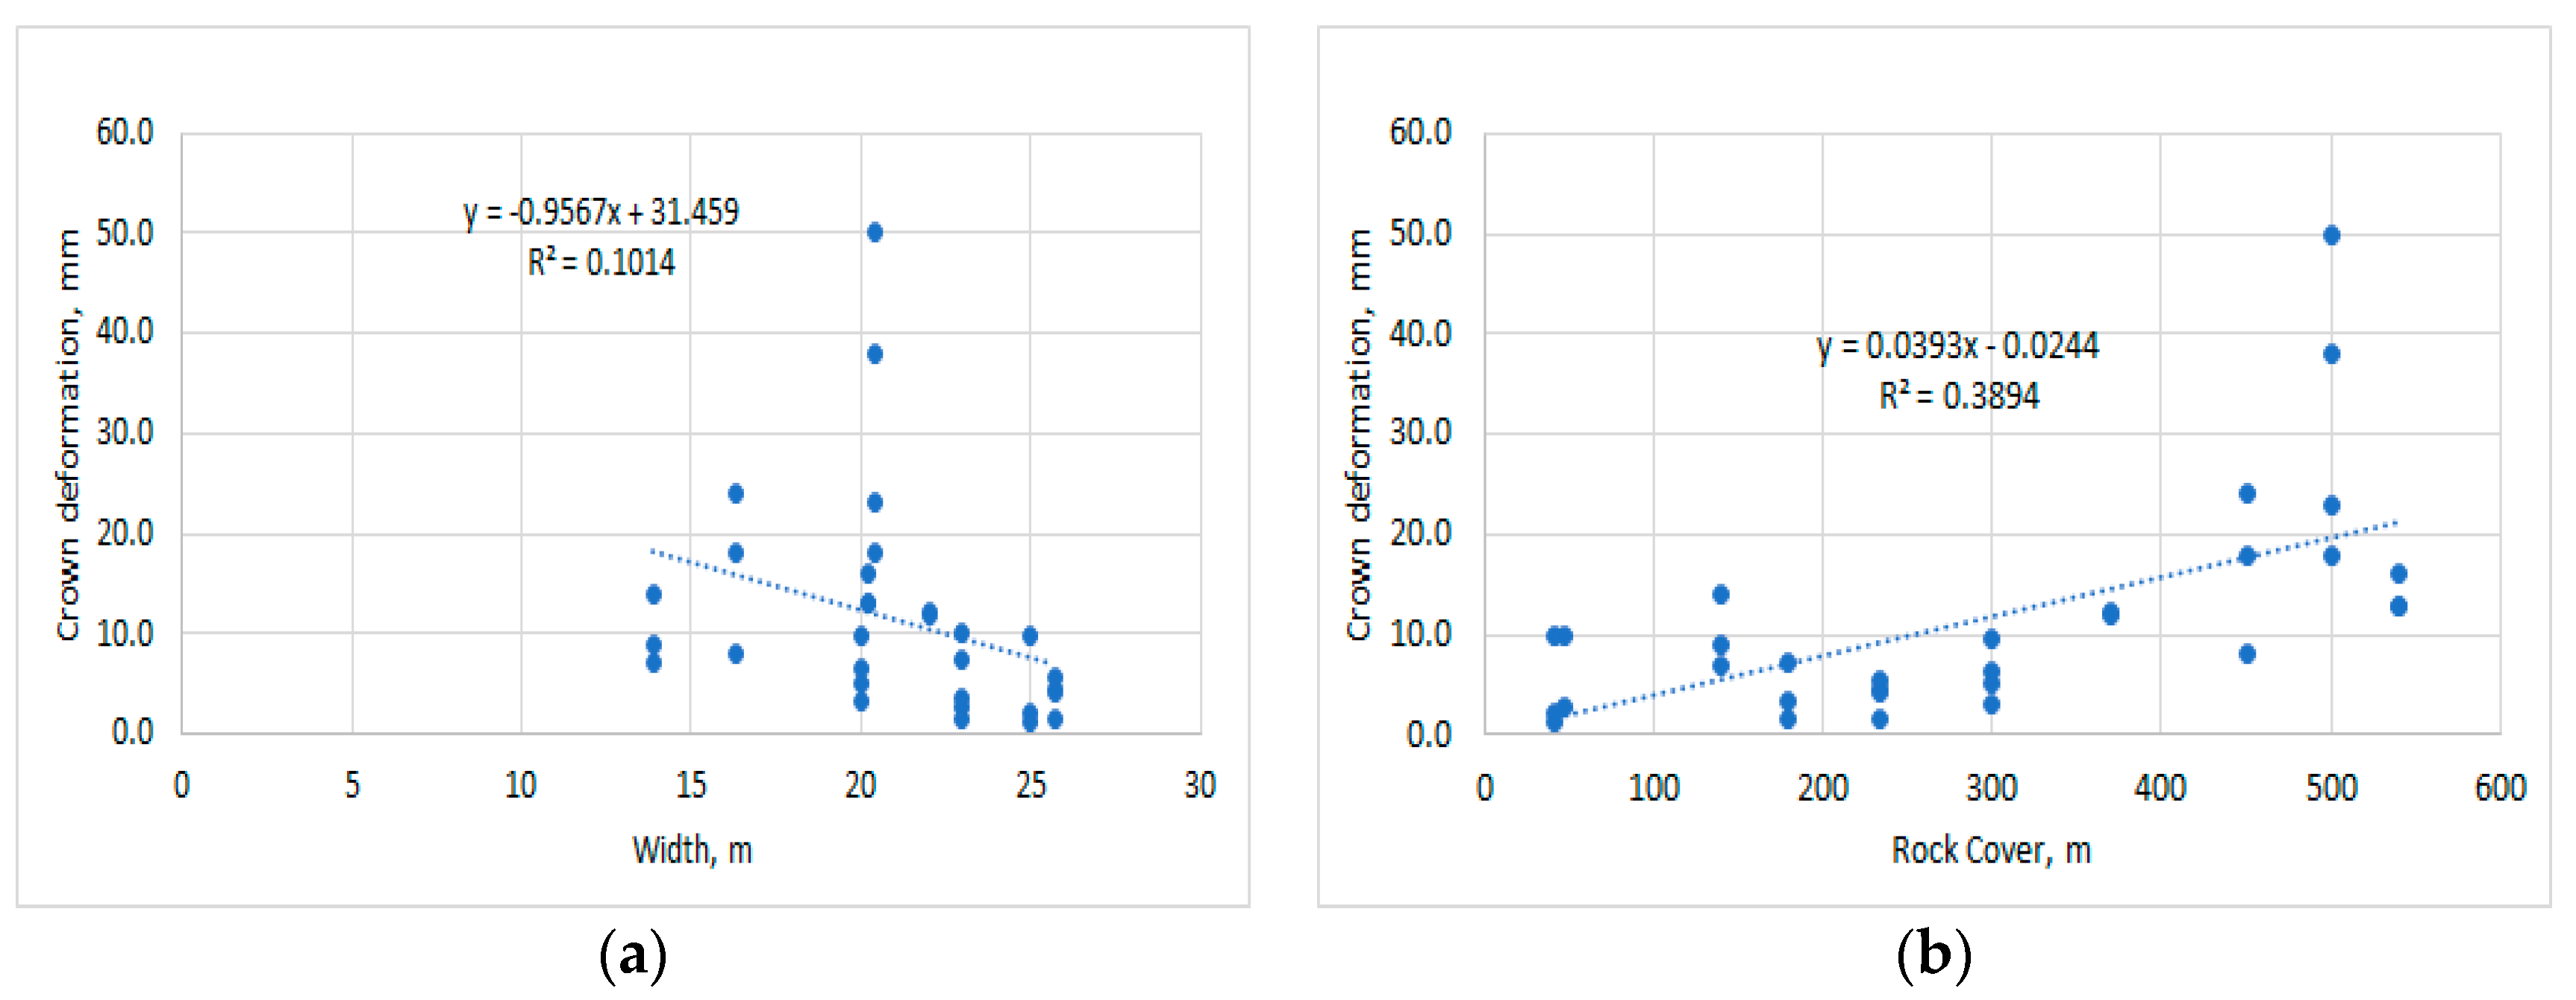
The type of instrumentation used can vary depending on the project’s specific needs. Simple mechanical instruments are often used for initial monitoring, while more sophisticated remote-type instruments may be used for long-term monitoring.
The effectiveness of the support systems and rock mass stability is verified by monitoring the support elements using loadcells and deformations using the MPBX and identifying the crucial zones of the powerhouse and transformer caverns [15,27]. The sophistication and remoteness of instruments increase with a decrease in the stability of the structure [28].
An extensive geotechnical instrumentation and monitoring program was carried out at the Ingula hydropower caverns to validate design assumptions and monitor long-term creep effects. The results of this monitoring program showed that most of the time-dependent deformation in the power caverns was expected to occur within 6 months to a year following excavation down to the operating floor level [29].
In the last four decades, major hydropower caverns built in India and Bhutan, oil storage caverns, and pump house caverns built in India were instrumented and monitored during construction for their safety and stability. Normally, about four–five sections or more of instrumentation arrays cover the full length of the cavern. Figure 3 explains the typical instrumentation layout of a large cavern section.

5. Data Analysis

Initially, data were collected from all ten caverns selected for the present study. The data were checked and sorted, with 31 sections of crown displacements data and the surrounding rock mass conditions. Later, we checked for correlations between measured displacements and variables from geometry, overburden height, and rock mass properties. Finally, we plotted the correlation effect of crown deformations with the selected parameters in Figure 4a–h. The correlation coefficient matrix between the selected variables is shown in Table 2.
The following are the findings from the correlation matrix:
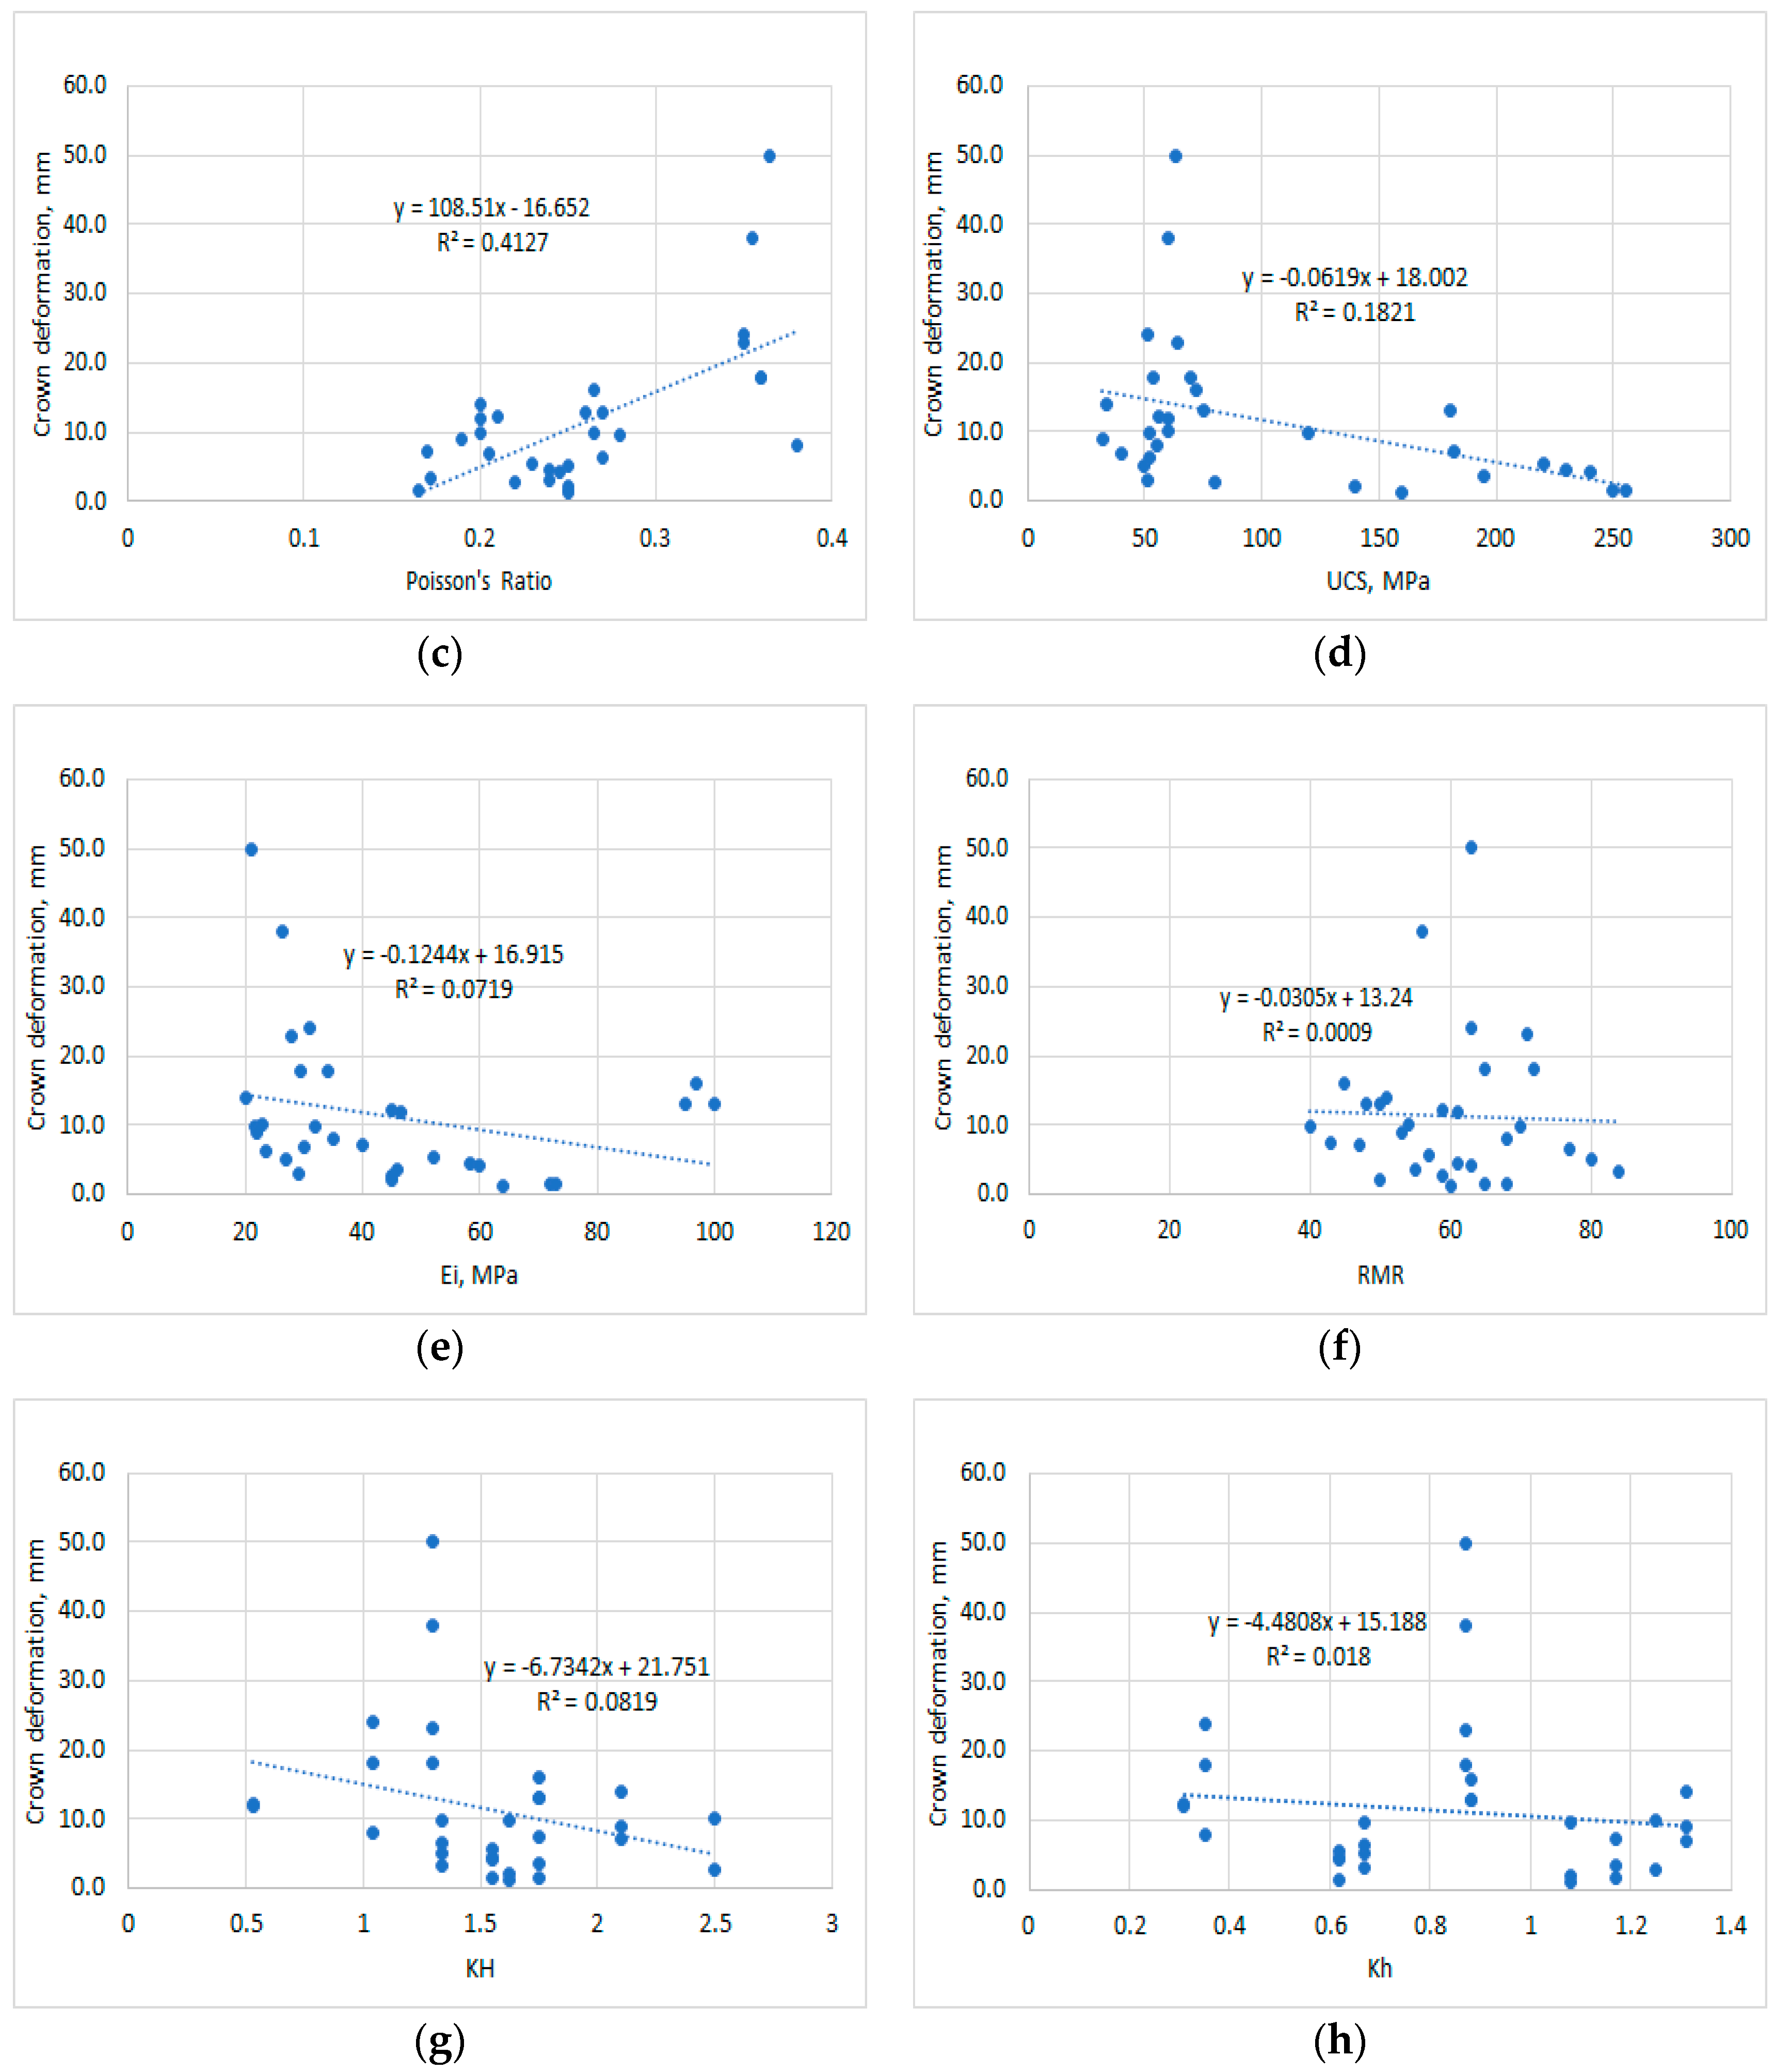
  • There is a strong positive correlation between crown displacement rock cover and Poisson’s ratio;
  • There is a weak negative correlation between crown displacement and UCS (Young’s modulus);
  • There is no significant correlation between crown displacement and other rock mass properties such as RMR, cohesion, and tensile strength; however, there is some nonlinear relation between these parameters and crown displacements.

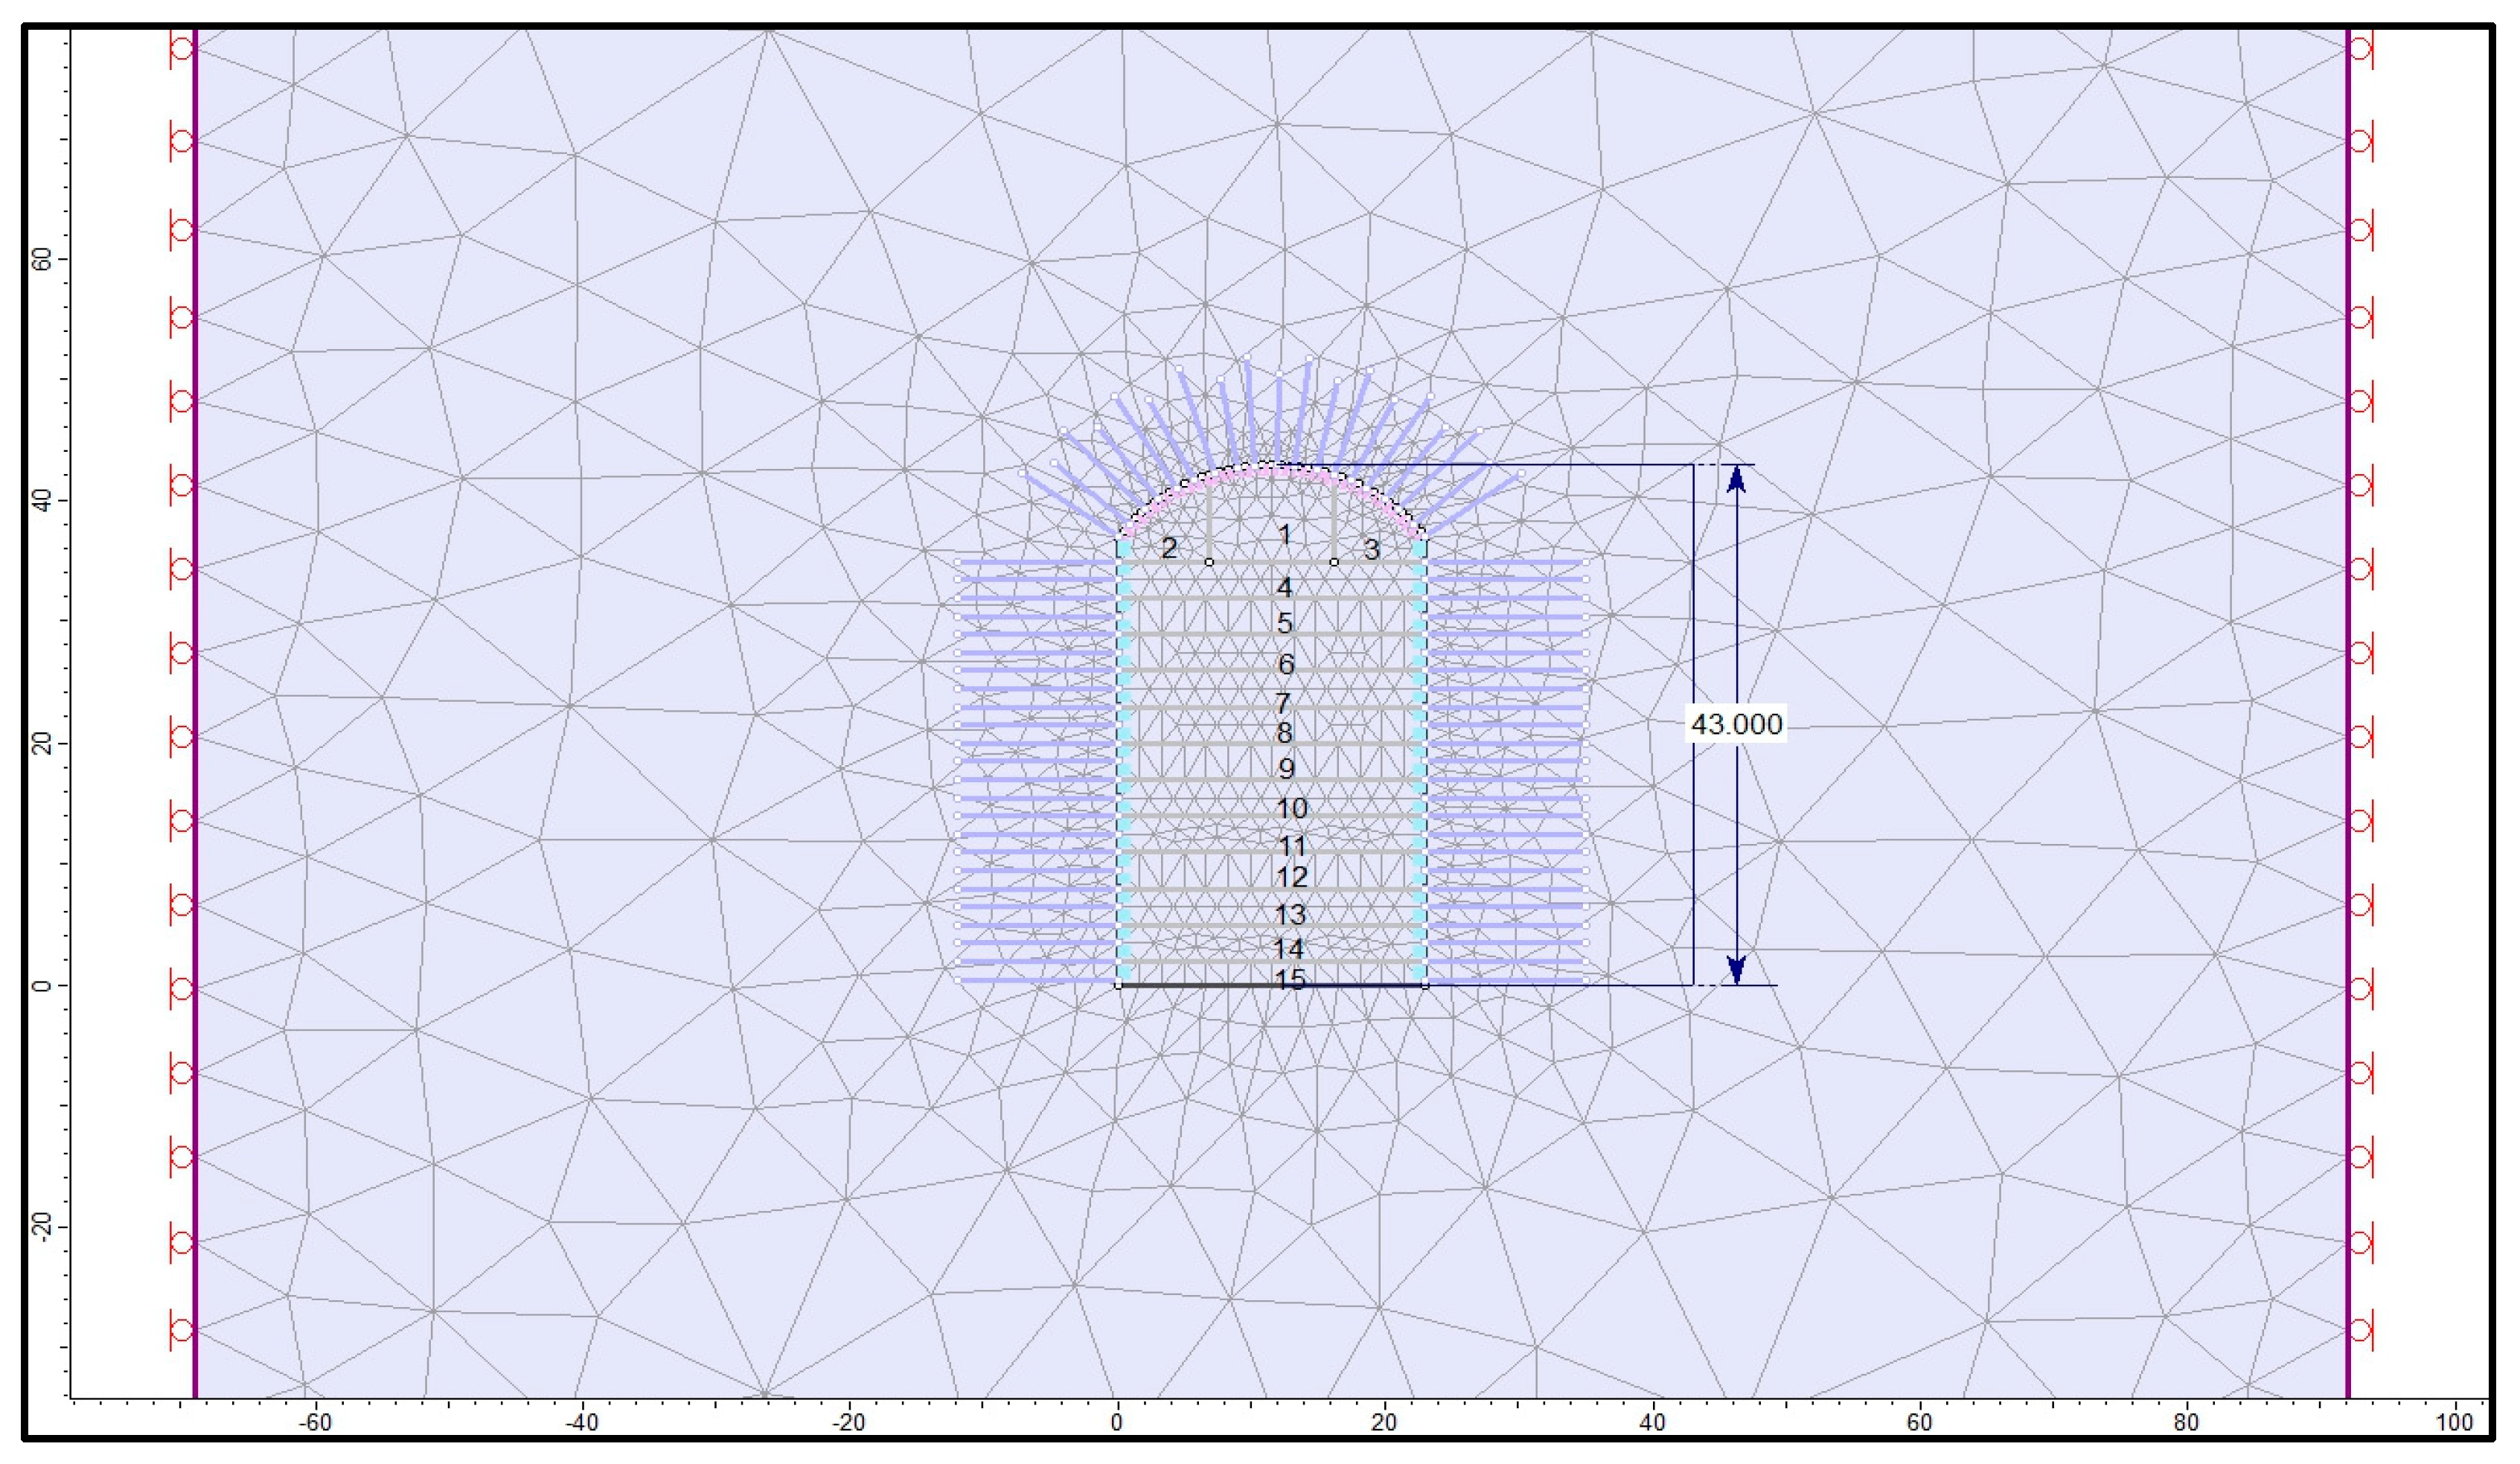
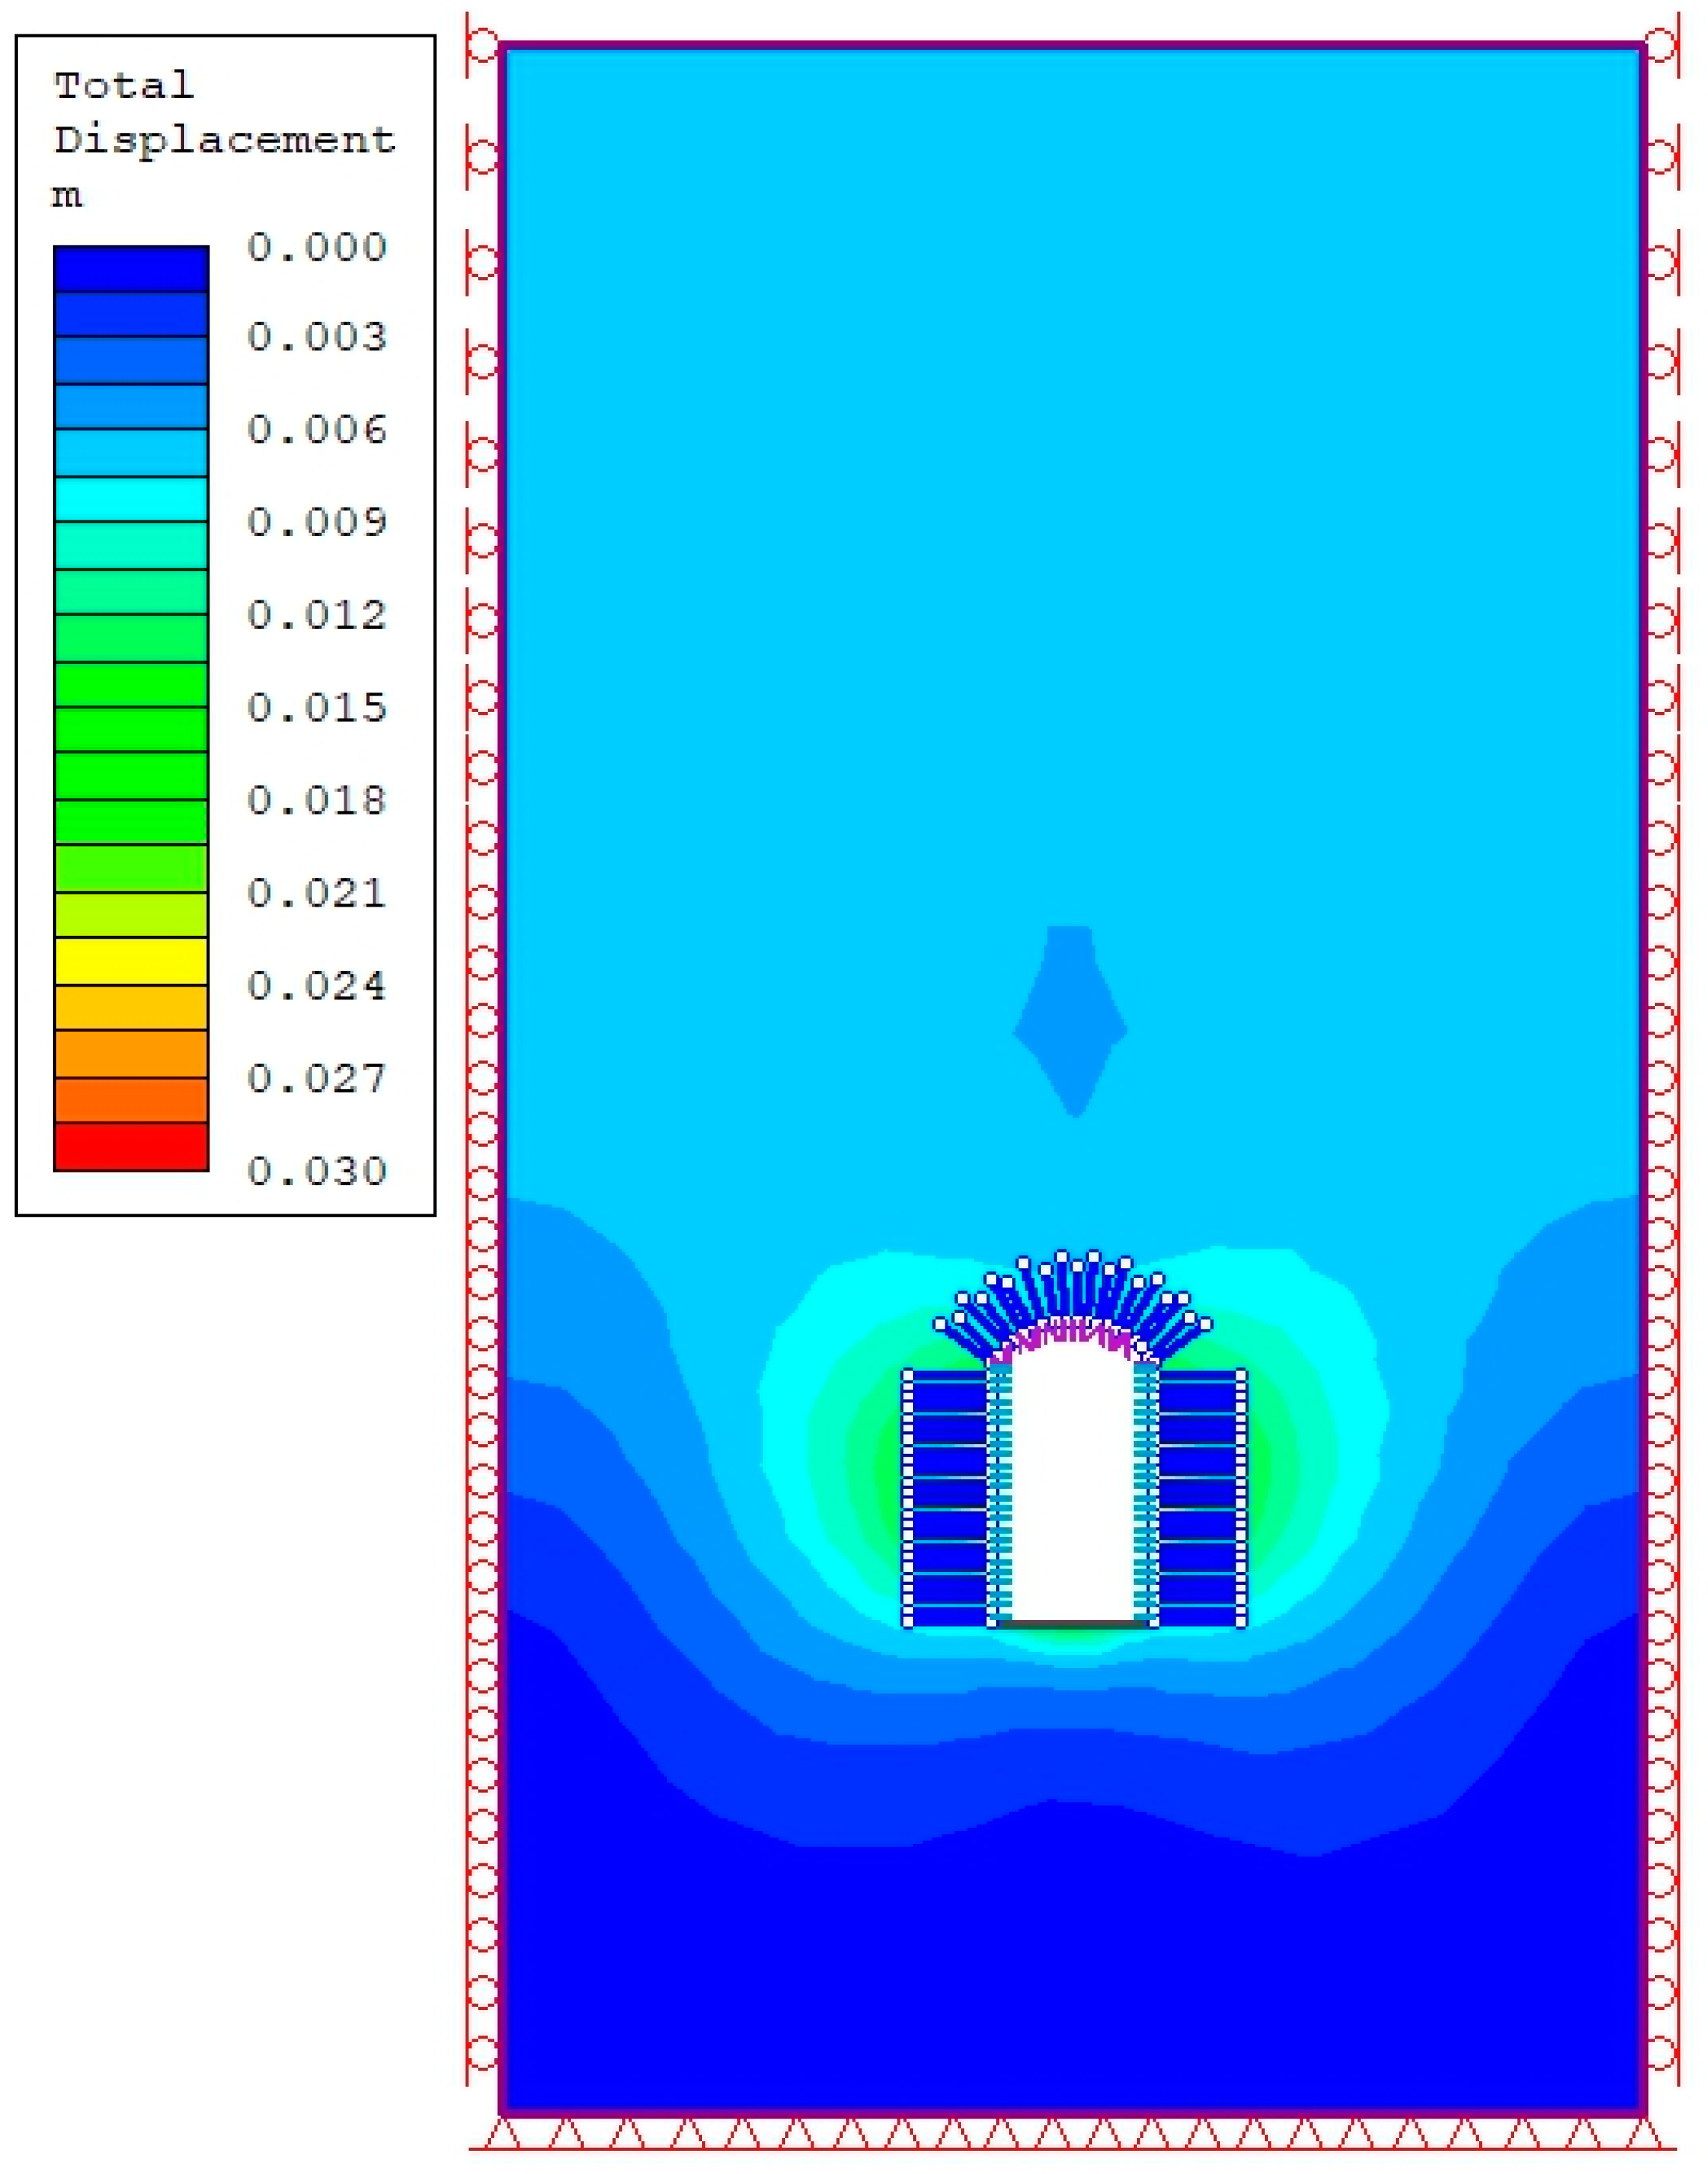
5.1. Numerical Modeling of Underground Caverns

In this study, the displacements were found using the RS2 (Phase2, Rocscience Inc., Toronto, ON, Canada) 2D finite element method (FEM) program for soil and rock applications. This program can be used to create complex, multi-stage models that can be quickly analyzed, such as tunnels and caverns in weak or jointed rock. The analysis type used in this study was plane strain.
The caverns studied in this paper were all excavated in 10–15 stages. The dimensions of each cavern were 200–250 m in length, 20–25 m in width, and 18–53 m in height. Figure 5 shows the dimensions of one of the caverns studied. The excavation of the caverns was modeled in stages, starting with the top heading (TH) and then moving on to bench 1 (B1) and bench 2 (B2). The bench height in each stage was 2.5 to 4 m. Figure 5 shows the sectional view of the excavation sequence considered for numerical modeling of case 1 of the MHP-MH cavern.
Figure 6 shows the mesh and boundary conditions of the model. The boundary conditions were set such that the sides of the model were restrained in the X direction and, at the bottom, restrained in the XY direction. Figure 7 shows the total displacement contours of the model.
The crown displacements for all 64 samples of the machine hall cavern of the MHP project for different values of the parameters are given in Table 3.
The results of the numerical modeling show that the crown displacements increase with increasing cavern height, decreasing rock mass rating, and increasing overburden depth.
The results of the numerical modeling can be used to improve the design and construction of underground caverns. By taking into account the factors that affect crown displacement, engineers can design caverns that are more stable and less likely to experience deformations.

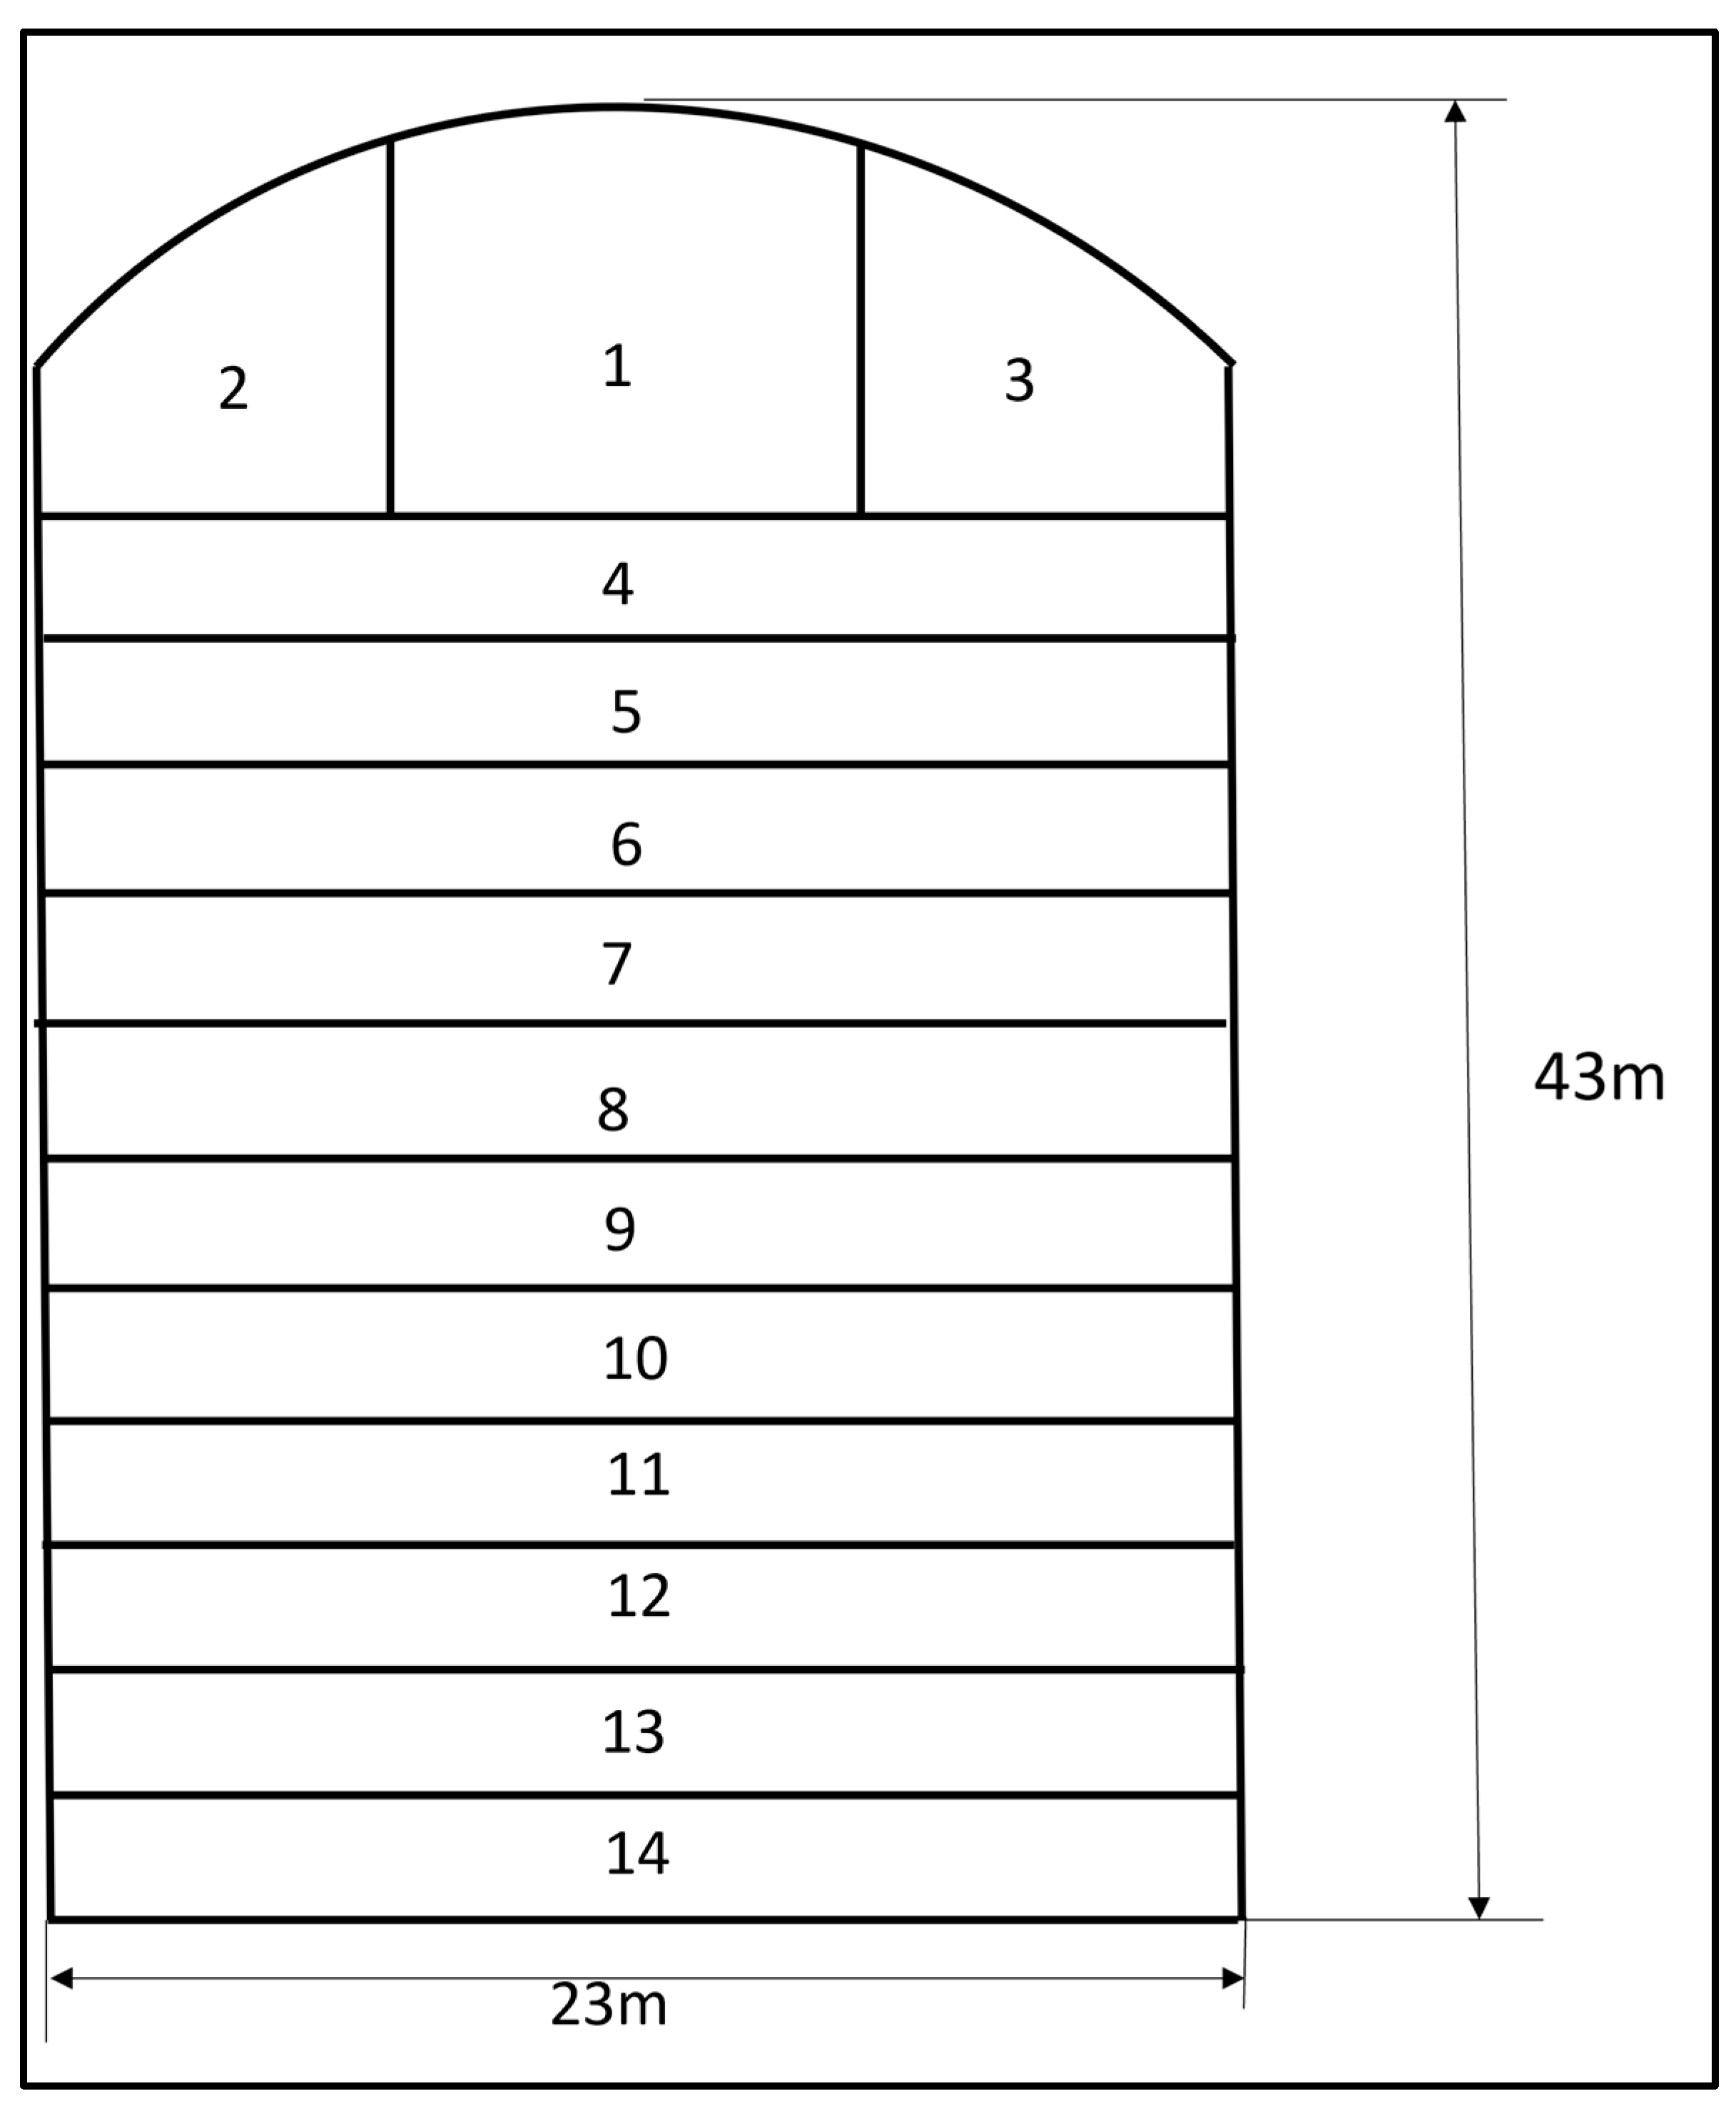
5.2. Parametric Study on Crown Deformations of a Cavern (Case Study MHP-MH)

5.2.1. Design of Experiments and Fractional Factorial Work

Design of experiments (DOE) is a tool that allows you to obtain information about how factors (X’s), alone and in combination, affect the process and its output (Y). DOE allows you to test more than one factor at a time, as well as different settings for each factor. DOE is more cost-effective than trial-and-error methods. Using DOE techniques, you can find the individual and interactive effects of various factors that can influence the output results of your measurements.
One way to do a parametric study is by changing one of the parameters within a range, keeping all other parameters constant, and then studying the effect. This process is then repeated for the remaining parameters one after another. However, this can be time-consuming and resource-intensive, especially if there are many parameters to consider. A more efficient way to conduct a parametric study is to use a factorial design of experiments. In a factorial design, experimental trials (or runs) are performed at all combinations of factor levels. A factorial experiment with k factors, each factor having two levels of value, will require 2k number of runs. This is known as a 2k factorial design, and it is read as a two-level k factor design [30,31,32,33].
In this study, we used a half-factorial design, which means that we only ran half of the possible combinations of factor levels. This was undertaken because we were only interested in the main effects of the parameters, not the interaction effects.
The values of the parameters used in the parametric study for the MHP machine hall cavern were as follows:
  • Rock mass rating of the cavern crown (RMR)    :43–65;
  • Uniaxial compressive strength (UCS)      :182–250 MPa;
  • Young’s modulus of intact rock (Ei)      :40–72 GPa;
  • Poisson’s ratio (υ)                :0.16–0.17;
  • Tensile strength (σt)               :0.18–1.3 MPa;
  • Internal friction angle (Φ)              :58.36–63.23 degrees;
  • Cohesion (C)                   :1.42–5.16 MPa.

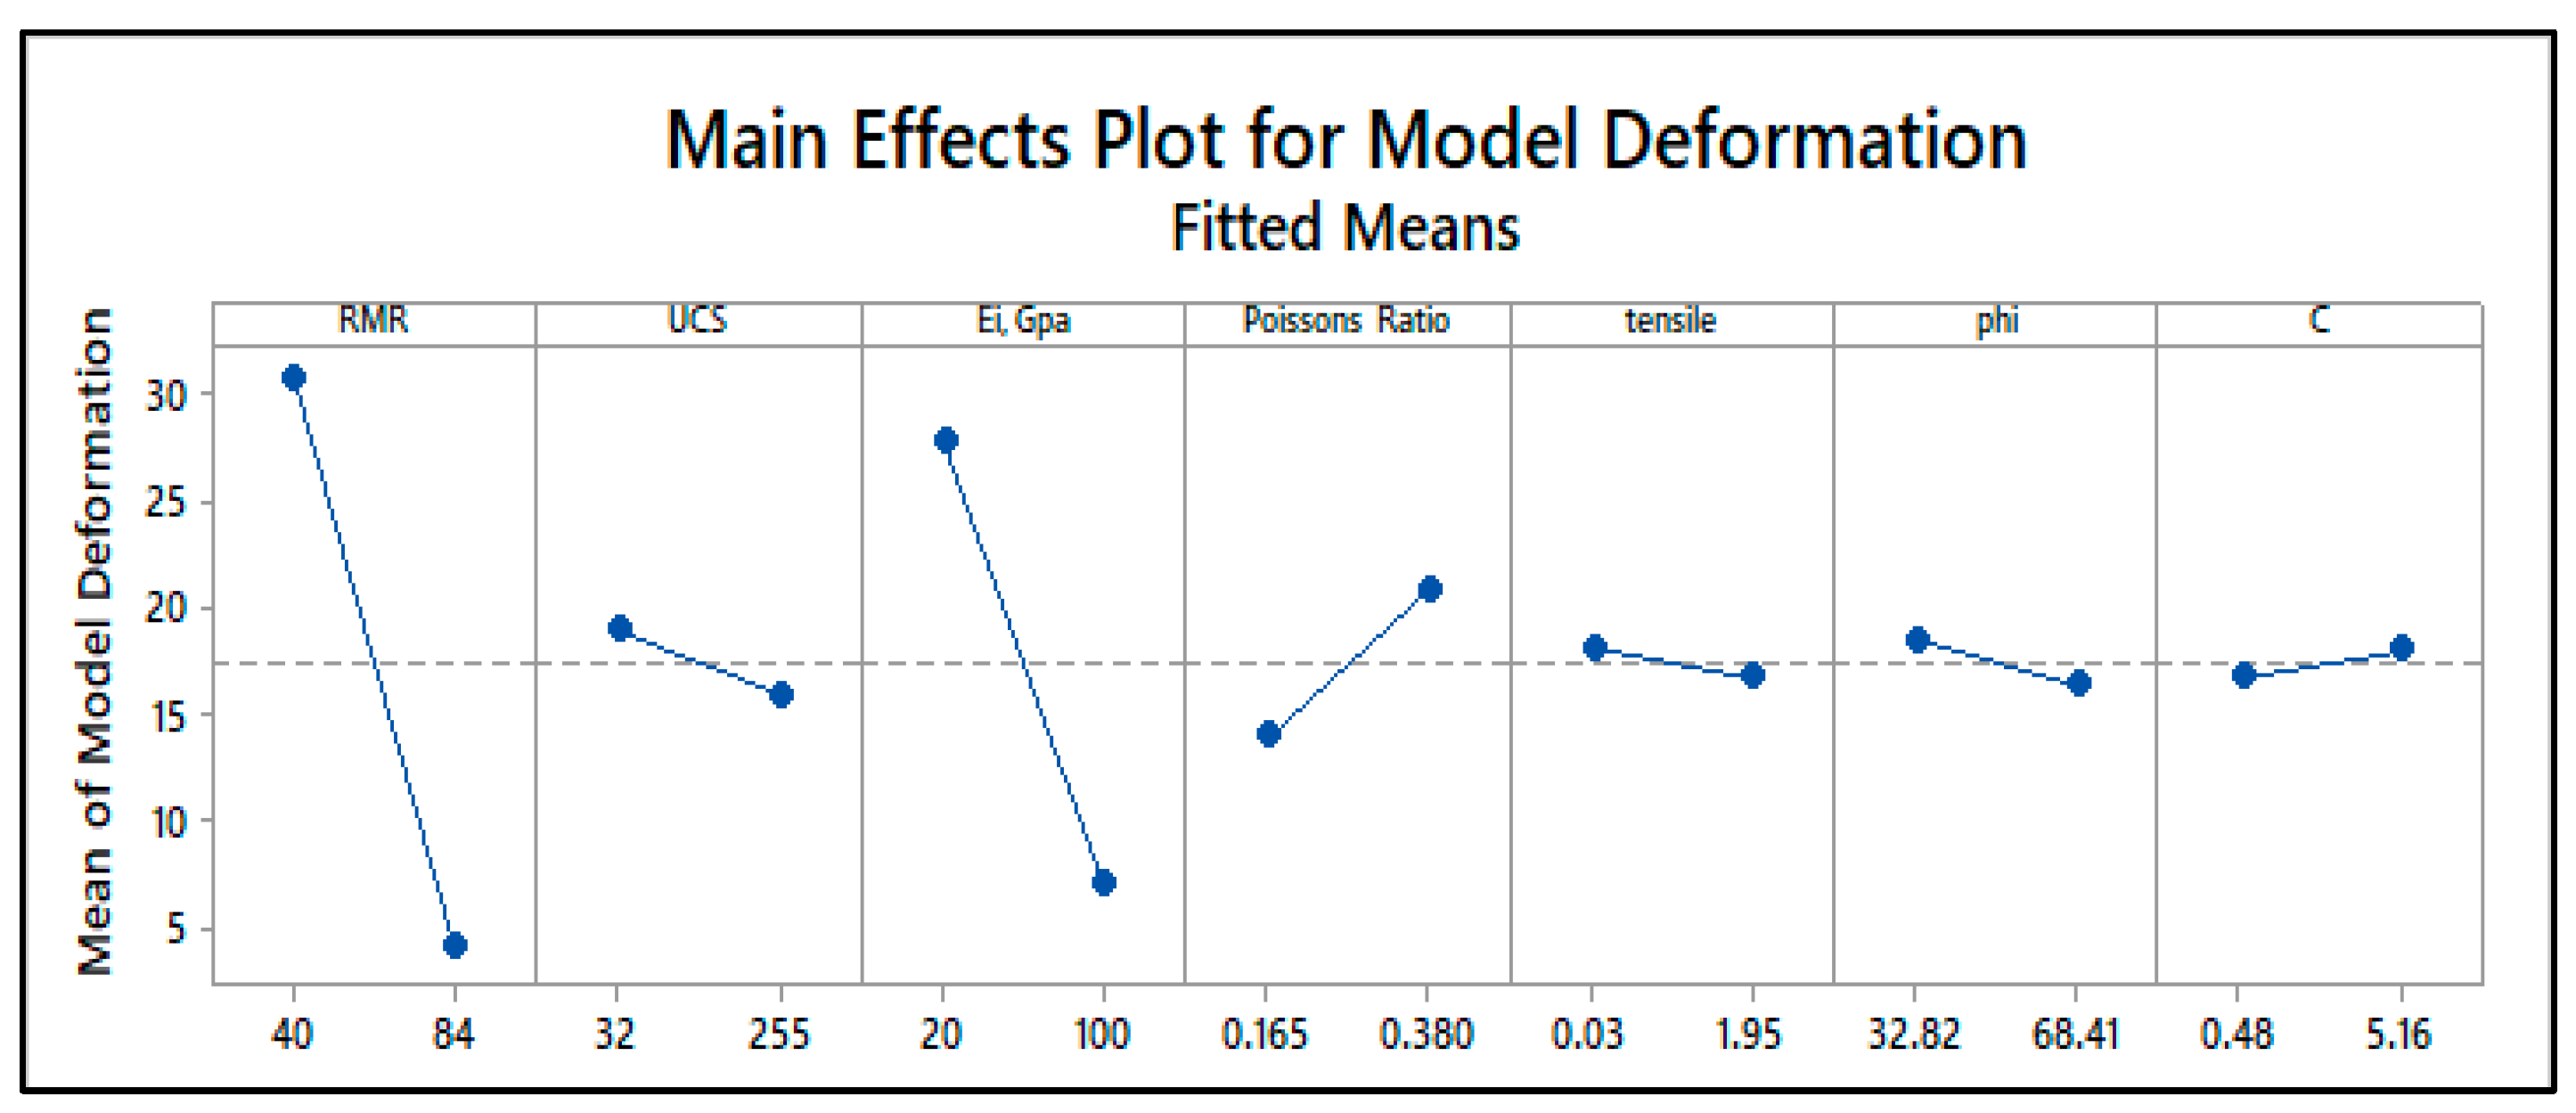
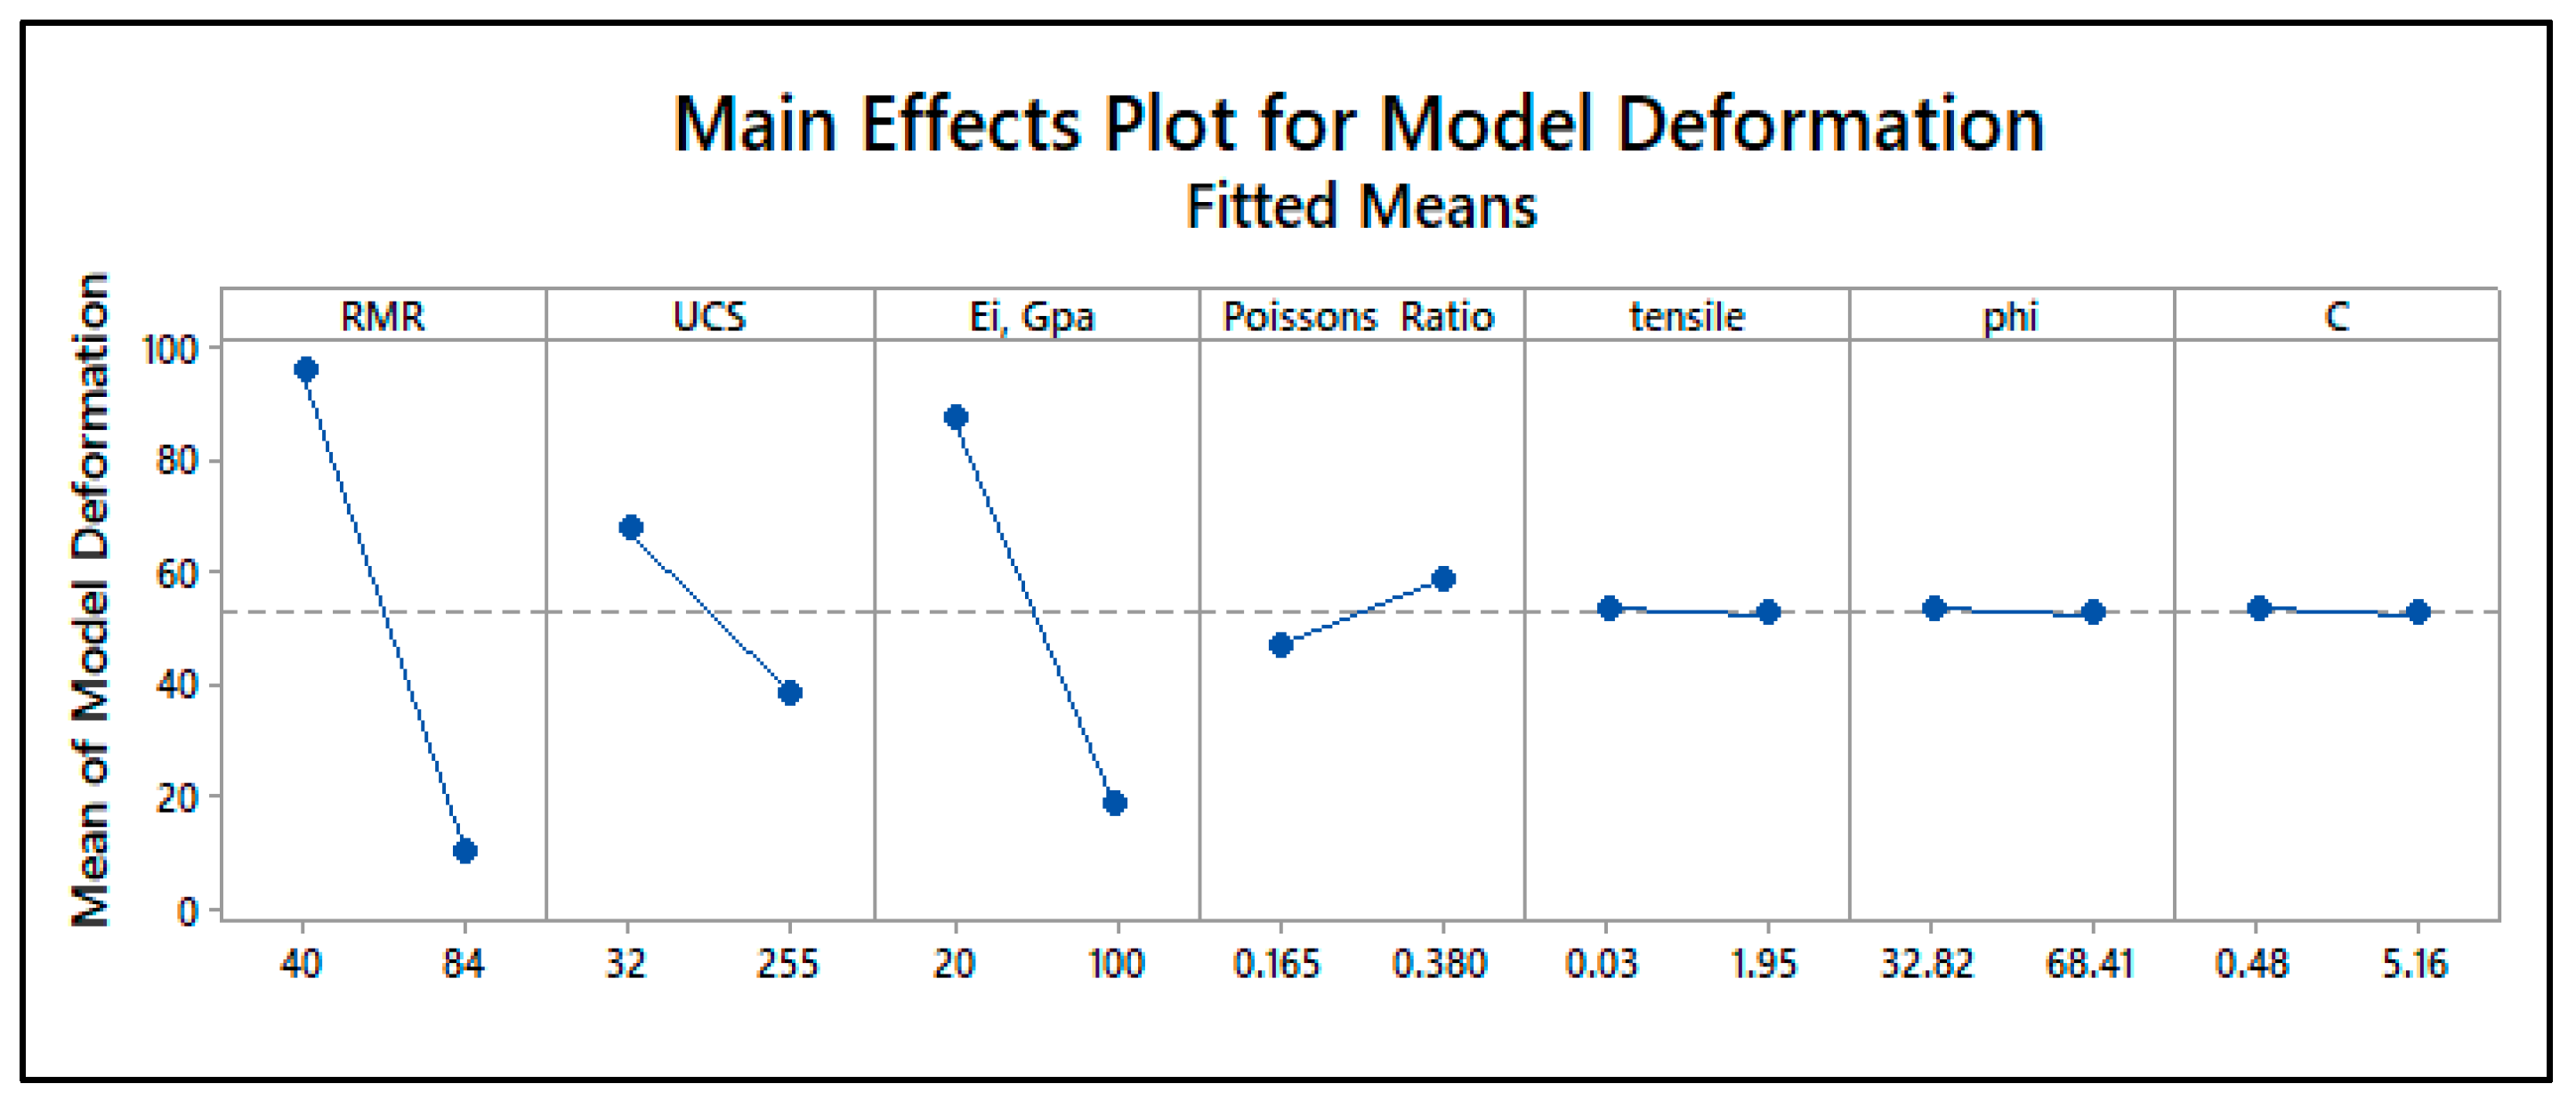
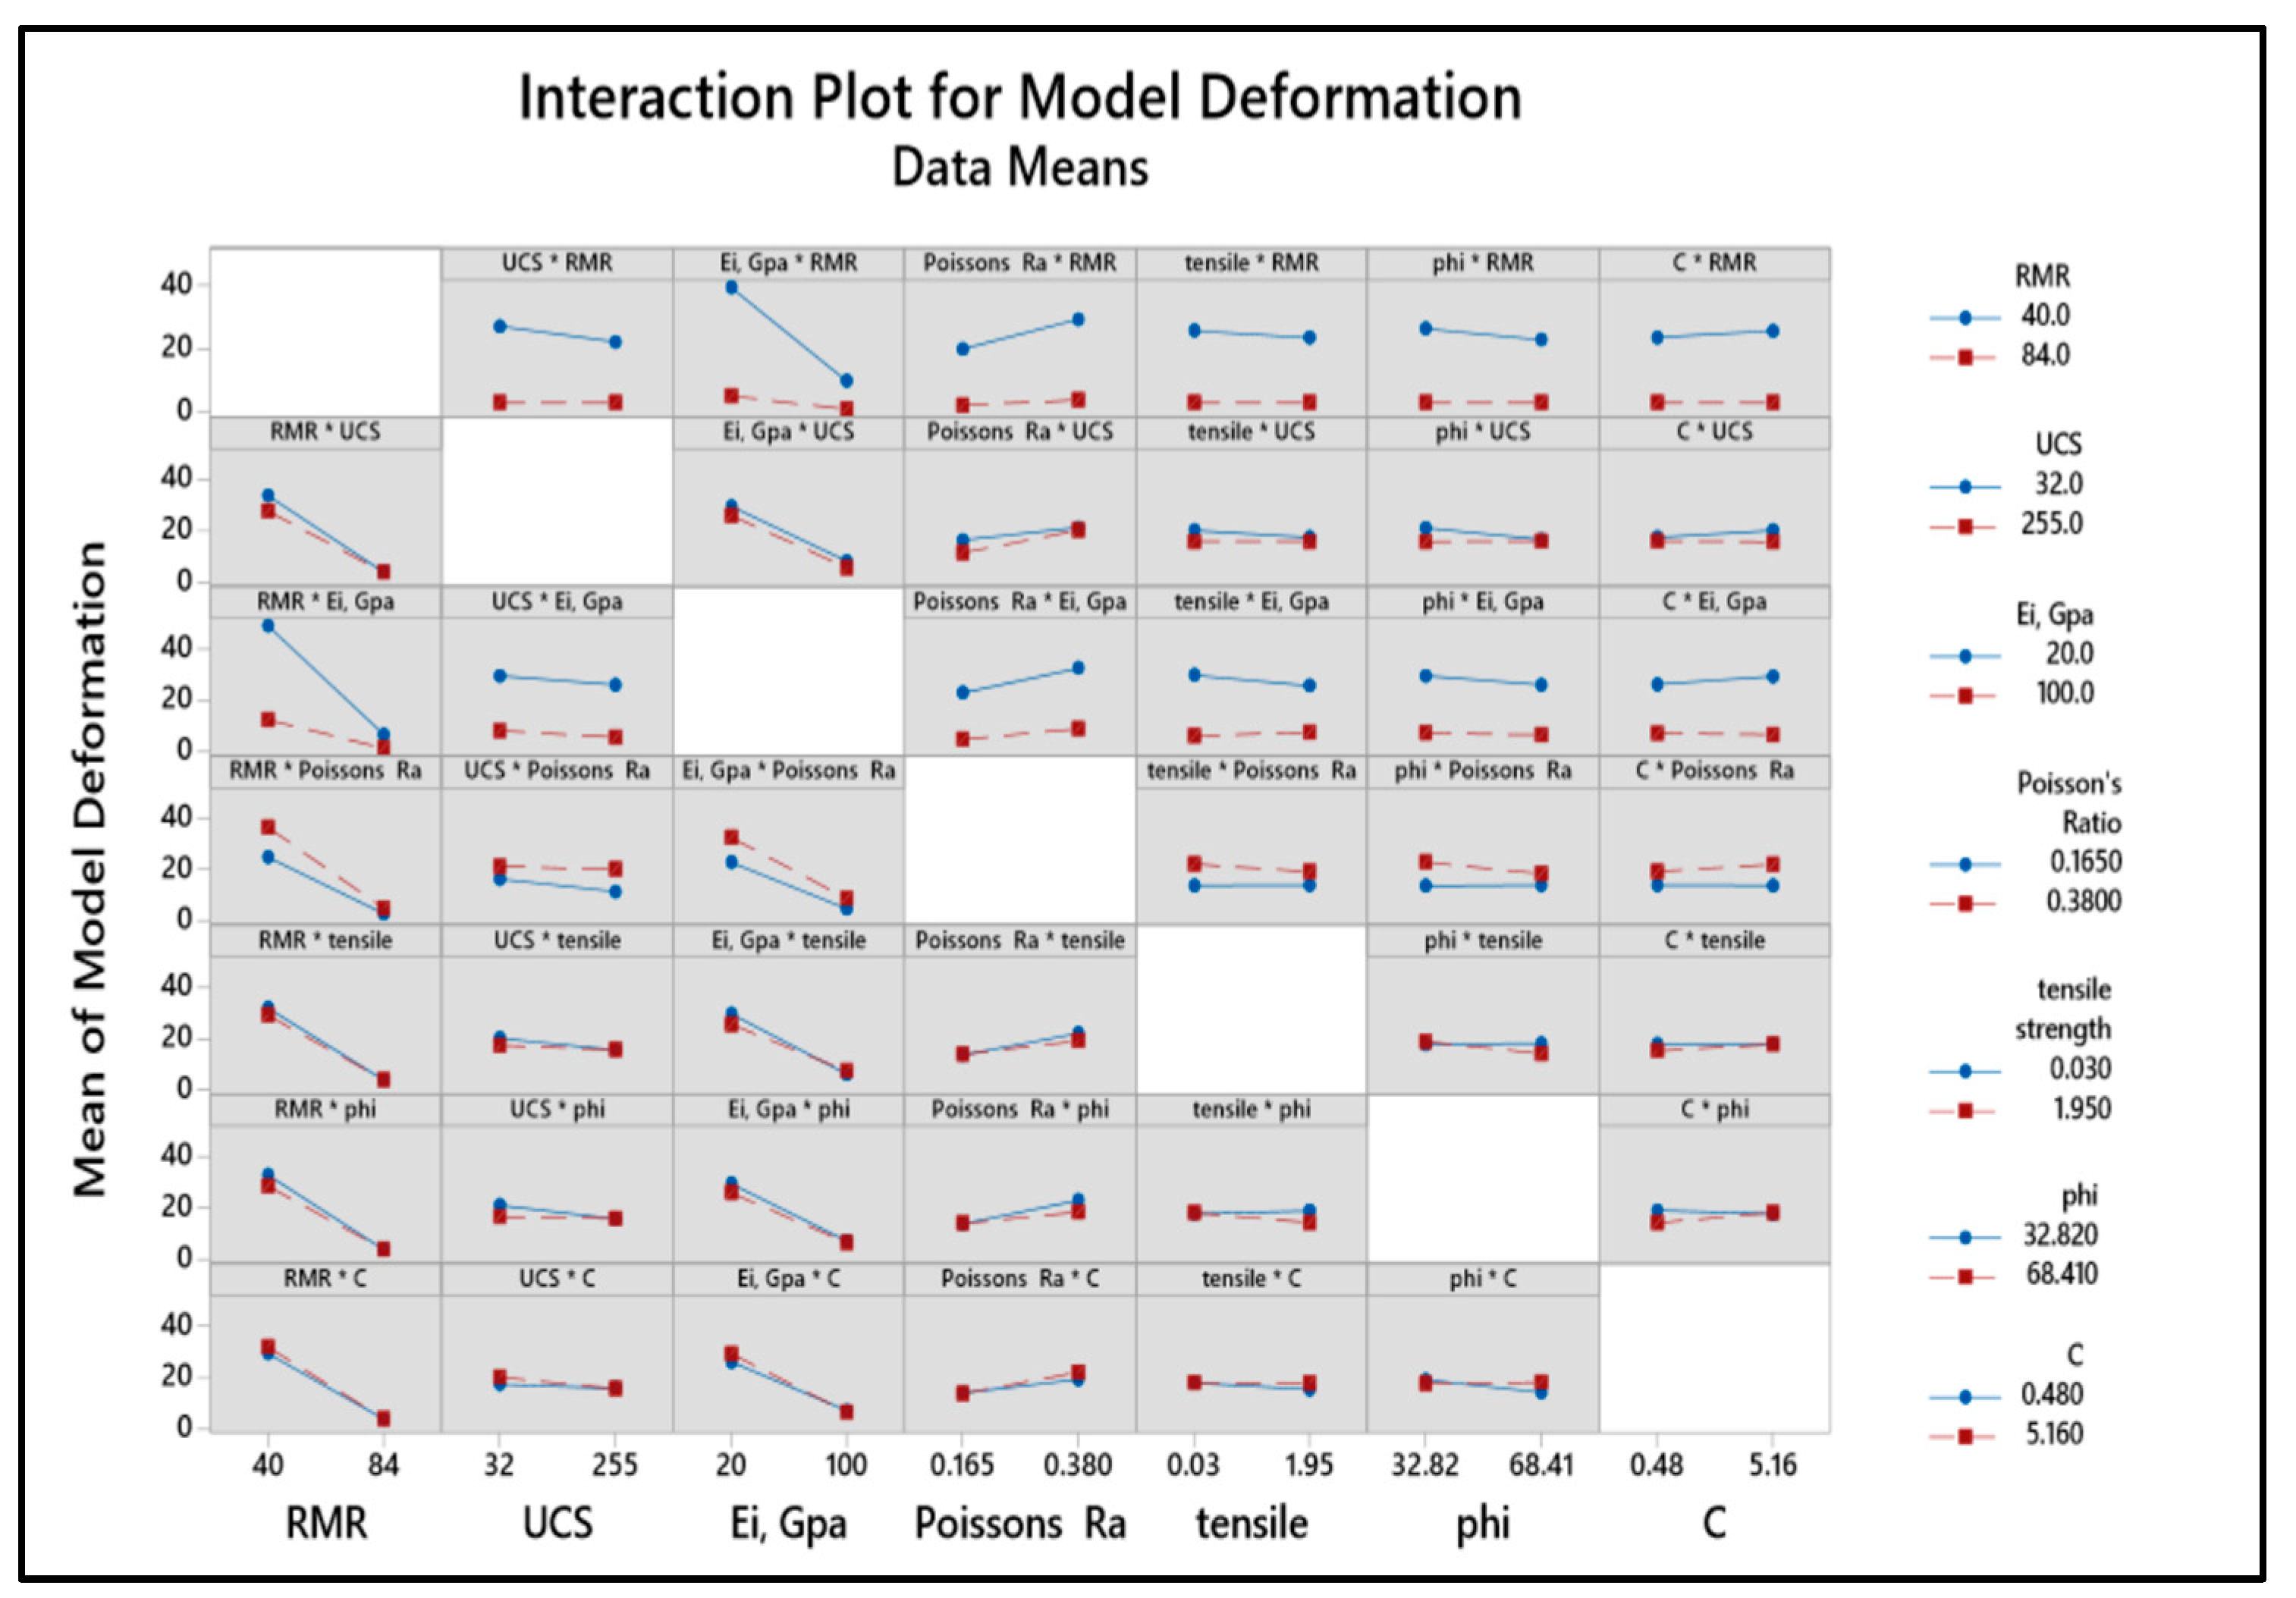
5.2.2. Main and Interaction Effects

The effect of a factor is defined as the change in response produced by a change in the level of the factor. It is called the main effect because it refers to the study’s primary factors. The main effect of all seven parameters has been shown for the cases of the MHP-MH and the Pykara-MH cavern in Figure 8 and Figure 9, respectively.
In this study, the main effects of the following parameters on crown deformation were investigated:
  • Rock mass rating (RMR);
  • Uniaxial compressive strength (UCS);
  • Young’s modulus of intact rock (Ei);
  • Poisson’s ratio (υ);
  • Tensile strength (σt);
  • Internal friction angle (φ);
  • Cohesion (C).
The results of the study showed that the following main effects were significant:
  • RMR: As RMR increases, crown deformation decreases;
  • UCS: As UCS increases, crown deformation slightly decreases or does not change significantly;
  • Ei: As Ei increases, crown deformation decreases;
  • υ: As PR increases, crown deformation increases;
  • σt: σt has no significant effect on crown deformation;
  • φ: As φ increases, crown deformation slightly decreases;
  • C: C has no significant effect on crown deformation.
The interaction effects between the parameters were also investigated. The results showed that there were no significant interaction effects between any of the parameters. This means that the effect of each parameter on crown deformation can be explained via its main effect alone. The parallel and near-to-parallel plots of crown deformation versus different parameters shown in Figure 10 indicate a very rare chance of interaction among the parameters. The same was observed for all other cases; thus, the influence of each parameter can be explained by its main effect alone. In conclusion, the results of this study show that the main effects of RMR, UCS, Ei, and υ are highly significant, and σt, φ, and C are of low significance to crown deformation. The interaction effects between the parameters are not significant.
In the case study MHP-MH, it is appropriate to consider the effect of Poisson’s ratio on displacement, which is 6.84. This indicates that as the Poisson’s ratio value increases from 0.165 to 0.38, the displacement will increase by 6.84 mm. A negative value shows the reduction in displacements. The ranking of each parameter is given based on its absolute value. It is observed that the rock mass rating, uniaxial compressive strength, Young’s modulus of intact rock, Poisson’s ratio, tensile strength, angle of internal friction, and cohesion have a decisive role to play in influencing the displacements. The main effect of different parameters with respect to other studied cases is given in Table 4. The effect of all parameters cannot be neglected unless the data are analyzed through regression analysis.

5.3. Development of Regression Equation

A multiple linear regression analysis was conducted to develop a regression equation for predicting crown deformation. The twelve variables considered in the regression analysis were as follows: width and height of the cavern, rock cover, horizontal stress coefficient (KH), vertical stress coefficient (Kh_1), rock mass rating (RMR), uniaxial compressive strength (UCS), Young’s modulus of intact rock (Ei), Poisson’s ratio (υ), tensile strength (σt), angle of internal friction (φ), and cohesion (C).
A log-linear form of the regression is considered here for analysis. With the twelve variables, in logarithmic form, the linear equation in general can be written in the following form:
Log (Deformation) = a1 + a2 × Log (Width) + a3 × Log (Height) + a4 × Log (Rock Cover) + a5 × Log (KH) − a6 × Log (Kh) – a7 × Log (RMR) − a8 × Log (UCS) − a9 × Log (Ei) + a10 × Log (Poisson’s ratio) − a11 × Log (Sigma t) – a12 × Log (Phi) + a13 Log (C).
This equation can be simplified as follows:
Log (Deformation) = log 10a1 + Log Widtha2 + Log Heighta3 + Log Rock Covera4 + Log KHa5 − Log Kha6 − Log RMRa7 − Log UCSa8 – Log Eia9 + Log Poisson’s ratioa10 − Log Sigmata11 − Log Phia12 + Log Ca13,
where a1 to a13 are the constants and are obtained in linear regression analysis. The constants are substituted in Equation (2):
Log (Deformation) = 5.448 + 0.091 Log(Width) + 0.535 Log(Height) + 1.0084 Log(Rock Cover) + 0.180 Log(KH) − 0.4060 Log(Kh) − 3.1223 Log(RMR) − 0.1888 Log(UCS) − 0.9818 Log(Ei) + 0.3619 Log(Poisson’s ratio) − 0.00282 Log(Sigma t) − 0.0704 Log(Phi) + 0.0145 Log(C).
Taking the antilog on both sides in Equation (3), the resulting equation for deformation will have the following form:
Deformation(mm) = 105.448 (Width0.091 Height0.535 Rock Cover1.0084 KH0.18 Poisson’s ratio0.3619 C0.0145)/(Kh_10.406 RMR3.1223 UCS0.1888 Sigma t0.00282 Ei0.9818Phi0.0704); R2 = 92.92%
The coefficient of determination (R2) for the regression equation is 92.92%, which indicates that the equation is a good predictor of crown deformation.
The regression equation shows that the most significant factors affecting crown deformation are RMR, UCS, Ei, and Poisson’s ratio. The width and height of the cavern, rock cover, and the stress ratios also have a significant effect on crown deformation. The results of the parametric study and the regression analysis can be used to improve the design and construction of underground caverns. By considering the factors that affect crown deformation, engineers can design caverns that are more stable and less likely to experience deformations.

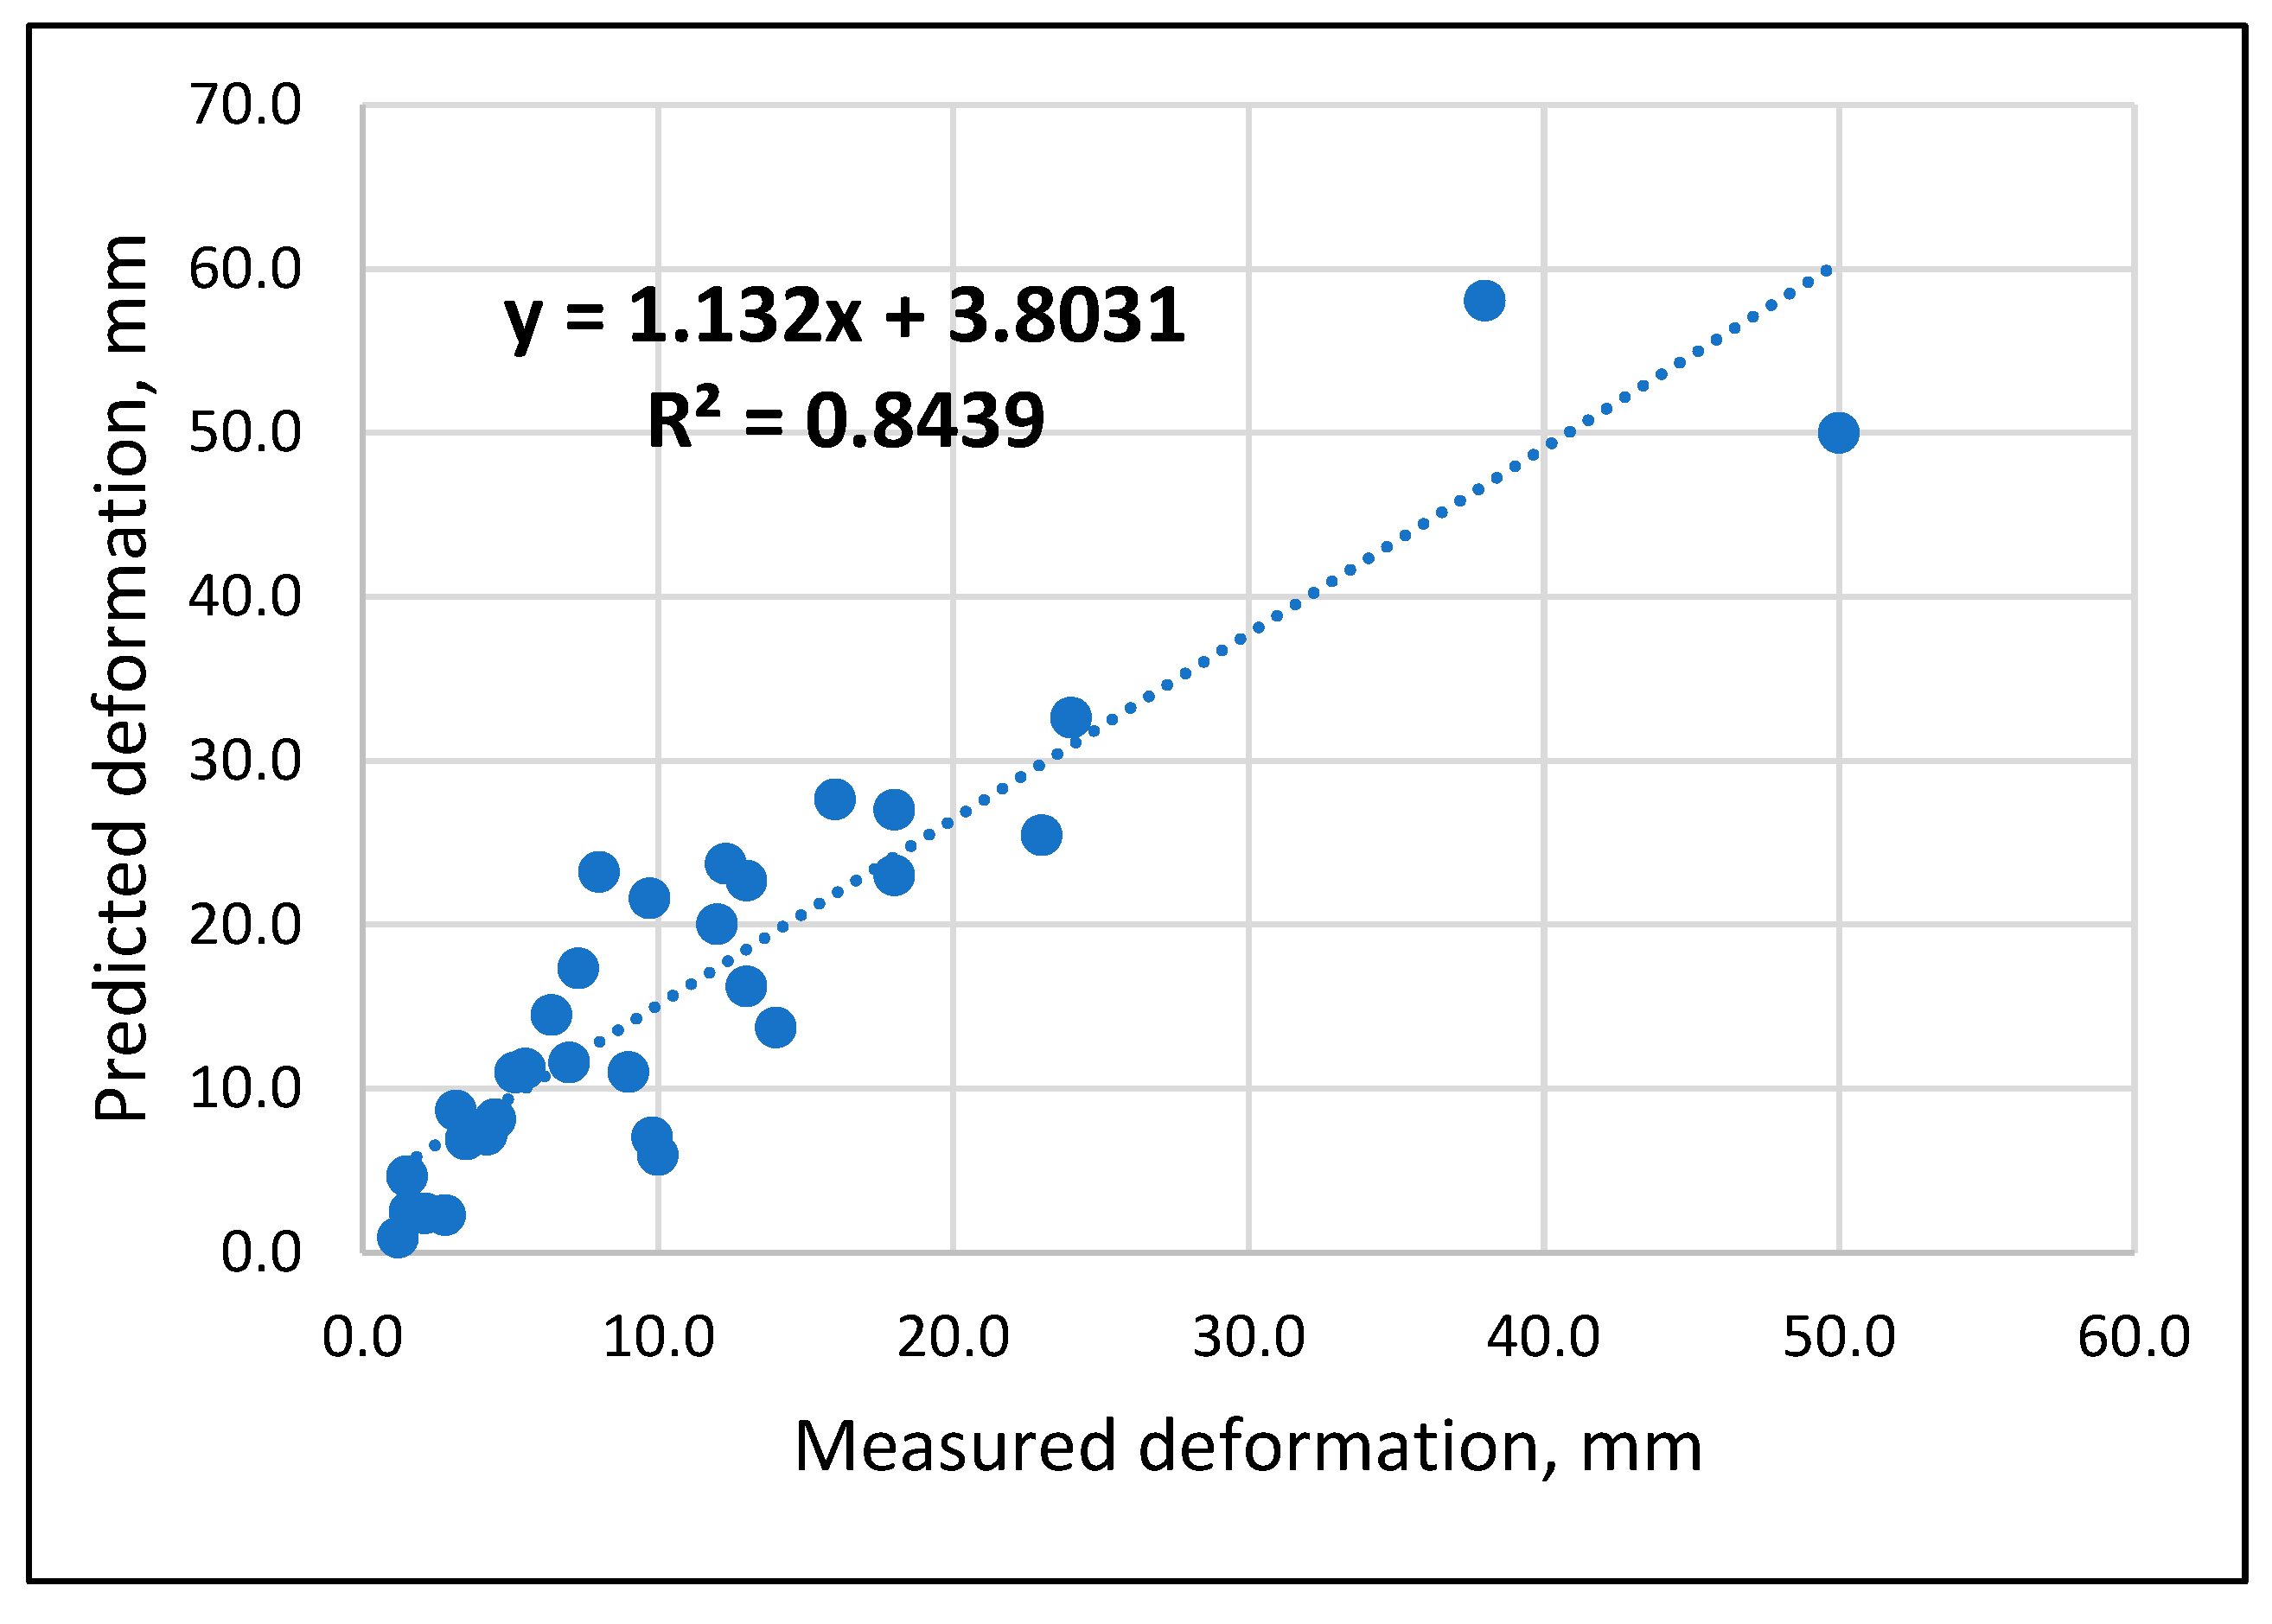
5.4. Validation of the Equation

Validating the equation is necessary for the validation of any empirical relationship developed. One way of validating the equation is to plot the deformation values observed through monitoring the crown deformations and predicted deformation obtained from the empirical equation. The exercise was conducted, and we found that the correlation coefficient (R2) is 0.84, indicating the level of confidence in the prediction of the crown deformations. Figure 11 depicts the correlation of deformation.
A correlation coefficient of 0.84 indicates a strong positive correlation between the observed and predicted deformations. This means that the predicted deformations are very close to the observed deformations. The high correlation coefficient suggests that the developed equation predicts crown deformation well.
The results of the validation exercise show that the developed equation can be used to predict crown deformation with a high degree of accuracy. This can be used to improve the design and construction of underground caverns. By considering the factors that affect crown deformation, engineers can design more stable caverns that are less likely to experience deformations.
Here are some additional details about the validation exercise:
  • The exercise was conducted for ten caverns;
  • The observed deformations were measured using monitoring instruments;
  • The predicted deformations were obtained using the developed equation;
  • The correlation coefficient (R2) of deformation was calculated for each cavern;
  • The average correlation coefficient for all ten caverns was 0.84.
The high correlation coefficient of 0.84 suggests that the developed equation is a good predictor of crown deformation for many caverns. This can be used to improve the design and construction of underground caverns.

6. Discussion and Conclusions

In this study, a parametric study using DOE and a multiple linear regression analysis were conducted to investigate the factors affecting crown deformation in underground caverns. The results of the study showed that the following factors have a significant effect on crown deformation:
  • Rock mass rating (RMR);
  • Uniaxial compressive strength (UCS);
  • Young’s modulus of intact rock (Ei);
  • Poisson’s ratio;
  • Angle of internal friction (Φ);
  • Width of the cavern;
  • Height of the cavern;
  • Rock cover;
  • KH (horizontal stress coefficient);
  • Kh_1 (vertical stress coefficient).
A regression equation was developed to predict crown deformation, given below:
Deformation(mm) = 105.448 (Width0.091 Height0.535 Rock Cover1.0084 KH0.18 Poisson’s ratio0.3619 C0.0145)/(Kh_10.406 RMR3.1223 UCS0.1888 Sigma t0.00282 Ei0.9818Phi0.0704).
The equation was validated using monitoring data from ten caverns. The results of the validation exercise showed that the developed equation can be used to predict crown deformation with a high degree of accuracy. The results of this study can be used to improve the design and construction of underground caverns. By considering the factors that affect crown deformation, engineers can design caverns that are more stable and less likely to experience deformations.
Here are some additional conclusions that can be drawn from the study:
  • The most significant factors affecting crown deformation are RMR, UCS, Ei, and Poisson’s ratio;
  • The width and height of the cavern, rock cover, and stress ratios also significantly affect crown deformation;
  • The developed equation can be used to predict crown deformation with high accuracy for a wide range of caverns;
  • The fractional factorial of designs in design of experiments (DOE) is very useful in building the models and no complication calculations are needed;
  • The rock mass parameters’ combinations were taken in models using fractional factorial analysis to cover all types of rock mass conditions;
  • The results of this study can be used to improve the design and construction of underground caverns;
  • The prediction values agreed well with the measured values, and the largest relative error was 15–20%;
  • Since the behavior of the rock mass conditions are site-specific and all parameters are available by the time of construction, these are to be included in deformation prediction;
  • Based on the study, the main influential parameters in crown deformations are rock mass rating, Young’s modulus, uniaxial compressive strength of the intact rock samples, and the shear strength parameters;
  • The predicted deformations can be used for optimal range selection for the extensometers and other deformation measurement instruments;
  • The predicted deformations can be used for Setting the warning/alert signals;
  • Finally, the prediction capability of the regression model may further improve with the addition of a greater number of case studies.

Author Contributions

Conceptualization, K.S.; methodology, K.S.; software, K.S. and R.K.S.; validation, K.S.; formal analysis, K.S.; investigation, K.S. and R.K.S.; resources, K.S., R.K.S. and S.R.N.; data curation, K.S.; writing—original draft preparation, K.S.; writing—review and editing, R.K.S. and S.R.N.; visualization, K.S.; supervision, R.K.S. and S.R.N. All authors have read and agreed to the published version of the manuscript.

Funding

This research received no external funding.

Institutional Review Board Statement

Not applicable.

Informed Consent Statement

Not applicable.

Data Availability Statement

The data availability presented in this study are available on request from the corresponding author. The data are not publicly available due to the reason that they pertain to mega engineering projects.

Acknowledgments

The authors thank the project authorities and the director of the National Institute of Rock Mechanics (NIRM) for allowing them to conduct their studies. The support provided by the Department of Mining Engineering, Indian Institute of Technology (Indian School of Mines), Dhanbad, India, and BH Vijaysekar, BNV Siva Prasad, Rabi Bhusan, and Praveen Das Jennifer, Scientists, NIRM, are duly acknowledged. This forms part of the first author’s doctoral research at IIT (ISM).

Conflicts of Interest

The authors declare no conflict of interest.

References

  1. Zhu, W.S.; Sui, B.; Li, X.J.; Li, S.C.; Wang, W.T. A methodology for studying the high wall displacement of large scale underground cavern complexes and it’s applications. Tunn. Undergr. Space Technol. 2008, 23, 651–664. [Google Scholar] [CrossRef]
  2. Saure, E.; Marcher, T.; John, M. Decisive Design Basis and Parameters for Power Plant Caverns; CRC Press: Geneva, Switzerland, 2013. [Google Scholar]
  3. Usmani, A.; Pal, S.; Nanda, A. Continuum and Discontinuum Analysis of Rock Caverns. Indian Geotech. J. 2018, 48, 663–676. [Google Scholar] [CrossRef]
  4. Dwivedi, R.D.; Singh, M.; Viladkar, M.N.; Goel, R.K. Parametric Analysis of an Empirical Correlation Predicting Deformation of Squeezing Tunnels. In Proceedings of the National Seminar on Innovative Practices in Rock Mechanics, Bengaluru, India, 6–7 February 2014. [Google Scholar]
  5. Naik, S.R.; Sastry, V.R.; Mishra, A. Effect of Orientation on Stability of Caverns—A Numerical Modelling Study. In Proceedings of the 10th Asian Rock Mechanics Symposium (ARMS10), Singapore, 29 October 2018. [Google Scholar]
  6. Prakash, I. Application of observational method in successful construction of underground structures, Sardar Sarovar (Narmada) project. In Proceedings of the Seventh International Conference on Case Histories in Geotechnical Engineering, Chicago, IL, USA, 1 May 2013. [Google Scholar]
  7. Van Kien, D.; Anh, D.N.; Thai, D.N. Numerical Simulation of the Stability of Rock Mass around Large Underground Cavern. Civ. Eng. J. 2022, 8, 81–91. [Google Scholar] [CrossRef]
  8. Kontogianni, V.A.; Stiros, S.C. Predictions and observations of convergence in shallow tunnels: Case histories in Greece. Eng. Geol. 2002, 63, 333–345. [Google Scholar] [CrossRef]
  9. Kuili, S.; Sastry, V.R. Prediction and Assessment of Lateral Displacement of Rock Mass Along the Length of the Horseshoe Cavern-A Numerical Modelling Approach Stability analysis of cavern under static and dynamic loads: A numerical modelling approach View project. Int. J. Geol. Geotech. Eng. 2017, 3, 17–28. [Google Scholar]
  10. Abdollahipour, A.; Rahmannejad, R. Investigating the effects of lateral stress to vertical stress ratios and caverns shape on the cavern stability and sidewall displacements. Arab. J. Geosci. 2013, 6, 4811–4819. [Google Scholar] [CrossRef]
  11. Feng, X.T.; Zhao, H.; Li, S. Modeling non-linear displacement time series of geo-materials using evolutionary support vector machines. Int. J. Rock Mech. Min. Sci. 2004, 41, 1087–1107. [Google Scholar] [CrossRef]
  12. Małkowski, P.; Juszyński, D. Roof fall hazard assessment with the use of artificial neural network. Int. J. Rock Mech. Min. Sci. 2021, 143, 104701. [Google Scholar] [CrossRef]
  13. Ma, H.P.; Daud, N.N.N.; Yusof, Z.M.; Yaacon, W.Z.; He, H.J. Stability Analysis of Surrounding Rock of an Underground Cavern Group and Excavation Scheme Optimization: Based on an Optimized DDARF Method. Appl. Sci. 2023, 13, 2152. [Google Scholar] [CrossRef]
  14. Basin, R.; Pabst, T.; Li, C. Rock Characterisation, Modelling and Engineering Design Methods. In Proceedings of the 3rd ISRM SINOROCK 2013 Symposium, Shanghai, China, 18–20 June 2013. [Google Scholar]
  15. Gupta, A.K.; Goyal, D.P.; Mishra, R.K.; Khazanchi, R.N. Instability Problems in Desilting Caverns of Tala hydroelectric project, Bhutan. In Proceedings of the SRM India Symp. on Advancing Rock Mechanics Frontiers to Meet the Challenges of 21st Century, New Delhi, India, 24–27 September 2002. [Google Scholar]
  16. Mishra, A.K.; Chaudhary, R.K.; Punetha, P.; Ahmed, I. Geological and Geotechnical Challenges Faced during Excavation of Powerhouse and Head Race Tunnel for Mangdechhu Project, Bhutan, India. Hydro Nepal J. Water Energy Environ. 2018, 23, 30–41. [Google Scholar] [CrossRef]
  17. Bhasin, R.K.; Barton, N.; Grimstad, E.; Chryssanthakis, P.; Shende, F.P. Comparison of predicted and measured performance of a large cavern in the Himalayas. Int. J. Rock Mech. Min. Sci. Geomech. 1996, 33, 607–613. [Google Scholar] [CrossRef]
  18. Dasgupta, B.; Singh, R.; Sharma, V.M. Numerical modelling of desilting chambers for Nathpa Jhakri Hydroelectric Project. In Proceedings of the 9th ISRM Congress 99, Paris, France, 25 August 1999. [Google Scholar]
  19. Dasgupta, B.; Sharma, M.K.; Verman, M.; Sharma, V.M. Design of underground caverns for Tehri Hydro Power project, India by numerical modelling. In Proceedings of the 9th ISRM Congress 99, Paris, France, 25 August 1999. [Google Scholar]
  20. Dasgupta, B.; Dham, R.; Lorig, L.J. Three dimensional discontinuum analysis of the underground powerhouse for SardarSarovar Project, India. In Proceedings of the 8th ISRM Congress, Tokyo, Japan, 25 September 1995. [Google Scholar]
  21. Varman, M.; Jethwa, J.L.; Singh, B. Monitoring of a large underground power house cavity. In Proceedings of the 9th ISRM Congress, Aachen, Germany, 16 September 1991. [Google Scholar]
  22. Venkateswarlu, V.; Srinivasulu, T.; Nagaraj, C.; Sudhakar, K. Instrumentation and Strata Monitoring at Srisailam Left Bank Hydro electric scheme. Project Report, NIRM, Kolar Gold Fields, 30 November 1996.
  23. Naitani, A.K.; Singh, L.G.; Rawat, D.S.; Jain, P. Engineering Geological Investigations of the Extension of Surge Pool and Pump House Caverns, Kaleswaram Lift Irrigation Project-Package8, Telangana, India, Project Report, NIRM, India. 31 January 2017.
  24. Purushothaman, C. Planning design and construction of transformer cavern for an underground hydroelectric project. In Proceedings of the ISRM International Symposium 2010 and 6th Asian Rock Mechanics Symposium—Advances in Rock Engineering, Newdelhi, India, 23 October 2010. [Google Scholar]
  25. Venkateswarlu, V.; Nagaraj, C. Instrumentation for monitoring the underground caverns at Pykara Ultimate Stage Hydro Electric Project, Project Report, NIRM, Kolar Gold Fields, India, 31 March 2000.
  26. Jayanthu, S.; Rao, G.M.N.; Udaykumar, S. Physico mechanical properties of Rocks—A data bank. Kolar Gold Fields. 2006.
  27. Song, S.; Feng, X.; Liao, C.; Cai, D.; Liu, Z.; Yang, Y. Measures for controlling large deformations of underground caverns under high in-situ stress condition—A case study of Jinping I hydropower station. J. Rock Mech. Geotech. Eng. 2016, 8, 605–618. [Google Scholar] [CrossRef]
  28. Mandal, P.K.; Singh, A.K.; Kumar, R.; Singh, R. Instrumentation and monitoring strategies for study of ground movement during underground extraction of coal. Min. Eng. J. 2006, 8, 15–27. [Google Scholar]
  29. Kellaway, M.; Taylor, D.; Keyter, G.J. The use of Geotechnical Instrumentation to Monitor Ground Displacements during Excavation of Ingula power caverns, For Model Calibration and Design Purposes. In Proceedings of the Southern African Institute of Mining and Metallurgy South African Tunnelling 2012-Lessons Learnt on Major Projects, Ladysmith, South Africa, 3 December 2012. [Google Scholar]
  30. Montgomery, D.C. Engineering Statistics; RGHN; John Wiley & Sons: Hoboken, NJ, USA, 2011. [Google Scholar]
  31. Lye, L.M. Some Applications of Statistical Design of Experiment Methodology in Civil Engineering. In Proceedings of the Annual Conference of the Canadian Society for Civil Engineering, Moncton, NB, Canada, 4–7 June 2003. [Google Scholar]
  32. Sinha, R.K.; Jawed, M.; Sengupta, S. An approach for support design in depillaring panels of coal mines. Arab. J. Geosci. 2019, 12, 666. [Google Scholar] [CrossRef]
  33. Ruan, J.-K.; Zhu, W.-W. Sensitivity Analysis of Influencing Factors of Building Slope Stability Based on Orthogonal Design and Finite Element Calculation. E3S Web Conf. 2018, 53, 03076. [Google Scholar]
Figure 1. Workflow of the current study.
Sustainability 15 12851 g001
Figure 2. Location of the caverns (Ref. www.mapsofindia.com, accessed on 15 May 2023).
Sustainability 15 12851 g002
Figure 3. Typical instrumentation layout of an underground cavern.
Sustainability 15 12851 g003
Figure 4. Effect of crown deformation with different variables: (a) width; (b) rock cover; (c) Poisson’s ratio; (d) UCS; (e) Ei; (f) RMR; (g) KH; (h) Kh.
Sustainability 15 12851 g004aSustainability 15 12851 g004b
Figure 5. Geometric model of cavern studied parametric study (Case: MHP-MH).
Sustainability 15 12851 g005
Figure 6. Mesh and boundary condition of the model (MHP-MH, Model 1/64).
Sustainability 15 12851 g006
Figure 7. Total displacement contours of the model (MHP-MH, Model 1/64).
Sustainability 15 12851 g007
Figure 8. Main effects plot for crown deformation in the MHP-MH cavern.
Sustainability 15 12851 g008
Figure 9. Main effects plot for crown deformation in the Pykara-MH cavern.
Sustainability 15 12851 g009
Figure 10. Interaction effects plot of crown deformation between different variables of MHP-MH cavern.
Sustainability 15 12851 g010
Figure 11. Correlation of deformation.
Sustainability 15 12851 g011
Table 1. List of caverns with geometry and rock properties.
Sr NoCavern NameWidth, mHeight, mRock Cover, mRock Mass Rating, RMRStress Ratios (KH, Kh)UCS, MPaYoung’s Modulus, Ei, GPa Tensile Strength, σt MPa Poisson’s Ratio, υ Friction Angle, ΦCohesion, C MPa Rock Types Issues Encountered during Construction References
1THP-MH *20.444.550056–721.30, 0.8760–7021–29.50.64–1.70.35–0.36532.82–35.731.81–3.09Phyllites, Philitic quartzite, and quartzite bandsThe roof collapse occurred during construction;
vertical and horizontal cracks occurred on shotcrete at high walls
[5,14]
2THP-DC *13.918.514047–532.10, 1.3034–4020–300.03–0.050.19–0.2046.35–50.080.65–0.78Predominantly muscovite-biotite genesis with miner bands of biotite schist, quartzite, and clac silicate rocks; general rock types are good to moderately goodMajor cracks occurred in the crown area during bench excavations[15]
3MHP-MH *234318043–651.75, 1.17182–25040–720.18–1.30.165–0.17258.4–63.231.71–5.16Biotite schist, quartzite, pegmatite with micaceous schist, granite intrusions [16]
4NJHP-MH *204530070–841.34, 0.6750–5221.5–290.16–0.700.24–0.2851.27–53.951.9–2.77Major rock types encountered are augen gneiss and gneissNo failures on a rock; minor cracks occurred on the shotcrete while benching[17]
5NJHP-DC *16.327.545063–681.04, 0.3551–5531–350.17–0.320.35–0.3841.51–43.381.89–2.01Predominantly massive augen gneiss and gneiss with minor bands of biotite schistRockfall occurred in chambers 3 and 4[18]
6Tehri-MH *224737059–610.53, 0.3156–6045–46.50.17–0.210.20–0.2141.0–42.081.48–1.61Massive thinly bedded phyllitic quartziteNo failures[19]
7SSP-PH *235747.554–592.5, 1.2560–8023–450.06–0.130.20–0.2258.9–61.530.5–0.75Deccan trap group-porphyritic basalt, amygdaloidal basalt, and agglomerateVertical cracks occurred in the crown and walls during construction[20,21]
8SLBHP-MH *25.75323357–681.55, 0.62220–25552–730.74–1.950.23–0.2551.3–53.382.51–4.95Hard siltstones; pinkish, fine-grained, and hard crystalline rockNo major problems associated with construction[22]
9KLIPP8-PH *25344240–601.62, 1.08120–16032–640.03–0.140.25–0.26564.26–68.410.48–1.03GraniteA wedge fall occurred in one place[23]
10PYKARA-MH *20.23753245–501.75, 0.8872–18095–1000.03–0.110.26–0.2749.92–57.511.2–1.88Massive charnokite and migmatite gneissNo problems noticed during construction[24,25]
* THP-MH—Tala Hydroelectric Project Machine Hall; THP-DC—Tala Hydroelectric Project Desilting Chambers; MHP-MH—Mangdhechu Hydroelectric Project Machine Hall; NJPC-MH—Nathpa Jhakri Hydroelectric Project Machine Hall; NJPC-DC—Nathpa Jhakri Hydroelectric Desilting Chambers; Tehri MH—Tehri Machine Hall; SSP-PH—Sardar Sarovar Project Power House; SLBHP-MH—Srisailam Left Bank Hydroelectric Project Machine Hall; KLIPP8-PH—Kaleswaram Lift Irrigation Project Package8 Pump House; PYKARA MH—Pykara Hydroelectric Project Machine hall.
Table 2. Correlation coefficient matrix between the selected variables.
Width, mHeight, mRock Cover, mKHKhRMR UCS, MPaEi, GPaPoisson’s Ratio υTensile Strength, σtFriction Angle, ΦCohesion (C), MPaDeformation (mm)
Width, m1.0
Height, m0.81.0
Rock Cover, m−0.30.01.0
KH0.0−0.1−0.61.0
Kh0.0−0.2−0.60.91.0
RMR0.00.30.2−0.4−0.51.0
UCS, MPa0.70.4−0.30.20.1−0.11.0
Ei, GPa0.40.10.20.10.0−0.30.61.0
Poisson’s Ratio υ−0.2−0.10.7−0.5−0.50.3−0.3−0.21.0
Tensile strength, σt0.40.50.2−0.2−0.20.50.50.10.21.0
Friction angle (Φ)0.50.1−0.70.50.4−0.30.50.3−0.6−0.21.0
C, MPa0.30.40.2−0.3−0.40.60.60.30.10.9−0.11.0
Deformation (mm)−0.3−0.10.6−0.3−0.10.0−0.4−0.30.60.0−0.7−0.11.0
Conditional formatting was used to color code the correlations: dark blue color indicates a strong positive correlation, light blue color indicates fair positive correlation, dark red indicates a strong negative correlation, light red indicates fair negative correlation and white indicates low or no correlation among the variables.
Table 3. Predicted crown displacements from the 64 samples of the MHP machine hall cavern for different combinations of the input parameters.
RMRUCS, MPaEi, GPaPoisson’s RatioTensile Strength, MPaFriction Angle, DegreeC, MPaDeformation, mm
40321000.1650.0368.415.1611.2
40255200.1651.9532.825.1632.6
84321000.381.9532.825.161.72
40321000.381.9568.415.1616.9
842551000.1650.0368.415.160.976
40255200.381.9532.820.4858.7
84321000.1650.0332.825.160.979
8432200.1651.9532.825.164.8
84321000.380.0332.820.481.72
84321000.381.9568.410.481.72
8432200.380.0332.825.168.38
8432200.380.0368.410.488.39
842551000.1650.0332.820.480.976
40321000.380.0332.825.1616.2
4032200.1650.0368.410.4851.1
4032200.380.0368.415.1672.4
40321000.1651.9568.410.4811.2
40255200.380.0368.410.4858.8
402551000.1651.9532.820.487.27
40321000.381.9532.820.4831.8
40255200.1650.0368.415.1632.7
402551000.381.9568.410.4812.7
842551000.1651.9532.825.160.977
402551000.1650.0368.410.487.27
40255200.381.9568.415.1658.8
84255200.1650.0368.410.484.79
4032200.1651.9532.820.4851.2
84255200.1651.9532.820.484.8
402551000.380.0368.415.1612.7
402551000.1650.0332.825.167.27
402551000.380.0332.820.4812.7
8432200.1651.9568.410.484.8
4032200.381.9568.410.489.39
84255200.1650.0332.825.164.79
8432200.381.9568.415.168.39
84321000.1651.9532.820.480.979
84255200.1651.9568.415.164.79
8432200.1650.0368.415.164.8
402551000.1651.9568.415.167.27
40255200.1651.9568.410.4832.7
40321000.1650.0332.820.487.27
40255200.1650.0332.820.4832.7
84255200.380.0368.415.168.27
40321000.380.0368.410.4813.6
84321000.380.0368.415.161.72
8432200.1650.0332.820.484.8
4032200.380.0332.820.4872.5
84255200.381.9532.825.168.28
842551000.380.0332.825.161.69
842551000.1651.9568.410.480.975
842551000.380.0368.410.481.69
84255200.380.0332.820.488.27
84321000.1651.9568.415.160.943
4032200.381.9532.825.1667.9
4032200.1651.9568.415.1648
8432200.381.9532.820.488.08
40255200.380.0332.825.1656.6
84255200.381.9568.410.487.98
40321000.1651.9532.825.1610.7
842551000.381.9568.415.161.63
84321000.1650.0368.410.480.942
402551000.381.9532.825.1612.2
842551000.381.9532.820.481.63
4032200.1650.0332.825.1648
Table 4. The main effect of different parameters on displacement for all cases.
Cavern Name RMRUCSEiP-RatioTensile StrengthPhi C
MHP-MHEffect−26.77−3.03−20.916.84−1.39−2.151.29
Ranking1st3rd2nd7th5th4th6th
THP-MHEffect−255.6−187.4−218.0−6.6−33.7−35.91.1
Ranking1st3rd2nd6th5th4th7th
THP-DCEffect−9.23−0.64−7.712.620.029−0.120.06
Ranking1st3rd2nd7th6th4th5th
NJHP-MHEffect−51.72−17.78−41.984.740.94−0.34−0.39
Ranking1st3rd2nd7th6th5th4th
NJHP-DCEffect−260.9−198.0−186.2−14.50.6−0.80.6
Ranking1st2nd3rd4th6th5th7th
Tehri-PHEffect−99.9−42.15−76.98−2.331.32−1.241.06
Ranking1st3rd2nd4th7th5th6th
SSP-PHEffect−8.49−0.041−7.664.71−0.63−0.840.68
Ranking1st5th2nd7th4th3rd6th
SLBHP-MHEffect−60.2−24.82−46.72.590.090.020.10
Ranking1st3rd2nd7th4th5th6th
KLIP-P8-PHEffect−58.93−0.03−4.831.40−0.001−0.080.08
Ranking1st4th2nd3rd5th6th7th
PYKARA-MHEffect−85.86−28.94−69.3211.80−1.27−1.20−1.21
Ranking1st3rd2nd7th4th6th5th
Disclaimer/Publisher’s Note: The statements, opinions and data contained in all publications are solely those of the individual author(s) and contributor(s) and not of MDPI and/or the editor(s). MDPI and/or the editor(s) disclaim responsibility for any injury to people or property resulting from any ideas, methods, instructions or products referred to in the content.

