Article

Did the Quality of Digital Communication Skills in Education Improve after the Pandemic? Evidence from HEIs

1
Faculty of Economics, University of Economics in Katowice, 40-287 Katowice, Poland
2
Faculty of Informatics and Communication, University of Economics in Katowice, 40-287 Katowice, Poland
3
Faculty of Spatial Economy and Regions in Transition, University of Economics in Katowice, 40-287 Katowice, Poland
4
Faculty of Economics, VSB-Technical University of Ostrava, 702 200 Ostrava, Czech Republic
*
Author to whom correspondence should be addressed.
Sustainability 2023, 15(15), 11878; https://doi.org/10.3390/su151511878
Submission received: 21 June 2023 / Revised: 30 July 2023 / Accepted: 31 July 2023 / Published: 2 August 2023

Abstract

:
In the global transition, digital technologies are perceived as important drivers of change. Contemporary IT technologies help to enhance the productivity and efficiency of numerous systems on the way to achieving sustainable development goals. Wider use of digital communication tools in HEIs (higher education institutions) can reduce inequalities and increase inclusiveness of tertiary education. In this paper, we present the results of exploratory research aimed at assessing whether COVID-19 has improved digital communication skills in higher education. We revised the quality of digital direct and indirect communication skills between students and teachers (both ways), by referring to the level of satisfaction of both sides of digital communication (teachers and students). The results indicate that there is a statistically significant improvement in the quality of digital communication skills, in particular, if we compare the position of both students and teachers after the pandemic, relative to the pre-COVID-19 pandemic period. Our investigation confirms that COVID-19 was a shock that enhanced the improvement of digital communication skills in higher education, and the pandemic experience had a positive impact on the more efficient use of digital education technologies.

1. Introduction

Education has been severely affected by the COVID-19 pandemic throughout the world. The crisis caused by COVID-19 was an important stress test for the education system with a threat of massive loss of human capital development and long-term economic and social implications [1]. However, as any other crisis, it has created new educational opportunities and changed the ways of thinking, also in the area of the role of online education in fostering sustainable development. It has promoted the digitalization of the education system and initiated the debates regarding the potential of online learning, educational inequalities, and the effectiveness of online communication and teaching methods [2].
Digitalization provides remote access to an integrated network of institutions, users, services, and resources and is perceived as a significant driver for sustainability. Information and communications technologies (ICTs) improve the productivity and efficiency of socioeconomic systems and lead to greater resource efficiency, generating unique opportunities to address challenges associated with sustainable development goals (SDGs) [3,4]. Among the 17 SDGs of the United Nations [5], there are 4 directly related to digitalization in education: quality education (SDG 4), reduced inequalities (SDG 10), sustainable cities and communities (SDG 11), and responsible consumption and production (SDG 12). Online education replaces many face-to-face activities; this helps to achieve resource efficiency and waste reduction by reducing the need for facilities, buildings and other infrastructure (SDG 12). The study conducted by Versteijlen et al. [6] on HEIs shows that online education (when at least 80% of education processes is digital) also greatly decreases the carbon impact of student and teacher travel (SDG 11). Furthermore, digital communication can reduce inequalities (SDG 10), especially in the area of spatial accessibility (e.g., rural areas), increasing inclusiveness of education and many public services [7,8]. On the other hand, the COVID-19 pandemic also showed that online learning can enhance teaching innovations with the use of new technology infrastructures, improve digital competencies of both students and teachers, or improve learning conditions at home [9], supporting education quality (SDG 4).
The contributions of digital transformation (DT) and the related digital transformation in education (DTE) themselves are regarded relevant factors supporting the SDGs, in line with the 2030 agenda [10]. In particular, the use of information and communication technologies (ICT) are regarded as important factors in accelerating progress and supporting the achievement of SDGs addressing quality of education and inclusive knowledge. In fact, this issue raised research attention in pre-COVID-19 pandemic period, in the context of technological readiness [11]. The COVID-19 experience forced universities to shift to this new trend in education in a very short period of time. Not surprisingly, as revised by Bond et at. [12] in their meta-analysis of published works, shortly after the pandemic outbreak, there were numerous studies (often qualitative or on small samples) reflecting technological readiness, pedagogical constraints, or social limitations of remote education. In this stream of the literature, however, the problem of digital communication skills was not addressed. Our work adds to this evident research gap by addressing the digital communication skills of teachers and students in the digital teaching environment. In this regard, our work contributes to the increase in online communication competences that are critical for efficient digital communication in higher education.
The main purpose of our work is to explore whether the quality of teachers’ and students’ digital communication skills has improved due to the experience of the COVID-19 pandemic. In our empirical investigations, we compare the results for three universities located in three countries: Poland, Czechia, and Slovakia. The selection country setting was driven by several observations. First, these three countries represent central Europe and share cultural, economic, and social similarities, which result from their history and geographical proximity [13]. Since their accession to the European Union in 2004, the policy reforms of higher education were targeted at implementing the standards of the Bologna Process, which bring coherence to higher education system across European Union [14]. In this aspect, the three countries subject to our empirical exploration remain homogenous. At the same time, despite many similarities shared by Poland, Czechia, and Slovakia, there are some interesting differences in the use of digital education, leaving Poland behind, especially in the post-COVID-19 pandemic period. According to Eurostat [15], the percentage of individuals who attend online courses or use of digital educational materials in the post-COVID-19 pandemic period reached merely 14%, while in Slovakia and Czechia, this indicator was above the EU average of 25%. Thus, our sample selection provides an insight to countries that are not homogenous as far as the impacts of pandemic on the enhancement of digital education are considered.
Our investigation was designed as an exploratory work to address three research questions that address the satisfaction of digital communication skills at HEIs. Our intention was to detect the potential improvement in digital communication skills by comparing the pre- and post-COVID-19 pandemic periods. Moreover, we were interested in tracking the improvement in communication skills of two major stakeholders of digital education, namely teachers and students, as well as the supportive role of technology. Taking the above into consideration, we formulated our research questions as follows:
  • RQ1: Has student satisfaction with the quality of teacher digital communication skills improved?
  • RQ2: Has teacher satisfaction with the quality of student digital communication skills improved?
  • RQ3: Has the satisfaction of students and teachers with the software platform used for online lectures improved?
For the purposes of our exploratory study, we designed a survey. To draw conclusions on the improvement in quality of digital communication skills, we asked our respondents to consider the situation before pandemic (pre-C19), at the beginning of pandemic outbreak (beg-C19), and after the pandemic (post-C19). By comparing post-COVID-19 pandemic responses with those of former periods (pre-C19 and beg-C19), we were able to address the differences that appeared between these three points in time. The survey was targeted at students and teachers separately, allowing us to compare the perceptions of these two groups with regard to the digital communication process.
The remainder of this paper is organized as follows: In Section 2, we outline the theoretical framework of digital communication in education, with identification of major problems faced by the participants of the digital communication process. In Section 3, we explain the design of our exploratory empirical research by explaining the sample selection, survey design, and methods we used. In Section 4, we present and discuss the results. Section 5 concludes.

2. Digital Communication Skills in the Higher Education Process

Market practice and scientific research show that gradually, for many years, the role of remote learning in the educational market has increased [16,17,18]. Undoubtedly, one of the reasons behind this was the process of digital transformation (DT) and the related digital transformation in education (DTE). The DTE itself remains critical in efficient support of sustainable development goals as far as quality of education and inclusiveness are considered [10]. In particular, the use of information and communication technologies (ICTs) is regarded as an important factor to accelerating progress [11]. Not surprisingly, the first works to consider the challenges of the COVID-19 pandemic were very concerned about technological readiness for remote education. However, less attention was paid to the readiness of the participants of the process of education, in line with the theory of communication and its quality, and its specifics in the digital environment.
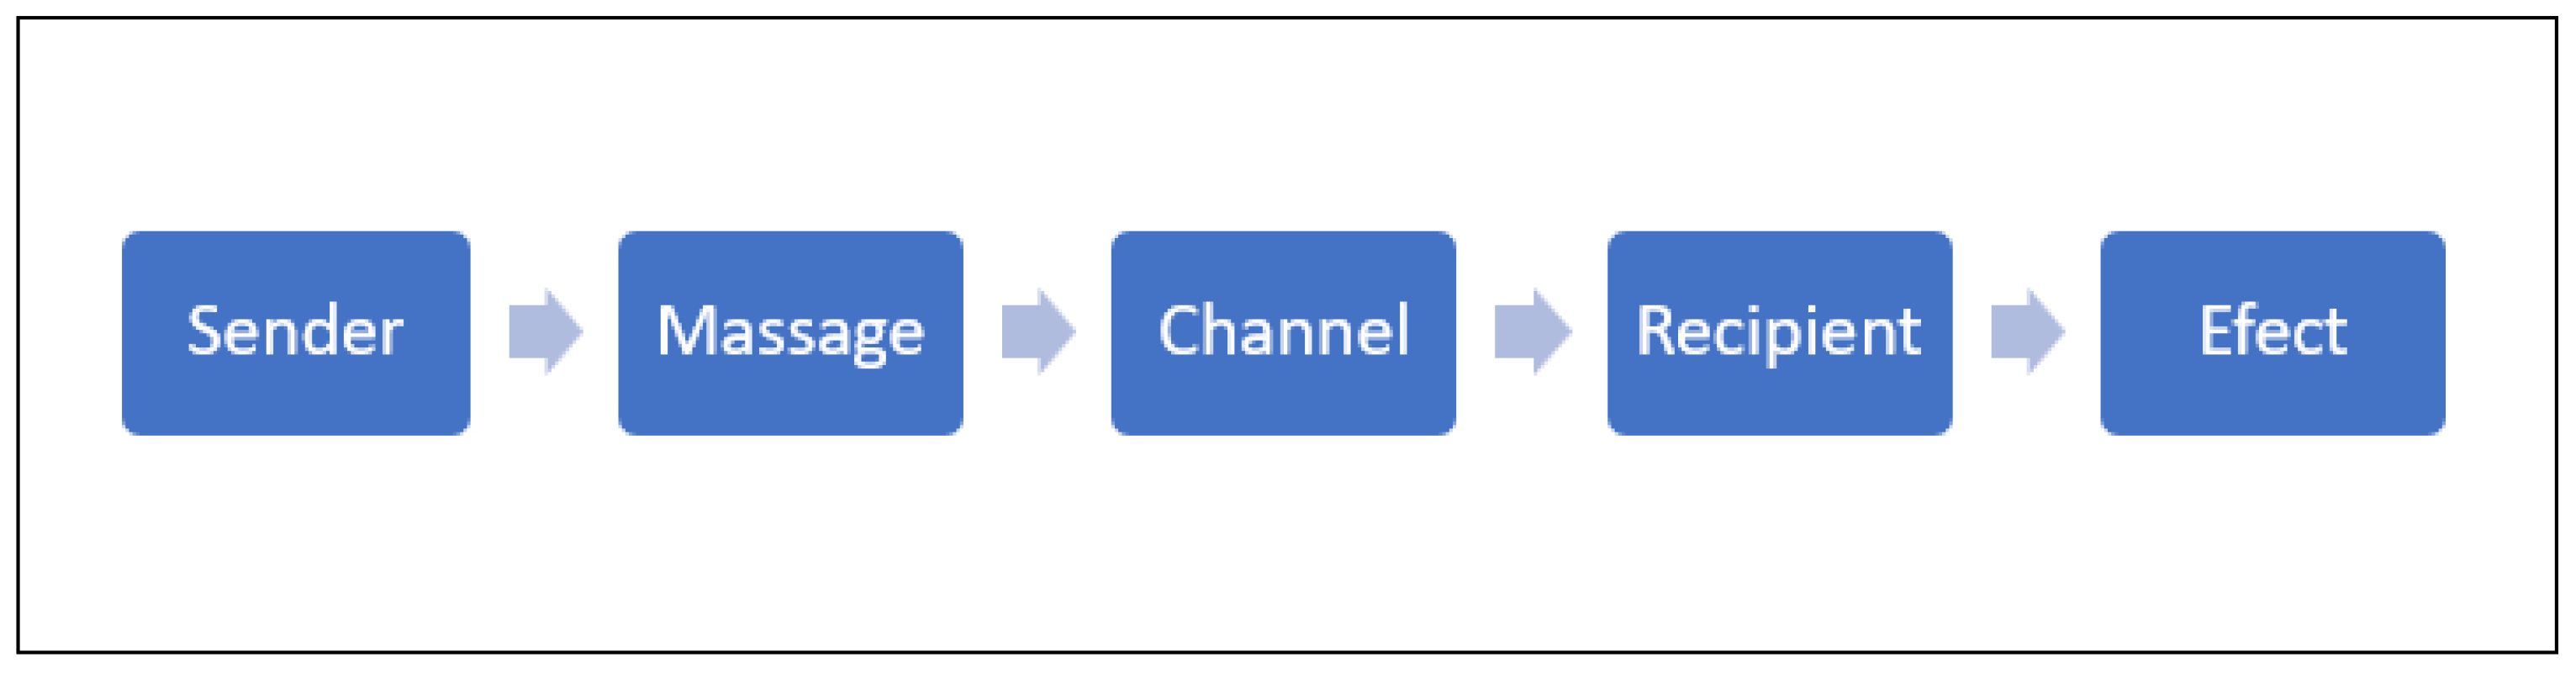
Overall, our study reflects H. Lasswell’s [19] model of communication, known as the “5W” model and presented in Figure 1 [20,21]. The “5W” model emphasizes the two important aspects of interpersonal communication: the linearity of communication and its functionality. The communication process has five main elements: sender, receiver, message, channel, and effect (“WHO says WHAT to WHOM in WHICH channel with WHAT effect”). Subsequent work on the theory of the communication process extended the structure of Lasswell’s model to include elements such as communication noise and feedback, which are also important for determining effectiveness of communication [22,23]. In line with Lasswell’s model, communication is defined as the act of communicating between individuals to exchange ideas and share information using appropriate channels and tools.
As pointed out by Wengxiu [24], in the process of media communication, the “5W” elements are evolving, not only in terms of technological development impacting the channel of communication, but also in complexity of the remaining elements. Accordingly, the process of digital communication is also more complex, and if education is considered, the proper communication skills of teachers (senders) and students (recipients) are essential. The COVID-19 pandemic led both teachers and students to develop the ability to react quickly to changes happening around them and to adapt the tools and methods of education and learning to changing conditions. Nevertheless, there is some pre- and post-COVID-19 pandemic evidence that sheds light on major problems that might influence efficient digital communication in the process of higher education.
If we consider students as the recipients of communication in the process of education, for many students, participation in remote classes was difficult, and the glass screen barrier did not allow for full participation and the exchange of ideas. Lack of contact with teachers and lack of live interaction with colleagues affected self-regulation and added to learning difficulties during online study [25]. Students participating in remote learning were also exposed to psychological issues, such as a sense of isolation, difficulty in focusing on the screen for a long time, or lack of a sense of support. In addition, massive information and work overload were also reported as relevant disturbances in the process of online teaching at the beginning of the COVID-19 pandemic [12,26]. Some studies also confirmed the lack of motivation to work in online classes, which in turn resulted in higher dropout rates. This tendency was observed before the COVID-19 pandemic (for instance, Angelino et al. [27] proved 10–20% higher attrition rates for online classes in comparison to in-house classes). Regarding the COVID-19 pandemic’s effects, similar problems with motivation were observed by Hervás-Gómez et al. [10]. Overall, students’ problems with lack of clear feedback from teachers, incomprehensibility, imprecise instructions for assignments, and lack of technical preparation of learners were confirmed by several works far before the COVID-19 pandemic’s outbreak [28,29], inspired by early attempts to implement digital education.
If we consider teachers as the senders of communication, similar conclusions can be drawn. First of all, teachers were also observed to have difficulties, including situations where students turn off cameras and perform various activities unrelated to the subject during the lecture. The inability of teachers to use their body language, gestures, and facial expressions, which in the real world build relationships, is also an obstacle to effective online teaching. It is up to teachers to find a way to reach out to students to encourage them to keep their attention on the course and participate in tasks. A key aspect of the learning process is communication and motivation, and in a distance learning environment, the importance of proper communication between all parties in the process seems even more important than in a university classroom environment [18,30,31].
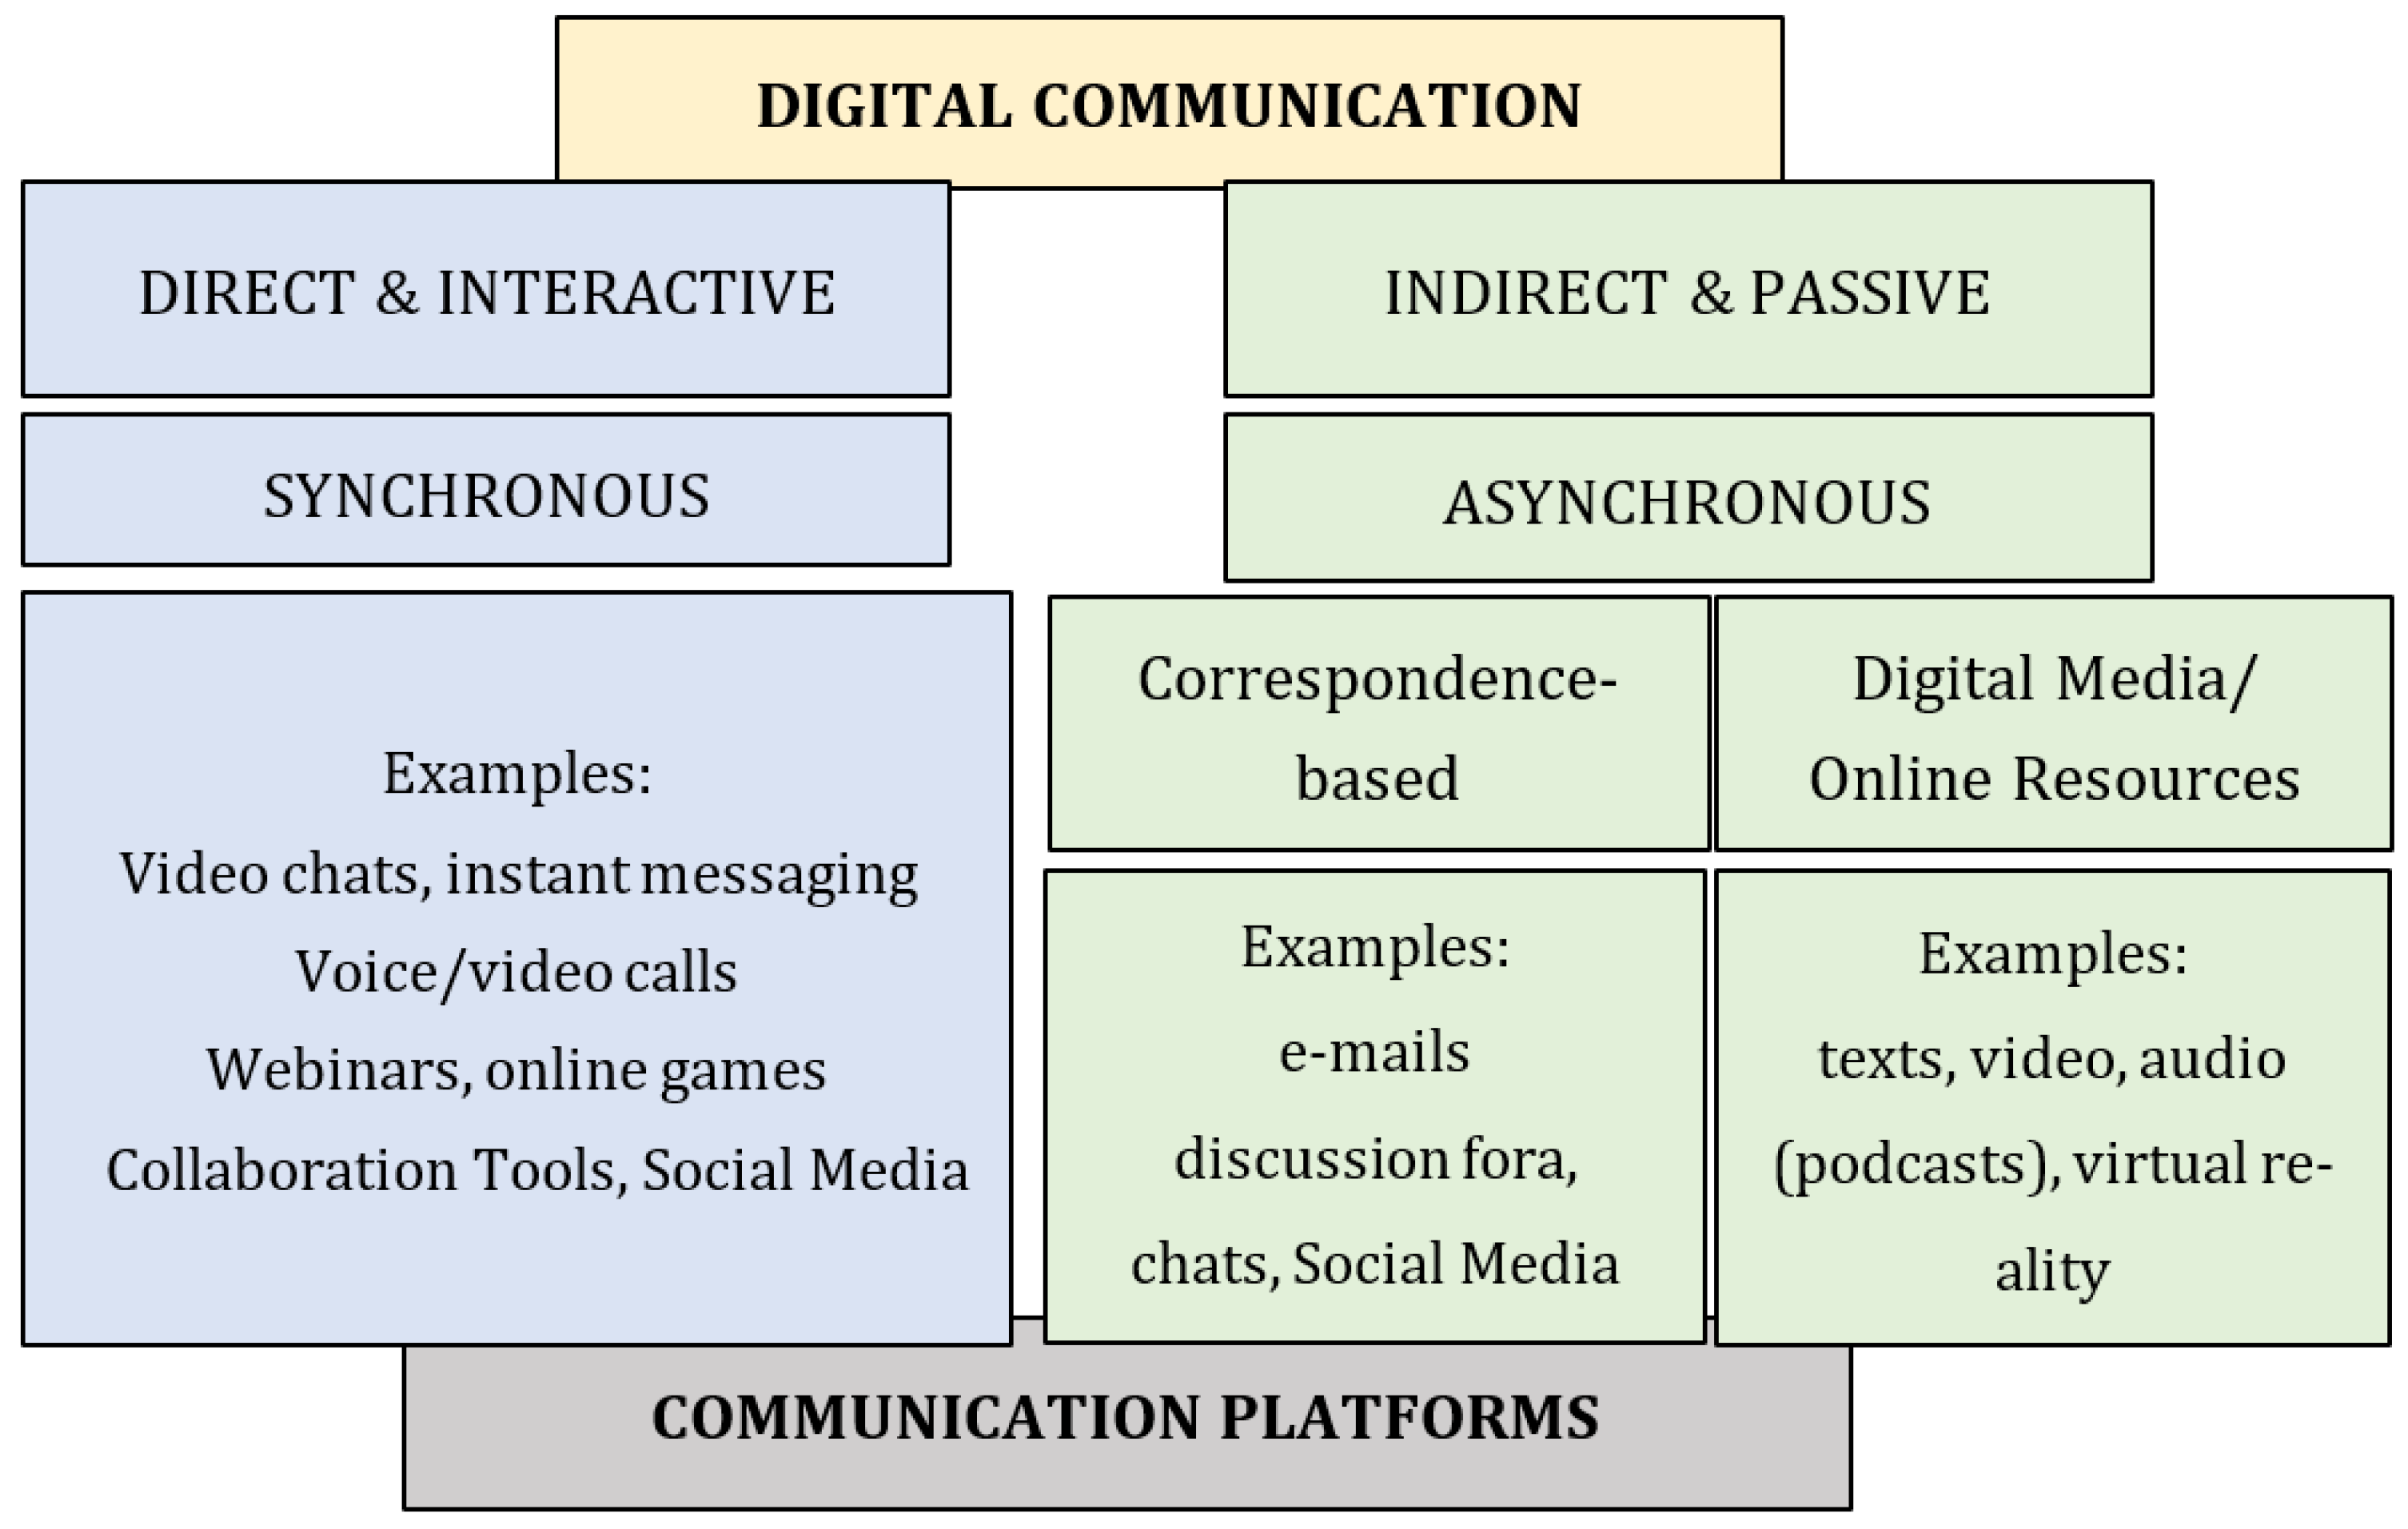
From the perspective of the process of education, communication in online education may implement either synchronous or asynchronous online modes (as distinguished by Khan [32]). Khan [32] considered synchronous learning as consisting of two crucial elements: interactions over the internet (students’ interactions with a tutor) and real-time digital communication. Asynchronous teaching is defined as teaching not limited by the time, place, or constraints of a classroom [33]. With reference to this distinction, in Figure 2, we present the two main types of digital communication that are in place in the digital education process [34,35]. Synchronous communication is based on conversations, and at the same time, it represents a direct and interactive communication style. Examples are online lessons and lectures (in real time) performed with the support of visual techniques. There are also two types of asynchronous communication, which represent indirect and passive communication. These could be either the correspondence-based communication (e.g., emails or discussion fora) or digital media and online resources (e.g., the texts provided to support the learning process). Regardless of type, digital communication needs adequate technical support to be efficient. Therefore, digital communication platforms remain a relevant technical aspect of efficient digital education in channeling information from sender to recipient.
Each learning situation requires the adaptation of appropriate communication styles and techniques that improve audience engagement and enable the achievement of learning objectives [36]. Contrary to appearances, in synchronous online communication, the critical issue is not only the choice of tools and platforms or the interactivity of the prepared presentation. Most important is the teacher’s attitude (as the sender of communication) toward the students (recipients of communication) and a teacher’s ability to maintain their students’ attention. These aspects are critical to the quality of digital communication skills in the education process. When designing our exploratory survey, we referenced the types of digital communication presented in Figure 2 and the relevance of communication platforms, which is explained in the following section.

3. Research Design and Method

3.1. Survey Design

To address the problem of digital communication skills in the process of digital education at HEIs, we used the unique opportunity created by the COVID-19 pandemic. At that time, HEIs had to shift from the traditional (on-site) learning process to online lectures in a relatively short period of time. This was a challenging experience and is very informative in the context of how far external forces can drive improvement in the education process. Our survey was designed and conducted as part of an educational project aimed at improving digital education in HEIs. As part of the diagnosis of the existing situation, we ran this exploratory survey to learn about the digital communication skills of both sides of the process of communication, teachers and students, as well as about the role of digital communication channels used to support this process (in line with the model outlined in Figure 2).
In Table 1, we present the three main constructs of our survey. These constructs were designed in line with the three research questions we asked, with reference to the comparison of pre- and post-COVID-19 pandemic periods:
  • RQ1: Has student satisfaction with the quality of teachers’ digital communication skills increased?
  • RQ2: Has teacher satisfaction with the quality of students’ digital communication skills increased?
  • RQ3: Has student and teacher satisfaction with the software platform used for online lectures increased?
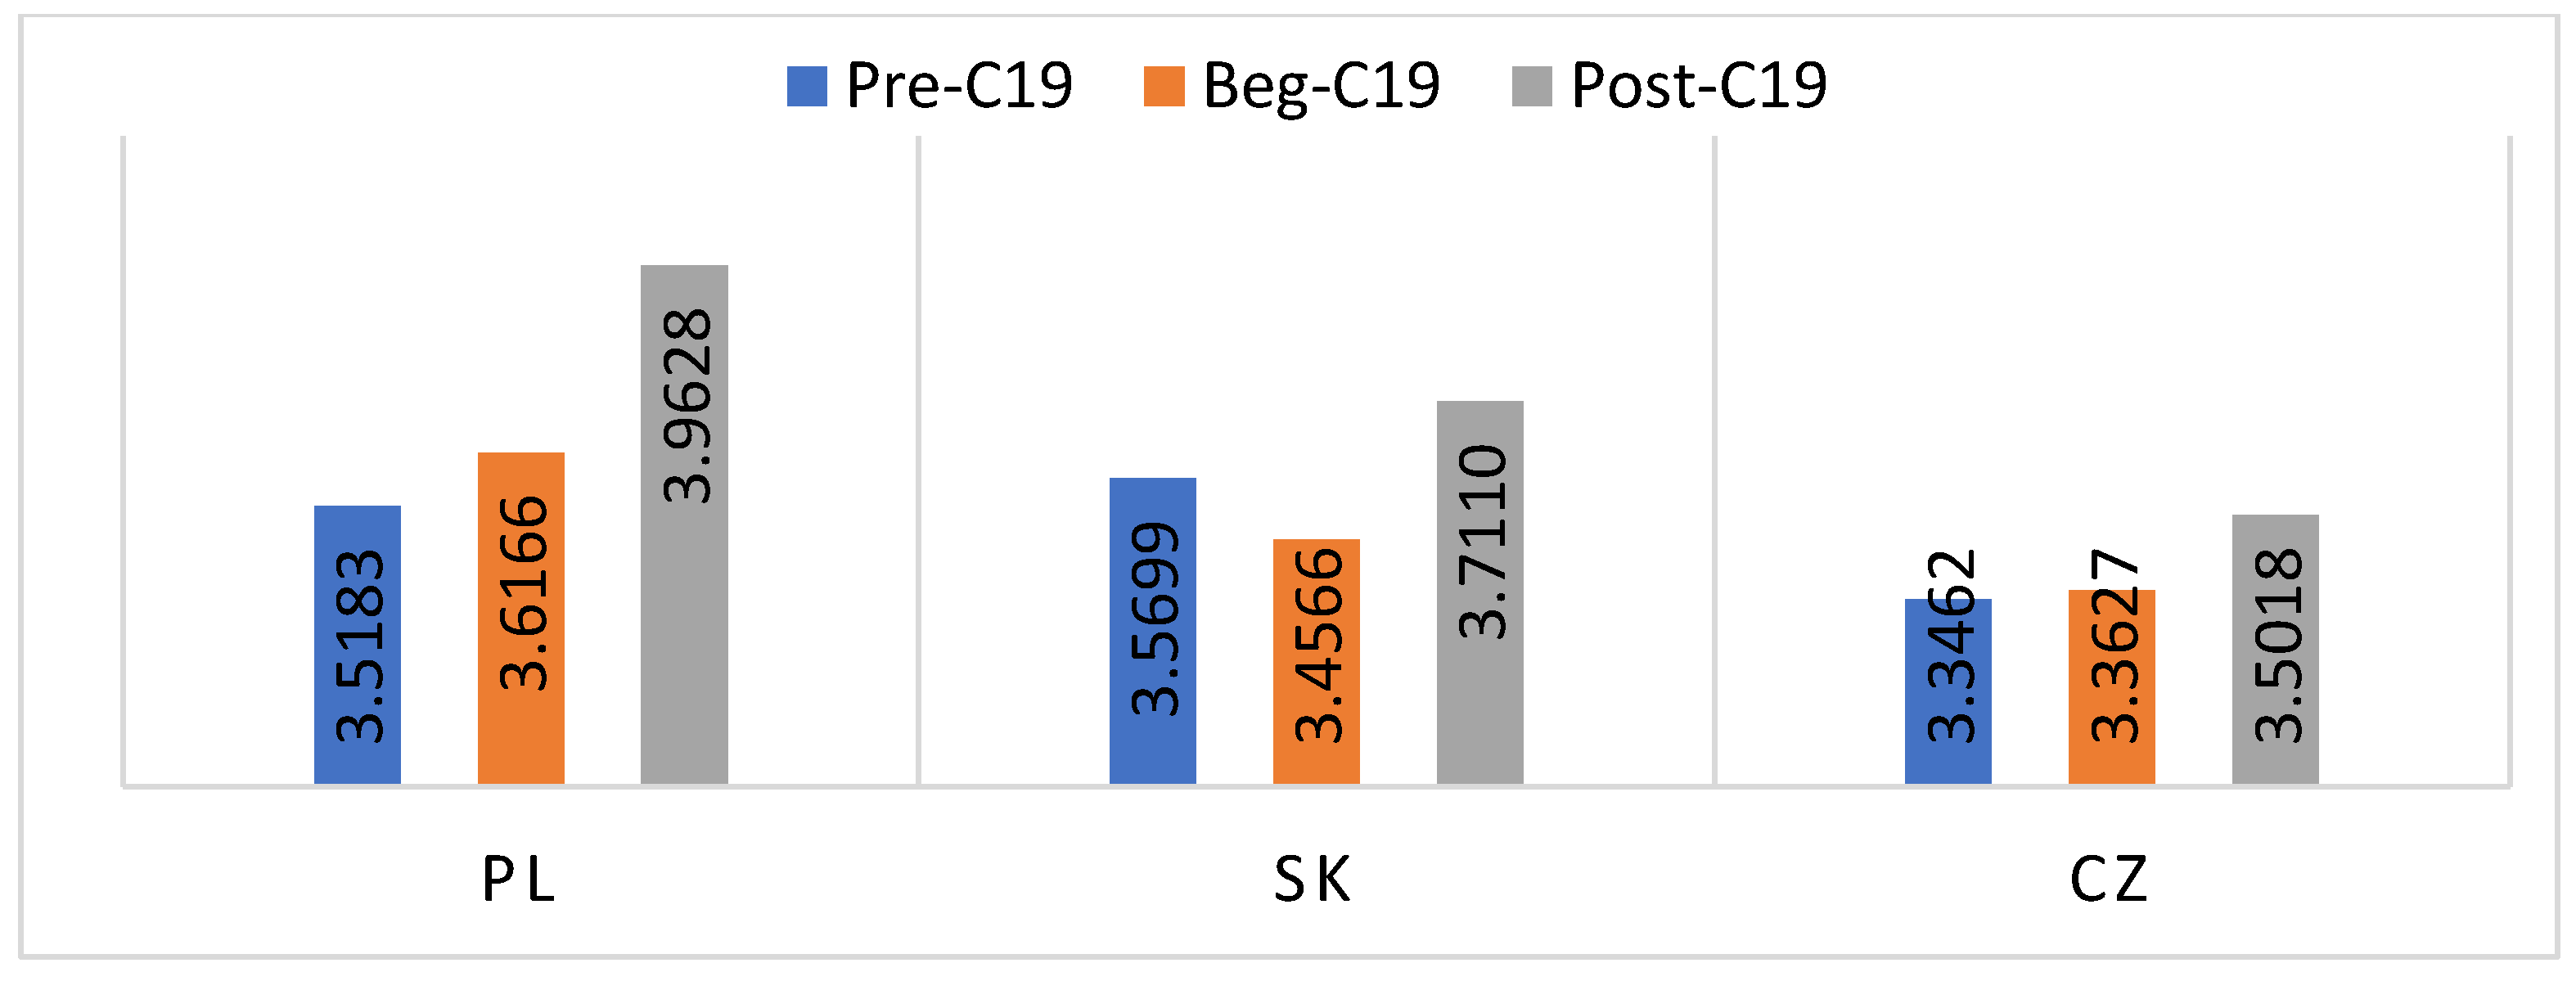
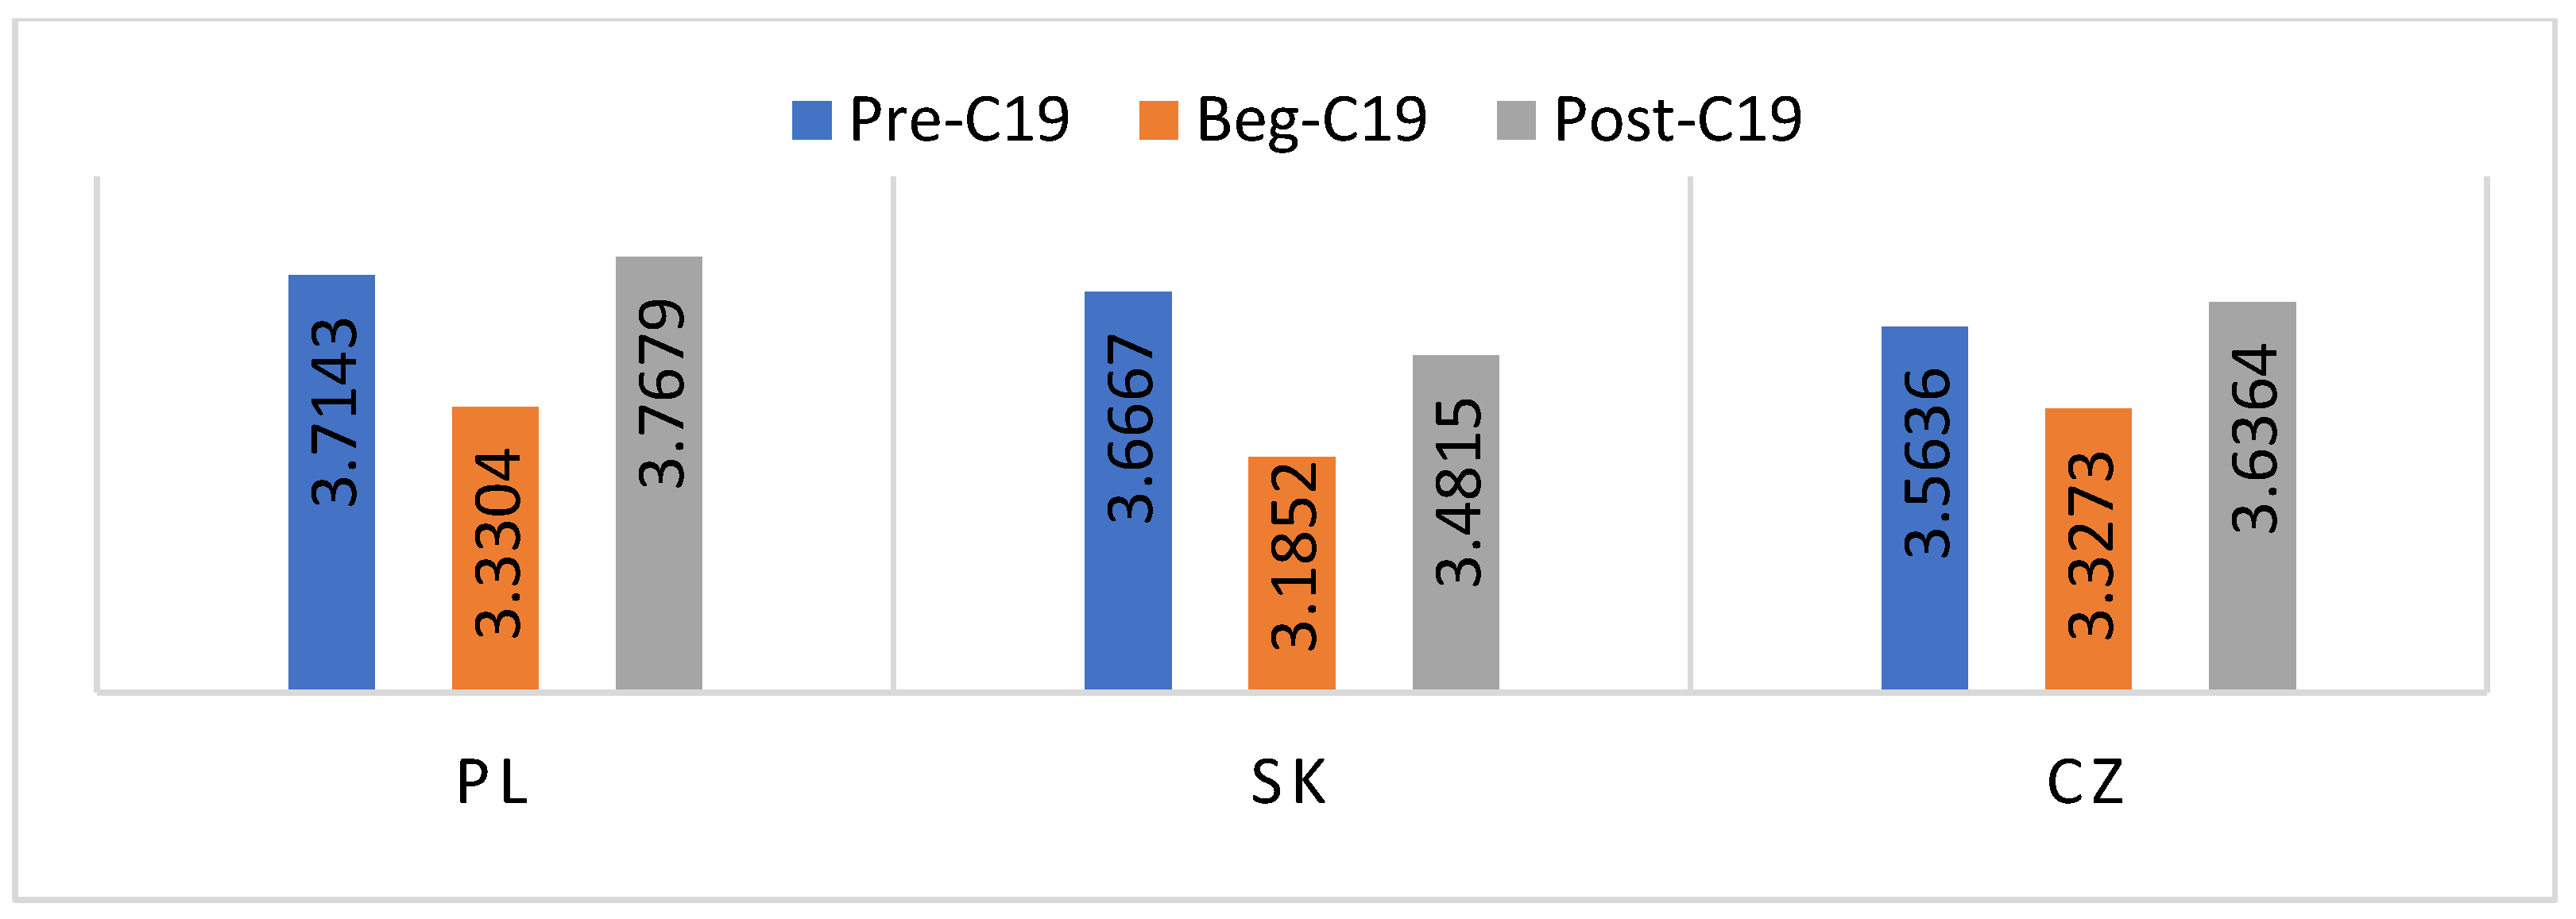
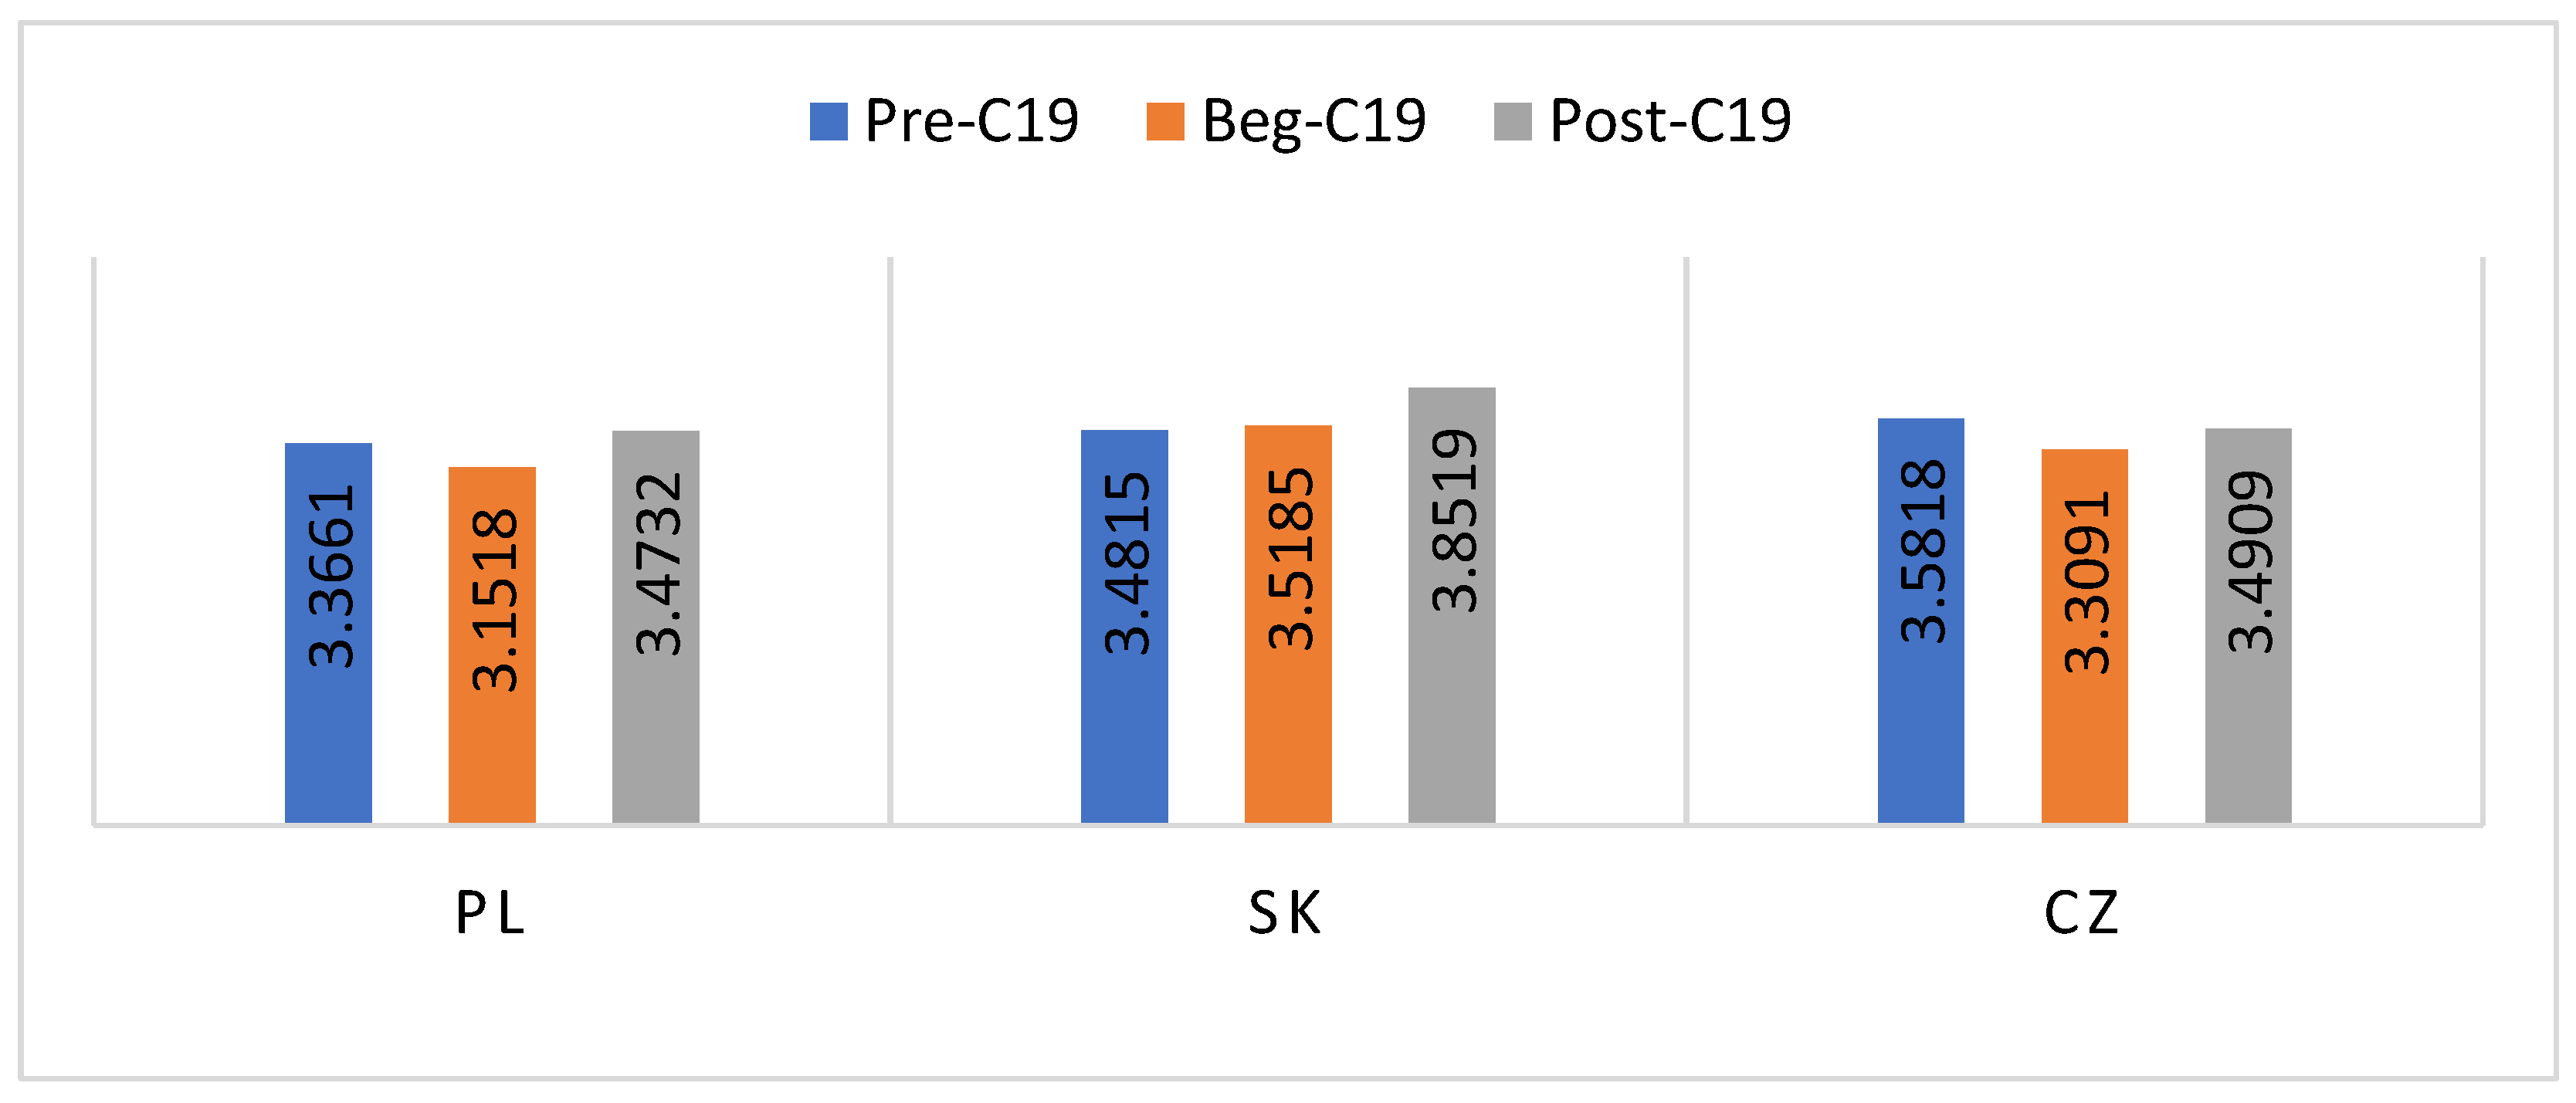
To answer the first research question, we asked students about the quality of teachers’ digital communication skills and addressed both direct (synchronous) and indirect (asynchronous) communication. In a similar vein, we addressed the second research question by asking teachers about the quality of students’ digital communication skills. Finally, we asked both groups of the communication process (teachers and students) about their satisfaction level with the digital platforms used to support the communication process in online teaching. The teachers and students’ assertions were provided on a 5-point Likert scale, ranging from 1 (not satisfied at all) to 5 (very satisfied). With this methodical approach, we were able to compare the level of satisfaction with the quality of digital communication and the learning platforms used in the communication process over time.
The assertions provided by the respondents (students and teachers) covered three time periods to allow for comparisons of satisfaction levels before, during, and shortly after the COVID-19 pandemic. More specifically, we asked each respondent to provide their level of satisfaction with digital communication skills and platforms used during different periods:
  • Face-to-face teaching, when digital education was used relatively occasionally; this period is referenced in the interpretation of results as the pre-COVID-19 pandemic period (pre-C19);
  • At the beginning of the COVID-19 pandemic (beg-C19), when the universities had to urgently shift to distance learning, although often not fully prepared;
  • After the COVID-19 pandemic outbreak (post-C19), when online teaching was prevalent and universities were facing consecutive waves of lockdowns, depending on the scale of the COVID-19 pandemic.
We introduced this differentiation to enable the assessment of the improvement in digital communication skills as an effect of the challenges driven by the COVID-19 pandemic. The pre-COVID-19 pandemic period (pre-C19) provides a kind of reference point that enables us to evaluate readiness for digital education in HEIs. Then, the beginning of the COVID-19 pandemic (beg-C19) compared to pre-COVID-19 pandemic (pre-C19) is informative in the context of the effects of crisis management and the quality of tools and solutions implemented by universities at that time. In these two aspects, our respondents provided some backward-looking estimates, driven by their personal perceptions of the quality of digital communication skills and the software used. The third period of refence (which we call the post-COVID-19 pandemic situation, denoted as post-C19) provided us with estimates of the quality of digital communication skills and software used after the universities had established their procedures in this regard. We hypothesize that the urgency of the pandemic enhanced the rapid increase in quality of digital communication skills for both students and teachers. The platforms used are supportive in this process, although HEIs tend to stick to formerly (pre-C19) used solutions. Thus, in terms of the supportive role of software, the direction of change is not so obvious.

3.2. Sample Selection

The process of sample selection was two-dimensional. First, we selected countries and universities with the aim of providing a relatively homogeneous survey environment but offering results at an international level. We selected three countries from central and eastern Europe that share cultural, economic, and social similarities, resulting from their history and geographical proximity: Czechia, Poland, and Slovakia [13]. The higher education system in these three countries is also homogenous, due to their adoption of the Bologna Procedures, required by all EU member states. At the same time, these three countries offer an interesting setting for researching digital education due to differences that could shed some light on the advancement of online learning process. For these purposes, we took some figures that provide overall insight into the scale of online learning from the pre-COVID-19 pandemic period (2019) into consideration, in comparison to figures observed in 2022, reported in the Eurostat databases [15]. In Table 2, we provide the Eurostat data on the percentage of individuals taking online courses (of any subject) or using online learning materials for the three countries of interest, and the average of the EU27 countries.
Slovakia and Czechia have slightly higher rates of people taking online courses or using learning materials than Poland in each period of reference. The differences are particularly high for 2022, which is a post-COVID-19 pandemic period and thus could be informative in the context of long-term impacts and trends. If we compare the changes over time, comparing 2022 to 2019 (as the pre-COVID-19 pandemic period), it can be seen that Poland has the lowest dynamics of change, while the rate for Czechia and Slovakia exceeded the average for the EU27. In Poland, it can be observed that there was only an in 2021 (of 19.17%), which was obviously directly driven by the COVID-19 pandemic’s impacts. Still, however, the ratio is visibly lower in comparison to Czechia (with 21.97%) and Slovakia (with 29.9%). The figures reported in Table 2 suggest that the three countries of interest are not homogenous if the readiness to digital education is considered. This observation justifies further comparison of cross-country differences, which we perform in our empirical analysis.
In the context of demographic features of our sample, with our survey, we approached respondents (teachers and students) from one field of education, namely specialization-conforming social sciences (business- and economics-oriented study programs in particular). Therefore, our survey was distributed among teachers and students of VSB-TUO, Faculty of Economics (Czechia); University of Economics in Katowice (UEKAT, Poland); and TUKE, Faculty of Economics (Slovakia). The unified field of study is relevant, as it determines the predominant methods of teaching and studying (given the specifics of the field of study). In this regard, we ensured relative homogeneity of the sample.
Another relevant demographic feature we controlled for was students’ experience of the hectic implementation of COVID-19 solutions at their HEIs and their former experience of traditional in-house university education. To ensure this, we selected the time of survey distribution as well as the target group of respondents precisely. Our survey was distributed online among respondents at the beginning of 2022. At that time, all three universities and faculties of interest were already participating in the process of organized online teaching. In response to the first wave of the pandemic, faced in the summer semester of the academic year 2020/2021, online teaching was implemented at all surveyed universities, but without any specific instructions to teachers regarding the organization of lectures, methods of communication, or supportive digital platforms. However, starting from the teaching period in October 2021 (winter semester of the academic year 2021/2022), online teaching had been formally organized, with instructions on the platforms used, the documentation of online activities, adjustments to teaching and learning methods including students’ assessment procedures. Thus, in January/February 2022 (which was the end of the winter semester 2021/2022), both teachers and students had achieved some experience and a sense of routine in the process of online teaching.
To control the demographic feature reflecting students’ experience, in the group of students, the survey was distributed at random to all students of the third year of bachelor level or the second year of master level. The motivation behind the selection of this target group was to ensure that the student respondents had experience in both pre-COVID-19 pandemic (on-site) education, as well as the pains of the first lock down and the related requirement of distance learning implementation. While distributing the survey, we followed the saturation approach to reach a response rate of c.a. 30%. More specifically, we distributed the survey among a wider, randomly selected group of students that fitted our entry sample selection criteria. Then, we completed the collection of responses once the number of complete survey responses had reached c.a. 30% of the potential number of students that fitted our demographic criterion covering the pre- and post-COVID-19 pandemic experience (it was c.a. 1000 students for the University of Economics in Katowice, c.a. 1000 students for VSB-TUO, and 800 students for TUKE).
In the group of educators, the invitation was distributed to all teachers who provided lectures in the winter semester of the academic year 2021/2022 in the study programs conforming to our entry criteria (social sciences, business- and economics-oriented). The response rate we obtained was c.a. 25% for Poland (112 out of c.a. 350 academic staff members), ca. 30% for TUKE (27 out of c.a. 90 academic staff members of the Faculty of Economics), and c.a. 36% for VSB-TUO (55 out of c.a. 150 academic staff members of the Faculty of Economics).
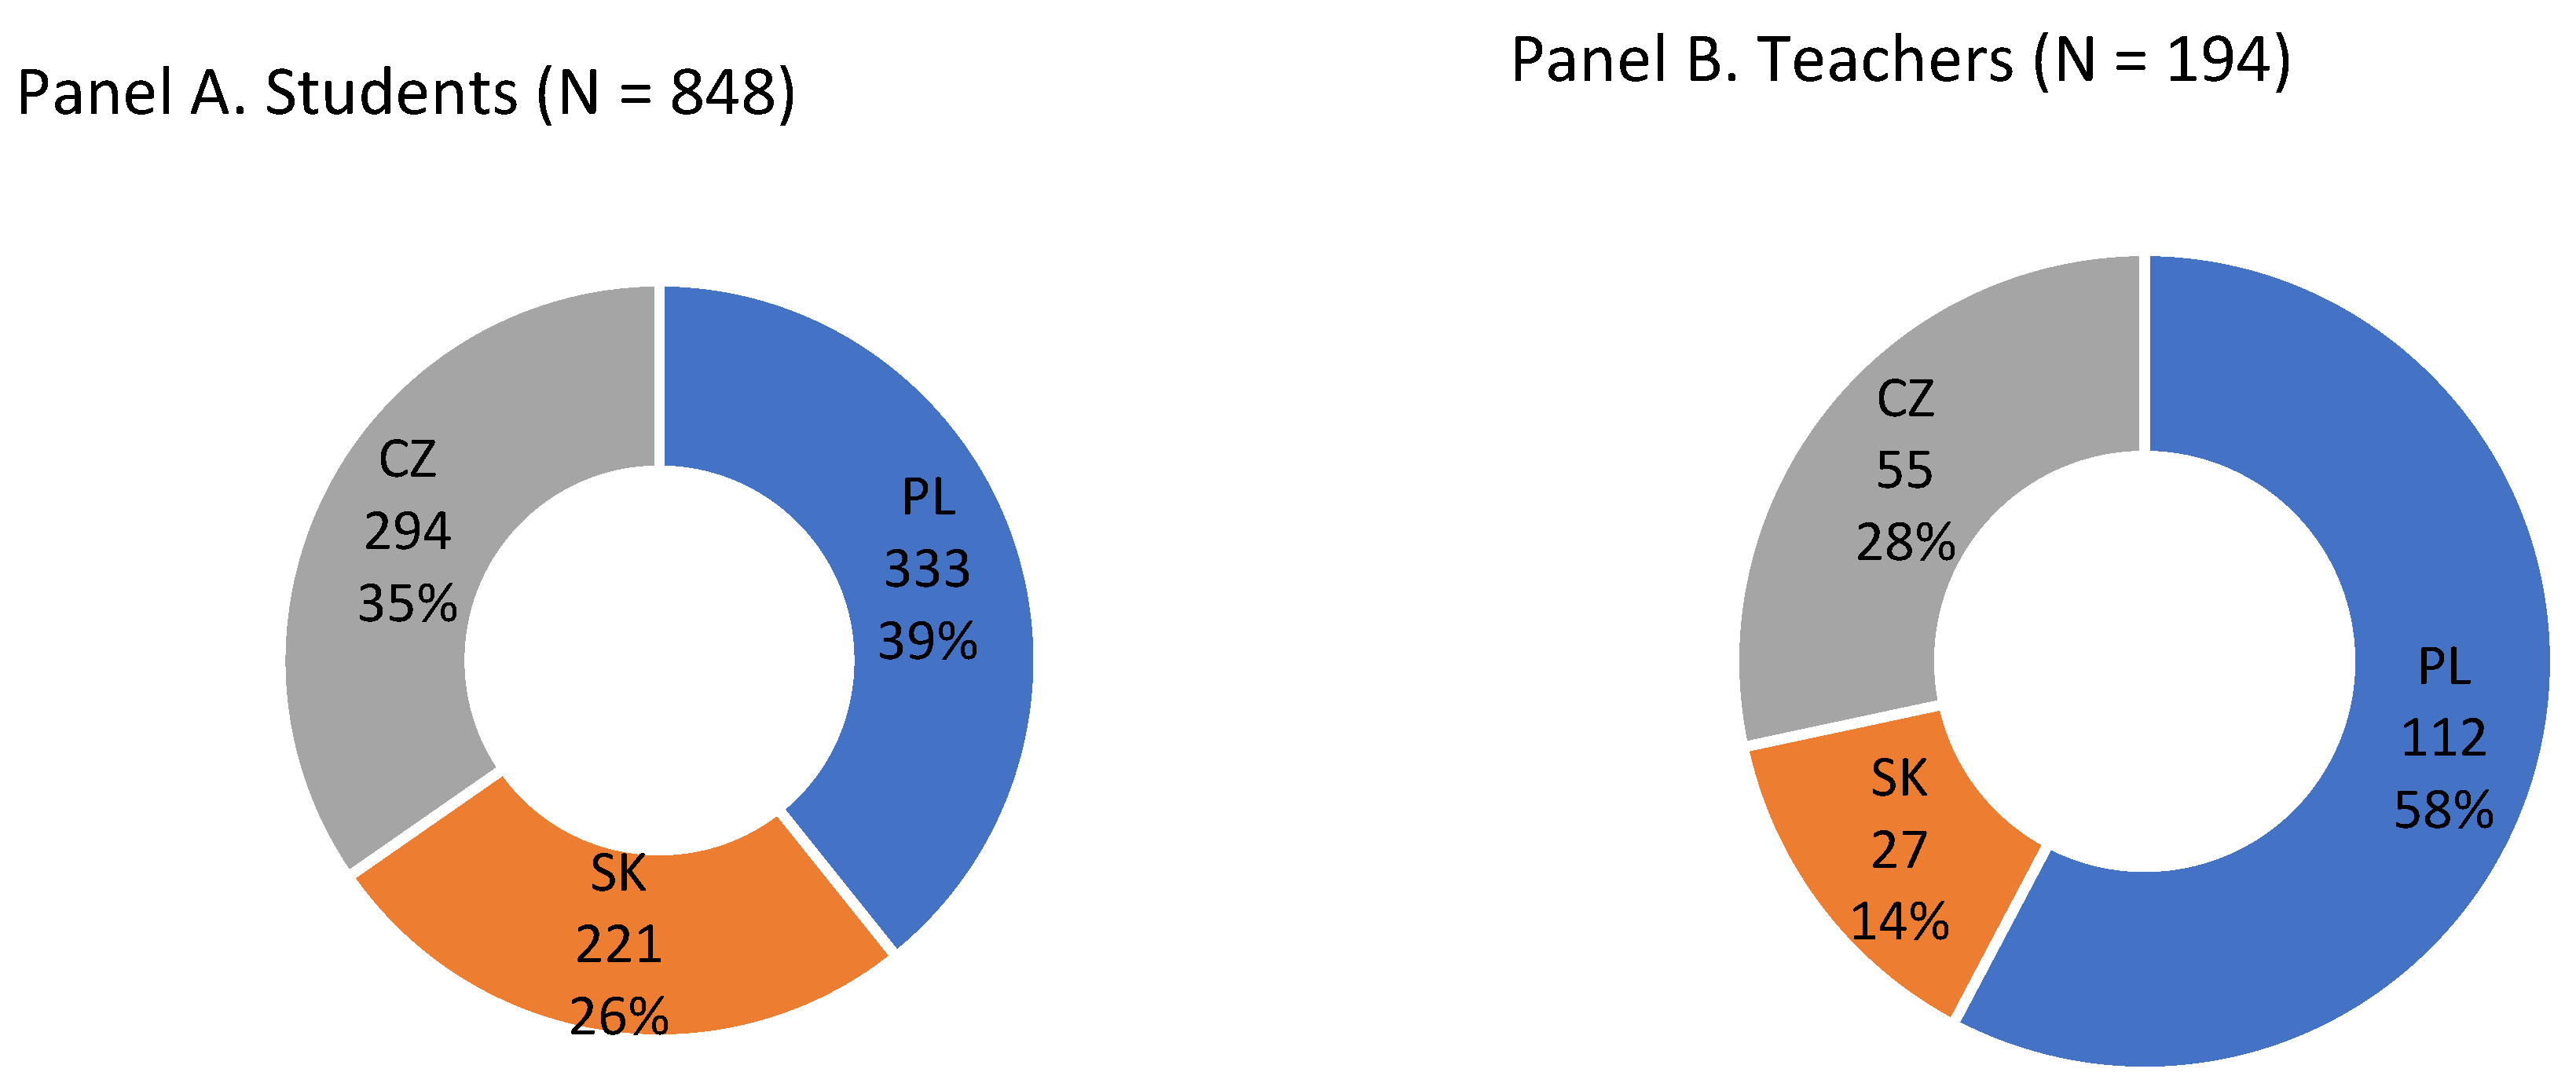
In Figure 3, we provide the distribution of our sample at the country level. In the survey, we obtained 848 responses from students (Panel A), with relatively comparable contributions from Polish (39%) and Czech (33%) students. However, in the group of teachers, the voice of the UEKAT (PL) is prevalent, as out of 194 respondents, there were 58% (112) from this University, followed by 28% from Czechia and 14% from Slovakia.

3.3. Methods

In the data analysis process, we confirmed the reliability (internal consistency) of our survey with Cronbach’s alpha. The results are reported in Appendix A Table A1 separately for the surveys of students and teachers, both in general and country level dimensions. The results indicate good and very good reliability (with α > 0.8).
To provide an insight to the average distribution of ranks of satisfaction provided by the respondents, we graphically present the mean values of these ranks, for each question asked, at country level. However, we confirm the statistical significance of the observed trends by applying nonparametric tests. The reason behind the selection of nonparametric methods is motivated by a common problem in the survey-based studies, which is that of data not normally distributed (we confirmed this by applying Kolmogorov–Smirnov and Shapiro–Wilk tests).
In line with nonparametric approach, we applied the Wilcoxon signed rank test for paired data to compare our observations (level of satisfaction) for pairs of the periods of interest, namely post-C19 relative to either beg-C19 or post-C19 [37]. As we noted some interesting heterogeneity between the countries of interest in terms of digital education, we additionally perform country-level comparisons. For this purpose, we apply a nonparametric ANOVA with Kruskal–Wallis test to verify the statistical significance of similarities and differences observed between the countries (as groups of observations).
The computations were performed with the PS Imago Pro 7.0 (SPSS) software.

4. Results and Discussion

4.1. Students’ Perspective on Teachers’ Digital Communication Skills

4.1.1. Direct Communication Skills

The first problem explored in our survey was how satisfied students are with teachers’ communication skills if direct communication is considered. In Figure 4, we illustrate the mean values of the satisfaction ranks obtained for each country (the distribution of responses is presented in Appendix B Table A2). For Poland and Czechia, we observed an upward trend, which indicates that there was an increase in student satisfaction from direct and interactive communication with teachers. It suggests that in UEKAT and VSB- TUO teachers were able to adapt to the need to communicate digitally with students and that the pandemic led to permanent positive effects within. The results from TUKE also show increased student satisfaction if we compare the post-COVID-19 pandemic situation (post-C19) with the pre-COVID-19 pandemic (pre-C19) or the beginning of the pandemic (beg-C19).
To confirm the statistical significance of the differences observed between the pairs of periods of interest, we performed Wilcoxon signed rank test at the country level. The results of the Wilcoxon test (presented in Table 3) confirm that the situation after the COVID-19 pandemic (post-C19), compared to the situation before it (pre-C19), improved at a statistically significant level (sig. at 0.1%) in each university. Similarly, the situation after the COVID-19 pandemic (post-C19), compared to the situation at its beginning (beg-C19), improved at a statistically significant level (sig. at 0.1%). This strongly supports the view that in the universities surveyed, the COVID-19 pandemic positively influenced the quality of teachers’ communication skills with students if direct and interactive synchronous communication is considered.
We also performed the Kruskal–Wallis test to compare whether the differences we observed between the countries of interest are statistically significant with regard to the level of satisfaction of students with direct and interactive communication with teachers. The results are reported in Table 4.
The results of the comparisons between countries lead to the conclusion that the most important differences are observed for student satisfaction in the post-COVID-19 pandemic period (post-C19). Before and at the beginning, the differences were statistically significant between Slovakia and Czechia. However, for the post-COVID-19 pandemic situation, the satisfaction of the students between the countries differed for Poland compared to Slovakia and Czechia with 0.1% statistical significance. This confirms that the increase in student satisfaction with digital communication with teachers observed for the current state of affairs was not equal in all countries, and Poland was leader in improvement here.

4.1.2. Indirect Communication Skills

In Figure 5, we present the mean values of the survey ranks obtained for the question of students’ satisfaction with the quality of indirect digital communication skills with their teachers. The distribution of ranks, by country, is presented in Appendix B Table A3.
The data presented in Figure 5 illustrate that, for Poland, an upward trend in students’ satisfaction with the indirect digital communication skills of their teachers can be observed if we compare the post- and pre-COVID-19 pandemic period. This observation is confirmed by the results of the Wilcoxon signed rank test, as the differences between the periods are statistically significant for both the pre-C19 and post-C19 situation, as well as for post-C19 situation relative to beg-C19 (Table 5). For the remaining countries, there is a slight decline in student satisfaction with indirect communication with teachers at the beg-C19, with a further improvement in the level of satisfaction with the post-C19 situation. The differences between the periods of interest are also statistically significant.
In Table 6, we report the results of the Kruskal–Wallis test to compare the statistical significance of the differences observed between the countries. The results confirm our previous observation for Poland, which differed at a statistically significant level from Czechia (at 0.1%) and Slovakia (at 1%) for the beg-C19 and post-C19 periods in particular.

4.2. Teacher Perceptions of Student Digital Communication Skills

4.2.1. Direct Communication Skills

The data presented in Figure 6 indicate some similarities between Poland and Czechia if teacher satisfaction with the direct digital communication skills of students is considered. In these universities, teachers’ satisfaction with direct communication decreased slightly at the beginning of the pandemic (beg-C19) compared to the state before the pandemic (pre-C19). In the case of Slovakia, we observed that the level of satisfaction was lower for post-C19 relative to pre-C19. For Poland and Czechia, post-C19 satisfaction is slightly higher than in the pre-C19 period. In Table 7, we provide the results of Wilcoxon signed rank test, which indicates that only the differences after the COVID-19 pandemic relative to its beginning are statistically significant (for Poland and Slovakia only). It supports the observation that there was no significant change in teacher satisfaction with direct communication with students if the post- and pre-C19 period is considered.
In Table 8, we report the results of the Kruskal–Wallis test for country-level differences. The statistically significant differences in teacher satisfaction with indirect communication with students are observed only in the pre-C19 and post-C19 periods.

4.2.2. Indirect Communication Skills

The data presented in Figure 7 indicate some similarities between Poland and Czechia if teacher satisfaction with students’ indirect digital communication skills is considered. In these universities, the satisfaction of teachers with indirect communication decreased slightly at the beginning of the pandemic compared to the state before the pandemic. In the case of Slovakia, we observe a slight increase. Furthermore, we observe that the mean values for the post-C19 situation are slightly higher for Poland and Slovakia if compared to the levels observed at the beginning of the COVID-19 pandemic (beg-C19). This observation is confirmed by the results of Wilcoxon signed rank test, which we provide in Table 9 (statistical significance at 0.1% for Poland and 5% for Slovakia and Czechia). We also observe that, for Slovakia only, there are statistically significant differences between the level of satisfaction observed post-C19 relative to the pre-C19 period. This suggests that from the teacher’s perspective, the COVID-19 pandemic did not add to the quality of the digital indirect communication skills of students. However, it is interesting to observe that at beg-C19, teachers found indirect communication with students more problematic than pre-C19.
There are no statistically significant differences if we compare observations at the country level (Table 10). This indicates that the patterns of teachers’ perceptions of students’ indirect communication skills were similar in each of the HEIs surveyed.

4.3. Channels of Digital Direct Communication

The third problem we explored was the change in level of satisfaction with the platforms of digital communication used in the HEIs surveyed. More specifically, we focused on platforms used for online lectures. We considered the perspective of both students and teachers given the importance of reciprocity in communication. Teachers’ impressions on the functionality of the channel they are required to use are influential on how they communicate with students and may, in turn, influence student satisfaction. The basic digital platforms used for teaching varied in these countries as they depended on the individual policy of each university regardless of country. For example, for VSB TUO and TUKE, the main platform was MS Teams, but for UEKAT it was Google Classroom. In this aspect of our investigations, we focused on the comparison of the situation at the beginning of the COVID-19 pandemic (beg-C19) and after (post-C19). The reason is that pre-C19, the surveyed universities did not offer digital courses; thus, both teachers and students could not provide us with a reliable estimation of their satisfaction level in this regard.
In Figure 8, we provide the means of the student’s rankings provided for their level of satisfaction with the digital communication channels used (5-point Likert scale). In all countries, we observe a visible increase in the ranks assigned to satisfaction scores, which indicates increased satisfaction of the platforms in the post-C19 period compared to beg-C19. These observations are statistically significant at 0.1%, as confirmed by Wilcoxon’s signed rank test (Table 11). The data also confirm the increase in teacher satisfaction with the platforms used. The differences in satisfaction levels post-C19 relative to beg-C19 are statistically significant (at 0.1% and 1%).
In Table 12, we report the results of the Kruskal–Wallis test, where we compare the differences between countries. If we consider the satisfaction of students, there are significant differences between all pairs of countries. However, if we consider the satisfaction of teachers, the differences at the country level are only statistically significant in the post-COVID-19 period, and Poland differed with 1% statistical significance from Slovakia and Czechia.

5. Conclusions

The quality of digital communication is critical for the efficiency of the learning process. Digitalization of communication in education can lead to many aspects of resource efficiency and thus increase quality of education and reduce inequalities, in line with sustainable development requirements [6,8]. Therefore, after an intensive and unexpected process of digital transformation speeded up by the COVID-19 pandemic, there is a constant need to study the effectiveness of methods, channels, and tools used to improve the quality of teaching and learning in a digital environment.
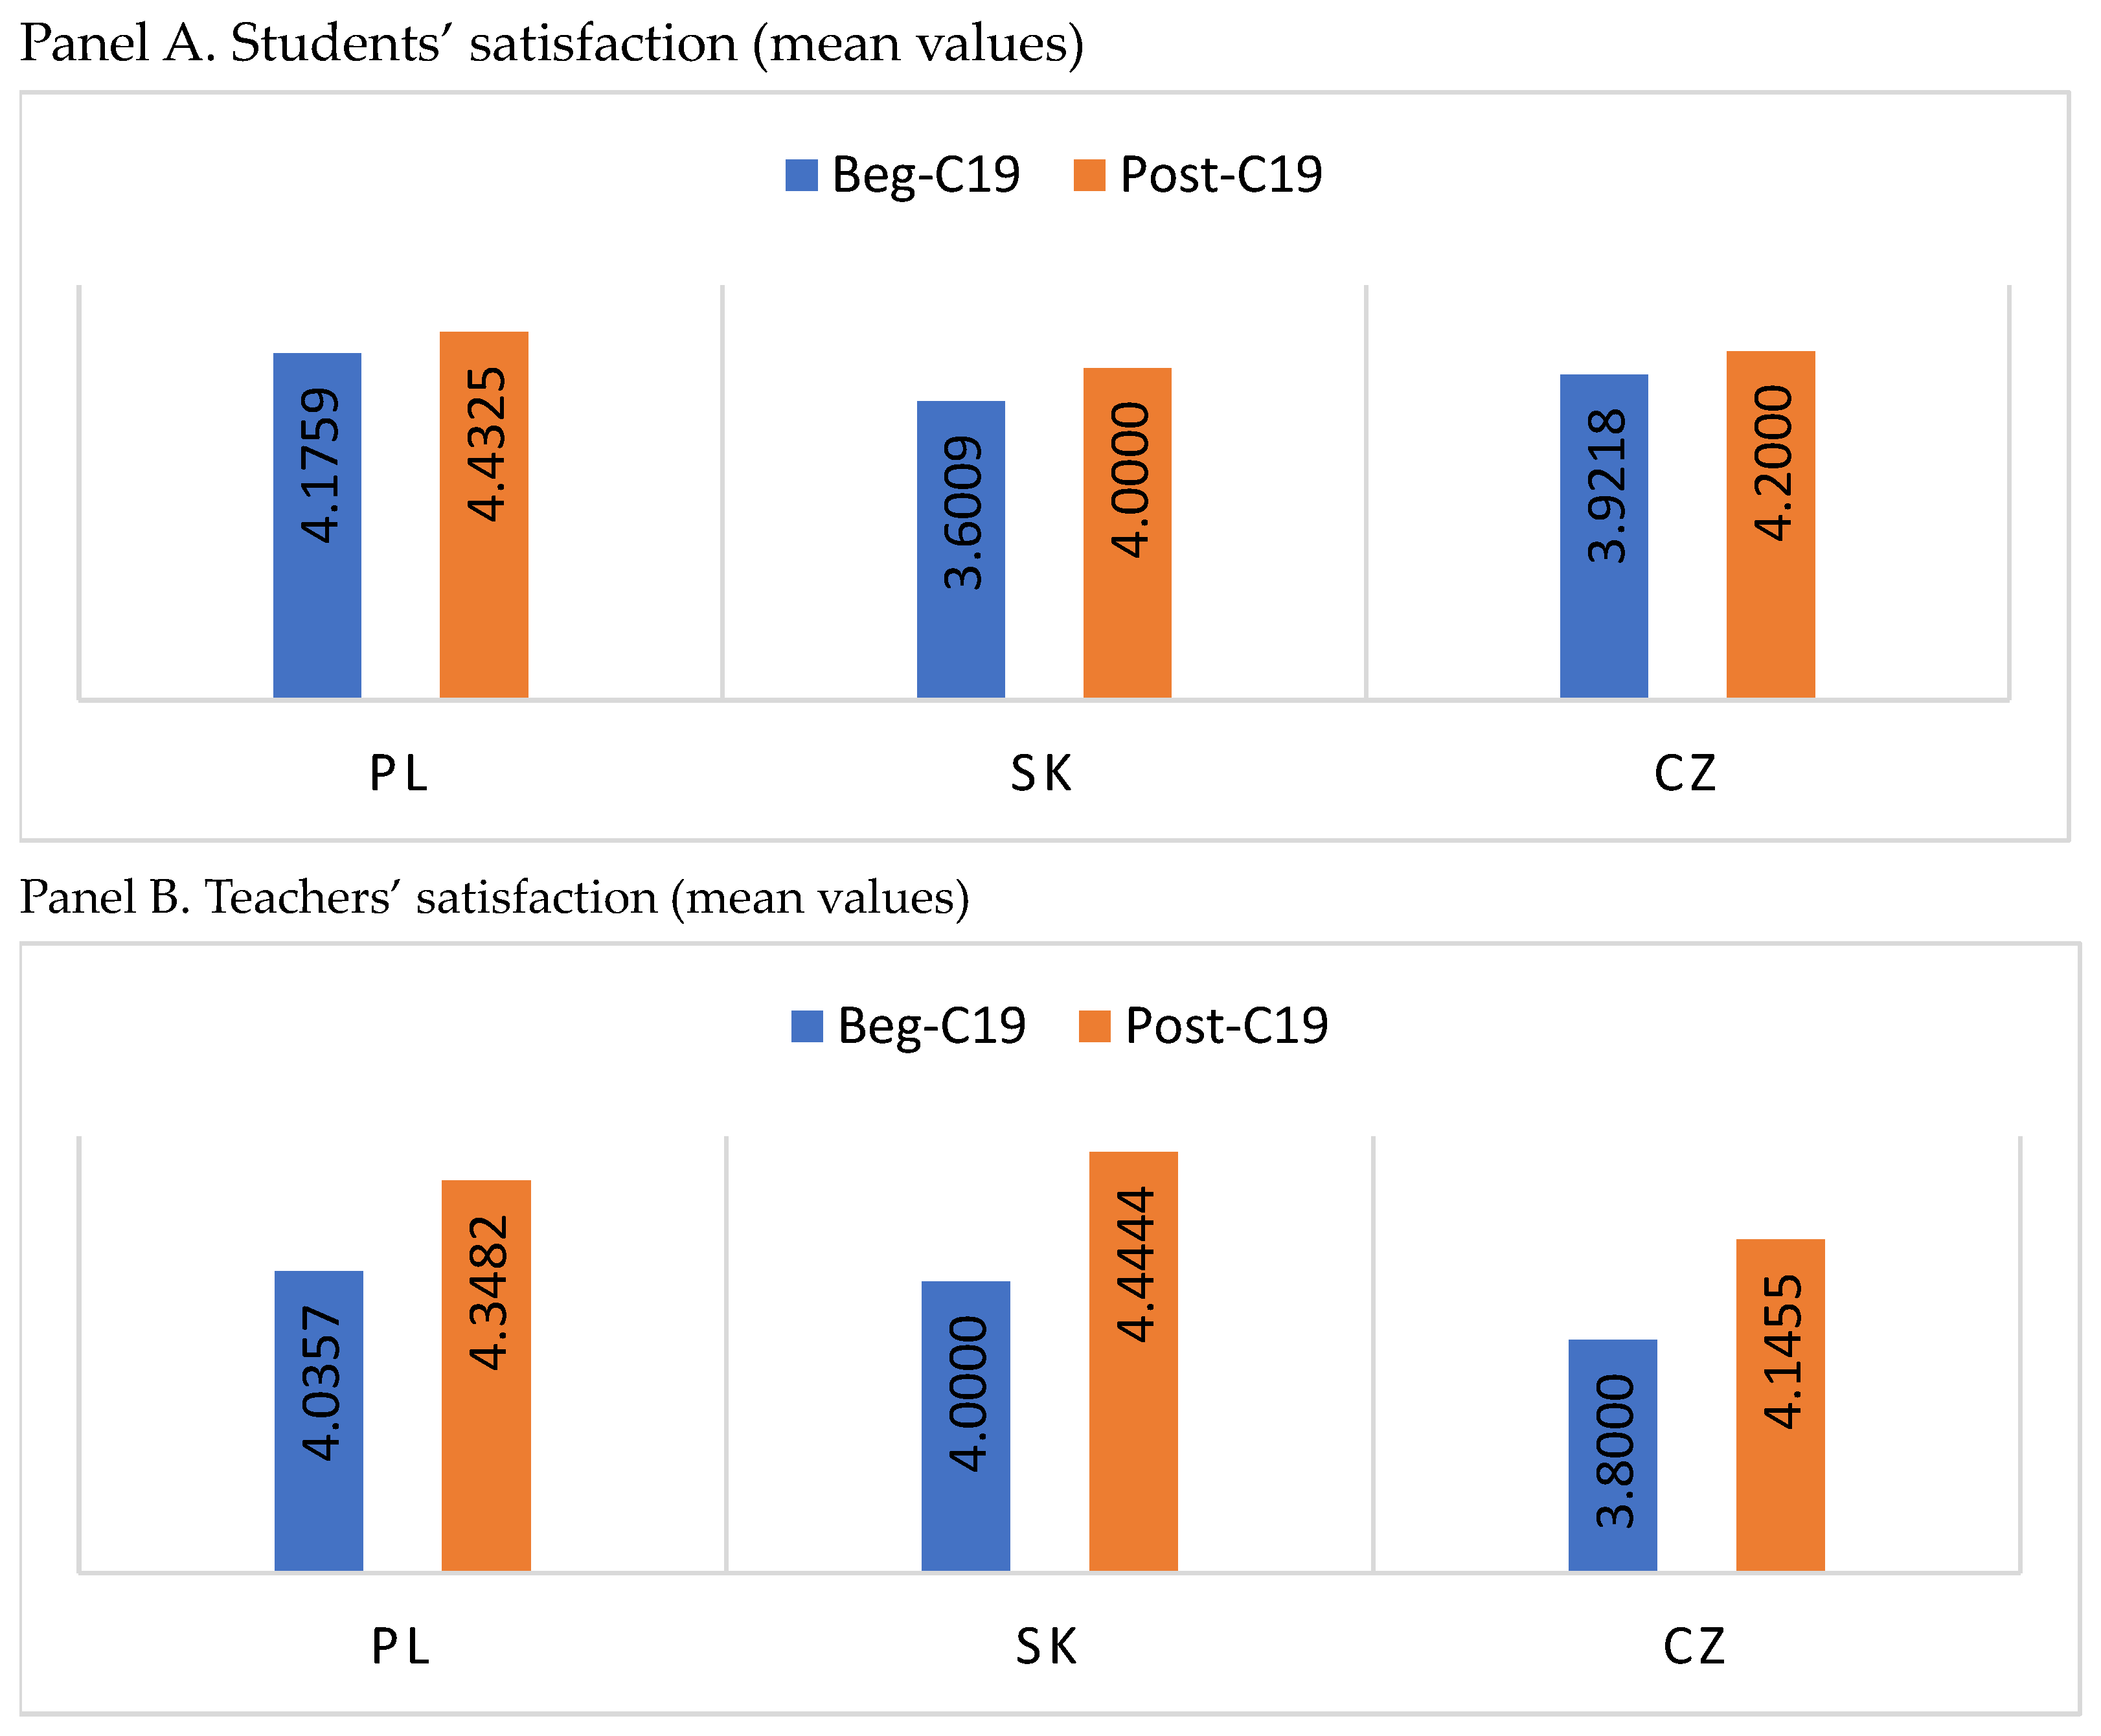
Our empirical investigations were designed to explore whether the pandemic improved digital communication skills in HEIs. For these purposes, we surveyed teachers’ and students’ satisfaction in different types of communication (direct, indirect), as well as their satisfaction with the platforms used. Our study focused on comparing satisfaction levels post-COVID-19 pandemic, relative to the pre-COVID-19 pandemic period.
Our study found that student satisfaction with digital communication skills of teachers increased but was not equal in all countries. For instance, in Poland, the improvement was more visible in comparison to Slovakia and Czechia. These results are interesting given that, according to Eurostat data [15], Poland was lagging behind in the evolution of digital education at scale (as far as the increase in the percentage of people who take online courses or use online learning materials is considered). Our findings also show that from the teachers’ perspective, the COVID-19 pandemic did not add to the quality of digital indirect communication skills of students. However, teachers’ satisfaction with indirect communication with students increased at the beginning of the COVID-19 pandemic, and then teachers found indirect communication with students more problematic than before the COVID-19 pandemic.
The results achieved in our investigations align with some other previous studies. The studies conducted by Azeiteiro et al. [38] in Portugal and Iglesias-Pradas et al. [39] in Madrid, Spain, show that digital education can provide an effective alternative to the traditional face-to-face form, which can be a source of satisfaction, motivation, and increase in student academic performance. As indicated in those studies and also by Hasan and Khan [40], the greatest advantage for students is flexibility and interactivity.
On the other hand, however, for some countries, the results were reversed. For example, findings for Finland [41] and Sweden [42] confirmed mostly negative experiences of students and teachers from online education in HEIs. The results of these studies show a decrease in motivation, general satisfaction with studying, and teacher–student and student–student interaction [43]. These works, however, do not straightforwardly address satisfaction with digital communication skills between senders and recipients of messages in the process of digital education. In this respect, our study provides some new insights.
If we consider the technological aspects of the process of communication, our study indicates increased student satisfaction with the platforms used to support digital education, if the pre- and post-COVID-19 pandemic periods are compared. These results are aligned with the majority of previous studies, even those where the general experience of digital education was negative (like, for example, Dalipi et al. [42] or Niemi and Kousa [41]). The increase in student and teacher satisfaction from the platforms used confirms that regular use of ICT tools leads to familiarity and routine, fewer problems, and thus a higher functionality rating. However, it also shows that the features, functionality, quality, and performance of available on-the-market ICT tools and platforms used for teaching and learning purposes were quite high and well prepared for this unexpected digital transition (Dalipi et al. [42]; Hasan and Khan [40]; Iglesias-Pradas et al. [39]).
Our study has several limitations. First, it covers only three universities from three countries. We paid attention to ensuring homogeneity regarding sociodemographic features of the respondents (countries/fields of study/prior experience in education). Still, however, the country orientation limits the generalizability of our findings, in particular if the voice of the academic teachers is considered. Despite these limitations, our study offers some insights into the research on digital communication in education from dynamically developing eastern European countries (Poland, Czechia, and Slovakia). In this regard, it supplements the existing theoretical output that mainly comes from western European countries, for example, the Netherlands [6], Sweden [42], Portugal [38], Finland [41], or Spain [39]. Another limitation of our study is that it is based on a comparison of the subjective assessments of the respondents. We tracked satisfaction with digital communication skills in education and the platforms used to support this process by tracking differences in declared satisfaction level of each respondent for the three periods of interest. This approach is helpful in monitoring overall trends, although is based on a subjective evaluation of the satisfaction of each respondent. Thus, conclusions at a generalized level must be drawn carefully. In particular, the satisfaction at country level might depend on some factors that are interlinked to cultural or social factors. We believe this aspect emerges as an interesting and relevant area for further investigation.
In a similar dimension, our study is limited by not covering other potential factors that could be influential on the efficiency of digital communication in education, such as technical/infrastructural and organizational factors, as well as individual propensity to or familiarity with the use of ITC tools or readiness for innovation in the education process. The level of access to the internet and some economic and infrastructural conditions for the investigated countries and other western European countries is regarded as similar. However, there are studies that provide evidence for countries such as Bangladesh [44], India [40], or the Philippines [45] reporting that the quality of digital education was highly influenced by poor infrastructure, internet accessibility, lack of devices, and affordability of technology. Among organizational factors, prior works have confirmed the relevance of the size of the class, course content design (relation between synchronous and asynchronous teaching), or the choice of digital tools and platform used in the education process [39,46,47]. Further inquiries shall be made to recognize how these factors influence participant (here: teachers and students) satisfaction with digital communication skills. Also, further studies shall inquire regarding teacher digital communication skills in the interlink between their experience, readiness to innovate with various ITC tools, or new digital teaching methods.
The results of our survey provide some relevant policy implications. In pursuance of sustainable development, digital education technologies will inevitably evolve and their use in HEI environment will be more common [48]. In fact, the three universities we surveyed have already decided to shift part of their educational programs to being delivered online only (in response to students’ expectations, but also due to cost reduction reasons). Thus, for the support of more efficient communication in the process of digital education, constant training is essential. This training shall cover both the use of new ITC tools, as well as the mastering of teachers’ digital communication skills. In particular, teachers need some support in developing their competences in enhancing students’ attention and motivation in the process of digital education. From a policy-oriented perspective, our study also highlights the need for modification of quality and assurance procedures at HEIs if digital or hybrid learning is in place. The digital environment requires a different approach from teachers (as the senders of the communicates), to ensure students’ motivation and participation in online education. Thus, recognition and inclusion of teachers’ digital communication skills in quality and assurance procedures is relevant.

Author Contributions

Conceptualization, A.U., A.L. (Anna Losa) and M.W.-K.; methodology, K.H. and A.L. (Aleš Lokaj); software, K.H.; validation, K.H. and M.W.-K.; formal analysis K.H., A.L. (Aleš Lokaj) and M.W.-K.; investigation, K.H., A.L. (Aleš Lokaj) and M.W.-K.; resources, A.U. and A.L. (Anna Losa); data curation, K.H.; writing—original draft preparation, A.U., A.L. (Anna Losa) and M.W.-K.; writing—review and editing, A.U., A.L. (Anna Losa), M.W.-K. and K.H.; visualization, A.U. and M.W.-K.; supervision, A.U.; project administration, K.H. and A.L. (Aleš Lokaj); funding acquisition, K.H. and A.L. (Aleš Lokaj). All authors have read and agreed to the published version of the manuscript.

Funding

This study is based on the results of a survey that was part of the project DANTE (Digital Area for Networking Teachers and Educators, Project No. 2020-1-CZ01-KA226-HE-094368) co-funded by the Erasmus + Programme of the European Union.

Informed Consent Statement

Informed consent was obtained from all subjects involved in this study.

Data Availability Statement

The data presented in this study are available upon request from the corresponding author. The data are not publicly available due to data repository policies adopted at university level. However, in Appendix B, aggregated survey responses at country level are presented for each period of interest.

Acknowledgments

The authors thank TUKE partners for their help in the survey distribution process. The authors gratefully acknowledge the insightful comments provided by the four anonymous reviewers of this paper.

Conflicts of Interest

The authors declare no conflict of interest.

Appendix A

Table A1. The results of Cronbach’s alpha.
TeachersStudents
PL0.8120.808
SK0.8030.848
CZ0.8680.823
Whole sample0.8030.826

Appendix B

Table A2. Are you satisfied with the quality of the quality of direct digital communication with educators?—Distribution of students’ responses by country.
Pre-C19Beg-C19Post-C19
Frequency%Frequency%Frequency%
PLDefinitely not144.2216.3113.3
No4012.0257.5144.2
Neutral8625.88726.16118.3
Yes9829.410030.012738.1
Definitely yes6318.98024.011033.0
No opinion329.6206.0103.0
In total,333100.0333100.0333100.0
SLODefinitely not52.3135.952.3
No156.82410.9135.9
Neutral7433.54419.93114.0
Yes8136.78538.510447.1
Definitely yes4620.85424.46730.3
No opinion02.010.510.5
In total221100.0221100.0221100.0
CZDefinitely not165.472.462.0
No4214.3217.151.7
Neutral11037.47625.95819.7
Yes7525.511137.812542.5
Definitely yes5017.07726.28829.9
No opinion1.320.7124.1
In total294100.0294100.0294100.0
Table A3. Are you satisfied with the quality of indirect digital communication with teachers?—Distribution of students’ responses by country.
Pre-C19Beg-C19Post-C19
Frequency%Frequency%Frequency%
PLDefinitely not144.2216.3113.3
No4012.0257.5144.2
Neutral8625.88726.16118.3
Yes9829.410030.012738.1
Definitely yes6318.98024.011033.0
No opinion329.6206.0103.0
In total333100.0333100.0333100.0
SLODefinitely not41.8167.283.6
No2812.72712.22410.9
Neutral4620.84922.24118.6
Yes8438.09543.09543.0
Definitely yes3114.03214.55022.6
No opinion2812.720.931.4
In total221100.0221100.0221100.0
CZDefinitely not72.482.751.7
No4013.64816.33311.2
Neutral9532.39131.09432.0
Yes9231.310736.411137.8
Definitely yes268.83010.23612.2
No opinion3411.6103.4155.1
In total294100.0294100.0294100.0
Table A4. Are you satisfied with the quality of direct digital communication with students?—Distribution of teachers’ responses by country.
Pre-C19Beg-C19Post-C19
Frequency%Frequency%Frequency%
PLDefinitely not43.61311.6108.9
No32.71412.598.0
Neutral5044.63228.62320.5
Yes1917.02925.92522.3
Definitely yes3632.12421.44540.2
No opinion00.000.000.0
In total112100.0112100.0112100.0
SKDefinitely not 311.113.7
No27.4518.5829.6
Neutral829.6933.3311.1
Yes1451.9414.8725.9
Definitely yes311.1622.2829.6
No opinion00.000.000.0
In total27100.027100.027100.0
CZDefinitely not23.6610.911.8
No47.3610.9712.7
Neutral1934.51425.51425.5
Yes2138.22240.02240.0
Definitely yes916.4712.71120.0
No opinion00.000.000.0
In total55100.055100.055100.0
Table A5. Are you satisfied with the quality of indirect digital communication with students?—Distribution of teachers responses by country.
Pre-C19Beg-C19Post-C19
Frequency%Frequency%Frequency%
PLDefinitely not7 6.3 14 12.5 11 9.8
No7 6.3 17 15.2 10 8.9
Neutral55 49.1 37 33.0 34 30.4
Yes24 21.4 26 23.2 29 25.9
Definitely yes19 17.0 18 16.1 28 25.0
No opinion00.000.000.0
In total112100.0112100.0112100.0
SKDefinitely not1 3.7 1 3.7 1 3.7
No2 7.4 3 11.1 1 3.7
Neutral11 40.7 8 29.6 6 22.2
Yes9 33.3 11 40.7 12 44.4
Definitely yes4 14.8 4 14.8 7 25.9
No opinion00.000.000.0
In total27100.027100.027100.0
CZDefinitely not1 1.8 4 7.3 2 3.6
No5 9.1 7 12.7 3 5.5
Neutral20 36.4 20 36.4 23 41.8
Yes19 34.5 16 29.1 20 36.4
Definitely yes10 18.2 8 14.5 7 12.7
No opinion00.000.000.0
In total55100.055100.055100.0
Table A6. How satisfied are you with the software platforms used for on-line lectures?—Distribution of students’ responses by country.
Beg-C19Post-C19
Frequency%Frequency%
PLDefinitely not15 4.5 4 1.2
No13 3.9 6 1.8
Neutral32 9.6 30 9.0
Yes90 27.0 91 27.3
Definitely yes157 47.1 195 58.6
No opinion26 7.8 7 2.1
In total333 100.0 333 100.0
SKDefinitely not14 6.3 3 1.4
No24 10.9 7 3.2
Neutral38 17.2 30 13.6
Yes101 45.7 127 57.5
Definitely yes41 18.6 53 24.0
No opinion3 1.4 1 0.5
In total,221 100.0 221 100.0
CZDefinitely not10 3.4 5 1.7
No15 5.1 4 1.4
Neutral52 17.7 34 11.6
Yes128 43.5 132 44.9
Definitely yes89 30.3 115 39.1
No opinion00.04 1.4
In total294 100.0 294 100.0
Table A7. How satisfied are you with the software platforms used for online lectures?—Distribution of teachers’ responses by country.
Beg-C19Post-C19
Frequency%Frequency%
PLDefinitely not4 3.6 3 2.7
No5 4.5 4 3.6
Neutral21 18.8 7 6.3
Yes35 31.3 35 31.3
Definitely yes47 42.0 63 56.3
No opinion00.000.0
In total,112 100.0 112 100.0
SKDefinitely not00.000.0
No2 7.4 00.0
Neutral5 18.5 1 3.7
Yes11 40.7 13 48.1
Definitely yes9 33.3 13 48.1
No opinion00.000.0
In total,27 100.0 27 100.0
CZDefinitely not2 3.6 55 100.0
No4 7.3 1 1.8
Neutral12 21.8 6 10.9
Yes22 40.0 32 58.2
Definitely yes15 27.3 16 29.1
No opinion00.055 100.0
In total55 100.0 55 100.0

References

  1. OECD. OECD Policy Responses to Coronavirus (COVID-19), Education Responses to COVID-19: Embracing Digital Learning and Online Collaboration. 2020. Available online: https://www.oecd.org/coronavirus/policy-responses/education-responses-to-covid-19-embracing-digital-learning-and-online-collaboration-d75eb0e8/ (accessed on 8 May 2023).
  2. Zancajo, A.; Verger, A.; Bolea, P. Digitalization and beyond: The effects of COVID-19 on post-pandemic educational policy and delivery in Europe. Policy Soc. 2022, 41, 111–128. [Google Scholar] [CrossRef]
  3. Mondejar, M.E.; Avtar, R.; Diaz, H.L.B.; Dubey, R.K.; Esteban, J.; Gómez-Morales, A.; Hallam, B.; Mbungu, N.T.; Okolo, C.C.; Prasad, K.A.; et al. Digitalization to achieve sustainable development goals: Steps towards a Smart Green Planet. Sci. Total Environ. 2021, 794, 148539. [Google Scholar] [CrossRef]
  4. Balogun, A.L.; Marks, D.; Sharma, R.; Shekhar, H.; Balmes, C.; Maheng, D.; Arshad, A.; Salehi, P. Assessing the potentials of digitalization as a tool for climate change adaptation and sustainable development in urban centres. Sustain. Cities Soc. 2020, 53, 101888. [Google Scholar] [CrossRef]
  5. UN 2023. Available online: https://sdgs.un.org/goals (accessed on 1 May 2023).
  6. Versteijlen, M.; Perez Salgado, F.; Janssen Groesbeek, M.; Counotte, A. Pros and cons of online education as a measure to reduce carbon emissions in higher education in the Netherlands. Curr. Opin. Environ. Sustain. 2017, 28, 80–89. [Google Scholar] [CrossRef]
  7. Gössling, S. Urban transport justice. J. Transp. Geogr. 2016, 54, 1–9. [Google Scholar] [CrossRef]
  8. Welser, H.T.; Khan, M.L.; Dickard, M. Digital remediation: Social support and online learning communities can help offset rural digital inequality. Inf. Commun. Soc. 2019, 22, 717–723. [Google Scholar] [CrossRef]
  9. Kennedy, A.I.; Mejía-Rodríguez, A.M.; Strello, A. Inequality in remote learning quality during COVID-19: Student perspectives and mitigating factors. Large-Scale Assess. Educ. 2022, 10, 29. [Google Scholar] [CrossRef]
  10. Hervás-Gómez, C.; Díaz-Noguera, M.D.; De la Calle-Cabrera, A.M.; Guijarro-Cordobés, O. Perceptions of University Students towards Digital Transformation during the Pandemic. Educ. Sci. 2021, 11, 738. [Google Scholar] [CrossRef]
  11. Bond, M.; Marín, V.I.; Dolch, C.; Bedenlier, S.; Zawacki-Richter, O. Digital Transformation in German Higher Education: Student and Teacher Perceptions and Usage of Digital Media. Int. J. Educ. Technol. High. Educ. 2018, 15, 48. [Google Scholar] [CrossRef]
  12. Bond, M.; Bedenlier, S.; Marín, V.I.; Händel, M. Emergency Remote Teaching in Higher Education: Mapping the First Global Online Semester. Int. J. Educ. Technol. High. Educ. 2021, 18, 50. [Google Scholar] [CrossRef]
  13. Wyplosz, C. Ten Years of Transformation: Macroeconomic Lessons; Policy Research Working Paper; The World Bank: Washington, DC, USA, 2000; No. 2288; Available online: http://documents.worldbank.org/curated/en/2000/02/438332/ten-years-transformation-macroeconomic-lessons (accessed on 15 April 2023).
  14. European Commission. The Bologna Process and the European Higher Education Area. 2023. Available online: https://education.ec.europa.eu/education-levels/higher-education/inclusive-and-connected-higher-education/bologna-process (accessed on 24 July 2023).
  15. Eurostat Database. Available online: https://ec.europa.eu/eurostat (accessed on 1 May 2023).
  16. Waits, T.; Lewis, L. Distance Education at Degree-Granting Postsecondary Institutions: 2006–2007; U.S. Department of Education, National Center for Education Statistics: Washington, DC, USA, 2008; pp. 1–3.
  17. Seaman, J.E.; Allen, I.E.; Seaman, J. Grade Increase: Tracking Distance Education in the United States. Research Report; Babson Survey Research Group: Babson Park, MA, USA, 2018; pp. 3–34. [Google Scholar]
  18. Darby, F.; Lang, J.M. Small Teaching Online: Applying Learning Science in Online Classes; Jossey-Bass: San Francisco, CA, USA, 2019; p. XV. [Google Scholar]
  19. Lasswell, H.D. The structure and function of communication in society. In The Communication of Ideas: A Series of Addresses; Bryson, L., Ed.; Institute for Religious and Social Studies: New York, NY, USA, 1948; pp. 37–51. [Google Scholar]
  20. Dobek-Ostrowska, B. Political and Public Communication [Komunikowanie Polityczne i Publiczne]; PWN: Warsaw, Poland, 2020; pp. 32–33. [Google Scholar]
  21. Sapienza, Z.A.; Narayanan, I.; Veenstra, A.S. Reading Lasswell’s Model of Communication Backward: Three Scholarly Misconceptions. Mass Commun. Soc. 2015, 18, 599–622. [Google Scholar] [CrossRef]
  22. Morreale, P.; Spitzberg, B.H.; Barge, J.K. Human Communication: Motivation, Knowledge, and Skills; Wadsworth Pub Co.: Belmont, CA, USA, 2006; p. 32. [Google Scholar]
  23. Steward, J. Bridges Not Walls: A Book about Interpersonal Communication; McGraw-Hill Education: London, UK, 2011; p. 174. [Google Scholar]
  24. Wenxiu, P. Analysis of New Media Communication Based on Lasswell’s “5W” Model. J. Educ. Soc. Res. 2015, 5, 245–249. Available online: https://www.mcser.org/journal/index.php/jesr/article/view/7723 (accessed on 24 July 2023). [CrossRef]
  25. Pavin Ivanec, T. The Lack of Academic Social Interactions and Students’ Learning Difficulties during COVID-19 Faculty Lockdowns in Croatia: The Mediating Role of the Perceived Sense of Life Disruption Caused by the Pandemic and the Adjustment to Online Studying. Soc. Sci. 2022, 11, 42. [Google Scholar] [CrossRef]
  26. Al-Kumaim, N.H.; Alhazmi, A.K.; Mohammed, F.; Gazem, N.A.; Shabbir, M.S.; Fazea, Y. Exploring the Impact of the COVID-18 Pandemic on University Student’s Learning Life: An Integrated Conceptual Motivational Model for Sustainable and Healthy Online Learning. Sustainability 2021, 13, 2546. [Google Scholar] [CrossRef]
  27. Angelino, L.M.; Williams, F.K.; Natwig, D. Strategies for Engaging Online Students and Reduce Attrition Race. J. Educ. Online 2007, 4, 1–14. [Google Scholar] [CrossRef]
  28. Hara, N.; Kling, R. Student distress in web-based distance education. Educ. Q. 2001, 3, 68–69. [Google Scholar] [CrossRef]
  29. Moody, J. Distance education: Why are the attrition rates so high? Q. Rev. Distance Educ. 2004, 5, 205–210. [Google Scholar]
  30. Subandi, S.; Choirudin, C.; Mahmudi, M.; Nizaruddin, N.; Hermanita, H. Building Interactive Communication with Google Classroom. Int. J. Eng. Technol. 2018, 7, 460–463. [Google Scholar] [CrossRef]
  31. Selvaraj, A.; Vishnu, R.; Ka, N.; Benson, N.; Mathew, A.J. Effect of pandemic based online education on teaching and learning system. Int. J. Educ. Dev. 2021, 85, 102–144. [Google Scholar] [CrossRef]
  32. Khan, B.H. Flexible Learning in an Information Society; Information Society Publishing: Hershey, PA, USA, 2007; pp. 1–17. [Google Scholar] [CrossRef] [Green Version]
  33. Mayadas, F. Asynchronous Learning Networks: A Sloan Foundation Perspective. J. Asynchronous Learn. Netw. 1997, 1, 1–16. [Google Scholar] [CrossRef]
  34. Grzenia, J. Komunikacja Językowa W Internecie; PWN: Warszawa, Poland, 2006; pp. 24–63. [Google Scholar]
  35. Wierzbicka, A. Dydaktyczne i Komunikacyjne Aspekty e-Edukacji Akademickiej; Wyd. Uniwersytetu Łódzkiego: Łódź, Poland, 2019; pp. 109–137. [Google Scholar]
  36. Watts, L. Synchronous and asynchronous communication in distance learning: A review of the literature. Q. Rev. Distance Educ. 2016, 17, 23–32. [Google Scholar]
  37. Rosner, B.; Glynn, R.J.; Lee, M.L. The Wilcoxon signed rank test for paired comparisons of clustered data. Biometrics 2006, 62, 185–192. [Google Scholar] [CrossRef] [PubMed]
  38. Azeiteiro, U.M.; Bacelar-Nicolau, P.; Caetano, F.J.P.; Caeiro, S. Education for sustainable development through e-learning in higher education: Experiences from Portugal. J. Clean. Prod. 2015, 106, 308–319. [Google Scholar] [CrossRef]
  39. Iglesias-Pradas, S.; Hernández-García, A.; Chaparro-Peláez, J.; Prieto, J.L. Emergency remote teaching and students’ academic performance in higher education during the COVID-19 pandemic: A case study. Comput. Hum. Behav. 2021, 119, 106713. [Google Scholar] [CrossRef]
  40. Hasan, N.; Khan, N.H. Online teaching-learning during COVID-19 pandemic: Students’ perspective. Online J. Distance Educ. E-Learn. 2020, 8, 202–213. Available online: https://tojdel.net/journals/tojdel/articles/v08i04/v08i04-03.pdf (accessed on 3 May 2023).
  41. Niemi, H.M.; Kousa, P. A case study of students’ and teachers’ perceptions in a finnish high school during the COVID pandemic. Int. J. Technol. Educ. Sci. 2020, 4, 352–369. [Google Scholar] [CrossRef]
  42. Dalipi, F.; Jokela, P.; Kastrati, Z.; Kurti, A.; Elm, P. Going digital as a result of COVID-19: Insights from students’ and teachers’ impressions in a Swedish university. Int. J. Educ. Res. Open 2022, 3, 100136. [Google Scholar] [CrossRef]
  43. Jacques, S.; Ouahabi, A.; Lequeu, T. Synchronous e-learning in higher education during the COVID-19 pandemic. In Proceedings of the 2021 IEEE Global Engineering Education Conference (EDUCON), Vienna, Austria, 21–23 April 2021; pp. 1102–1109. [Google Scholar] [CrossRef]
  44. Onyema, E.M.; Eucheria, N.C.; Obafemi, F.A.; Sen, S.; Atonye, F.G.; Sharma, A.; Alsayed, A.O. Impact of coronavirus pandemic on education. J. Educ. Pract. 2020, 11, 108–121. [Google Scholar]
  45. Alvarez, A.V., Jr. The phenomenon of learning at distance through remote emergency teaching in the midst of a pandemic crisis. Asian J. Distance Educ. 2020, 15, 144–153. [Google Scholar]
  46. Hodges, C.; Moore, S.; Lockee, B.; Trust, T.; Bond, A. The Difference between Emergency Remote Teaching and Online Learning. 2020. Available online: https://er.educause.edu/articles/2020/3/the-difference-between-emergency-remote-teaching-and-online-learning (accessed on 3 May 2023).
  47. van der Spoel, I.; Noroozi, O.; Schuurink, E.; van Ginkel, S. Teachers’ online teaching expectations and experiences during the COVID19-pandemic in the nether- lands. Eur. J. Teach. Educ. 2020, 43, 623–638. [Google Scholar] [CrossRef]
  48. Zawacki-Richter, O. The current state and impact of COVID-19 on digital higher education in Germany. Hum. Behav. Emerg. Technol. 2021, 3, 218–226. [Google Scholar] [CrossRef] [PubMed]
Figure 1. H.D. Lasswell’s “5W” model of the communication process. Source: own study.
Sustainability 15 11878 g001
Figure 2. Types of communication in digital education. Source: own study.
Sustainability 15 11878 g002
Figure 3. Sample distribution by country. Source: own study.
Sustainability 15 11878 g003
Figure 4. Are you satisfied with the quality of direct digital communication with teachers?—Mean values of the assigned satisfaction ranks. Source: own study.
Sustainability 15 11878 g004
Figure 5. Are you satisfied with the quality of indirect digital communication with teachers?—Mean values of the assigned satisfaction ranks. Source: own study.
Sustainability 15 11878 g005
Figure 6. Are you satisfied with the quality of direct digital communication with students?—Mean values of the assigned satisfaction ranks. Source: own study.
Sustainability 15 11878 g006
Figure 7. Are you satisfied with the quality of indirect digital communication with students?—Mean values of the assigned satisfaction ranks. Source: own study.
Sustainability 15 11878 g007
Figure 8. How satisfied are you with the software platforms used for online lectures?—Mean values of assigned ranks. Source: own study.
Sustainability 15 11878 g008
Table 1. The constructs of the exploratory survey.
ConstructsParticipants in the Digital Communication Process
Types of digital communicationDirect
(synchronous)
RQ1: StudentsRQ2: Teachers
Satisfaction with the quality of direct digital communication with teachers Satisfaction with the quality of direct digital communication with students
Indirect
(asynchronous)
Satisfaction with the quality of indirect digital communication with teachersSatisfaction with the quality of indirect digital communication with students
Communication channelsRQ3: Satisfaction of the software platforms used for online lectures
Source: own study.
Table 2. Individuals taking online courses (of any subject) or using online learning materials (percentage of individuals).
Time/2019
(%)
2020
(%)
2021
(%)
2022
(%)
Change
Country/Group2022/2019
(p.p.)
EU2718.3523.3427.5225.577.22
Czechia13.2915.8221.9722.369.07
Poland11.6215.1519.1714.953.33
Slovakia13.3318.9629.927.2713.94
Source: Eurostat database (2023).
Table 3. Are you satisfied with the quality of direct digital communication with teachers?—Significance of the differences in means by country.
MeansDifferenced in MeansMediansWilcoxon Signed Rank Test (Z-Statistic)
Pre-C19Beg-C19Post-C19Post-C19 vs. Pre-C19Post-C19 vs. Beg-C19Pre-C19Beg-C19Post-C19Post-C19 vs. Pre-C19Post-C19 vs. Beg-C19
PL3.50753.80524.30090.79340.4957444−9.114 ***−7.884 ***
SK3.66973.65003.97730.30760.3273444−3.720 ***−5.016 ***
CZ3.34473.78774.00710.66240.2194344−8.765 ***−3.875 ***
Notes: Statistically significant at *** α = 0.001. Source: own study.
Table 4. Are you satisfied with the quality of direct digital communication with teachers?—Comparison between the countries.
Pre-C19Beg-C19Post-C19
Kruskal–Wallis statistics0.004 **0.062 ^0.000 ***
Post-hoc tests:
  CZ–PL0.061 *0.033 *0.000 ***
  CZ–SK0.000 ***0.6400.875
  PL–SK0.3780.071 ^0.000 ***
Notes: Statistically significant at *** α = 0.001; ** α = 0.01; * α = 0.05; ^ α = 0.1. Source: own study.
Table 5. Are you satisfied with the quality of indirect digital communication with teachers?—Significance of the differences in means by country.
MeansDifferenced in MeansMediansWilcoxon Signed Rank Test (Z-Statistic)
Pre-C19Beg-C19Post-C19Post-C19 vs. Pre-C19Post-C19 vs. Beg-C19Pre-C19Beg-C19Post-C19Post-C19 vs. Pre-C19Post-C19 vs. Beg-C19
PL3.51833.61663.96280.44460.3462444−5.570 ***−5.679 ***
SK3.56993.45663.71100.14110.2544444−1.897 ^−4.524 ***
CZ3.34623.36273.50180.15560.1391334−2.344 *−2.906 **
Notes: Statistically significant at *** α = 0.001; ** α = 0.01; * α = 0.05; ^ α = 0.1. Source: own study.
Table 6. Are you satisfied with the quality of indirect digital communication with teachers?—Comparison between the countries.
Pre-C19Beg-C19Post-C19
Kruskal–Wallis statistics0.002 **0.000 ***0.000 ***
Post-hoc tests:
  CZ–PL0.056 ^0.000 ***0.000 ***
  CZ–SK0.054 ^0.1710.003 **
  PL–SK0.1790.002 **0.005 **
Notes: Statistically significant at *** α = 0.001; ** α = 0.01; ^ α = 0.1. Source: own study.
Table 7. Are you satisfied with the quality of direct digital communication with students?—Significance of the differences in means by country.
MeansDifferenced in MeansMediansWilcoxon Signed Rank Test (Z-Statistic)
Pre-C19Beg-C19Post-C19Post-C19 vs. Pre-C19Post-C19 vs. Beg-C19Pre-C19Beg-C19Post-C19Post-C19 vs. Pre-C19Post-C19 vs. Beg-C19
PL3.71433.33043.76790.05360.4375334−0.529−2.816 **
SK3.66673.18523.4815−0.18520.2963434−0.847−1.838 ^
CZ3.56363.32733.63640.07270.3091444−0.419−1.361
Notes: Statistically significant at; ** α = 0.01; ^ α = 0.1. Source: own study.
Table 8. Are you satisfied with the quality of direct digital communication with students?—Comparison between countries.
Pre-C19Beg-C19Post-C19
Kruskal–Wallis statistics0.018 *0.4090.031 *
Post-hoc tests:
  CZ–PL0.031 * 0.009 **
  CZ–SK0.527 0.331
  PL–SK0.029 * 0.311
Notes: Statistically significant at ** α = 0.01; * α = 0.05. Source: own study.
Table 9. Are you satisfied with the quality of indirect digital communication with students?—Significance of the differences in means by country.
MeansDifferenced in MeansMediansWilcoxon Signed Rank Test (Z-Statistic)
Pre-C19Beg-C19Post-C19Post-C19 vs. Pre-C19Post-C19 vs. Beg-C19Pre-C19Beg-C19Post-C19Post-C19 vs. Pre-C19Post-C19 vs. Beg-C19
PL3.36613.15183.47320.10710.3214334−0.974−4.071 ***
SK3.48153.51853.85190.37040.3333344−2.233 *−2.460 *
CZ3.58183.30913.4909−0.09090.1818433−0.398−2.332 *
Notes: Statistically significant at *** α = 0.001; * α = 0.05. Source: own study.
Table 10. Are you satisfied with the quality of indirect digital communication with students?—Comparison between countries.
Pre-C19Beg-C19Post-C19
Kruskal–Wallis statistics0.1900.3050.164
Source: own study.
Table 11. How satisfied are you with the software platforms used for online lectures?—Significance of differences in means by country.
MeansDifferenced in MeansMediansWilcoxon Signed Rank Test (Z-Statistic)
Beg-C19Post-C19Post-C19
vs. Beg-C19
Beg-C19Post-C19Post-C19
vs. Beg-C19
Students’
satisfaction
PL4.17594.43250.256645−5.679 ***
SK3.60094.00000.399144−6.144 ***
CZ3.92184.20000.278244−6.096 ***
Teachers’
satisfaction
PL4.03574.34820.312545−3.977 ***
SK4.00004.44440.444444−2.807 **
CZ3.80004.14550.345544−2.863 **
Notes: Statistically significant at *** α = 0.001; ** α = 0.01. Source: own study.
Table 12. How satisfied are you with the software platforms used for online lectures?—Student comparison between countries.
Students’ SatisfactionTeachers’ Satisfaction
Beg-C19Post-C19Beg-C19Post-C19
Kruskal–Wallis statistics0.000 ***0.000 ***0.1670.004 **
Post-hoc tests:
CZ–PL0.000 ***0.000 *** 0.003 **
CZ–SK0.003 **0.001 ** 0.003 **
PL–SK0.000 ***0.000 *** 0.270
Notes: Statistically significant at *** α = 0.001; ** α = 0.01. Source: own study.
Disclaimer/Publisher’s Note: The statements, opinions and data contained in all publications are solely those of the individual author(s) and contributor(s) and not of MDPI and/or the editor(s). MDPI and/or the editor(s) disclaim responsibility for any injury to people or property resulting from any ideas, methods, instructions or products referred to in the content.

