Article

Identification and Prediction Network Analysis Based on Multivariate Data of Urban Form: A Case Study of Shenzhen, China

1
School of Civil Engineering and Architecture, Wuhan University of Technology, Wuhan 430070, China
2
School of Architecture and Urban Planning, Huazhong University of Science and Technology, Wuhan 430074, China
*
Author to whom correspondence should be addressed.
Sustainability 2023, 15(15), 11857; https://doi.org/10.3390/su151511857
Submission received: 26 May 2023 / Revised: 19 July 2023 / Accepted: 26 July 2023 / Published: 1 August 2023

Abstract

:
The rapid growth of urban populations has resulted in a scarcity of land, thus making sustainable urban development an urgent matter. Although Shenzhen has implemented land policies and optimized its functional layouts, these measures have inadvertently contributed to a shortage of available land for development. The city’s exponential population growth and expansive urban expansion have outpaced the supply of land. This study endeavors to identify urban commercial patterns by employing multiple data sources and applying machine learning and network analysis to predict future commercial areas. The results demonstrated that the identification of commercial points of interest and analysis of land surface temperature distributions made Futian district the primary area for ongoing commercial development, while also revealing a positive correlation between these two datasets. By leveraging network analysis to thoroughly examine this data, Bao’an district was highlighted as the future focal point for Shenzhen’s commercial sector, with 22 core nodes identified in total. Finally, by assessing the network centrality within the spatial networks, and utilizing clustering algorithms to categorize nodes into groups, the economic clustering pattern was determined as the predominant model for Shenzhen’s commercial growth. This research represents a significant contribution to the realm of sustainable urban development and presents a valuable framework for other cities to adopt.

1. Introduction

With population growth and technological development, cities have become increasingly complex, resulting in unmanageable social risks becoming a thorny issue for countries worldwide [1,2,3]. In particular, China’s urban industrialization has accelerated in recent years, posing a difficulty in urban public security management and risk control with the rapid development of new technology [4]. Shenzhen, as a Special Economic Zone, is a bridgehead for foreign trade. The Chinese government has provided significant policy support and funding, which enabled it to undergo rapid development and expansion in the 1990s. After 2000, it has developed into an international metropolis similar to Hong Kong [5,6]. However, the rapid growth of various districts in Shenzhen has resulted in the inability of land use to keep pace with the city’s developmental needs. High population density areas often face a scarcity of land allocated for public services [7]. They also frequently experience significant hardening of green spaces, which leads to the urban heat island effect [8], leading to a decrease in its economic vitality [9]. Shenzhen has undertaken extensive land reclamation to increase the available land area; research on urban vitality and land use through the application of big data has been conducted [10], yet it is still challenging to satisfy the demands of urban growth and population migration. Therefore, optimizing the connection and development of urban areas’ management more effectively has become an important issue for urban development (Table 1). With the advancement of information technology, new methods for urban research have provided increasingly convenient means of collecting urban information. Urban research methods based on land surface temperature and city points of interest have become the preferred choice and an essential indicator of regional economic vitality in cities. At the same time, network analysis can effectively predict the relationship between urban areas and is an important tool for urban structure optimization.
The central research question addressed in this paper is how land surface temperature and point-of-interest data can be used to predict the interrelationships and interdependencies between urban areas, ultimately optimizing the structural layout and functional organization of cities. In particular, we explore how analyzing the interrelationships and interdependencies between different urban areas based on land surface temperature and POI data can provide insights for improving urban planning and development. Land surface temperature, mapped by remote sensing imagery, serves as an indicator of the thermal environment and reveals the urban heat island effect. Points of interest data contain information on the distribution and density of different urban functional zones, for example, the distribution and scale of commercial districts, the density of residential areas, and the locations of public service facilities. These data can be used to analyze the spatial structure and functional zoning of a city. Therefore, using points of interest data to comprehensively understand a city’s spatial structure and functional distribution is of great significance for scientific urban planning and construction. By constructing networks connecting areas with similar thermal environments and point-of-interest distributions, we can study the correlations and interactions between different parts of a city. Furthermore, network optimization algorithms can be applied to restructure the networks, which represent potential ways to improve the layout of the urban fabric. This data-driven network approach allows us to model urban areas as interconnected systems and simulate rearrangements that improve flows and interactions. The expected outcome is an optimal configuration of the city that balances functionality and connectivity between areas. Consequently, this article reviews and evaluates literature in three intersecting areas of urban studies: urban points of interest, land surface temperature, and network analysis. The purpose is to understand the current development trends and hot issues in urban research.

2. Review of Related Research

2.1. Land Surface Temperature

As the level of urbanization continues to increase and population agglomeration and land use intensify, the urban heat island effect is increasingly apparent, affecting the living and working environment of urban residents [11]. The spatial distribution characteristics of urban heat island effect can be obtained by acquiring and analyzing the land surface temperature data of different regions in the city [12]. Significant differences exist in the surface temperature of different urban functional areas (such as residential areas, commercial areas, and industrial areas). The surface temperature data can be correlated with urban form characteristics such as building density and green coverage rate to analyze the mechanism of urban form’s influence on temperature distribution. Generally, the higher the surface temperature in an urban area, the higher the degree of land hard surface and the lower the green coverage rate in the area [13]. This shows that the economic vitality of the region is relatively higher than the population density. Analysis of urban area surface temperature data can reflect the economic and social characteristics of the area to a certain extent. Consequently, the land surface temperature (LST) has become an important tool for identifying urban development based on data inversion. Solar radiation on the urban surface, as measured by satellites [14], is used to identify the LST. They are essential for assessing and analyzing the economic development and urban heat island effect of a city [15]. The LST of a city is determined by the properties of the ground surface, with different types of land surfaces giving off different amounts of radiation [16]. It is derived through the use of satellite remote sensing techniques for inversion, which is a quick and easy method that can achieve a high degree of precision and generate outstanding outcomes for characterizing urban areas on a wide scale [17]. To study the spatiotemporal evolution of land, the split-window algorithm of moderate-resolution imaging spectroradiometer (MODIS) sensor data carried by the TERRA satellite [18,19] is mainly used for inverse applications. The important feature of MODIS is its daily data collection, which provides the possibility to simulate the spatiotemporal evolution of the city. In addition, the LST is not only affected by the surface of the city, but also by various other influences, such as the weather. This means that it can provide uncertain city data, which require stable data for supplementation as an important factor [20].

2.2. City Points of Interest

City points of interest (POI) are used to characterize urban forms and are now a visualization tool for a specific analysis of big city data. It reflects areas of the city with intense human and socioeconomic activity [21], typically for urban business forms [22], function identification, and population distribution [23]. POI collects urban information through the Internet, mobile devices, and data sensors. It abstracts urban entity elements as point elements containing information about the entities themselves [24], and uses APIs to query and download data [25,26]. Kernel density estimation [27,28] is often used to identify urban centers and to visually represent spatial patterns of cities, such as the functional pattern of cities [29] and urban center areas [15,30]. Due to its spatial distribution, POI shows a noticeable spatial autocorrelation, which is consistent with the typical clustering pattern [31]. It also has a certain stability and is not prone to change. Therefore, the POI captures the characterization of urban economic vitality using factors, such as population mobility, productivity, and economic growth.

2.3. Network Analysis

Network science, which includes the LST and POI, has become increasingly popular due to its wide application in information technology [32,33,34]. It can effectively reflect the development of the urban economy [35,36] and it combines the characteristics of systems science, cybernetics, information technology, economics, and operations research. It employs data-driven network modeling and network analysis to explore urban commercial forms, identify spatial distributions, and predict future development areas [37,38]. Urban forms are modeled as networks to reflect the spatial relationships of the city and to identify the relationships between its key elements. However, there has been a lack of corresponding research on using network science to analyze urban forms and predict morphological regions in recent years [39,40]. This paper attempts to analyze the distribution of commercial forms in Shenzhen within the framework of network science theory and data mining, and further measures the network characteristics between the commercial distribution of Shenzhen urban districts. To facilitate the analysis of complex factors and values in networks based on topological properties, the following metrics are usually used to evaluate the network structure and predict node region: degree centrality, closeness centrality, eigenvector centrality, and community-related metrics [41,42]. They determine the distribution of critical commercial nodes and the pattern division of node groups in Shenzhen, thus predicting that Shenzhen may have critical commercial areas (Table 2).
This research makes a significant contribution to sustainable urban development and provides a valuable framework. This can demonstrate the relationship between core business areas and the potential for the spontaneous emergence of business areas in urban systems (Figure 1). It can offer insights into future directions for commercial growth and sustainable urban development.

3. Research Context and Methods
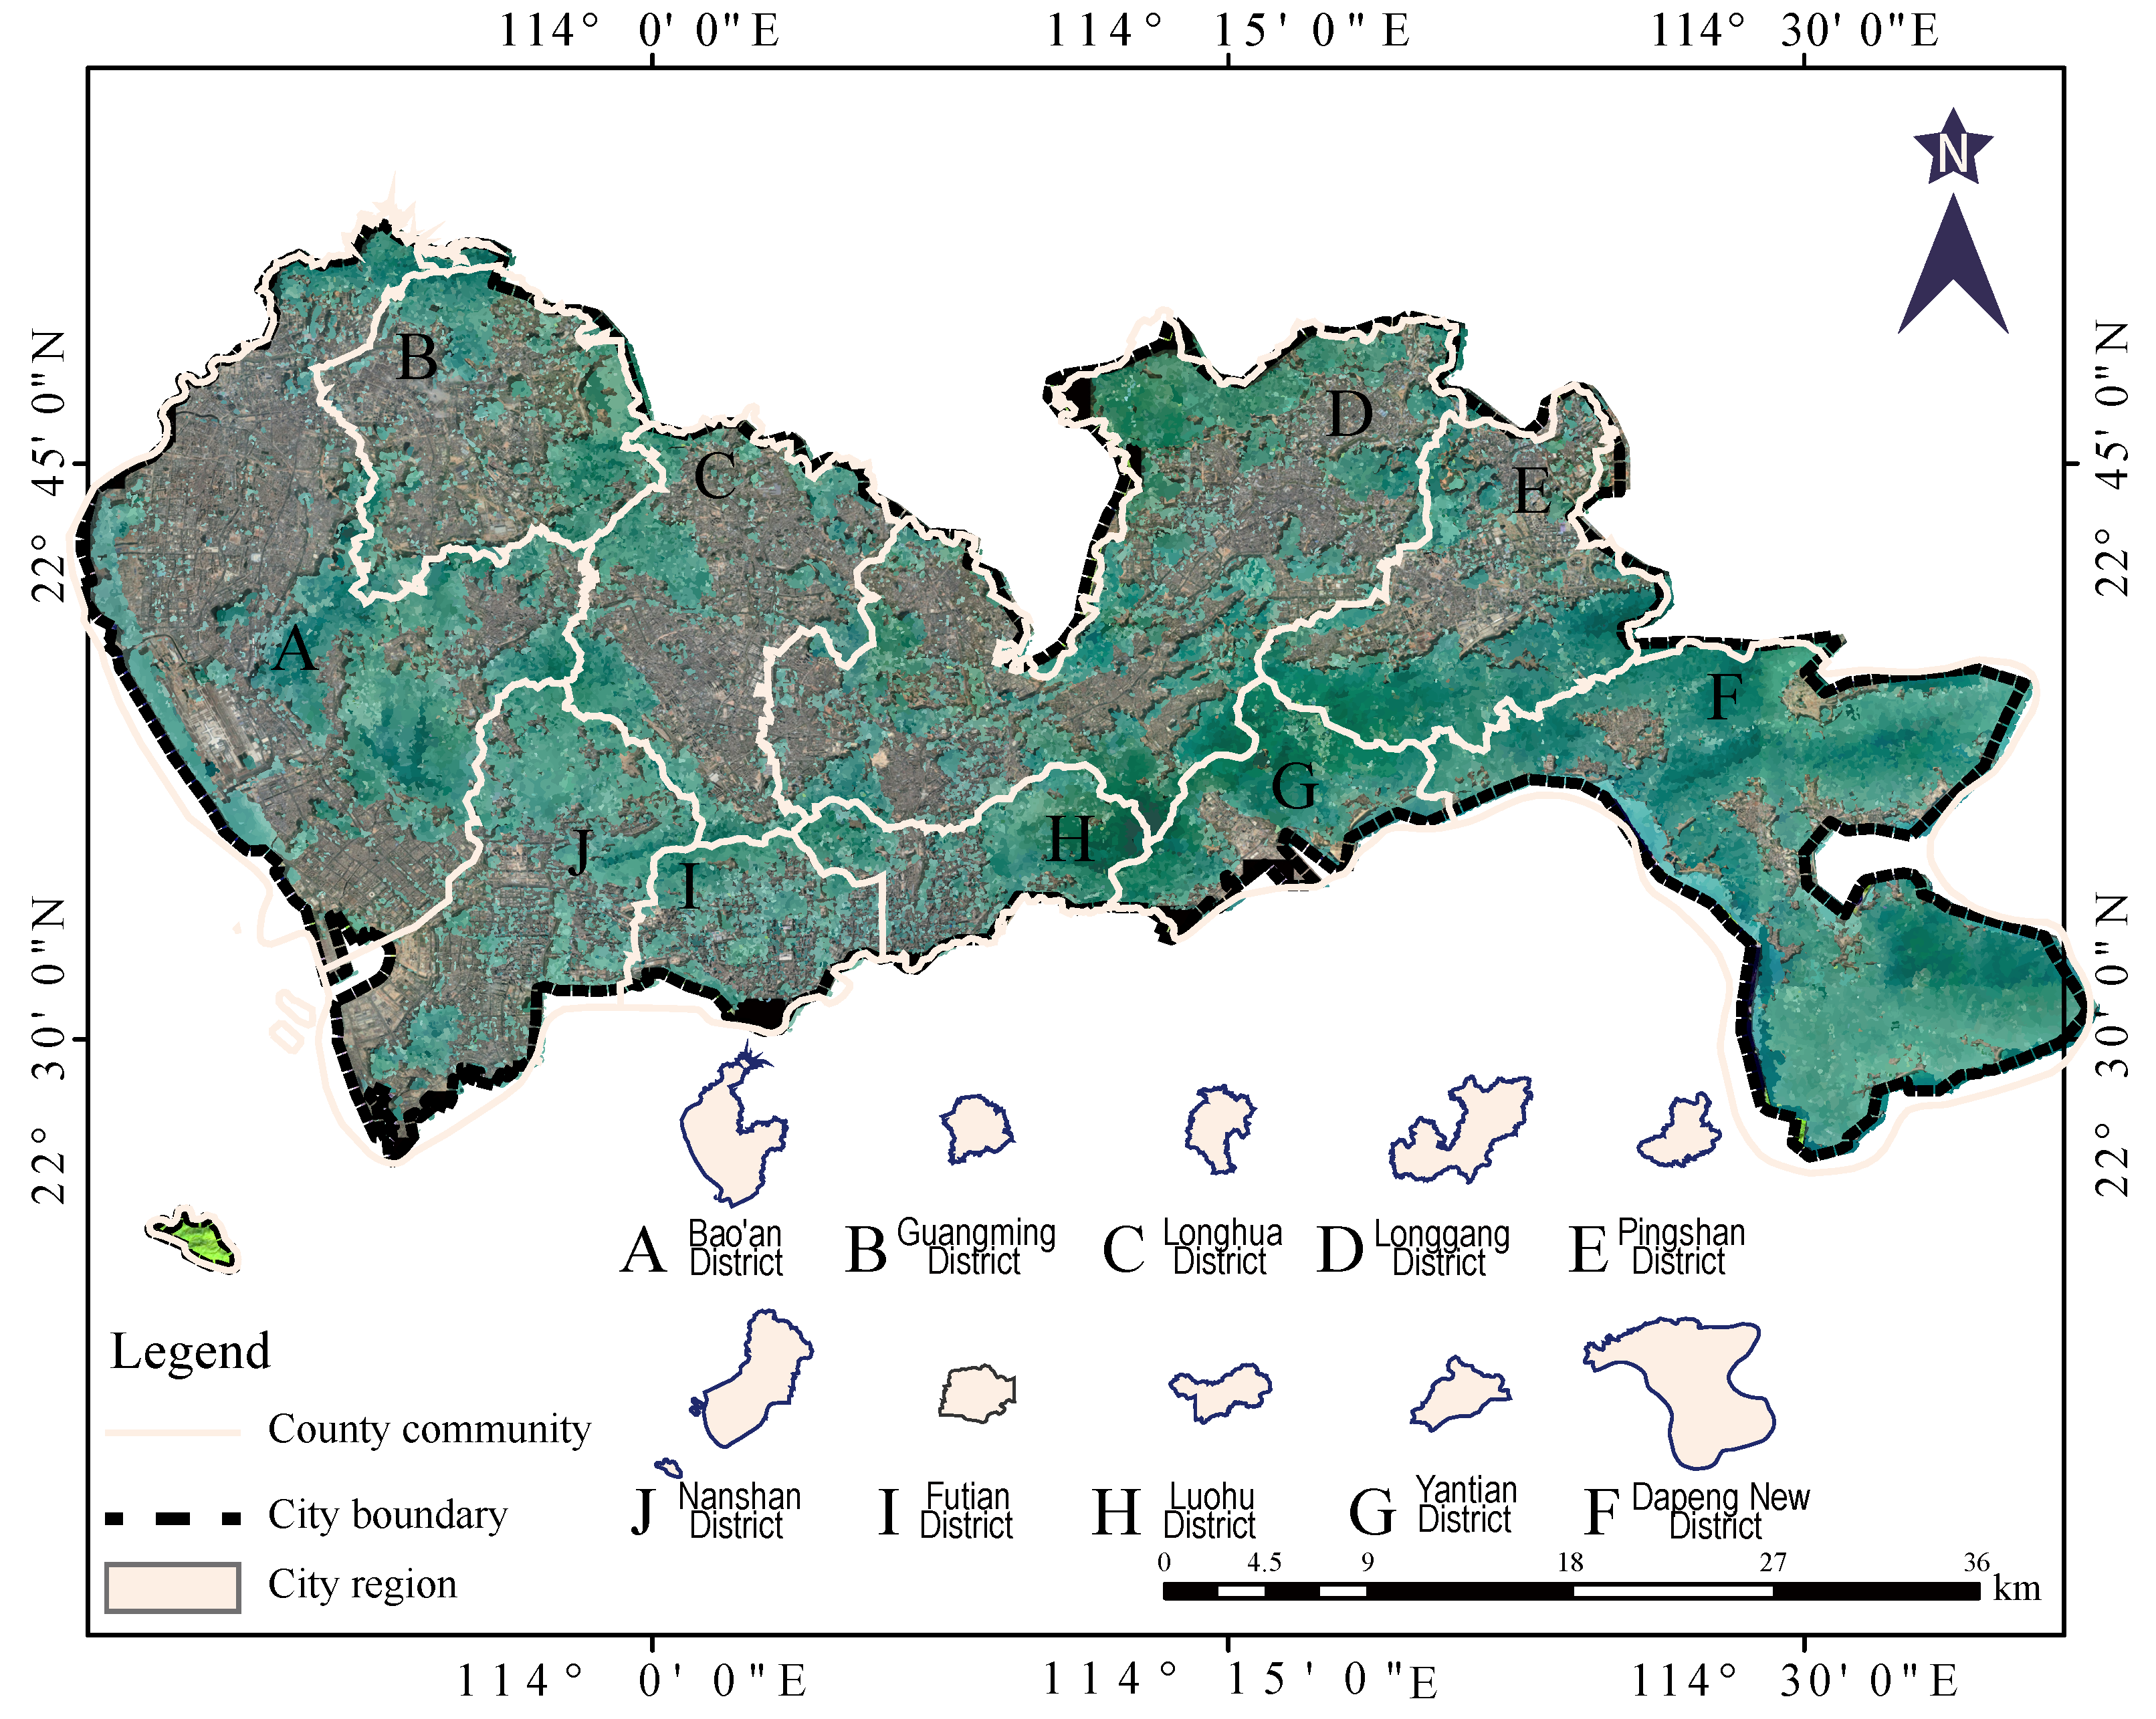
3.1. Study Area

Shenzhen (E 113 46 ~ 114 37 , N 22 27 ~ 22 52 ) has progressively grown from a fishing town to the most developed first-tier metropolis along the coastal areas of China by taking advantage of the opportunity of reform and opening up in the 1990s. From 2000 until the present, it underwent a gradual transformation from a commercial city to a smart, multipurpose city and a tourism destination. The urban administrative districts have also evolved from the initial single center of Futian–Luohu to a complex system of multi-center cities, including Qianhai, Longhua, Yantian, and others (Figure 2).

3.2. Data Description

The moderate-resolution imaging spectroradiometer (MODIS) [14], developed and manufactured for the NASA Goddard Space Flight Center (GSFC), was used to select the form of surface temperature inversion data (https://ladsweb.modaps.eosdis.nasa.gov (MOD021KM), accessed on 22 November 2019). The time span of the data was from 1 January 2018 to 31 December. Excluding the interference of clouds, a total of 281 image data were obtained. The POI data, which primarily focuses on the commercial sector and includes the catering industry, shopping centers, living services, business affairs, and financial institutions, were gathered via the Gaode Open Platform (https://lbs.amap.com/dev/index, accessed on 5 October 2018). There were 524,000 total pieces of collected data after data cleansing, de-duplication, and other processing. The OpenStreetMap (https://www.openstreetmap.org, accessed on 10 December 2021) and Shenzhen Planning Institute data (http://opendata.sz.gov.cn, accessed on 12 December 2021) on a city road contain comprehensive street data for Shenzhen. The QGIS platform was used to perform the data classification, processing, and vectorization (3.26.2-Buenos Aires).

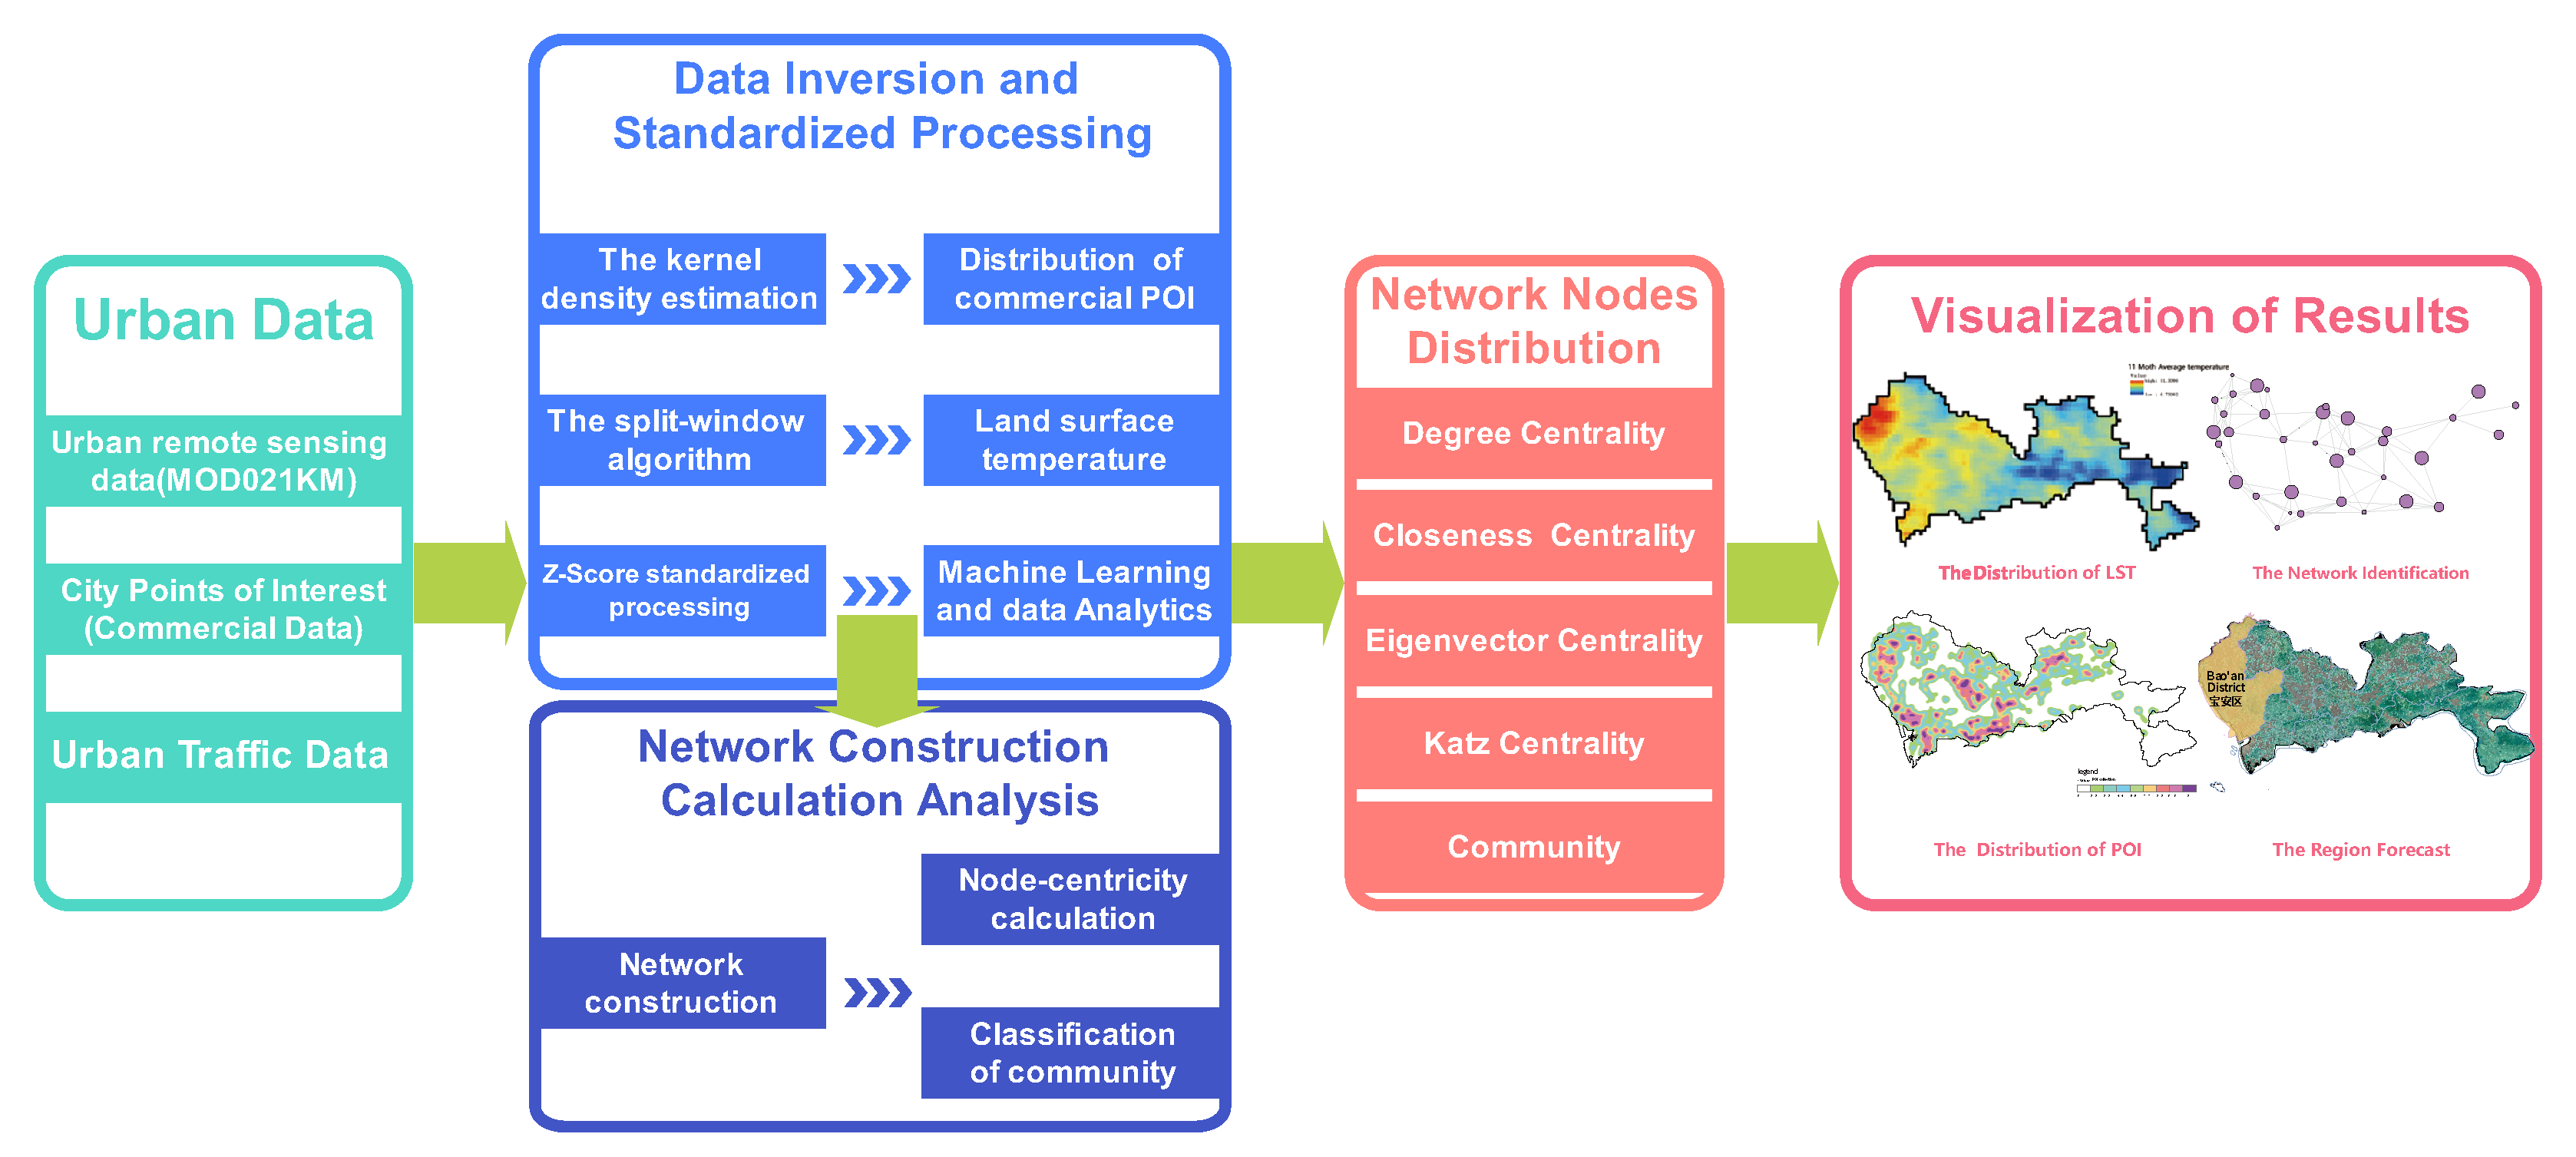
3.3. Research Methods

3.3.1. Multivariate Data Inversion and Processing

The split-window algorithm is a reasonably general LST algorithm [18,19] (Equation (1)). It is the primary algorithm for the MODIS LST inversion algorithm, which has 36 channels, and 1–19 and 26 are distributed in the visible and near-infrared bands. The other 16 channels are distributed in the thermal infrared band from 3 to 15. The algorithm requires only two parameters for the inversion of LST: atmospheric transmittance and surface emissivity. It can be inverted from other band data of MODIS, and no additional information is required.
Kernel density estimation (Equation (2)) helps visualize the distribution of points. It is used to calculate densitometric analysis for a common bandwidth area near any number of data points in the region. We analyzed the research object by establishing the spatial distribution of POI density [27].
The multiple data dimensions are different and do not conform to a unified standard, resulting in less accurate modeling in the early stages of data analysis and mining. To normalize these different data types, the Z-score is adopted as a data normalization pre-process [43] (Equation (3)). Simultaneously, conventional algorithms are used for data matching and evaluation, and the optimal algorithmic model is selected to mine the knowledge behind the urban multidimensional data and establish the correlation basis for network construction.
We integrated all commercial POI density distributions, used the supervised classification method to extract the highest area in the density distribution, and formed a spatial network (including the POI–8 network, POI–10 network, POI–11 network, and POI–12 network) under the calculation of Euclidean distance (Equation (4)) (Table 3).

3.3.2. Network Analysis Computation and Evaluation

The highly agglomerated areas in urban commercial forms are extracted as nodes using network science methods, and the relationships between different regions are represented by connecting edges to construct a network system. Network indicators are utilized to evaluate the nodes, edges, and overall structure of the network. The impact and connectivity of urban commercial form nodes are evaluated using degree centrality ( C D i ) (Equation (5)), closeness centrality ( C C i ) (Equation (6)), and eigenvector centrality ( E C ) (Equation (7)) to assess the influence of nodes at a distance from the commercial nodes on the commercial core area. The aggregation connection of nodes in the commercial area is evaluated using community ( C O M ) (Equation (8)). These indicators provide valuable insights into the relationships between nodes and edges in the network, as well as patterns and trends (Table 4).
In Table 4, A i j represents the link matrix of commercial typology nodes, d ( v i , v j ) represents the distance between row i and column j, u is a vector with elements equal to centrality scores, u j , t 1 is a ratio constant, L is the number of edges in the network, k i and k j represent the degrees of nodes i and j, respectively, and g i and g j represent the clusters to which nodes i and j belong.

4. Results

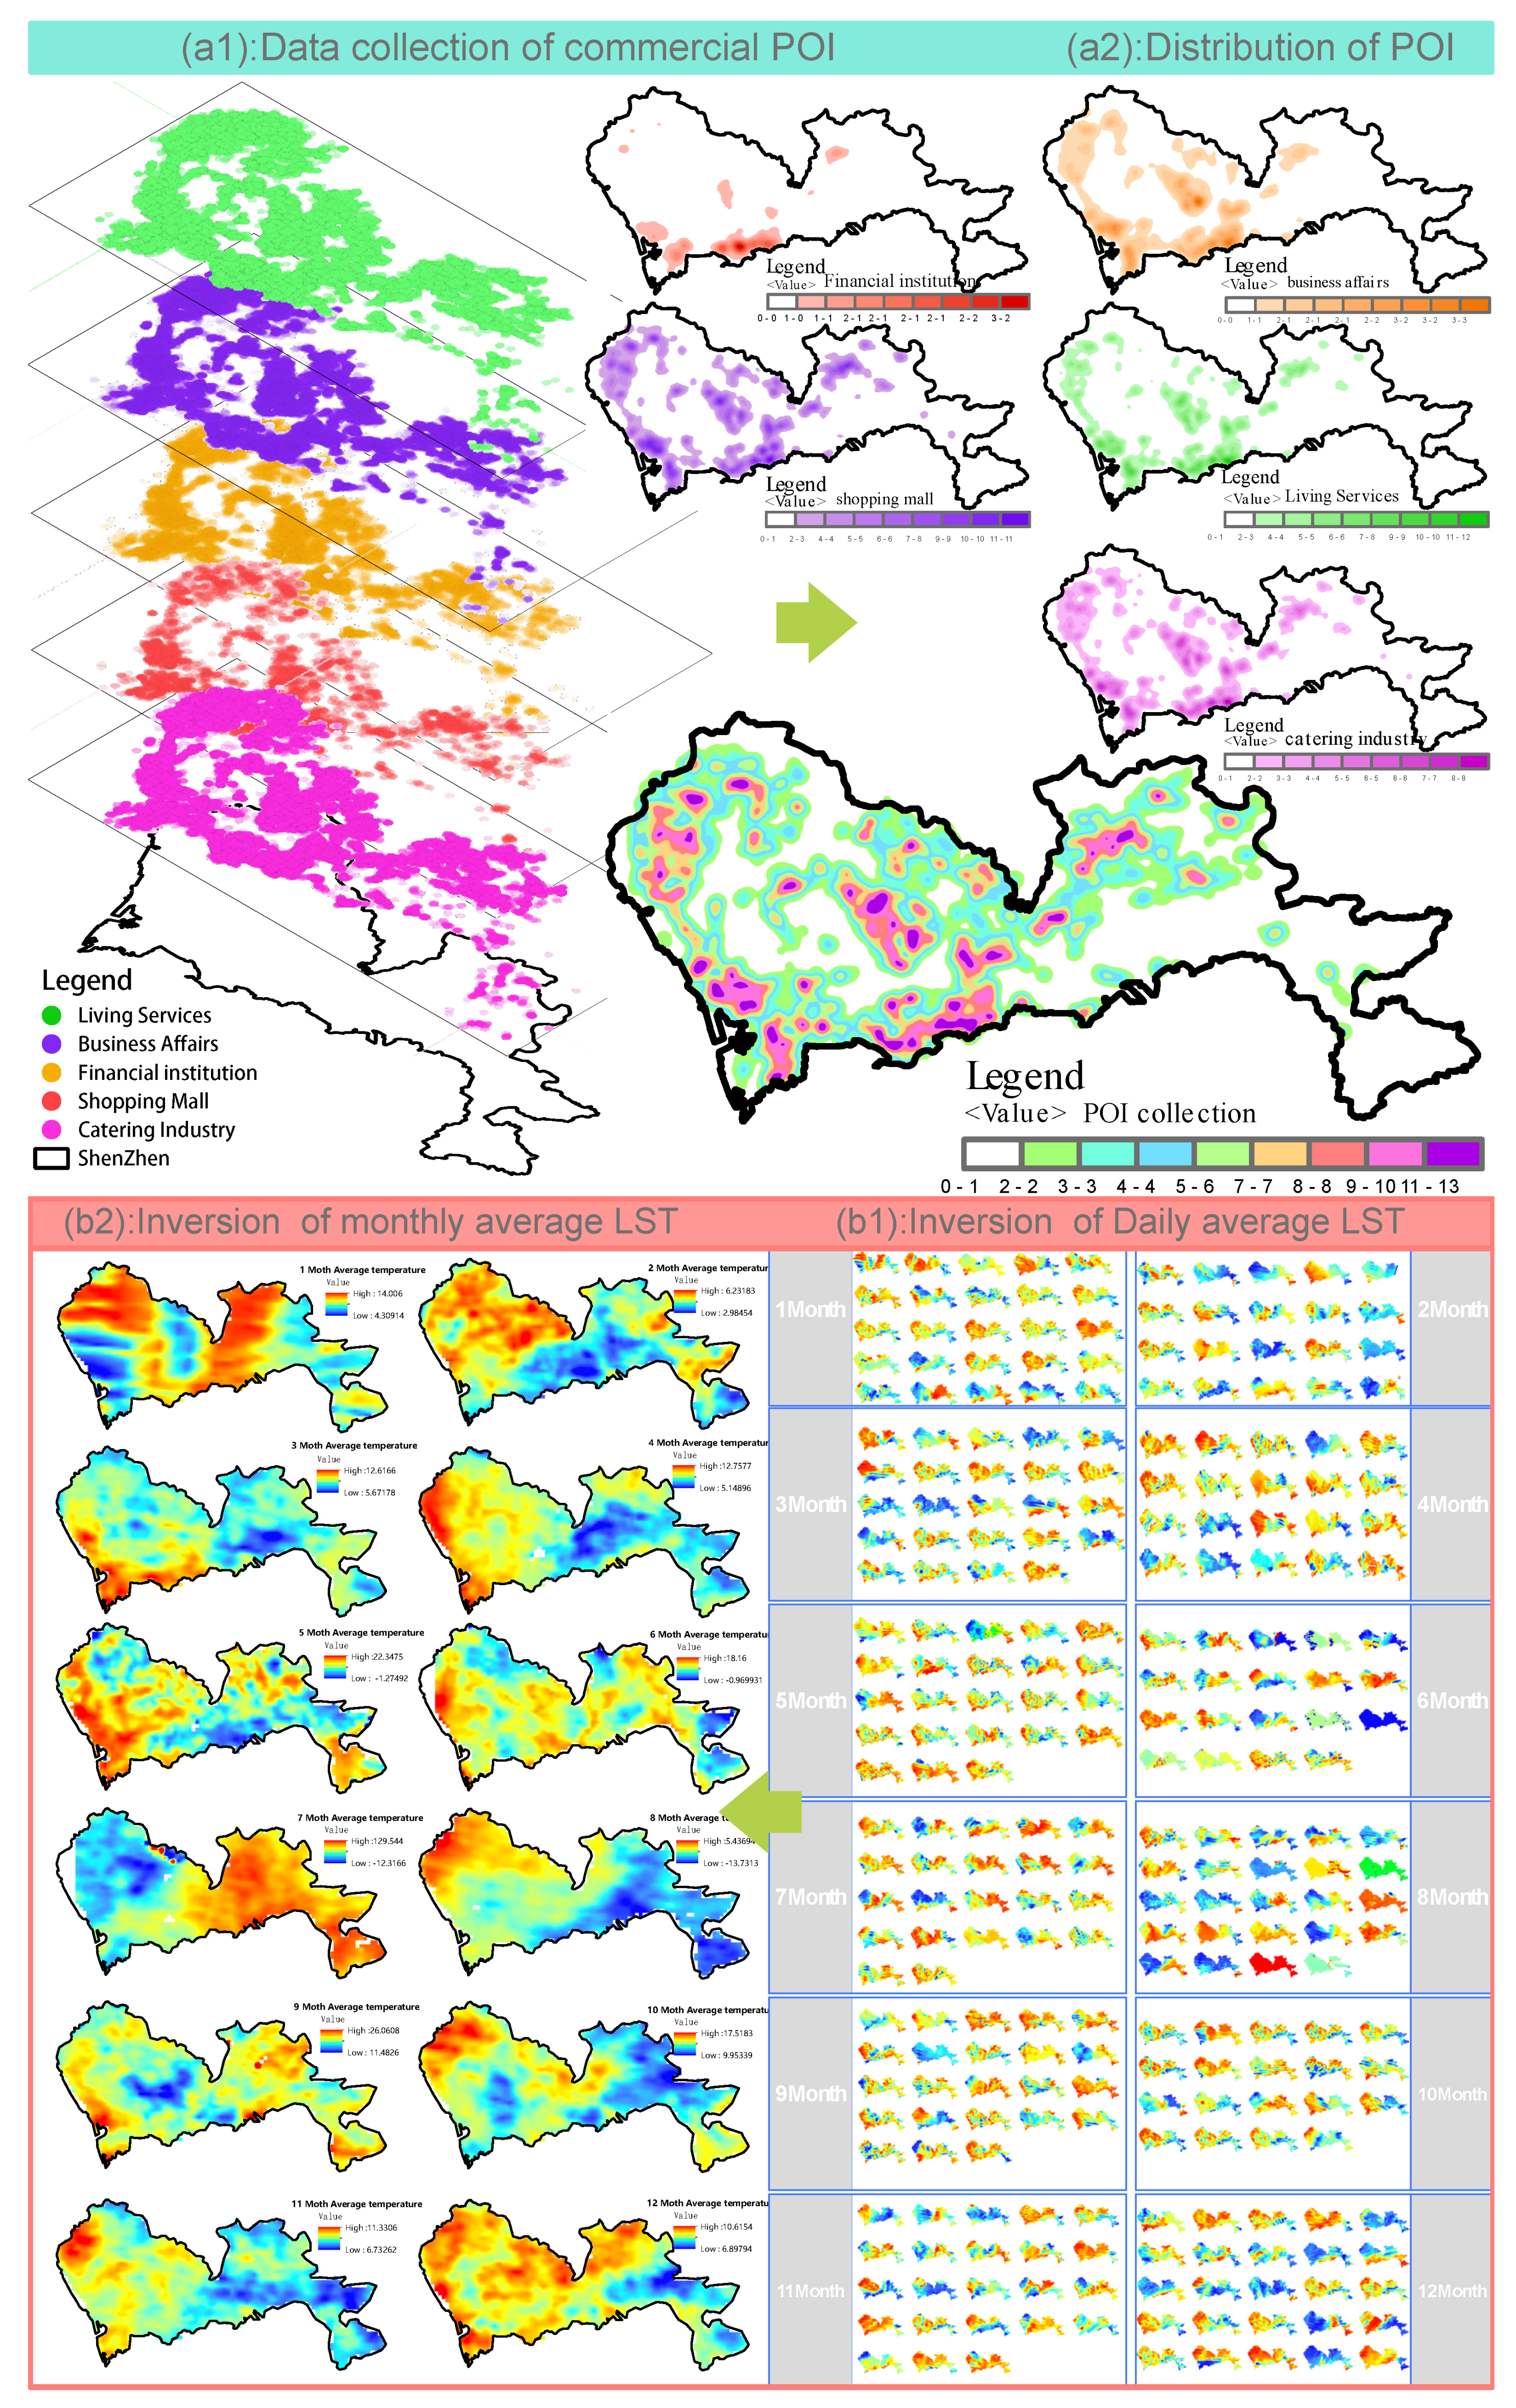
4.1. The Distribution of LST and POI

Figure 3(a1,a2) shows that residential services, business affairs, and catering are mainly concentrated in Futian, Nanshan, Luohu, Longhua, Baoan, etc., while financial institutions are mainly distributed in Futian. The five commercial POIs are integrated, and the darker areas in the density distribution represent the highest commercial activity. Figure 3(b1,b2) shows that the high-temperature areas are mainly concentrated in the southwestern part of Shenzhen (e.g., Baoan, Nanshan, Futian). The 12–month average LST distribution heat trend gradually decreases from the southwest of Shenzhen to the northeast and southeast. The hardening of the underlying surface caused by urban development and expansion is the primary cause of the high surface temperature in Shenzhen’s southwest. Therefore, the distribution of LST and POI shows that the main locations of commercial distribution in Shenzhen are in the western, central, and southern regions. Among them, Futian has the most influential commercial form.

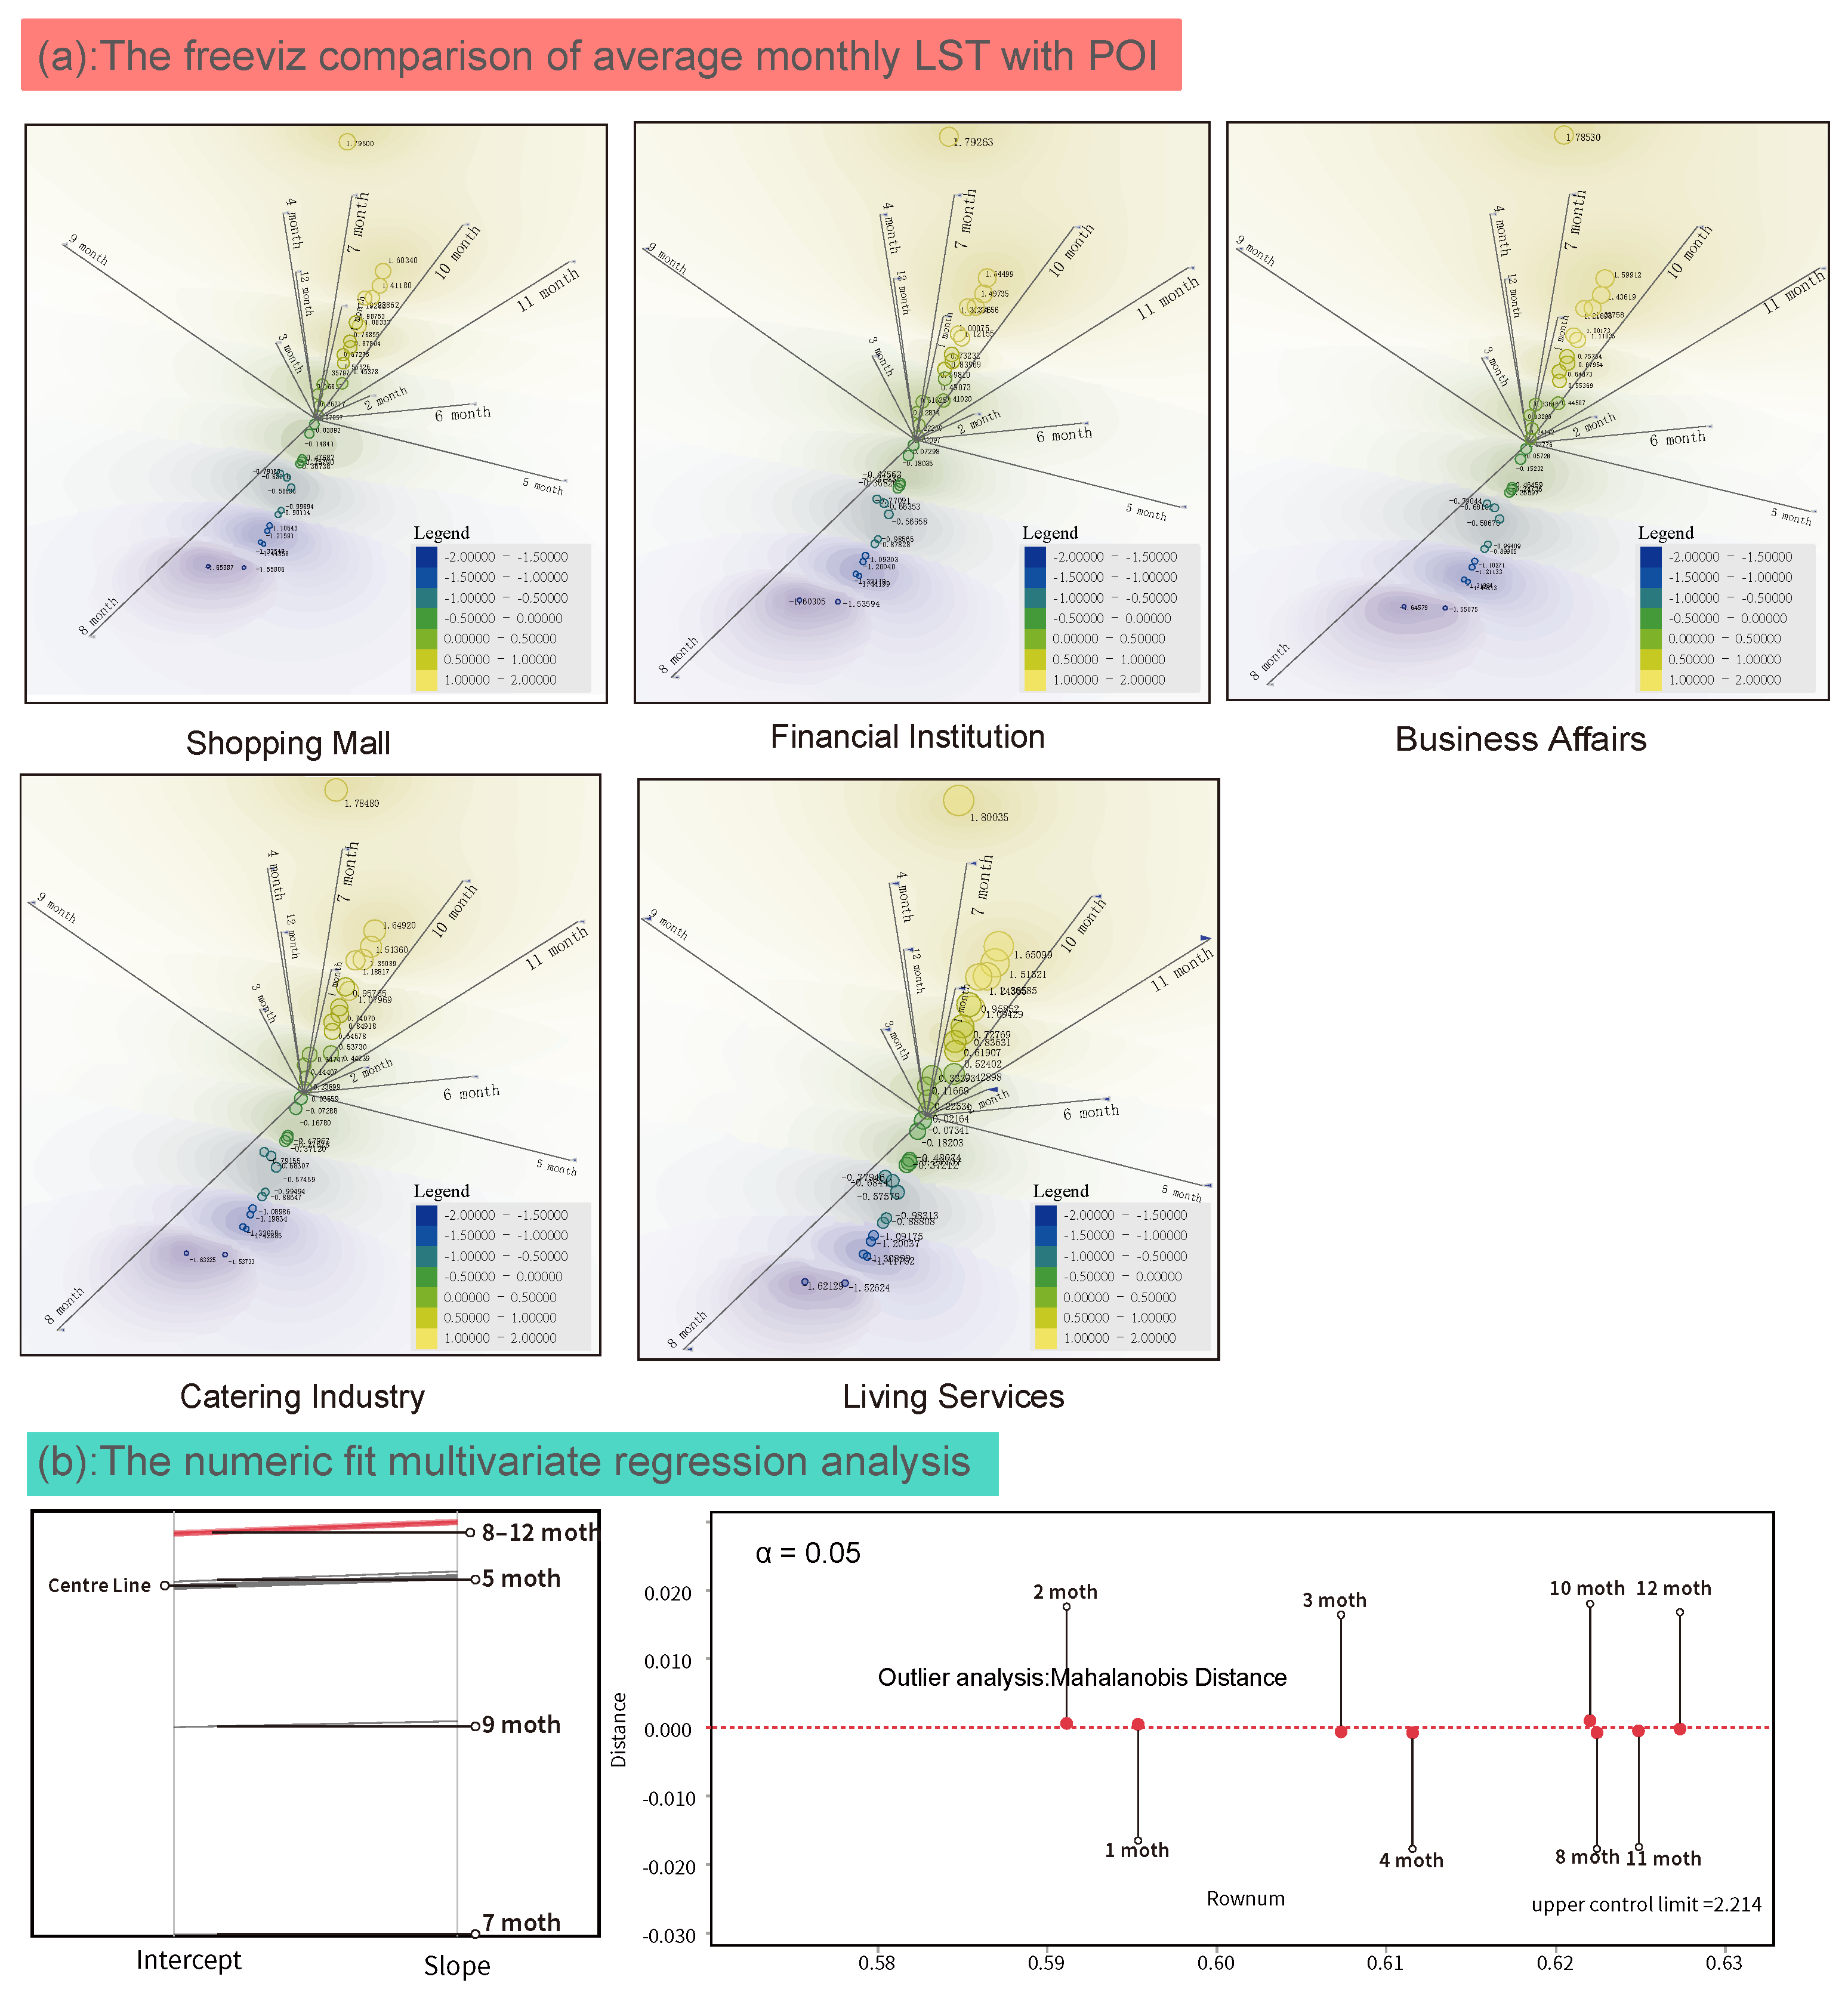
4.2. Data Analysis of Mining and Processing

LST is utilized to visually separate multiple datasets through free visualization by combining POI data for business purposes. Figure 4a shows that the distribution of commercial POI and LST is consistent. The average months in which their commercial POI and LST distributions largely coincide are January, April, July, August, October, November, and December. The linear regression algorithm is chosen as the primary means of combining the commercial POI data with the LST correlation study data. Figure 4b shows that the highest eigenvalue of the data prediction process is October and December, followed by November, August, January, and March. Moreover, the optimal data combination was October, August, November, and December by the evaluation standards method and the center line partition.

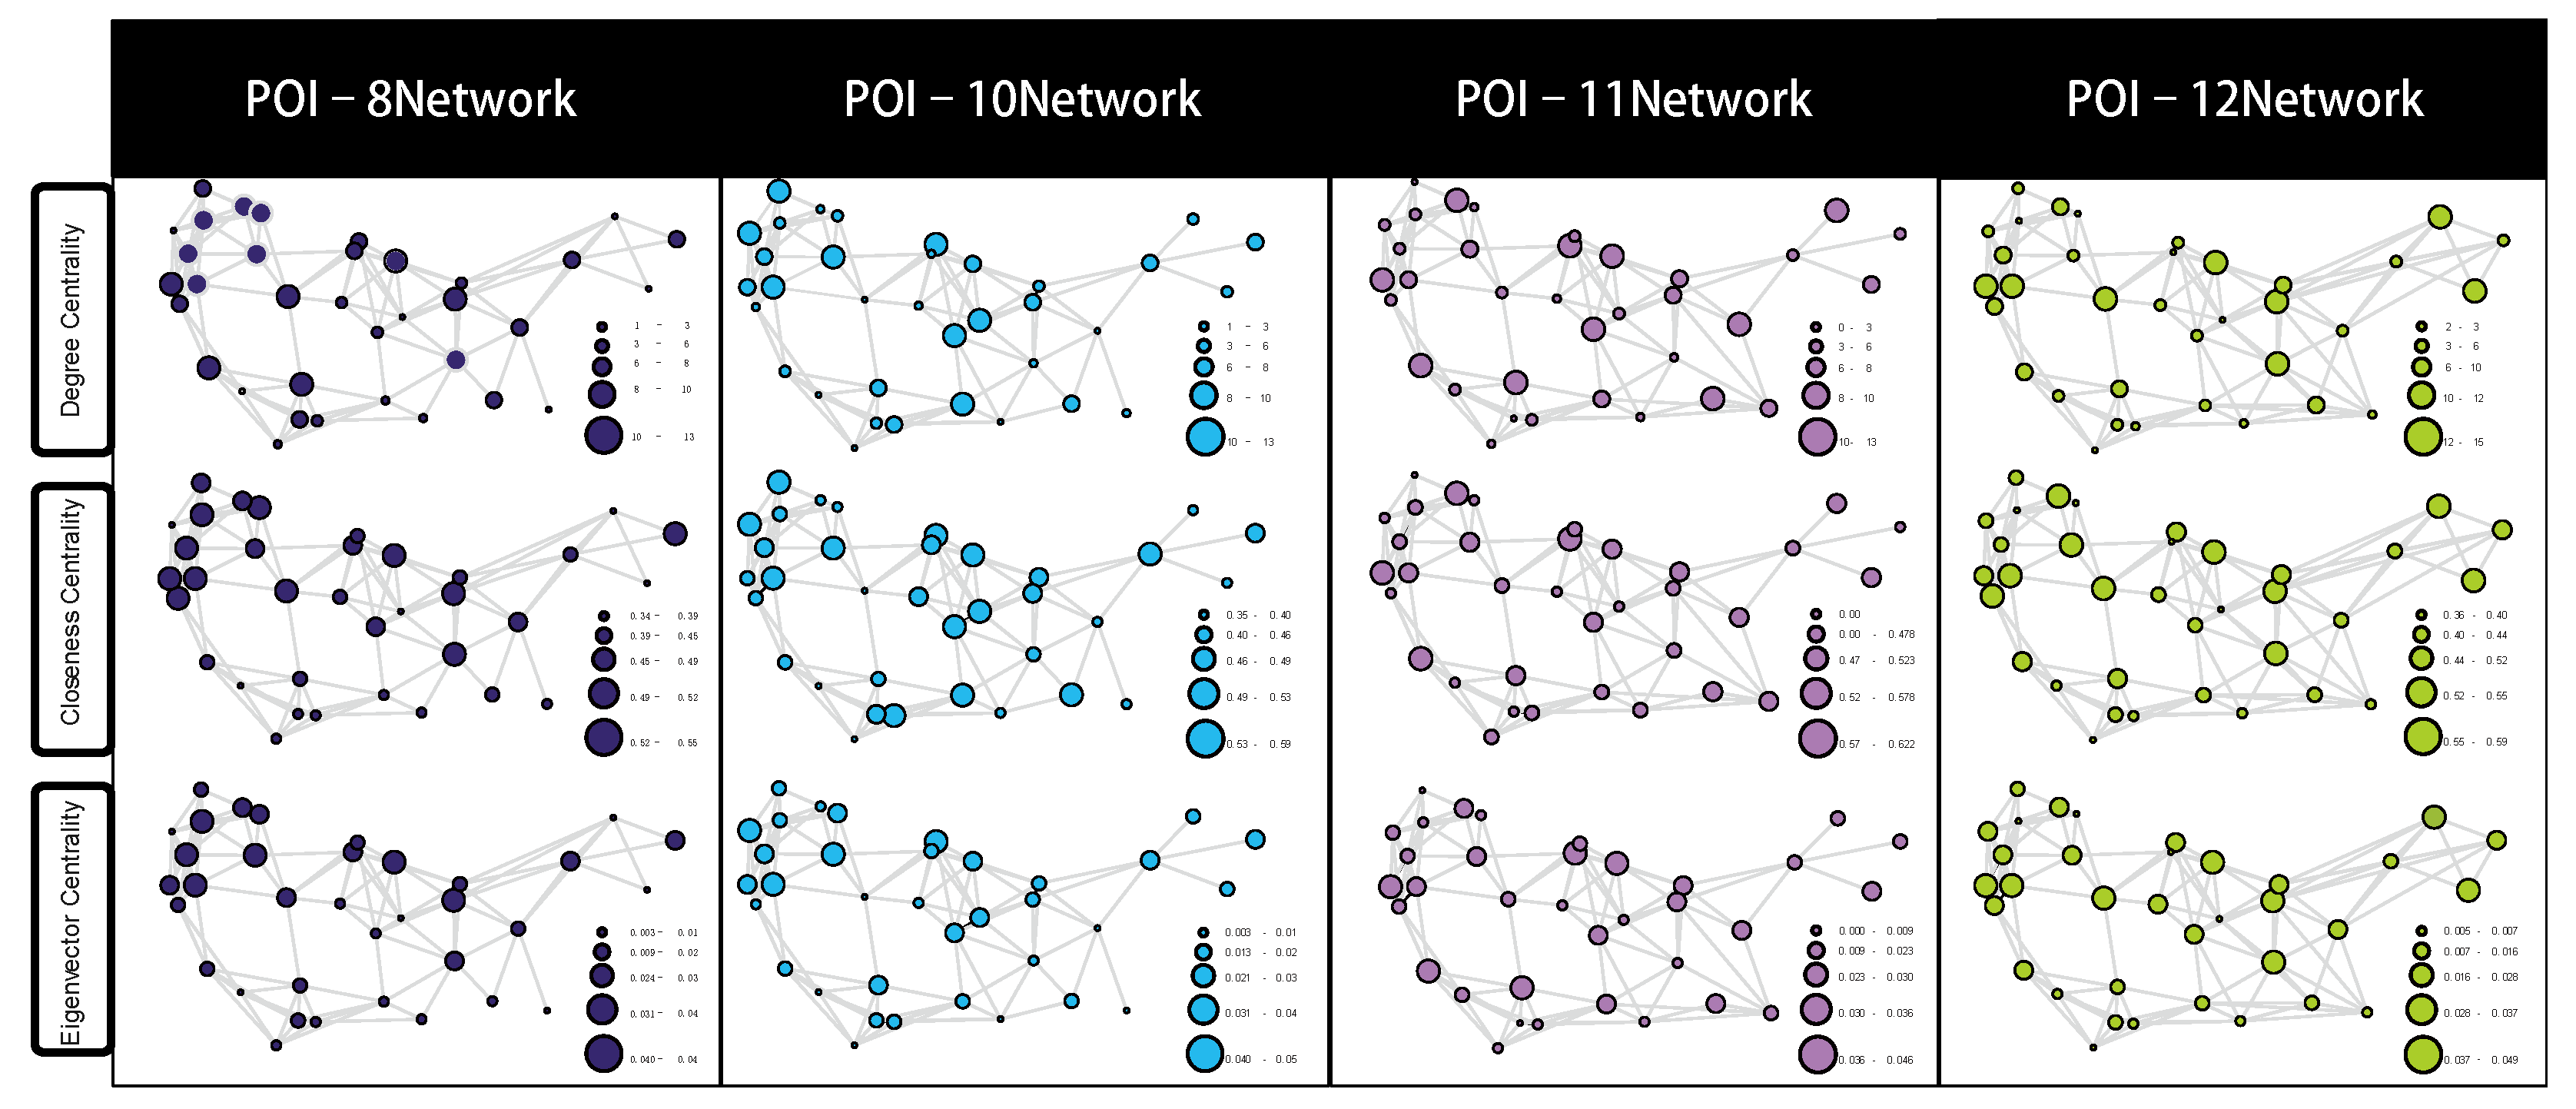
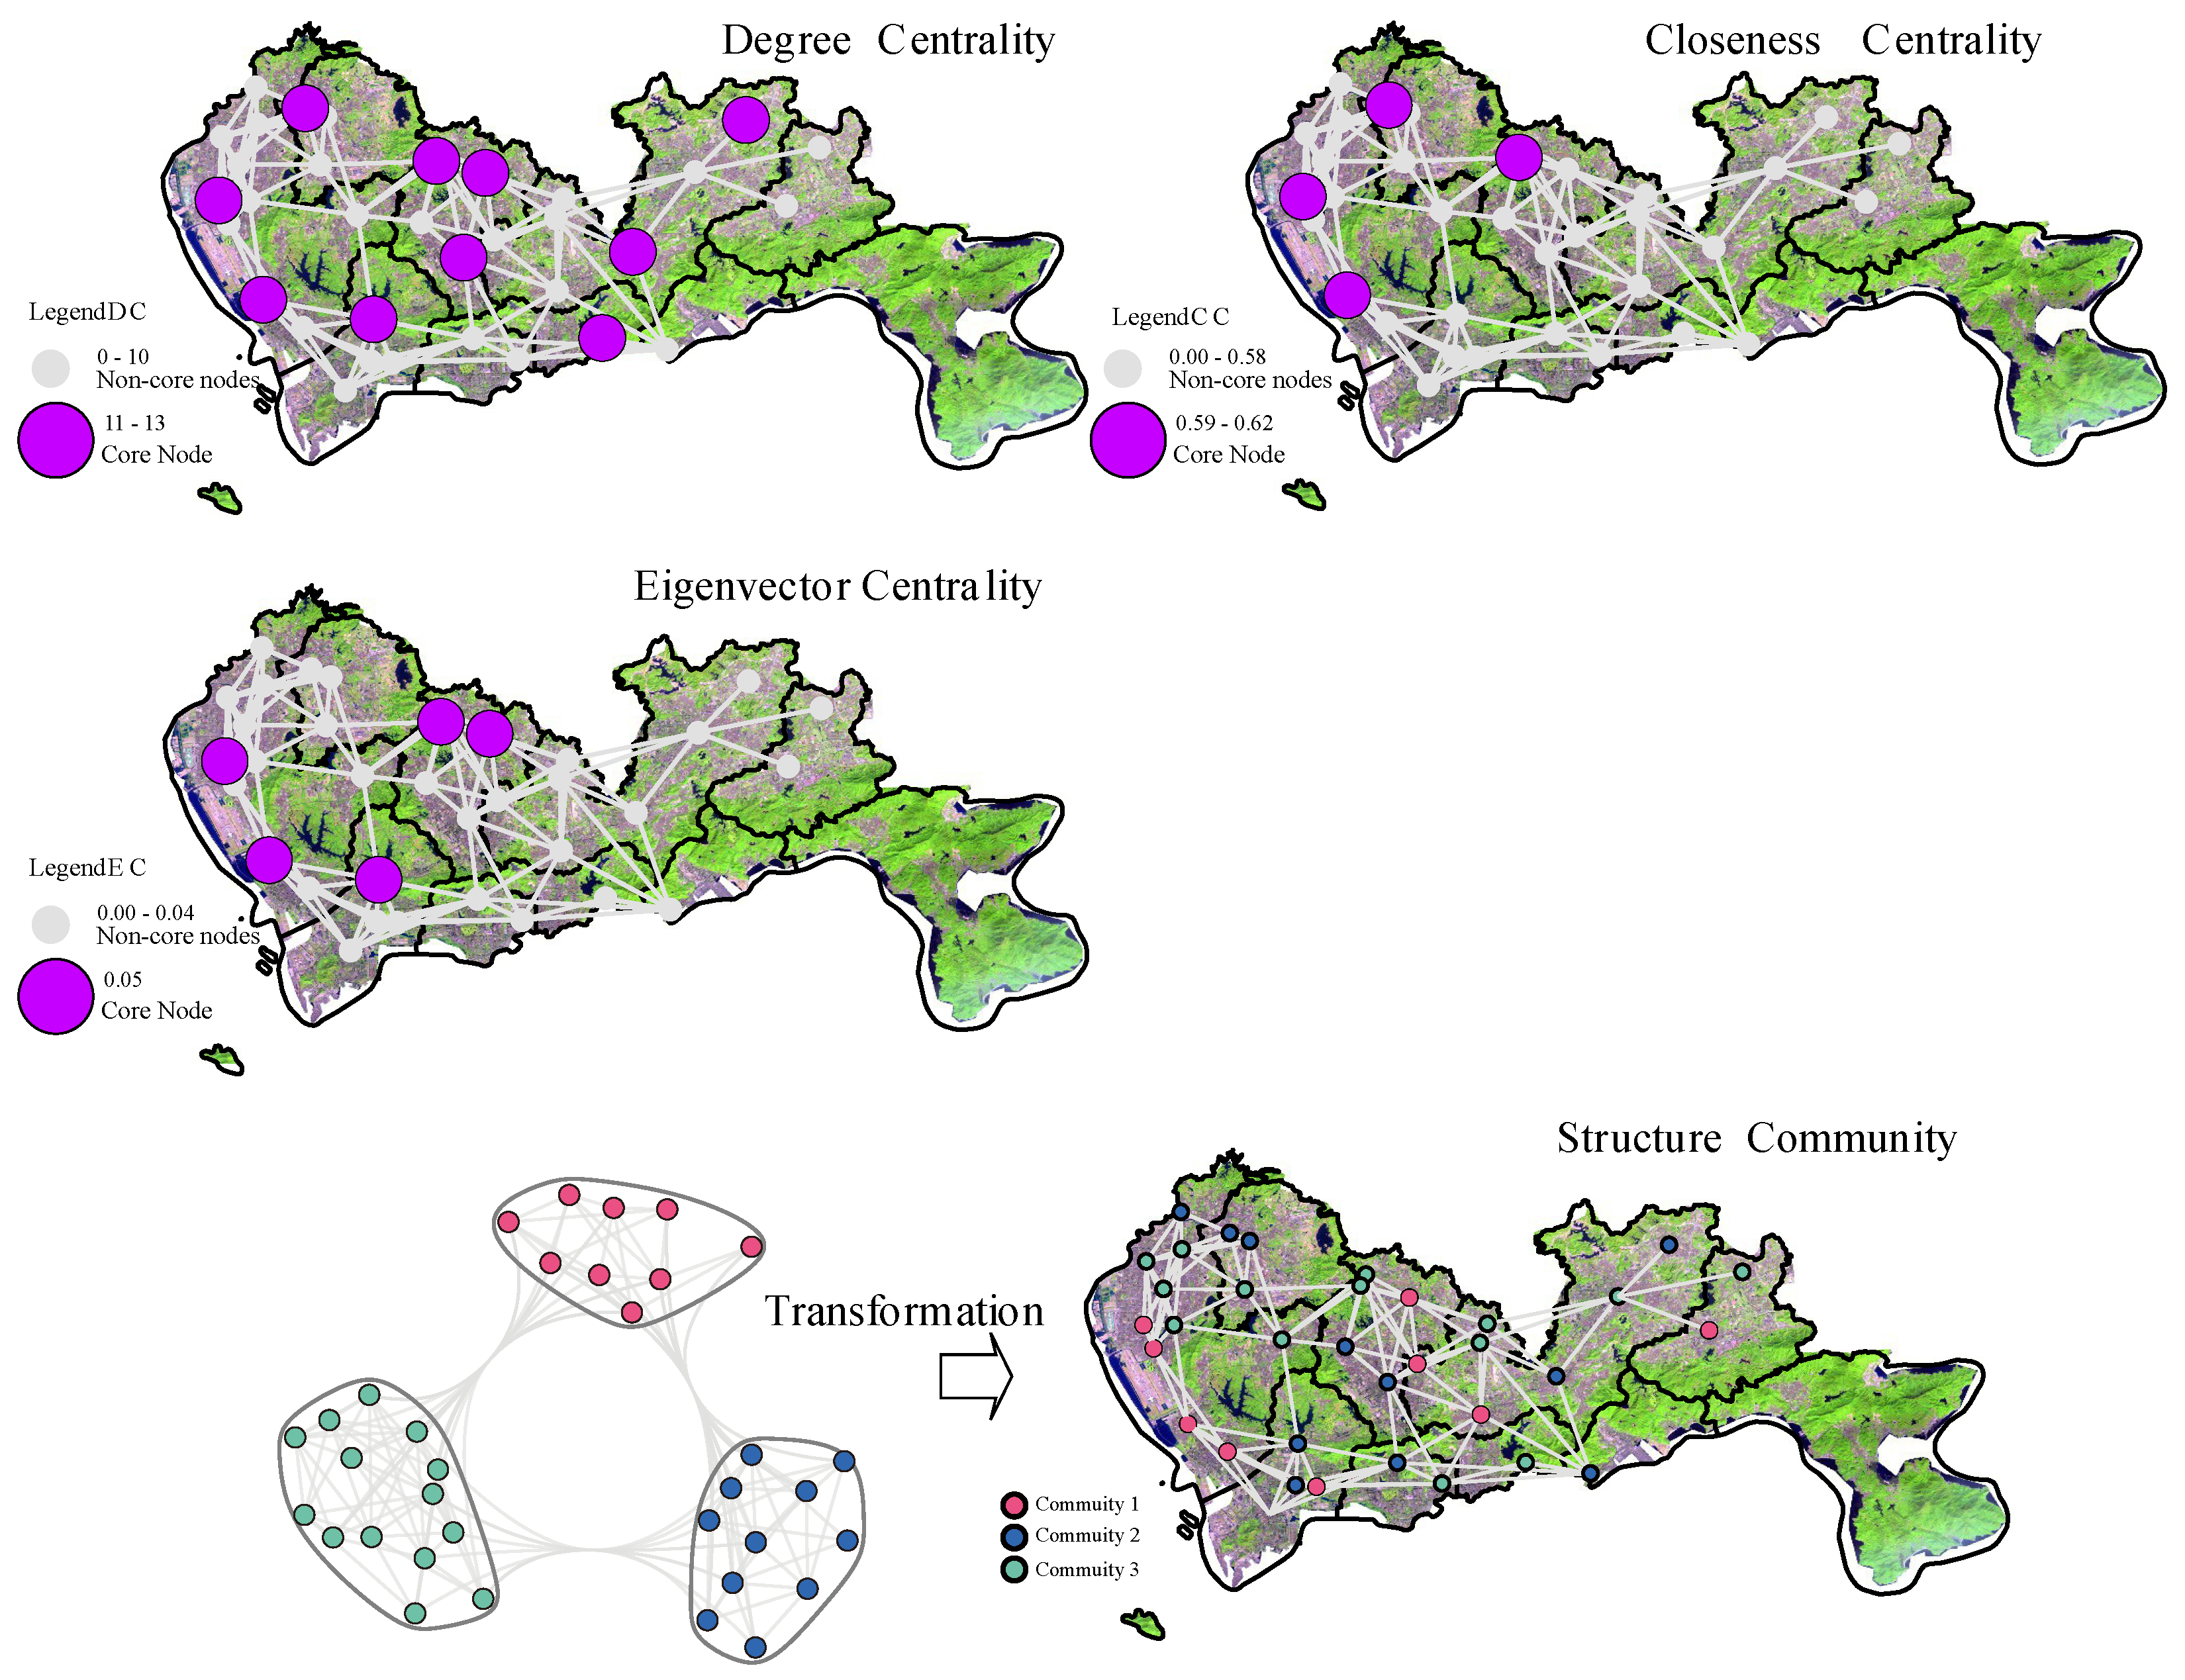
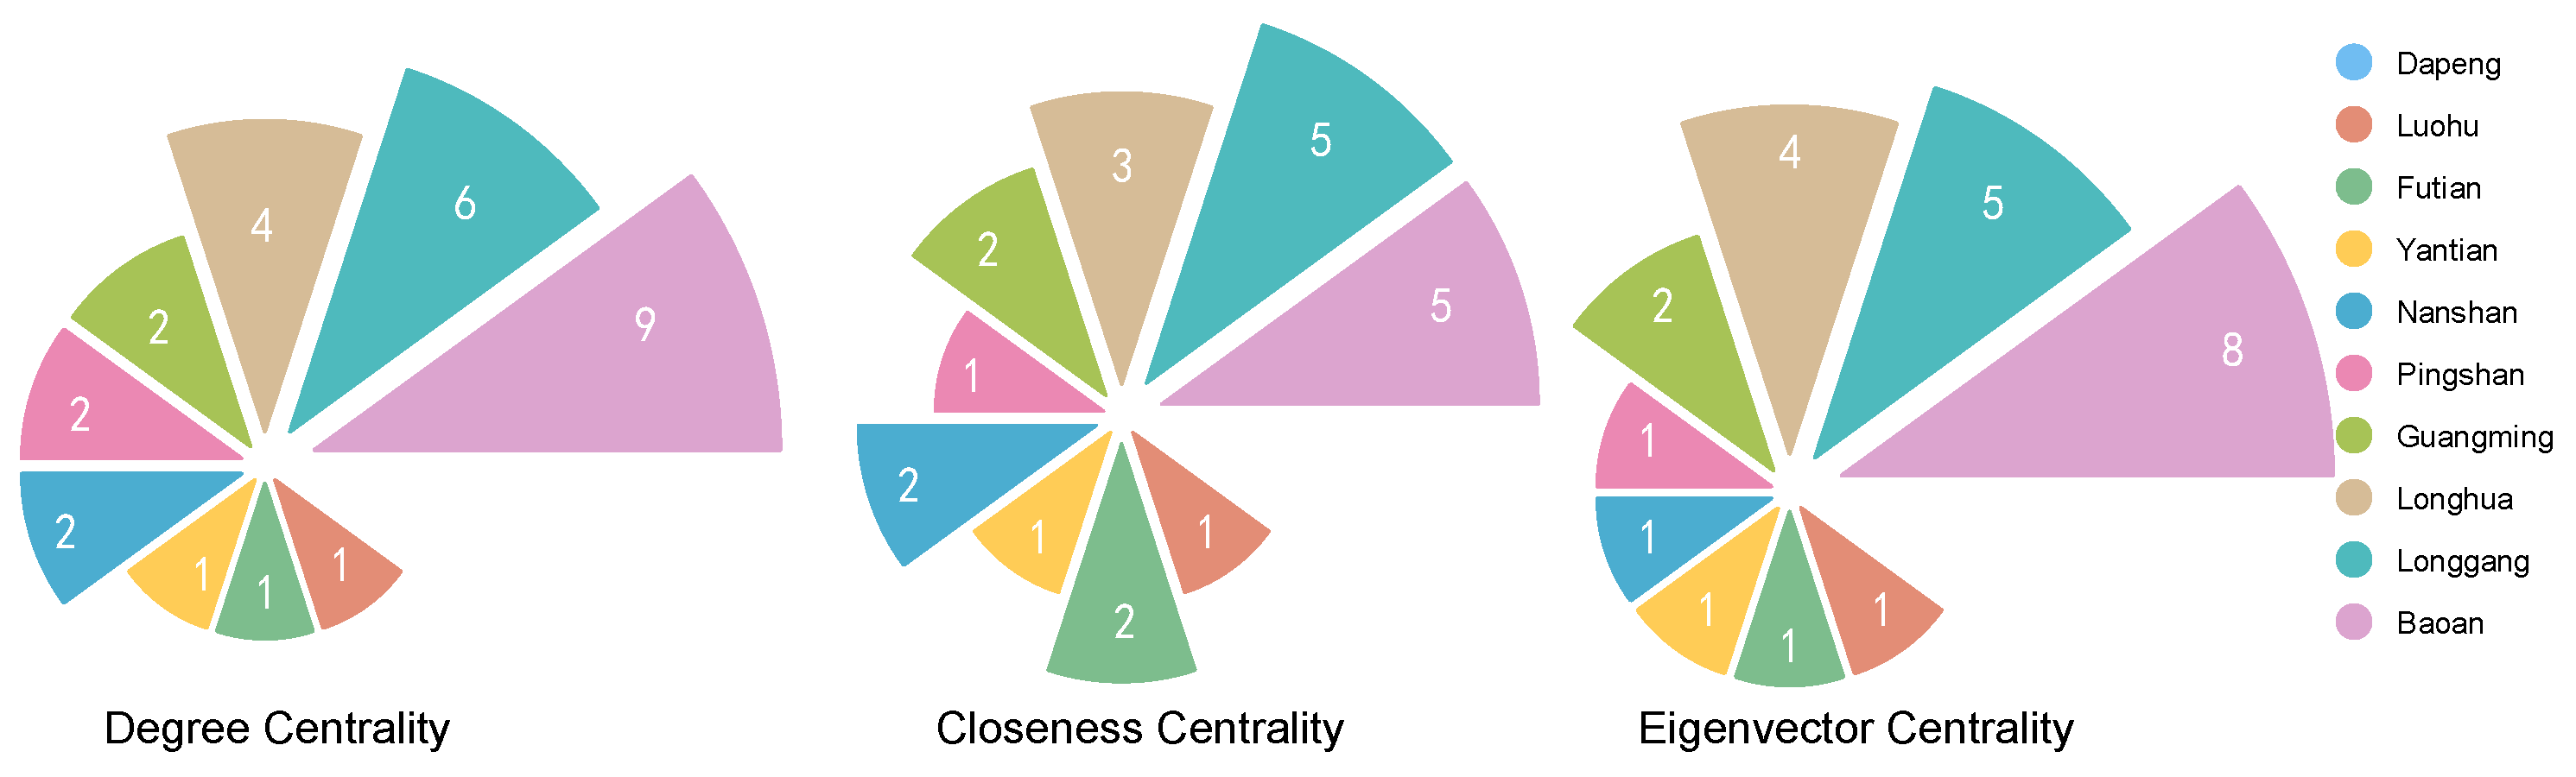
4.3. The Network Construction and Computing

The network indicators are used to calculate these networks numerically, and the central influence distribution of the whole network system is evaluated. Based on Table 5, it is evident that the POI–12 network has the highest influential value for the degree centrality, followed by the POI–8 network, suggesting that the nodes in the network demonstrate a high level of cohesion. The closeness centrality measures the degree of proximity between a node and all other nodes in the network. Therefore, the higher the value, the smaller the average distance between the nodes in the network. The higher closeness centrality values are found in the POI–8, POI–11, and POI–12 networks. The eigenvector centrality shows the relationship between the nodes and the surrounding nodes. The higher the centrality of the node, the more critical the surrounding nodes become. The POI–11 network has the highest value. The statistical analysis of the three network indicators reveals that the POI–11 network exhibits the most accurate representation of the distribution and influence of network nodes in terms of network centrality (Figure 5).
Extracting the centrality of the POI–11 network reveals its spatial distribution in the city (Figure 6). Specifically, the highest values of degree centrality are primarily located in Bao’an, Guangming, Nanshan, Longhua, Futian, and Longgang. The main distribution of closeness centrality is observed in Bao’an, Guangming, and Longhua. The significant development areas identified by eigenvector centrality are mainly concentrated in Bao’an, Longhua, and Nanshan. In addition to the impact of major hubs on the structure, community as a subdivision, characterizing areas with high connectivity, becomes an important indicator categorization into different subnetworks, which allows better connectivity between their own than between non-subnetworks. The calculation results indicate that the POI–11 network is divided into three subnetworks, reflecting different distribution patterns. The subnetworks exhibit a dispersed distribution, showing a trend from central-western to eastern areas.

5. Discussion

This paper studies the identification and prediction of commercial areas using land surface temperature (LST) and points of interest (POIs). The study analyzes the network nodes and the structure of a group to investigate the urban commercial form. The research indicates a positive correlation between the spatial distribution characteristics of POI and the distribution of LST. The study also identifies the optimal network for centrality as the POI–11 network, with the most critical nodes in this network being distributed in Bao’an district.

5.1. Discussion of Method

5.1.1. The Relationship between Commercial POI and LST

There is a similar spatial distribution pattern observed between urban commercial POIs and LST. Urban commercial POIs abstract commercial entities into spatial information points. When POIs are clustered extensively in urban space, evaluating the spatial distribution of commercial areas using kernel density can provide insight into the distribution of the urban economy and identify significant commercial districts. LST depends on the physical properties of the underlying urban surface. Generally, developed commercial areas often have an underlying surface characterized by cemented pavements in cities. Therefore, there exists a general similarity in the spatial distribution of both LST and POIs, indicating that the two tend to correlate with each other. From Figure 3 and Figure 4, we can see that the distribution of POIs is basically the same as that of average monthly ground temperatures for most months, among which outlier analysis gives α = 0.05 , indicating that the distributions of the two sets of data are basically consistent. The spatial distribution and aggregation of POIs is directly related to the distribution of human activities and economic activities, which produce large amounts of heat, and thus, affect the surface temperature. The similarity in the distribution patterns between POIs and ground temperatures suggests a potential correlation between human activity and ground temperatures. However, the relationship between them is not strictly linear, as their spatial patterns are influenced by various intricate factors [25]. For instance, LST is influenced not only by the type of underlying surface, but also by factors such as regional sunlight exposure and vegetation coverage. It is important to note that not all cemented concrete surfaces are exclusive to commercial areas. Industrial parks, schools, hospitals, and non-commercial development sites under construction may also feature cement concrete surfaces, potentially influencing the identification of high-temperature zones on the land surface [15]. However, the spatial distribution of POIs depends on a variety of factors, including economic, social, and political factors. For instance, commercial POIs are often concentrated in areas characterized by high population density and vibrant economic activities. Additionally, the spatial arrangement of POIs can be influenced by policies and planning interventions, employing diverse strategies. Consequently, the integration of POIs and LST can enhance the accuracy of identifying commercial areas and yield more precise results.

5.1.2. Utilizing Monthly Average LST for Objective Analysis

In this study, the monthly mean LST was employed instead of daily temperature measurements. This methodology ensures the objectivity of the data by effectively reducing the influence of weather variations and other anthropogenic factors. LST is subject to diverse influences, including climate change, cloud cover, and vegetation coverage, among others. The inherent variability in daily temperature data poses a challenge in accurately capturing surface characteristics. Using monthly averages allows us to reduce the effect of short-term fluctuations and provide a more stable representation of the temperature field. This enables a better understanding of the intrinsic relationship between LST and its associated features. Moreover, machine learning techniques were used to extract relevant attributes from both the LST and commercial POIs. The aim was to identify the month with the closest temporal correspondence between the two datasets. Although this conclusion differs slightly from the conventional preference for the summer months, it is not without foundation. Our results show a strong correlation particularly in the months of August, October, November, and December. While higher summer temperatures are advantageous for detecting urban heat island effects and areas of high commercial density, excessively high temperatures can obscure certain surface characteristics. Conversely, the moderate temperatures of autumn provide a balance, ensuring sensitivity to surface features while minimizing interference from climatic variations. Our choice of months, therefore, takes into account both typicality and relatively stable temperature conditions.

5.1.3. Analyzing Network Structures and Spatial Correlation Patterns of Urban Hotspots

The data collected have been used to construct the network by calculating Euclidean distance. The calculation of Euclidean spatial distance serves as a straightforward and intuitive approach, quantifying the spatial separation between any two points based on their coordinates. In this investigation, both LST and POIs are geographically referenced. The integration of these two datasets allows the extraction of core areas for node transformation using supervised classification. The Euclidean distances between nodes and their neighbors are evaluated. The result is a mesh-like connectivity structure.
Network analysis is performed through the assessment of node centrality, which is a concept from network science [32]. Cluster analysis is used for the identification of the structural characteristics of the network by means of community detection. The primary objective during the examination of node centrality is to identify the regional influence and spatial distribution of crucial nodes within the urban area network. From the comparison of node centrality values, it can be observed that the nodes have the highest influence in both the global network and among the surrounding nodes in the POI–11 network. Among them, the maximum centrality values in the POI–11 network nodes are as follows: C l o s e n e s s C e n t r a l i t y = 0.600566 and E i g e n v e c t o r C e n t r a l i t y = 5.601139 . This indicates that it is relatively close to the average Euclidean distance of the shortest paths between other nodes in the network. It demonstrates that POI–11 holds a central position within the entire network’s topology and plays a crucial role as a key node. Additionally, it is tightly connected to the entire network, with numerous connections to other significant nodes. The eigenvector centrality objectively reflects the importance of the node in the network. The high eigenvector centrality of POI–11 further underscores its hub position within the entire network. Degree centrality and closeness centrality, as network centrality indicators, represent the cumulative adjacency and cumulative distance between nodes, respectively. They gradually extend from local to global levels. Eigenvector centrality primarily captures the impact of relationships between nodes and is considered a measure from a global perspective. Therefore, the analysis of these three centrality measures allows a progressive understanding of the role and influence of each node in the network, from local to global perspectives. Nodes that demonstrate high centrality within local or overall networks possess significant importance that should not be disregarded.
Community analysis was employed to divide network nodes, enabling the identification of clustering structural features within the network [33]. A community can be thought of as a group of nodes with dense internal connections and relatively sparse external connections. Each community identified by the algorithm represents a cluster module within the network, characterized by relatively weak connectivity between communities. Thus, the partitioning of communities effectively captures the overall pattern of aggregation within the network. It provides a macroscopic perspective to assess the structural characteristics of the network. In this analysis, different communities were interpreted based on the correspondence between node attributes and their aggregation into spatial hotspots. For example, if nodes within a community have similar attributes and are located within the same commercial area, it is highly likely that the community represents that particular hotspot distribution area. The spatial distribution of communities reflects the scale of the commercial area, while the density of nodes within each community indicates the density of facilities within the commercial area. Consequently, the analysis of cluster attributes not only helps to identify the primary clustering structures of the network, but also facilitates their mapping to the commercial distribution in the urban space. This allows for a true understanding of the spatial correlation patterns between hotspot distribution areas at the data network level.

5.2. Discussion of the Results

5.2.1. Shenzhen’s Economic Core: Futian District

A preliminary spatial analysis of urban landmarks and surface temperature shows that the core of Shenzhen’s economic form is predominantly located in Futian district. Futian district serves as the central business district of Shenzhen and is characterized by a concentration of numerous commercial and office buildings. It is also notable for the spatial overlap between these areas and blocks with higher surface temperature values. It is well-developed and pedestrianized, and serves as the economic and commercial center of Shenzhen. This area has a dense concentration of different commercial elements, with a strong agglomeration effect, which is undoubtedly reflected in the data for POIs. The higher LST values correspond to the extensive concrete surfaces in Futian district, especially the numerous high-rise buildings and the large central area of the CBD. In comparison, other districts, such as Nanshan district and Bao’an district, also have a certain number of POIs and areas with higher LST [5]. However, when compared to the density and concentration in Futian district, there is still a significant difference. These areas may correspond to secondary commercial districts, but they are relatively far from being the economic center of Shenzhen. Therefore, Futian district undoubtedly demonstrates its unique position in Shenzhen’s economy through the dual identification of urban landmarks and LST. However, previous studies that focused on identifying the commercial morphology of Shenzhen through urban data have concluded that Futian district remains the most central business area in Shenzhen [8,14], highlighting a lack of forward-looking urban development planning. These studies primarily relied on traditional data sources and analytical methods of spatial analysis models, which were unable to accurately reflect the evolving trends and spatial details of the urban commercial pattern. Therefore, this study approaches the topic from a new angle, using network analysis and systemic thinking to provide a fresh exploration of this issue. Network science provides a new perspective for studying complex urban systems, allowing the characterization of interactions and correlations between different regions from a topological point of view. It provides a scientific basis for the functional planning and optimization of the commercial layout in Shenzhen.

5.2.2. Network Analysis Reveals Key Commercial Nodes’ Influence on Urban Development

To gain a deeper understanding of the development of Shenzhen’s commercial forms, methods such as node centrality and cluster analysis from network science were employed to further explore the constructed network of commercial patterns. The network nodes in this study represent the areas with the highest concentration of urban commercial clusters. This region not only exerts a commercial influence on the surrounding environment (such as employment, dining, and residential aspects), but also plays a crucial role in shaping the distribution characteristics of the urban population. Degree centrality and closeness centrality classify important commercial nodes in the city into different categories based on their magnitudes. The larger the node, the higher the degree of commercial aggregation. The more pronounced the commercial vitality in the area, the denser the surrounding supporting facilities and population aggregation. Among the commercial nodes in the city, there is not only cooperation and material exchange among them, but also mutual constraints and competition. Well-established supporting facilities at important commercial nodes create a suction effect on smaller nodes, causing underdeveloped smaller nodes in the vicinity to gradually merge into the important nodes until they disappear. In addition, the potential for small nodes to develop into larger nodes can be identified through eigenvector centrality. The spatial influence of important nodes gradually diminishes with increasing spatial distance, reducing the impact of important nodes on small nodes. This allows for the enhancement of small node development through a series of optimization strategies.
The community analysis divides the commercial nodes into three local network patterns: western region, central region, and eastern region. The basis of this pattern is the spatial connectivity between nodes, rather than the individual influence of nodes or their impact on surrounding nodes. A traditional community of urban commercial forms is typically based on planning schemes and existing business districts. As a city with government-led urban planning, Shenzhen initially focused on developing business district models around Hong Kong due to its proximity and geographical location. Luohu, Futian, and Nanshan were formed as the main economic communities. With the expansion of the city and a significant increase in population, Shenzhen’s urban land has become increasingly strained. To address this, the government has actively pursued outward expansion, using existing economic clusters as a foundation. This has resulted in the creation of the multiple economic regions we see today. The formation of these economic regions is driven not only by industrial development needs, but also by the requirement to accommodate the residential and lifestyle demands of the growing population. However, these regions still need to maintain the necessary links with the primary Luohu–Futian–Nanshan economic cluster. Consequently, many smaller nodes (economic areas) have developed organically in various locations to address local subsistence concerns.

5.2.3. The Rising Economic Power of Bao’an District

In the POI–11 network, Bao’an has the highest number of important economic nodes (Figure 7), with both degree centrality and closeness centrality exhibiting a clear dominance within the established economic regions. These core nodes are closely linked to neighboring economic nodes. They have a significant impact on other regions of Shenzhen. Bao’an district has now become the second major center of Shenzhen, and its development is having a significant impact on the city’s overall economic environment. This study collects and integrates various spatial data related to the economic and social aspects of Shenzhen, including the distribution of economic points of interest (POI) and surface temperature data. We established the spatial network among various economic elements in Shenzhen, analyzed the network structure, connectivity, etc., and identified the interaction and influence between economic elements. We assessed the economic potential and advantages of different regions in Bao’an district and identified hotspots and hub areas of economic development. Utilizing various urban data and employing techniques such as network centrality computation and machine learning, we can predict the future trends of economic development in Bao’an district. Combined with the forecast results, the distribution rules of urban economic nodes can be excavated to improve the mutual promotion and coordination between economic elements, release greater economic potential, and provide more accurate and dynamic decision-making support for regional development. Therefore, through these studies, we can comprehensively grasp the various spatial information of the Shenzhen region, deeply analyze the existing spatial network structure and operating mechanism, and predict the future trend of Bao’an district, thereby effectively guiding economic layout and policy decision making, and promoting the steady economic growth of Bao’an District. The commercial center of Bao’an district focuses on entertainment, dining, and lifestyle services, attracting a large number of consumers to visit and contributing to the rise and development of the service industry in Bao’an district. The prosperity of Bao’an district has also driven the commercial development of the surrounding areas. This has accelerated the expansion and aggregation of the western economy. Bao’an district has already established a significant presence in terms of economic activity clustering and continues to develop further. In addition, its unique geographical location and the implementation of national policies have made it a key hub in the Guangdong–Hong Kong–Macau Greater Bay Area. This has positioned Bao’an district in an extremely advantageous position amid the global industrial transfer and technological innovation wave. Supported by the eastern and western wings of the Guangdong–Hong Kong–Macau Greater Bay Area, Bao’an district is accelerating the formation of a globally oriented open industrial system and innovation ecosystem.

5.2.4. Valuable Research Focuses and Promising Directions for Further Investigation

This study demonstrates the effectiveness of these innovative methods by using network analysis and machine learning techniques to investigate the relationship between commercial POIs and LST. The successful application of these approaches highlights their potential for studying complex urban systems and provides researchers with new tools for analyzing urban spatial patterns and correlations. The network analysis and community detection techniques used to identify key commercial nodes and clustering patterns provide valuable information for predicting future urban development trends. Understanding how commercial clusters evolve over time can help anticipate shifts in economic centers, guide urban planning, and support informed policy decisions. The integration of POIs and LST data can lead to more accurate identification of commercial areas and hotspots in Shenzhen. This can inform commercial planning and development strategies, ensuring a more efficient allocation of commercial facilities, transportation, and services, benefiting both businesses and residents. The identification of Bao’an district as the rising economic power of Shenzhen’s economic form provides valuable insights for urban planners, policymakers, and researchers. Knowing the precise location of the economic center can guide the allocation of resources, infrastructure development, and investment decisions within the city.
Similar to previous research, this study identifies the Futian district as the core of Shenzhen’s economic form. The central business district status and concentration of commercial activities in the Futian district have been well-documented in previous studies. However, it provides new evidence of emerging hubs such as Bao’an. While network analysis has been used in previous research to study urban spatial patterns and correlations, this research leverages network science and integrates multiple data sources for more robust quantification of commercial structure. The use of network metrics such as centrality measures is novel compared to traditional methods such as kernel density estimation employed in prior urban planning research. This study underscores the economic rise of peripheral areas such as Bao’an. While some past studies concentrated only on established CBDs such as Futian, based on legacy hierarchies, this study focuses on Shenzhen, and the methodology and findings may have broader applicability to other cities facing similar urban development challenges. Researchers and urban planners in different cities can adapt and apply the methods presented in this study to gain a better understanding of their urban economic patterns and inform their decision-making processes.
In this study, focused on the correlation between commercial POIs and LST, other factors can influence surface temperatures. Researchers could consider incorporating additional variables, such as green spaces, built-up areas, and local weather patterns, to gain a more comprehensive understanding of the urban heat island effect and its relationship with commercial activities. Simultaneously, more advanced machine learning techniques can be applied, such as deep learning, to further improve the feature extraction and data integration capabilities. Furthermore, the network analysis can be extended using tools from graph theory to quantify subnetwork structures, resilience, vulnerability, and other topological characteristics. By considering these possible improvements or alternative approaches, researchers can enhance the robustness and applicability of the study’s findings, ultimately contributing to the advancement of the field of urban studies and sustainable urban development.
This research investigates urban economies through the development of a multidisciplinary framework integrating remote sensing, POI, machine learning, and network research. The combination of land surface temperature data and POIs provides a richer context for identifying economic areas. Network analysis quantifies the interconnectivity between economic nodes based on their spatial influence, overcoming the limitations of density-based clustering. The use of computational techniques such as machine learning facilitates robust integration of disparate datasets. Identifying the growing importance of decentralized areas such as Bao’an provides a forward-looking assessment that has been lacking in previous studies. The research provides an objective, data-driven methodology for mapping the commercial network, avoiding the biases of planning-based approaches. By revealing discrepancies between planned and emergent growth, it highlights the need for adaptive planning. As such, the developed framework helps to advance the quantitative evidence base for strategic planning in rapidly developing cities such as Shenzhen. Meanwhile, this study allows the spatio-temporal characteristics of urban commercial development to be accurately determined, providing essential guidance for commercial planning and investment.

6. Conclusions

This study used a combination of multisource urban datasets and network analysis techniques to identify and predict the commercial pattern in Shenzhen. A commercial network topology of Shenzhen was constructed using Euclidean spatial distance by integrating and fusing data from multiple channels through machine learning models. Various network analysis indicators were then applied to analyze the distribution and connectivity patterns of network nodes. In terms of data fitting, the appropriateness and generalizability of the machine learning model was ensured through repeated experiments and cross-validation. In terms of network analysis, metrics such as node centrality and network clustering were used to describe the basic layout and structural characteristics of the commercial network in Shenzhen. In addition, by identifying key nodes and patterns within the network, promising commercial types with development potential were identified. The conclusion is that the distribution of commercial POIs is generally compatible with the LST distribution, and the data fitting shows substantial correlation. However, the correlation between the two is not entirely consistent, and there are some discrepancies. This may be because many factors influence the distribution of LST. Therefore, although the commercial POIs distribution does not completely coincide with the LST distribution, there is an obvious positive correlation between the two, which is verified by data analysis. This study constructed an urban spatial network based on land surface temperature and POIs data. The centrality of the network was evaluated, and the results showed that the POI–11 network had the highest centrality. Furthermore, community analysis was used to assess the economic distribution in Shenzhen, highlighting the significant role of Bao’an District in the future economic development of the city. As a result, the existing economic distribution pattern could be improved by establishing links between important nodes and promoting the optimization of secondary nodes. The study incorporates a network analysis approach to urban morphology research to accurately explore the urban regional development, and provides relevant strategies and results for the rapidly expanding cities of developing countries and regions.

Author Contributions

Conceptualization, Z.Y. and Y.W.; methodology, Z.Y., Y.W., and Y.H.; validation, Z.Y., Y.W., and Y.H.; formal analysis, Y.W. and Y.H.; investion, Z.Y, Y.W., and Y.H.; resources, Z.Y. and Y.W.; data collection, Y.W. and Y.H.; writing—original draft preparation, Z.Y., Y.W., and Y.H.; writing—review and editing, Z.Y. and Y.W.; visualization, Z.Y., Y.W., and Y.H.; supervision, Z.Y.; project administration, Z.Y. and Y.W.; funding acquisition, Z.Y. All authors have read and agreed to the published version of the manuscript.

Funding

This research was funded by the Independent Innovation Research Fund Project of the Wuhan University of Technology: 2182022236.

Institutional Review Board Statement

Not applicable.

Informed Consent Statement

Not applicable.

Data Availability Statement

Websites with URLs are listed in the paper and that information, including the data, is publicly available.

Acknowledgments

We would like to thank the Shenzhen Planning Institute for providing road data, Gaode Company for providing urban interest point data, and NASA for providing remote sensing data. We would also want to thank the School of Engineering and Architecture of WUT and the School of Architecture and Urban Planning of HUST for their support.

Conflicts of Interest

The authors declare no conflict of interest.

References

  1. de Amorim, W.S. Pandemics, global risks and adaptation: Challenges for a changing world. Res. Glob. 2020, 2, 100023. [Google Scholar]
  2. Chen, G.; Li, X.; Liu, X.; Chen, Y.; Liang, X.; Leng, J.; Xu, X.; Liao, W.; Qiu, Y.; Wu, Q.; et al. Global projections of future urban land expansion under shared socioeconomic pathways. Nat. Commun. 2020, 11, 537. [Google Scholar] [CrossRef] [Green Version]
  3. Mahtta, R.; Fragkias, M.; Güneralp, B.; Mahendra, A.; Reba, M.; Wentz, E.A.; Seto, K.C. Urban land expansion: The role of population and economic growth for 300+ cities. Npj Urban Sustain. 2022, 2, e23777. [Google Scholar]
  4. Yuan, J.; Chen, K.; Li, W.; Ji, C.; Wang, Z.; Skibniewski, M.J. Social network analysis for social risks of construction projects in high-density urban areas in China. J. Clean. Prod. 2018, 198, 940–961. [Google Scholar]
  5. Bulanda-Jansen, A. Evolution of The Metropolitan Area of Shenzhen, Analysis: From Theory to Selected Examples. IOP Conf. Ser. Mater. Sci. Eng. 2019, 471, 112058. [Google Scholar]
  6. Hui, E.C.; Li, X.; Chen, T.; Lang, W. Deciphering the spatial structure of China’s megacity region: A new bay area—The Guangdong-Hong Kong-Macao Greater Bay Area in the making. Cities 2020, 105, 102168. [Google Scholar] [CrossRef]
  7. You, H. Characterizing the inequalities in urban public green space provision in Shenzhen, China. Habitat Int. 2016, 56, 176–180. [Google Scholar] [CrossRef]
  8. Peng, J.; Jia, J.; Liu, Y.; Li, H.; Wu, J. Seasonal contrast of the dominant factors for spatial distribution of land surface temperature in urban areas. Remote Sens. Environ. 2018, 215, 255–267. [Google Scholar]
  9. Lai, Y.; Tang, B.; Chen, X.; Zheng, X. Spatial determinants of land redevelopment in the urban renewal processes in Shenzhen, China. Land Use Policy 2021, 103, 105330. [Google Scholar] [CrossRef]
  10. Tu, W.; Zhu, T.; Xia, J.; Zhou, Y.; Lai, Y.; Jiang, J.; Li, Q. Portraying the spatial dynamics of urban vibrancy using multisource urban big data. Comput. Environ. Urban Syst. 2020, 80, 101428. [Google Scholar] [CrossRef]
  11. Chen, M.; Zhou, Y.; Hu, M.; Zhou, Y. Influence of Urban Scale and Urban Expansion on the Urban Heat Island Effect in Metropolitan Areas: Case Study of Beijing–Tianjin–Hebei Urban Agglomeration. Remote Sens. 2020, 12, 3491. [Google Scholar] [CrossRef]
  12. Gao, Y.; Zhao, J.; Han, L. Exploring the spatial heterogeneity of urban heat island effect and its relationship to block morphology with the geographically weighted regression model. Sustain. Cities Soc. 2022, 76, 103431. [Google Scholar] [CrossRef]
  13. Ke, X.; Men, H.; Zhou, T.; Li, Z.; Zhu, F. Variance of the impact of urban green space on the urban heat island effect among different urban functional zones: A case study in Wuhan. Urban For. Urban Green. 2021, 62, 127159. [Google Scholar] [CrossRef]
  14. Wang, W.; Liu, K.; Tang, R.; Wang, S. Remote sensing image-based analysis of the urban heat island effect in Shenzhen, China. Phys. Chem. Earth Parts A/B/C 2019, 110, 168–175. [Google Scholar] [CrossRef]
  15. Li, H.; Zhou, Y.; Li, X.; Meng, L.; Wang, X.; Wu, S.; Sodoudi, S. A new method to quantify surface urban heat island intensity. Sci. Total Environ. 2018, 624, 262–272. [Google Scholar] [PubMed]
  16. Ma, Y.; Zhang, S.; Yang, K.; Li, M. Influence of spatiotemporal pattern changes of impervious surface of urban megaregion on thermal environment: A case study of the Guangdong – Hong Kong – Macao Greater Bay Area of China. Ecol. Indic. 2021, 121, 107106. [Google Scholar] [CrossRef]
  17. Schwarz, N.; Lautenbach, S.; Seppelt, R. Exploring indicators for quantifying surface urban heat islands of European cities with MODIS land surface temperatures. Remote Sens. Environ. 2011, 115, 3175–3186. [Google Scholar] [CrossRef]
  18. Qin, Z.; Karnieli, A.; Berliner, P. Derivation of split window algorithm and its sensitivity analysis for retrieving land surface temperature from NOAA-advanced very high resolution radiometer data. J. Geophys. Res. 2001, 106, 22655–22670. [Google Scholar]
  19. Xu, Y.; Qin, Z.; Liu, Y. A Semi-Empirical Split-Window Algorithm for Retrieving near Surface Air Temperature from MODIS Data. Can. J. Remote Sens. 2019, 45, 733–745. [Google Scholar] [CrossRef]
  20. Hu, L.; Brunsell, N.A. The impact of temporal aggregation of land surface temperature data for surface urban heat island (SUHI) monitoring. Remote Sens. Environ. 2013, 134, 162–174. [Google Scholar]
  21. Song, Y.; Long, Y.; Wu, P.; Wang, X. Are all cities with similar urban form or not? Redefining cities with ubiquitous points of interest and evaluating them with indicators at city and block levels in China. Int. J. Geogr. Inf. Sci. 2018, 32, 2447–2476. [Google Scholar] [CrossRef]
  22. Li, D.; Liu, J. Uncovering the relationship between point-of-interests-related human mobility and socioeconomic status. Telemat. Inform. 2019, 39, 49–63. [Google Scholar] [CrossRef]
  23. Liu, L.; Xia, B.; Wu, H.; Zhao, J.; Peng, Z.; Yu, Y. Delimitating the Natural City with Points of Interests Based on Service Area and Maximum Entropy Method. Entropy 2019, 21, 458. [Google Scholar] [CrossRef] [PubMed]
  24. Zhang, S.; Liu, X.; Tang, J.; Cheng, S.; Wang, Y. Urban spatial structure and travel patterns: Analysis of workday and holiday travel using inhomogeneous Poisson point process models. Comput. Environ. Urban Syst. 2019, 73, 68–84. [Google Scholar] [CrossRef]
  25. Andrade, R.; Alves, A.; Bento, C. POI Mining for Land Use Classification: A Case Study. ISPRS Int. J. Geo-Inf. 2020, 9, 493. [Google Scholar] [CrossRef]
  26. Sparks, K.; Thakur, G.; Pasarkar, A.; Urban, M. A global analysis of cities’ geosocial temporal signatures for points of interest hours of operation. Int. J. Geogr. Inf. Sci. 2020, 34, 759–776. [Google Scholar] [CrossRef] [Green Version]
  27. King, T.L.; Bentley, R.J.; Thornton, L.E.; Kavanagh, A.M. Using kernel density estimation to understand the influence of neighbourhood destinations on BMI. BMJ Open 2016, 6, e008878. [Google Scholar] [CrossRef] [Green Version]
  28. Zhang, J.; Sui, X.; He, X. Research on the Simulation Application of Data Mining in Urban Spatial Structure. J. Adv. Transp. 2020, 2020, 8863363. [Google Scholar] [CrossRef]
  29. Wei, S.; Wang, L. Community detection, road importance assessment, and urban function pattern recognition: A big data approach. J. Spat. Sci. 2021, 96, 1–21. [Google Scholar] [CrossRef]
  30. Lv, Y.; Zhou, L.; Yao, G.; Zheng, X. Detecting the true urban polycentric pattern of Chinese cities in morphological dimensions: A multiscale analysis based on geospatial big data. Cities 2021, 116, 103298. [Google Scholar] [CrossRef]
  31. Giglio, S.; Bertacchini, F.; Bilotta, E.; Pantano, P. Machine learning and points of interest: Typical tourist Italian cities. Curr. Issues Tour. 2020, 23, 1646–1658. [Google Scholar] [CrossRef]
  32. Barabasi, A.L. Network Science; Cambridge University Press: Cambridge, UK, 2016. [Google Scholar]
  33. Newman, M.E.J. Networks, 2nd ed.; Oxford University Press: Oxford, UK, 2018. [Google Scholar]
  34. Dey, N.; Borah, S.; Babo, R.; Ashour, A.S. Social Network Analytics: Computational Research Methods and Techniques/Nilanjan Dey, Samarjeet Borah, Rosalina Babo, Amira S. Ashour; Academic Press: London, UK, 2019. [Google Scholar]
  35. Zhang, Z.; Zhang, Y.; He, T.; Xiao, R. Urban Vitality and its Influencing Factors: Comparative Analysis Based on Taxi Trajectory Data. IEEE J. Sel. Top. Appl. Earth Obs. Remote Sens. 2022, 15, 5102–5114. [Google Scholar] [CrossRef]
  36. Chen, Y.; Yang, J.; Yang, R.; Xiao, X.; Xia, J.C. Contribution of urban functional zones to the spatial distribution of urban thermal environment. Build. Environ. 2022, 216, 109000. [Google Scholar] [CrossRef]
  37. Ding, R.; Ujang, N.; Hamid, H.B.; Manan, M.S.A.; Li, R.; Albadareen, S.S.M.; Nochian, A.; Wu, J. Application of Complex Networks Theory in Urban Traffic Network Researches. Netw. Spat. Econ. 2019, 19, 1281–1317. [Google Scholar] [CrossRef]
  38. Chen, Z.; Liu, Y.; Feng, W.; Li, Y.; Li, L. Study on spatial tropism distribution of rural settlements in the Loess Hilly and Gully Region based on natural factors and traffic accessibility. J. Rural Stud. 2022, 93, 441–448. [Google Scholar] [CrossRef]
  39. Yin, S.; Liu, J.; Han, Z. Relationship between urban morphology and land surface temperature—A case study of Nanjing City. PLoS ONE 2022, 17, e0260205. [Google Scholar] [CrossRef] [PubMed]
  40. Zhou, N. Research on urban spatial structure based on the dual constraints of geographic environment and POI big data. J. King Saud Univ.-Sci. 2022, 34, 101887. [Google Scholar] [CrossRef]
  41. Zhang, M.; Lan, B. Detect Megaregional Communities Using Network Science Analytics. Urban Sci. 2022, 6, 12. [Google Scholar]
  42. Gan, C.; Voda, M.; Wang, K.; Chen, L.; Ye, J. Spatial network structure of the tourism economy in urban agglomeration: A social network analysis. J. Hosp. Tour. Manag. 2021, 47, 124–133. [Google Scholar]
  43. AlFaiz, M.Z.; Ibrahim, A.A.; Hadi, S.M. The effect of Z-Score standardization (normalization) on binary input due the speed of learning in back-propagation neural network. Iraqi J. Inf. Commun. Technol. 2019, 1, 42–48. [Google Scholar]
Figure 1. Overall study of the technical framework.
Sustainability 15 11857 g001
Figure 2. The scope of this research: Shenzhen.
Sustainability 15 11857 g002
Figure 3. The heat map distribution of POI and LST. (a1) Data collection of POI. (a2) Kernel density distribution of POI in Shenzhen. (b1) Inversion of daily average LST. (b2) Inversion of monthly average LST.
Sustainability 15 11857 g003
Figure 4. Correlation analysis and data inference between POI and LST.
Sustainability 15 11857 g004
Figure 5. Distribution statistics of network indicators.
Sustainability 15 11857 g005
Figure 6. The POI–11 Network level node distribution and association division.
Sustainability 15 11857 g006
Figure 7. The POI–11 network centrality core node statistics.
Sustainability 15 11857 g007
Table 1. Various issues faced by urban land development in Shenzhen.
Study of the ProblemProblem Description
Special Features of ShenzhenAs the most economically robust and outwardly open city among inland cities in the Greater Bay Area, Shenzhen plays an undeniable and positive role in promoting the overall development of the entire bay area through its transportation network, population mobility, and economic growth [6].
Public resources and land use issuesIt has been observed that the quality of public green space is worse in wealthier neighborhoods, while the neighborhoods facing housing problems enjoy high-quality public green space. The accessibility of public green space is more limited in communities facing socioeconomic disadvantage [7].
Land development with urban heat islandsExcessive land development has a significant impact on the urban heat island effect, resulting in an increase in urban surface temperature [8].
Urban vitality and land useThe research utilizing urban big data and urban analysis methods reveals the relationship between urban vitality and land use development in Shenzhen [10].
Table 2. Case studies that have already been conducted.
Research ContentCase Study Interpretation
Urban vitalityUrban vitality is examined through the use of LST and POI [35].
Urban functional area identificationPOI and LST data are used to identify urban functional areas [36].
Case studiesA case study on the city was conducted using POI data and LST [39].
Urban multi-center identificationMulti-center identification of cities based on POI big data [40].
Network constructionUrban science and greater regions constructed a network with county centroids as nodes and direct links between each pair of counties as edges, capturing spatial interactions [41].
Network analysisUsing network analysis to examine the relevant characteristics of the spatial network structure of the tourism economy [42].
Table 3. Urban multivariate data preprocessing.
Formula Coefficient Description
T s = A 0 + A 1 T 31 A 2 T 32 (1) T S is the LST, T 31 and T 32 are the brightness temperatures of the 31st and 32nd bands of MODIS, and A 0 , A 1 , and A 2 are the parameters of the split-window algorithm.
n x = 1 n h i = 1 n K x X i h (2)K is the kernel function, h is the search radius, x is the location of the POI, the specific area in the space of POI formed by X i a circle center, and n is the number of sample points.
z = x μ 1 N i = 1 N x i μ 2 (3)x is the variable-name value. μ is the mean value.
d = i = 1 N p l x i y i 2 (4) x i and y i represent the coordinates of node i, respectively.
Table 4. The network analysis index.
NameFormula Coefficient Description
Degree Centrality( C D i ) C D i = j = 1 n A i j j i i j (5)The local connectivity relationships around vertices [32].
Closeness centrality( C C i ) C C i = n 1 j = 1 : j i n d v i , v j (6)A centrality measure based on the distance between nodes [32].
Eigenvector centrality( E C ) E C i t = j = 1 n A i j u j t 1 i = 1 , . . . , n (7)Calculate the transmission of node impact and measure the effect of nodes in the network [33].
Community( C O M ) C O M i = 1 2 L i j A i j k i k j 2 L δ g i g j (8)The ability to find clusters in a network, revealing structure and organization within networks at a scale more significant than that of a single node or a few nodes [34].
Table 5. The numerical statistics for various indexes of the network.
Average MonthNetwork Indicators
Degree Centrality ( D C )Closeness Centrality ( C C )Eigenvector Centrality ( E C )
83320.5961685.430971
102900.5597675.47392
113160.6005665.601139
123600.5906375.419892
Disclaimer/Publisher’s Note: The statements, opinions and data contained in all publications are solely those of the individual author(s) and contributor(s) and not of MDPI and/or the editor(s). MDPI and/or the editor(s) disclaim responsibility for any injury to people or property resulting from any ideas, methods, instructions or products referred to in the content.

