1. Introduction
When waves propagate through soil during cyclic loading, complex mechanisms contribute to the loss of energy in the material. Fluid flow loss and inelastic friction loss are mainly responsible for energy dissipation in soil [
1]. The dominant mechanism depends on the strain level and nonlinear behavior of soil. The damping ratio describes energy dissipation in a system. This parameter plays an important role when modeling dynamic geotechnical and structural problems (e.g., soil response analysis and soil–structure interaction problems). Thus, a substantial effort has been made in the last few decades to introduce experimental dynamic laboratory procedures and in situ methods to study the damping behavior of soils for a wide range of shear strain amplitudes. Resonant Column (RC) and Torsional Simple Shear (TOSS) tests have been developed and improved to measure the damping ratio with reasonable accuracy. The effects of various soil parameters on damping have been further investigated over the years. The most impactful factors are the void ratio, confining pressure, particle shape, and number of loading cycles [
2,
3,
4].
Damping in materials may take several forms. In soils, geotechnical engineers are mostly concerned with hysteretic and viscous damping, which are proportional to displacement and velocity, respectively. While vibration frequency affects viscous damping, it seems to have no impact on the hysteretic damping. These two forms of damping are results of distinct mechanisms.
Soils have a tendency to dissipate energy even when subjected to low levels of strain [
5]. Soils loaded cyclically below the linear strain threshold (
) exhibit an elastic behavior. Hysteresis loops do not generate at strain amplitudes lower than that threshold. According to Kokusho [
6], damping is a consequence of the fluids present in the voids, suggesting that the loss of fluid (viscous damping) is the main mechanism behind the soil’s damping at small strain levels (below
). Conversely, beyond
, the shear stress–strain curves start to form hysteresis loops when soil is cyclically loaded. This is attributed to the nonlinear behavior of soil at higher strains. A rise in hysteretic damping is observed as the strain amplitude increases, and most of the energy dissipation is a result of inelastic friction. Thus, viscous damping is marginal, and the nature of damping is hysteretic [
7,
8].
Resonant column testing typically involves two distinct methods for measuring the damping of materials: The Steady-State Vibration (SSV) and the Free Vibration Decay (FVD) [
9,
10]. Several studies compared these two methods and provided suggestions on their scopes and limitations [
11,
12,
13]. However, the unique design of the RC-TOSS device used in this study allows for conducting both tests on the same sample. This feature provided an accurate comparison between the three methods of measuring the damping ratio. These three methods are the SSV, FVD, and the method of calculating the damping ratio from the hysteretic loops generated in the TOSS test. This eliminates any potential effect of sample preparation on the results, which facilitates a more precise comparison. Since the damping ratio of soil influences the dynamic response of structures, a better understanding and more accurate estimation of the damping ratio can lead to a reduction in the structural demands and potentially increase the safety and resilience of the design. This can contribute to the long-term sustainability of the structure by preventing or minimizing damage.
2. Testing Device, Materials, and Methods
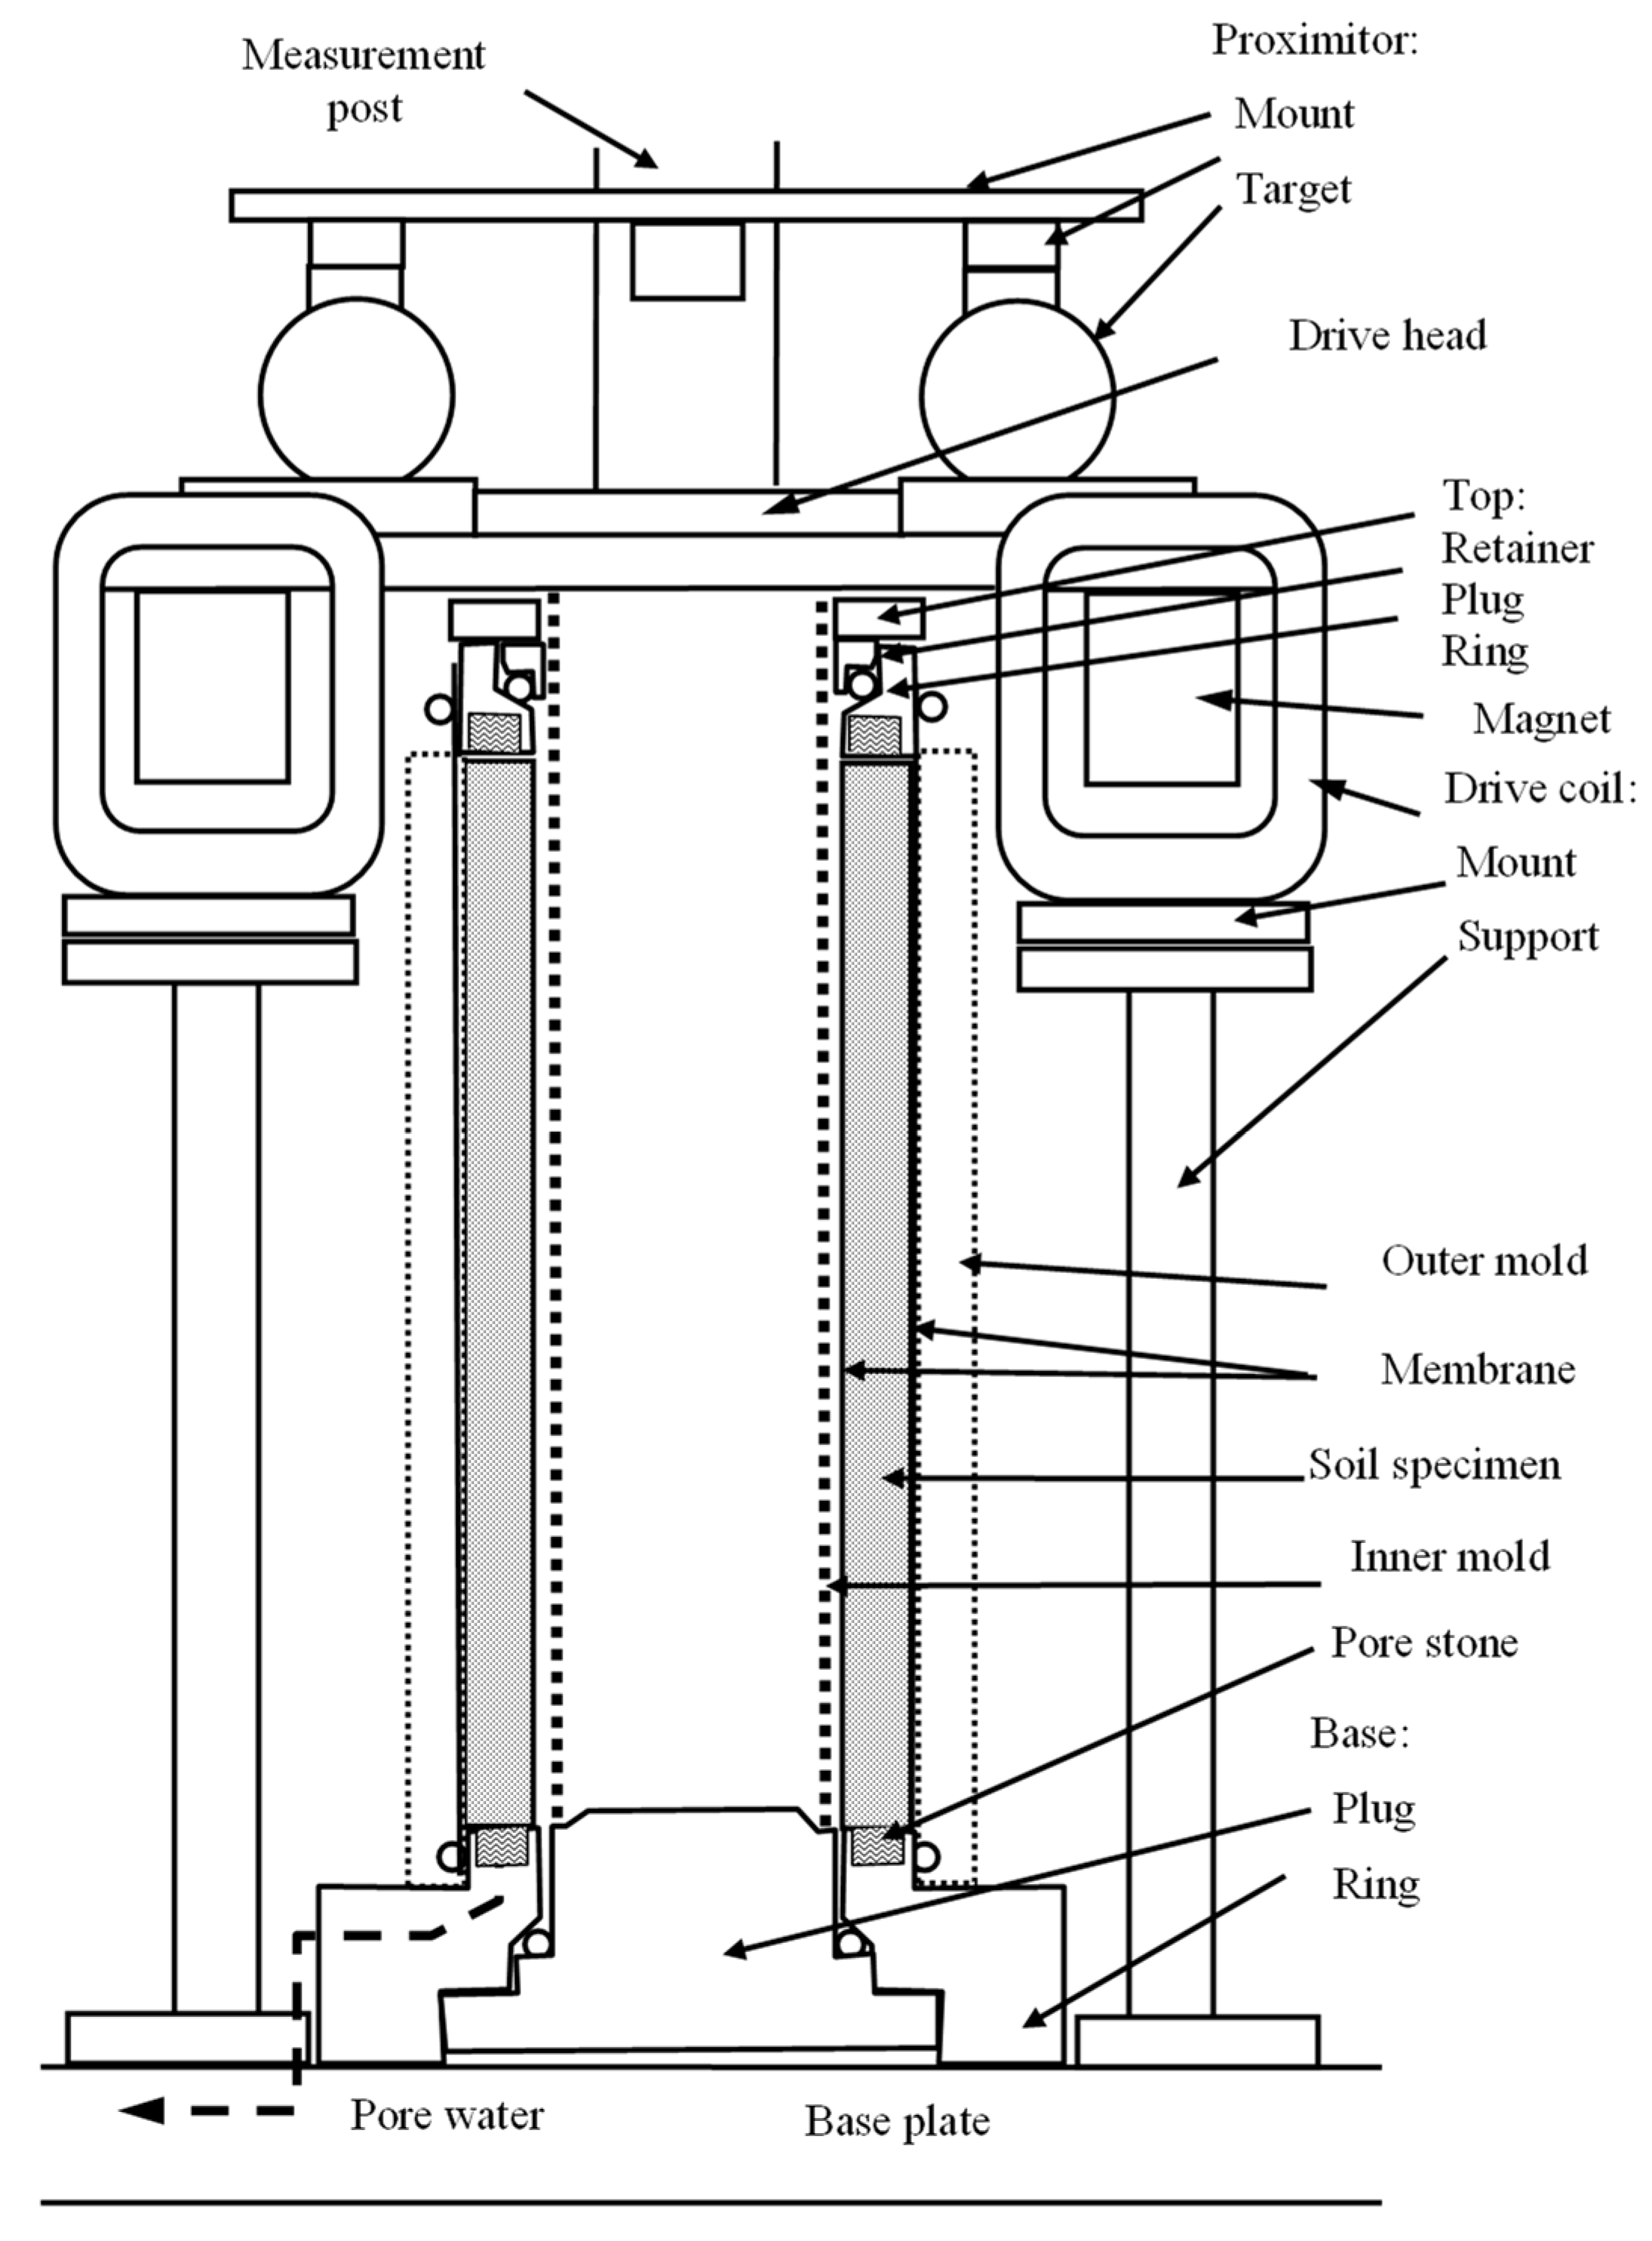
Hollow, cylindrical soil samples were tested using a combined Resonant Column-Torsional Simple Shear device (RC-TOSS). The samples have an outer diameter of 6 cm, an inner diameter of 4 cm, and a height of 14 cm. A drive head applies torsional loading on the top of the sample (the free end), while the bottom of the specimen is fixed, as shown in
Figure 1. The drive system consists of a set of two magnets inserted inside four coils. Two proximitors are fixed on the measurement post to measure the gap between the sensors and targets attached to the specimen. The difference between the two gaps gives the rotation from which the shear strain is found at each loading step. Torque is calculated from the known current passing through the coils during the test. The RC test requires displacement measurements with very high accuracy at very low amplitude (
= 10
−4%). An accelerometer mounted on the drive head provides such accurate measurements. A multimeter and an oscilloscope read and record the response curve, resonance frequency, and decaying response of the sample. The device is capable of conducting RC and TOSS tests on the same sample. A detailed description of the device and the methods of calibration are present in [
3,
14].
Three different types of Danube sands were selected for testing. Samples A and B retained a very low percentage of fines, while the fine content for sample C was 21.11%. The soil comprised fluvial sediments of the Danube River, extracted from a location near the channel of the river. The particles were sub-angular to rounded. The properties of the samples are shown in
Table 1.
A vacuum applied a confining pressure of 97 KPa on the tested samples. The preparation of dense specimens was performed via the pluviation method. The soil was poured slowly from a height of 50 cm to achieve the thinnest thread of soil possible. On the other hand, to prepare samples in a loose state, the dry filling with tamping method was applied. Dry soil was poured through a glass funnel with a 14 cm spout into the mold. Pouring started with the spout touching the base ring, and then the spout was constantly and carefully raised and moved around to touch the surface of the soil. The testing plan appears in
Table 2.
2.1. Damping in the Torsional Simple Shear Device
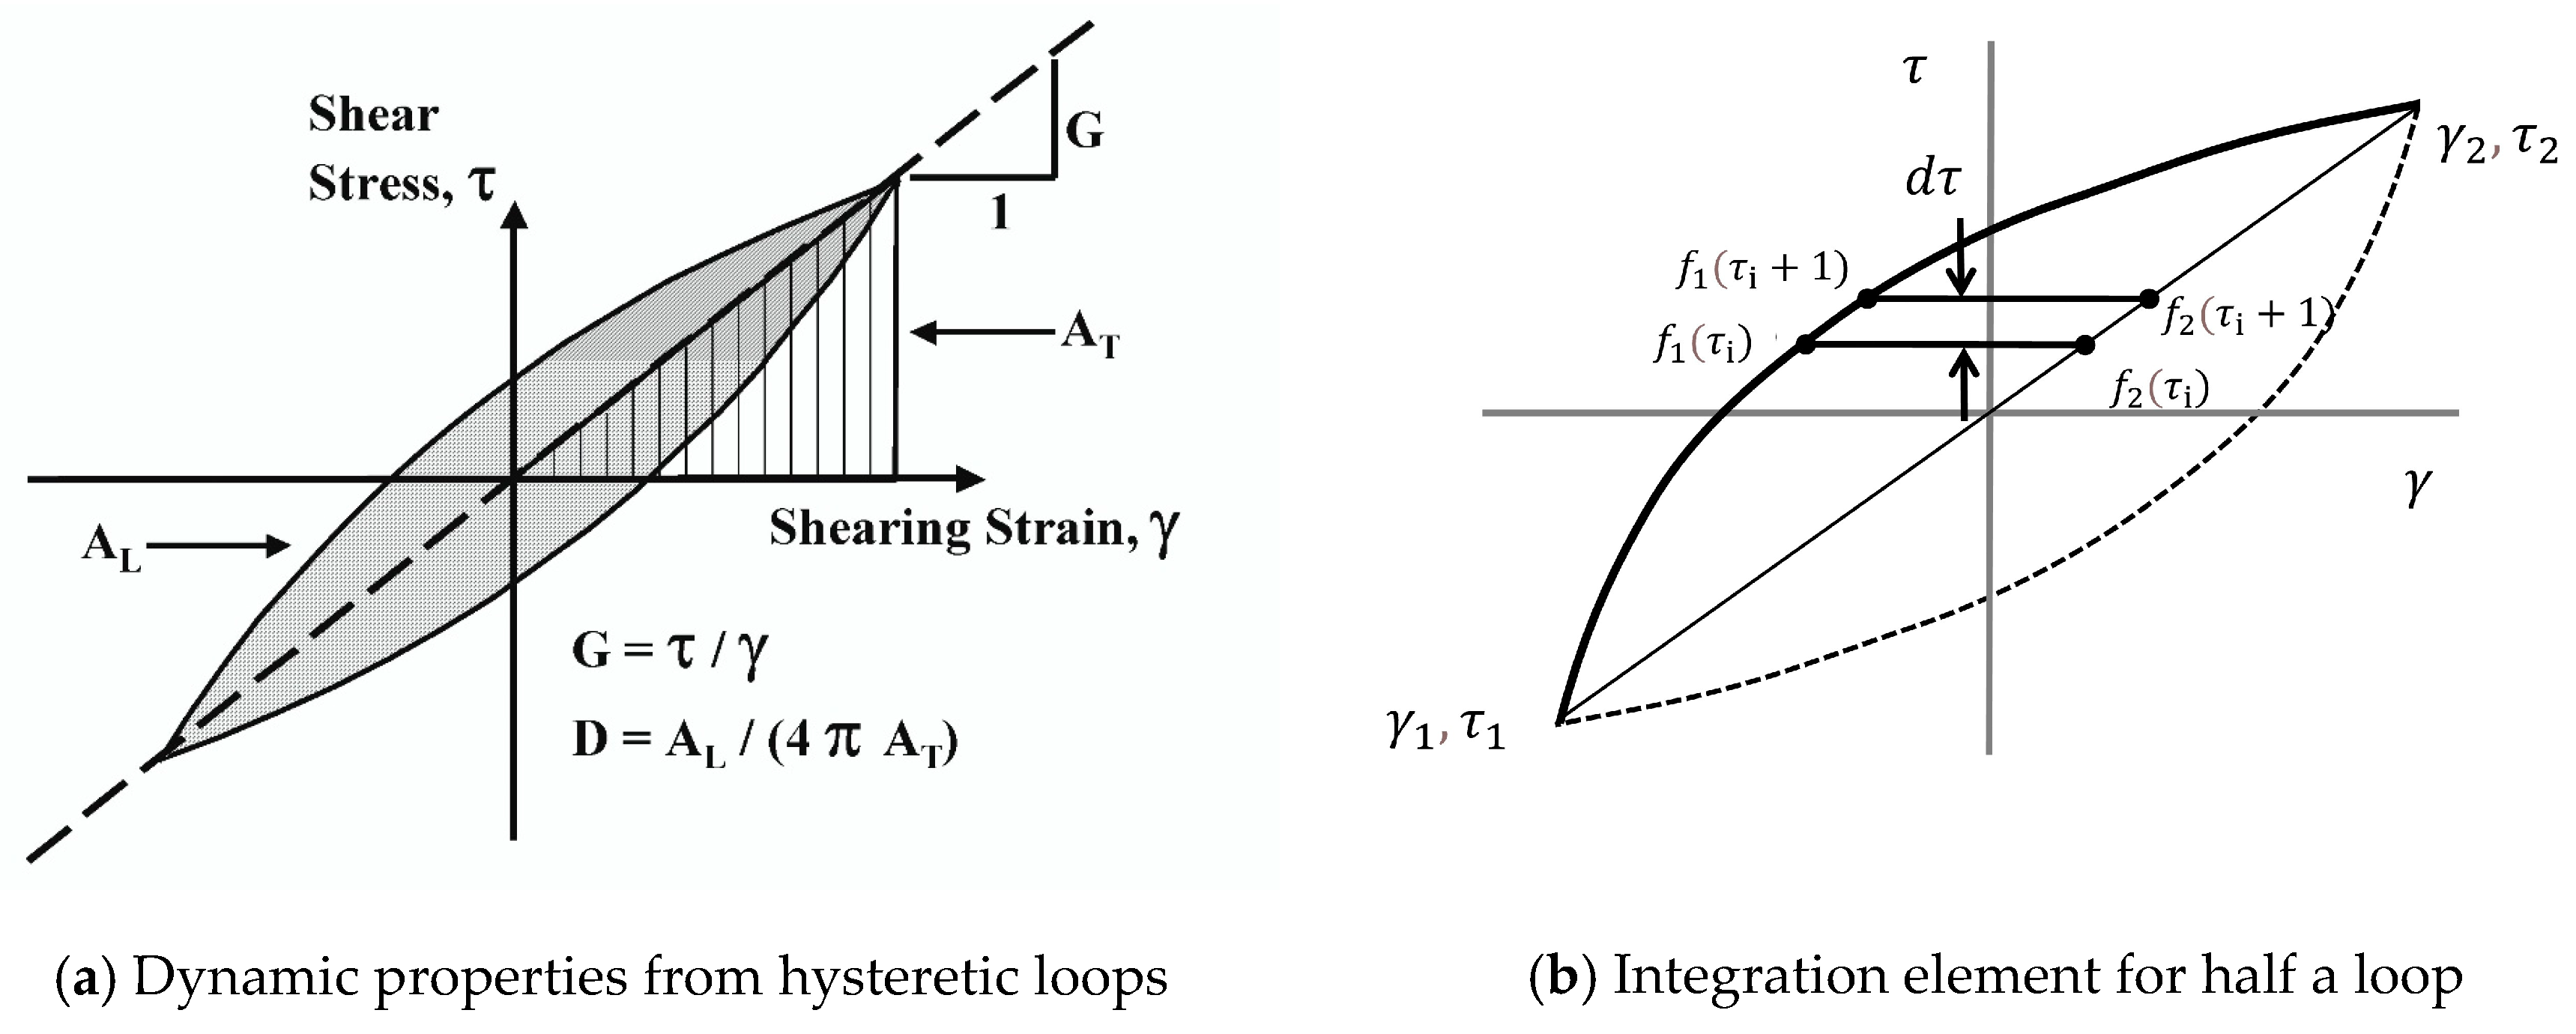
Around load reversal points throughout cyclic torsional loading, the soil recovers its stiffness due to the reengagement and interlocking of the previously slipped contacts between particles in the opposite direction. The shear stress–strain path forms a hysteresis loop as demonstrated in
Figure 2a. The gradient of the straight line that joins the endpoints of the hysteresis loop indicates the typical level of shear stiffness exhibited by the soil, which is also referred to as the secant shear modulus (
Gsec). Although soil damping is recognized to be hysteretic in nature, it is commonly substituted with equivalent viscous damping in most analyses for the sake of mathematical convenience. “The equivalent viscous damping is determined in such a manner as to yield the same dissipation of energy per cycle as that produced by the actual damping mechanism” [
15]. The damping ratio (
D) represents the ratio of the energy absorbed in one cycle of vibration to the potential energy at maximum displacement in that cycle [
16]. The following equation calculates the equivalent damping ratio
D:
where
AL is the area of the loop (shadowed in
Figure 2a) and
AT is the area of the triangle bounded by a straight line defining the secant modulus at the point of maximum strain (
Figure 2a).
Subroutines in Visual Basic for Applications (VBA) in Excel were created to calculate the area between the loop and line that connects its two ends. The subroutine divides this area into very small slices that can be considered trapezoids (
Figure 2b). The sum of the areas multiplied by two denotes
AL in Equation (1).
The proximitors incorporated in the TOSS test have low accuracy compared to the accelerometer measurements in the RC test. Therefore, TOSS tests in this study allow for damping ratio measurements at strain amplitudes above 0.02%.
2.2. Damping in the Resonant Column Device
2.2.1. The Free Vibration Decay Method (FVD)
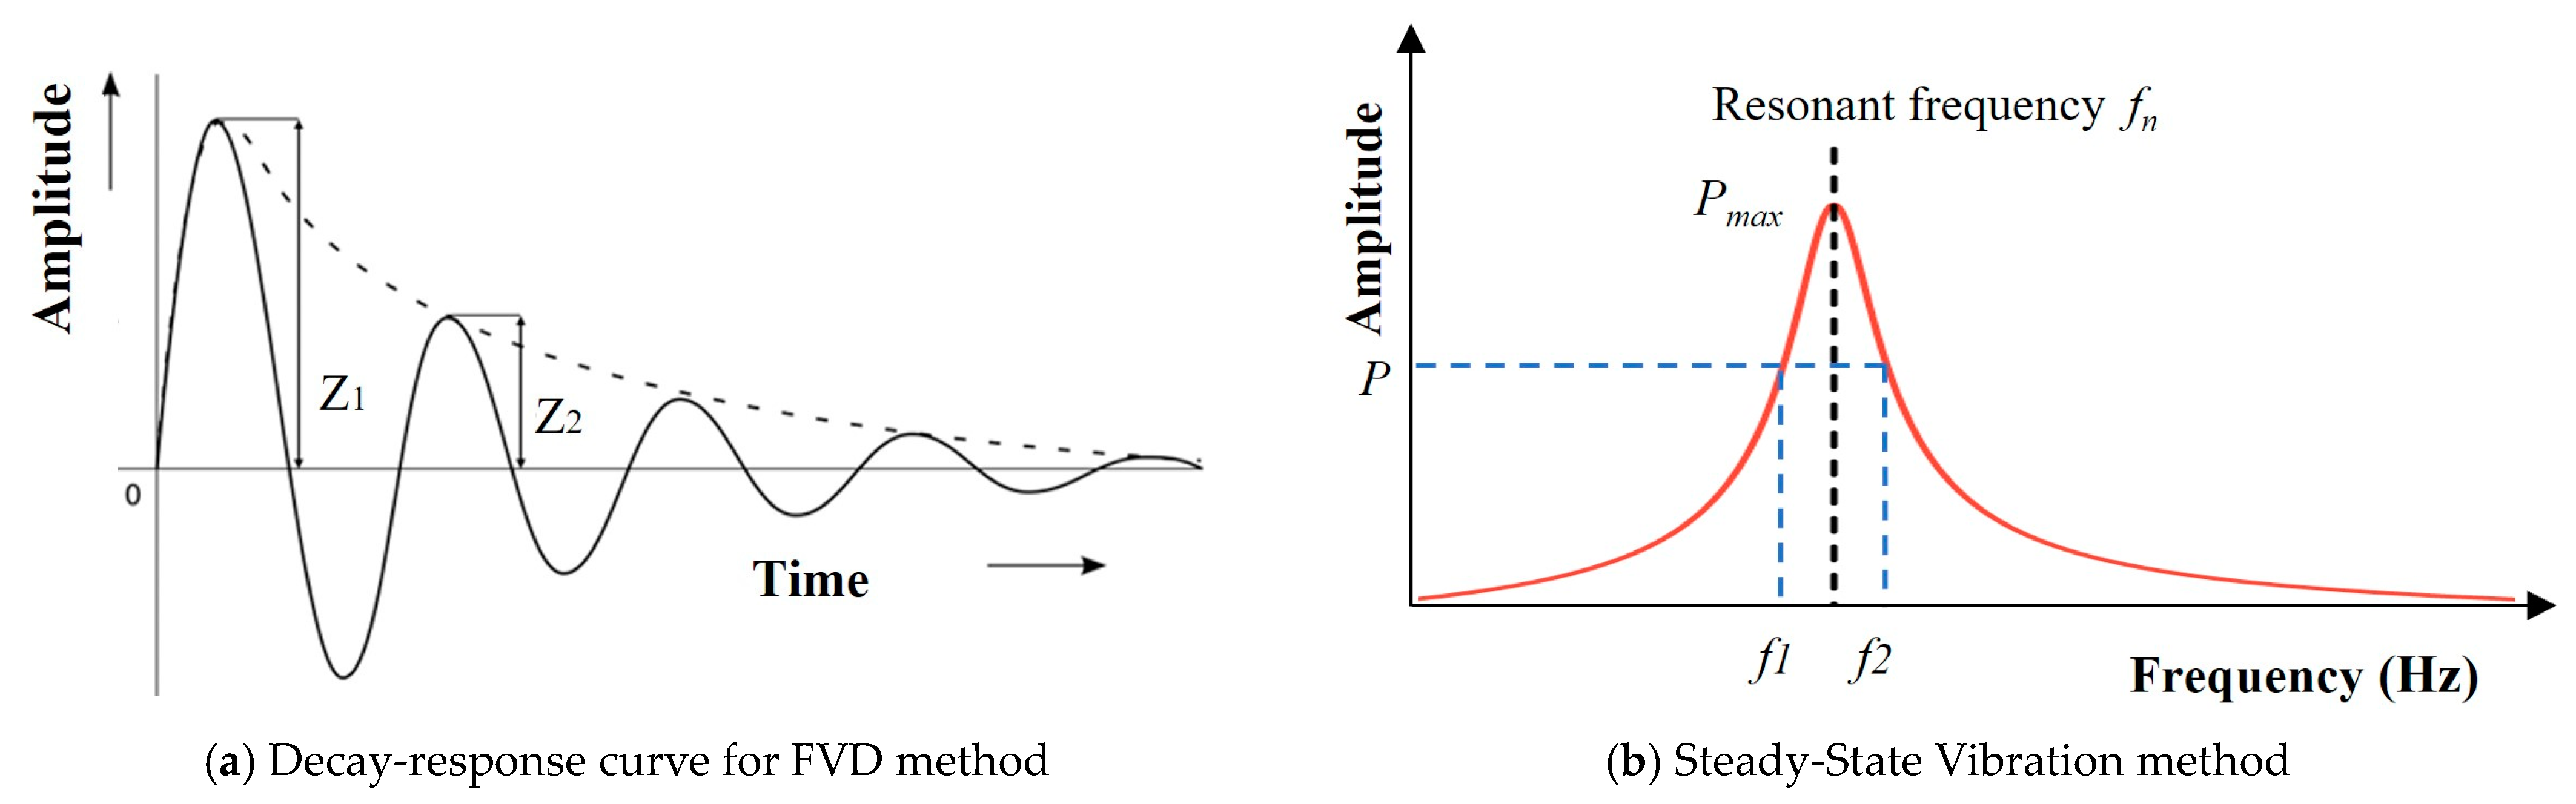
The resonant column test starts by applying a torsional oscillation on the top of the specimen with an increasing amplitude sine wave. For each tested strain amplitude, the frequency progressively increases to obtain the dynamic response of the specimen. The frequency that corresponds to the maximum response amplitude is the resonance frequency of the sample. The dynamic shear modulus is a function of the fundamental frequency based on wave propagation and elasticity theories. Once the operator finds the resonance frequency, they cut the power and track the decaying response on a storage oscilloscope. A multimeter records the decaying curve on an Excel sheet where damping is determined from the logarithmic decrement equation [
5]:
where
δ is the logarithmic decrement,
N is the number of cycles,
Z1 is the first amplitude,
Z1+N is the amplitude after
N cycles (
Figure 3a), and
D is the damping ratio.
For small values of the damping ratio, as found in soil,
, the damping expression becomes:
Ray [
14] suggests using a small number of cycles (
N) when driving at high amplitude. A larger
N would cause a reduction in strain amplitude by a factor of about 3 over the measurement interval. ASTM D4015 [
17] recommends the use of less than 10 cycles. Mog and Anbazhagan [
13] conducted resonant column tests using the GCTS device to investigate the effect of the number of successive cycles (
N) used in measuring the damping ratio. They observed an increase in the damping ratio when increasing the number of cycles up to 10 cycles. Nonetheless, beyond 10 cycles, the damping ratio starts to decrease for a higher number of cycles in the measurements (i.e., for 20, 30, and 50 cycles). Damping ratio measurements determined by this method scatter significantly. Therefore, 2 or 3 successive cycles in the decay response curve should determine the damping ratio in the RC test.
2.2.2. The Steady-State Vibration Method (SSV)
Initially, the SSV method (also termed the half-power bandwidth method) was created to calculate the modal damping ratio (ξ) of a structure by measuring the width of peaks in its frequency response function. However, it could be used to measure the damping ratio of soil during the RC test. In this technique, the width of the frequency-response curve near the resonance determines the logarithmic decrement (
δ). The half-power bandwidth (∆ω) is the width of the peak where the magnitude of the frequency corresponds to
[
18]. Equation (4) determines
(GCTS-CATS, 2007):
where
f1 and
f2 are frequencies below and above the resonance where the strain amplitude is
P,
Pmax is the maximum amplitude (or resonant amplitude), and
fr is the resonant frequency (
Figure 3b).
Since the damping in soils is small and the amplitude
P is
, Equation (4) becomes:
Then, the damping ratio can be expressed as:
According to Mog and Anbazhagan [
13], at strain levels below 0.005%, there can be a variation of up to 15% in the damping ratio when measured using the SSV method and FVD method with two consecutive cycles. However, the variation can be even greater (up to 50%) when a higher number of successive cycles (3, 7, and 10 cycles) are used. These results agree with Senetakis et al. [
11] where a scatter of 15% was also reported. The ambient noise and the number of applied cycles during the RC test justify this scatter. A much higher number of cycles is needed in the SSV method to plot the frequency-response curve [
19].
3. Results and Discussions
Every test starts with very small strain RC measurements to obtain the maximum shear modulus (
Gmax) and minimum damping ratio (
Dmin). The RC tests continue with ascending strain amplitudes up to the volumetric-threshold shearing strain (
), which is around 0.01% for sand. Below
, the behavior is nonlinear but still elastic and there is no effect of the cyclic loading on the dynamic behavior of soil [
3,
20,
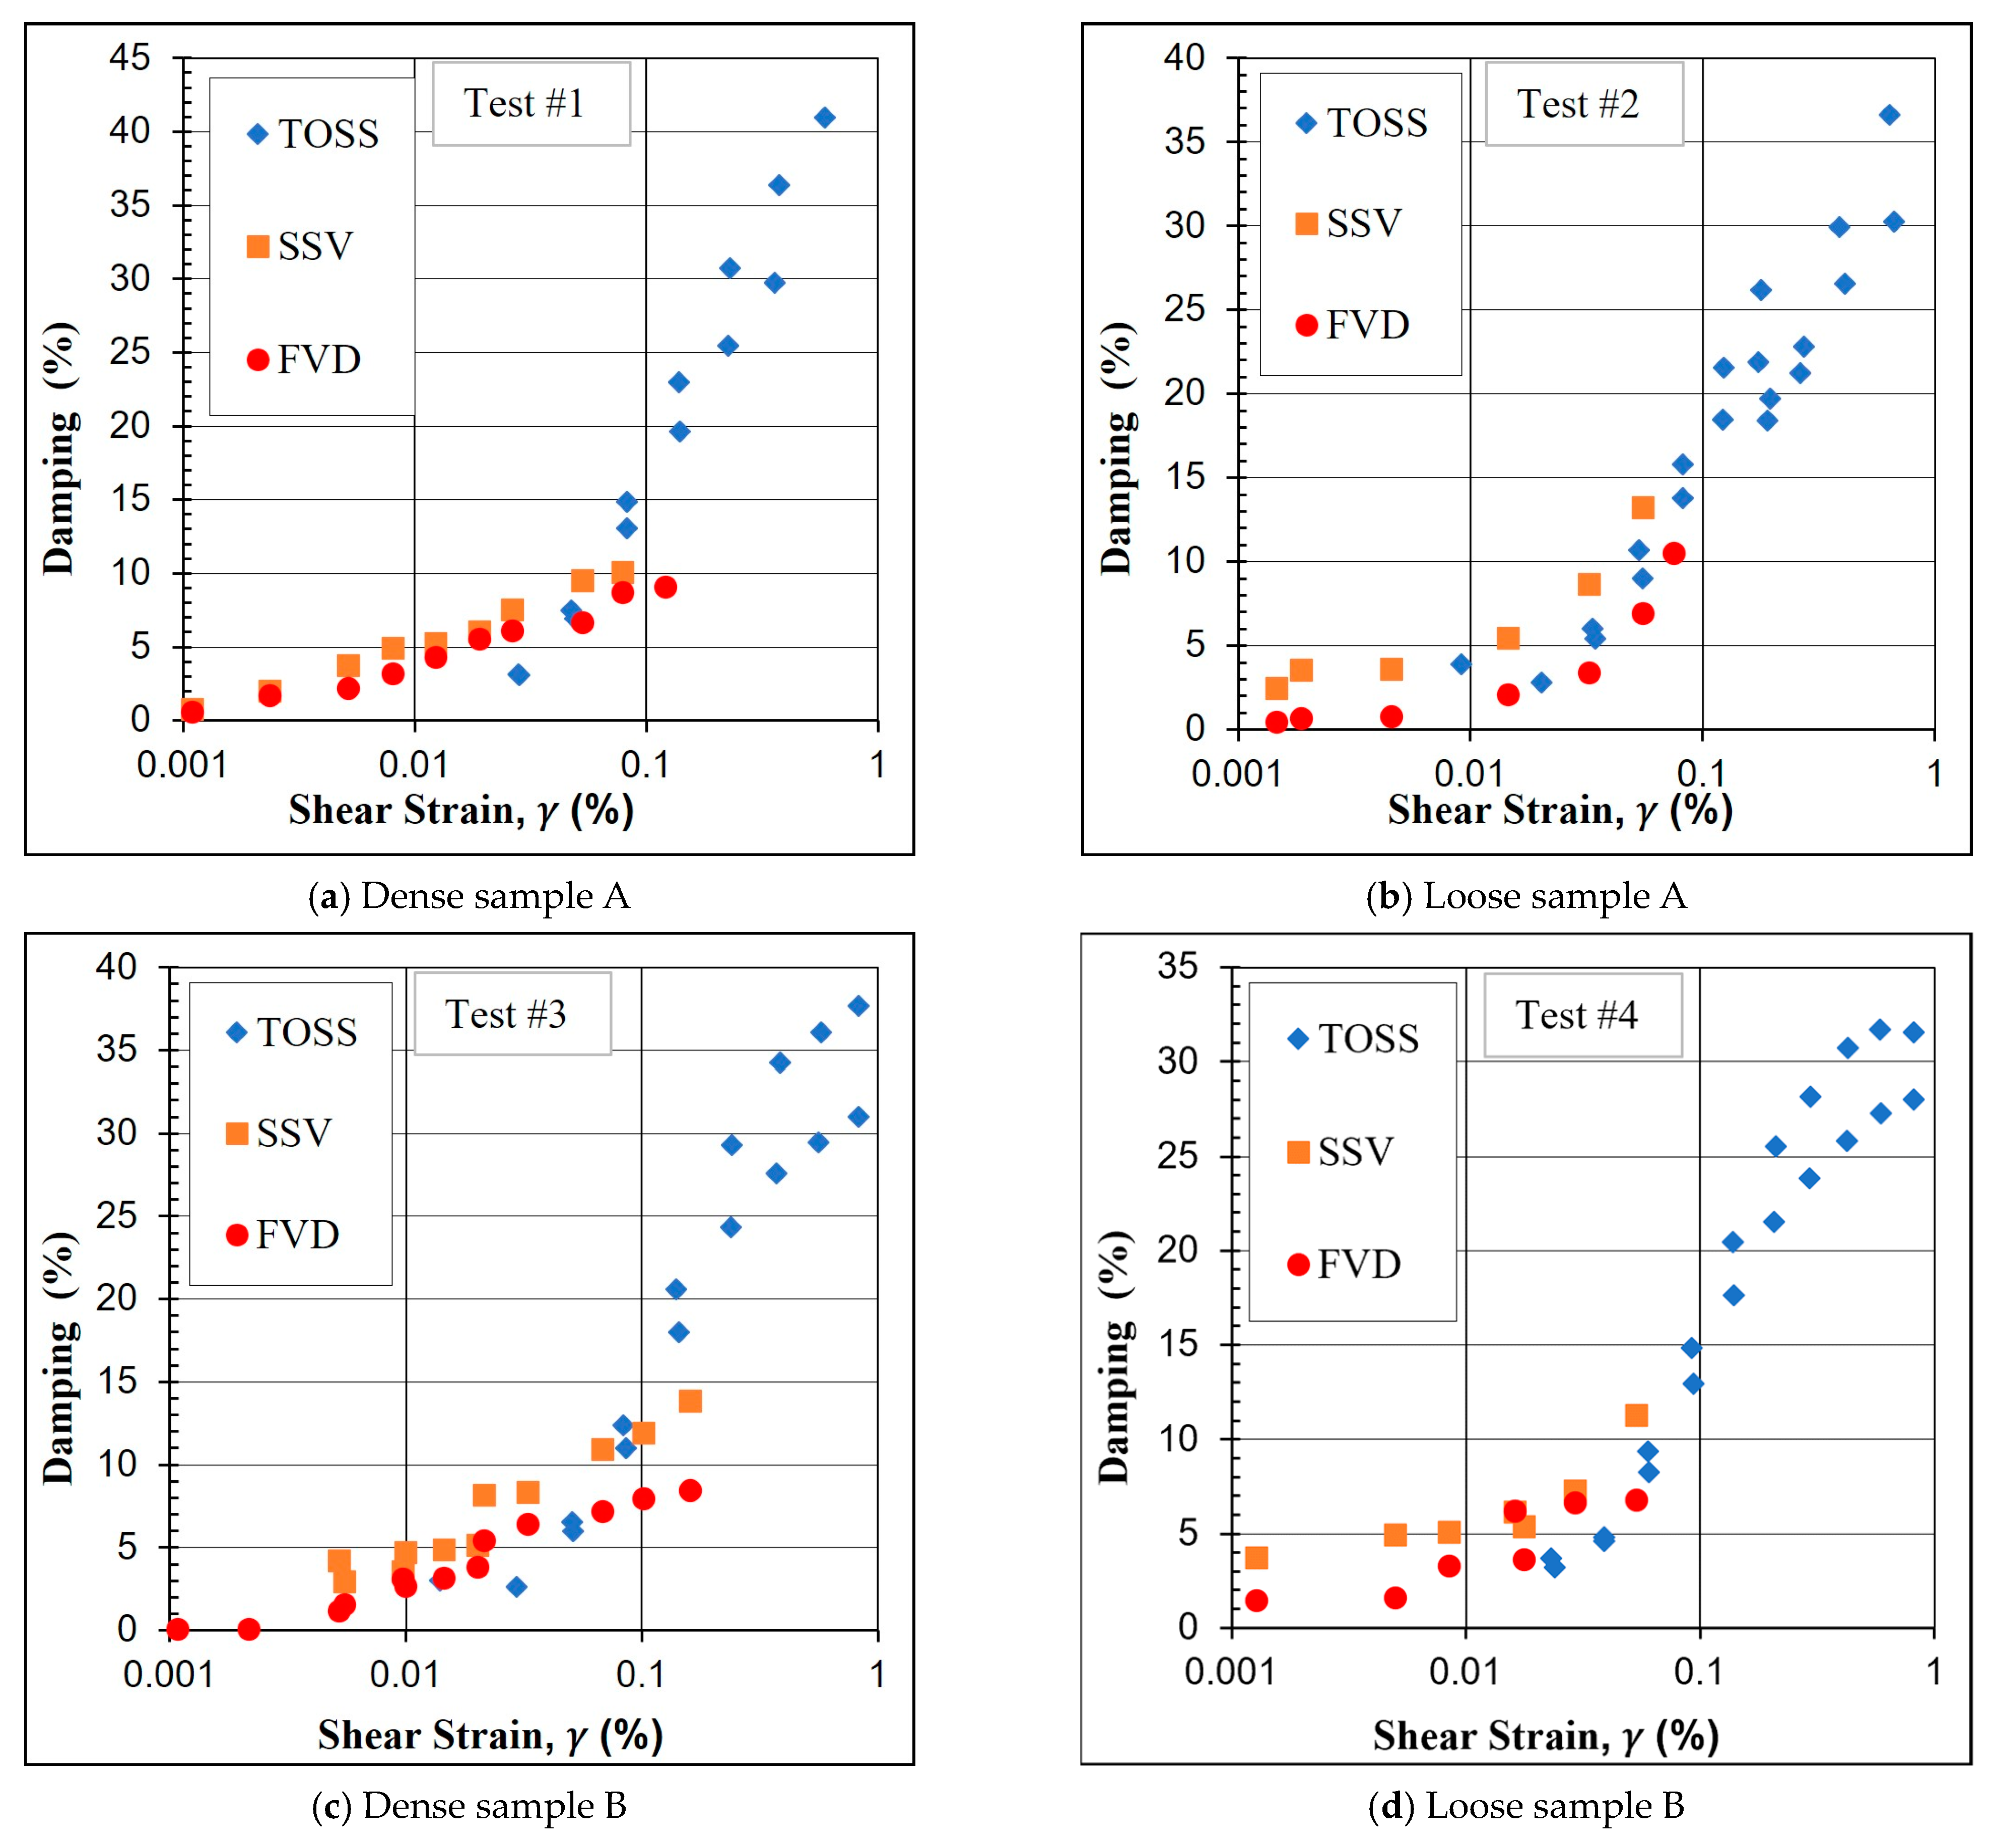
21]. Next, cyclic TOSS tests load the sample for two cycles at progressively higher stress levels (5–10–15–20–25–30–35–40–45–50 KPa). RC tests are continued after reaching the maximum shear strain that can be measured using the proximitors (just below 1% peak-to-peak strain). The six RC tests provided a total of 115 damping measurements. This allowed for comparison with 54 data points from the TOSS test.
Typical response curves for the SSV method appear in
Figure 4 for ascending strain levels. At higher strain amplitudes (above 0.1%), dynamic instability prevented precise response data from being recorded by the multimeter. For the FVD method, however, very small strain levels inhibited accurate damping measurements, and relatively accurate decay-response curves required several attempts. During the disconnection from drive coils, an electric pulse often produces a strong transient. This pulse creates noise that distorts the readings of the most critical first few cycles, since damping is calculated from the first three cycles before strain levels decrease substantially. This noise did not affect the response at strain amplitudes higher than 0.005%, and the peaks could be spotted easily for the first few cycles.
Figure 5 compares the damping ratio measurements of the three methods.
The SSV method generally provides higher damping values than the FVD method, especially at higher strain levels. At the same time, there is a closer agreement between the two methods at medium strain amplitudes (0.005–0.03%). At higher strain amplitudes, the frequency-response curve becomes asymmetric, compromising the accuracy of the damping ratio calculations in the SSV method and causing an overestimation of their values. Such behavior also occurs when comparing with the TOSS tests, as damping values obtained from the TOSS tests agree more with the FVD method in the RC test at the strain levels where the SSV method is questionable.
Due to the nature of the TOSS test measurements and insufficient accuracy of the proximitors at very small strain amplitudes, comparisons between the RC and TOSS tests become difficult at strain levels below 0.02%. However, the two tests are in agreement and their combined response can generate damping-ratio curves for a wide range of strains.
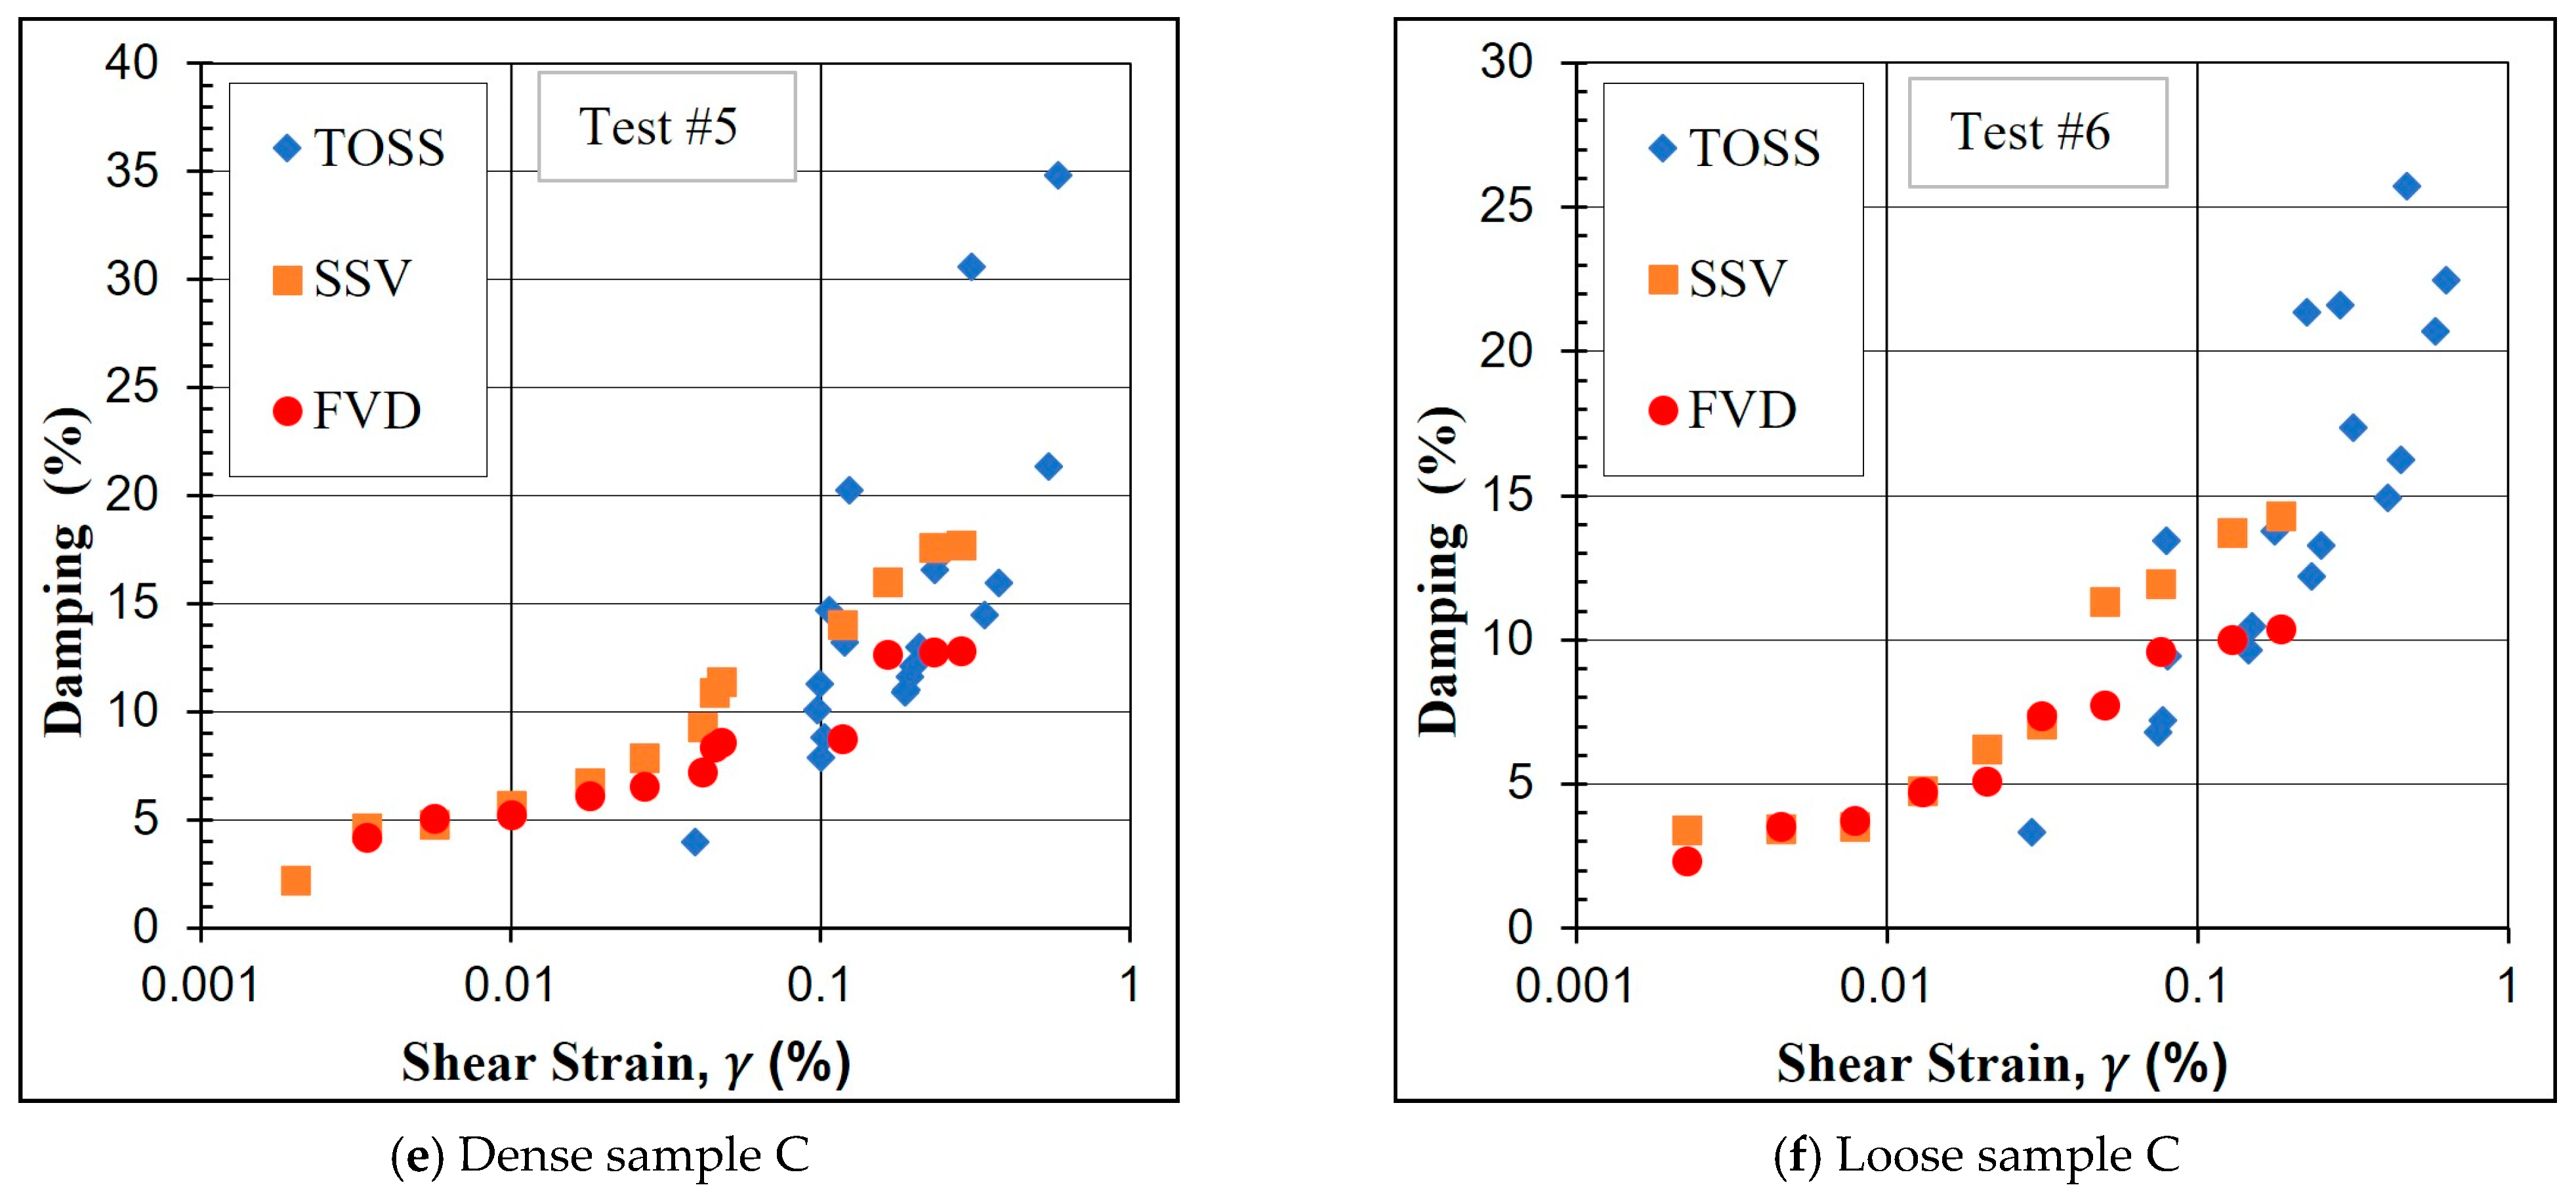
Multiple effects and uncertainties cause the scatter seen in the damping measurements. The sources of variability include the decreasing strain amplitude with time (FVD), response curve asymmetry (SSV), and the number of cycles and stiffening behavior in the TOSS test. Such effects cause difficulties when comparing the damping ratio obtained from different methods. As a result, they produce a scatter that may exceed 40% in the data when comparing the SSV and FVD methods, as seen in
Figure 6.
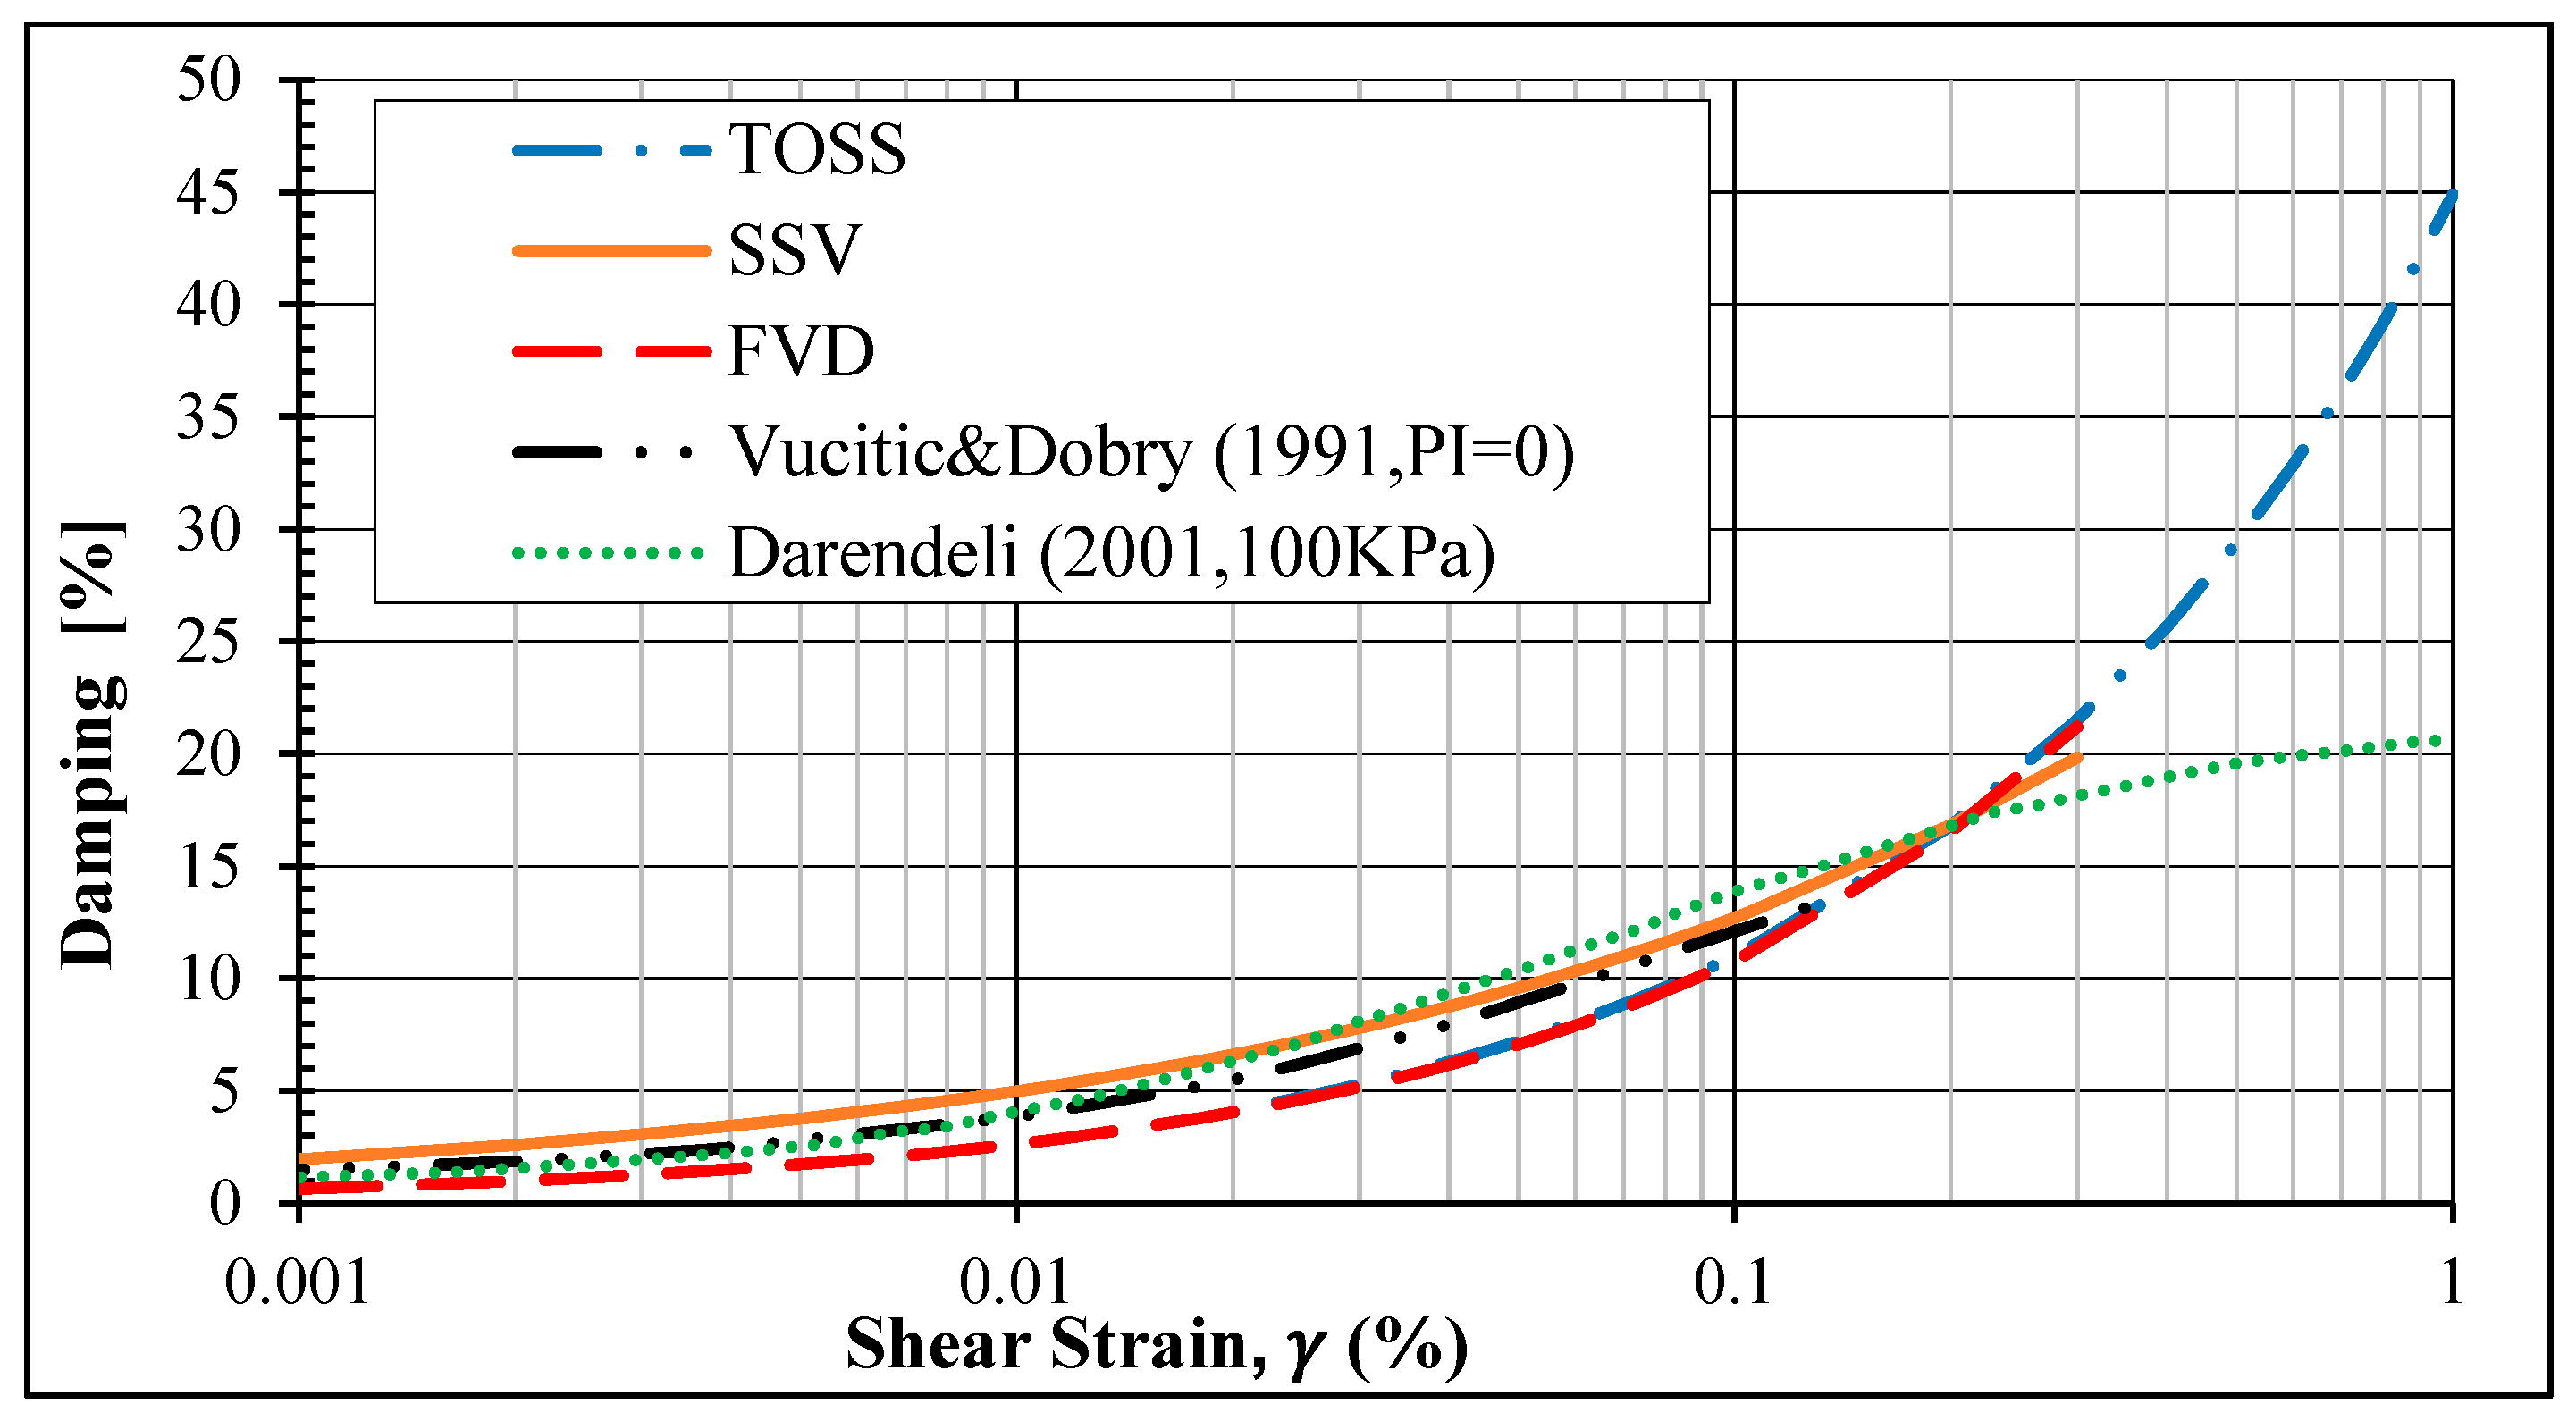
The best fit for all the damping ratio data points from the six tests using the three methods appears in
Figure 7, along with a comparison with two earlier studies [
22,
23] on dry sand.
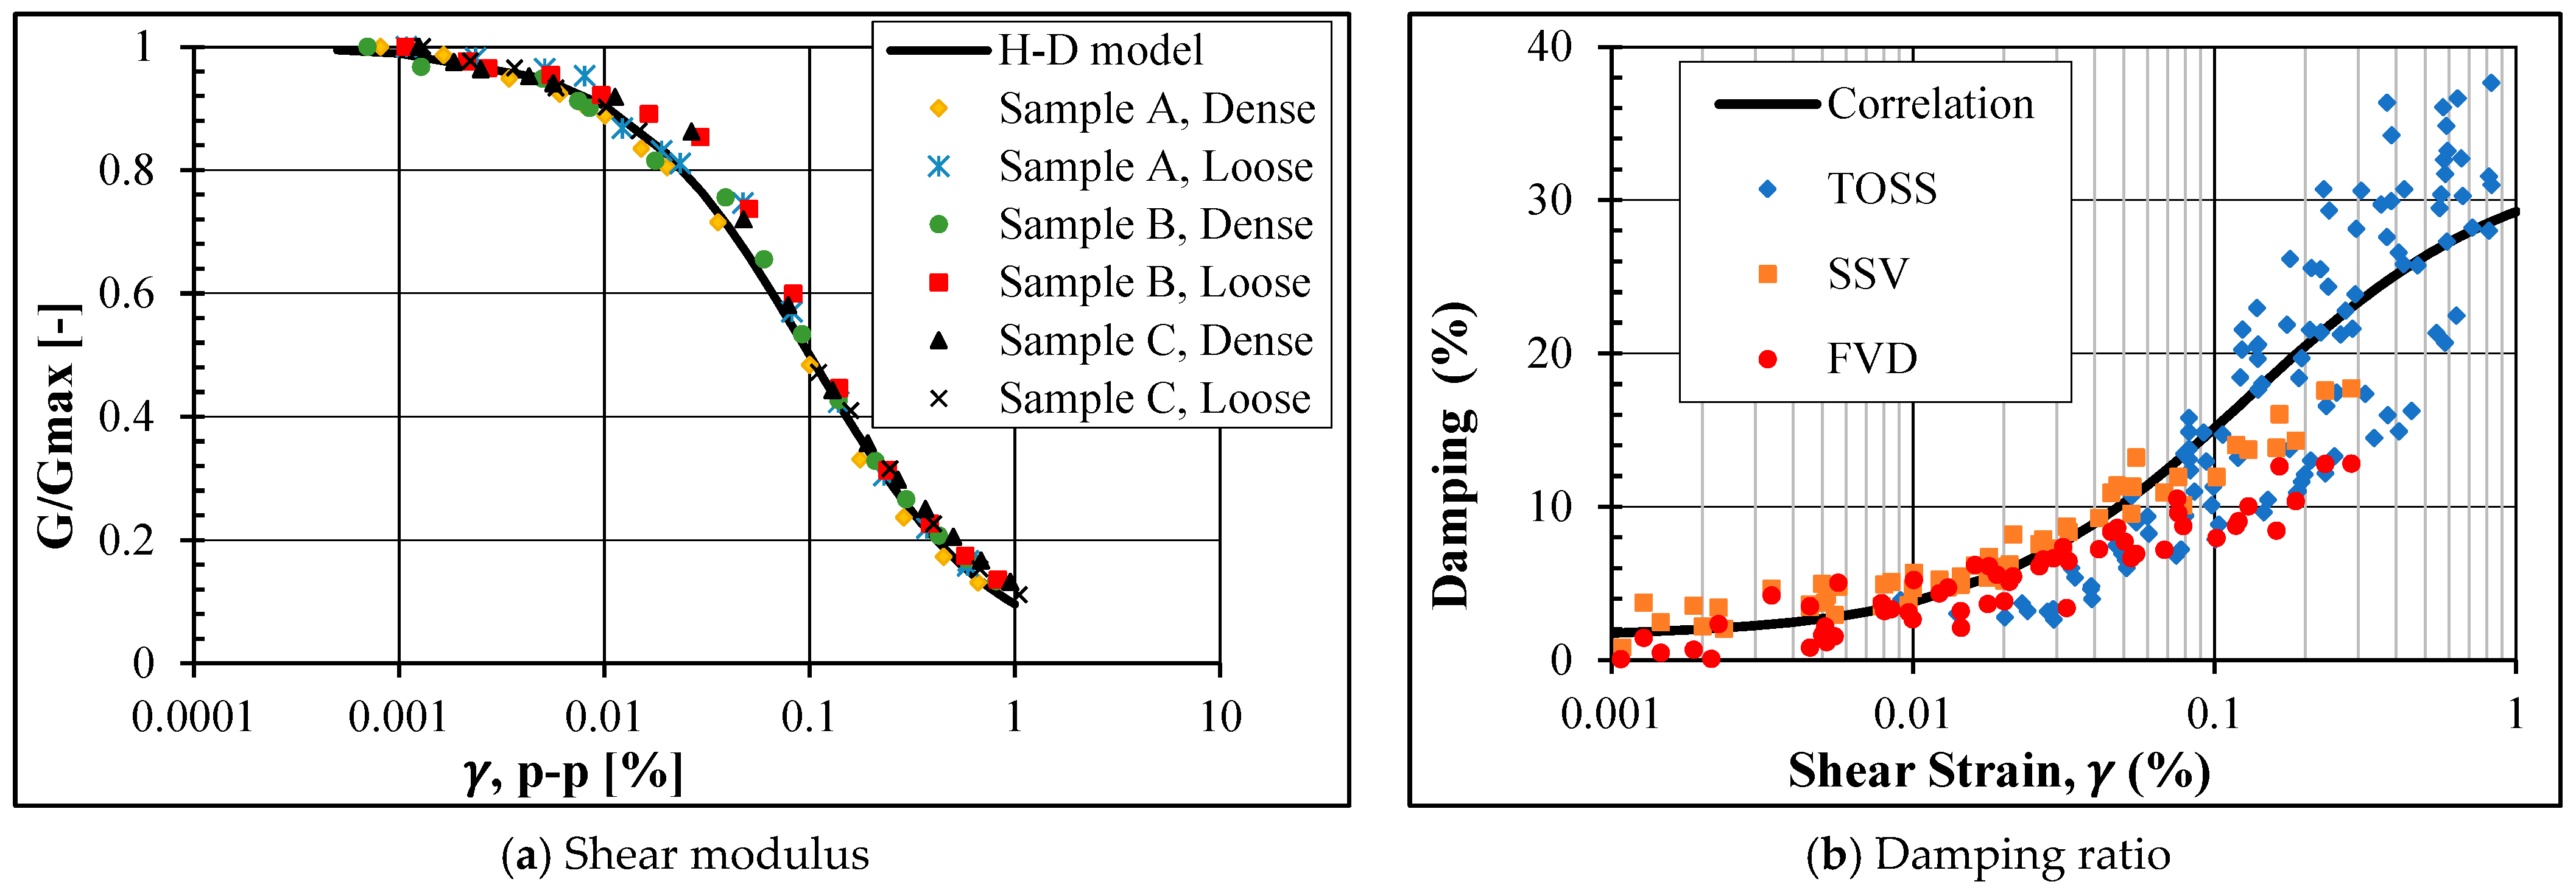
3.1. Damping Ratio Correlation
To estimate the damping ratio with correlations, it is common practice to relate it with the normalized shear modulus using a second-degree polynomial of (
G/Gmax) [
11,
24,
25].
The modified hyperbolic model based on the Hardin–Drnevich model provides an excellent presentation of the modulus-reduction curve. This model employs two curve-fitting parameters:
The reference shear strain
in this model is defined as the strain amplitude when the shear modulus reduces to one-half of
Gmax [
23]. The fit for all the samples is shown in
Figure 8a for
= 0.1 and
a = 0.974.
After finding the correlation for the shear-modulus-degradation curve, the following equation models the damping ratio increase with increasing strain amplitude:
where
C1,
C2, and
C3 are curve-fitting constants. The constants are found using the least square method, by minimizing the summation of the squared errors between the equation and the lab measurements. For the damping ratio measurement in this study for all tested samples, the equation becomes:
Figure 8b demonstrates how the equation fits the RC-TOSS damping measurements.
3.2. Effect of Torsional Cyclic Loading on Damping
After exceeding the volumetric-shear-strain threshold (
), the cyclic loading causes an increase in soil stiffness [
26,
27,
28].
Figure 9 of the shear-stress–strain curves for 100 cycles shows how the hysteresis cycles decrease in size. Therefore, the damping ratio decreases with the increasing number of cycles. Several authors have detected this effect [
6,
29,
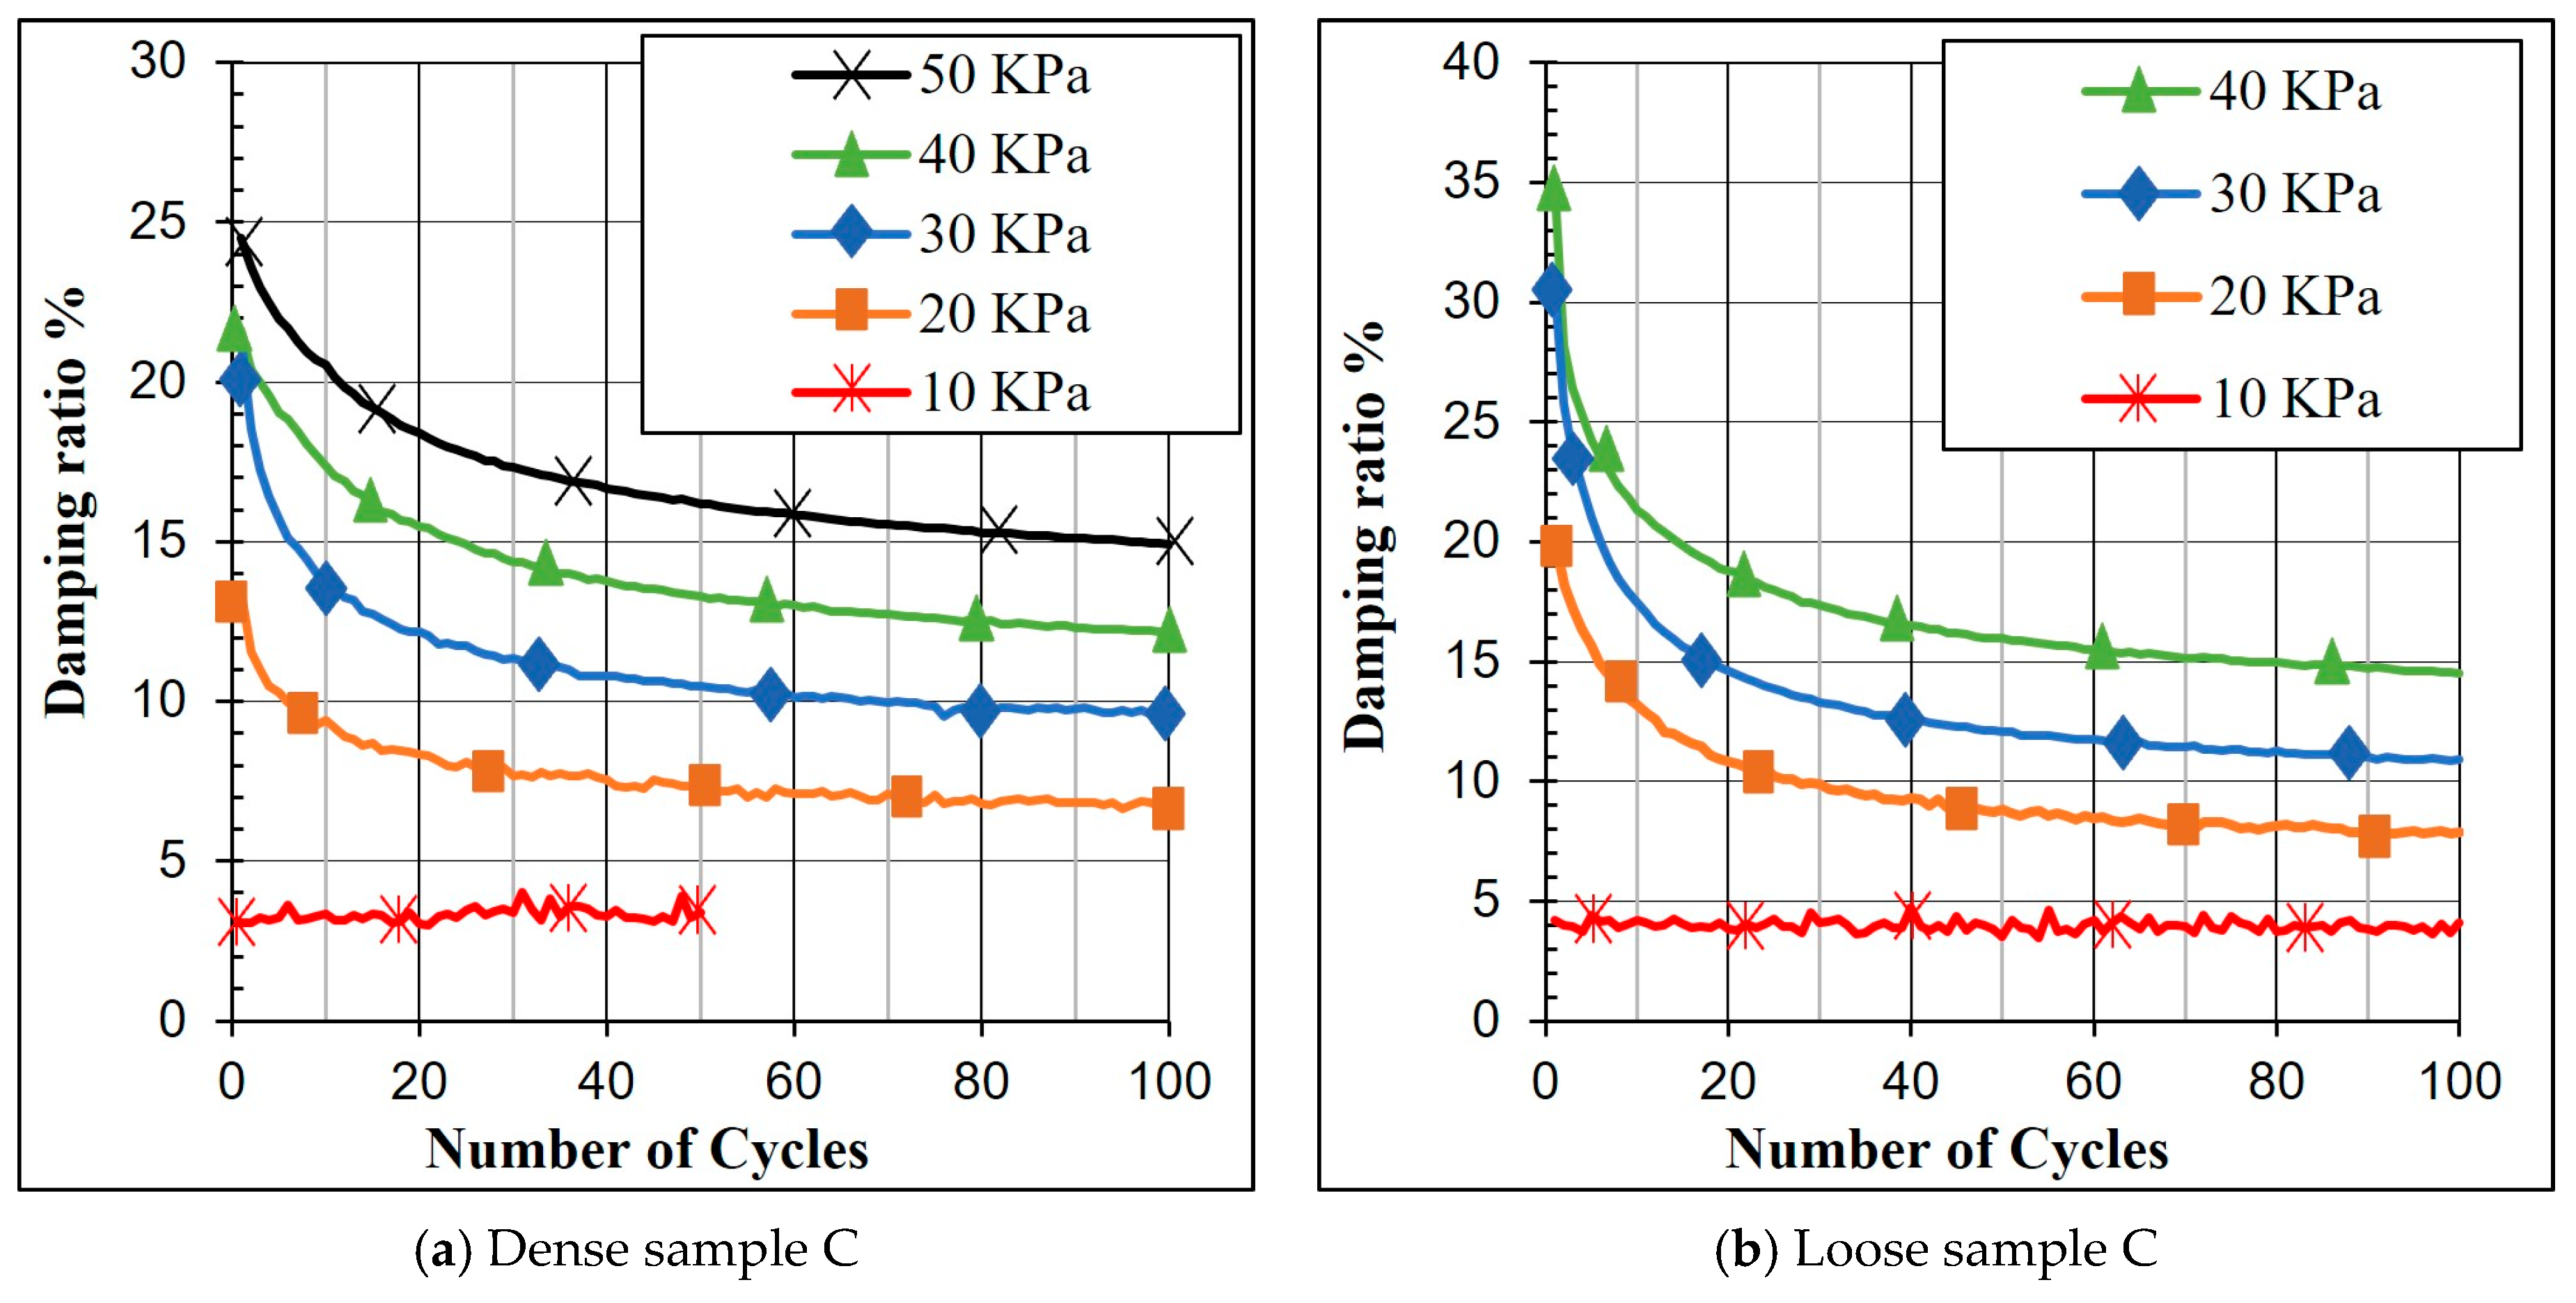
30]. However, most studies have focused on the effect of low-strain cyclic vibration with a high number of cycles on the dynamic properties of soil. No agreement has been found regarding the effect of high-strain-amplitude cyclic loading. Thus, in this study, cyclic TOSS tests were conducted with increasing stress levels ranging between 10 KPa to 60 KPa with a maximum peak-to-peak strain amplitude of 1%. Each test applies 100 cycles where the damping ratio is calculated for all cycles.
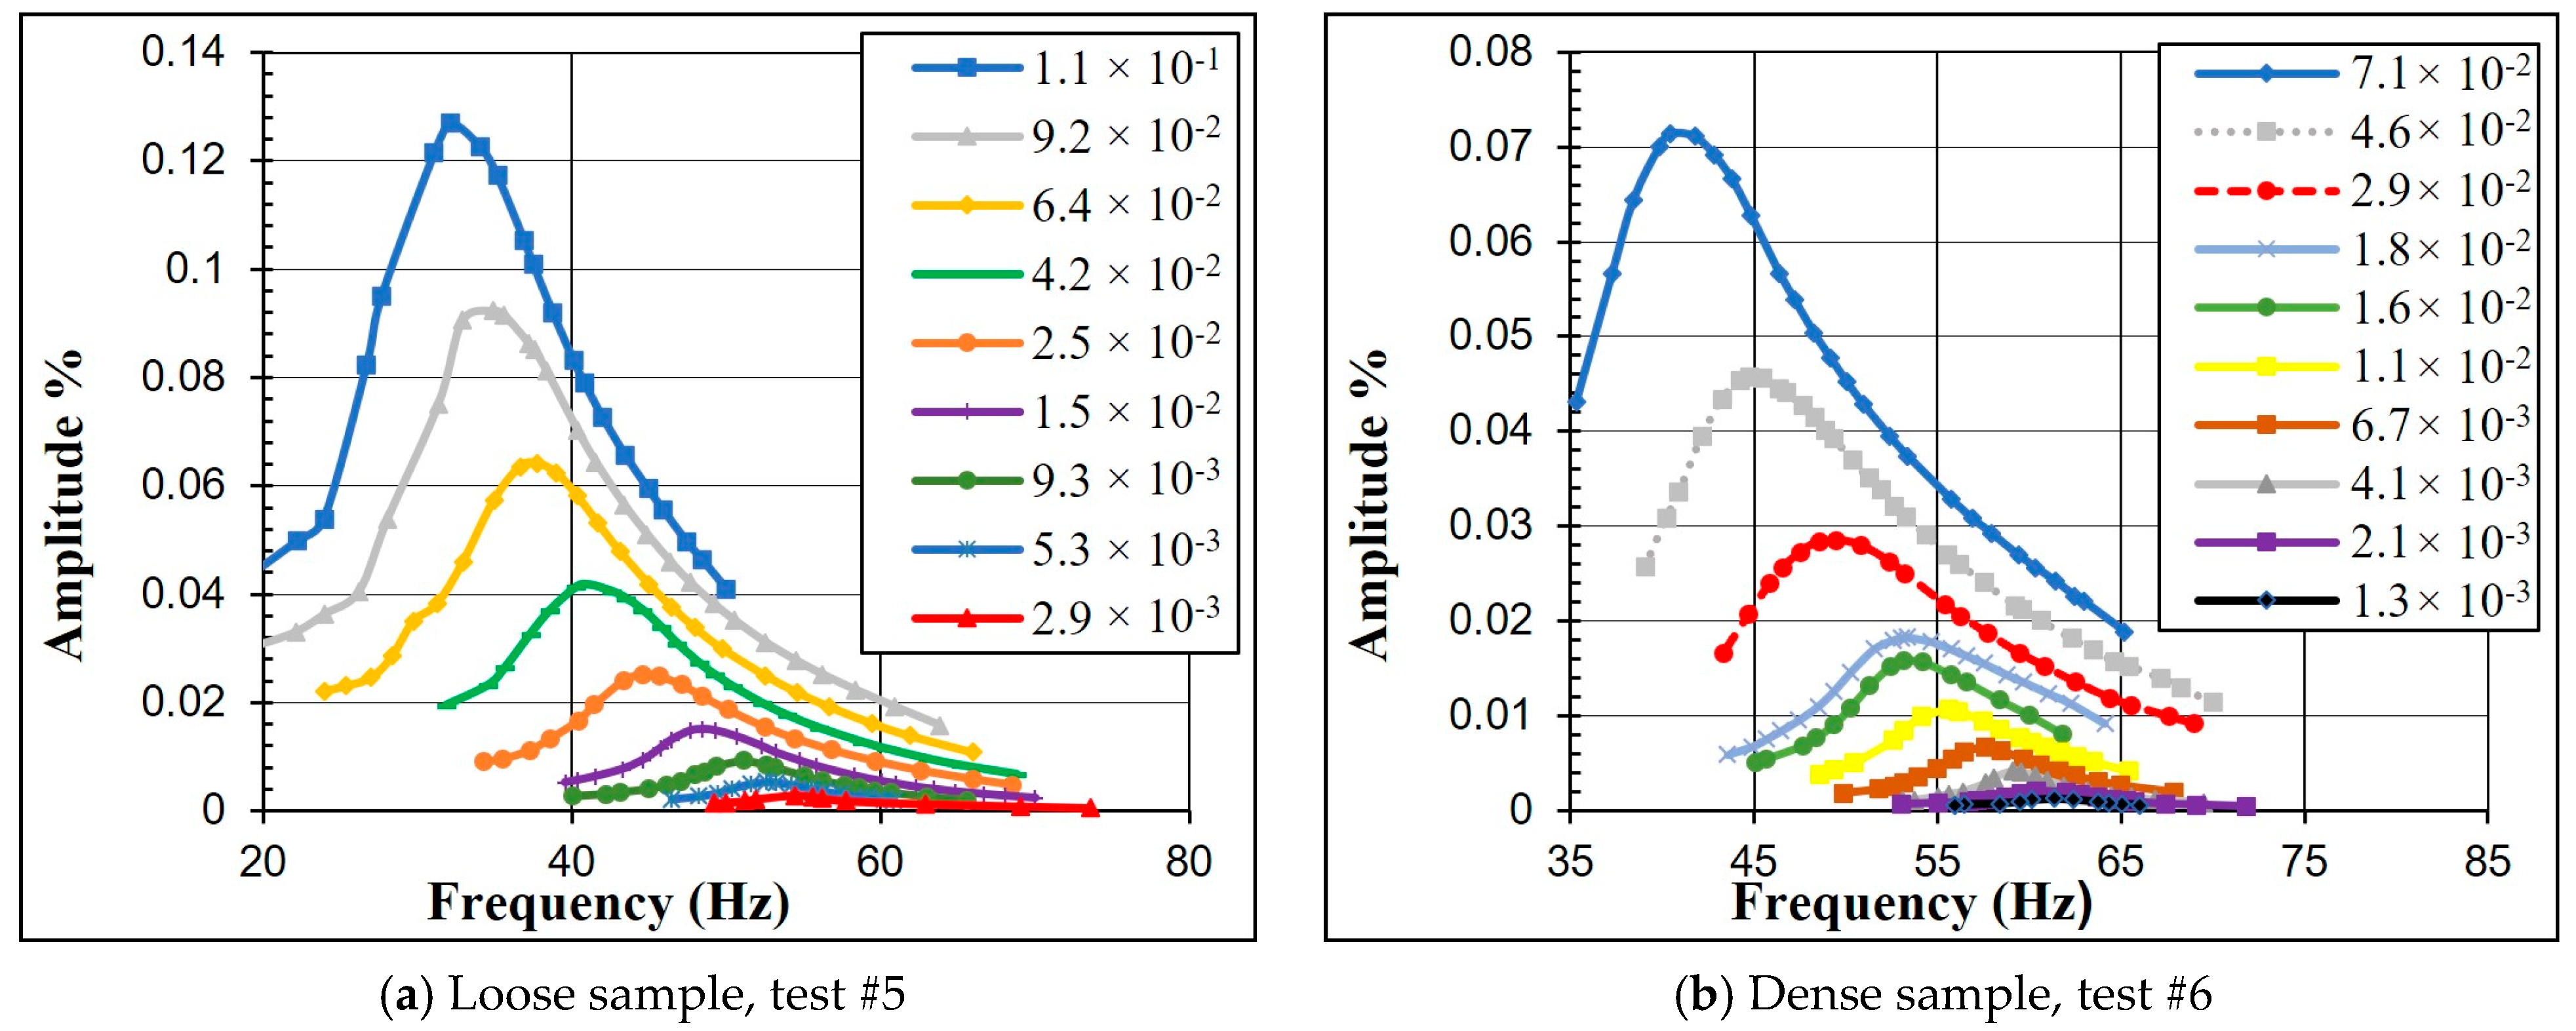
The decrease in the damping ratio with the increasing number of cycles (N) at different stress levels is shown in
Figure 10 for sample C at two different states; (a) is a loose sample and (b) is a dense sample. It is difficult to estimate the rate of change for each stress level due to the sequence of the TOSS test and cyclic loading that the sample has experienced at lower stress levels. However, the higher the stress level, the higher the effect of (
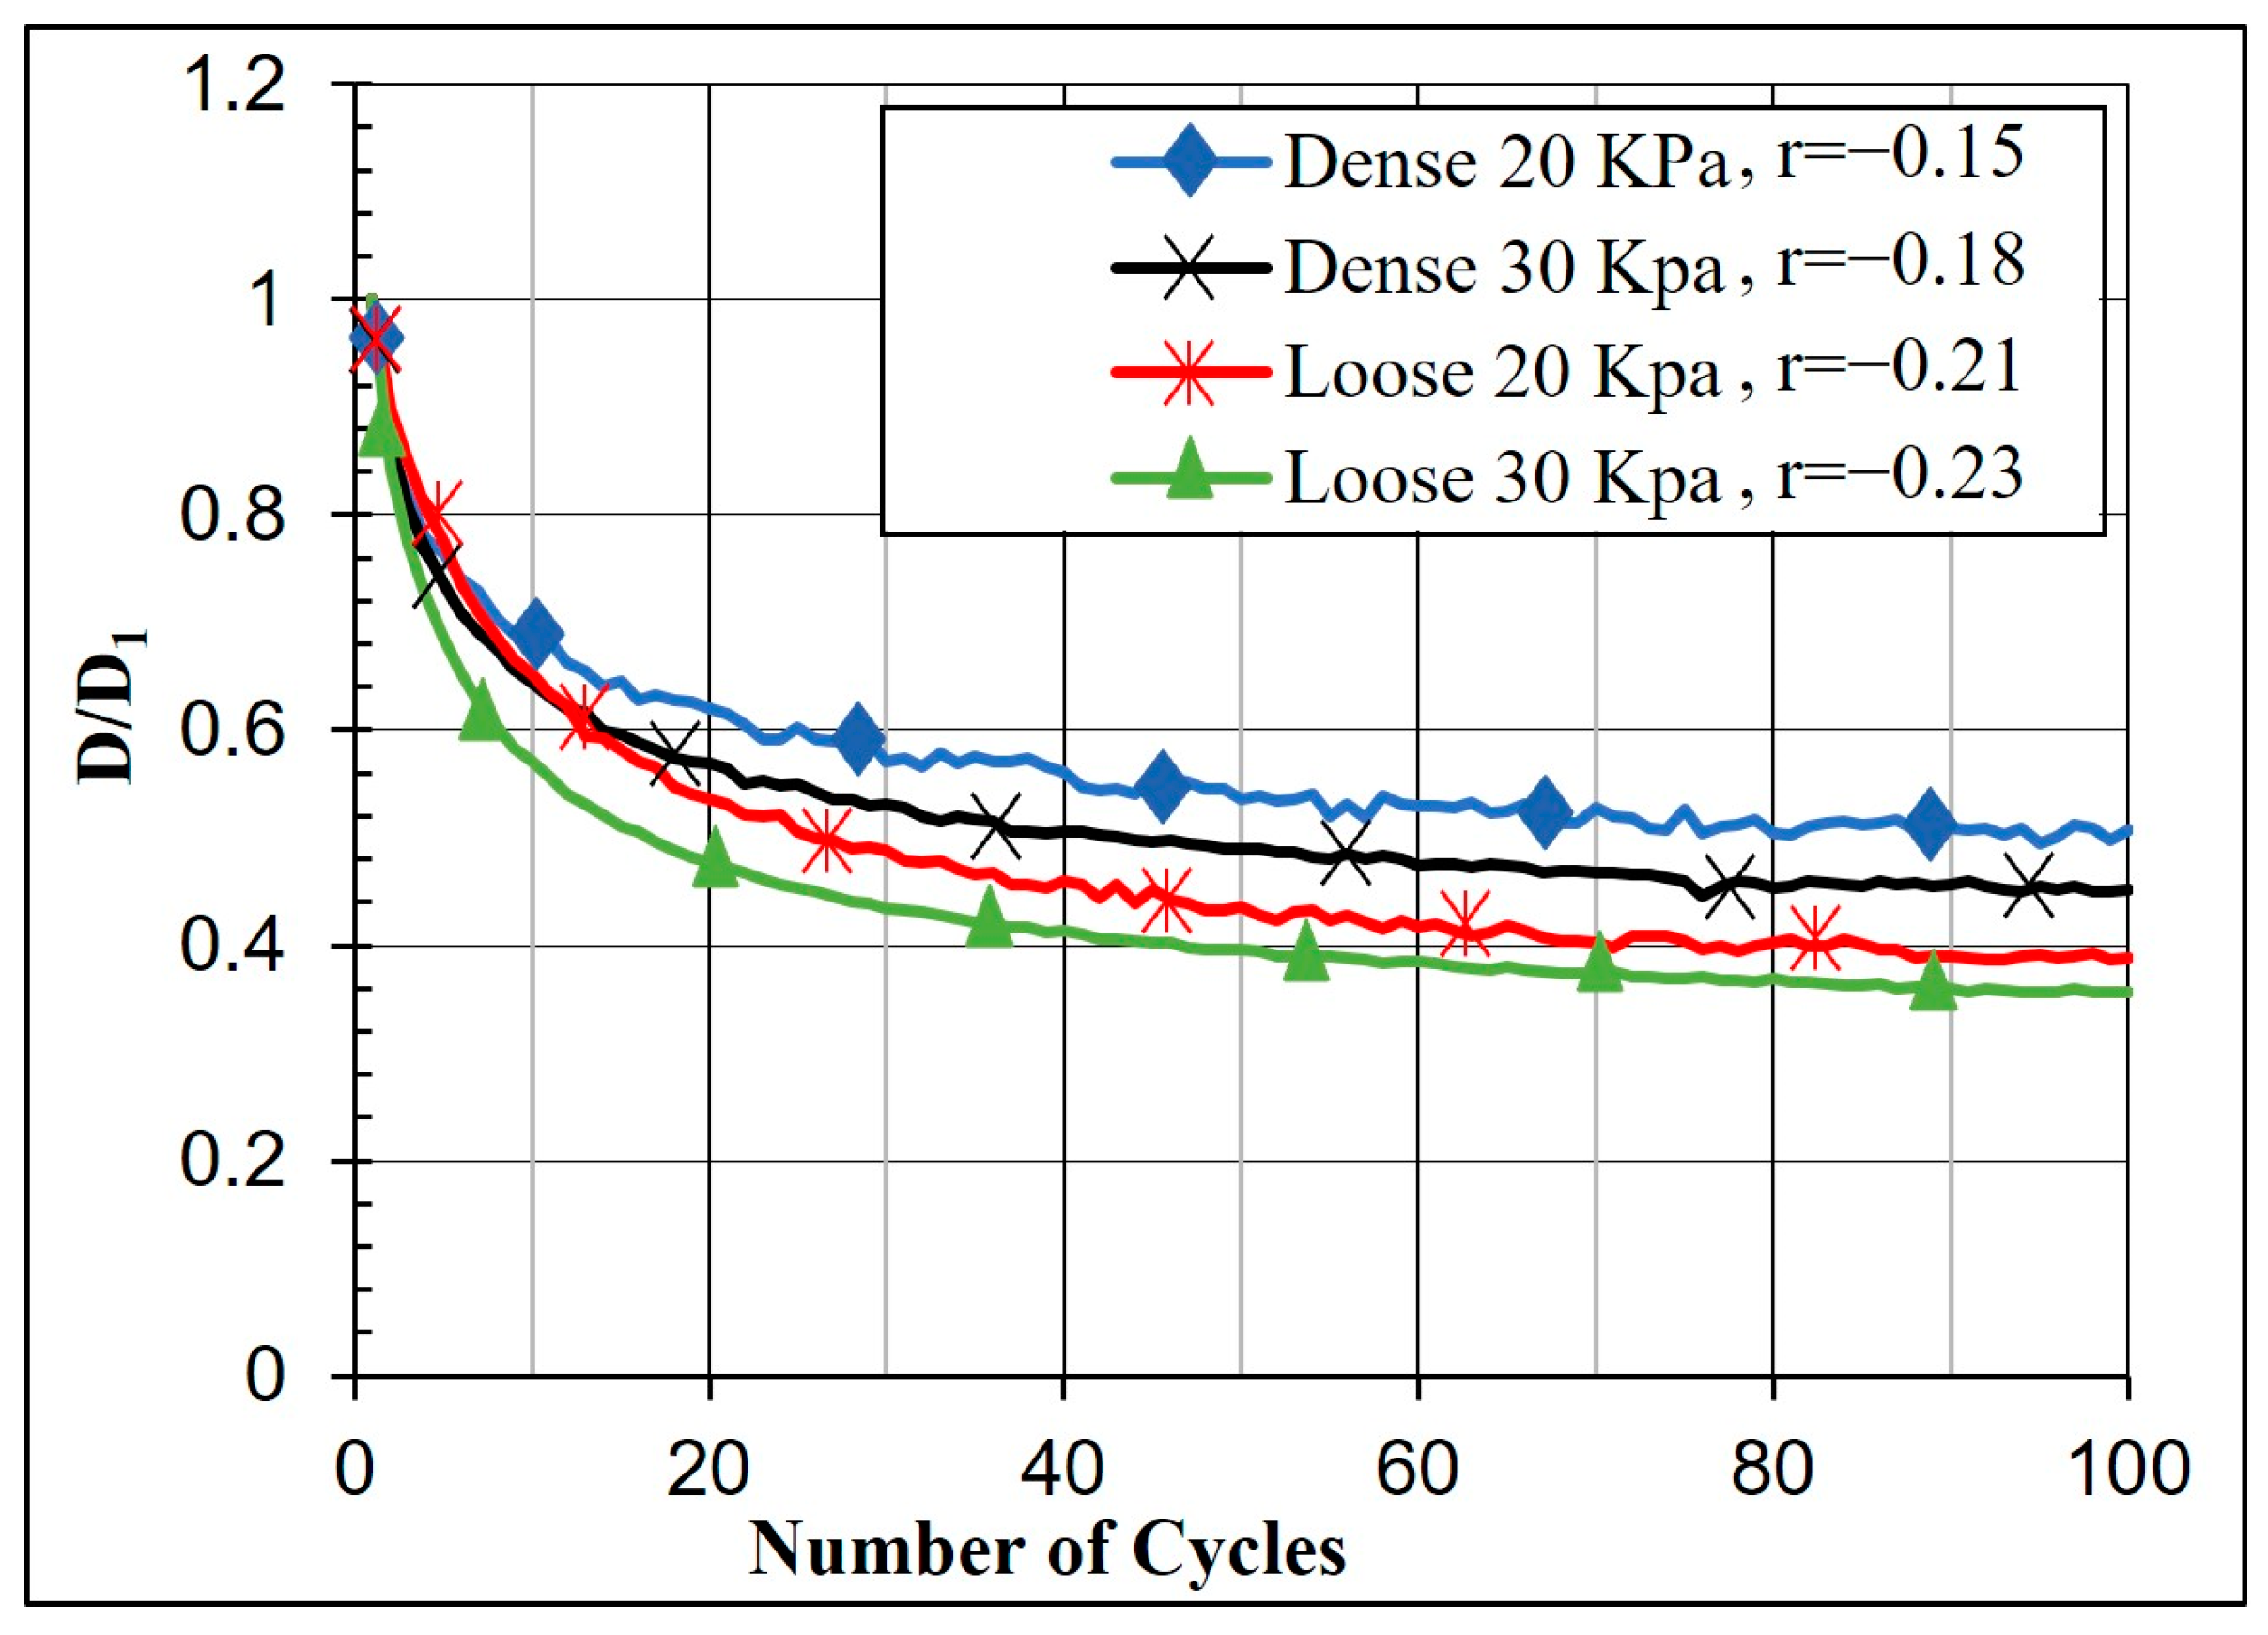
N) on damping up to a specific limit. Beyond this, the stress level seems to have a minor influence on the rate of decrease in the damping ratio. Specimens with a higher void ratio or lower relative density exhibit a more significant reduction in damping ratio. For instance, at stress levels of 20 KPa and 30 KPa, the damping ratio decreased by 50% and 54% after 100 cycles for a dense sample, while a loose sample decreased by 61% and 64% (
Figure 11).
DN is the damping ratio calculated from a cyclic TOSS test at the N
th cycle, and
D1 is the damping ratio of the first cycle (maximum damping ratio at that stress level). Results show that log(
DN/D1) is linearly proportional to log(
N), and the slope of log(
DN/D1) − log(
N) plot represents a parameter (
r) that describes the rate of decrease in damping ratio with the number of cycles.
The values of the parameter (r) also vary in a manner similar to damping ratio measurements, and it is difficult to find a pattern in the change in (r) with the increasing strain amplitude. Generally, (r) takes values between (−0.15 and −0.24) for strain amplitudes above 0.1%.
4. Conclusions
Several methods are in use nowadays to measure the damping ratio in practical applications. The scatter in the measurements is typically present in the literature due to uncertainties in the strain amplitudes, frequency-response curve symmetry, and the effect of the number of cycles. Luckily, the impact of this scatter is marginal in dynamic problems, such as site response analysis. Previous studies have not provided the opportunity to compare the measurement methods for damping ratios in both RC and TOSS tests. However, this study benefits from the exceptional design of the device, which enables the execution of both tests on a single sample. This allows for a direct comparison of the results without the interference of external factors, disturbances, or sample preparation. Steady-State Vibration (SSV), Free Vibration Decay (FVD), and damping in the Torsional Simple Shear device have been investigated and compared for three types of Danube sands with different relative densities. Based on the results, it is recommended to use the SSV method at very low strain amplitudes (below 0.005%) where the response curve is symmetrical. For this strain range, the FVD measurements are unreliable due to the noise created by the device when turning off the drive power. At medium strain levels (0.005%–0.03%), the two methods and the TOSS results agree with each other. However, at higher strain amplitudes (above 0.03%), it is advised to employ the FVD method to measure the damping ratio, due to the reduced accuracy of the SSV method. The SSV-response curves are not symmetrical anymore, which compromises the use of the half-bandwidth method, causing an overestimation in the damping ratio values. Achieving a more precise estimation of the damping ratio of soil leads to improving the performance and safety of structures under dynamic loads, which can contribute to the longevity of the design, reducing the overall environmental footprint associated with maintenance.
The effect of the shear stiffening behavior during cyclic loading in the TOSS test was investigated. After exceeding the volumetric shear strain threshold, a considerable decrease in the damping ratio was observed. This trend is more evident in loose samples where damping can decrease by up to 64% after 100 cycles compared to a 54% decrease in dense samples for the same stress level of the applied cycles. Considering this decrease during the design phase can improve the analysis of the dynamic response of structures to reach a more resilient design of the infrastructure when subjected to dynamic loading, this can reduce the need for repairs or reconstruction after seismic events, thereby minimizing resource consumption and waste generation, contributing to long-term sustainability.
Author Contributions
Conceptualization, M.A. and R.R.; methodology, M.A. and R.R.; software, R.R.; investigation, M.A.; resources, R.R.; writing—original draft preparation, M.A.; writing—review and editing, R.R.; visualization, M.A.; supervision, R.R. All authors have read and agreed to the published version of the manuscript.
Funding
This research is funded by the Stipendium Hungaricum Scholarship, grant number 192800.
Data Availability Statement
The data presented in this study can be provided by the author upon request.
Conflicts of Interest
The authors declare no conflict of interest.
References
- White, J.E. Underground Sound: Applications of Seismic Waves; Elsevier: Amsterdam, The Netherlands, 1983; pp. 83–137. [Google Scholar]
- Payan, M.; Senetakis, K.; Khoshghalb, A.; Khalili, N. Influence of particle shape on small-strain damping ratio of dry sands. Geotechnique 2016, 66, 610–616. [Google Scholar] [CrossRef] [Green Version]
- Szilvágyi, Z. Dynamic Soil Properties of Danube Sands. Ph.D. Thesis, Széchenyi István University, Győr, Hungary, 2017. [Google Scholar]
- Upreti, K.; Leong, E.C. Effect of mean grain size on shear modulus degradation and damping ratio curves of sands. Géotechnique 2021, 71, 205–215. [Google Scholar]
- Kramer, S.L. Geotechnical Earthquake Engineering; Prentice Hall: Upper Saddle River, NJ, USA, 1996; p. 643. ISBN 978-0133749434. [Google Scholar]
- Kokusho, T. In Situ Dynamic Soil Properties and Their Evaluations. In Proceedings of the 8th Asian Regional Conference on Soil Mechanics and Foundation Engineering, Kyoto, Japan, 20–24 July 1987. [Google Scholar]
- Hardin, B. The Nature of Damping in Sands. J. Soil Mech. Found. Div. 1965, 91, 63–98. [Google Scholar] [CrossRef]
- Dobry, R. Damping in Soils: Its Hysteretic Nature and the Linear Approximation; M.I.T. Department of Civil Engineering, Inter-American Program: Cambridge, MA, USA, 1970. [Google Scholar]
- Facciorusso, J. An archive of data from resonant column and cyclic torsional shear tests performed on Italian clays. Earthq. Spectra 2020, 73, 545–562. [Google Scholar] [CrossRef]
- Xu, Z.; Tao, Y.; Hernandez, L. Novel Methods for the Computation of Small-Strain Damping Ratios of Soils from Cyclic Torsional Shear and Free-Vibration Decay Testing. Geotechnics 2021, 1, 330–346. [Google Scholar] [CrossRef]
- Senetakis, K.; Anastasiadis, A.; Pitilakis, K. A comparison of material damping measurements in resonant column using the steady-state and free-vibration decay methods. Soil Dyn. Earthq. Eng. 2015, 74, 10–13. [Google Scholar] [CrossRef]
- Yu, S.; Shan, Y. Experimental Comparison and Study on Small-Strain. Geotech Geol. Eng. 2017, 35, 2479–2483. [Google Scholar] [CrossRef]
- Mog, K.; Anbazhagan, P. Evaluation of the damping ratio of soils in a resonant column using different methods. Soils Found. 2022, 62, 101091. [Google Scholar] [CrossRef]
- Ray, R.P. Changes in Shear Modulus and Damping in Cohesionless Soils Due to Repeated Loading. Ph.D. Thesis, University of Michigan, Ann Arbor, MI, USA, 1984; p. 417. [Google Scholar] [CrossRef]
- Bae, Y.-S. Modeling Soil Behavior in Large Strain Resonant Column and Torsional Shear Tests. Ph.D. Thesis, Utah State University, Logan, UT, USA, 2007. [Google Scholar]
- Richart, F.E.; Hall, J.R.; Woods, R.D. Vibrations of soils and foundations. Prentice-Hall: Upper Saddle River, NJ, USA, 1970. [Google Scholar]
- ASTM D4015; Standard Test Methods for Modulus and Damping of Soils by Resonant-Column Method. Annual Book of ASTM Standards, USA; ASTM International: West Conshohocken, PA, USA, 1992.
- Chopra, A.K.; Structures, D.O. Theory and Applications to Earthquake Engineering, 3rd ed.; Prentice Hall: Upper Saddle River, NJ, USA, 2007. [Google Scholar]
- Meng, J. The Influence of Loading Frequency on Dynamic Soil Properties. Ph.D. Thesis, Georgia Institute of Technology, Atlanta, GA, USA, 2003. [Google Scholar]
- Georgiannou, V.N.; Rampello, S.; Silvestri, F. Static and dynamic measurements of undrained stiffness of natural overconsolidated clays. In Deformation of Soils and Displacement of Structures; Balkema: Florence, Italy, 1991. [Google Scholar]
- Vucetic, M. Cyclic threshold shear strains in soils. J. Geotech. Eng. 1994, 120, 2208–2228. [Google Scholar] [CrossRef]
- Vucetic, M.; Dobry, R. Effect of soil plasticity on cyclic response. J. Geotech. Eng. 1991, 117, 89–107. [Google Scholar] [CrossRef]
- Darendeli, B. Development of a New Family of Normalized Modulus Reduction and Material Damping Curves. Ph.D. Thesis, University of Texas at Austin, Austin, TX, USA, 2001; pp. 1–362. [Google Scholar]
- Ishibashi, I.; Zhang, X. Unified dynamic shear modulus and damping ratios of sand and clay. Soils Found. Jpn. Soc. Soil Mech. Found. Eng. 1993, 33, 182–191. [Google Scholar] [CrossRef] [Green Version]
- Zhang, J.; Andrus, R.; Juang, C. Normalized Shear Modulus and Material Damping Ratio Relationships. J. Geotech. Geoenvironmental. Eng. 2005, 131, 453–464. [Google Scholar] [CrossRef]
- Hardin, B.; Drnevich, V. Shear modulus and damping in soils: Design equations and curves. J. Soil Mech. Found. Div. 1972, 98, 667–692. [Google Scholar] [CrossRef]
- Iwasaki, T.; Tatsuoka, F.; Takagi, Y. Shear moduli of sands under cyclic torsional shear loading. Soils Found. 1978, 18, 39–50. [Google Scholar] [CrossRef] [Green Version]
- Ray, R.; Woods, R. Modulus and damping due to uniform and variable cyclic loading. J. Geotech. Eng. 1988, 114, 861–876. [Google Scholar] [CrossRef]
- Silver, M.L.; Seed, H.B. Volume changes in sands during cyclic loading. J. Soil Mech. Found. Div. 1971, 97, 1171–1182. [Google Scholar] [CrossRef]
- Edil, T.B.; Luh, G.F. Dynamic modulus and damping relationships for sands. In Proceedings of the ASCE Geotechnical Engineering Division Specialty Conference, Pasadena, CA, USA, 19–21 June 1978. [Google Scholar]
| Disclaimer/Publisher’s Note: The statements, opinions and data contained in all publications are solely those of the individual author(s) and contributor(s) and not of MDPI and/or the editor(s). MDPI and/or the editor(s) disclaim responsibility for any injury to people or property resulting from any ideas, methods, instructions or products referred to in the content. |
© 2023 by the authors. Licensee MDPI, Basel, Switzerland. This article is an open access article distributed under the terms and conditions of the Creative Commons Attribution (CC BY) license (https://creativecommons.org/licenses/by/4.0/).


