Article

Numerical Simulation and Application of an Oxygen-Enriched Side-Blown Smelting Furnace for the Treatment of Electroplating Sludge

School of Minerals Processing and Bioengineering, Central South University, Changsha 410083, China
*
Author to whom correspondence should be addressed.
Sustainability 2023, 15(13), 10721; https://doi.org/10.3390/su151310721
Submission received: 28 April 2023 / Revised: 12 June 2023 / Accepted: 21 June 2023 / Published: 7 July 2023

Abstract

:
In the oxygen-enriched side-blown smelting furnace for the treatment of electroplating sludge, fluent was used to simulate the gas–liquid two-phase flow process. The relationship between the lance diameter, lance inclination, bath depth, and the bath evaluation indicators were studied, and the oxygen lance spacing was optimized. The results show that the high velocity and high gas rate areas were near the oxygen lance, while the stirring dead zones with low velocity appeared in the central and bottom areas of the molten pool. The key parameters were optimized using single-factor analysis and multifactor comprehensive optimization. The results showed that the bath evaluation indicators were all at good levels under the optimal parameter conditions. These were comprehensively obtained as the following: the lance diameter was 25 mm, the lance inclination was 15°, the lance spacing was 1050 mm, and the bath depth was 1500 mm. The industrial test carried out in an environmental protection enterprise in Guangdong achieved satisfactory results. The test shows that the electroplating sludge containing 7.24% Cu can be melted at 1300~1400 °C to obtain matte. Compared with industrial copper slag, the smelting slag has a higher CaO and a lower Fe content.

1. Introduction

Electroplating sludge (ES) is a kind of heavy metal sludge formed after the treatment of wastewater from the electroplating industry. It usually contains chromium, nickel, copper, zinc, iron, tin, mercury, manganese, silver, and other heavy metals [1]. These metals usually exist in the form of mixed oxides, hydroxides, sulfates, silicates, or phosphates. Every year, the world produces a large amount of ES, including about 10 million tons in China, about 1.3 million tons in the United States, about 15,000 tons in the European Union, about 65,000 tons in Japan, and more than 100,000 tons of valuable metal resources [2,3,4]. At present, ES disposal methods include solidification or stabilization, landfill [5], or conversion to building materials. Although these methods are simple in the disposal process, there are secondary pollution problems caused by heavy metal slow release [6], and it leads to the waste of valuable metal resources such as nickel, copper, and zinc. The ES contains a large number of toxic heavy metals. If it is not disposed of harmlessly and utilized as a resource, it will inevitably cause great harm to human health and the natural environment, and it will also lead to the loss of a large amount of metal resources.
To recover valuable metals from electroplating sludge, domestic and foreign scholars have carried out a lot of research, mainly including the pyrometallurgical process, the wet process, and the sulfide roasting flotation process. At present, the most commonly used process for industrial treatment of electroplating sludge is the pyrometallurgical process, such as an oxygen-enriched side-blown bath smelting process, which has the advantages of short process flow, strong adaptability to raw materials, high metal recovery rate, thorough harmlessness, and easy resource utilization of tailings. The oxygen-enriched side-blown smelting furnace is the key core equipment of the oxygen-enriched side-blown molten pool smelting process. When it works, the high-temperature melt in the furnace is vigorously stirred by the high-speed oxygen-enriched air injected into the molten pool to promote the physical and chemical reactions in the furnace. The multiphase flow behavior and flow field distribution in the furnace not only determine the efficiency of the metallurgical reaction but also affect the safe service life of the smelting furnace [7]. Therefore, the structural parameters of the furnace body and the flow field distribution in the furnace are very important for the operation of the oxygen-enriched side-blown smelting furnace.
Nowadays, computational fluid dynamics (CFD) is a widely used method with which to study various flow phenomena in different containers. Many scholars have carried out numerical simulations on the melting process of metallurgical equipment, such as top-blown furnaces [8,9], bottom-blown furnaces [10,11,12], and oxygen-enriched side-blown smelting furnaces. Li et al. [13] performed a numerical simulation and optimization on the oxygen lance jet flow in the gas–liquid two-phase flow and obtained the optimal structural parameters of the oxygen lance: the length-to-diameter ratio was 11–11.4, the area ratio was 2.5–2.8, and the diffusion angle was 2.5~3°. Under these conditions, the vacuum in the suction volume reached the maximum value. Zhan [14] studied the phenomenon of molten pool agitation in the experimental furnace under the submerged side-blowing method. The gas–liquid two-phase flow model was used to describe the flow behavior and agitation in the side-blown molten pool. Lee [15] explored the emulsification phenomenon and analyzed the effect of the gas flow rate on the emulsified drop size distribution. The results showed that, as the gas injection flow rate increased, the average diameter of the emulsified droplet volume surface area decreased, and the droplet surface area increased linearly. For the side-blown furnace, Zhu [16] carried out numerical simulations under different injection speeds and injection modes and found that, at the same injection speed, the opposite-blowing mode using low nozzles could increase the average velocity of the melt, leading to its more violent agitation. Liu [17] took an oxygen-enriched side-blown furnace as a prototype, established its water model according to the similarity principle, and analyzed the influence of airflow speed, the submerged depth, and the downward angle on the gas–liquid two-phase flow. The results of the water model experiments and numerical simulation were compared, and it was found that the simulation results obtained by using the realizable k-ε turbulence model were the closest to the experimental results. Uncertainties of material properties, size, and other factors exist and can have an influence during the modeling and simulating process. Hamdia [18] performed a global sensitivity analysis to quantify the uncertainties in modeling soft composites. The approach of deploying a stochastic multiscale in modeling provided a reference and instruction in the study of side-blown furnace numerical simulation. The studies above have carried out numerical simulation or water model experiments on oxygen lance structural parameters, the emulsification phenomenon, and injection mode, etc. However, systematic research needs to be further improved which focuses on the influence of flow field distribution and key parameters such as oxygen lance arrangement on the melting process.
This paper introduced the model establishment, which includes the geometry model, the mathematics, and the water model. Then, the numerical simulation of the furnace was carried out, and the parameters of the bubble were compared with the water model experiment to verify the rationality of the established model. Furthermore, the distribution of the flow field under basic working conditions was investigated using numerical simulation. Lastly, the influence of the lance diameter, lance inclination, bath depth, and lance spacing on the melting process was studied through conducting single-factor numerical experiments and orthogonal experiments with matrix analysis using the simplified model. Meanwhile, the average velocity of the fluid, the turbulent kinetic energy, and the gas rate of the bath were taken as evaluation indicators to determine the suitable range of the parameters. The gas–liquid two-phase flow behavior was optimized with the improvement of the indicators, which could be beneficial for the development of the efficiency of metallurgical reactions and agitation in the side-blown furnace, and industrial tests were conducted to verify the applicability of the numerical simulation. This study found the optimal combination of the lance parameters of the side-blown furnace. The basis and guidance for the structural design and lance arrangement of the side-blown furnace are provided.

2. Model Establishment and Calculation

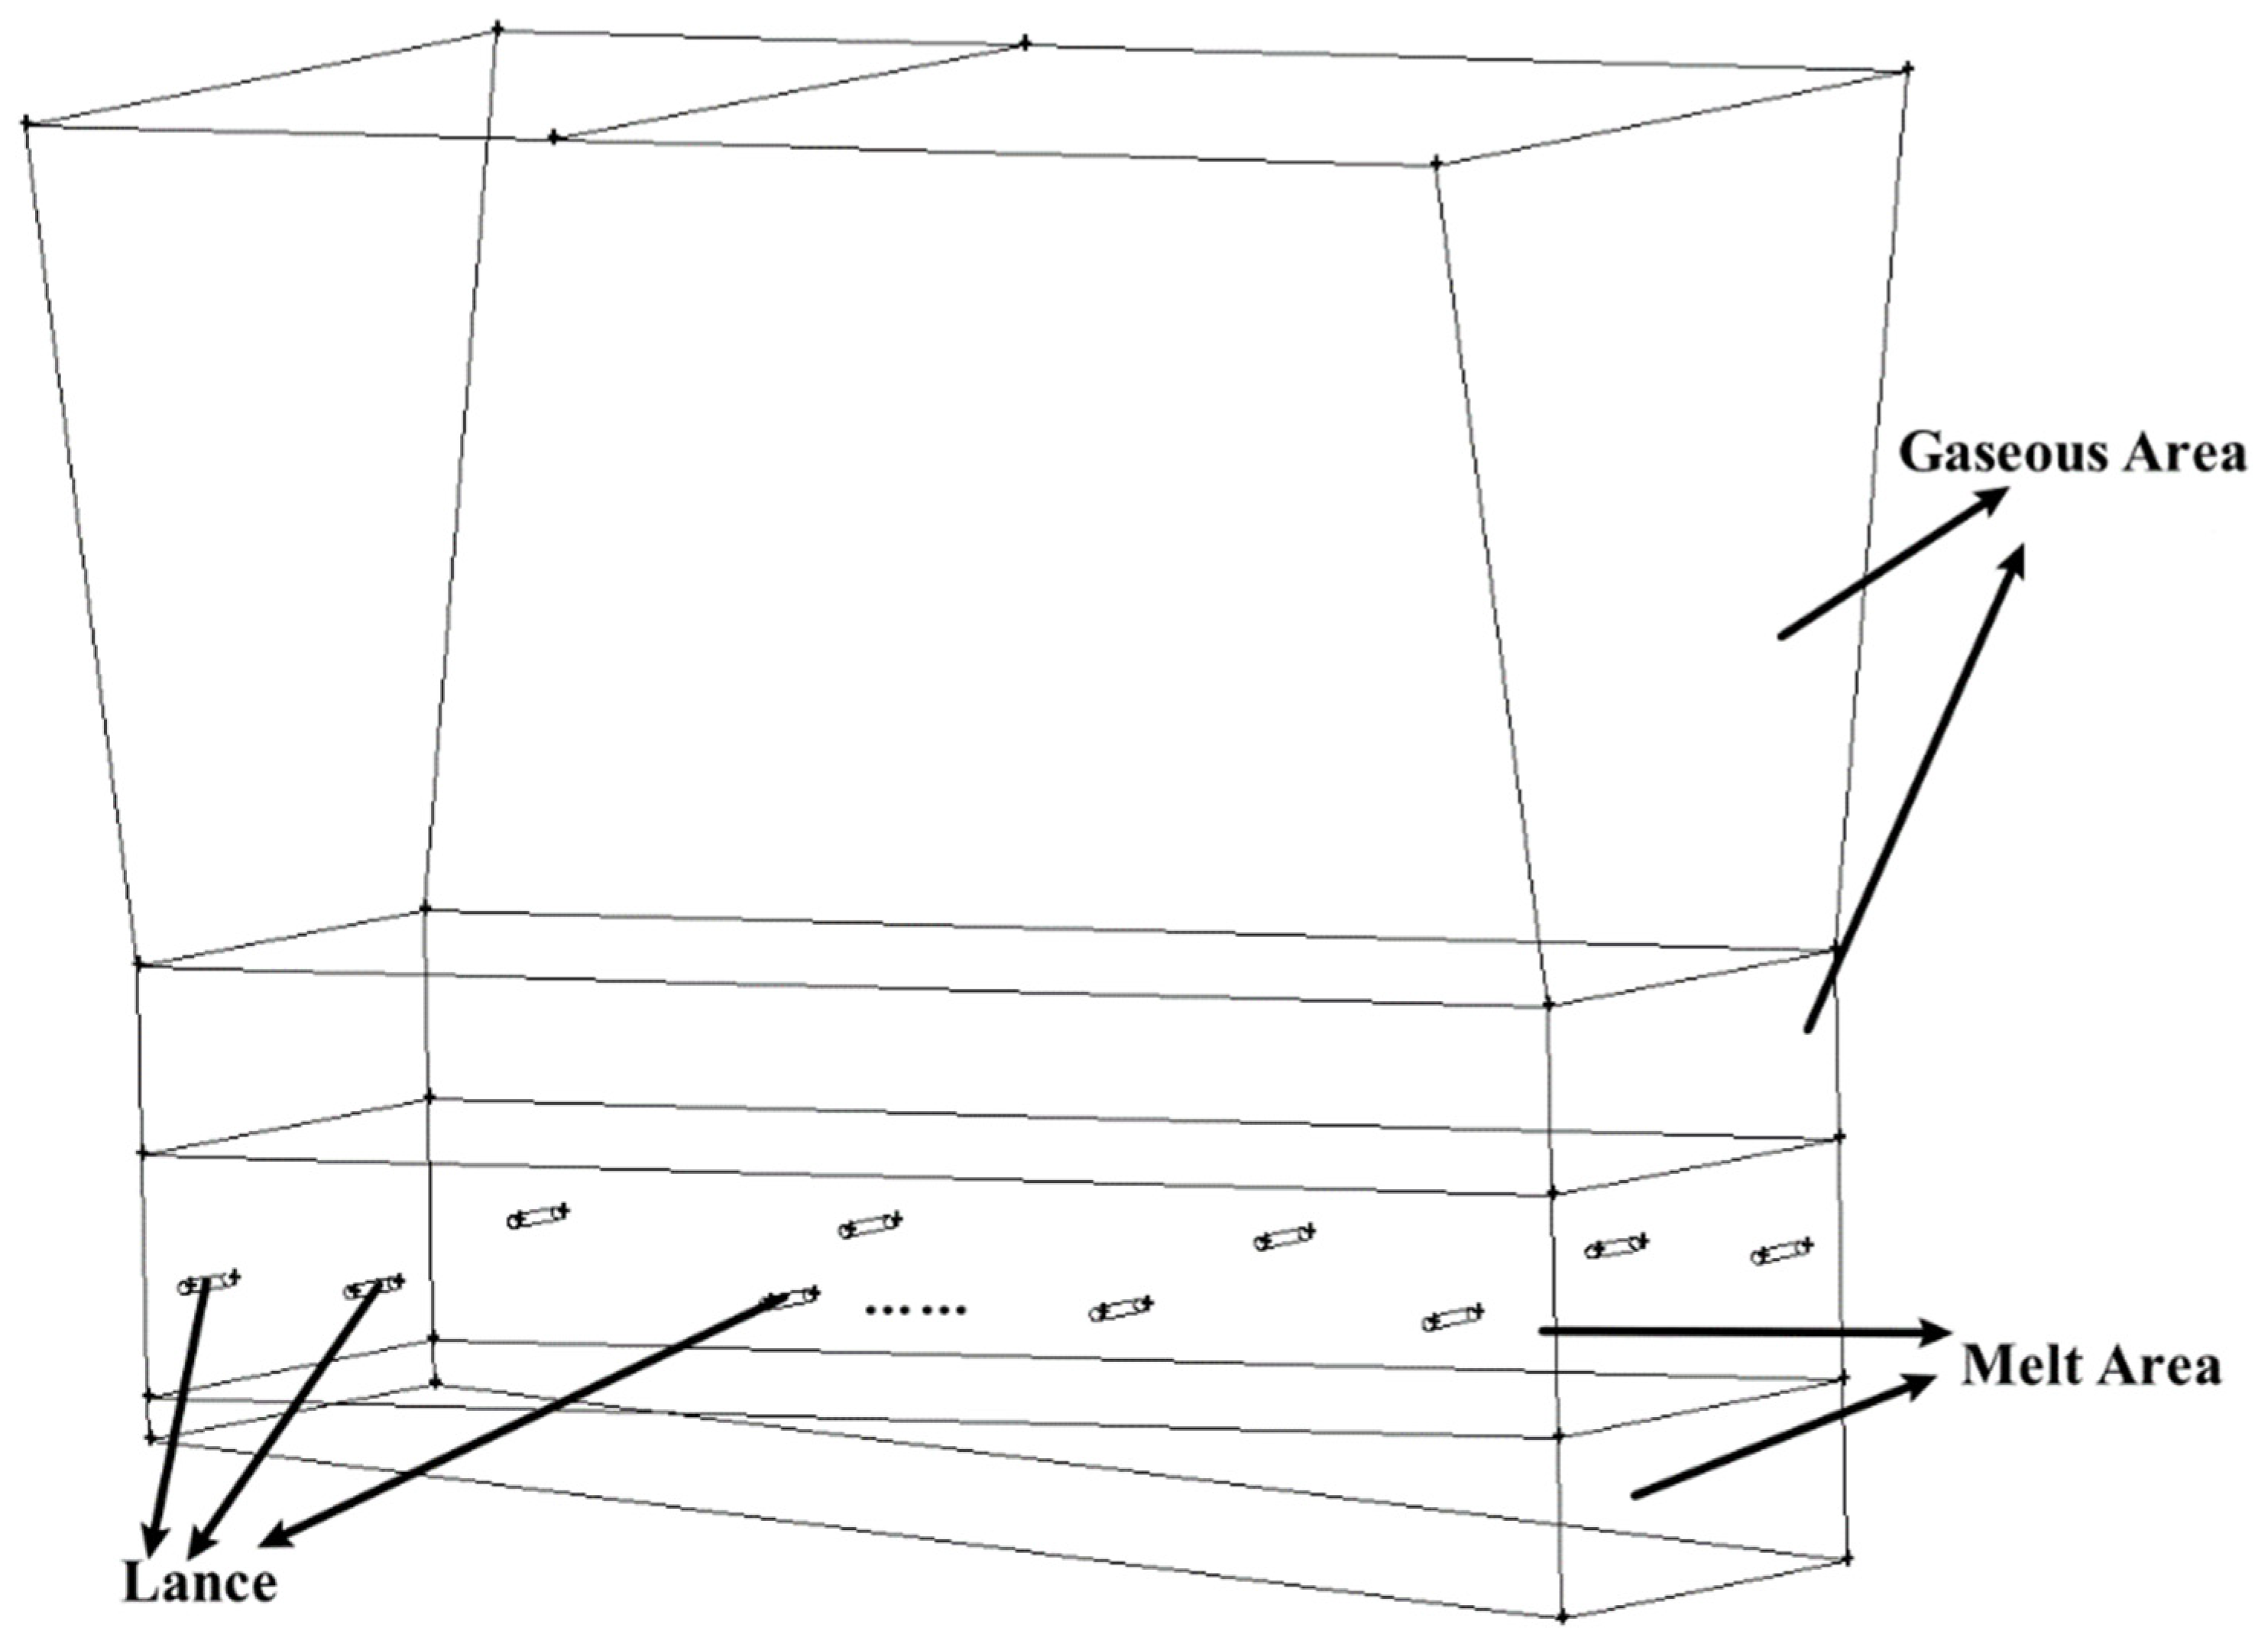
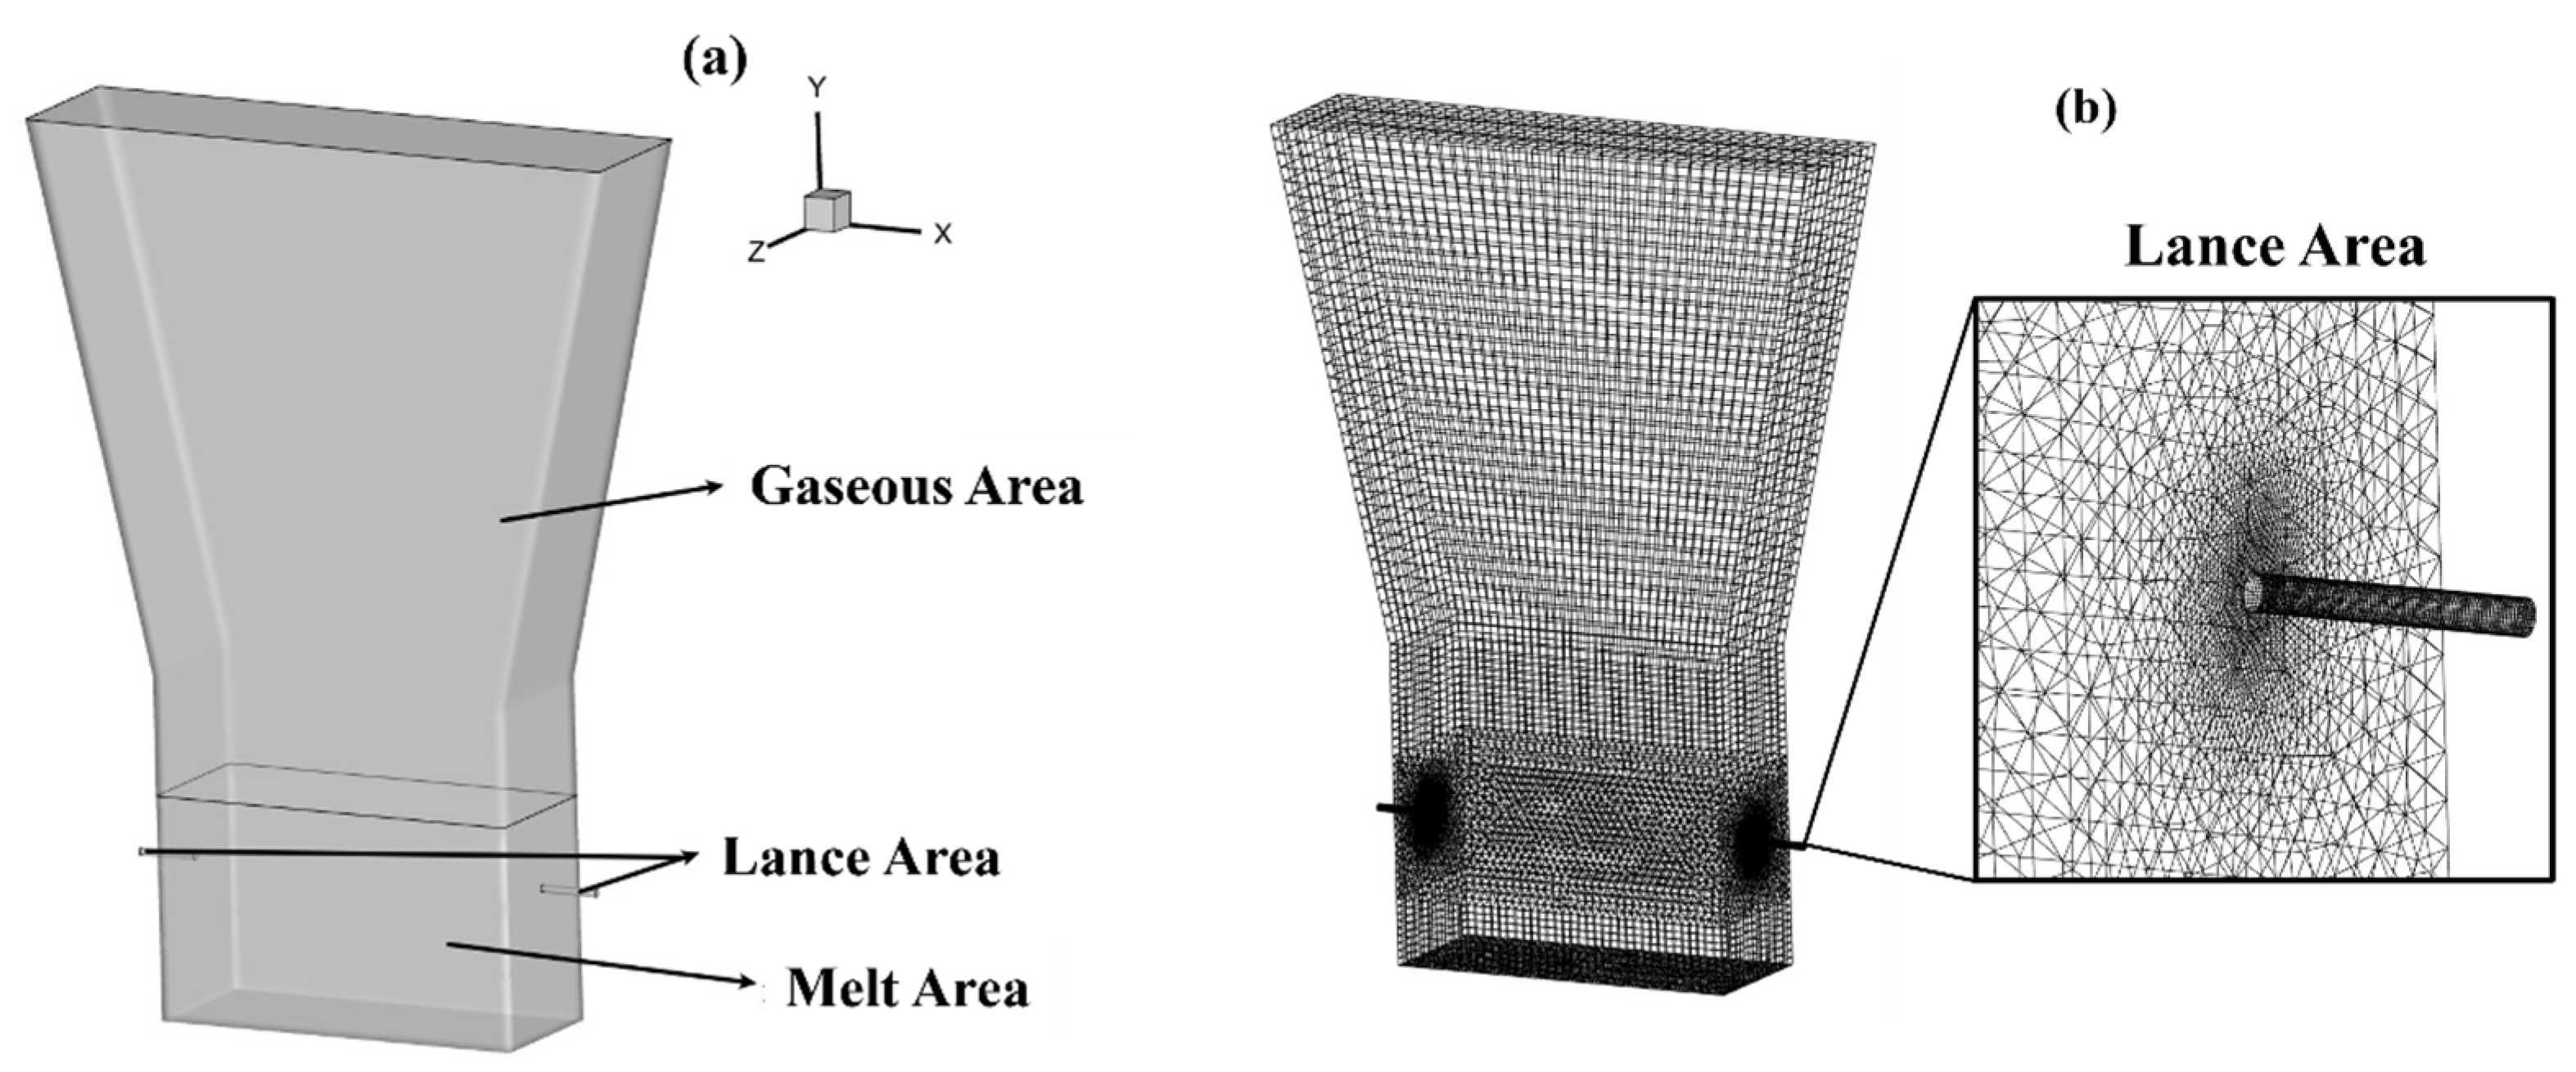
2.1. Geometry Model with Simplification

The oxygen-enriched side-blown smelting furnace located in Guangdong Province in China was taken as the research object. The geometry model of the side-blown furnace was made by using Gambit 2.4.6 with a scale of 1:1 to the actual size and is shown in Figure 1. The length, width, and total height of the furnace were 5.27 m, 2 m, and 4.875 m, respectively. This model was divided into three parts, including a gaseous area, melt area, and lance for numerical simulation and data measurement. The melt area was 0.945 m high on the lower side and 1.4 m high on the higher side. Two rows of lances were vertically distributed on both sides of the furnace with a diameter of 0.04 m and a distance of 0.31 m from the wall.
Before conducting the numerical simulation, a reasonable simplification and assumption of the model were required to accelerate the calculation [19]. This study focused on the behavior of gas–liquid two-phase flow in the side-blown furnace, and the purpose of this was to improve the melting process in the side-blown furnace and optimize the key parameters of the furnace. Thus, the simulation model can be simplified and assumed as follows [17]:
The influence of the differences between the physical parameters of the slag layer and the copper matte could be ignored; the entire melt in the melt pool area could be considered copper matte.
The influence of the chemical reactions and the process of feeding and discharging in the furnace was not considered due to the complexity of the flow and reaction process in the bath.
The heat dissipation of the furnace wall and the heat transfer effect of the copper water jacket were not considered. The wall was considered a no-slip boundary, and the standard wall function was used in the near-wall region.

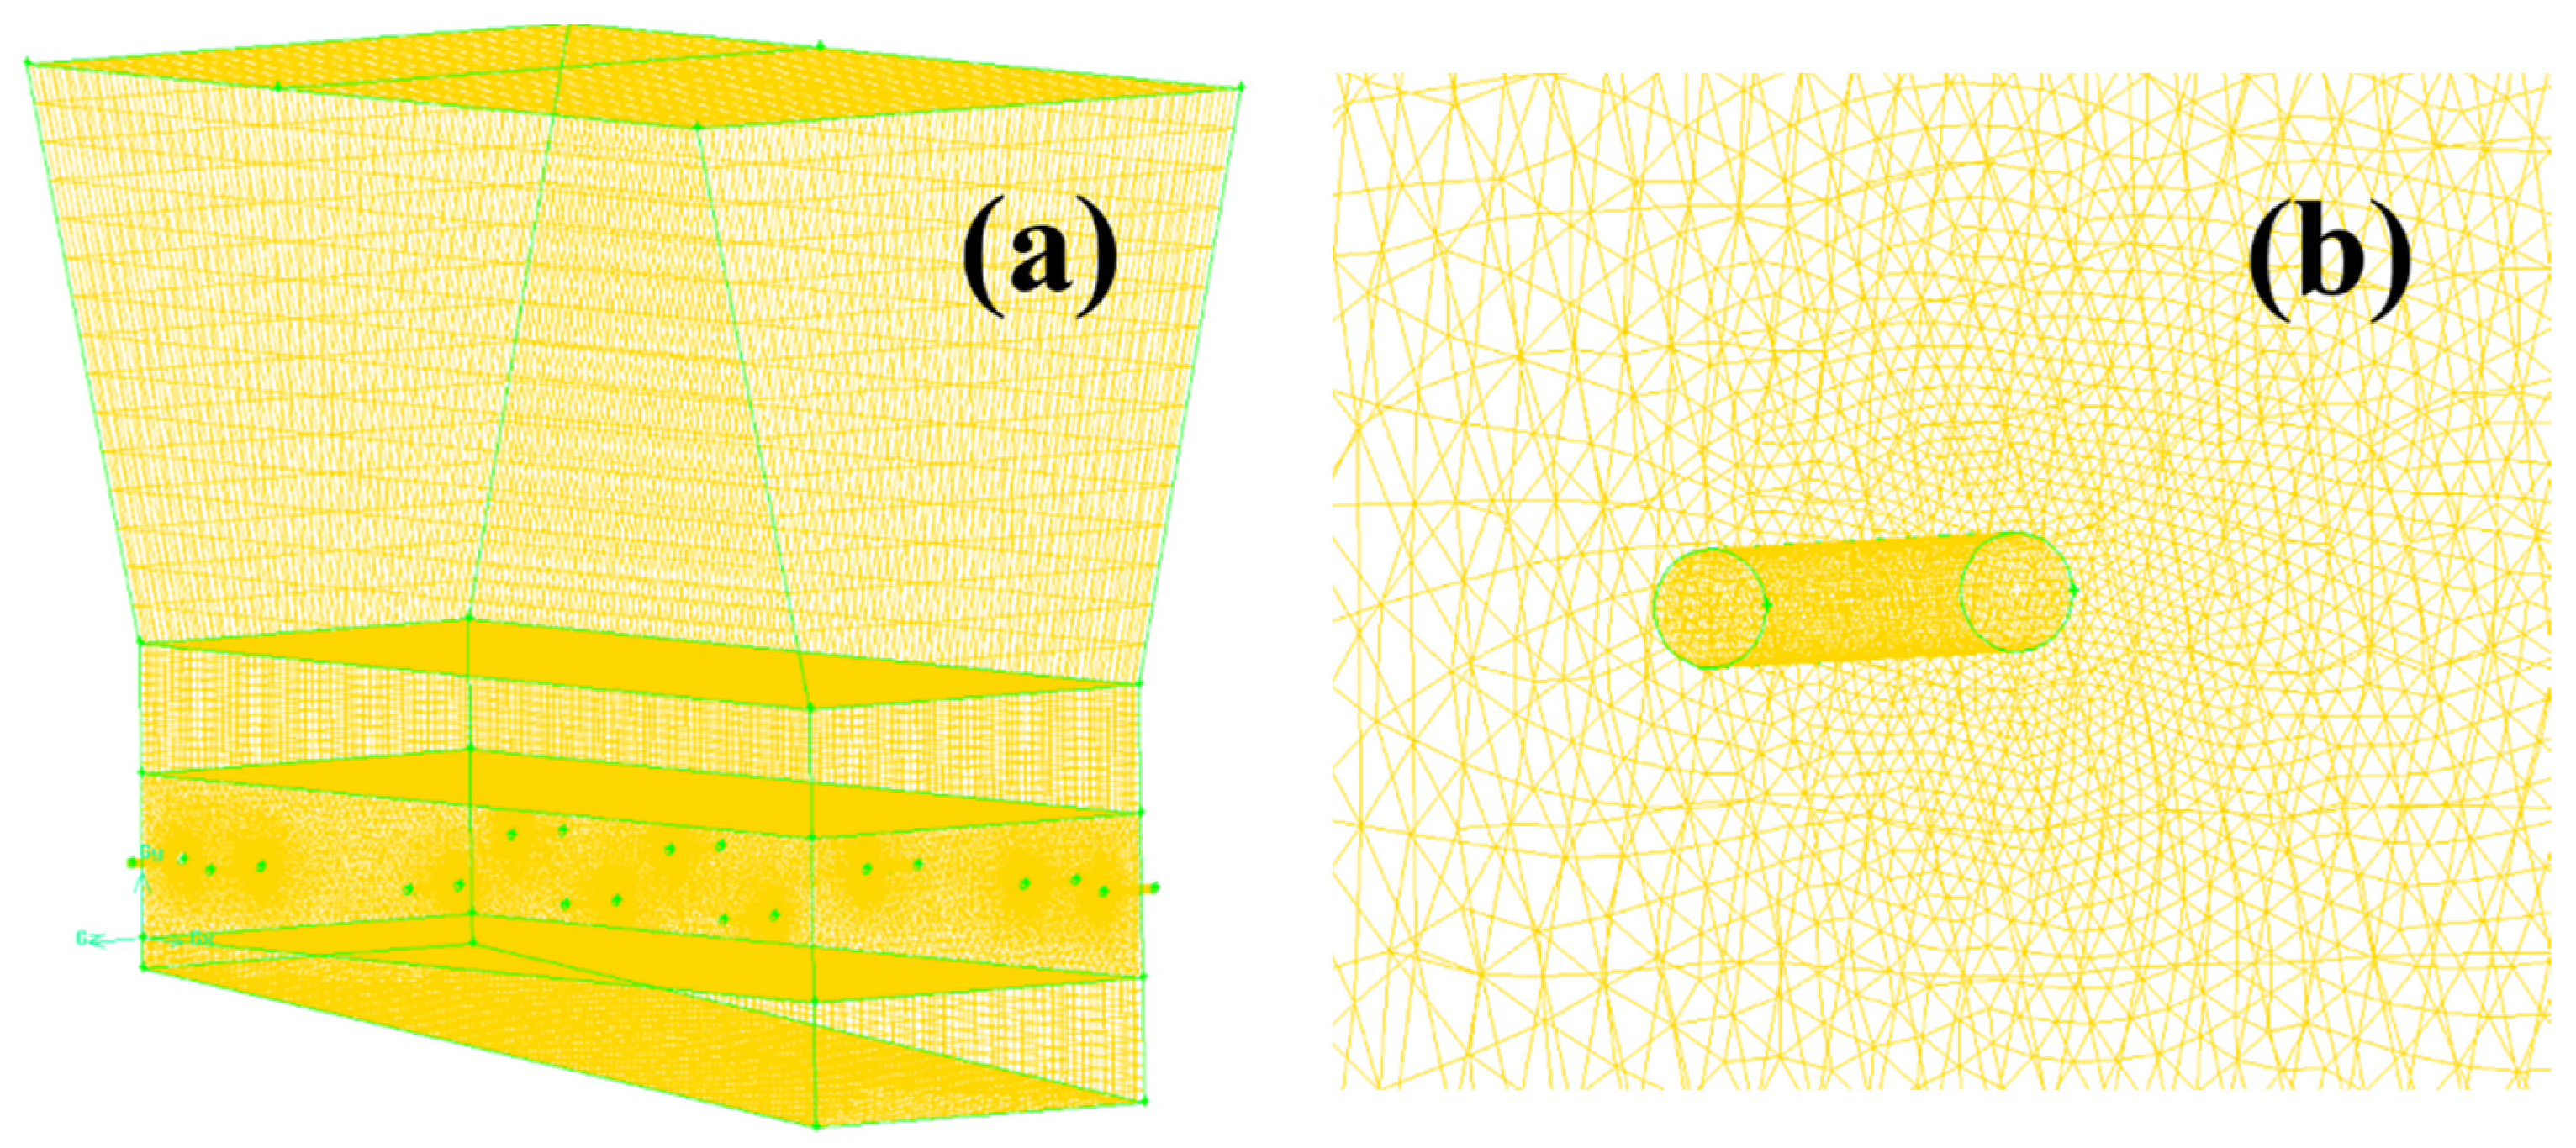
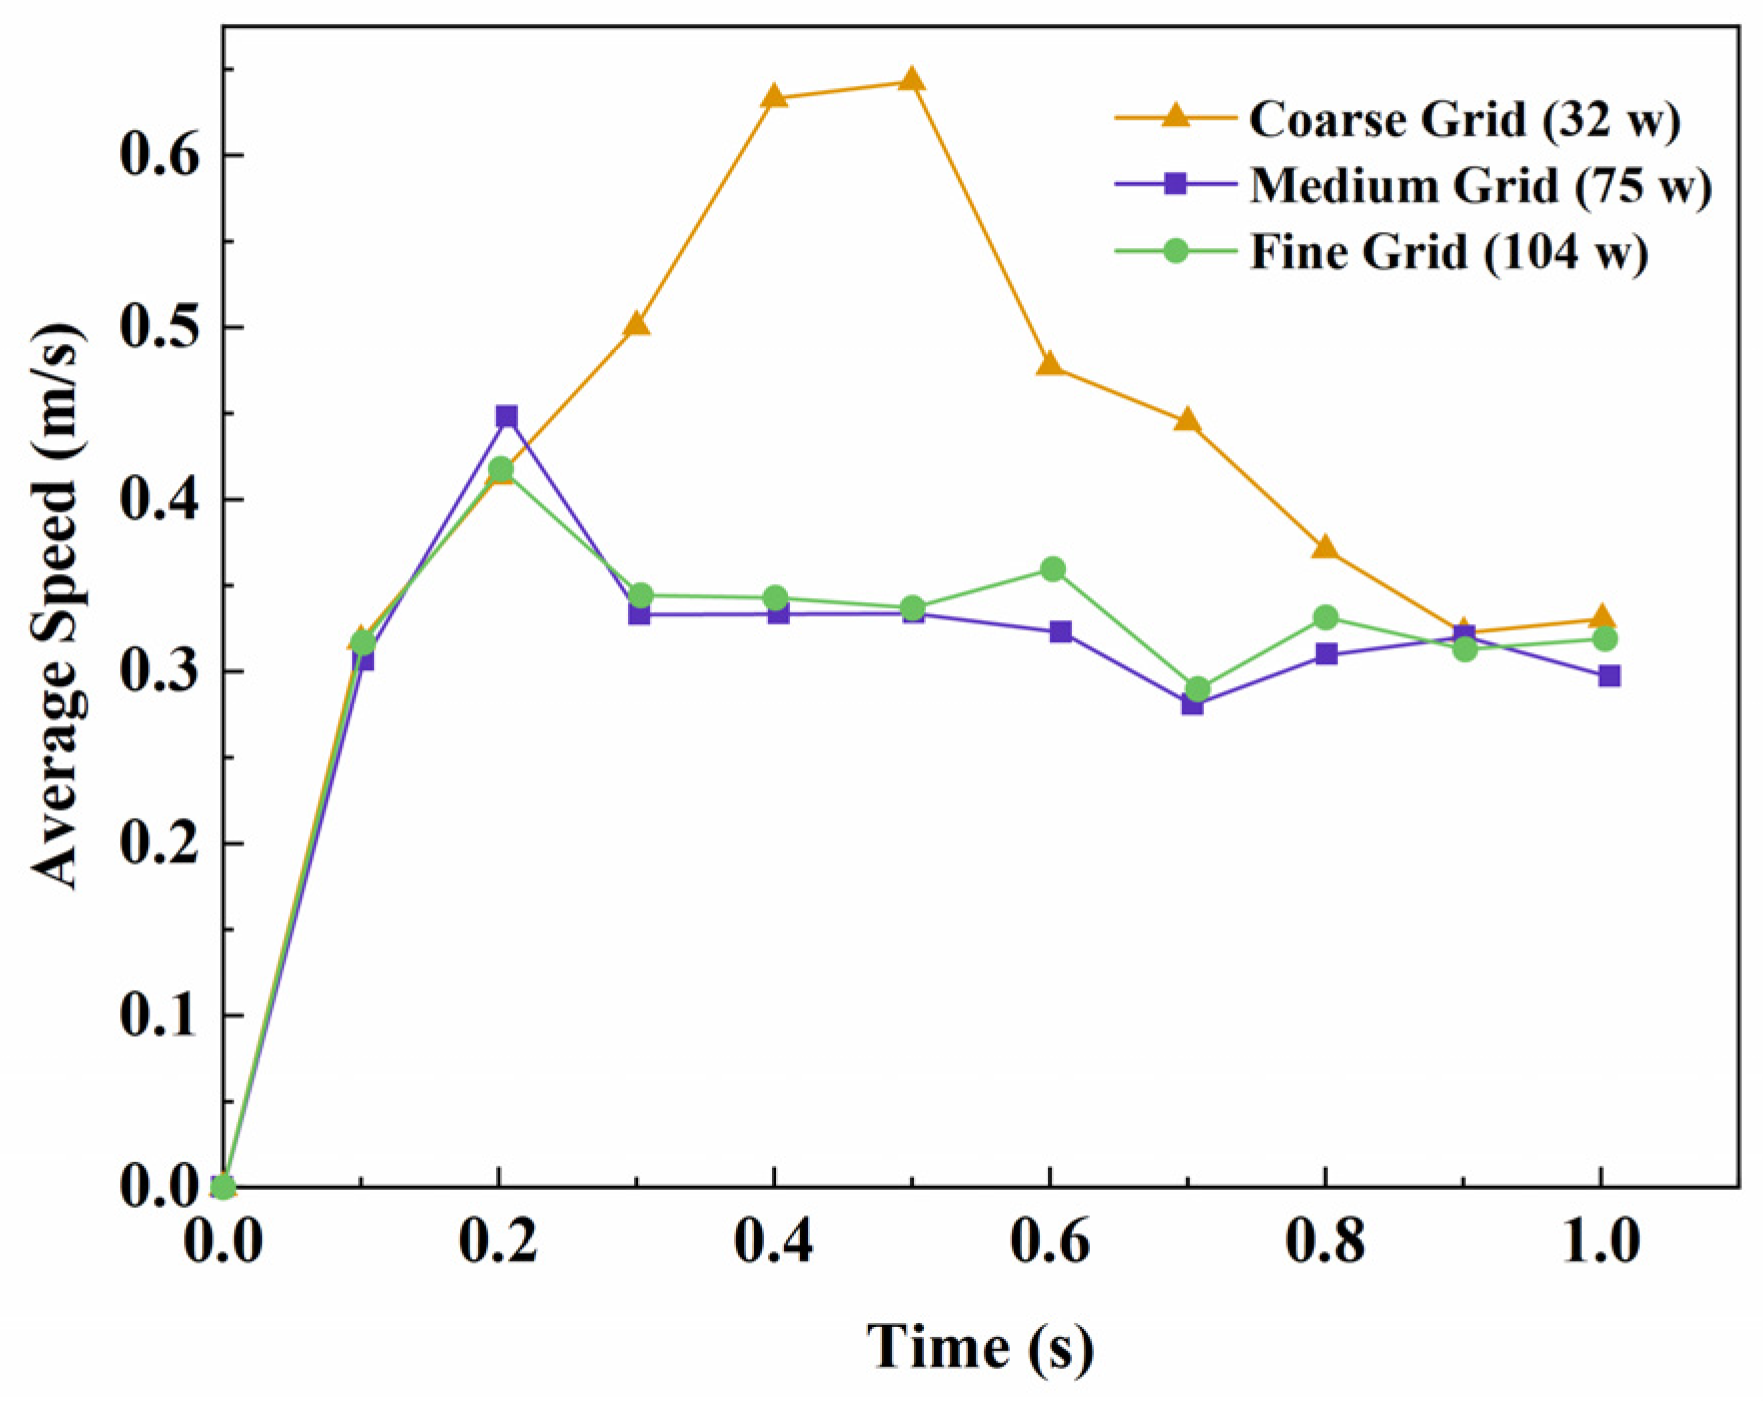
2.2. Grid Division and Independence Test

The grid division of the model is shown in Figure 2, and the detailed information on the grid can be seen in Table 1. A structured grid partition was used in the calculation area and the interval count of the face mesh on the lance inlet was set at 30 to meet the necessary refinement area near the junction of the lance and melt region. The lance area meshed first, and the following meshing with an interval size of six was conducted in the melt area. The quantity of the elements in the whole model was 748,909. The max aspect ratio was 1.646, the max cell skewness was 0.543, and the max cell squish was 0.462.
The grid independence test was conducted with the aim of choosing a suitable grid that can ensure the accuracy and efficiency of numerical simulations. We set three different sizes of grids from coarse to fine by changing the interval count of the face mesh on the lance and conducted calculations under the same condition as other parameters with these grids. The optimal grid for numerical simulation was determined by considering the trends in the average velocity of bath fluids and the calculative time obtained in the calculation results.

2.3. Mathematic Model and Calculation Method

2.3.1. Basic Governing Equations

A VOF (volume of fluid) multiphase flow model was used for the numerical simulation of the side-blown furnace. Different fluid components share a set of momentum equations, and the volume rate occupied by each fluid component is recorded in each calculation cell within the whole flow field during the calculation [20]. Many examples in the research have shown that the VOF multiphase flow model is suitable for liquid filling in containers and large bubble flow in liquids [7,19,21,22]. Therefore, the gas–liquid two-phase flow in the oxygen-enriched side-blown furnace was simulated using the VOF two-phase flow model.
(1)
Continuity Equation
t ( ρ m ) + ( ρ m v m ) = 0
In Equation (1), ρ m is the density of the mixture phase, kg/m3, v m is the velocity of the mixture phase, m/s, and t is the time, s.
(2)
Volume Fraction Equation
The tracking of the interfaces between the phases was accomplished via the solution of a continuity equation for the volume fraction of one or more of the phases [23]. The equation is shown as follows [23,24]:
t ( α q ρ q ) + ( α q ρ q v q ) = S α q + p = 1 n ( m ˙ p q m ˙ q p )
In Equation (2), α q is the volume fraction of phase q; ρ q is the density of phase q, kg/m3; t is the time, s; represents the operator symbol whose expression is = ( x + y + y ) ; v q is the velocity of phase q, m/s; m ˙ p q represents the mass transfer from phase p to phase q; m ˙ q p is the mass transfer from phase q to phase p; and S α q is the constant or user-defined mass source for each phase.
(3)
Momentum Equation
In the VOF model, a single momentum equation was solved throughout the domain, and the resulting velocity field was shared among the phases. The momentum equation is shown below.
t ( ρ v ) + ( ρ v ) v = p + [ μ ( v + v T ) ] + ρ g + F
In Equation (3), ρ represents the density of the fluid, kg/m3; v is the velocity of the fluid, m/s; μ represents the dynamic viscosity, Pa·s; g is the gravitational acceleration, m/s2; and F is the volume force acting on the control volume, N.

2.3.2. Turbulence Model

The realizable k-ε model was used as the turbulence model in the simulation process. The modeled transport equations for k and ε in the realizable k-ε model were as follows [23]:
t ( ρ k ) + x j ( ρ k u j ) = x j [ ( μ + μ t σ k ) k x j ] + G k + G b ρ ε Y M + S k
t ( ρ ε ) + x j ( ρ ε u j ) =   x j [ ( μ + μ t σ ε ) ε x j ]                   + ρ C 1 S ε ρ C 2   ε 2 k + v ε   +   C 1 ε ε k C 3 ε G b + S ε
In these equations, C 1 = max [ 0.43 , η η + 5 ] ; η = S k ε ; S = 2 S i j S i j ; G k is the generation of turbulence kinetic energy due to the mean velocity gradients, kg·(m−1·s−3); G b represents the generation of turbulence kinetic energy due to buoyancy, kg·(m−1·s−3); Y M is the contribution of the fluctuating dilatation in compressible turbulence to the overall dissipation rate; C 2 and C 1 ε are constants; σ k and σ ε represent the turbulent Prandtl numbers for k and ε, respectively; S k and S ε are user-defined source terms; μ t is the turbulent viscosity, Pa·s; μ t = ρ C μ k 2 ε ; and μ represents dynamic viscosity, Pa·s.

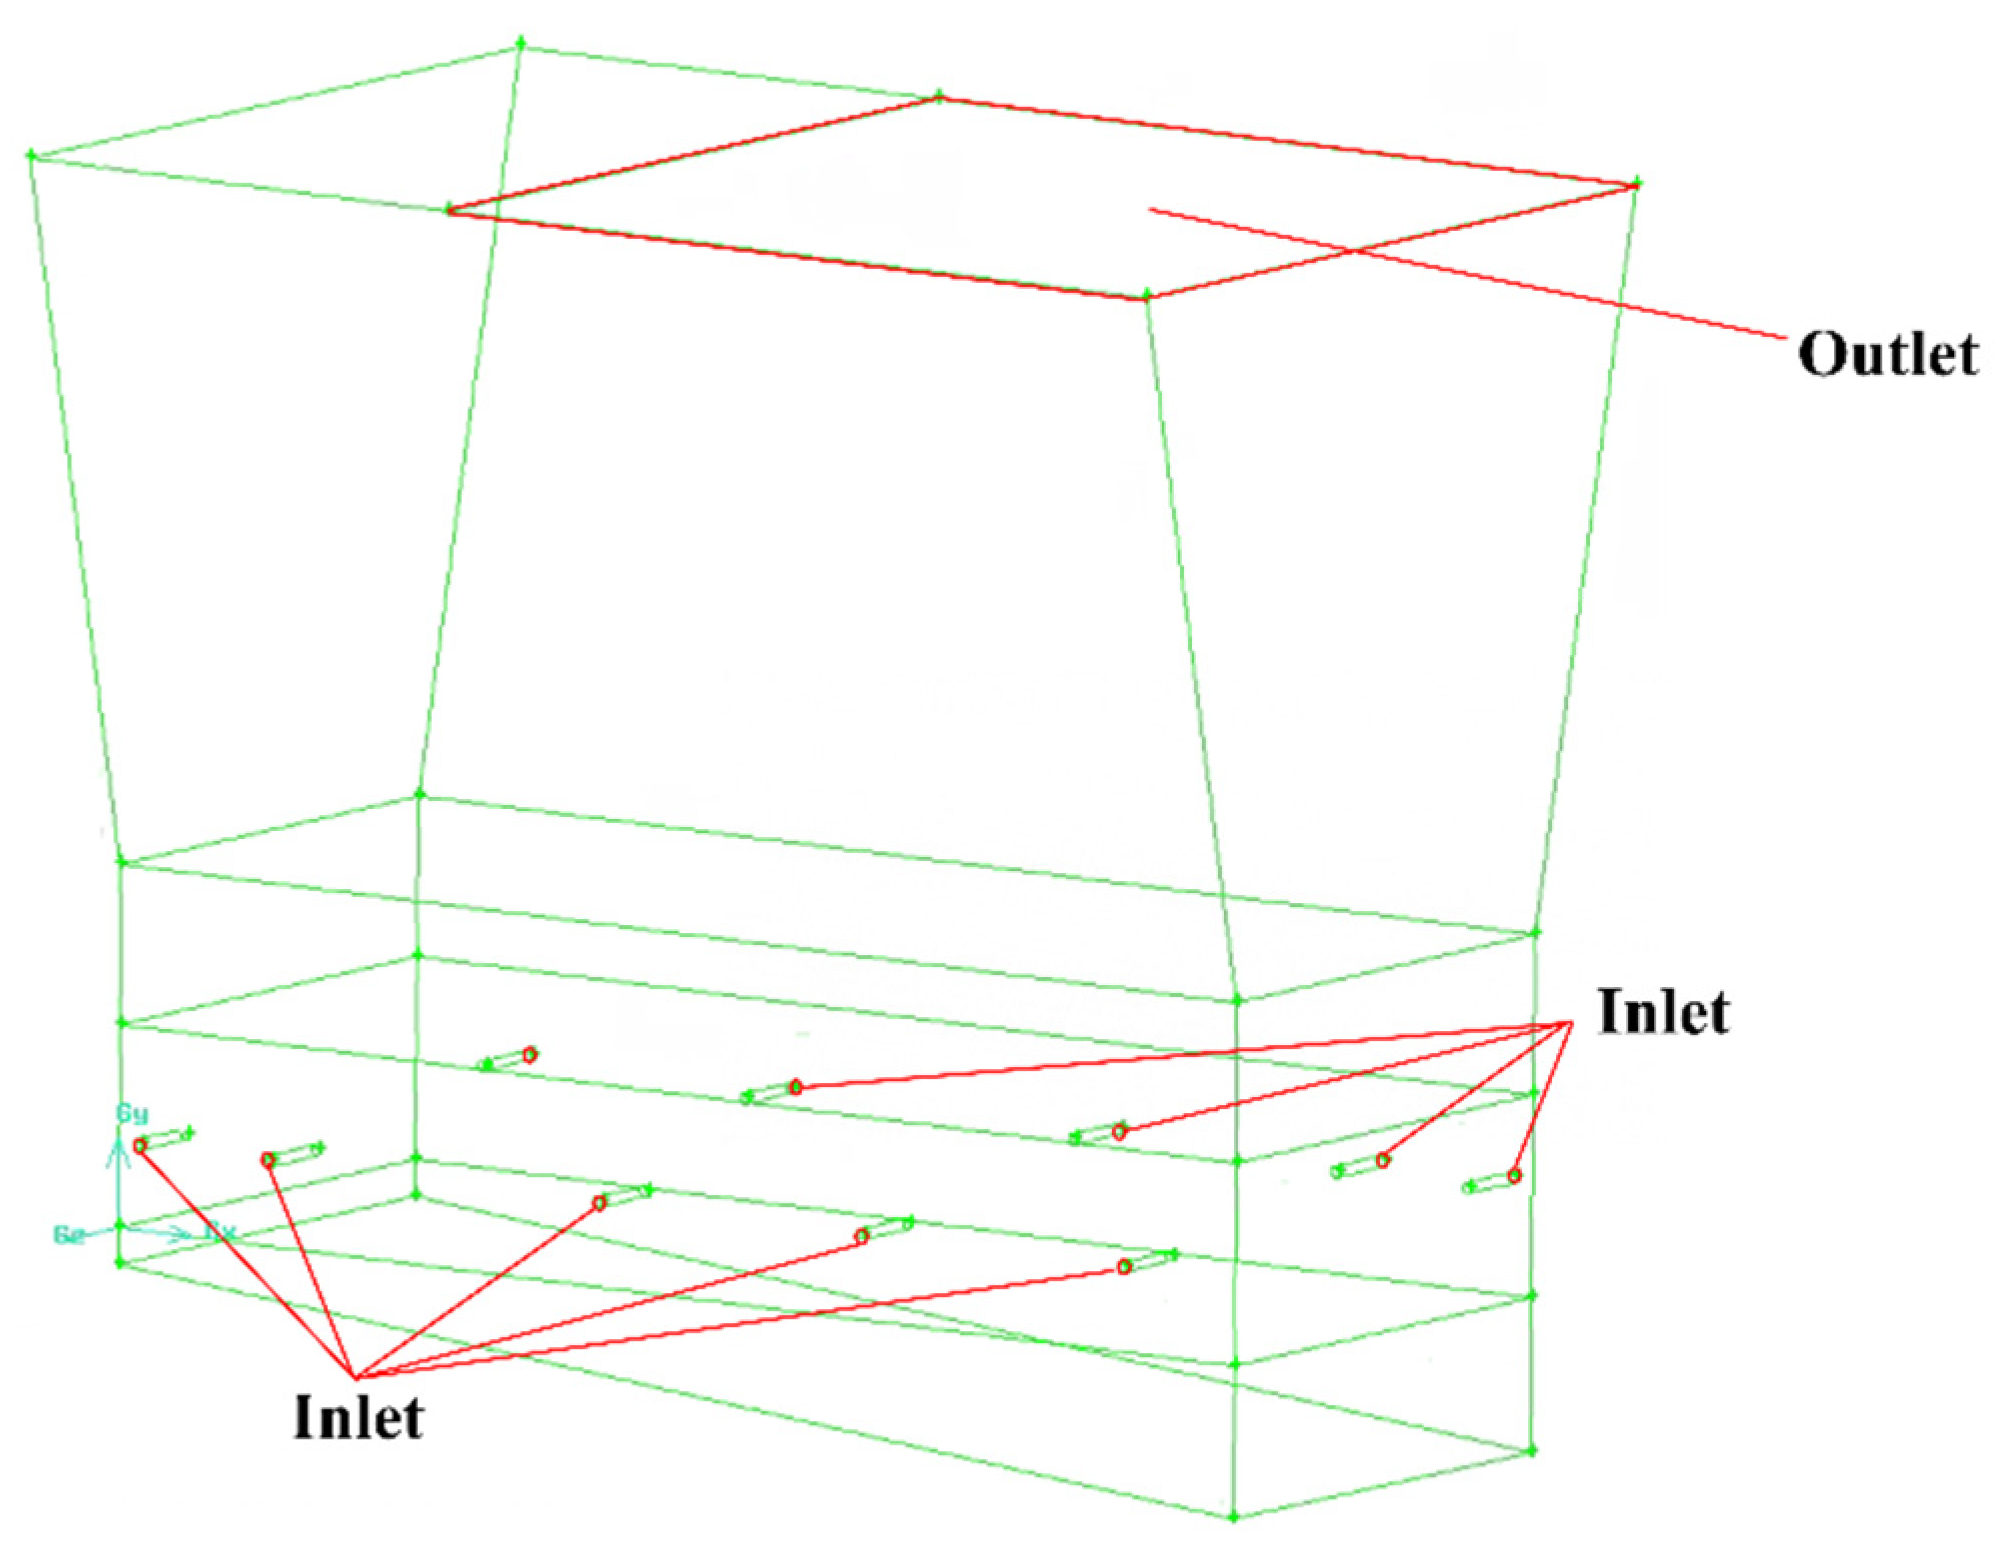
2.3.3. Boundary Conditions and Property Parameters of Material

Figure 3 shows the inputs and outputs of the boundary conditions. According to the basic working conditions provided by the smelting plant, the boundary conditions were calculated and set as follows:
(1)
Inlet conditions
The oxygen lance inlet was set up as a mass flow inlet with a flow rate of 0.3019 kg/s. The turbulence intensity was 3.1 %, and the hydrodynamic diameter was 0.04 m.
(2)
Outlet conditions
The outlet of the furnace was connected to the waste heat boiler and the pressure of the gaseous area was rendered negatively due to the basic working conditions. Therefore, the outlet of the gaseous area was set as the pressure outlet with a pressure of −50 Pa.
(3)
Wall boundary conditions
The heat dissipation at the wall surface was ignored, and the wall was treated as an adiabatic. It can be considered that the fluid velocity at the wall surface was zero, and no-slip wall boundary conditions were used. The near-wall region was treated by the standard wall function.
(4)
Material
Under reasonable simplification and assumptions, the side-blown furnace mainly contained two fluids, copper matte and oxygen-enriched air. The physical parameters of copper matte were referenced from the related literature [25], and the oxygen-enriched air in the gas mixture was 70% oxygen and 30% nitrogen. The property parameters of copper matte and oxygen-enriched air are shown in Table 2.

2.3.4. Solver Settings

The unsteady calculation was used for the multiphase flow, and the adaptive step size was adopted with the initial value of 0.00001 s. The pressure–velocity coupling mode adopted the PISO format. Pressure discretization used the PRESTO! format. The second-order upwind was used for momentum calculation to improve accuracy.
The initial conditions were computed from all zones, and the reference frame was relative to the cell zone. The lance area and gaseous area were patched with the air phase, while the melt area was initialized with a matte phase. The initial temperature in the lance and melt area was set at 298.15 K and 1573.15 K, respectively, according to the basic working conditions.

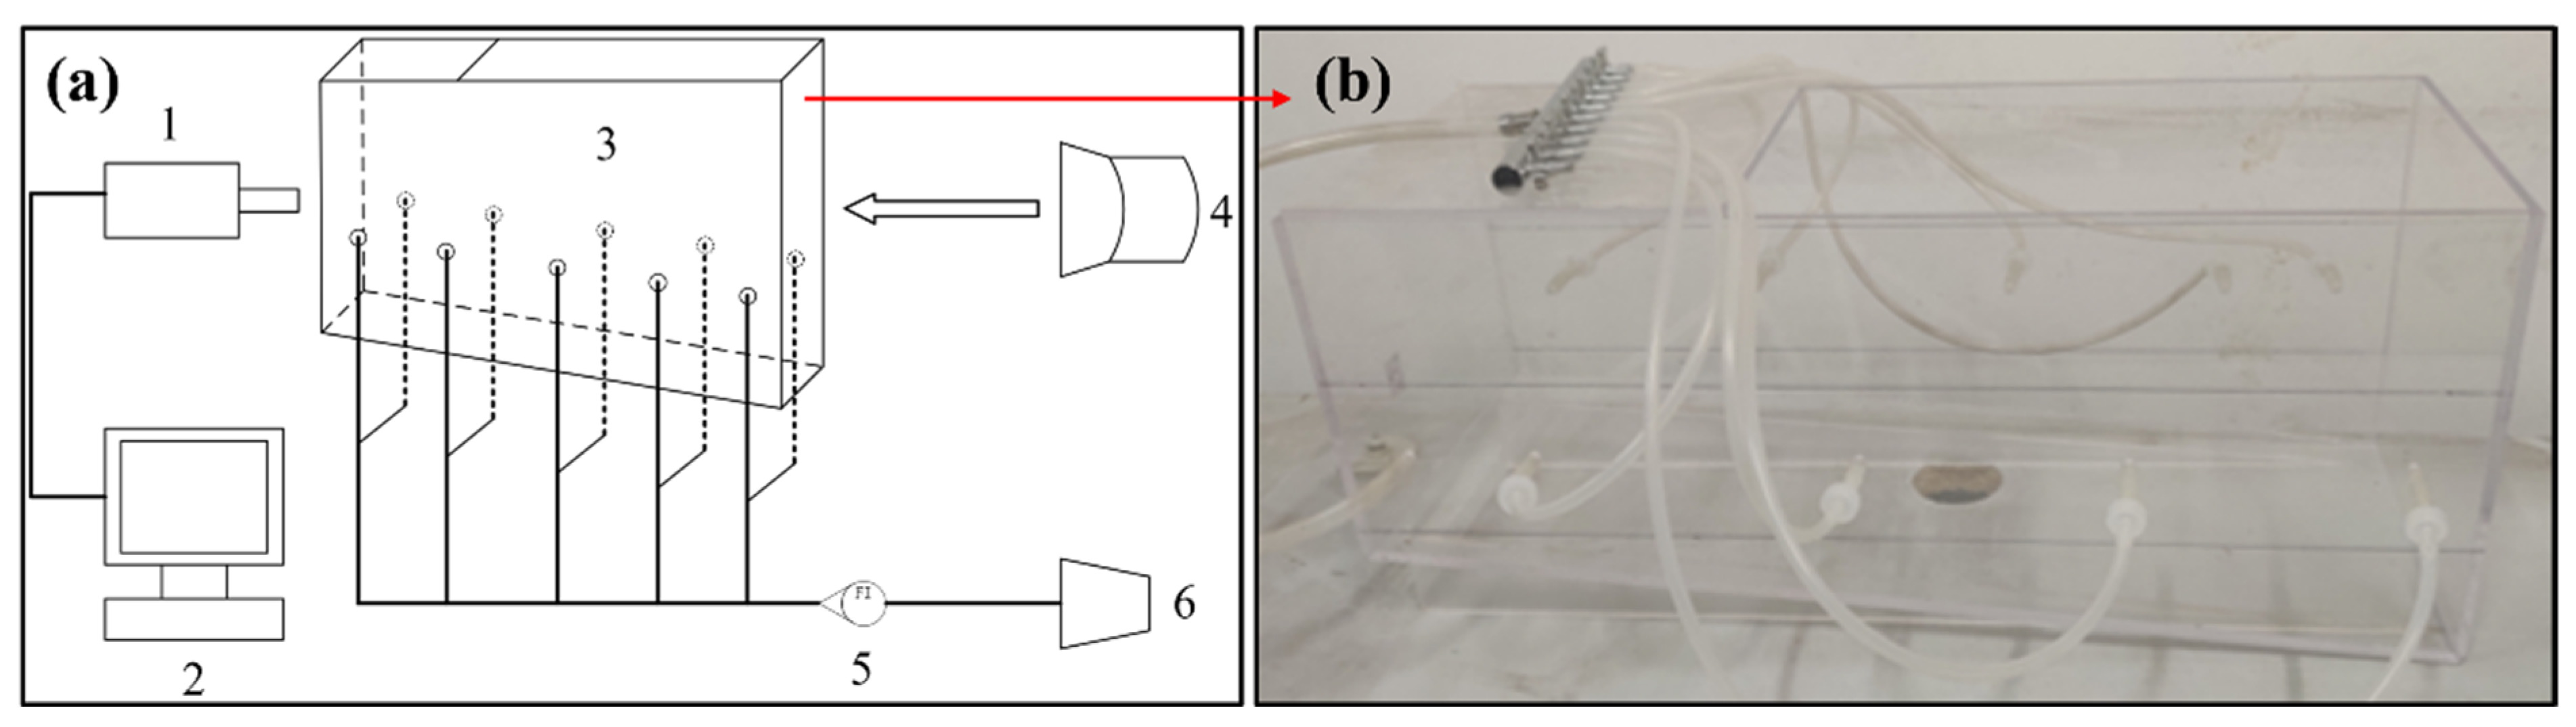
2.4. Establishment of the Water Model

Based on the similarity principle [26], the research object was used as a prototype to build the water model experimental platform in the ratio of 10:1 to verify the rationality of the calculation. The connection diagram of the water model experimental device and the schematic of the water model are shown in Figure 4. To ensure the similarity of size and kinetics in water model experiments, the modified Froude number was used as the similarity standard number based on the similarity theory.
The parameters of the oxygen lance injection in the water model were solved through equating the Froude number of the numerical simulation and the water model experiment. The modified Froude number is defined as F r = u 2 g L ρ g ρ l , where u is the characteristic velocity, m/s; g is the acceleration of gravity, m·s−2; L is the characteristic length, mm; and ρ g ρ l is the gas–liquid density ratio. In the oxygen-enriched side-blown smelting process:
F r E q u i p m e n t = u 2 g L ρ g ρ l = 180 2 9.8 × 0.04 × 1.23514 4600 = 26.58
F r E q u i p m e n t = F r M o d e l
The inlet velocity v Model and the inlet volume flow Q V of the oxygen lance in the water model experiment can be calculated as follows:
v M o d e l   = v E q u i p m e n t 2 ρ g E q u i p m e n t L M o d e l ρ l M o d e l L E q u i p m e n t ρ l E q u i p m e n t ρ g M o d e l = 197 2 × 1.235 × 0.004 × 1000 0.04 × 4600 × 1.257 = 28.79   m / s
Q V = S v M o d e l = 3.14 × 0.002 2 × 28.79 = 21.7   L / min
Water and air generated by an air pump were used as the experimental materials. The data were collected using a high-speed camera to photograph the water model blowing process, and the results were analyzed based on the longitudinal section of the oxygen lance. The reliability of the numerical simulation was ensured by comparing the shape and size of the bubble. Hence, the results of the numerical simulation can be trusted to verify the water model experiment.

2.5. Numerical Simulation

All the numerical simulation cases were carried out using Fluent 6.3.26. The calculations were conducted using the dual CPU with 48 cores (Intel Xeon Gold 6248R CPU*2) based on the high-performance computing service platform at Central South University.

2.5.1. Basic Working Conditions

A numerical simulation under basic working conditions was carried out with the geometry model established, and the calculation settings are shown above to study the flow field and temperature distribution in the side-blown furnace. The results were extracted from two cross-sections and two lance longitudinal sections in the furnace after the calculating process became steady, and the distribution of the gas volume fraction, velocity, and temperature was analyzed, respectively, to provide guidance for the optimization of the key parameters.
In the oxygen-enriched side-blown melting process, the four parameters of oxygen lance diameter, oxygen lance inclination, oxygen lance spacing, and bath depth had a significant impact on the melting process [27]. The research and optimization of these parameters can help improve the flow field distribution in the furnace so that the metallurgical reaction efficiency and the effect of agitation in the molten pool can be enhanced. Suitable indicators, including the melt average velocity, the melt average turbulent kinetic energy, and the bath gas rate, were chosen to evaluate the parameters.
The melt average velocity can be described as:
u ρ d V ρ d V = i = 1 n u i ρ i | V i | i = 1 n ρ i | V i |
In Equation (10), u represents the melt average velocity, ρ is the density, and V is the volume. When the melting process had nearly stabilized, the higher melt velocity provided power for the bubble expansion movement and the agitation in the melt area, which was beneficial for the improvement in the uniform mixing and the full reaction of the metallurgical materials. The oxygen-enriched air injected by the side-blown furnace wall oxygen lance formed a strong turbulent flow in the melt area, so the average turbulent kinetic energy of the fluid was an important indicator in measuring the development or decline of the turbulent flow and the ability of turbulent mixing. It was necessary to ensure the average turbulent kinetic energy as much as possible to improve the effect of agitation in the molten pool. The bath gas rate represents the percentage of the gas phase in the melt pool to the volume of the gas–liquid mixture. A higher gas rate means a larger gas–liquid interaction area and that a higher gas-phase concentration will be produced, which is conducive to the metallurgical reactions in the melt bath.

2.5.2. Single-Factor Numerical Experiment

A single-factor analysis was conducted to obtain a better range of the key parameters. The simplified model with a pair of oxygen lances was used in the single-factor numerical simulation to reduce calculation costs. Figure 5 shows the geometry model and the grid division diagram under single-factor analysis. The grid division method, boundary conditions, material parameters, and the solver settings were all settled in the same way as the original model, while the change in the key parameters reflected the corresponding model. For example, as the lance diameter grew from 20 mm to 60 mm, the inlet conditions changed in the meantime.
In summary, three evaluation indicators were used in the single-factor analysis, and the numerical simulations were carried out using the simplified model. The influence of each parameter during the smelting process and the corresponding optimal value range can be obtained using the results of the numerical simulation.

2.5.3. Multifactor Comprehensive Optimization

Orthogonal experiments were performed to optimize the key parameters and consider multifactor comprehensive influences. Based on the results obtained in the single-factor analysis, the configuration of the factors’ level and the design of the orthogonal experiments are shown in Table 3 and Table 4. A numerical simulation was used to carry out nine groups of experiments alongside the evaluation indicators of the melt average velocity, melt turbulent kinetic energy, and bath gas rate with each experiment, which were obtained.
Matrix analysis is a method that can calculate the weight of each level of each factor and quickly determine the optimal parameter combinations and the influential order of the factors. The matrix analysis was performed to deal with the results and four matrixes, which were defined as shown below.
(1)
Definition I: Indicator layer matrix M
If there are l factors in the orthogonal experiment, and each factor has m levels, then the average value of the experimental evaluation indicator on the jth level of the factor Ai can be defined as kij (l = 4, m = 3). The larger the three evaluation indicators of the orthogonal experimental results were, the better; this led to Kij = kij and established the matrix.
M = [ K 11 0 0 0 K 12 0 0 0 K 1 m 0 0 0 0 K 21 0 0 0 K 22 0 0 0 K 2 m 0 0 0 0 K 31 0 0 0 K 32 0 0 0 K 3 m 0 0 0 0 K l 1 0 0 0 K l 2 0 0 0 K l m ]
(2)
Definition II: Factor layer matrix T
We observed that T i = 1 / j = 1 m K i j and this established the matrix.
T = [ T 1 0 0 0 T 2 0 0 0 T l ]
(3)
Definition III: Level layer matrix S
The range of factor Ai in the orthogonal experiment was set as si, where S i = s i / i = 1 l s i , and established the matrix.
S = [ S 1 S 2 S l ]
(4)
Definition IV: Weight matrix ω
The weight matrix was established to judge the weight size of each factor and level with the influences on the evaluation indicators.
ω = M T S
After the corresponding calculations, the weight of the impact of each factor and level on the evaluation indicators of the experimental results could be intuitively analyzed from the weight matrix. Based on this, the primary and secondary order of the factors and the optimal parameter combination could be determined.

3. Results and Discussion

3.1. Grid Independence Test

Three different sizes of grids were established based on a different interval count of the face mesh in the oxygen lance, with the average velocity of the bath fluid being used as the evaluation indicator. The grids were divided from coarse to fine with the element numbers 322,445, 748,909, and 1,044,726, respectively. The calculations were conducted with these three sizes of grids, and the distribution of the bath fluid average velocity with time under different element numbers is shown in Figure 6. The results of the medium grid and fine grid were similar, with the same change in patterns, while the coarse grid was deviant with a large fluctuation in the average velocity. The average velocity of bath fluids under three sizes of grids when the calculation was nearly stabilized is shown in Table 5. The average velocity of the fluid was larger in the coarse grid, while it was almost equal in medium and fine grids. However, with the increase in the element numbers, the calculation cost and the time required increased significantly. Therefore, the medium grid with 748,909 elements was chosen as the optimal grid for the numerical simulation of the side-blown furnace, taking the calculation cost and accuracy into consideration.

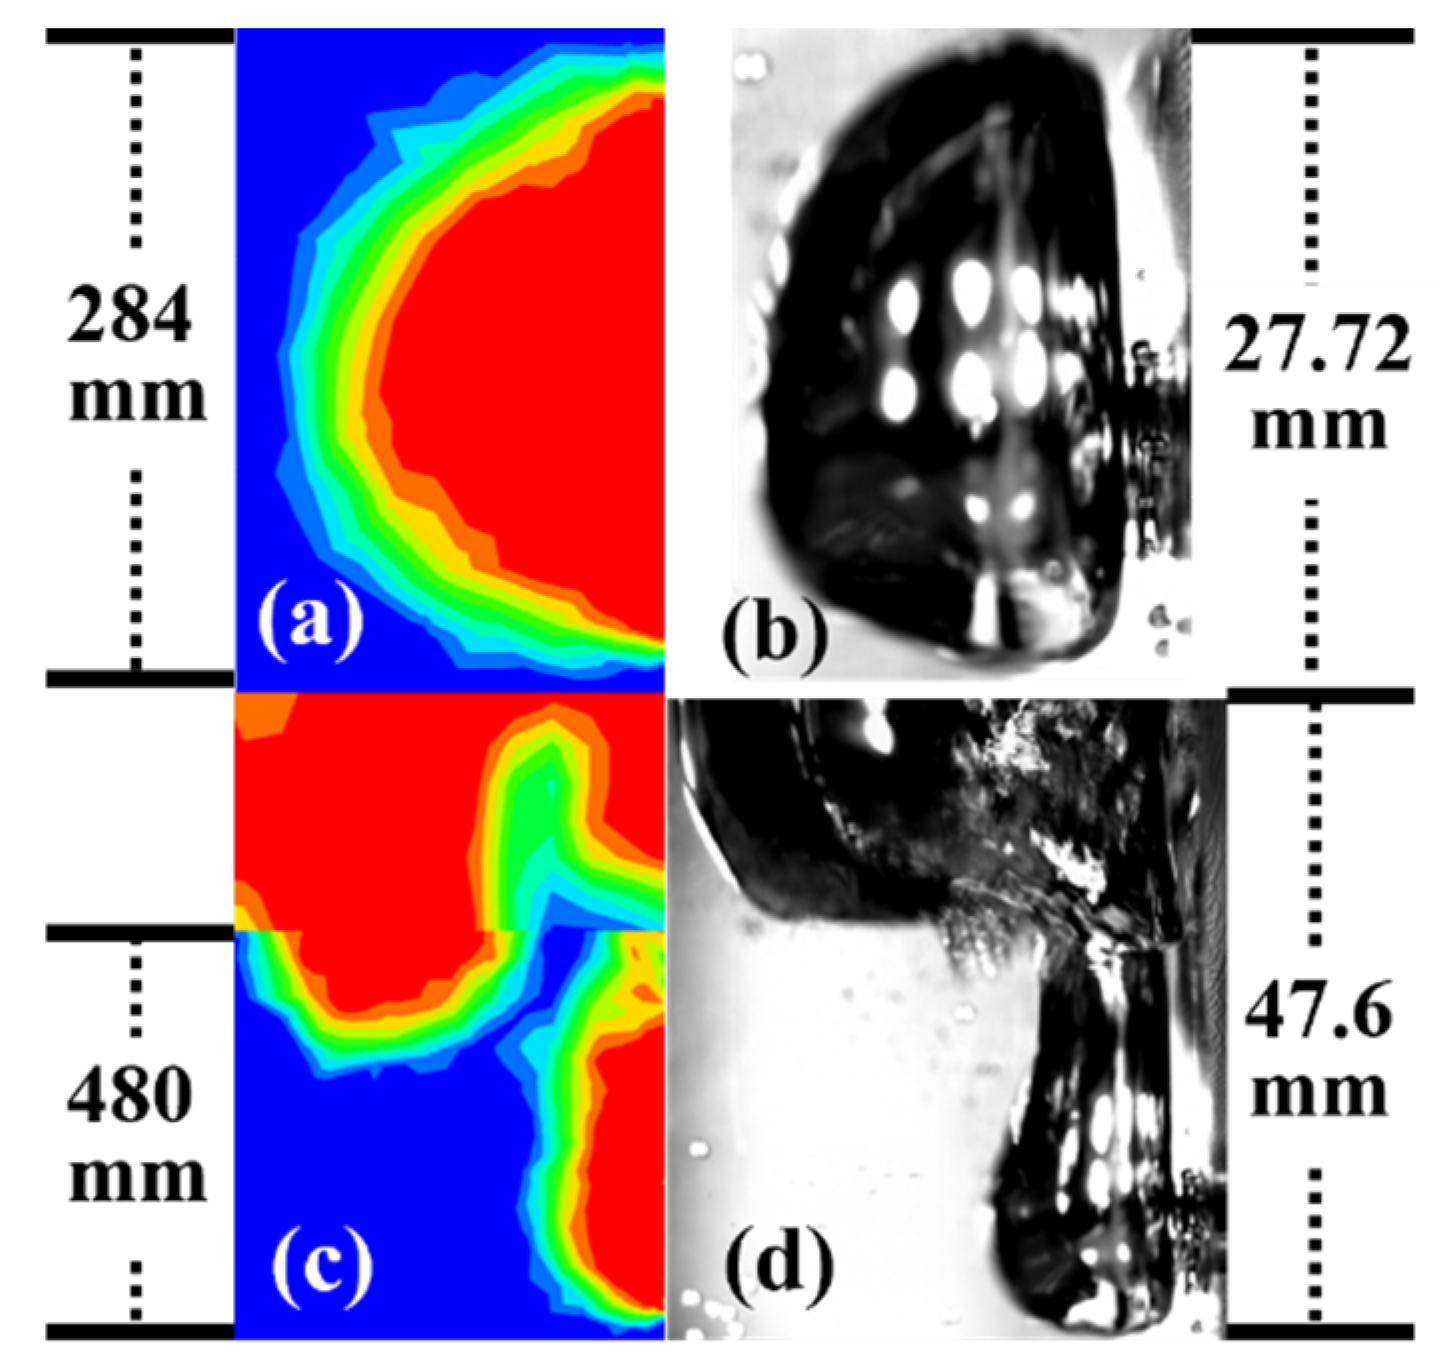
3.2. Model Verification

The results of the calculation and water model experiment, including the bubble shape and the bubble size, were compared and analyzed. Figure 7 shows the comparison of the bubble shapes at the bottom of the lance in the numerical simulation and water model experiment. In the initial blowing stage, oxygen was injected into the melt pool to form a large ellipsoidal gas cluster at the root of the oxygen lance, and, in the process of deformation in the gas cluster by buoyancy, the bubble clung to the wall and formed a long “neck”. In the continuous blowing stage, the bubble reached the surface of the melt pool accompanied by breaking and deformation. The bubble shape of the water model experiment was very similar to the numerical simulation, which proved that the mathematical model established was rational to conduct calculations.
The bubble size measurement of the two methods was not comparable because the lance diameter of the water model and the geometry model were not the same. Therefore, the dimensionless number d b / d n ( d b is the bubble diameter; d n is the lance diameter) was introduced as the evaluation indicator of the bubble size, and the results are shown in Table 6. The error of the bubble size was 2.39%, which was within the acceptable error range. As a result, the mathematical model established was verified to be rational for the numerical simulation of the side-blown furnace.

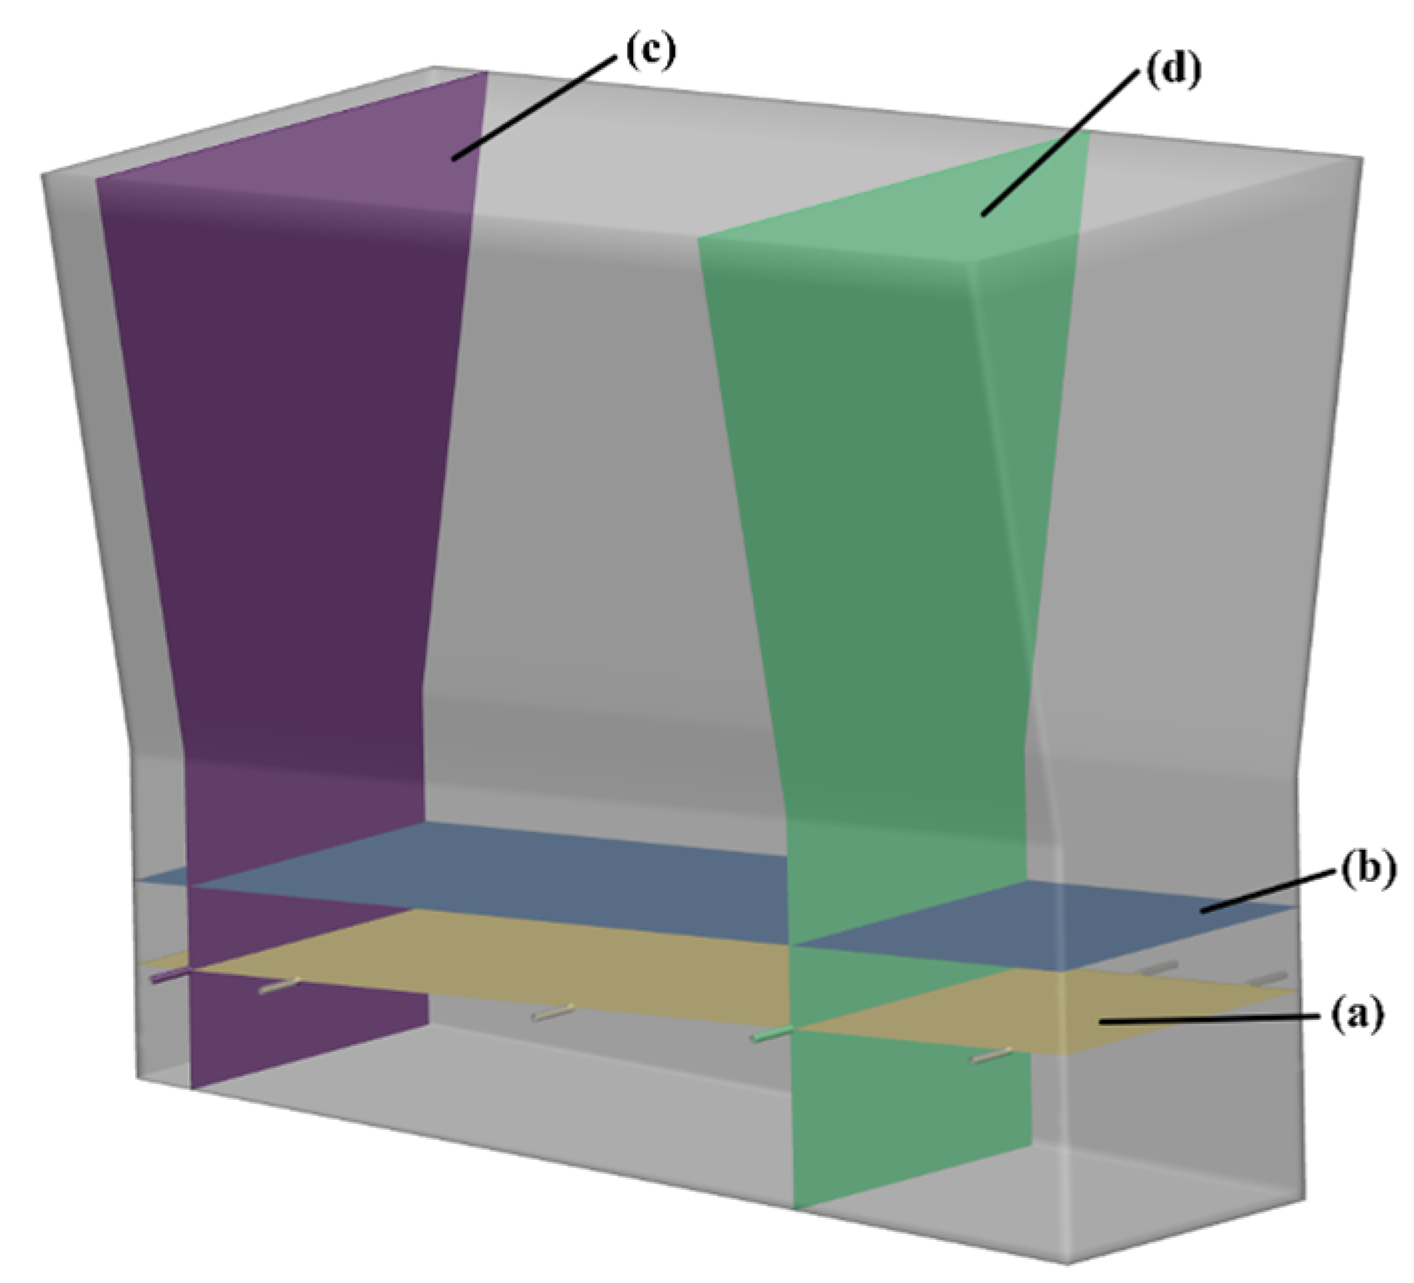
3.3. Flow Field and Temperature Distribution under Basic Working Conditions

Figure 8 shows a schematic diagram for the sections of the furnace. Two longitudinal sections and two cross-sections were sliced for analysis. Section (a) is the cross-section of the oxygen lance and section (b) is the free liquid surface of the molten pool, which is 400 mm above the oxygen lance. Section (c) and (d) are the longitudinal sections of No.1 and No.4 oxygen lances. Data extraction and analysis were carried out on different sections in the furnace so that the flow field distributions under basic working conditions could be obtained.

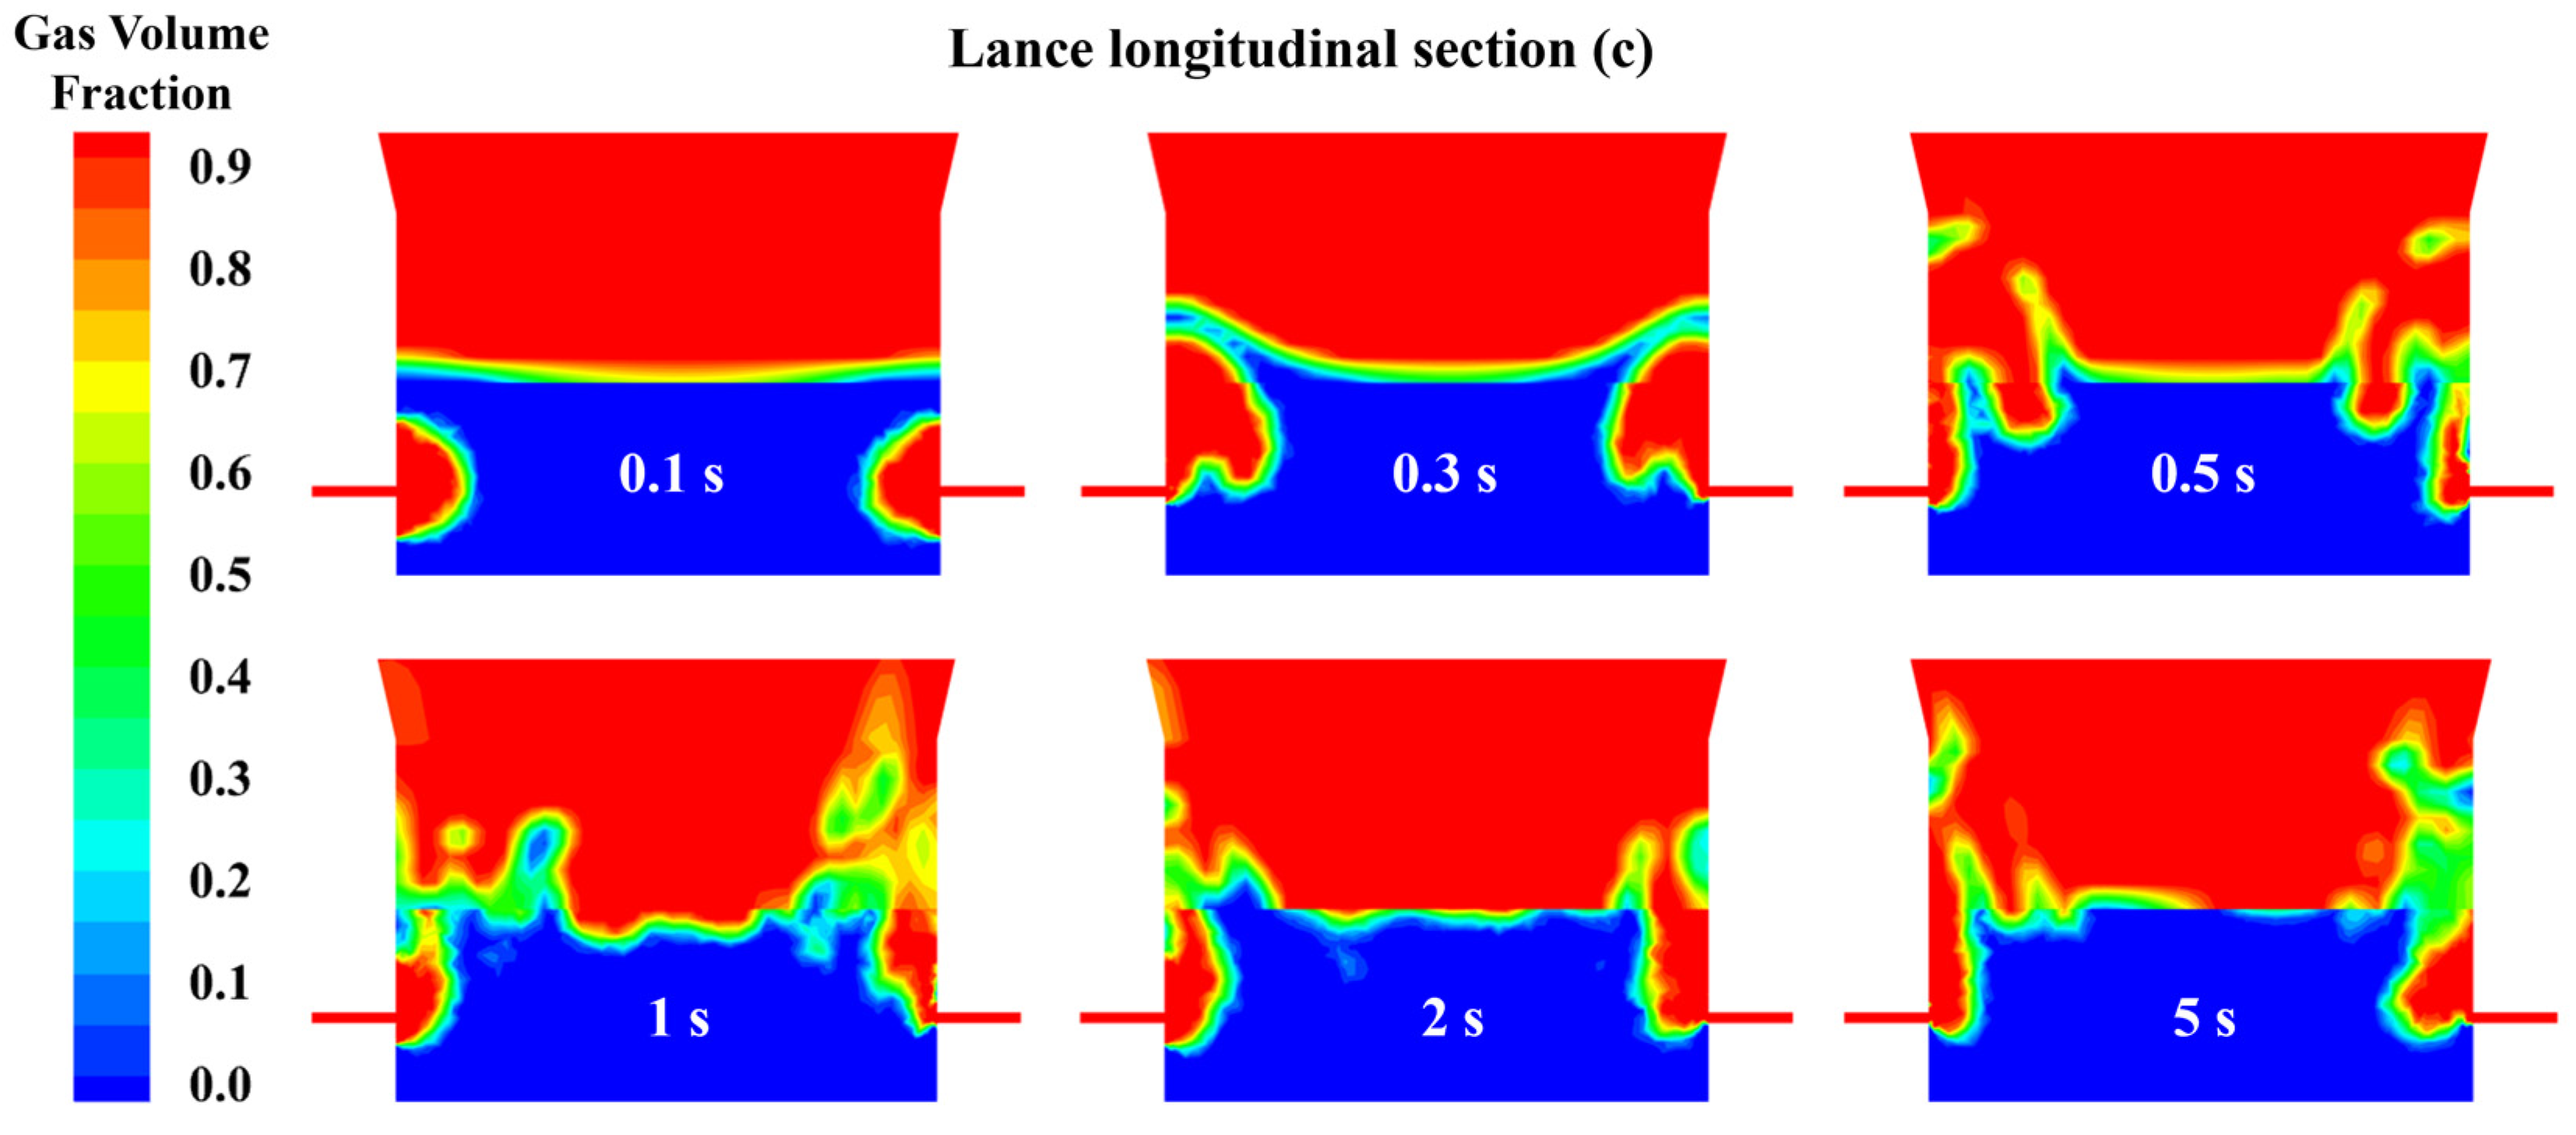
3.3.1. Variation in Gas Volume Fraction Distribution with Time

Figure 9 shows the variation in the gas volume fraction distribution with time in section (a). When the initial blowing time was within 0.1 s, the oxygen-enriched air was injected horizontally from the lance into the molten pool. Since the density of the copper matte phase is much greater than the gas phase, the oxygen-enriched air was compressed, and the velocity slowed down sharply at the outlet of the lance with the formation of a huge air mass. Then, within 0.1 s to 0.5 s, the air mass continuously floated up and adhered to the wall under the action of buoyancy and then rose to the free surface of the molten pool until it ruptured due to the interaction of various forces. After 0.5 s, the bubble movement gradually stabilized with time, and the air mass generated at the root of the oxygen lance became smaller. The high gas volume fraction area occurred in the upper part of the lances and adhered to the wall. The gas volume fraction area within 0.3–0.7 appeared 400 mm above the free surface, which referred to the splashing phenomenon. The middle part of the molten pool was observed as the low gas volume fraction area.

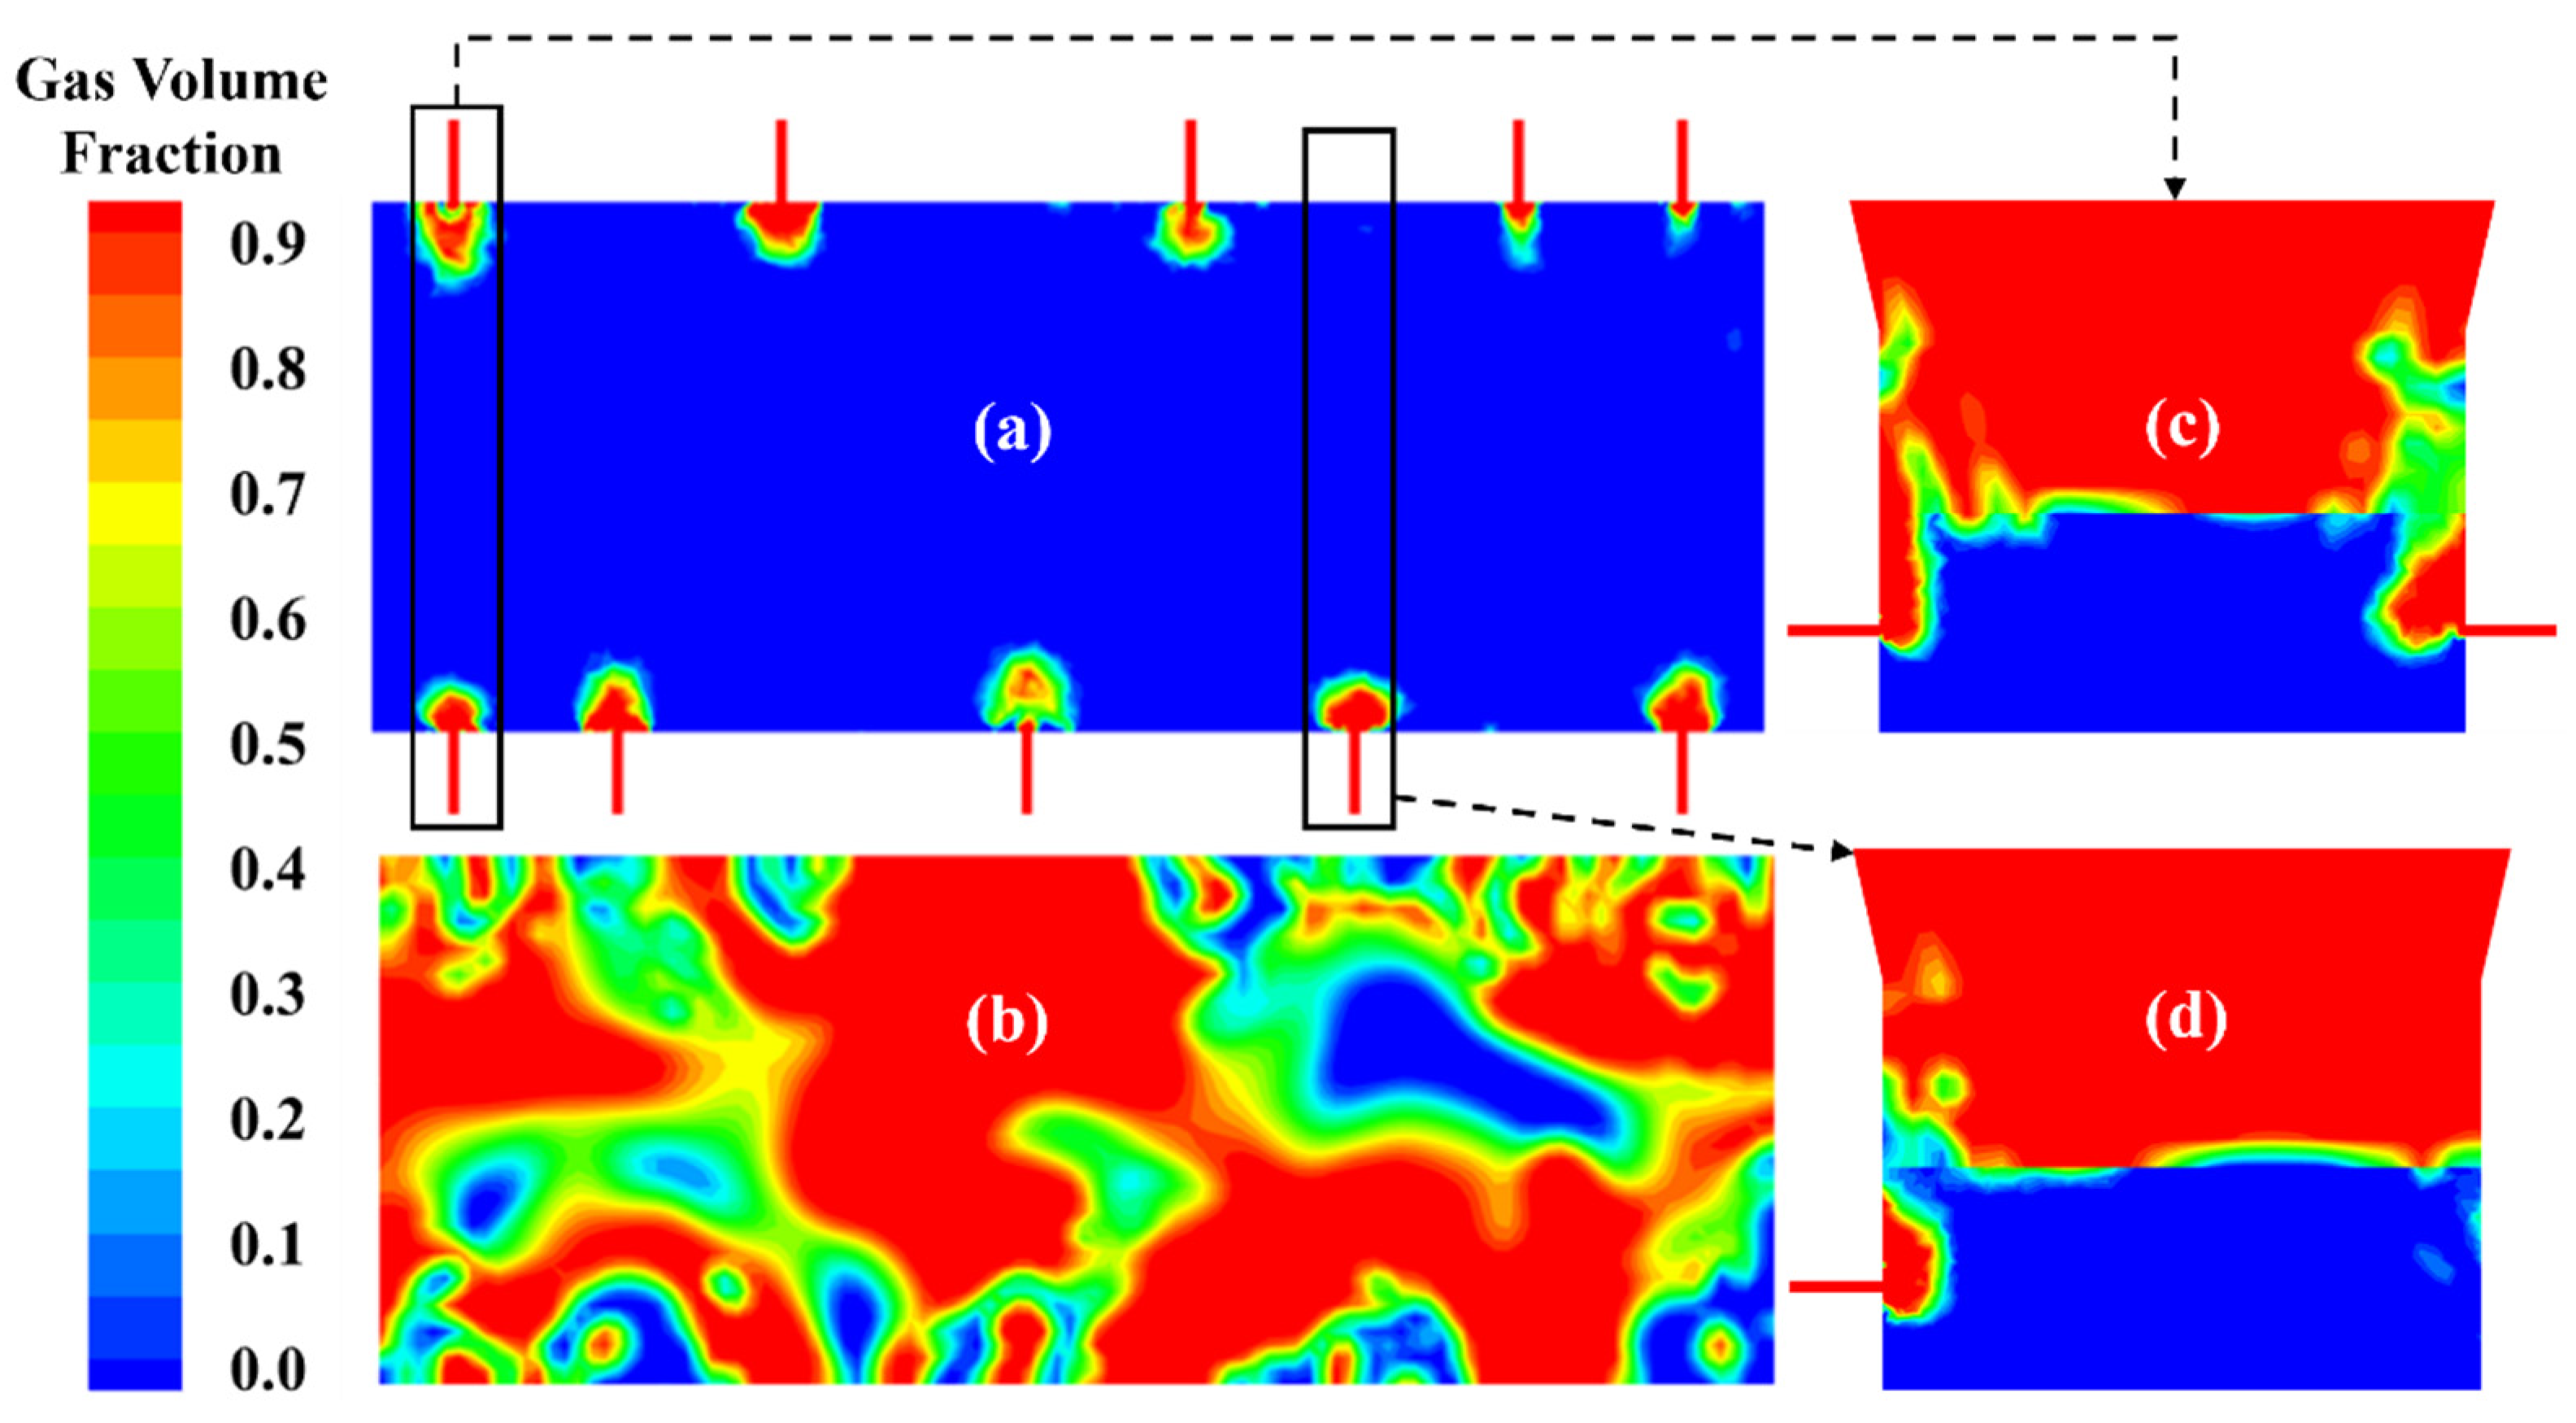
3.3.2. Gas Volume Fraction Distribution

When the smelting process was basically stable, the gas volume fraction distribution of different sections is shown in Figure 10. The bubbles were continuously generated at each lance due to the injection of the oxygen-enriched air, and the size of the bubbles was significantly reduced. The high gas volume fraction area occurred in the near-wall region and the free surface, while the low gas volume fraction area with a neglectable gas phase appeared in the middle and bottom of the molten pool. The gas phase at the oxygen lance was relatively small compared to the initial blowing stage. In addition, the gas rate in the central area of the molten pool was low, while the upper area was higher because of the adhesion movement of the bubbles.

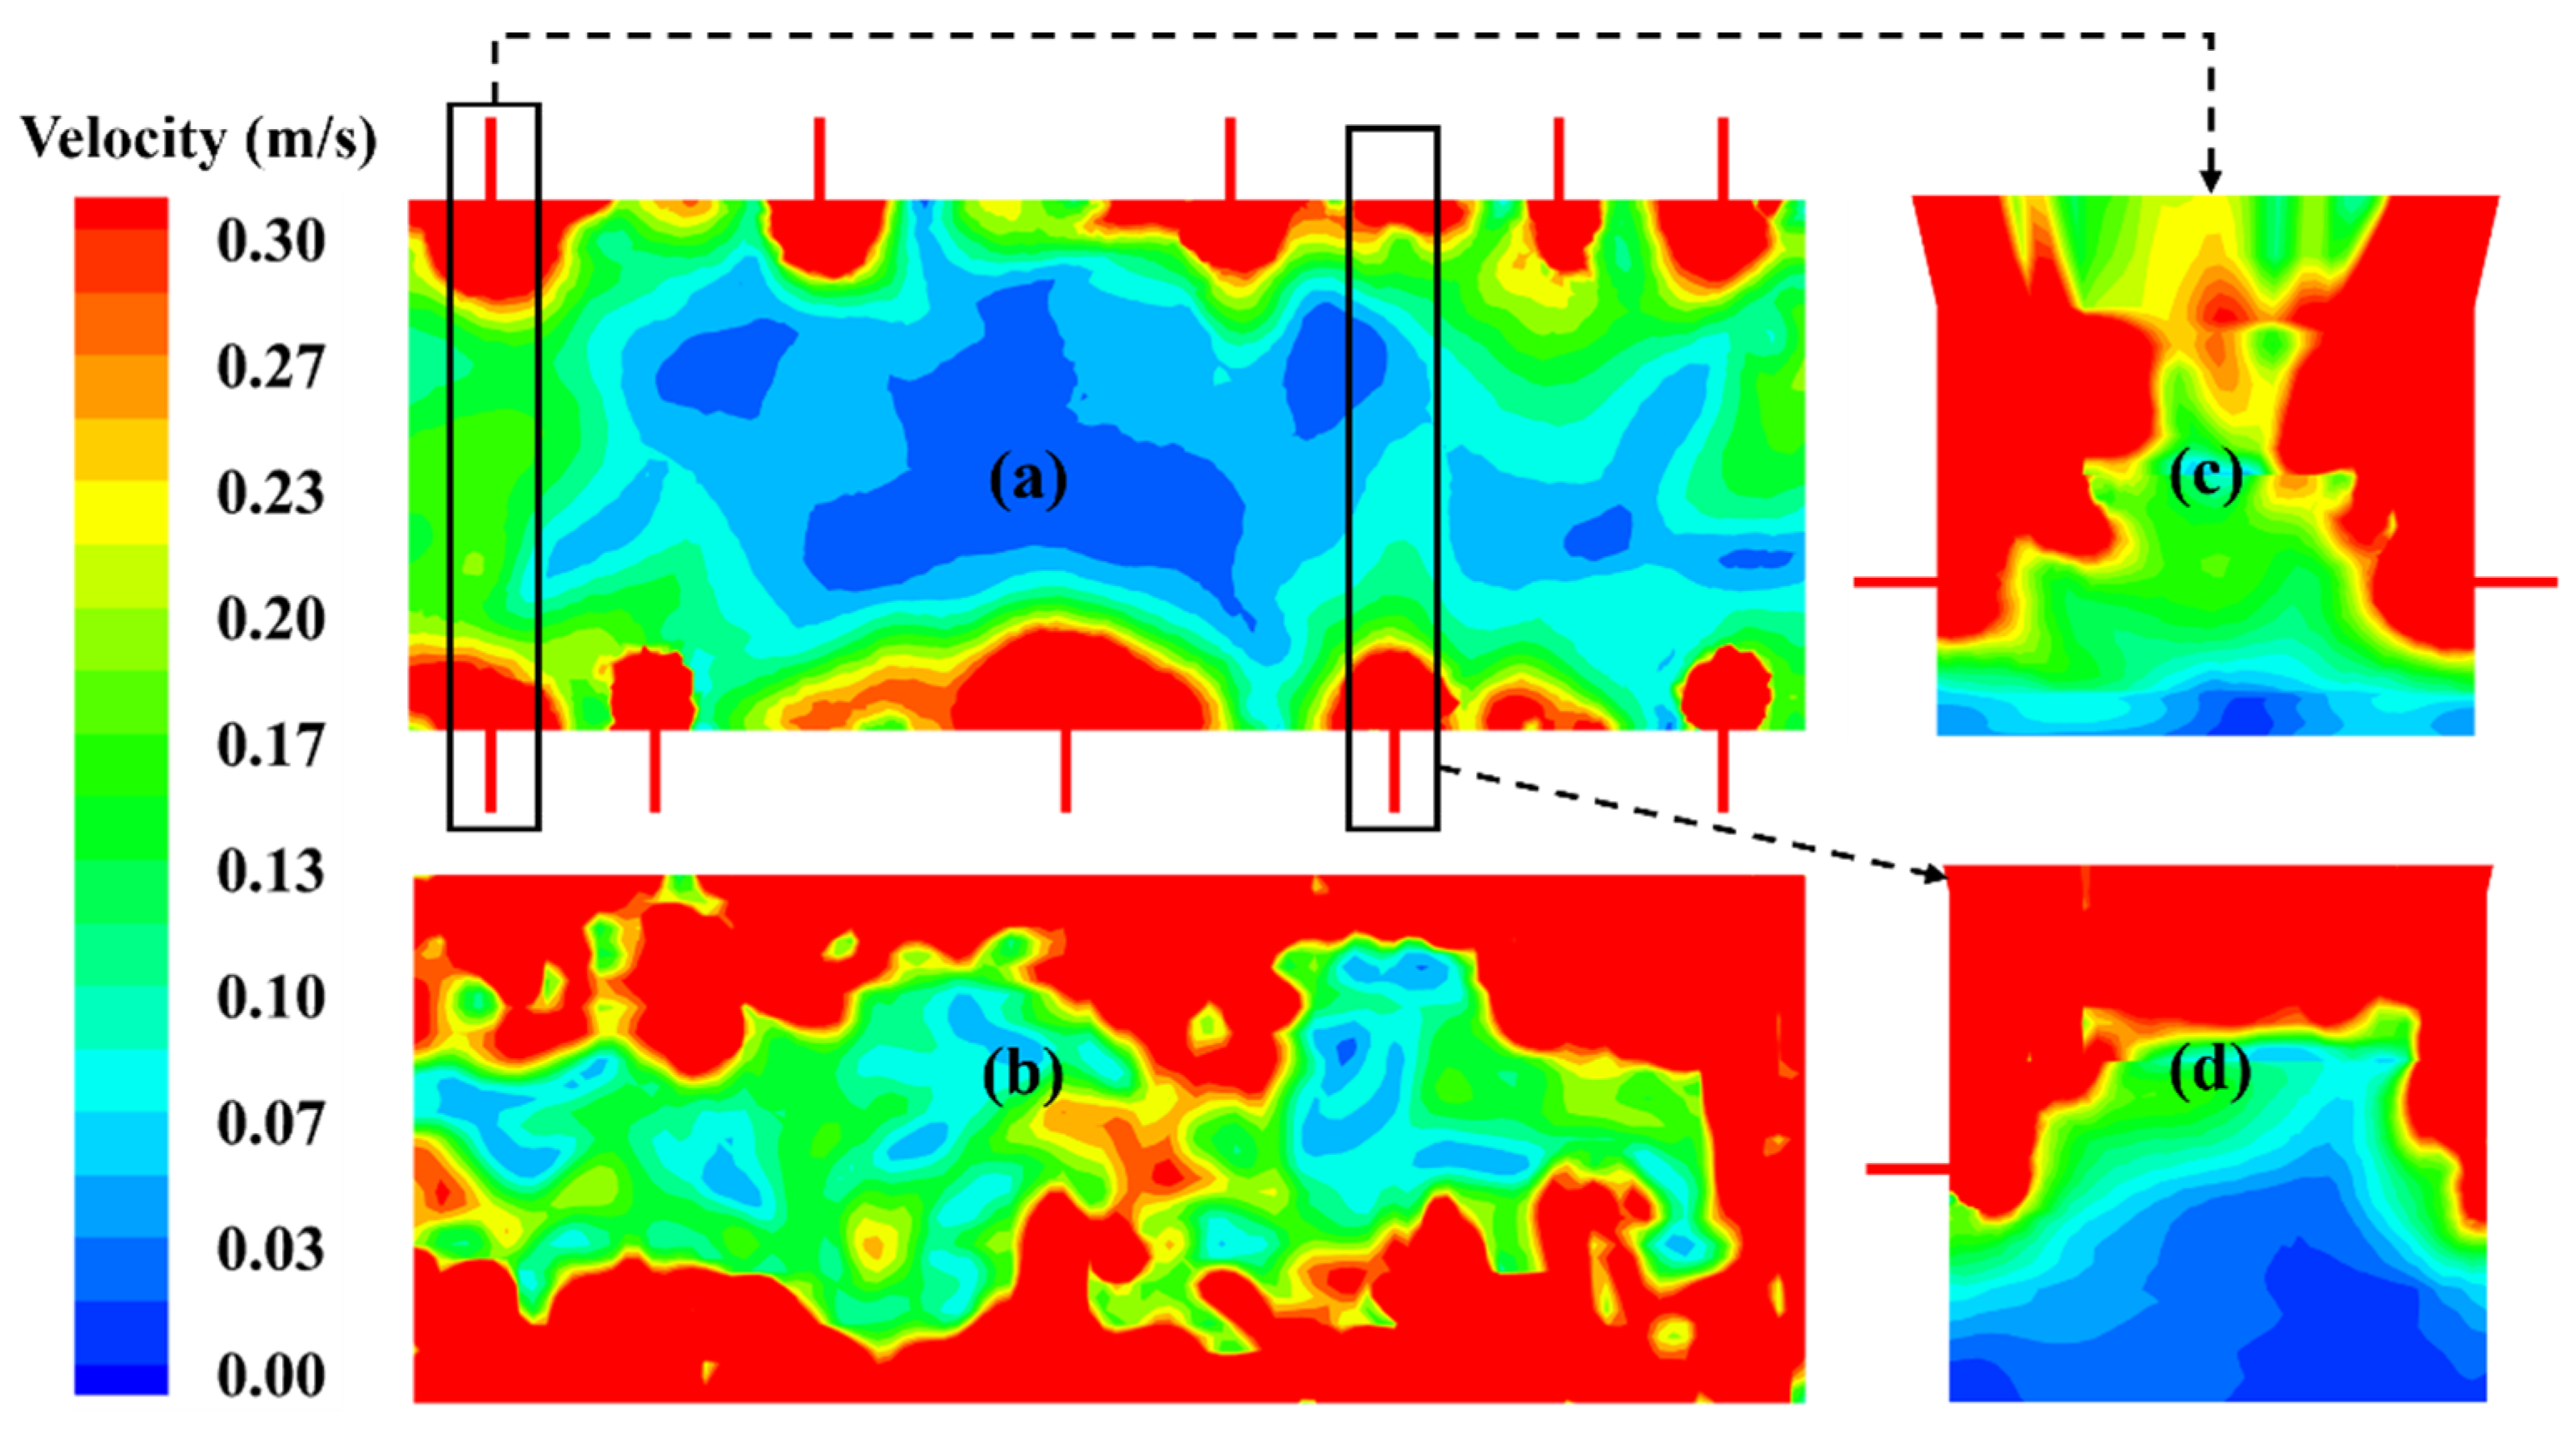
3.3.3. Velocity Distribution

Figure 11 shows the velocity distribution of different sections. Taking 0.3 m/s as the evaluation index, it was observed that the velocity in the middle and bottom of the molten pool was very low. Sections (a) and (b) show that the high-speed area was distributed near the oxygen lance, and the velocity of the gas phase was significantly greater than the velocity of the melt. The velocity in the center was lower than the lanced area above 0.1 m/s. It can be seen from sections (c) and (d) that a stirring dead zone was generated in the central area at the bottom of the molten pool, where the melt was not fully stirred by oxygen-enriched air and may have had adverse effects on the metallurgical reactions.

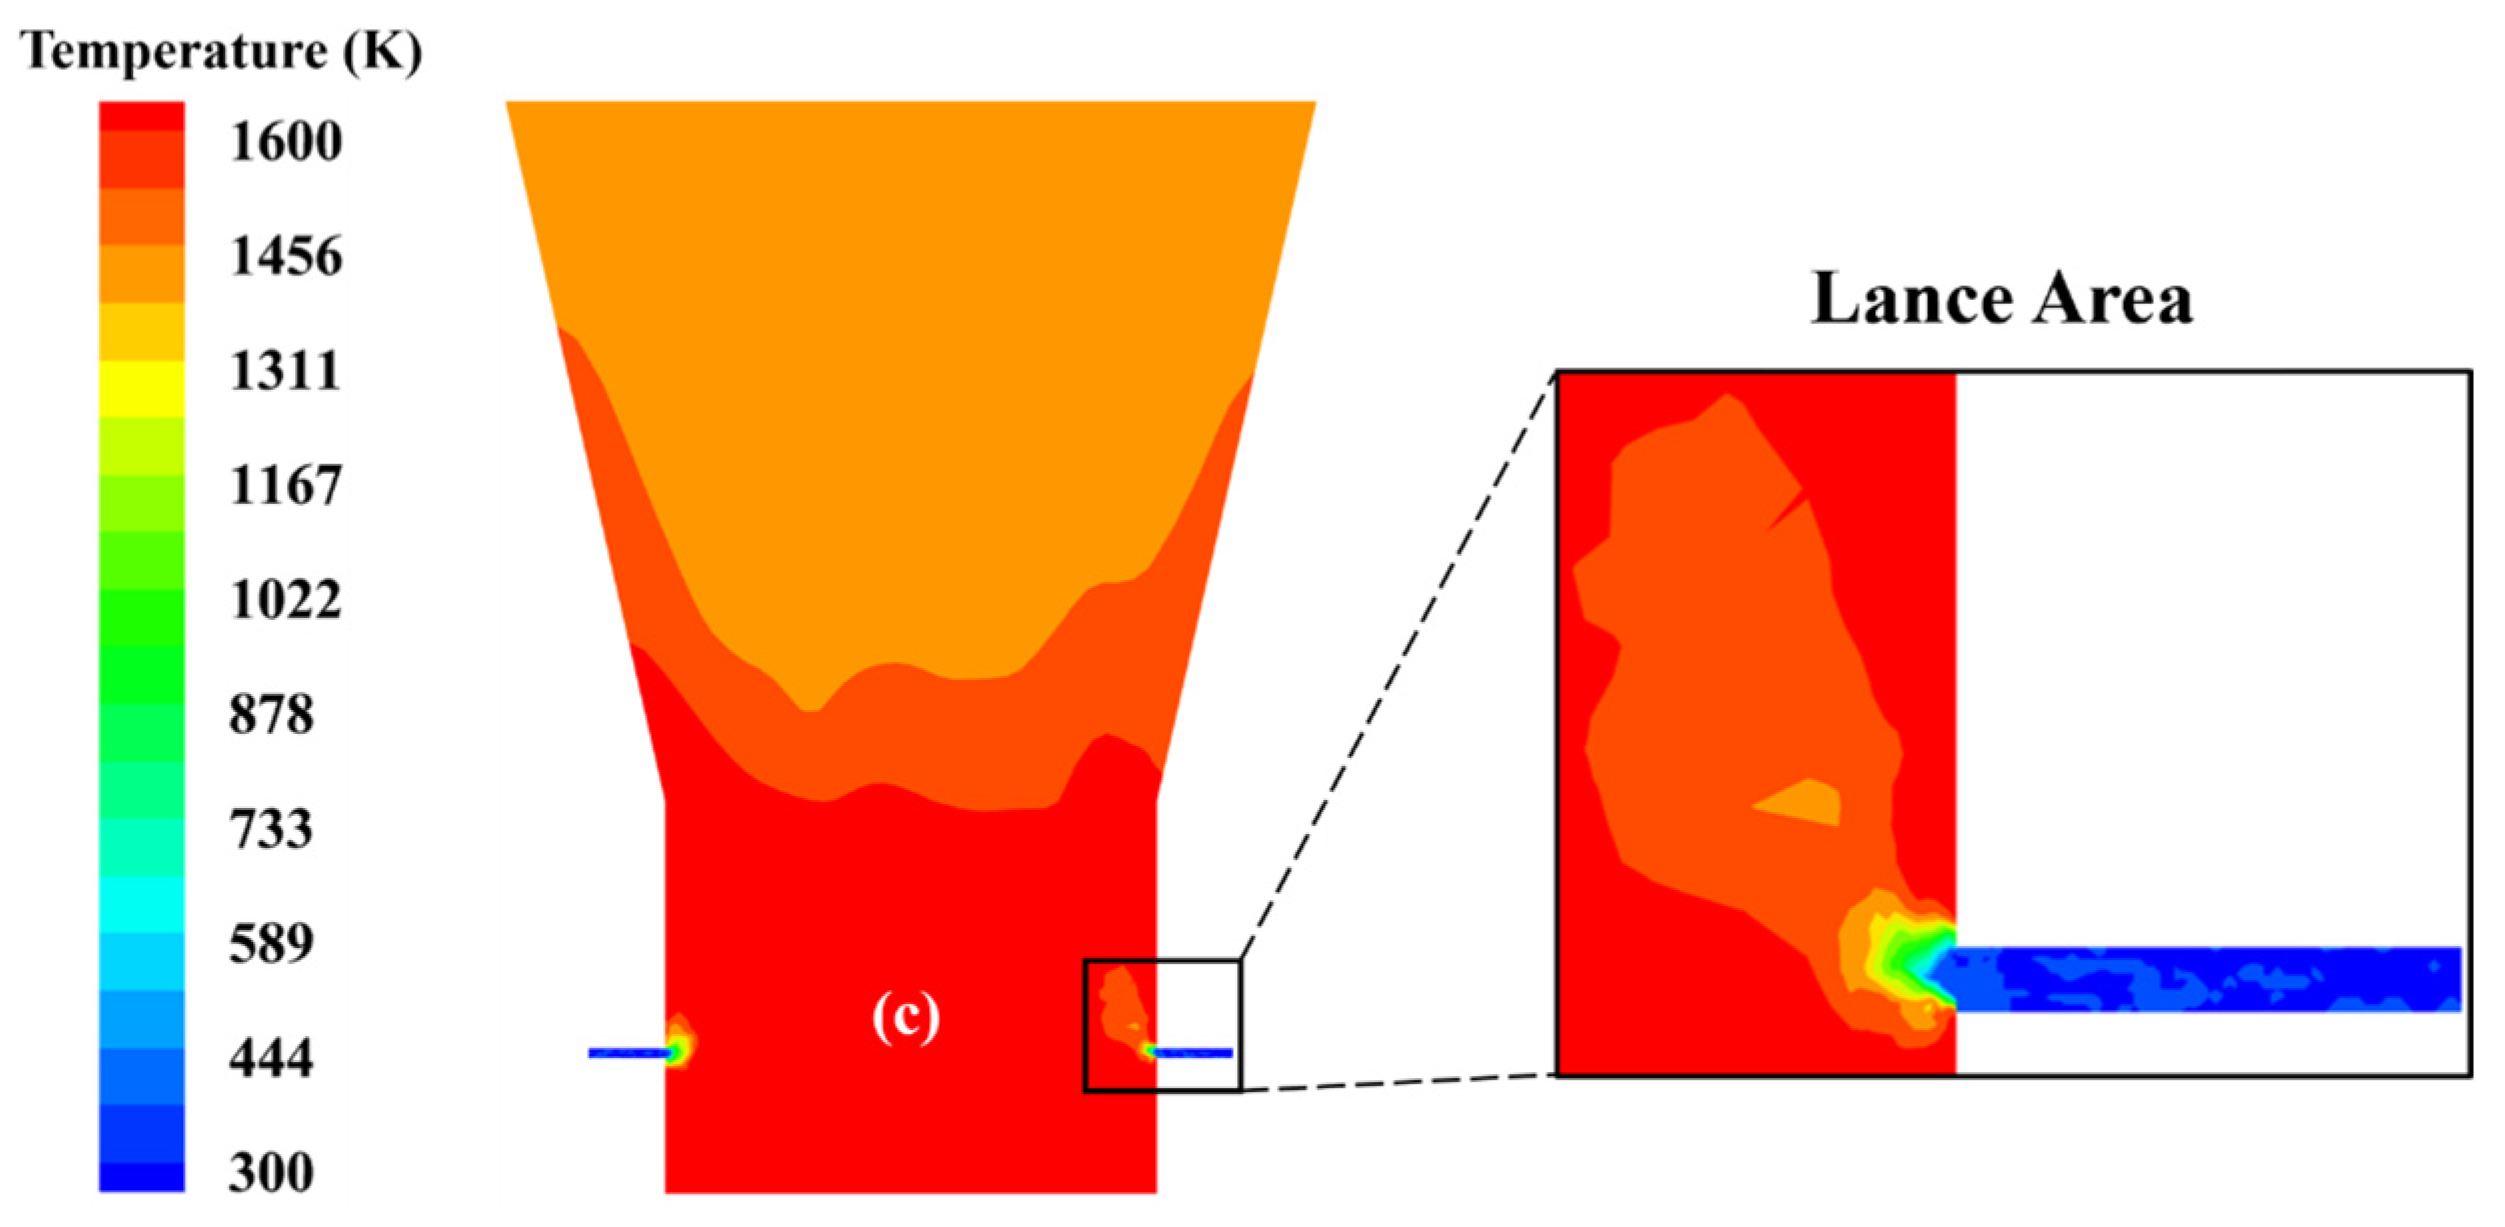
3.3.4. Temperature Distribution

Figure 12 shows the temperature distribution of section (c). The temperature in the oxygen lance was very low, and after spraying into the molten pool, strong mass transfer and heat transfer occurred between the oxygen-enriched air and the high-temperature melt. The temperature of the whole melt area was around 1600 K and gradually decreased in the upper flue gas area. The heat exchange between the melted and oxygen-enriched air in the molten pool promoted gas expansion, which was beneficial to the thorough agitation of the molten pool.

3.4. Analysis and Optimization of Key Parameters

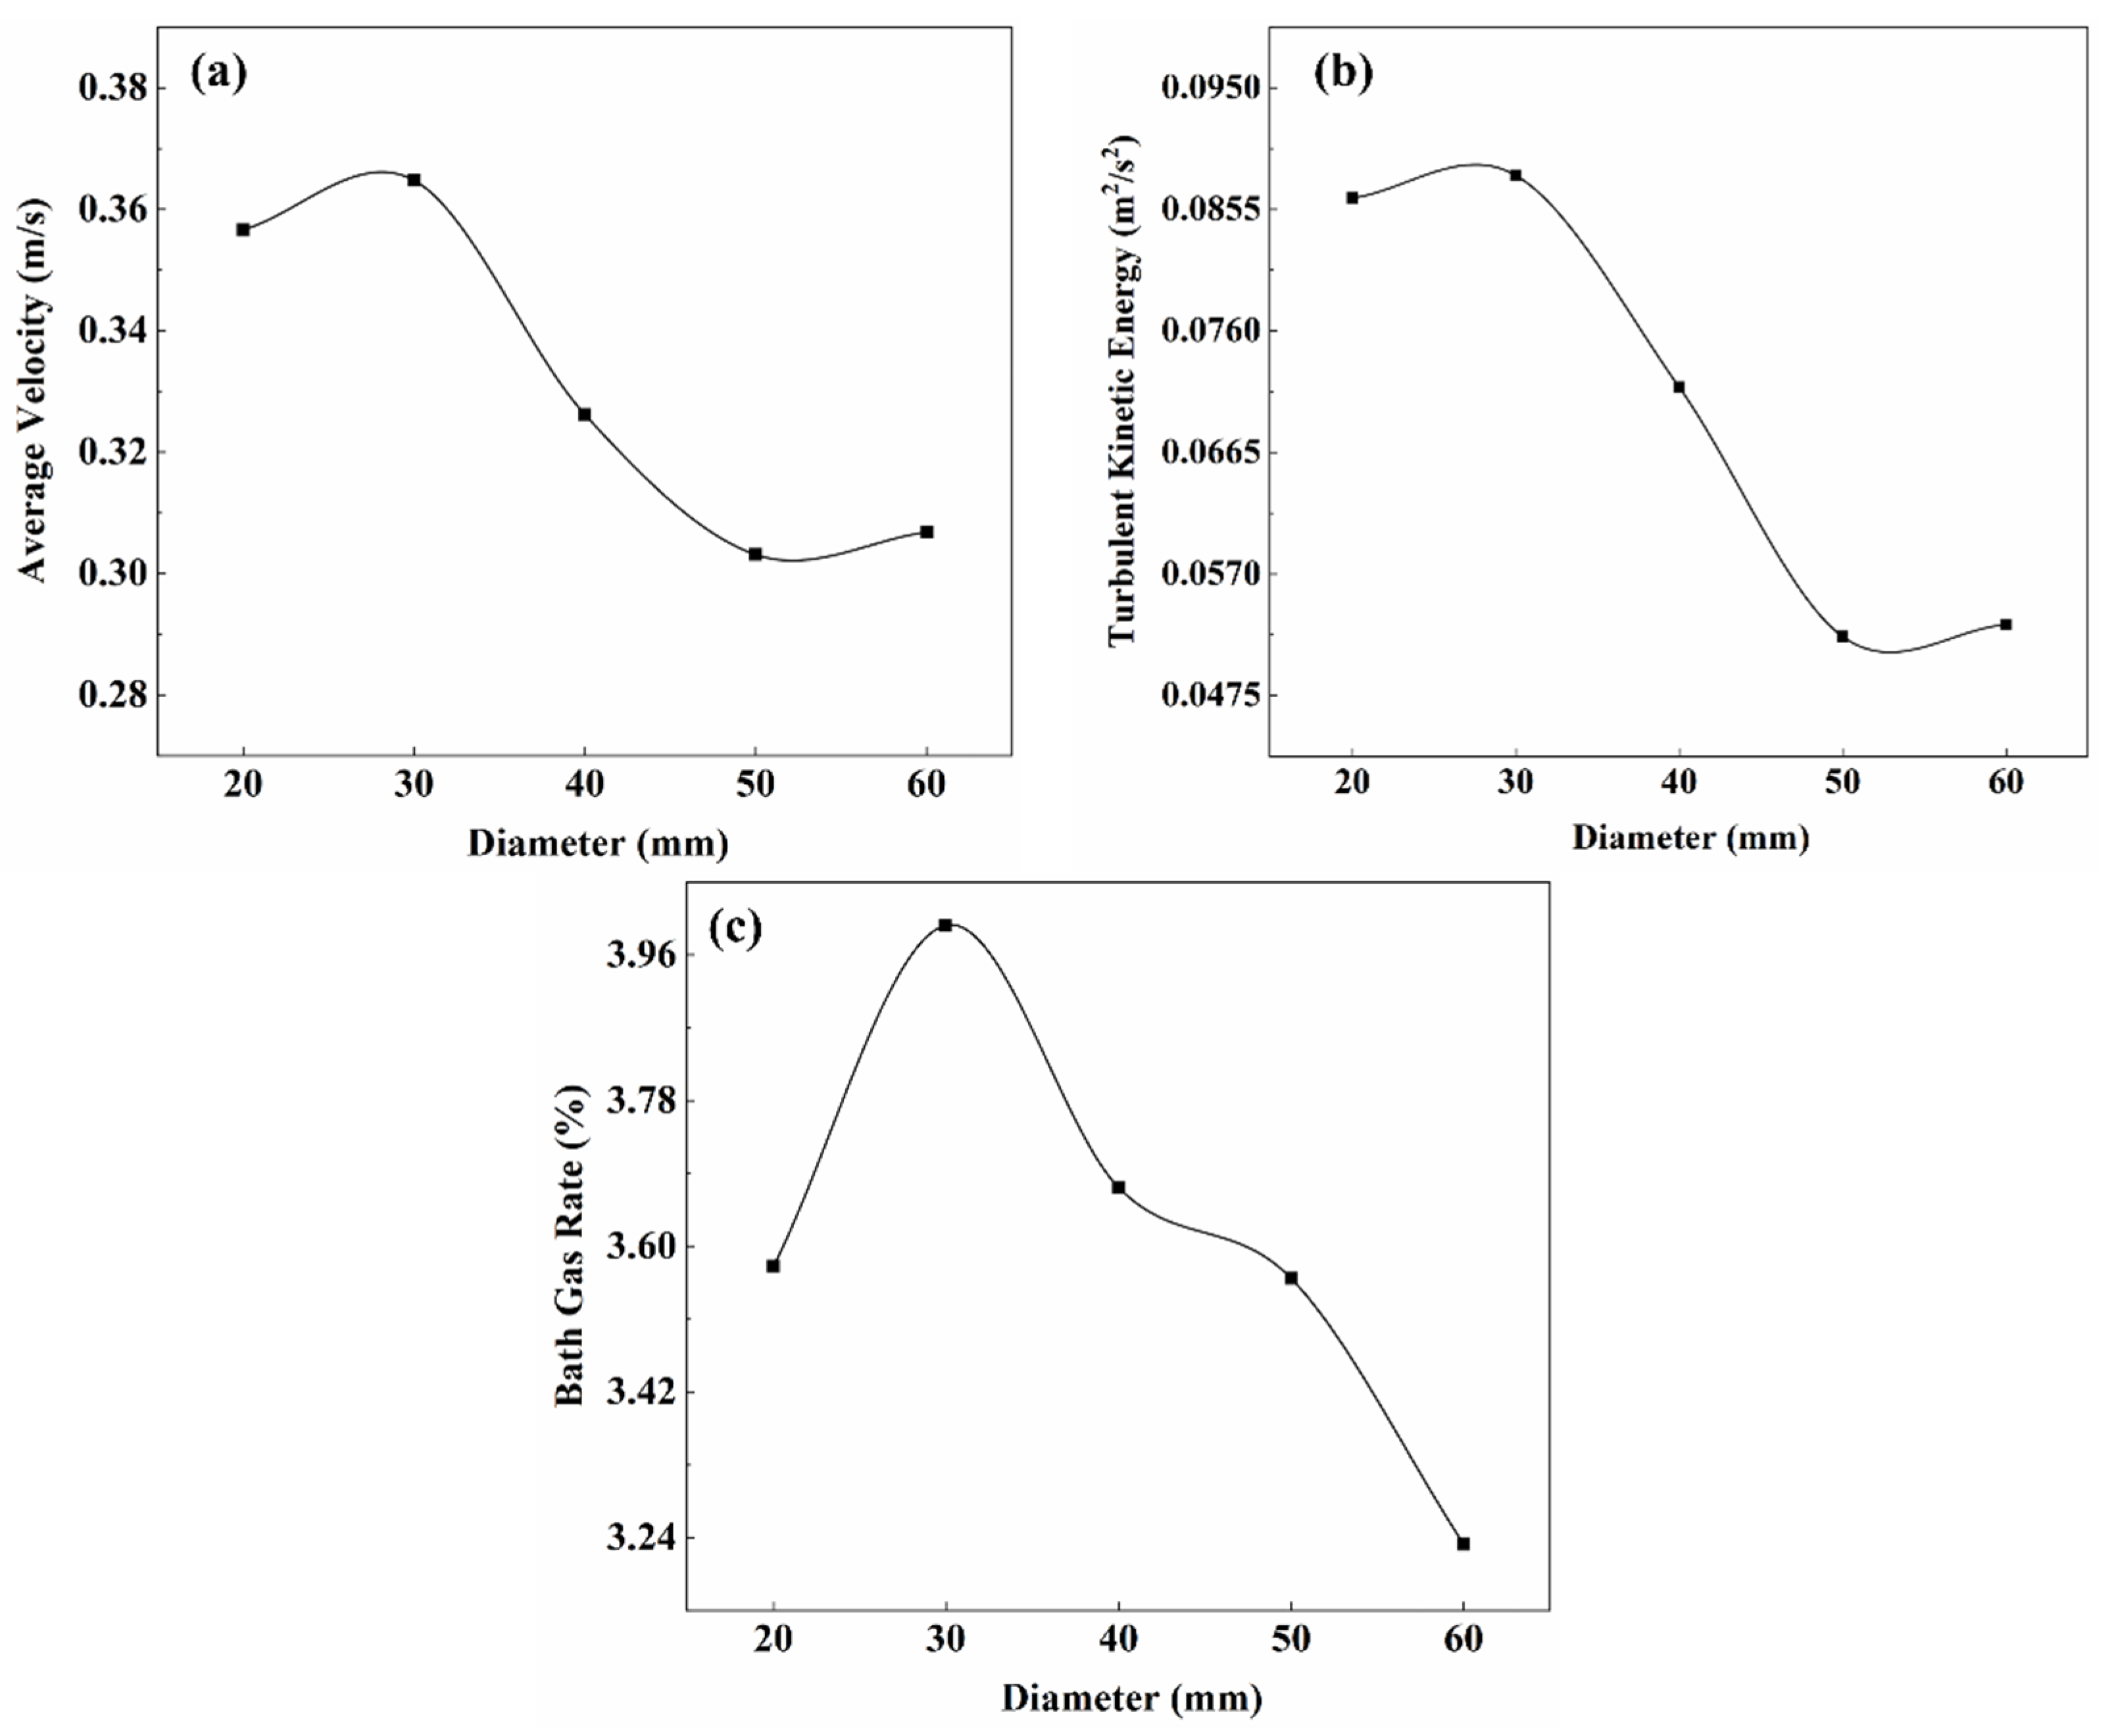
3.4.1. Lance Diameter

The lance diameter can have a large impact on the flow rate of oxygen-enriched air sprayed into the melt pool and the process of agitation in the melt pool. The range of the lance diameter was set from 20 mm to 60 mm, and the relationship between the evaluation indicators and the lance diameter is shown in Figure 13. The changing trend of the three indicators was similar, first increasing until the lance diameter reached 30 mm and then showing a decreasing trend with the lance diameter increasing. The peak of the indicators occurred when the lance diameter was 30 mm. Therefore, it was concluded that the lance diameter of about 30 mm was best.

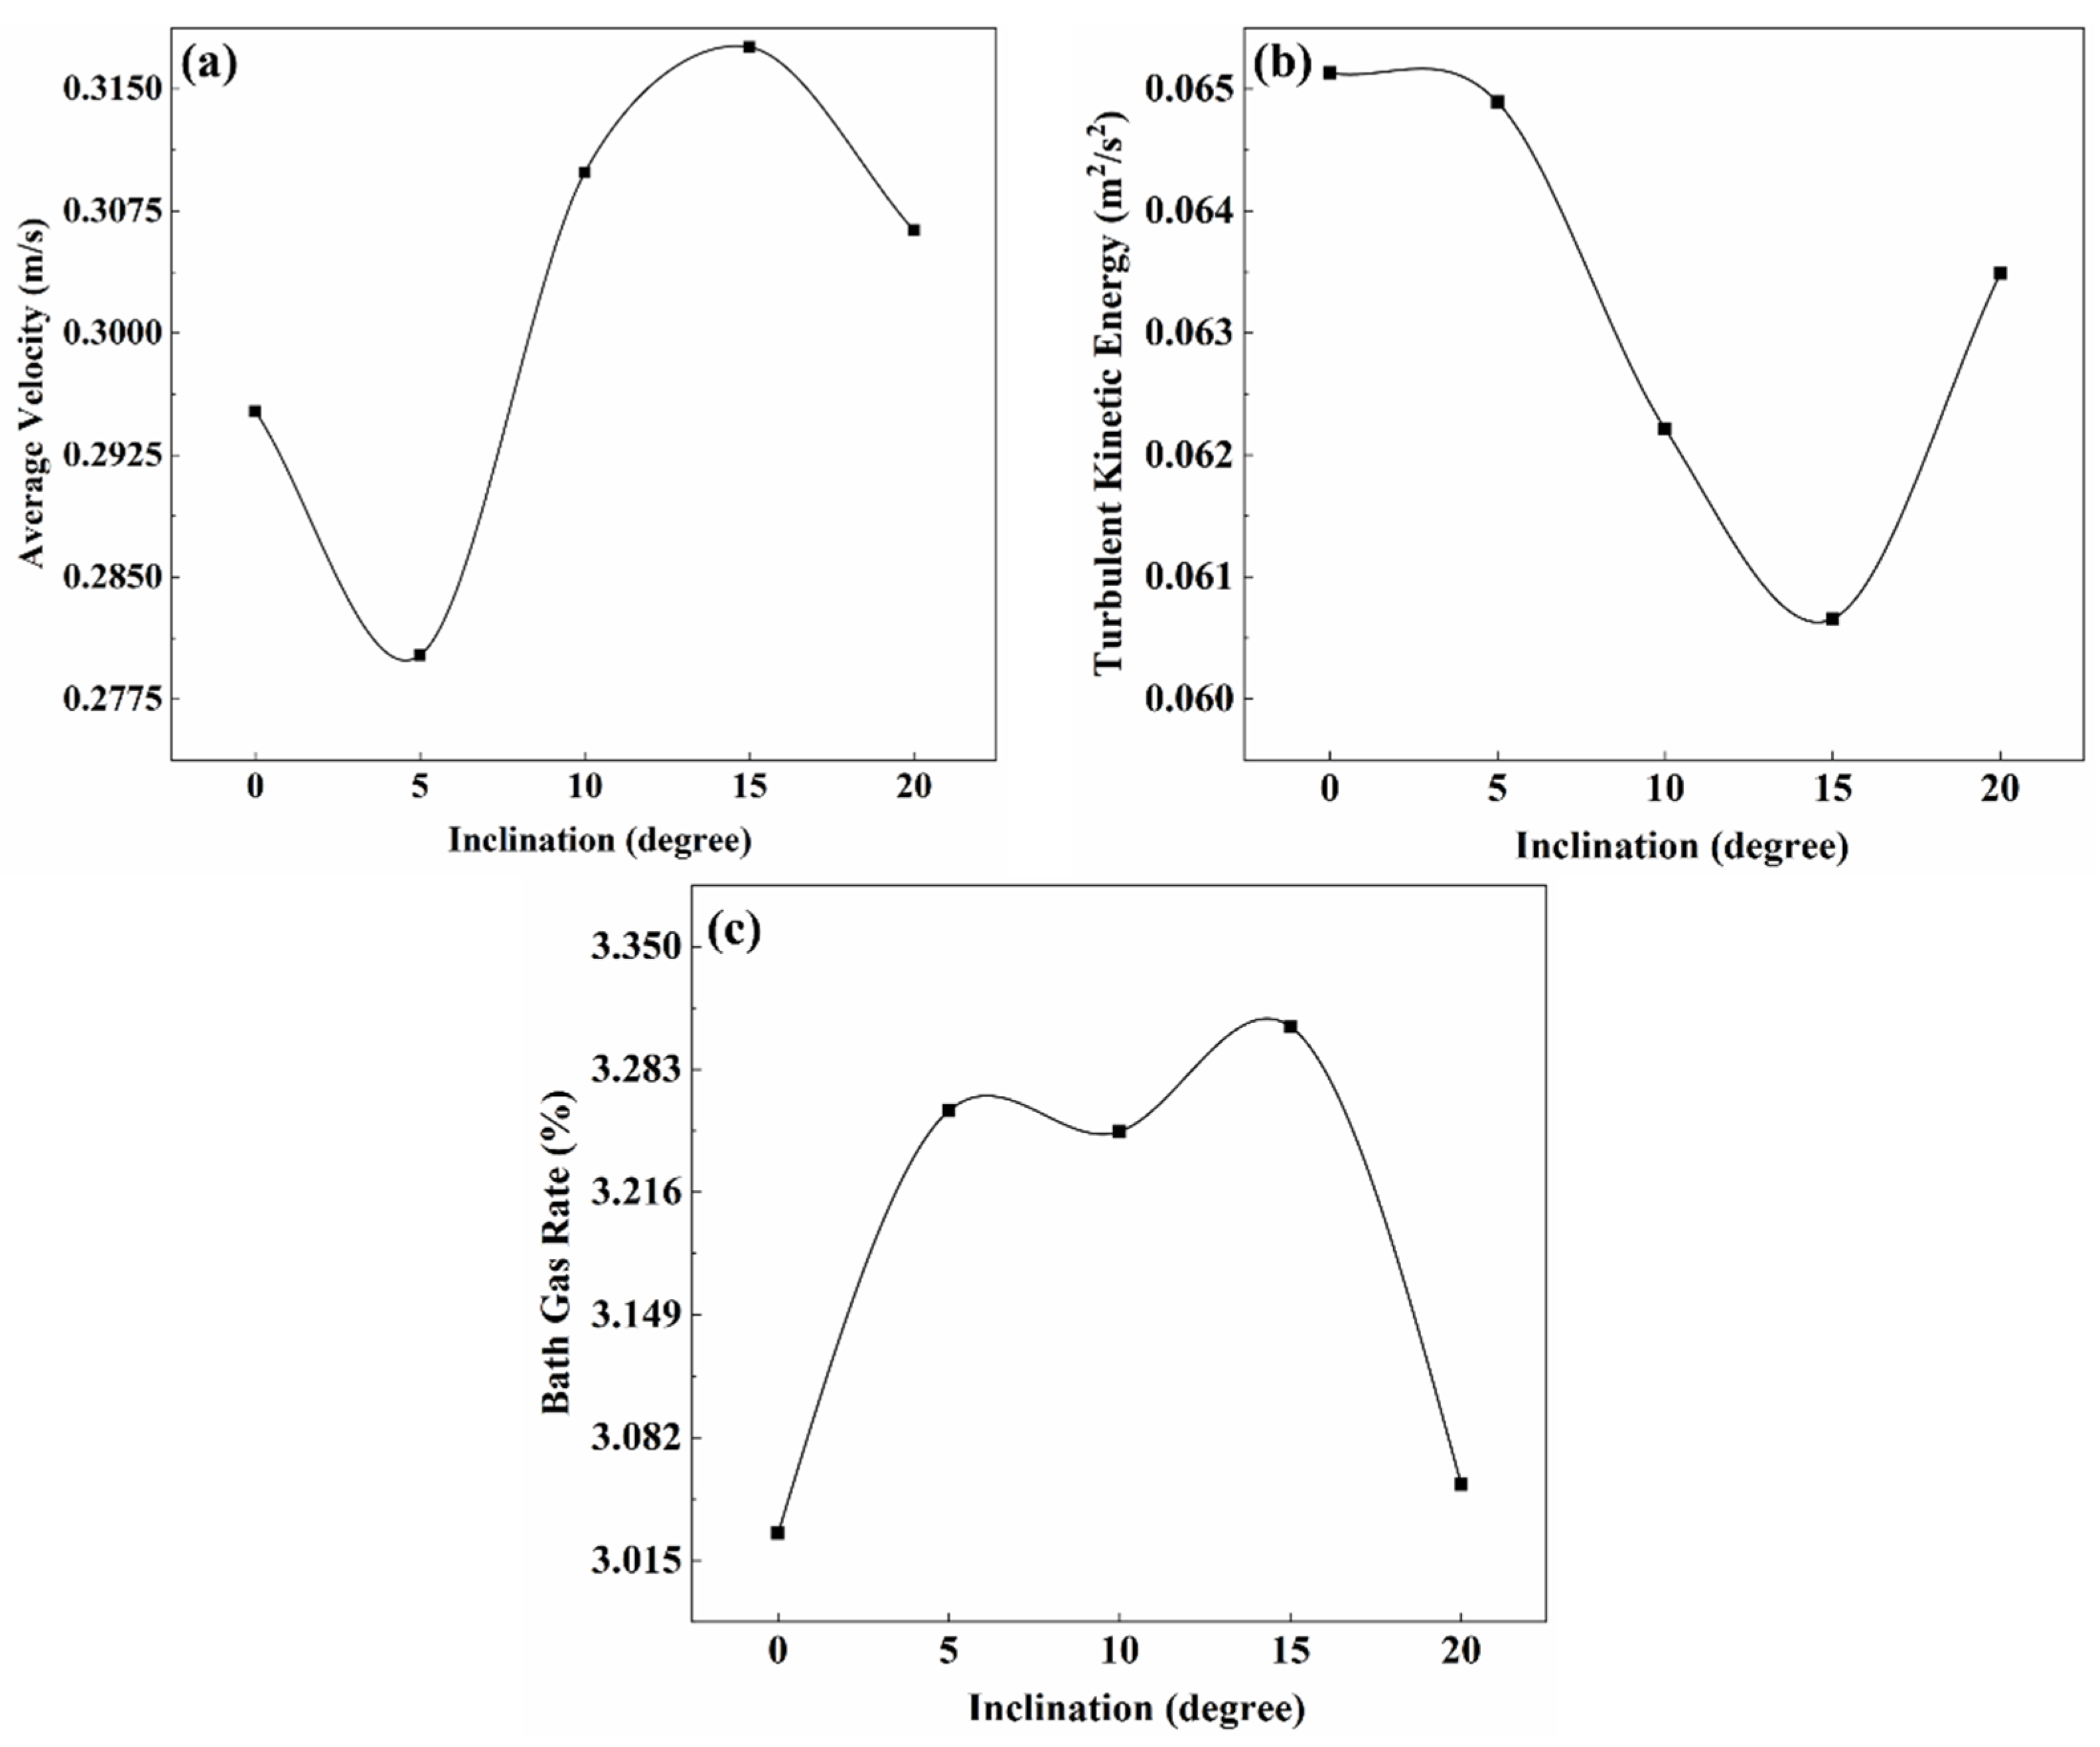
3.4.2. Lance Inclination
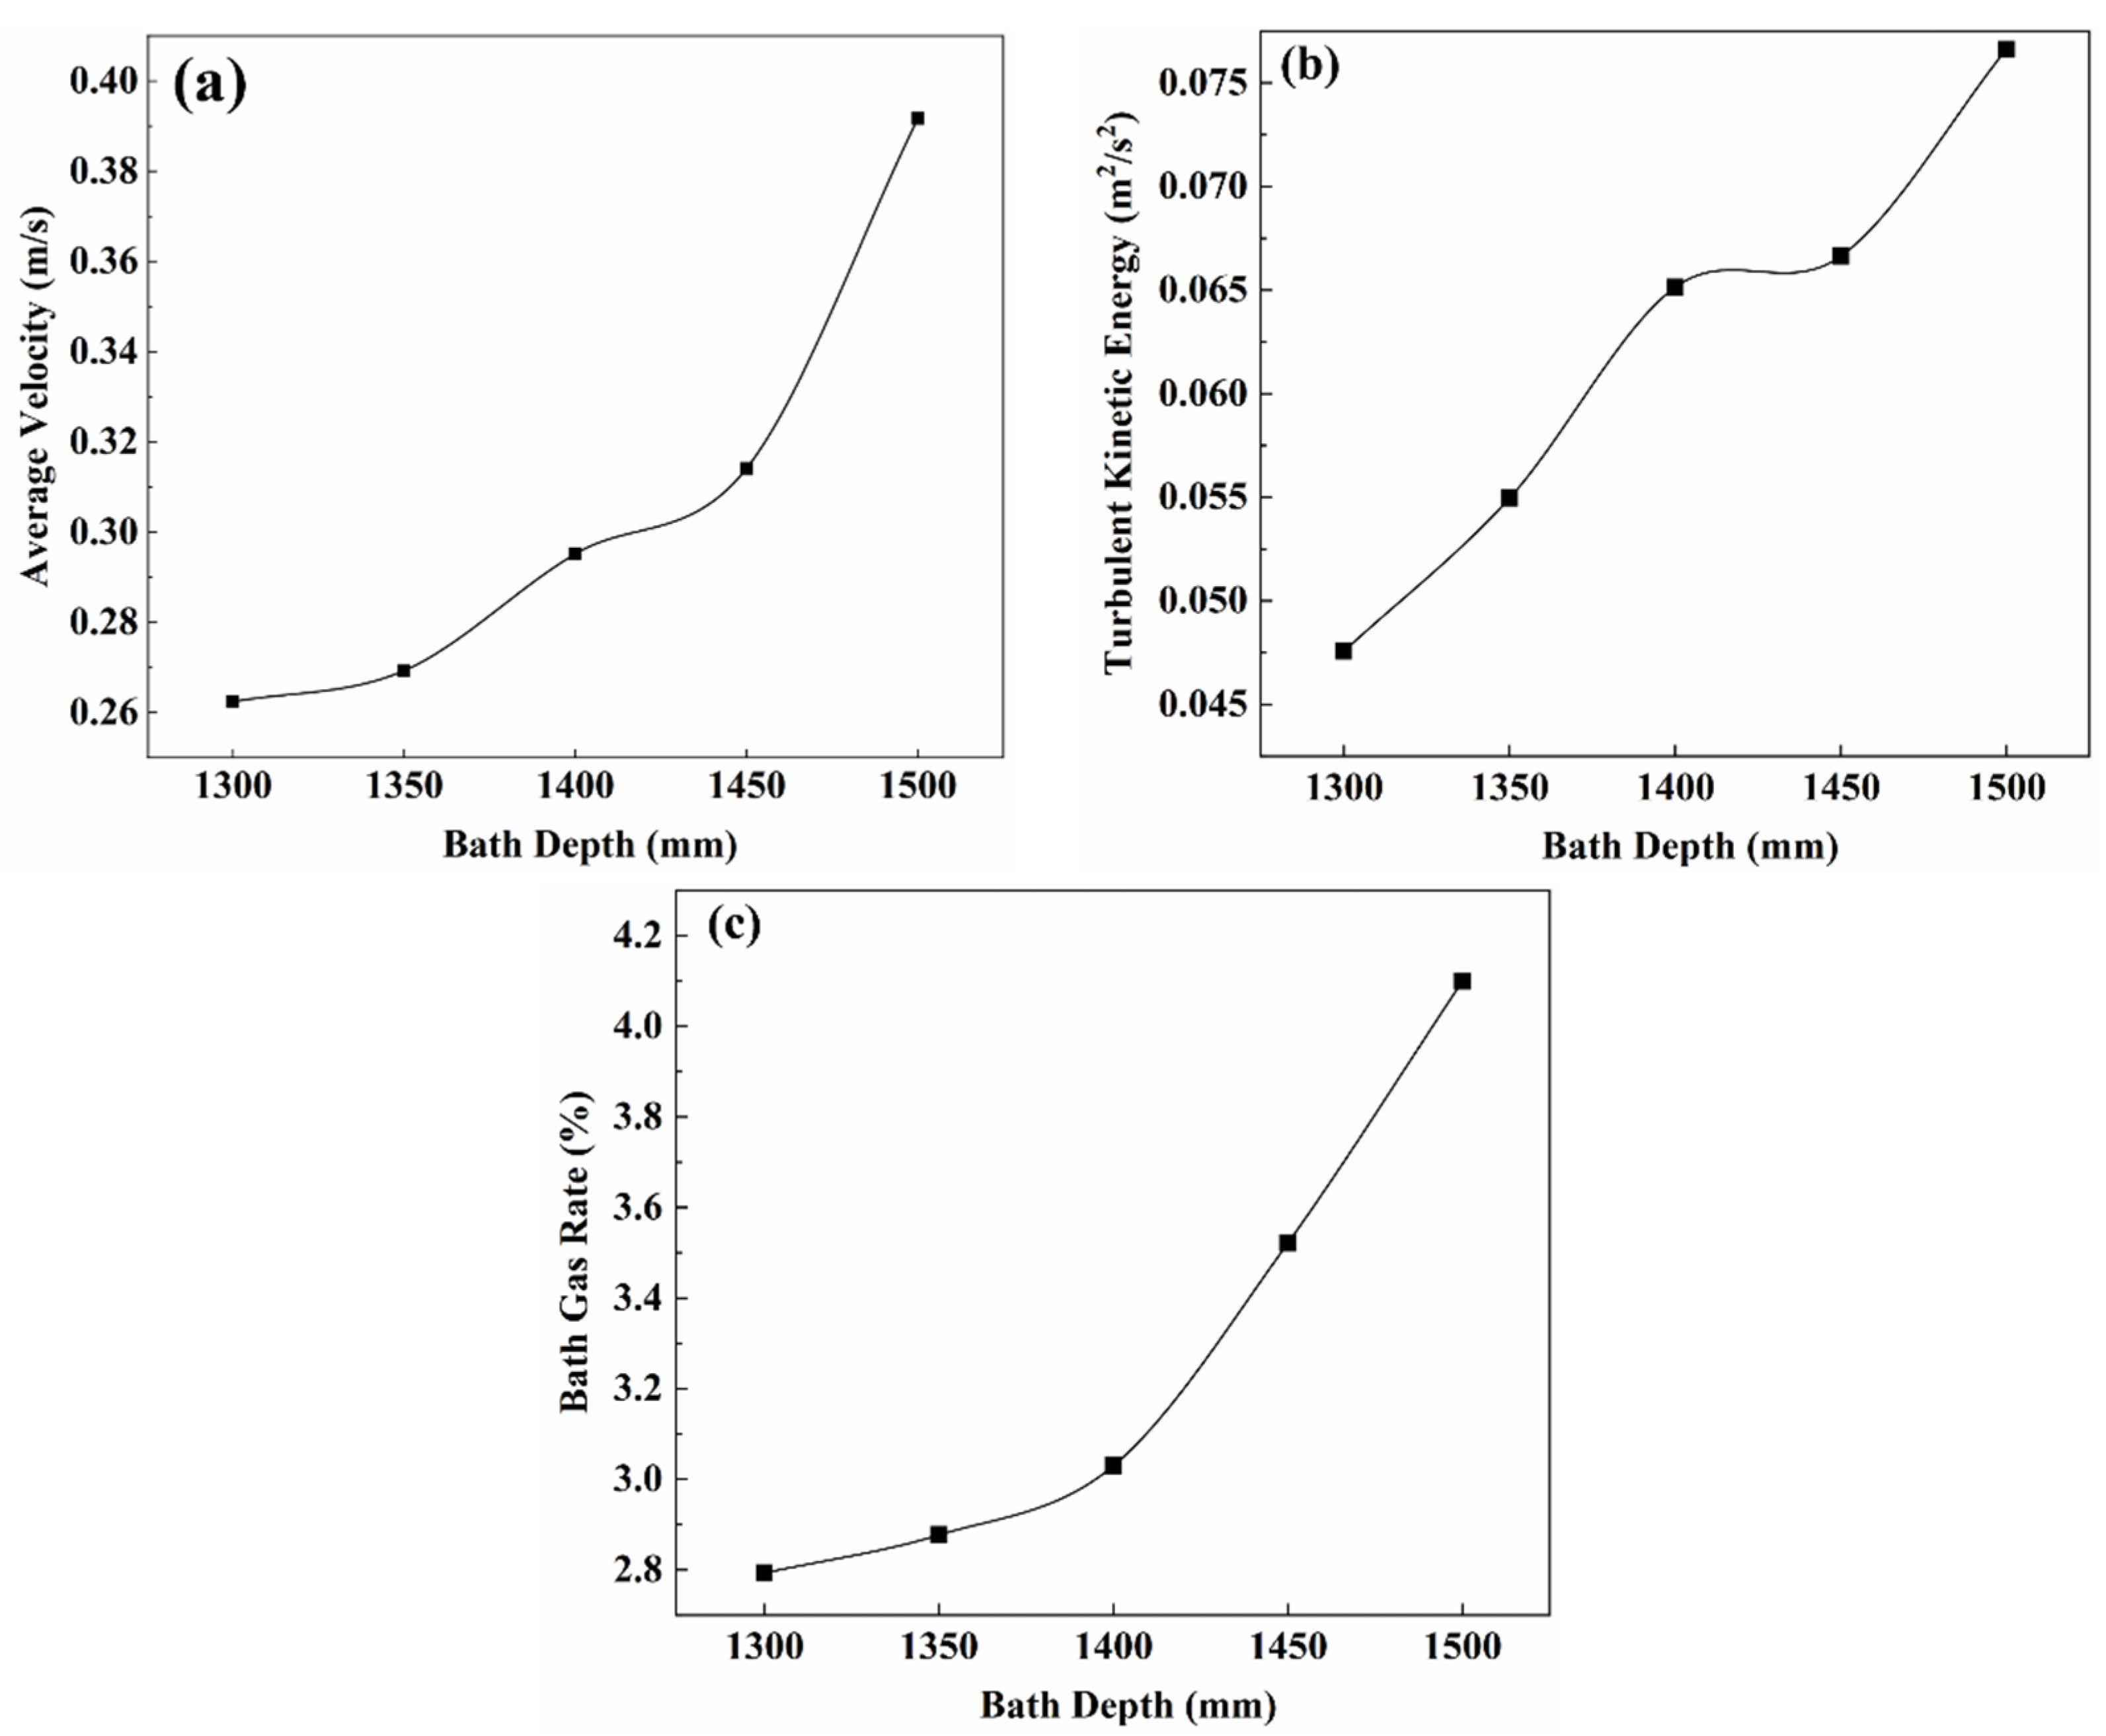
The lance inclination is the upward angle between the oxygen lance and the side wall of the furnace in the horizontal direction. The lance inclination was 0° in basic working conditions, which meant that the angle between the lance and the furnace wall was 90°. The range of the lance inclination was set from 0° to 20°, and the relationship between the evaluation indicators and the lance inclination is shown in Figure 14. The maximum of the average velocity and the bath gas rate appeared when the lance inclination was 15°. The trend of the average velocity is similar to a cosine function, where the maximum values occurred at the lance inclination of 15°. The turbulent kinetic energy decreased to the minimum when the lance inclination was 15°. The bath gas rate first showed an overall increasing trend until the lance inclination increased to 15°, where the indicator reached a maximum. When analyzed comprehensively, both the average velocity and the bath gas rate reached the maximum when the lance inclination was 15°. Although the average turbulent kinetic energy of the melt was the minimum at this inclination angle, the range under this influence factor was only 0.005 m2/s2. This variation was only about 13–17% compared with the range under other influential factors (0.036 m2/s2 under the diameter of the oxygen lance and 0.029 m2/s2 under the depth of the molten pool). Therefore, it can be concluded that the lance inclination of about 15° was best.

3.4.3. Bath Depth

Bath depth refers to the vertical distance between the bottom of the side-blown furnace and the free interface of the melt at rest, which can visually reflect the smelting capacity of the furnace. The range of bath depth was set from 1300 mm to 1500 mm, and the relationship between the evaluation indicators and the lance inclination is shown in Figure 15. Obviously, the three evaluation indicators all increased with the increase in the bath depth. Compared to the bath depth of 1400 mm in basic working conditions, one that is 100 mm higher can extend the residence time of the oxygen-enriched air in the melt pool and enhance the mixing ability of the oxygen lance. Therefore, it was concluded that, when the bath depth was about 1500 mm, the indicators were all at a better level.

3.4.4. Lance Spacing

The oxygen lance spacing, which is the distance between the lances arranged on the side wall, affects the agitation of the oxygen-enriched air in the melt pool. Determining reasonable oxygen lance spacing can avoid the production of a dead zone of mixing with a low-velocity melt due to large lance spacing. Meanwhile, the efficiency of oxygen-enriched air utilization can be improved with suitable lance spacing. According to the study of Cai [28], the reasonable coefficient of the lance spacing arrangement (S/W) was introduced to determine the suitable range of lance spacing. The diameter of the effective mixing zone was determined by measuring the velocity distribution of the melt pool area, and this was set as S. W represents the lance spacing. When S/W was within 1.2~1.5, the lance spacing was in the best range. The relationship between time and the effective mixing zone is shown in Figure 16. When the melt pool basically tended to stabilize, the effective mixing zone was 1.255 m. The lance spacing was in the best range when S/W = 1.2~1.5, so it needed to be kept at 0.84~1.05 m where the agitation of the furnace and the utilization efficiency of oxygen-enriched air were at a high level.

3.5. Matrix Analysis of the Orthogonal Experimental Results

The numerical simulation results of the orthogonal experiment were obtained; each value and the range of the indicator layer matrix were calculated, as shown in Table 7.
Taking the weight matrix affecting the melt average velocity ( ω 1 ) as an example, the calculating process can be shown as follows:
M 1 = [ K 11 0 0 0 K 12 0 0 0 K 13 0 0 0 0 K 21 0 0 0 K 22 0 0 0 K 23 0 0 0 0 K 31 0 0 0 K 32 0 0 0 K 33 0 0 0 0 K 41 0 0 0 K 42 0 0 0 K 43 ] = [ 0.2667 0 0 0 0.2507 0 0 0 0.282 0 0 0 0 0.2703 0 0 0 0.2653 0 0 0 0.2637 0 0 0 0 0.2697 0 0 0 0.254 0 0 0 0.2757 0 0 0 0 0.2407 0 0 0 0.2853 0 0 0 0.2733 ]
T 1 = [ 1 0.7993 0 0 0 0 1 0.7993 0 0 0 0 1 0.7993 0 0 0 0 1 0.7993 ]
S 1 = [ 0.0313 0.1042 0.0066 0.1042 0.0217 0.1042 0.0446 0.1042 ]
ω 1 = M 1 T 1 S 1 = [ 0.1002 0.0942 0.1060 0.0214 0.0210 0.0209 0.0703 0.0662 0.0718 0.1289 0.1528 0.1463 ]
The weight matrix affecting the melt average turbulent kinetic energy ( ω 2 ) and bath gas rate ( ω 3 ) were calculated in the same way, respectively.
ω 2 = [ 0.2873 0.2257 0.1679 0.0683 0.0818 0.0786 0.0018 0.0018 0.0018 0.0274 0.0293 0.0286 ] ,   ω 3 = [ 0.0601 0.0578 0.0604 0.0543 0.0564 0.0567 0.0345 0.0345 0.0336 0.1692 0.1875 0.1941 ]
The total weight matrix was defined as the average of the three indicators’ weight matrix and could be calculated as:
ω = 1 3 × ( ω 1 + ω 2 + ω 3 ) = [ 0.1492 0.1259 0.1114 0.0480 0.0531 0.0521 0.0355 0.0342 0.0357 0.1085 0.1232 0.1230 ] = [ A 1 A 2 A 3 B 1 B 2 B 3 C 1 C 2 C 3 D 1 D 2 D 3 ]
With the analysis of the total weight matrix, the results showed that the lance diameter (A) had the largest weight, followed by the bath depth (D), while that of the lance inclination (B) was weaker, and that of the lance spacing (C) was the weakest. The optimal parameter combination was obtained as A1B2C3D2, and the corresponding parameters were a lancing diameter of 25 mm, lance inclination of 15°, lance spacing of 1050 mm, and bath depth of 1500 mm.

3.6. Industrial Application Verification

This study was applied in an environmental protection enterprise in Guangdong Province to guide the design of an oxygen-enriched side-blown smelting furnace for electroplating sludge. The structural parameters of the industrial furnace include: the length of the furnace body is 5270 mm, the width of the furnace body is 2000 mm, the number of lances is 10, the diameter of the lances is 25 mm, the inclination angle of the lances is 15°, the spacing of the lances is 1050 mm, the bath depth is 1500 mm, and the distance between the lances and the furnace wall is 310 mm.
The industrial test raw materials are from Dongguan City, Guangdong Province. The contents of metal elements, total carbon, and total sulfur are shown in Table 8, and the XRD pattern is shown in Figure 17. It can be seen from Table 8 that the main valuable metal in electroplating sludge is Cu, with a content of 7.28%, which has a high recovery value and economic significance. Ni, Mn, and Sn content is very low, only 0.56%, 0.37%, and 0.86%. It can be seen from the XRD pattern that the X-ray diffraction peak intensity of the electroplating sludge is weak, there are many miscellaneous peaks and only the diffraction peaks of calcium compounds and silica are shown.
The industrial test of the oxygen-enriched side-blown smelting furnace obtained satisfactory results. The matte and slag were obtained by smelting electroplating sludge at 1300~1400 °C. The composition of the matte is shown in Table 9, and the XRD pattern is shown in Figure 18a. The composition of slag is shown in Table 10, and the XRD pattern is shown in Figure 18b. It can be seen from Table 9 that the main elements of the matte are Cu, Fe, Ni, and S. The XRD pattern shows that the main components are CuS, Bornite, Fe2S, NiS, and elemental copper, which proves that the product is matte and is similar to the composition of industrial matte products. It can be seen from Table 10 that the main elements of slag are Fe, SiO2, and CaO. Compared with industrial copper slag, the content of CaO in slag melted by electroplating sludge is higher, while the content of Fe is lower. The XRD pattern shows that the main material is wollastonite and olivine, and contains a small amount of silica, which can be used for cement raw materials and building materials.

4. Conclusions

A mathematical model of the oxygen-enriched side-blown furnace with actual size was established, and a numerical simulation was conducted using the VOF multiphase model and realizable k-ε model. A water model experiment was carried out to verify the rationality of the mathematical model, and the results were compared with the numerical simulation and showed agreement. The numerical simulation results of the oxygen-enriched side-blown furnace were used to guide the industrial furnace design of an environmental protection enterprise in Guangdong. The industrial test of the oxygen-enriched side-blown smelting of electroplating sludge was carried out, and satisfactory results were obtained.
Through the study of the flow field and temperature field distribution of different sections under basic working conditions, it can be concluded that the oxygen-enriched air injected from the oxygen lance is generally in a state of “adhesion to the wall” and the bath gas rate in the middle of the molten pool is low. The velocity in the middle and bottom of the molten pool is very low, and there are stirring dead zones in the central and bottom areas of the molten pool. The oxygen-enriched air with lower temperature exchanges heats strongly with the melt, which promotes the better agitation of the molten pool.
Through research into the influence of the lance diameter, lance inclination, bath depth, and lance spacing, the optimal key parameters can be obtained: these include a lance diameter of 30 mm, a lance inclination of 15°, a bath depth of 1500 mm, and a lance spacing within 0.84~1.05 m. Under these conditions, the stirring capacity in the furnace and the utilization efficiency for the oxygen-enriched air were relatively high.
An orthogonal experiment and matrix analysis were conducted to determine the optimal parameter combination. The results showed that the influence of the four key factors on the flow process in the side-blown furnace was obtained with the order of lance diameter > bath depth > lance inclination > lance spacing. The optimal parameter combination was determined to be a lance diameter of 25 mm, lance inclination of 15°, lance spacing of 1050 mm, and bath depth of 1500 mm.
The research was successfully applied in an environmental protection enterprise in Guangdong and the optimal parameter combination was used in the actual industrial furnace. Electroplating sludge containing 7.28% Cu can be melted at 1300~1400 °C to obtain qualified matte and slag, but industrial copper slag and electroplating sludge smelting slag have higher CaO content and lower Fe content.
In summary, this study optimizes the layout of the lances and provides a basis and guidance for the design and development of the oxygen-enriched side-blown smelting furnace for electroplating sludge. We believe that these optimized working conditions can provide practical benefits for industrial production.

Author Contributions

Conceptualization, B.Y. and W.L.; methodology, B.Y., W.L. and F.J.; software, B.Y.; validation, B.Y., W.L. and F.J.; formal analysis, B.Y., S.J. and L.Z.; investigation, B.Y.; resources, B.Y. and W.Q.; writing—original draft, B.Y.; writing—review and editing, B.Y. and L.Z.; visualization, B.Y.; supervision, L.Z. All authors have read and agreed to the published version of the manuscript.

Funding

This work was supported by the National Key R&D Program of China (No. 2018YFC1902505 and No. 2020YFC1908902).

Institutional Review Board Statement

Not applicable.

Informed Consent Statement

Not applicable.

Data Availability Statement

The data presented in this study are available on request from the corresponding author. The data are not publicly available due to our lab policy or confidentiality agreement.

Conflicts of Interest

On behalf of all authors, the corresponding author states that there are no conflicts of interest.

References

  1. Zhou, J.Z.; Wu, Y.Y.; Liu, C.; Orpe, A.; Liu, Q.; Xu, Z.P.; Qian, G.R.; Qiao, S.Z. Effective Self-Purification of Polynary Metal Electroplating Wastewaters through Formation of Layered Double Hydroxides. Environ. Sci. Technol. 2010, 44, 8884–8890. [Google Scholar] [CrossRef] [PubMed]
  2. Li, C.; Xie, F.; Ma, Y.; Cai, T.; Li, H.; Huang, Z.; Yuan, G. Multiple heavy metals extraction and recovery from hazardous electroplating sludge waste via ultrasonically enhanced two-stage acid leaching. J. Hazard. Mater. 2010, 178, 823–833. [Google Scholar] [CrossRef] [PubMed]
  3. Magalhaes, J.M.; Silva, J.E.; Castro, F.P.; Labrincha, J.A. Physical and chemical characterisation of metal finishing industrial wastes. J. Environ. Manag. 2005, 75, 157–166. [Google Scholar] [CrossRef] [PubMed] [Green Version]
  4. Kuchar, D.; Fukuta, T.; Onyango, M.S.; Matsuda, H. Sulfidation treatment of copper-containing plating sludge towards copper resource recovery. J. Hazard. Mater. 2006, 138, 86–94. [Google Scholar] [CrossRef] [PubMed]
  5. Jordan, M.M.; Almendro-Candel, M.B.; Romero, M.; Rincón, J. Application of sewage sludge in the manufacturing of ceramic tile bodies. Appl. Clay Sci. 2005, 30, 219–224. [Google Scholar] [CrossRef] [Green Version]
  6. Karlovic, E.S.; Dalmacija, B.D.; Tamas, Z.S.; Prica, M.D.; Ranogajec, J.G. Preliminary evaluation of galvanic sludge immobilization in clay-based matrix as an environmentally safe process. J. Environ. Sci. Health Part A Toxic/Hazard. Subst. Environ. Eng. 2008, 43, 528–537. [Google Scholar] [CrossRef] [PubMed]
  7. Li, P.; Yao, X.; Guo, T.Y.; Li, D.B. Numerical simulation of gas-liquid mixing characteristics in side-blown bath. Nonferrous Met. Equip. 2019, 2, 16–24. [Google Scholar]
  8. Huda, N.; Naser, J.; Brooks, G.; Reuter, M.A.; Matusewicz, R.W.; Iaeng, A. Computational Fluid Dynamic Modeling Study of Slag Fuming in Top Submerged Lance Smelting Furnace. In Proceedings of the World Congress on Engineering (WCE 2010), London, UK, 30 June–2 July 2010; International Association of Engineers-IAENG: Hong Kong, China, 2010; pp. 1069–1074. [Google Scholar]
  9. Lei, M.; Wang, Y.Z.; Zhang, J.Y.; Cheng, W.L.; Zheng, S.B.; Wang, B.; Hong, X. The multiphase flow model simulates fluid flow in a smelting reduction furnace. Chin. J. Proc. Eng. 2009, 9, 420–425. [Google Scholar]
  10. Yan, H.J.; Liu, F.K.; Zhang, Z.Y.; Gao, Q.; Liu, L.; Cui, Z.X.; Shen, D.B. Influence of lance arrangement on bottom-blowing bath smelting process. Chin. J. Nonferrous Met. 2012, 22, 2393–2400. [Google Scholar]
  11. Davis, M.; Dry, R.; Schwarz, P.; Symbols, G. Flow simulation of the hismelt process. In Proceedings of the Third International Conference on CFD in the Minerals and Process Industries CSIRO, Melbourne, Australia, 10–12 December 2003. [Google Scholar]
  12. Yan, H.J.; Xia, T.; Liu, L.; He, Q.A.; He, Z.J.; Li, Q.Q. Numerical simulation and structural optimization of gas-liquid two-phase flow in reduction furnace of lead-rich slag. Chin. J. Nonferrous Met. 2014, 24, 2642–2651. [Google Scholar]
  13. Li, Y.; Ma, F. The Numerical Simulation and Optimal Design of Nozzle Jet for Gas-fluid Two Phase Flow. In Proceedings of the International Conference on Advanced Engineering Materials and Technology (AEMT2011), Sanya, China, 29–31 July 2011; Volume 291–294, pp. 2403–2406. [Google Scholar] [CrossRef]
  14. Zhan, S.H.; Lai, Z.B.; Xiao, Z.Q. Agitation in a side-blown metal bath. J. Cent. South Univ. Soc. Sci. 2003, 2, 148–151. [Google Scholar]
  15. Li, X.L.; Liu, Y.; Wang, D.X.; Zhang, T.A. Physical Simulation of Emulsion Phenomena in Copper Sideblown Smelting Process. J. North Univ. Nat. Sci. 2018, 39, 649–653. [Google Scholar]
  16. Zhu, Z.Y.; Zhou, P.; Chen, Z.; Long, P.; Zhang, L. Numerical simulation on effect of air injection on two-phase flow in oxygen-enriched side-blown furnace. J. Cent. South Univ. Sci. Technol. 2022, 53, 398–408. [Google Scholar]
  17. Liu, F.K. Numerical Simulation and Optimization of Mulfiphase Flow in Bottom Blowing Lead Smelting Furnace. Ph.D. Thesis, Central South University, Changsha, China, 2013. [Google Scholar]
  18. Hamdia, K.M.; Ghasemi, H. Quantifying the uncertainties in modeling soft composites via a multiscale approach. Int. J. Solids Struct. 2022, 256, 111959. [Google Scholar] [CrossRef]
  19. Bian, Z.; Chen, D.; Sun, L.; Wang, L.; Zhao, H. Numerical Simulation and Experimental Investigation of Multiphase Flow in an Oxygen-Rich Side-Blown Bath Smelting Furnace. SSRN 2022, 4119238, preprint. [Google Scholar] [CrossRef]
  20. Rabha, S.S.; Buwa, V.V. Volume-of-fluid (VOF) simulations of rise of single/multiple bubbles in sheared liquids. Chem. Eng. Sci. 2010, 65, 527–537. [Google Scholar] [CrossRef]
  21. Cong, D.; Jian-Zhong, L.; Zhen-Yu, H.; Jun-Hu, Z.; Ke-Fa, C. VOF Method for Impinging-Jet Atomizers. Energy Fuels 2010, 24, 451–455. [Google Scholar] [CrossRef]
  22. Feng, K.F.; Zhang, J.Y.; Wang, B.; Xu, J.; Xie, J.Y.; Cheng, W.L.; Yin, D.Y.; Zheng, S.B. Numerical Simulation Study on Immersed Side-Blowing in C-H-2 Smelting Reduction Furnace. In Proceedings of the 5th International Symposium on High-Temperature Metallurgical Processing held during 143rd TMS Annual Meeting and Exhibition, San Diego, CA, USA, 16–20 February 2014. [Google Scholar]
  23. ANSYS. ANSYS Fluent Theory Guide; Fluent Inc.: Canonsburg, PA, USA, 2021; p. 2021. [Google Scholar]
  24. Zhang, L.; Zhang, L.; He, Y. The Process and Application of Oxygen-Enriched Air Side Blown Smelting of Lead-Zinc Materials. In Proceedings of the 9th International Symposium on Lead and Zinc Processing (PbZn), San Diego, CA, USA, 23–27 February 2020; Springer International Publishing: Cham, Switzerland, 2020; pp. 291–299. [Google Scholar] [CrossRef]
  25. Sundström, A.W.; Eksteen, J.J.; Georgalli, G.A. A review of the physical properties of base metal mattes. J. South Afr. Inst. Min. Met. 2008, 108, 431–448. [Google Scholar]
  26. Cai, Z.P.; Liang, Y.; Zhang, C.X. Experimental Study and Measurement Technology of Chemical Metallurgy Model; Metallurgical Industry Press: Beijing, China, 2001. [Google Scholar]
  27. Xia, T. Numerical Simulation and Optimization of Multiphase Flow in Reduction Furnace of Liquid High Lead Slag. Postgraduate Thesis, Central South University, Changsha, China, 2014. [Google Scholar]
  28. Cai, Z.P.; Liang, Y.; Qian, Z.M.; Ma, E.X.; Wei, W.S.; He, Y.L.; Wang, L.S. The model experiment study of continuous lead smelting with bottom blowing oxygen (I) the reasonable arrangement of the distance between the bottom blowing gun and the partition wall. Chin. J. Proc. Eng. 1985, 4, 113–122. [Google Scholar]
  29. Peng, Q.R. Copper Metallurgy; Central South University Press: Changsha, China, 2004. [Google Scholar]
Disclaimer/Publisher’s Note: The statements, opinions, and data contained in all publications are solely those of the individual author(s) and contributor(s) and not of MDPI and/or the editor(s). MDPI and/or the editor(s) disclaim responsibility for any injury to people or property resulting from any ideas, methods, instructions, or products referred to in the content.
Figure 1. Schematic of the side-blown furnace geometry model.
Sustainability 15 10721 g001
Figure 2. Grid diagram of the furnace (a) and the refined lance region (b).
Sustainability 15 10721 g002
Figure 3. Diagram of inlets and outlet.
Sustainability 15 10721 g003
Figure 4. Connection diagram of the water model experimental device (a): 1—High speed camera. 2—Computer. 3—Water model of side-blown furnace. 4—LED light source. 5—Rotor flow meter. 6—Air pump. The schematic of the water model of the side-blown furnace (b).
Sustainability 15 10721 g004
Figure 5. Geometry model (a) and the grid division (b) under single-factor analysis.
Sustainability 15 10721 g005
Figure 6. Distribution of the average velocity of bath fluid with time under different grids.
Sustainability 15 10721 g006
Figure 7. Comparison of bubble shapes in numerical simulation and water model experiment (a), (b) initial blowing stage; and (c,d) continuous blowing stage.
Sustainability 15 10721 g007
Figure 8. Schematic diagram of the sections of the furnace: lance cross-section (a), bath-free surface (b), and lance longitudinal sections (c,d).
Sustainability 15 10721 g008
Figure 9. The changes in gas volume fraction distribution in the lance section (c) with time.
Sustainability 15 10721 g009
Figure 10. Gas volume fraction distribution of lance cross-section (a), bath-free surface (b), and lance longitudinal sections (c,d) in the furnace.
Sustainability 15 10721 g010
Figure 11. Velocity distribution of lance cross-section (a), bath-free surface (b), and lance longitudinal sections (c,d) in the furnace.
Sustainability 15 10721 g011
Figure 12. Temperature distribution of lance longitudinal section (c) in the furnace.
Sustainability 15 10721 g012
Figure 13. Relationship between average velocity (a), turbulent kinetic energy (b), bath gas rate (c), and lance diameter.
Sustainability 15 10721 g013
Figure 14. Relationship between average velocity (a), turbulent kinetic energy (b), bath gas rate (c), and lance inclination.
Sustainability 15 10721 g014
Figure 15. Relationship between average velocity (a), turbulent kinetic energy (b), bath gas rate (c), and bath depth.
Sustainability 15 10721 g015
Figure 16. Relationship between the effective mixing of zone diameter and time.
Sustainability 15 10721 g016
Figure 17. XRD pattern.
Sustainability 15 10721 g017
Figure 18. XRD patterns of the smelting products: (a) matte, (b) slag.
Sustainability 15 10721 g018
Table 1. Grid division method.
ZoneScheme ElementsScheme TypeInterval Size/CountQuantity of Elements
Gaseous areahexahedralMapSize: 20117,600
Melt areaTet/HybridTGirdSize: 6570,629
Lance area (Face mesh)QuadrilateralPaveCount: 30\
Lance areaHex/WedgeCooperSize: 46068 × 10
Table 2. Property parameters of fluids in the side-blown furnace.
FluidDensity/
(kg·m−3)
Temperature/
K
Viscosity/
(kg·m−1·s−1)
Specific Heat Capacity/
(J·kg−1·K−1)
Thermal Conductivity/
(W·m−1·K−1)
Copper Matte46001573.150.00226070.04381
Oxygen-enriched Air1.235298.151.817 × 10−5967.8540.02444
Table 3. Configuration of the factors’ level.
FactorsLevel 1Level 2Level 3
A Lance Diameter/mm253035
B Lance Inclination/°121518
C Lance Spacing/mm8509501050
D Bath Depth/mm145015001550
Table 4. Design of the orthogonal experiments.
Experiment NumberLevel of Lance DiameterLevel of Lance InclinationLevel of Lance SpacingLevel of Bath Depth
11111
21222
31333
42123
52231
62312
73132
83213
93321
Table 5. Average velocity of bath fluids under different element numbers.
Element Number322,445748,9091,044,726
Average Velocity (m/s)0.370.3190.32
Table 6. Comparison of water model experimental results with numerical simulation results.
ResultWater Model ExperimentalNumerical SimulationError/%
db/dn 1)6.937.12.39
1)  d b : bubble diameter; d n : lance diameter.
Table 7. Results of the orthogonal experiment.
Experiment NumberLance Diameter
/mm
Lance Inclination
Lance Spacing
/mm
Bath Depth
/mm
Average Velocity
/ms−1
Turbulent Kinetic Energy
/m2 s2
Bath Gas Rate
/%
111110.2480.02756.87
212220.2720.03337.91
313330.2800.03168.02
421230.2490.02187.61
522310.2330.02516.68
623120.2700.02587.64
731320.3140.01627.48
832130.2910.028.21
933210.2410.01787.23
K10.26670.27030.26970.2407Intuitive analysis of average velocity
K20.25070.26530.2540.2853
K30.2820.26370.27570.2733
R0.03130.00660.02170.0446
K10.03080.02180.02440.0235Intuitive analysis of turbulent kinetic energy
K20.02420.02610.02430.0251
K30.0180.02510.02430.0245
R0.01280.00430.00010.0016
K17.67.327.57336.9267Intuitive analysis of bath gas rate
K27.317.67.58337.6767
K37.647.637.39337.9467
R0.330.310.191.02
Table 8. Results of quantitative analysis of multiple elements in electroplating sludge.
ElementsFeCaCuAlSiSnMgNiMnCS
Wt%10.3410.956.64~7.502.511.610.860.910.500.377.585.89
Table 9. Element analysis results of matte products [29].
Smelting MethodChemical Composition/wt%
CuFeSNiZnPb
ES46.5621.2121.983.110.070.06
Closed blast furnace (Oxygen-enriched air)41.5728.6623.79---
Otokunp52.4619.8122.37 0.23
Vanukov41–5525–1422–244.5–5.2--
Ausmelt44.5023.6023.80-3.20-
Mitsubishi65.709.2021.90---
Table 10. Analysis results of copper slag composition [29].
Smelting MethodChemical Composition/wt%
CuFeFe3O4SiO2SAl2O3CaOMgO
ES0.2725.86 36.50.35.919.50.95
Closed blast furnace
(Oxygen-enriched air)
0.4229.00-38.0-7.511.00.74
Vanukov0.4535.003.1535.00.73.88.01.40
Otokunp0.7844.06-29.71.47.80.6-
Mitsubishi0.6038.20-32.20.62.95.9-
Ausmelt0.6534.007.5031.02.87.55.0-
Disclaimer/Publisher’s Note: The statements, opinions and data contained in all publications are solely those of the individual author(s) and contributor(s) and not of MDPI and/or the editor(s). MDPI and/or the editor(s) disclaim responsibility for any injury to people or property resulting from any ideas, methods, instructions or products referred to in the content.

