
Family Dwelling House Localization in Poland as a Factor Influencing the Economic Effect of Rainwater Harvesting System with Underground Tank

Abstract
:1. Introduction
- -
- Climate change: global warming and climate change are contributing to rising temperatures, resulting in the accelerated evaporation of surface water. In addition, some regions are experiencing extreme weather events, such as prolonged droughts, which further reduce the availability of water.
- -
- Degradation of aquatic ecosystems: water pollution, deforestation, overuse of water resources, and destruction of wetlands are leading to the degradation of aquatic ecosystems. These changes negatively affect water retention and natural purification processes, leading to a decrease in the availability of clean water.
- -
- Increasing demand for water: population growth, economic development, urbanization, and agriculture require increasing amounts of water. The increasing demand for water associated with various economic sectors is resulting in the overuse of water resources.
- (1)
- Water supply infrastructure and plumbing systems: Properly designed, operated, and maintained water supply systems affect the efficiency of water delivery to users. The use of water-efficient appliances and tapware directly affects water consumption and can significantly reduce water use.
- (2)
- User behavior and habits: The level of awareness of users about water resources and the efficient use of water, as well as education on water efficiency, such as information campaigns, can influence users to change their habits and reduce consumption.
- (3)
- Water regulation and pricing policies: Water tariffs, fees, and subscription fees can influence user behavior and motivate water efficiency. Introducing and enforcing appropriate standards, including building certification, can promote technological innovation and encourage less water consumption in the use of appliances and systems.
- -
- those requiring a supply of drinking water (tap), which provides water for food, personal hygiene, and dishwashing purposes, with the quality specified in the decree of the Minister of Health [8], or;
- -
- others, which can be supplied with water of lesser quality than drinking water, e.g., gray water generated during bathing and hand washing, after it has been treated in an adapted system, or rainwater, after it has been treated and stored. It is necessary to clearly label the rainwater collection points as water not suitable for human consumption.
2. Materials and Methods
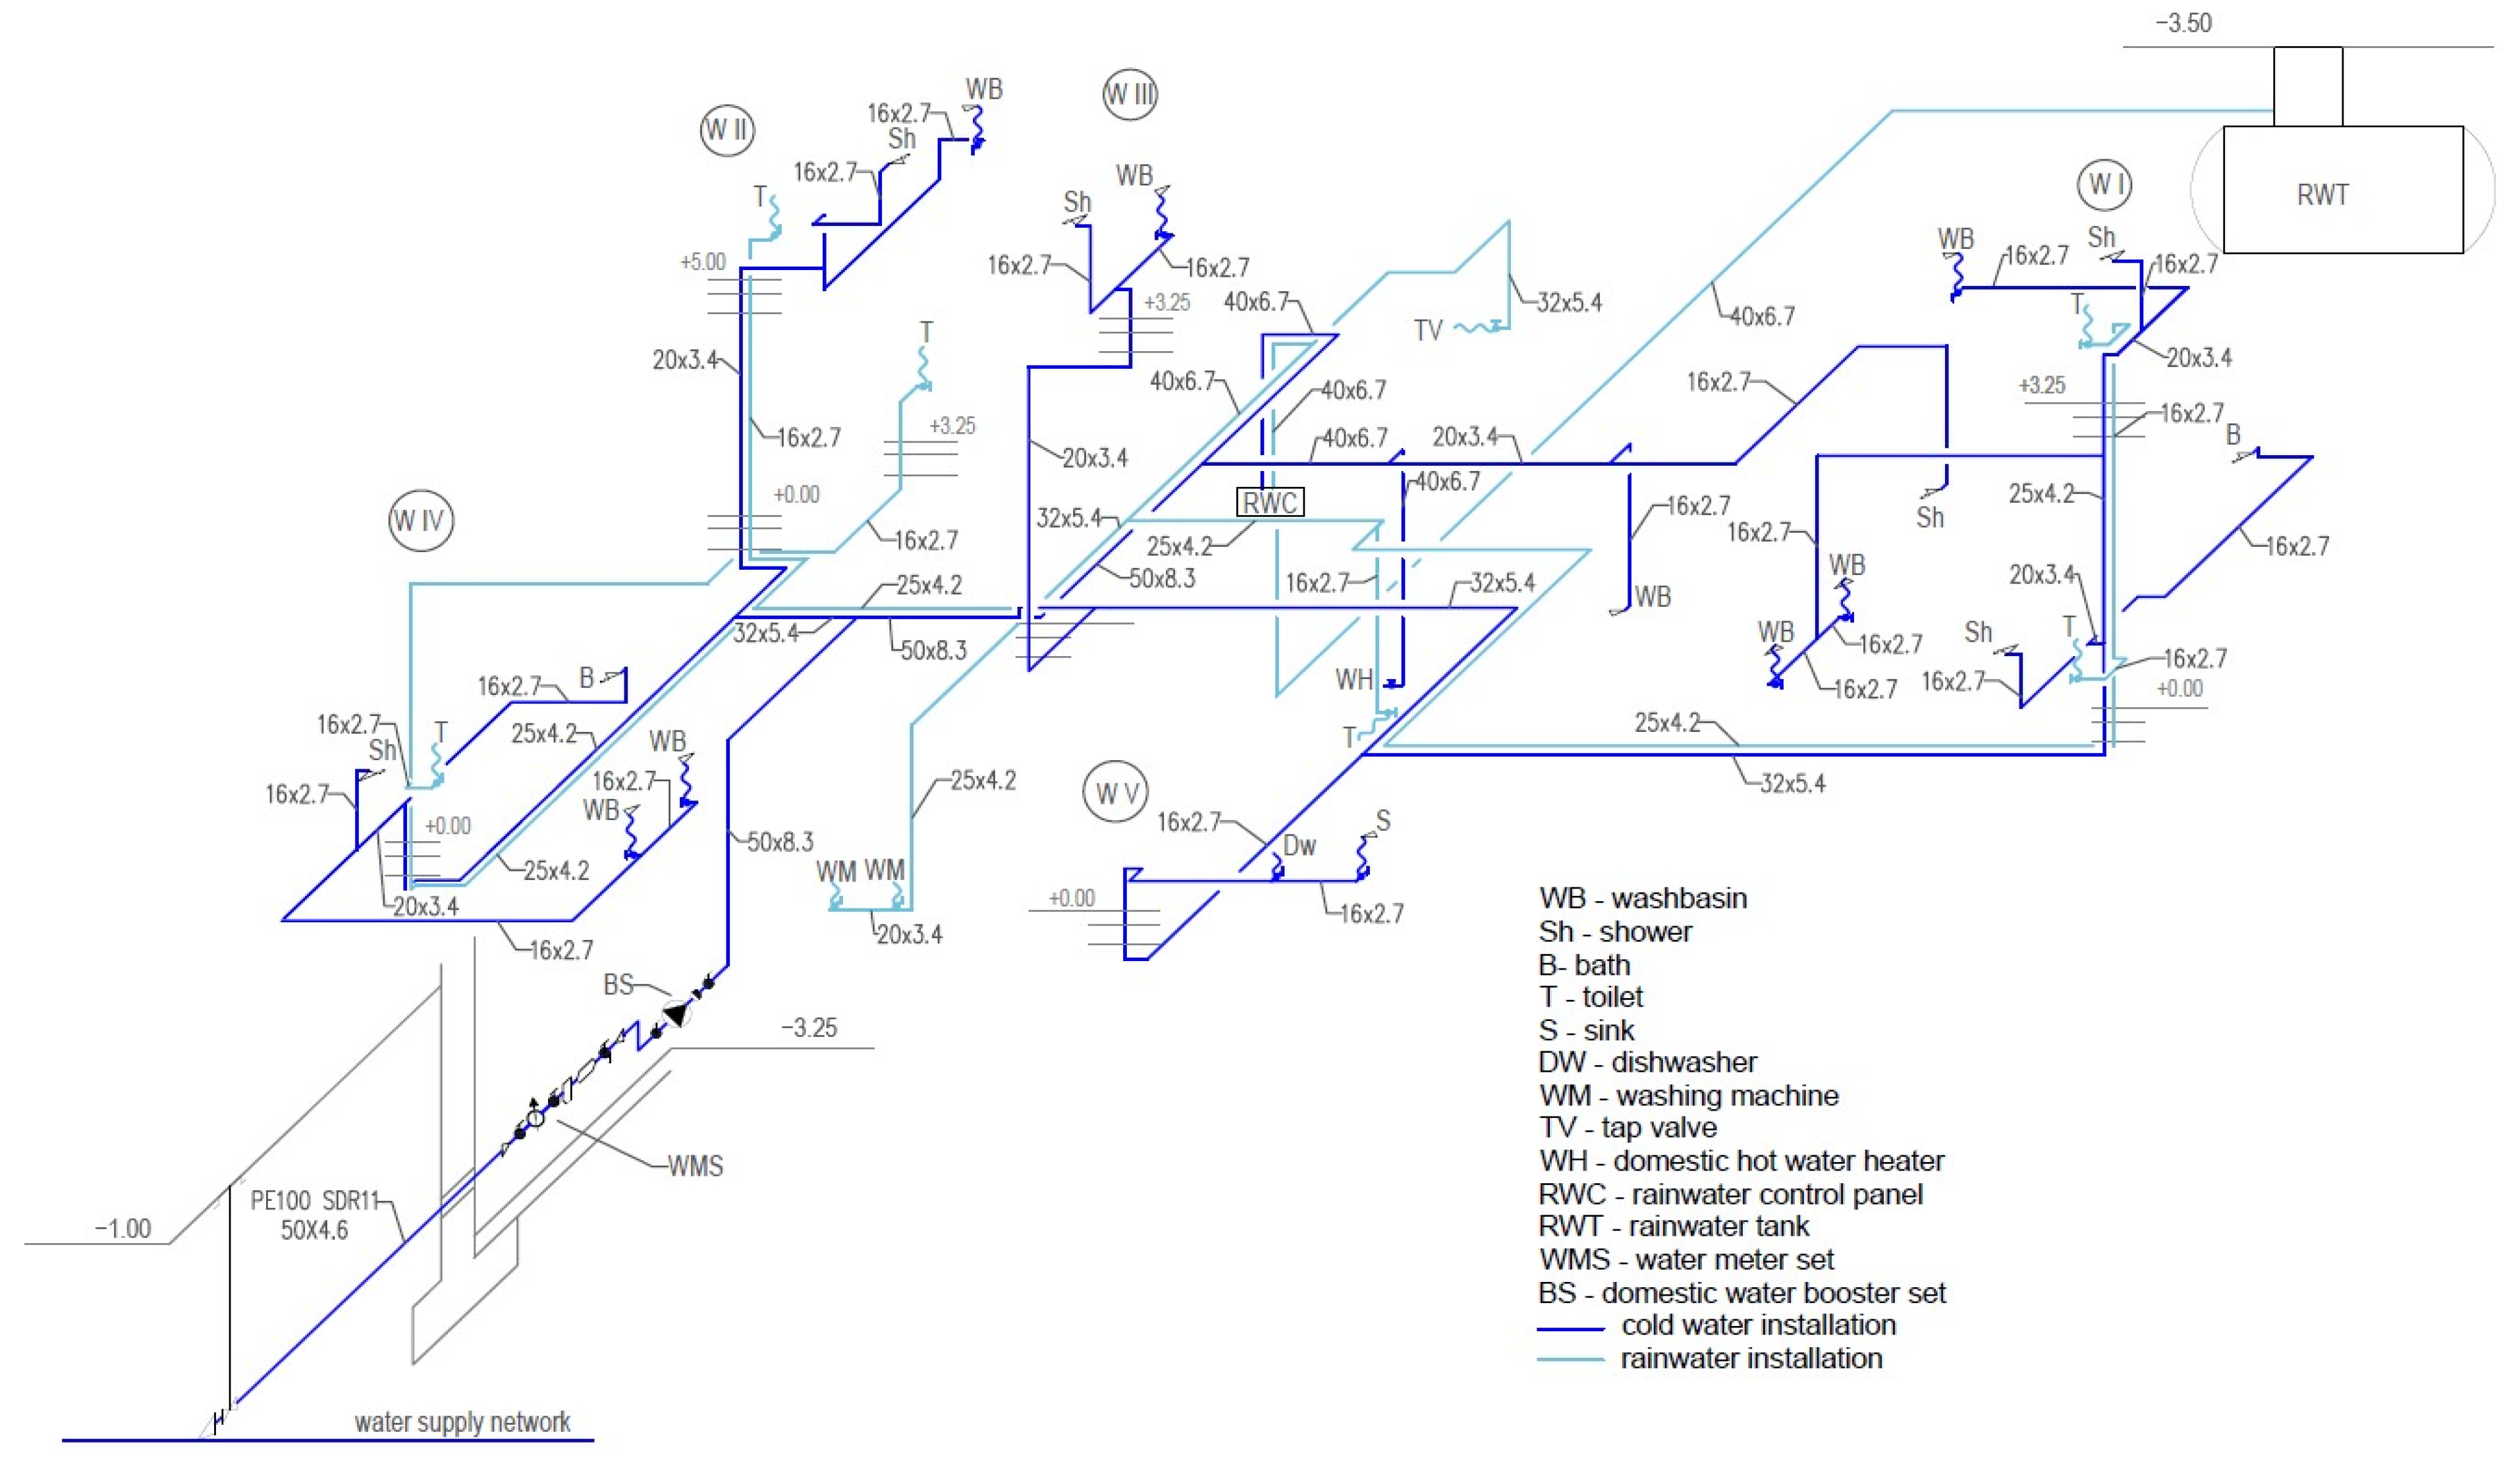
2.1. Installation of Rainwater Recovery and Use in a Single-Family Building
- -
- garden—allowing the use of rainwater for the irrigation of green areas during the growing season of plants, and for cleaning purposes or washing cars;
- -
- domestic (indoor)—allowing the use of rainwater for flushing toilets and/or urinals, and for laundry and cleaning purposes; and
- -
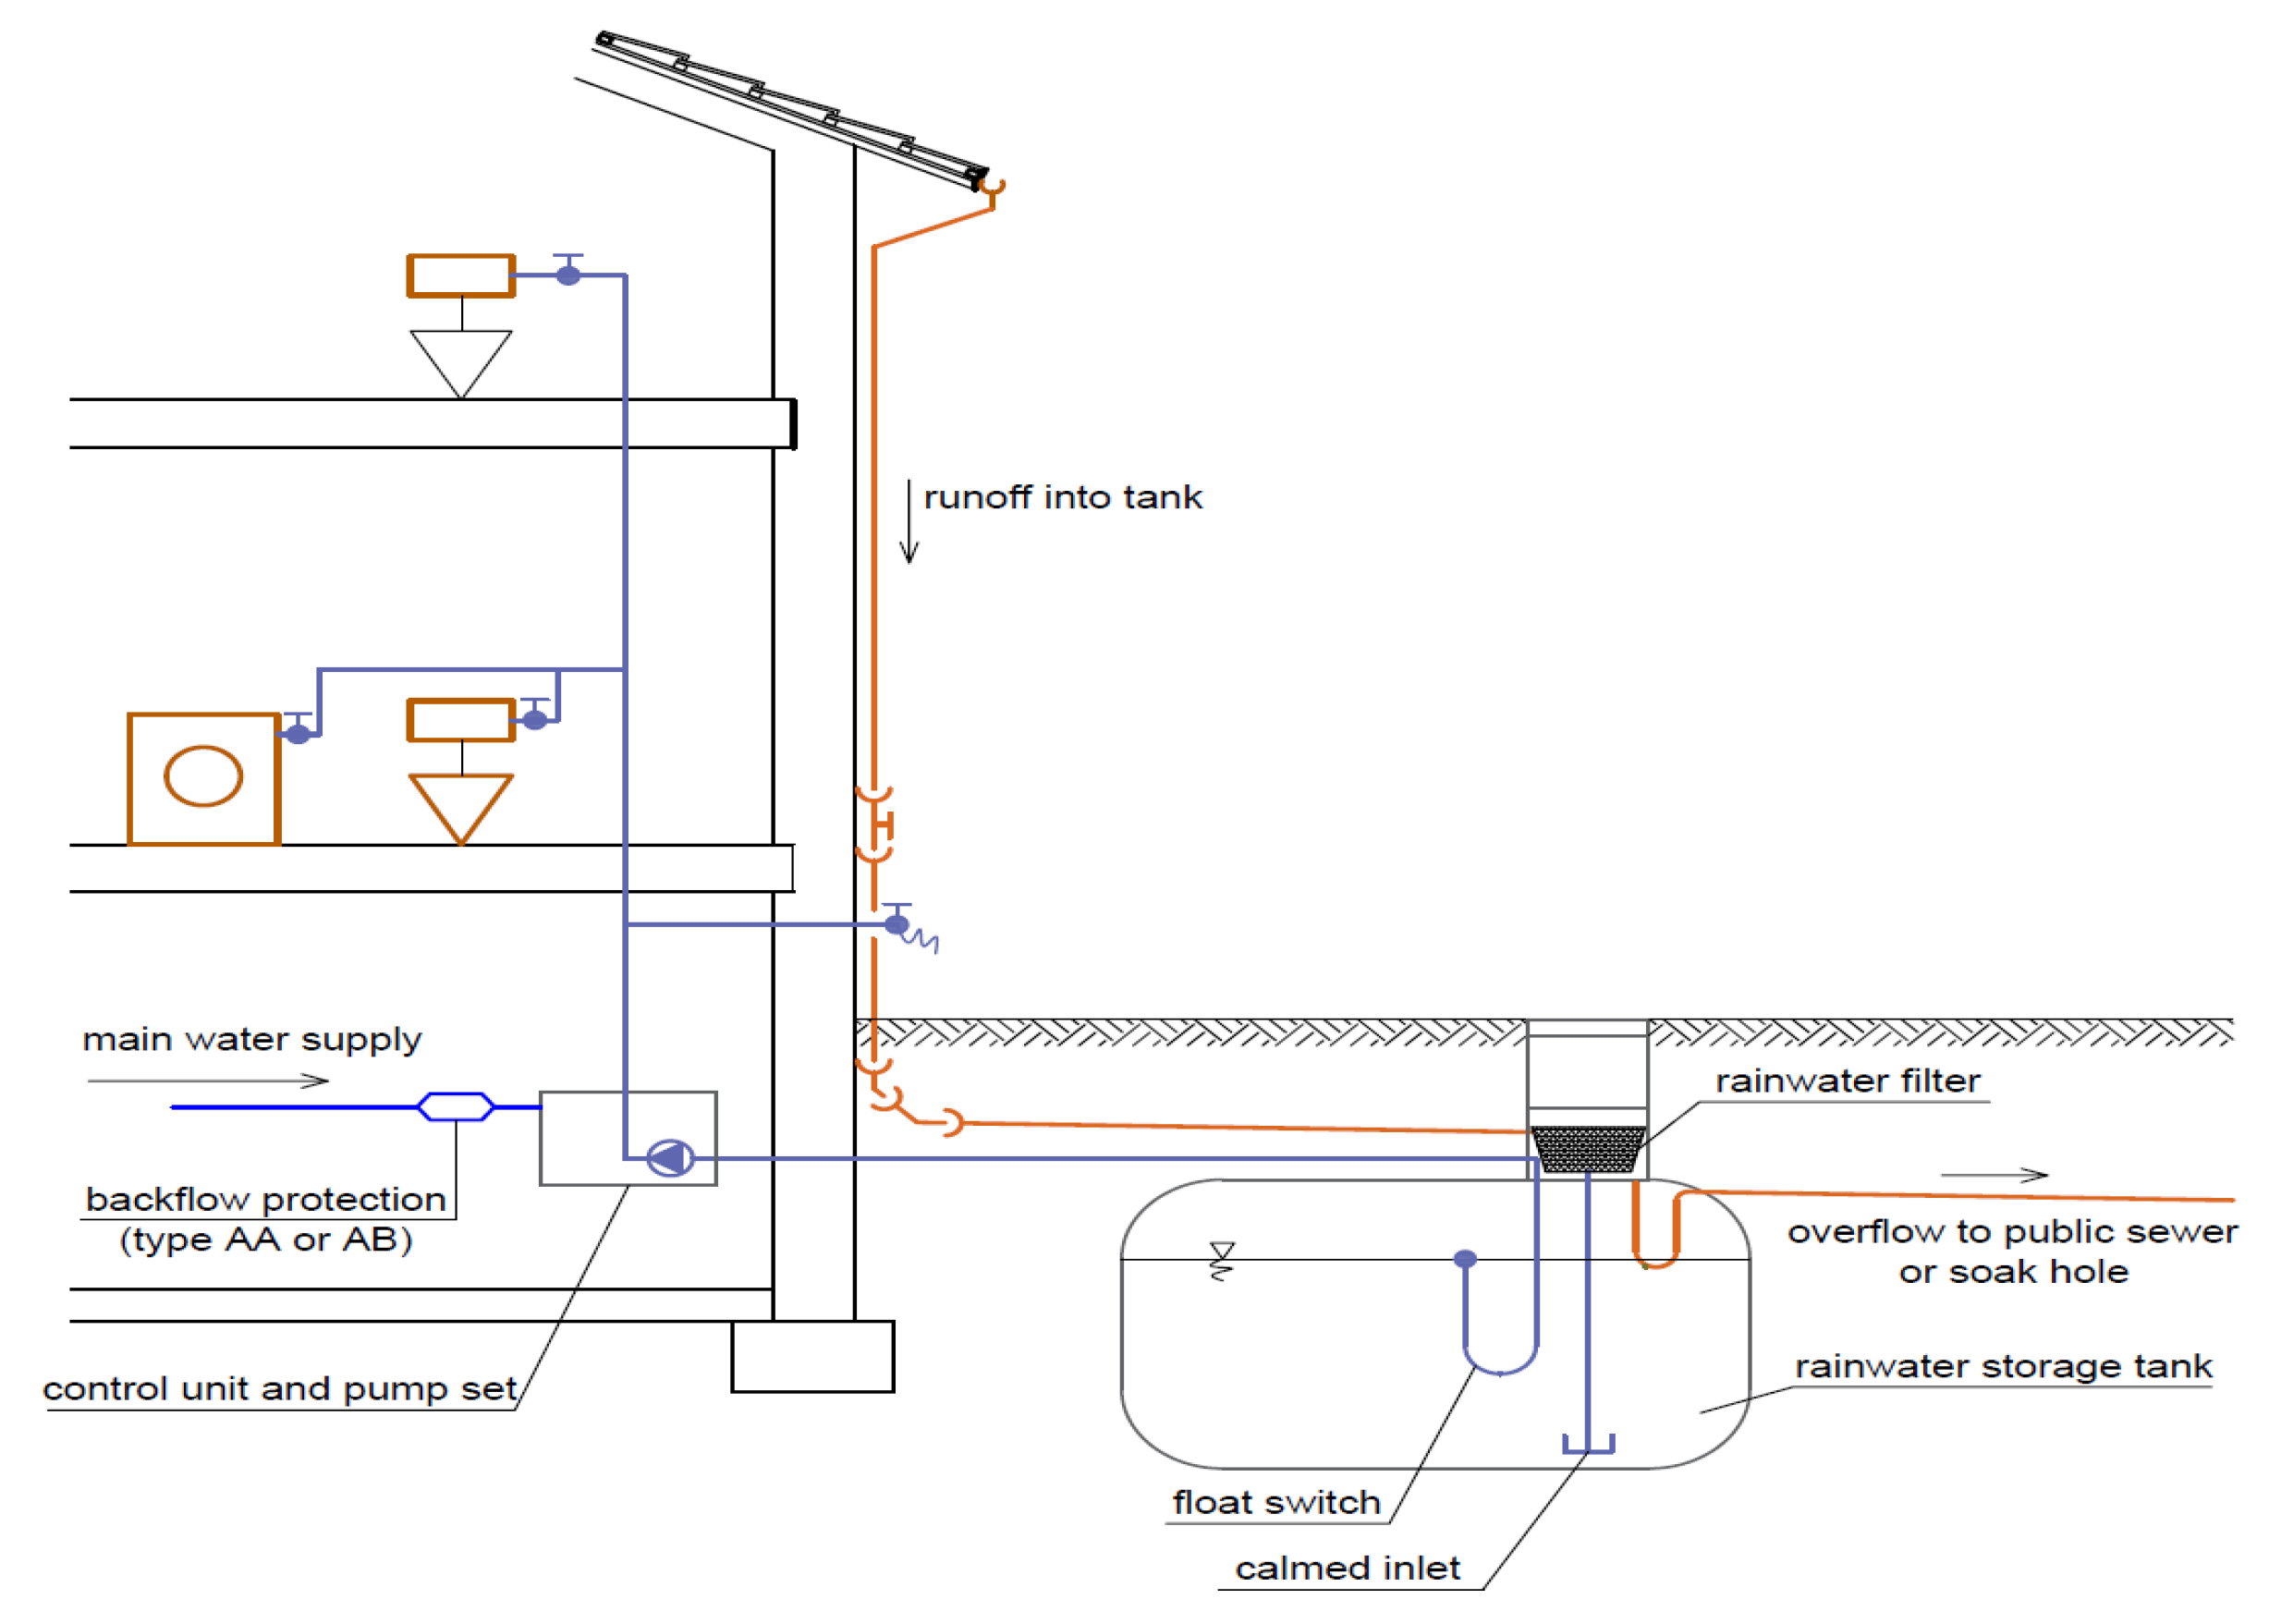
- domestic-garden, which is a combination of the above systems. An example diagram of a domestic-garden with an underground tank is shown in Figure 1.
2.2. Methodology for Designing Rainwater Systems
- -
- adopt annual rainfall totals from a 30-year period for the location;
- -
- determine the area from which rainwater will be collected and adopt the runoff coefficient depending on the coverage;
- -
- for other surfaces, take into account only those whose contact with rainwater will not result in it containing major contaminants;
- -
- determine the annual yield of rainwater and, based on the result, adopt the method of application of rainwater so that the demand is approximately equal to the yield;
- -
- provide an emergency supply of water from the water mains and an appropriate backflow-prevention assembly on the pipe supplying tap water to the rainwater system;
- -
- unambiguously mark rainwater collection points as water unfit for human consumption; and
- -
- use plastic materials for rainwater systems, due to their high corrosivity.
- -
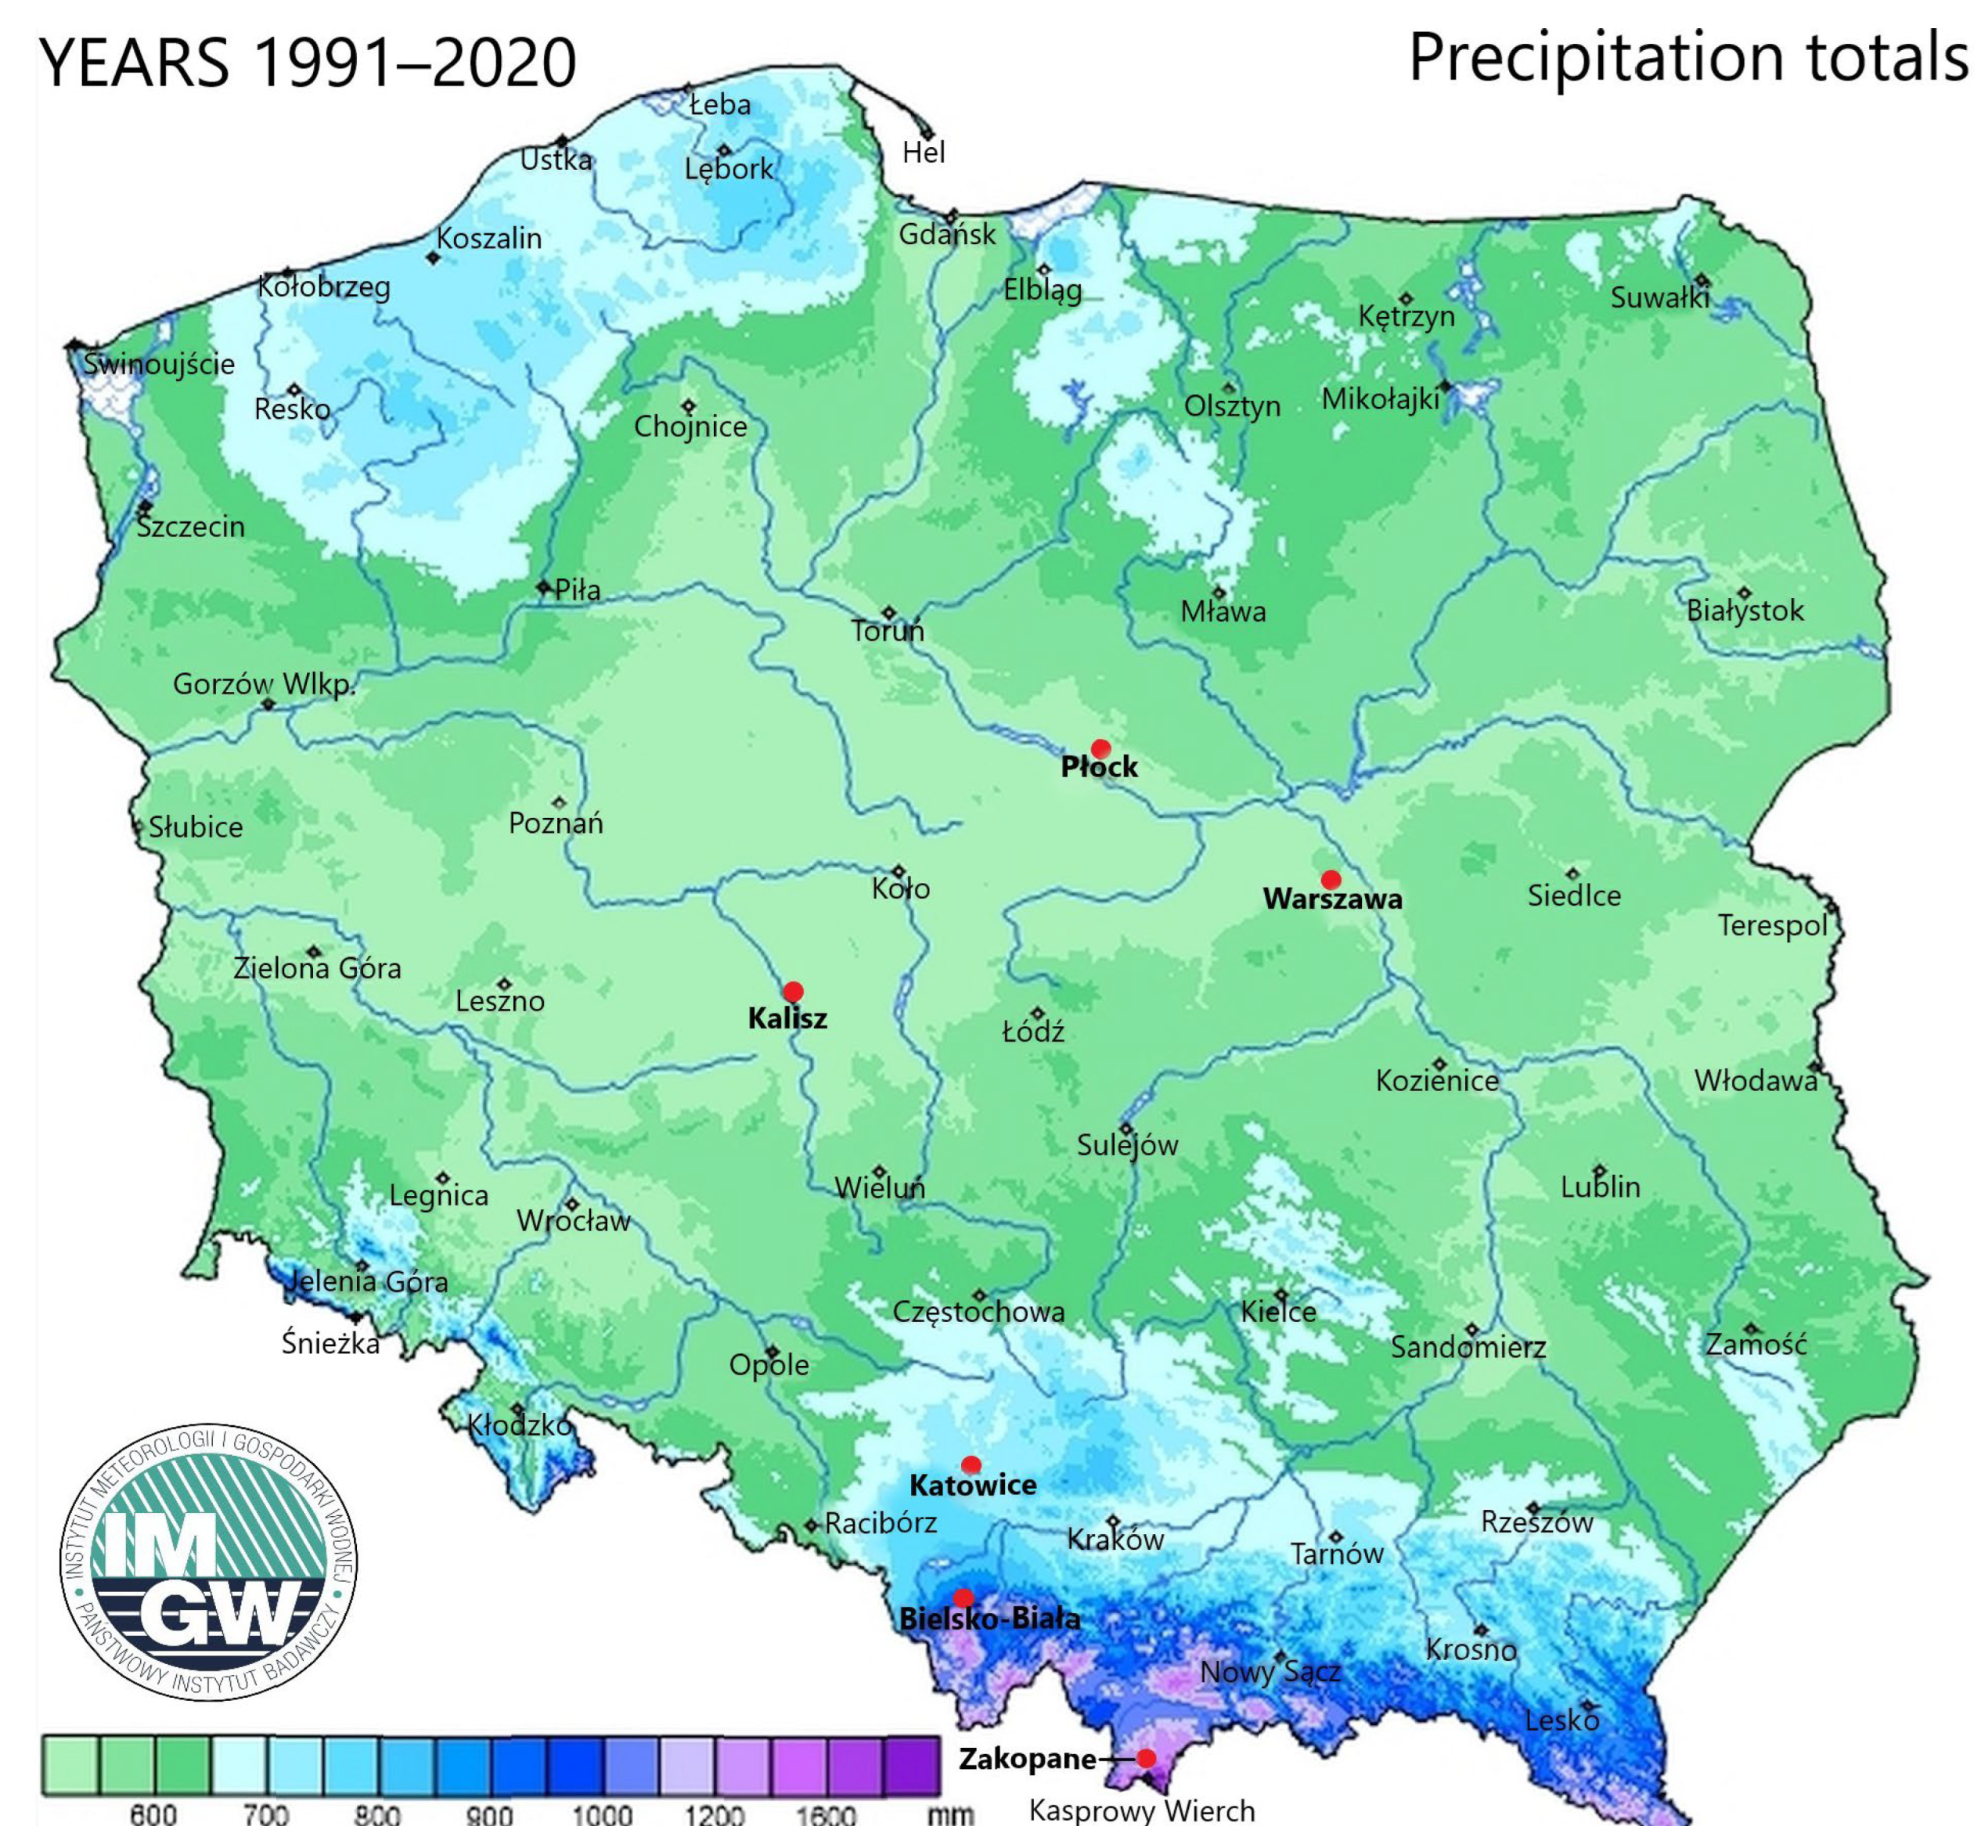
- Average annual precipitation hN over a 30-year period is expressed in dm3/m2 or mm, depending on the location of the building, read from a map available on the website [30]. For Poland, information can also be obtained from the IMGW website [31], where averaged precipitation totals for the 30-year normal period 1991–2020, based on data from 58 synoptic stations, are tabulated;
- -
- The size of the drainage area AA, which, in the case of a roof, is calculated as the area in the horizontal projection, regardless of the shape and slope of the roof. For other types of surfaces, only the area where it rains is taken for calculation;
- -
- The value of the runoff coefficient e is adopted according to the type of drainage surface and the material with which it is covered; and
- -
- Hydraulic efficiency of the filter η is usually assumed to be 0.9, or is based on the filter manufacturer’s guidelines, as appropriate.
- AA—drainage area, m2
- e—runoff coefficient, -
- hN—average annual precipitation, dm3/m2, mm
- η—hydraulic efficiency of the filter, -
- and annual rainwater demand BWA, according to relation (2):where:BWA = Pd × n · 365 + ABew × BSA
2.3. Characteristics of Precipitation in Poland
2.4. Water Tariffs in Poland
2.5. National and Local Financial Support Programs
3. Results and Discussion
3.1. Building and Installation Characteristic
- Case 1: domestic-garden:
- Case 2: garden:
3.2. Size of Rainwater Tank
- -
- -
- The size of the drainage area AA will be the sum of the roof area calculated in the horizontal projection: 253.98 m2 for a sloping roof and 39.52 m2 for a flat roof;
- -
- The value of the runoff coefficient e was assumed, that is, according to the type and material of the drainage area: sloped roof, glazed tile equal to e = 0.9, flat roof e = 0.8;
- -
- The hydraulic efficiency of the filter η was assumed to be 0.9.
3.3. Economic Analysis
- -
- pipes and fittings for the installation of cold water, rainwater, drainpipes that bring rainwater from the drainpipes to the tank;
- -
- installation of cold water, rainwater, and drainage pipes;
- -
- tank and its installation, including excavation;
- -
- rainwater control unit;
- -
- rainwater filter;
- -
- float valve installed in the tank.
- -
- pipes and fittings for the installation of cold water, rainwater, and drainpipes that bring rainwater from the drainpipes to the tank;
- -
- installation of cold water, rainwater, and drainage pipes;
- -
- tank and its installation, including excavation (the work of the excavator to lay sewer pipes and the work of excavation and installation of the tank are included);
- -
- a set including the replenishment of drinking water in the tank, a pump in the tank, a float valve installed in the tank, and protection against backflow;
- -
- rainwater filter.
- -
- in the case of traditional installation—Case 0:
- -
- in Case 1 (Variant W1 and W2), the annual demand for mains water will be reduced by the lesser of ER or BWa, depending on the location of the building:
- -
- A: when subsidizing the system from the nationwide program, local programs, and traditional electrical installation;
- -
- B: when subsidizing the system from the nationwide program, local programs, and electrical installation with PV panels.
4. Conclusions
- (1)
- The rainwater collection tank is a key investment cost; hence, the lower price of concrete tanks may encourage investors, although its key disadvantage is its short lifespan and the need for replacement after 15 years.
- (2)
- Local financial support programs are offered in various regions of Poland, which, in addition to the national subsidy, further support the investment budget and account for between 15 and 47% of investment costs in the cases analyzed.
- (3)
- The prices of water and electricity vary in different regions of Poland, with the price of water being particularly noticeable and significant, differing by up to 80%, in the cities under discussion.
- (4)
- In the case of the domestic-garden and garden installations analyzed, taking into account current tap water prices, rainfall volumes, and investment subsidies, the annual water cost savings ranged from 480 to 1080 PLN, which is not an impressive figure.
- (5)
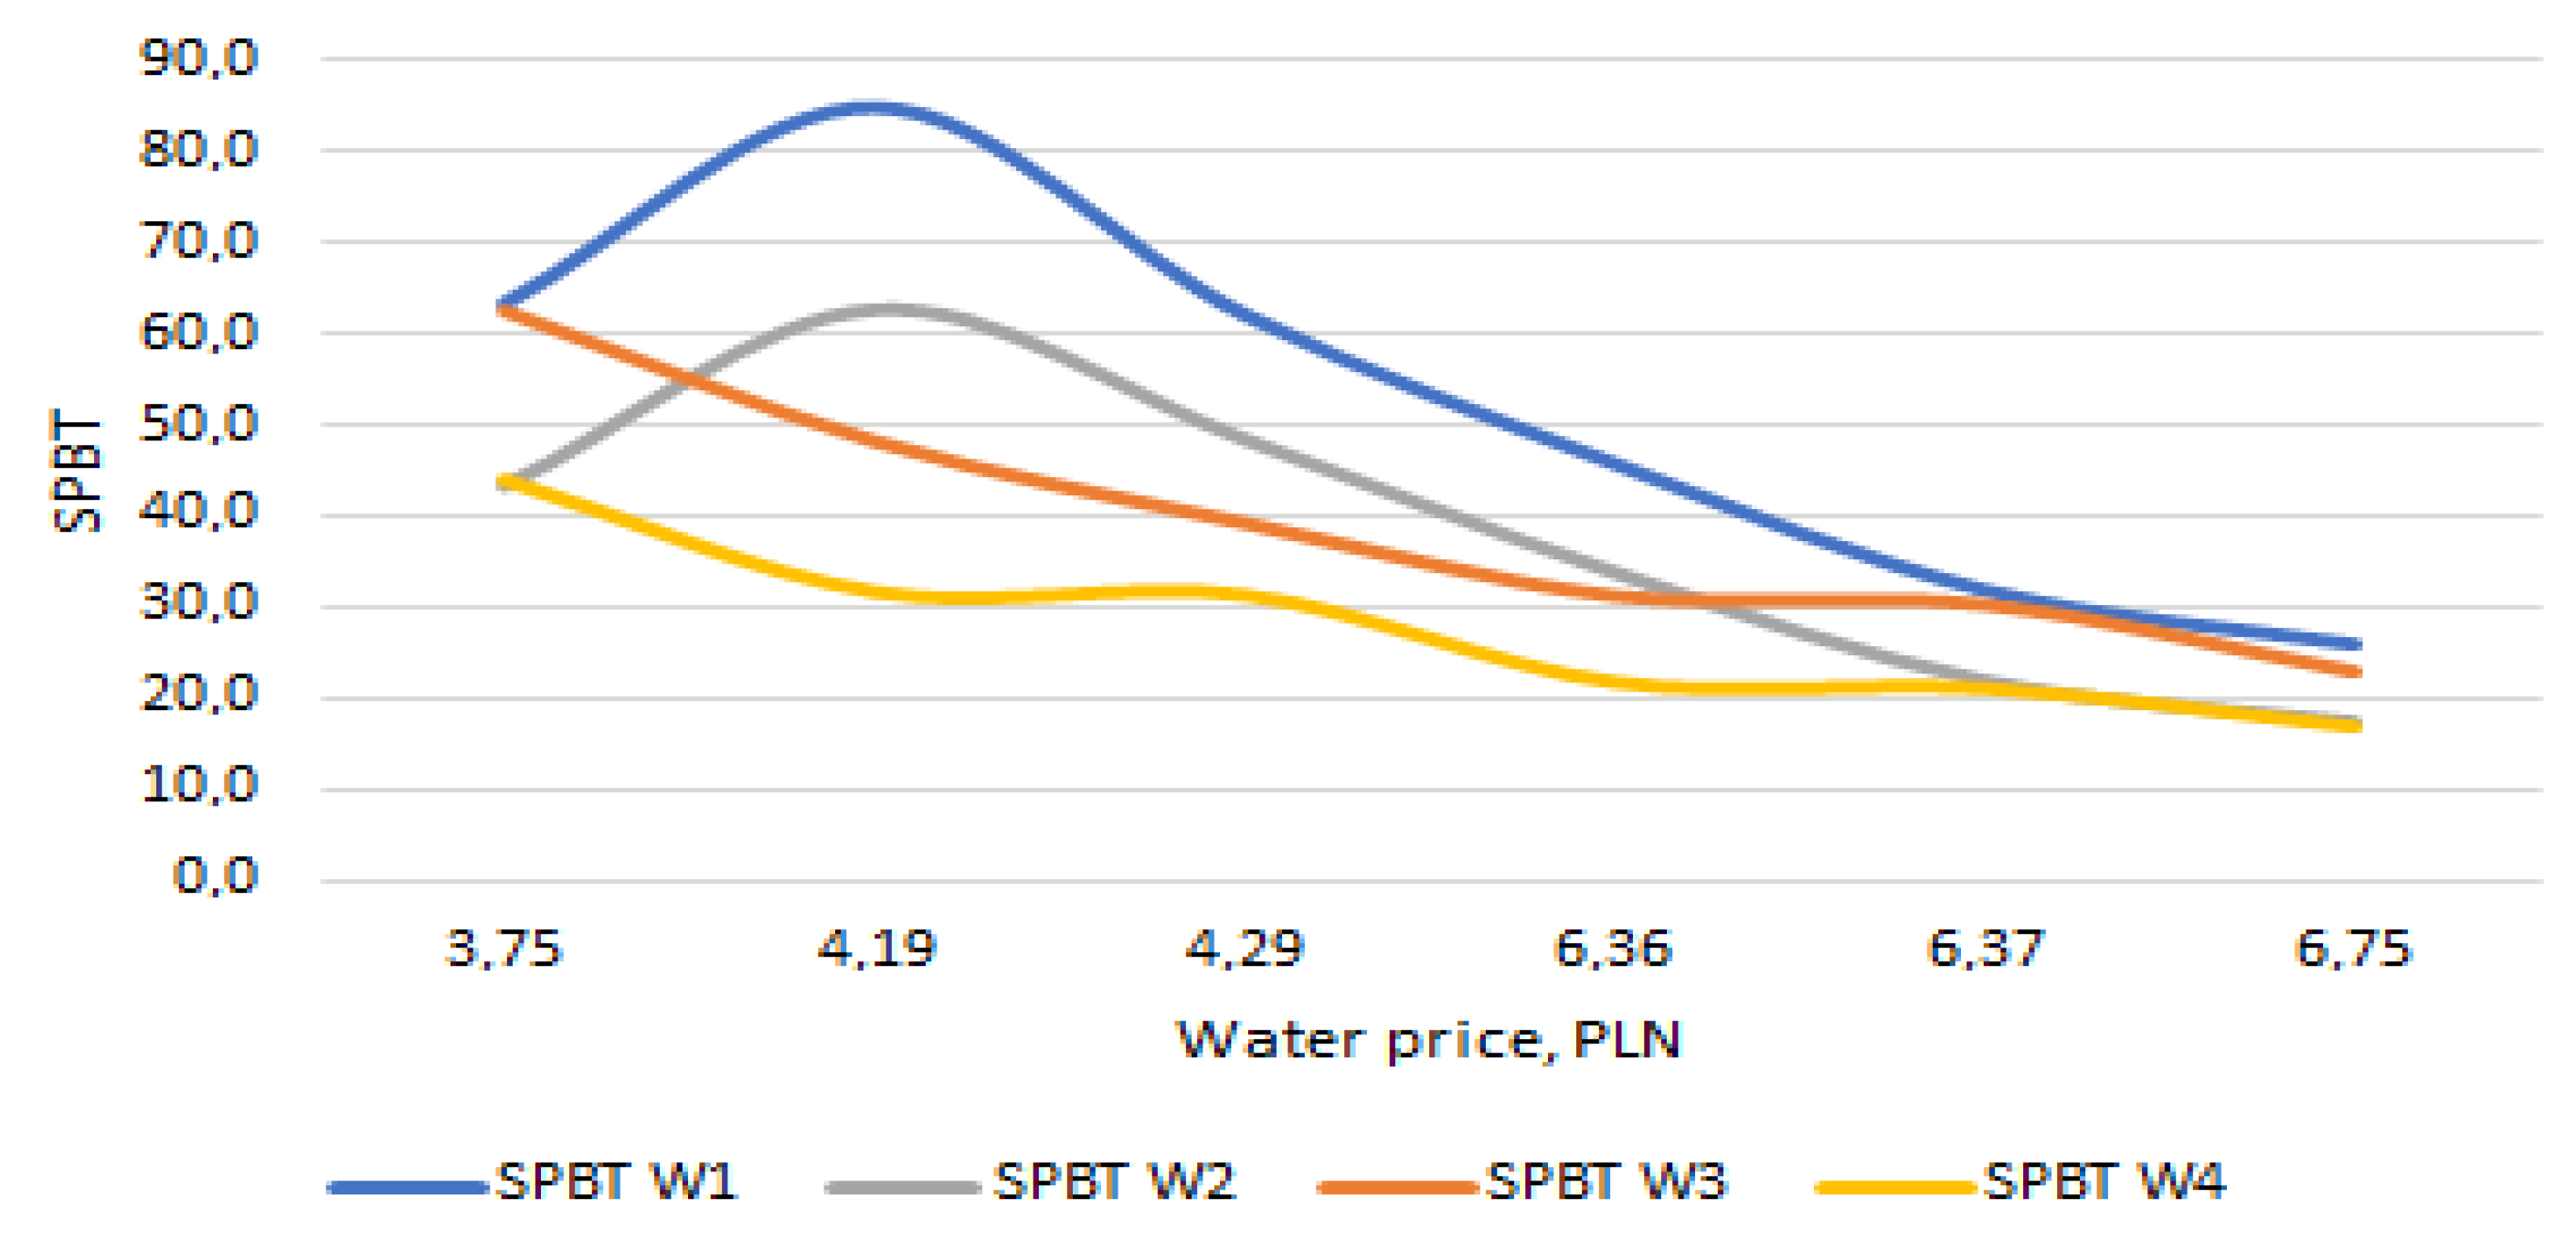
- Almost double the investment outlay of a traditional installation makes the return on investment, according to the SPBT indicator, look very unfavorable, i.e., from 17 to 84 years, depending on the variant. Similar negative conclusions were presented by the authors in a publication that appeared 15 years ago, and, in the case of a single-family house, the return on investment costs ranged from 46 to 74 years [19].
- (6)
- Despite the significant increase in water prices in recent years, as well as the spread of the rainwater management system, its popularization, and investment support programs, investors must still expect a long payback period for a single-family house.
- (7)
- Investment in a less-extensive garden system does not clearly mean a shorter payback period, due to a lower subsidy amount representing a certain percentage of the investment.
- (8)
- Even in simple economic analyses, the operating costs associated with the consumption of electricity for the operation of the rainwater panel cannot be ignored, as they can account for up to 50% of the costs saved from reduced water consumption on an annual basis.
- (9)
- Under Polish conditions, the most advantageous option, at present, is the use of a water management system in Bielsko-Biala and Katowice, where the price of water is the highest and the amount of rainfall is adequate to provide the amount of rainwater.
- (10)
- The bottom line is that, under Polish conditions, to achieve the greatest financial benefits from investing in a rainwater management system for a single-family house, it is crucial that the building’s rainwater demand is fully met by rainfall, the unit price of water is at least 8-times the unit price of electricity, with the aim of keeping operating costs as low as possible through the use of renewable energy sources, and subsidies are a significant percentage of the investment.
Author Contributions
Funding
Institutional Review Board Statement
Informed Consent Statement
Data Availability Statement
Acknowledgments
Conflicts of Interest
References
- Stec, A.; Kordana, S. Analysis of Profitability of Rainwater Harvesting, Gray Water Recycling and Drain Water Heat Recovery Systems. Resour. Conserv. Recycl. 2015, 105, 84–94. [Google Scholar] [CrossRef]
- Kordana-Obuch, S.; Starzec, M.; Słyś, D. Assessment of the Feasibility of Implementing Shower Heat Exchangers in Residential Buildings Based on Users’ Energy Saving Preferences. Energies 2021, 14, 5547. [Google Scholar] [CrossRef]
- Kordana, S.; Słyś, D. An Analysis of Important Issues Impacting the Development of Stormwater Management Systems in Poland. Sci. Total Environ. 2020, 727, 138711. [Google Scholar] [CrossRef]
- Kordana-Obuch, S.; Starzec, M.; Słyś, D. Evaluation of the Influence of Catchment Parameters on the Required Size of a Stormwater Infiltration Facility. Water 2023, 15, 191. [Google Scholar] [CrossRef]
- Raport 2020. Polska Na Drodze Zrównoważonego Rozwoju. Available online: https://raportsdg.stat.gov.pl/2020/index.html (accessed on 1 April 2023).
- Ustawa z Dnia 20 Lipca 2017 r.—Prawo Wodne. Available online: https://isap.sejm.gov.pl/isap.nsf/DocDetails.xsp?id=WDU20170001566 (accessed on 1 April 2023).
- Rozporządzenie Ministra Infrastruktury z Dnia 12 Kwietnia 2002 r. w Sprawie Warunków Technicznych, Jakim Powinny Odpowiadać Budynki i Ich Usytuowanie. Available online: https://isap.sejm.gov.pl/isap.nsf/DocDetails.xsp?id=wdu20020750690 (accessed on 1 April 2023).
- Rozporządzenie Ministra Zdrowia z Dnia 7 Grudnia 2017 r. w Sprawie Jakości Wody Przeznaczonej Do Spożycia Przez Ludzi. Available online: https://isap.sejm.gov.pl/isap.nsf/DocDetails.xsp?id=WDU20170002294 (accessed on 1 April 2023).
- Rozporządzenie Ministra Infrastruktury z dnia 14 stycznia 2002 r. w sprawie określenia przeciętnych norm zużycia wody 2002. Available online: https://isap.sejm.gov.pl/isap.nsf/DocDetails.xsp?id=wdu20020080070 (accessed on 1 April 2023).
- Mrowiec, M. Potentials of Rainwater Harvesting and Utilization in Polish Households. In Proceedings of the 11th International Conference on Urban Drainage, Edinburgh, Scotland, UK, 31 August–5 September 2008. [Google Scholar]
- Chudzicki, J.; Sosnowski, S. Instalacje Wodociągowe Projektowanie, Wykonanie, Eksploatacja; Wydawnictwo Seidel-Przywecki sp. z o.o.: Warszawa, Poland, 2011. [Google Scholar]
- Canales, F.A.; Gwoździej-Mazur, J.; Jadwiszczak, P.; Struk-Sokołowska, J.; Wartalska, K.; Wdowikowski, M.; Kaźmierczak, B. Long-Term Trends in 20-Day Cumulative Precipitation for Residential Rainwater Harvesting in Poland. Water 2020, 12, 1932. [Google Scholar] [CrossRef]
- Struk-Sokołowska, J.; Gwozdziej-Mazur, J.; Jadwiszczak, P.; Butarewicz, A.; Ofman, P.; Wdowikowski, M.; Kazmierczak, B. The Quality of Stored Rainwater for Washing Purposes. Water 2020, 12, 252. [Google Scholar] [CrossRef] [Green Version]
- Silva, C.M.; Sousa, V.; Carvalho, N.V. Evaluation of Rainwater Harvesting in Portugal: Application to Single-Family Residences. Resour. Conserv. Recycl. 2015, 94, 21–34. [Google Scholar] [CrossRef]
- Santos, C.; Imteaz, M.A.; Ghisi, E.; Matos, C. The Effect of Climate Change on Domestic Rainwater Harvesting. Sci. Total Environ. 2020, 729, 138967. [Google Scholar] [CrossRef] [PubMed]
- Pavolová, H.; Bakalár, T.; Kudelas, D.; Puškárová, P. Environmental and Economic Assessment of Rainwater Application in Households. J. Clean. Prod. 2019, 209, 1119–1125. [Google Scholar] [CrossRef]
- Ludwińska, A.; Dudkiewicz, E. Zagadnienia Projektowe Systemu Odzysku Wody Szarej w Instalacjach Sanitarnych Budynków. Przewod. Projekt. 2020, 3, 21–23. Available online: http://p.izbudujemy.pl/inzynierbudownictwa/pliki/uploadprzewodnik_projektanta_2020_3.pdf (accessed on 1 April 2023).
- Starzec, M.; Kordana-Obuch, S.; Słyś, D. Assessment of the Feasibility of Implementing a Flash Flood Early Warning System in a Small Catchment Area. Sustainability 2023, 15, 8316. [Google Scholar] [CrossRef]
- Słyś, D. Efekt Ekonomiczny Zastosowania Instalacji Do Wykorzystania Wód Opadowych w Budownictwie Jednorodzinnym. Instal 2006, 6, 66–69. [Google Scholar]
- Słyś, D. Wykorzystanie Wód Opadowych w Instalacji Sanitarnej Budynków Mieszkalnych. Przegląd Nauk. Inżynieria I Kształtowanie Sr. 2006, 15, 192–201. [Google Scholar]
- Ludwińska, A.; Paduchowska, J. Wykorzystanie Wody Deszczowej w Instalacjach Sanitarnych Budynków. Rynek Instal. 2017, 5, 42–46. [Google Scholar]
- Merc, K.; Stępniak, L. Instalacje Dualne Jako Alternatywa Dla Tradycyjnych Instalacji Wodociągowo-Kanalizacyjnych. Inżynieria Ochr. Sr. 2015, 18, 549–562. [Google Scholar]
- Ludwińska, A.; Paduchowska, J. Wykorzystanie Wód Deszczowych w Budownictwie Jednorodzinnym Dla Wrocławia i Okolic—Analiza Opłacalności. In W: Wybrane Problemy Podwyższania Efektywności Systemów Inżynieryjnych/Pod Red. Nauk. Sergeya Anisimova; Oficyna Wydawnicza Politechniki Wrocławskiej: Wrocław, Poland, 2010. [Google Scholar]
- PN-EN 1717:2003; Ochrona Przed Wtórnym Zanieczyszczeniem Wody w Instalacjach Wodociągowych i Ogólne Wymagania Dotyczące Urządzeń Zapobiegających Zanieczyszczeniu Przed Przepływem Zwrotnym. Polski Komitet Normalizacyjny: Warszaw, Polska, 2003.
- PN-92/B-01706; Instalacje Wodociągowe. Wymagania w Projektowaniu. Polski Komitet Normalizacyjny: Warszawa, Polska, 1992.
- DIN 1989-1:2002-04; Regenwassernutzungsanlagen—Teil 1: Planung, Ausfuhrung, Betrieb Und Wartun. German Institute for Standardisation: Berlin, Germany, 1989.
- BS 8515:2009; Rainwater Harvesting Systems—Code of Practice. British Standards Institution: London, UK, 2009.
- Słyś, D.; Hala, B. Efektywność Ekonomiczna Instalacji Do Wykorzystania Wód Deszczowych w Budownictwie Jednorodzinnym. Gaz, Woda i Tech. Sanit. 2008, 3, 19–23. [Google Scholar]
- Poradnik Wykorzystania Wody Deszczowej—Broszura Produktowa Wilo. Available online: https://cms.media.wilo.com/cdndoc/wilo418778/4542410/wilo418778.pdf (accessed on 1 April 2023).
- Mapy Klimatu Polski. Available online: https://klimat.imgw.pl/pl/climate-maps/#Precipitation/Yearly/1991-2020/1/Winter (accessed on 1 April 2023).
- Normy Klimatyczne 1991–2020. Available online: https://klimat.imgw.pl/pl/climate-normals/OPAD_SUMA (accessed on 1 April 2023).
- IMGW—Klimat Polski 2022. Available online: https://www.imgw.pl/sites/default/files/2022-04/imgw-pib_raport-klimat-polski_2021_0.pdf (accessed on 1 April 2023).
- Wojciechowska, E.; Gajewska, M.; Żurkowska, N.; Surówka, M.; Obarska-Pempkowiak, H. Zrównoważone Systemy Gospodarowania Wodą Deszczową; Wydawnictwo Politechniki Gdańskiej: Gdańsk, Poland, 2015; ISBN 9788373486317. [Google Scholar]
- Zbiorniki Na Deszczówkę. Available online: http://www.euro-plast.biz.pl/material,zbiorniki-na-deszczowke,87.html (accessed on 6 June 2023).
- Betonowe Zbiorniki Dla Rolnictwa. Available online: https://szambabetonowe.expert/kategoria/zbiorniki-dla-rolnictwa/ (accessed on 1 May 2023).
- Yan, R.; Zhang, Y. The Introduction of NPV and IRR. In Proceedings of the Proceedings of the 2022 7th International Conference on Financial Innovation and Economic Development (ICFIED 2022), Online, 14–16 January 2022; Volume 648, pp. 1472–1476. [Google Scholar]
- Stec, A.; Mazur, A. An Analysis of Eco-Technology Allowing Water and Energy Saving in an Environmentally Friendly House-A Case Study from Poland. Buildings 2019, 9, 180. [Google Scholar] [CrossRef] [Green Version]
- Lani, N.H.; Syafiuddin, A.; Yusop, Z.; Adam, U.B.; Amin, M.Z.B.M. Performance of Small and Large Scales Rainwater Harvesting Systems in Commercial Buildings under Different Reliability and Future Water Tariff Scenarios. Sci. Total Environ. 2018, 636, 1171–1179. [Google Scholar] [CrossRef]
- Suchorab, P.; Iwanek, M.; Kęska, P. Analiza Ekonomiczna Wybranych Instalacji Dualnych. Gaz, Woda i Tech. Sanit. 2018, 4, 15199. [Google Scholar] [CrossRef]
- Pochwat, K.; Kordana-Obuch, S.; Starzec, M.; Piotrowska, B. Financial Analysis of the Use of Two Horizontal DrainWater Heat Recovery Units. Energies 2020, 13, 4113. [Google Scholar] [CrossRef]
- Joachimiak-Lechman, K. Środowiskowa Ocena Cyklu Życia (LCA) i Rachunek Kosztów Cyklu Życia (LCC). Aspekty Porównawcze. Ekon. i Sr. 2014, 1, 80–96. [Google Scholar]
- IEC 60300-3-3:2017; Dependability Management—Part 3-3: Application Guide—Life Cycle Costing. International Electrotechnical Commission: Geneva, Switzerland, 2017.
- Słyś, D.; Stec, A. Centralized or Decentralized Rainwater Harvesting Systems: A Case Study. Resources 2020, 9, 5. [Google Scholar] [CrossRef] [Green Version]
- Stec, A.; Zeleňáková, M. An Analysis of the Effectiveness of Two Rainwater Harvesting Systems Located in Central Eastern Europe. Water 2019, 11, 458. [Google Scholar] [CrossRef] [Green Version]
- Guidelines for Life Cycle Cost Analysis; Stanford University Land and Buildings: 2005. Available online: https://lbre.stanford.edu/sites/lbre-production/files/publications/lcca121405.pdf (accessed on 1 April 2023).
- Stec, A.; Kordana, S. Life Cycle Costs Analysis of the Systems Allowing Water and Energy Consumption Reduction in a Single-Family Dwelling House. J. Civ. Eng. Environ. Archit. 2014, 61, 313–334. [Google Scholar] [CrossRef]


| Structure of Water Consumption | Literature References | |||||
|---|---|---|---|---|---|---|
| Poland [10] | Poland [11] | Poland [12,13] | Portugal [14] | Portugal [15] | Slovakia [16] | |
| Consumption and dishwashing | 7.4 | 3 + 10 = 13 | 4 + 6 = 10 | 8 + 1 = 9 | 5 + 2 = 7 | 6 + 5 = 11 |
| Hand washing and bathing | 36.5 | 10 + 26 = 36 | 35 | 14 + 39 = 53 | 10 + 32 = 42 | 36 |
| Toilet flushing | 29.8 | 30 | 32 | 29 | 28 | 29 |
| Laundry washing | 15.5 | 15 | 15 | 8 | 8 | 15 |
| Gardening, car washing | 10.8 | 6 | 8 | 1 | 15 | 9 |
| Total consumption | 100% | 100% | 100% | 100% | 100% | 100% |
| Daily water demand per capita, dm3 | avg. 119 | 100–150 avg. 125 | no data | avg. 154 | avg. 165 | avg. 120 |
| Structure of Water Consumption | Public Building (Generally) | Office Building | Rooms in Hotels |
|---|---|---|---|
| Gastronomic | 9 | - | - |
| Hand washing | 27 | 10 | 44.7 |
| Body washing | - | - | 32.6 |
| Toilet flushing | 43 | 49.9 | 22.4 |
| Urinal flushing | 20 | - | - |
| Cleaning and other needs | 1 | 40.1 | - |
| Water leaks | - | - | 0.3 |
| Total consumption | 100% | 100% | 100% |
| Draw-Off Point | Quantity | Normative Outflow Water dm3/s | |
|---|---|---|---|
| qn Cold Water | qn Rainwater | ||
| Toilet | 6 | 0 | 0.13 |
| Washing machine | 2 | 0 | 0.25 |
| Tap valve | 1 | 0 | 0.5 |
| Washbasin | 8 | 0.07 | 0 |
| Bathtub | 2 | 0.15 | 0 |
| Shower | 6 | 0.15 | 0 |
| Sink | 1 | 0.07 | 0 |
| Dishwasher | 1 | 0.15 | 0 |
| Total of outflow water | 1.98 | 1.78 | |
| Location/City | Kalisz | Plock | Warszawa | Katowice | Bielsko-Biala | Zakopane |
|---|---|---|---|---|---|---|
| Annual total precipitation hN; mm | 493.8 | 511.5 | 549.7 | 723.2 | 998.3 | 1145.0 |
| The annual rainwater yield ER dm3/year | 116,340 | 119,782 | 129,510 | 169,357 | 233,780 | 269,763 |
| Location/City | Kalisz | Plock | Warszawa | Katowice | Bielsko-Biala | Zakopane |
|---|---|---|---|---|---|---|
| Min. BWA or ER dm3/year | 116,340 | 119,782 | 129,510 | 169,357 | 174,460 | 174,460 |
| Vn dm3 | 6980 | 7187 | 7771 | 10,161 | 10,468 | 10,468 |
| Tank size W1, dm3 | 7000 | 8000 | 8000 | 11,000 | 11,000 | 11,000 |
| Price W1, PLN | 8399 | 9035 | 9035 | 12,147 | 12,147 | 12,147 |
| Tank size W2, dm3 | 8000 | 8000 | 8000 | 12,000 | 12,000 | 12,000 |
| Price W2, PLN | 2600 | 2600 | 2600 | 3700 | 3700 | 3700 |
| Location/City | Kalisz | Plock | Warszawa | Katowice | Bielsko-Biala | Zakopane |
|---|---|---|---|---|---|---|
| Min. BWA or ER dm3/year | 100,000 | 100,000 | 100,000 | 100,000 | 100,000 | 100,000 |
| Vn, dm3 | 6000 | 6000 | 6000 | 6000 | 6000 | 6000 |
| Tank size W3, dm3 | 6000 | 6000 | 6000 | 6000 | 6000 | 6000 |
| Price W3, PLN | 6678 | 6678 | 6678 | 6678 | 6678 | 6678 |
| Tank size W4, dm3 | 6000 | 6000 | 6000 | 6000 | 6000 | 6000 |
| Price W4, PLN | 2100 | 2100 | 2100 | 2100 | 2100 | 2100 |
| Location | Kalisz | Plock | Warszawa | Katowice | Bielsko-Biala | Zakopane |
|---|---|---|---|---|---|---|
| Investment cost INVW1 | 43,516 | 44,286 | 44,286 | 47,802 | 47,802 | 47,802 |
| Cost difference IO’ (W1-W0) | 28,615 | 29,385 | 29,385 | 32,901 | 32,901 | 32,901 |
| Subsidy | 7000 | 5000 | 9000 | 5000 | 8000 | 5000 |
| IOW1 PLN | 21,615 | 24,385 | 20,385 | 27,901 | 24,901 | 27,901 |
| Investment cost INVW2 | 37,923 | 27,923 | 37,923 | 39,023 | 39,023 | 39,023 |
| Cost difference IO’ (W2-W0) | 23,022 | 23,022 | 23,022 | 24,122 | 24,122 | 24,122 |
| Subsidy | 7000 | 5000 | 7080 | 5000 | 7531 | 5000 |
| IOW2 PLN | 16,022 | 18,022 | 15,942 | 19,122 | 16,591 | 19,122 |
| Location | Kalisz | Plock | Warszawa | Katowice | Bielsko-Biala | Zakopane |
|---|---|---|---|---|---|---|
| Investment cost INVW3 | 35,455 | 35,455 | 35,455 | 35,455 | 35,455 | 35,455 |
| Cost difference IO’ (W3-W0) | 20,554 | 20,554 | 20,554 | 20,554 | 20,554 | 20,554 |
| Subsidy | 7000 | 5000 | 9000 | 5000 | 8000 | 5000 |
| IOW3 PLN | 13,554 | 15,554 | 11,554 | 15,554 | 12,554 | 15,554 |
| Investment cost INVw4 | 30,859 | 30,859 | 30,859 | 30,859 | 30,859 | 30,859 |
| Cost difference IO’ (W4-W0) | 15,997 | 15,997 | 15,997 | 15,997 | 15,997 | 15,997 |
| Subsidy | 7000 | 5000 | 6680 | 5000 | 6551 | 5000 |
| IOW4 PLN | 8957 | 10,957 | 9277 | 10957 | 9405 | 10,957 |
| City | Water Price, PLN/m3 | Electric Energy PLN/kWh |
|---|---|---|
| Kalisz | 4.19 | 0.83 |
| Plock | 6.36 | 0.83 |
| Warszawa | 4.29 | 0.81 |
| Katowice | 6.37 | 0.74 |
| Bielsko-Biala | 6.75 | 0.76 |
| Zakopane | 3.75 | 0.76 |
| Location | Kalisz | Plock | Warszawa | Katowice | Bielsko-Biala | Zakopane |
|---|---|---|---|---|---|---|
| Variant W1/W2 | ||||||
| ZR, m3/year | 284.0 | 279.8 | 270.8 | 230.0 | 225.9 | 225.9 |
| Location | Kalisz | Plock | Warszawa | Katowice | Bielsko-Biala | Zakopane |
|---|---|---|---|---|---|---|
| Variant W1/W2 | ||||||
| SW PLN/year | 487 | 766 | 556 | 1085 | 1178 | 654 |
| OC PLN/year | 233 | 233 | 227 | 207 | 213 | 213 |
| AS, PLN | 255 | 534 | 329 | 878 | 965 | 441 |
| SPBTW1 | 84.8 | 45.7 | 62.0 | 31.8 | 25.8 | 63.2 |
| SPBTW2 | 62.8 | 33.8 | 48.5 | 21.8 | 17.2 | 43.3 |
| Variant W3/W4 | ||||||
| SW PLN/year | 419 | 636 | 429 | 637 | 675 | 375 |
| OC PLN/year | 137 | 137 | 134 | 122 | 125 | 125 |
| AS, PLN | 282 | 499 | 295 | 515 | 550 | 250 |
| SPBTW3 | 48.1 | 31.2 | 39.1 | 30.2 | 22.8 | 62.3 |
| SPBTW4 | 31.8 | 22.0 | 31.4 | 21.3 | 17.2 | 43.9 |
| Location | Kalisz | Plock | Warszawa | Katowice | Bielsko-Biala | Zakopane |
|---|---|---|---|---|---|---|
| Variant W1 | ||||||
| New water price PLN/m3 | 20.60 | 22.20 | 17.50 | 17.60 | 15.50 | 17.20 |
| Growth | 391% | 248% | 308% | 176% | 130% | 359% |
| New subsidy, PLN | 26,065 | 24,046 | 26,098 | 24,120 | 23,254 | 28,487 |
| Growth | 272% | 381% | 190% | 382% | 190% | 470% |
| Variant W4 | ||||||
| New water price PLN/m3 | 10.3 | 12.3 | 10.6 | 12.30 | 10.80 | 12.3 |
| Growth | 146% | 94% | 148% | 94% | 60% | 94% |
| New subsidy, PLN | 13,137 | 10,967 | 13,004 | 10,808 | 10,461 | 10,967 |
| Growth | 88% | 119% | 64% | 116% | 60% | 119% |
| Location | Kalisz | Plock | Warszawa | Katowice | Bielsko-Biala | Zakopane |
|---|---|---|---|---|---|---|
| Variant W1/W2 | ||||||
| SW PLN/year | 487 | 766 | 556 | 1085 | 1178 | 654 |
| OC PLN/year | 47 | 47 | 45 | 41 | 43 | 43 |
| AS, PLN | 441 | 720 | 510 | 1044 | 1135 | 612 |
| SPBTW1 | 53.6 | 33.9 | 39.0 | 26.7 | 21.9 | 39.9 |
| SPBTW2 | 40.9 | 25.0 | 31.3 | 18.3 | 14.6 | 31.3 |
| Variant W3/W4 | ||||||
| SW PLN/year | 419 | 636 | 429 | 637 | 675 | 375 |
| OC PLN/year | 27 | 27 | 27 | 24 | 25 | 25 |
| AS, PLN | 392 | 609 | 402 | 613 | 650 | 350 |
| SPBTW3 | 34.6 | 25.6 | 28.7 | 25.4 | 19.3 | 44.4 |
| SPBTW4 | 22.9 | 18.0 | 23.1 | 17.9 | 14.5 | 31.3 |
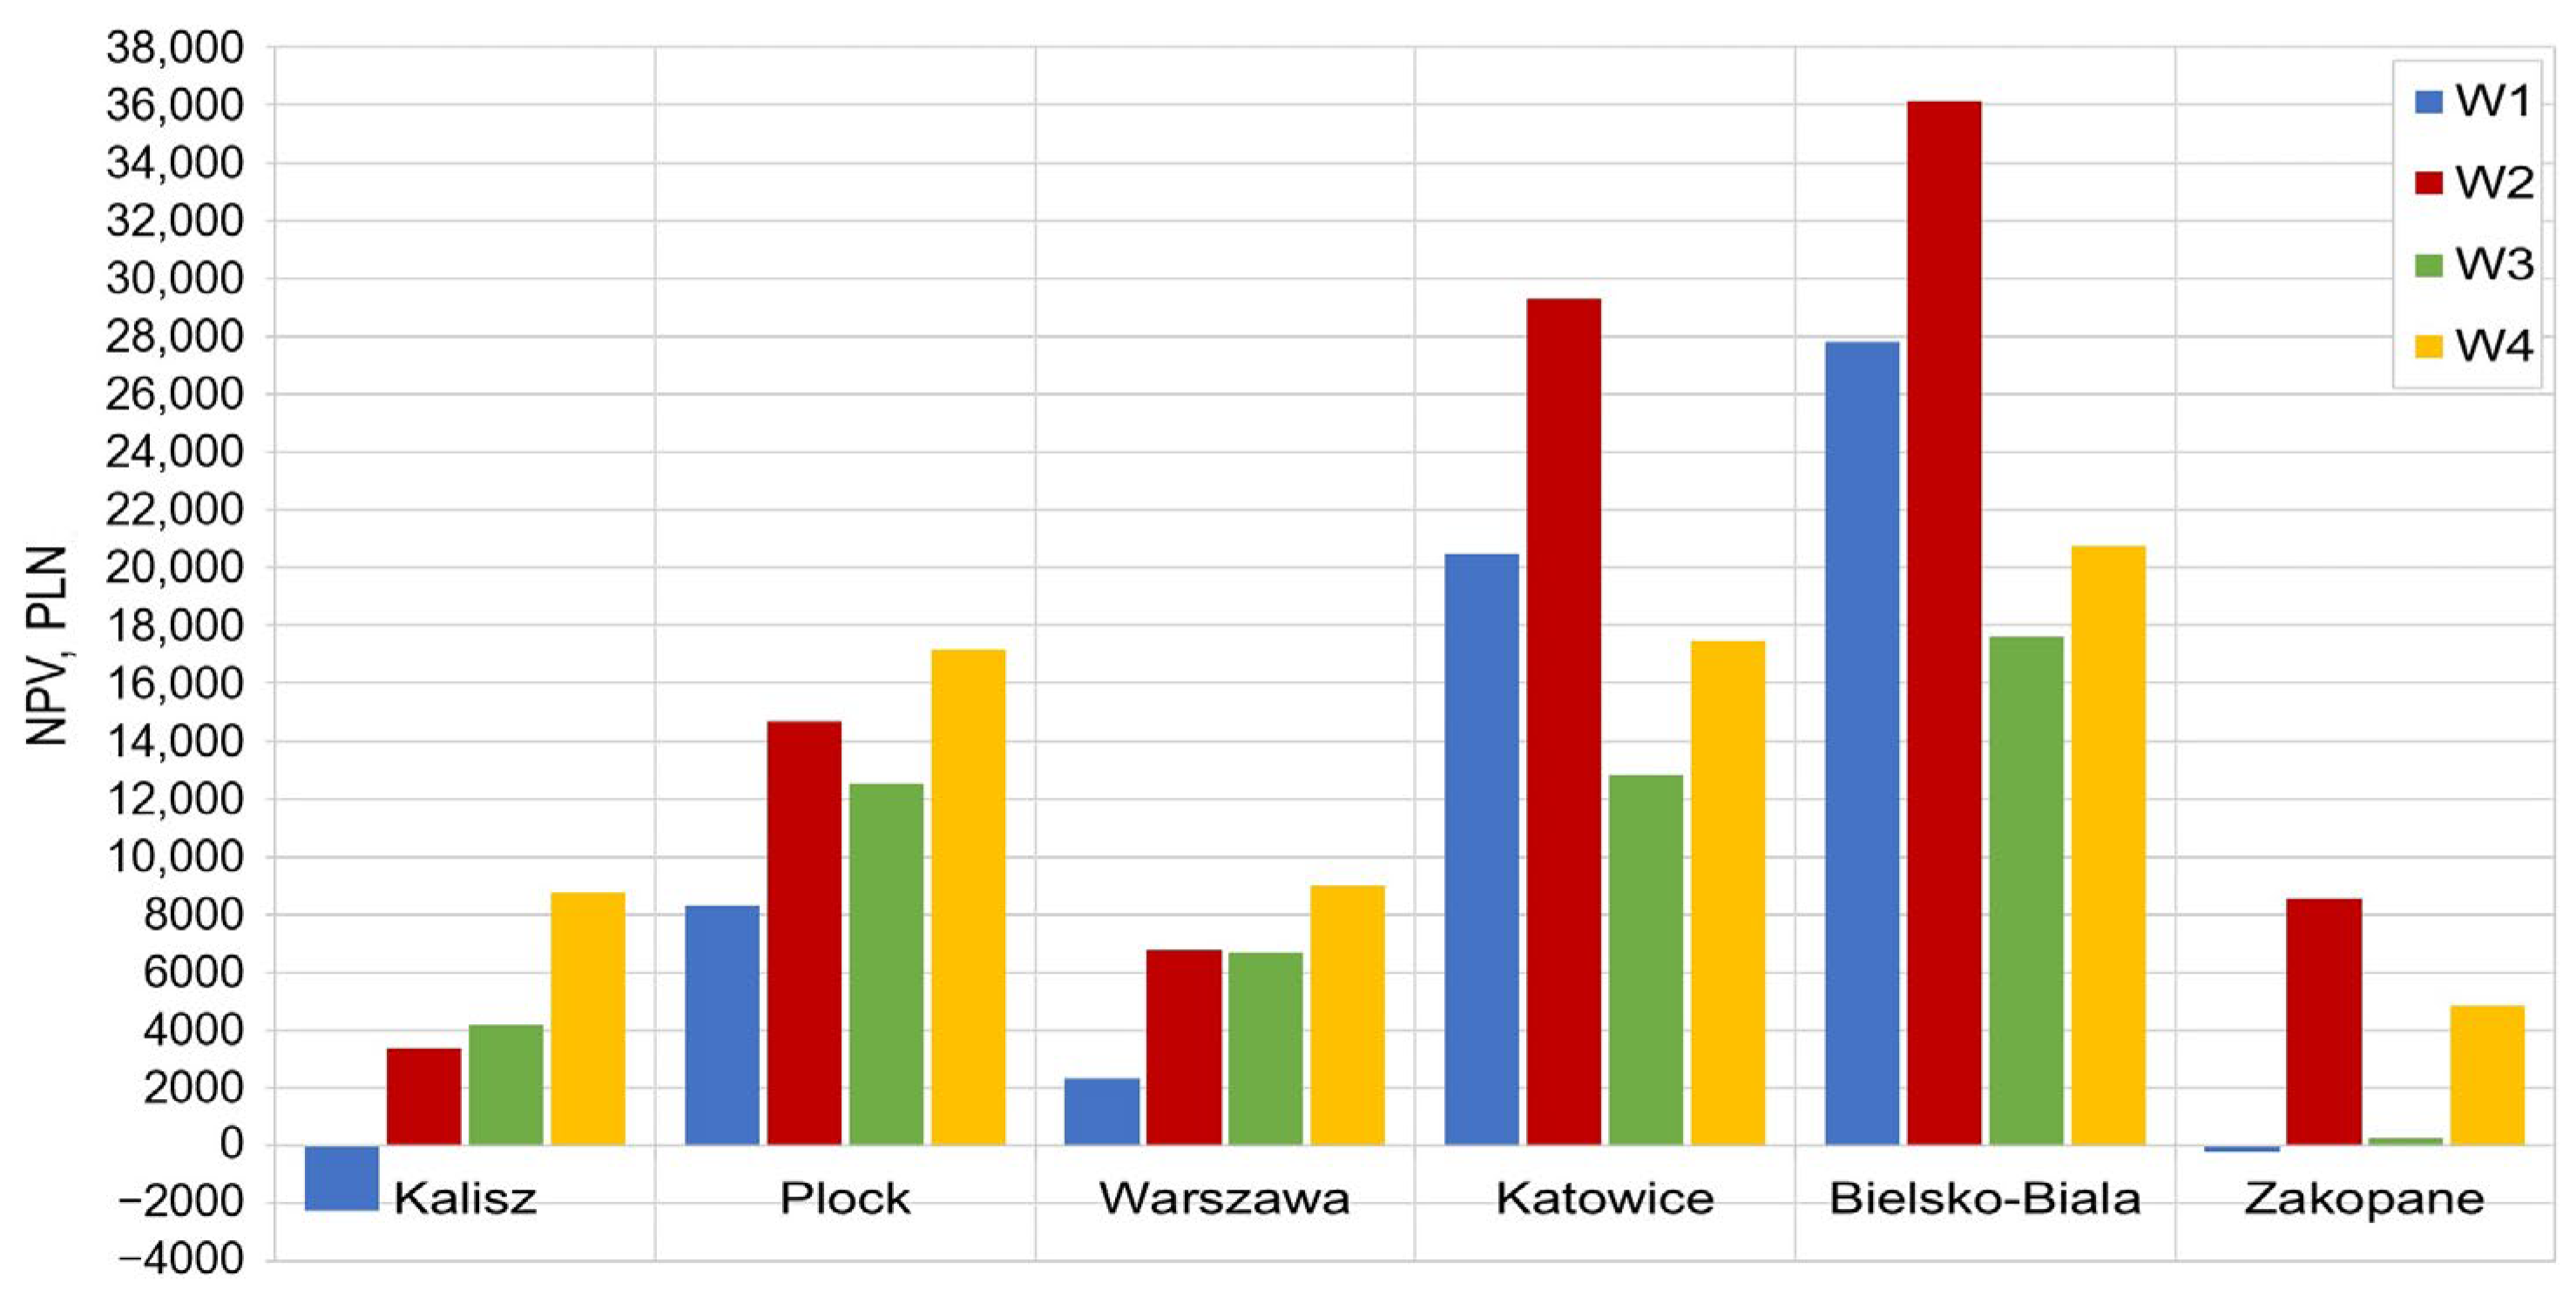
| Option | Kalisz | Plock | Warszawa | Katowice | Bielsko-Biala | Zakopane |
|---|---|---|---|---|---|---|
| Variant W1 | ||||||
| A B | −17,999 −2236 | −7424 8338 | −13,035 2347 | 6453 20,507 | 13,391 27,824 | −14,646 −212 |
| Variant W2 | ||||||
| A B | −12,406 3356 | −1060 14,702 | −8592 6790 | 15,232 29,286 | 21,701 36,134 | −5867 8566 |
| Variant W3 | ||||||
| A B | −5115 4169 | 3265 12,550 | −2357 6703 | 4571 12,849 | 9110 17,611 | −8241 260 |
| Variant W4 | ||||||
| A B | −518 8765 | 7862 17,146 | −80 8980 | 9168 17,446 | 12,258 20,759 | −3644 4856 |
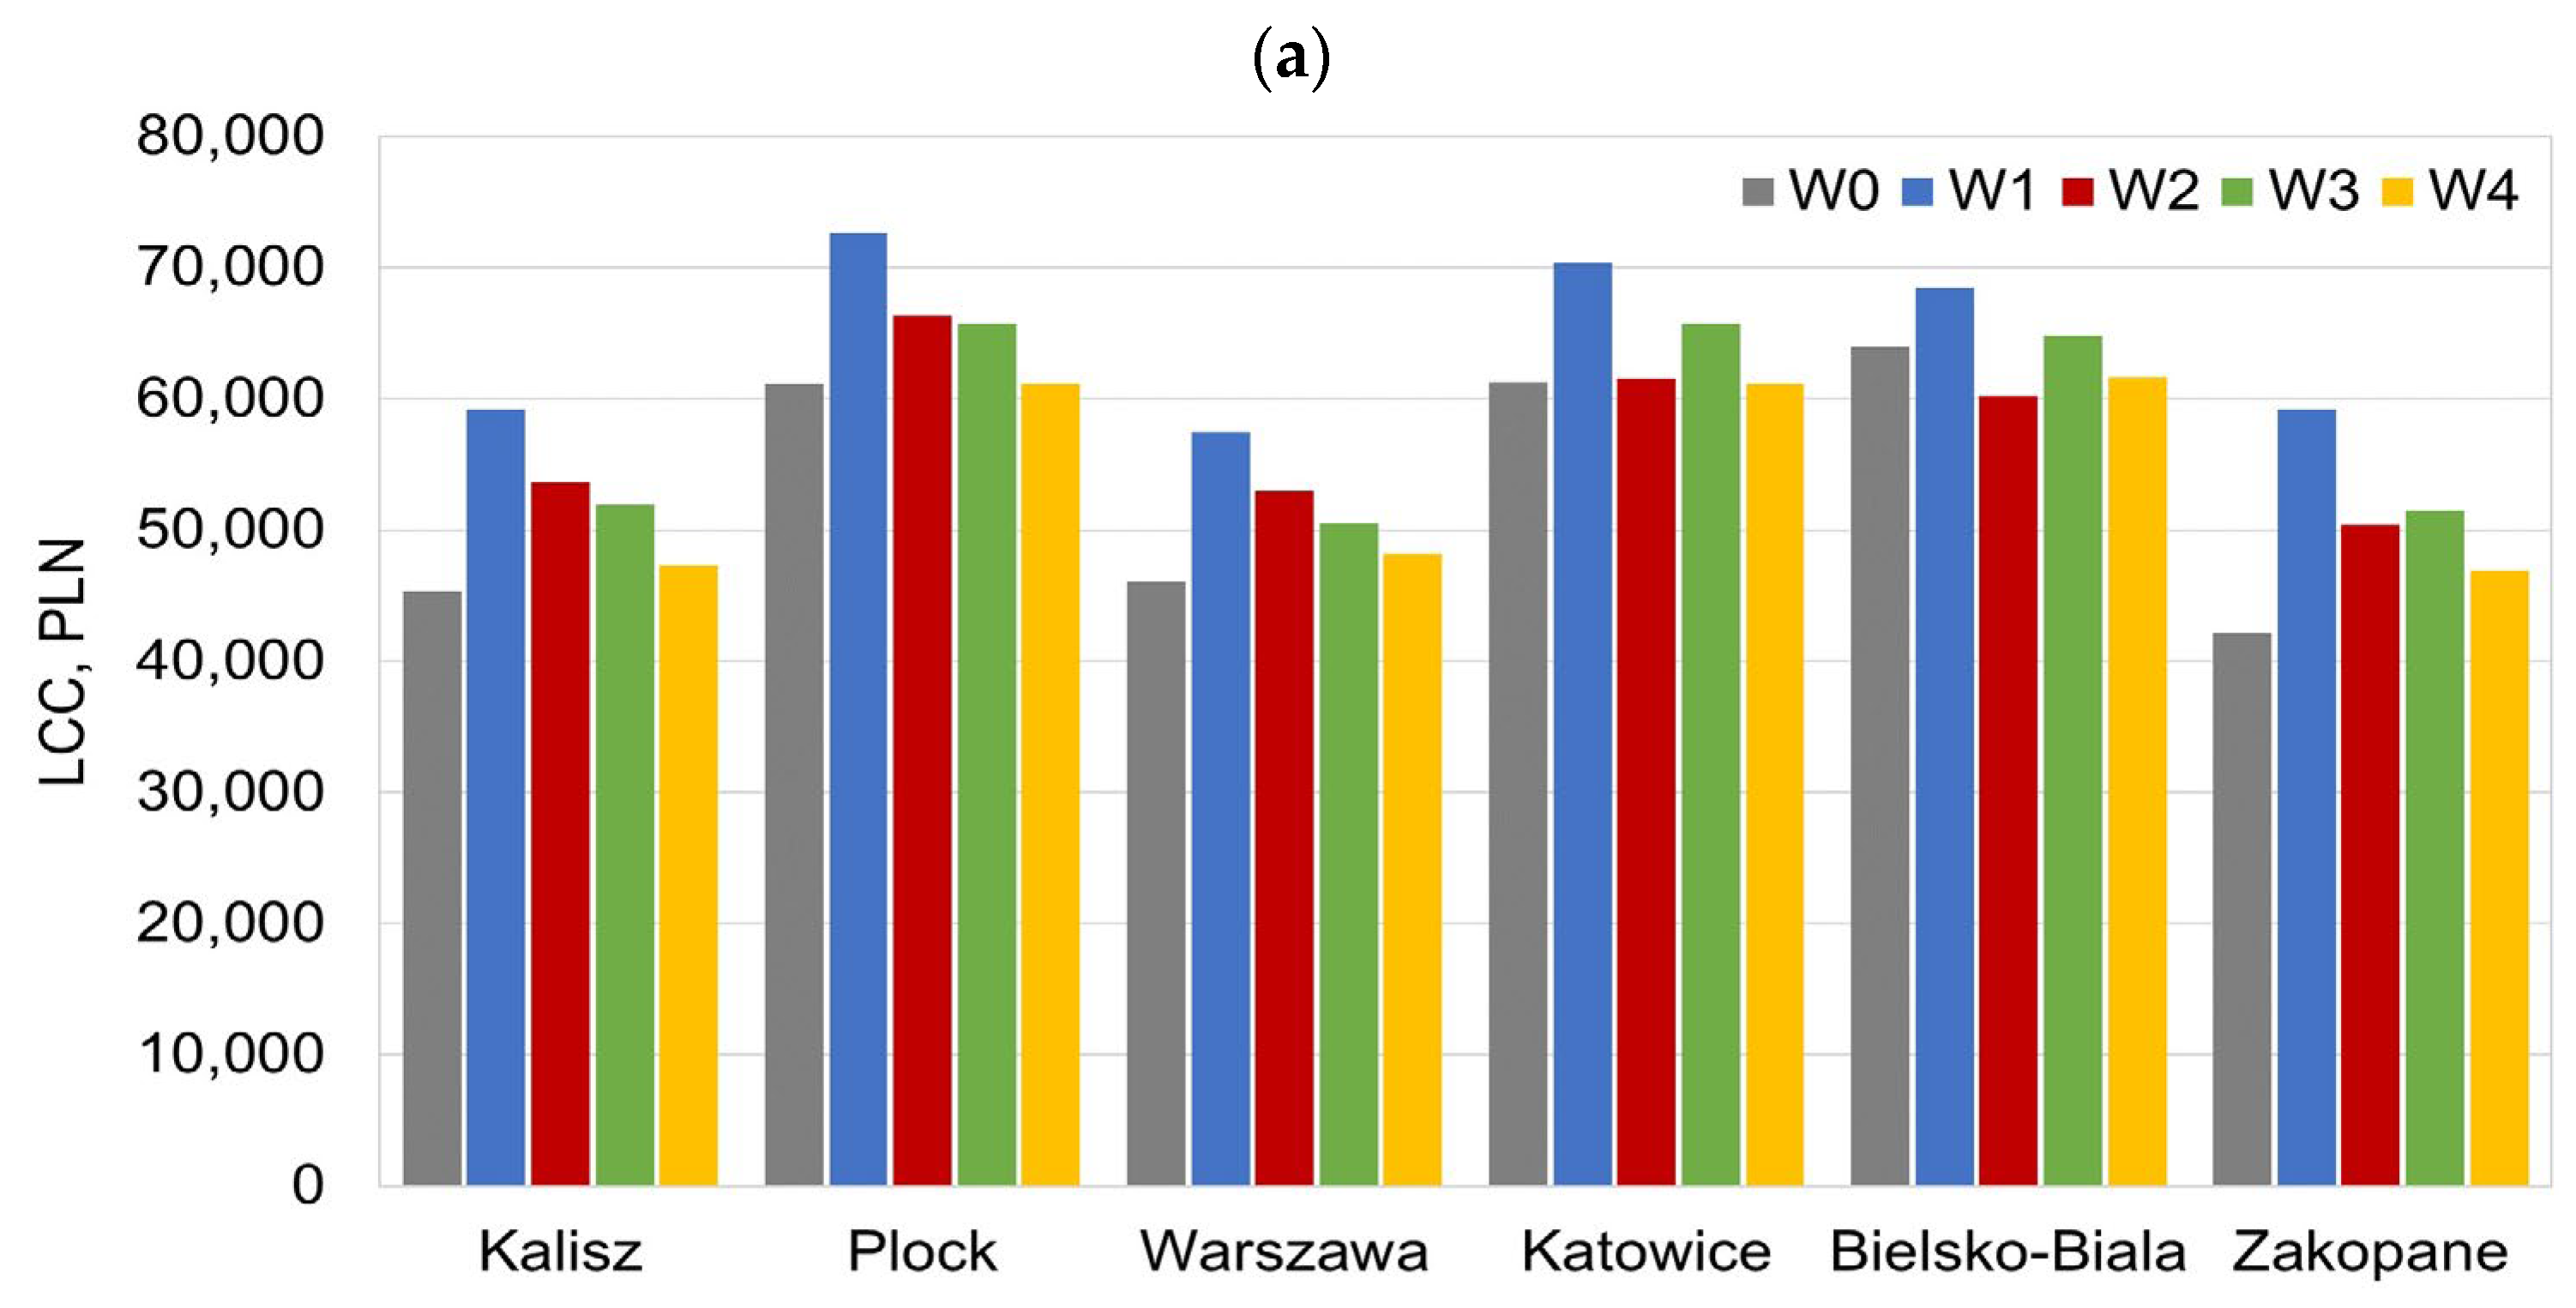
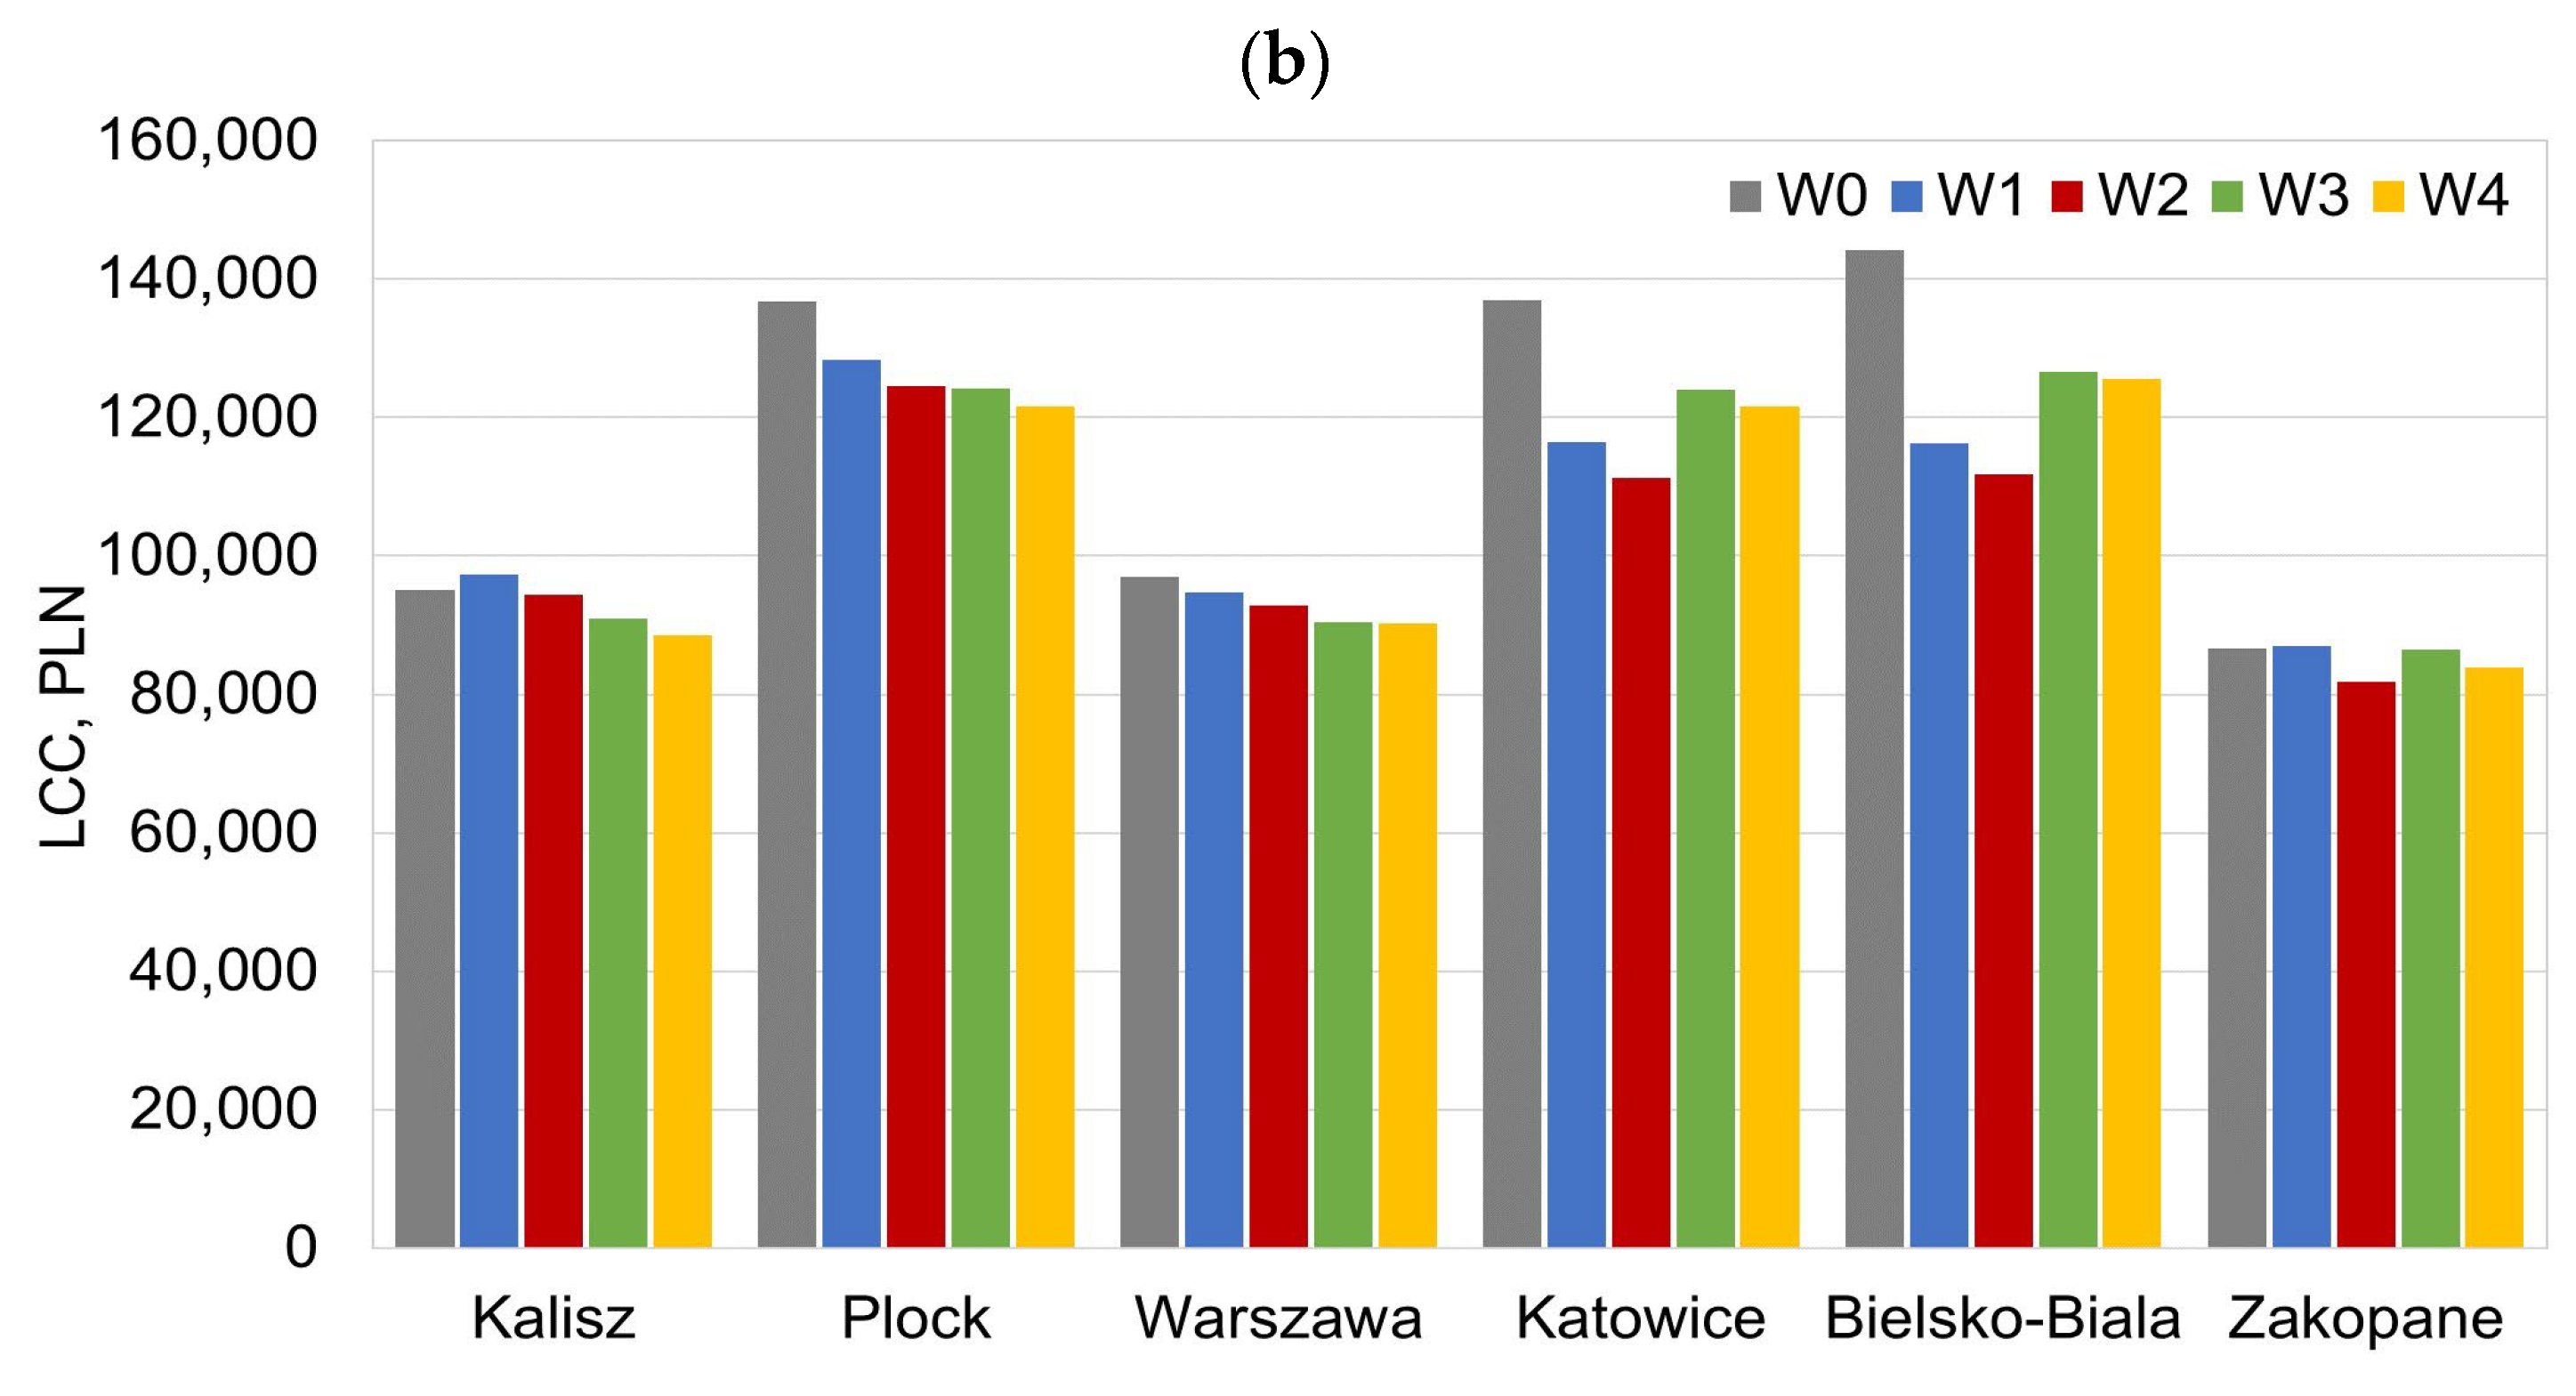
| Location | Variant | Analysis Period | |||||
|---|---|---|---|---|---|---|---|
| T = 15 Years | T = 30 Years | ||||||
| OC PLN | LCC PLN | INV/LCC % | OC PLN | LCC PLN | INV/LCC % | ||
| Kalisz | W0 | 30,450 | 45,352 | 33 | 80,246 | 95,148 | 16 |
| W1 | 27,025 | 63,542 | 57 | 76,631 | 113,147 | 32 | |
| W2 | 27,025 | 57,949 | 53 | 76,631 | 111,516 | 31 | |
| W3 | 26,039 | 54,494 | 52 | 71,808 | 100,263 | 28 | |
| W4 | 26,039 | 49,897 | 48 | 71,808 | 98,770 | 27 | |
| Plock | W0 | 46,220 | 61,122 | 24 | 121,806 | 136,707 | 11 |
| W1 | 37,731 | 77,018 | 51 | 104,844 | 144,131 | 27 | |
| W2 | 37,731 | 70,654 | 47 | 104,844 | 141,730 | 26 | |
| W3 | 37,870 | 68,325 | 45 | 102,986 | 133,442 | 23 | |
| W4 | 37,870 | 63,728 | 41 | 102,986 | 131,949 | 22 | |
| Warszawa | W0 | 31,177 | 46,078 | 32 | 82,161 | 97,063 | 15 |
| W1 | 26,384 | 61,671 | 57 | 74,812 | 110,098 | 32 | |
| W2 | 26,384 | 57,228 | 54 | 74,812 | 109,617 | 32 | |
| W3 | 26,507 | 52,962 | 50 | 72,965 | 99,420 | 27 | |
| W4 | 26,507 | 50,686 | 48 | 72,965 | 100,247 | 27 | |
| Katowice | W0 | 46,293 | 61,194 | 24 | 121,997 | 136,899 | 11 |
| W1 | 31,426 | 74,229 | 58 | 87,643 | 130,445 | 33 | |
| W2 | 31,426 | 65,450 | 52 | 87,643 | 126,728 | 31 | |
| W3 | 37,578 | 68,033 | 45 | 101,872 | 132,327 | 23 | |
| W4 | 37,578 | 63,437 | 41 | 101,872 | 130,834 | 22 | |
| Bielsko-Biala | W0 | 49,054 | 63,956 | 23 | 129,275 | 144,176 | 10 |
| W1 | 32,644 | 72,446 | 55 | 90,983 | 130,785 | 30 | |
| W2 | 32,644 | 64,137 | 49 | 90,983 | 127,537 | 29 | |
| W3 | 39,727 | 67,182 | 41 | 107,611 | 135,066 | 20 | |
| W4 | 39,727 | 64,034 | 38 | 107,611 | 135,022 | 20 | |
| Zakopane | W0 | 27,252 | 42,154 | 35 | 71,819 | 86,721 | 17 |
| W1 | 20,343 | 63,145 | 68 | 58,565 | 101,367 | 42 | |
| W2 | 20,343 | 54,366 | 63 | 58,565 | 97,650 | 40 | |
| W3 | 23,370 | 53,826 | 57 | 64,507 | 94,962 | 32 | |
| W4 | 23,370 | 49,229 | 53 | 64,507 | 93,469 | 31 | |
| Location | LCCW1/LCCW0 % | LCCW2/LCCW0 % | LCCW3/LCCW0 % | LCCW4/LCCW0 % |
|---|---|---|---|---|
| Kalisz | 102 | 101 | 96 | 94 |
| Plock | 94 | 92 | 91 | 90 |
| Warszawa | 98 | 97 | 93 | 94 |
| Katowice | 85 | 82 | 91 | 90 |
| Bielsko-Biala | 81 | 78 | 88 | 88 |
| Zakopane | 100 | 96 | 100 | 98 |
Disclaimer/Publisher’s Note: The statements, opinions and data contained in all publications are solely those of the individual author(s) and contributor(s) and not of MDPI and/or the editor(s). MDPI and/or the editor(s) disclaim responsibility for any injury to people or property resulting from any ideas, methods, instructions or products referred to in the content. |
© 2023 by the authors. Licensee MDPI, Basel, Switzerland. This article is an open access article distributed under the terms and conditions of the Creative Commons Attribution (CC BY) license (https://creativecommons.org/licenses/by/4.0/).
Share and Cite
Dudkiewicz, E.; Ludwińska, A. Family Dwelling House Localization in Poland as a Factor Influencing the Economic Effect of Rainwater Harvesting System with Underground Tank. Sustainability 2023, 15, 10687. https://doi.org/10.3390/su151310687
Dudkiewicz E, Ludwińska A. Family Dwelling House Localization in Poland as a Factor Influencing the Economic Effect of Rainwater Harvesting System with Underground Tank. Sustainability. 2023; 15(13):10687. https://doi.org/10.3390/su151310687
Chicago/Turabian StyleDudkiewicz, Edyta, and Agnieszka Ludwińska. 2023. "Family Dwelling House Localization in Poland as a Factor Influencing the Economic Effect of Rainwater Harvesting System with Underground Tank" Sustainability 15, no. 13: 10687. https://doi.org/10.3390/su151310687