
Pioneer Use of Pseudo Sub-Daily Timestep Model for Rainwater Harvesting Analysis: Acceptance over Hourly Model and Exploring Accuracy of Different Operating Algorithms

Abstract
:1. Introduction
2. Methodology and Data
3. Results
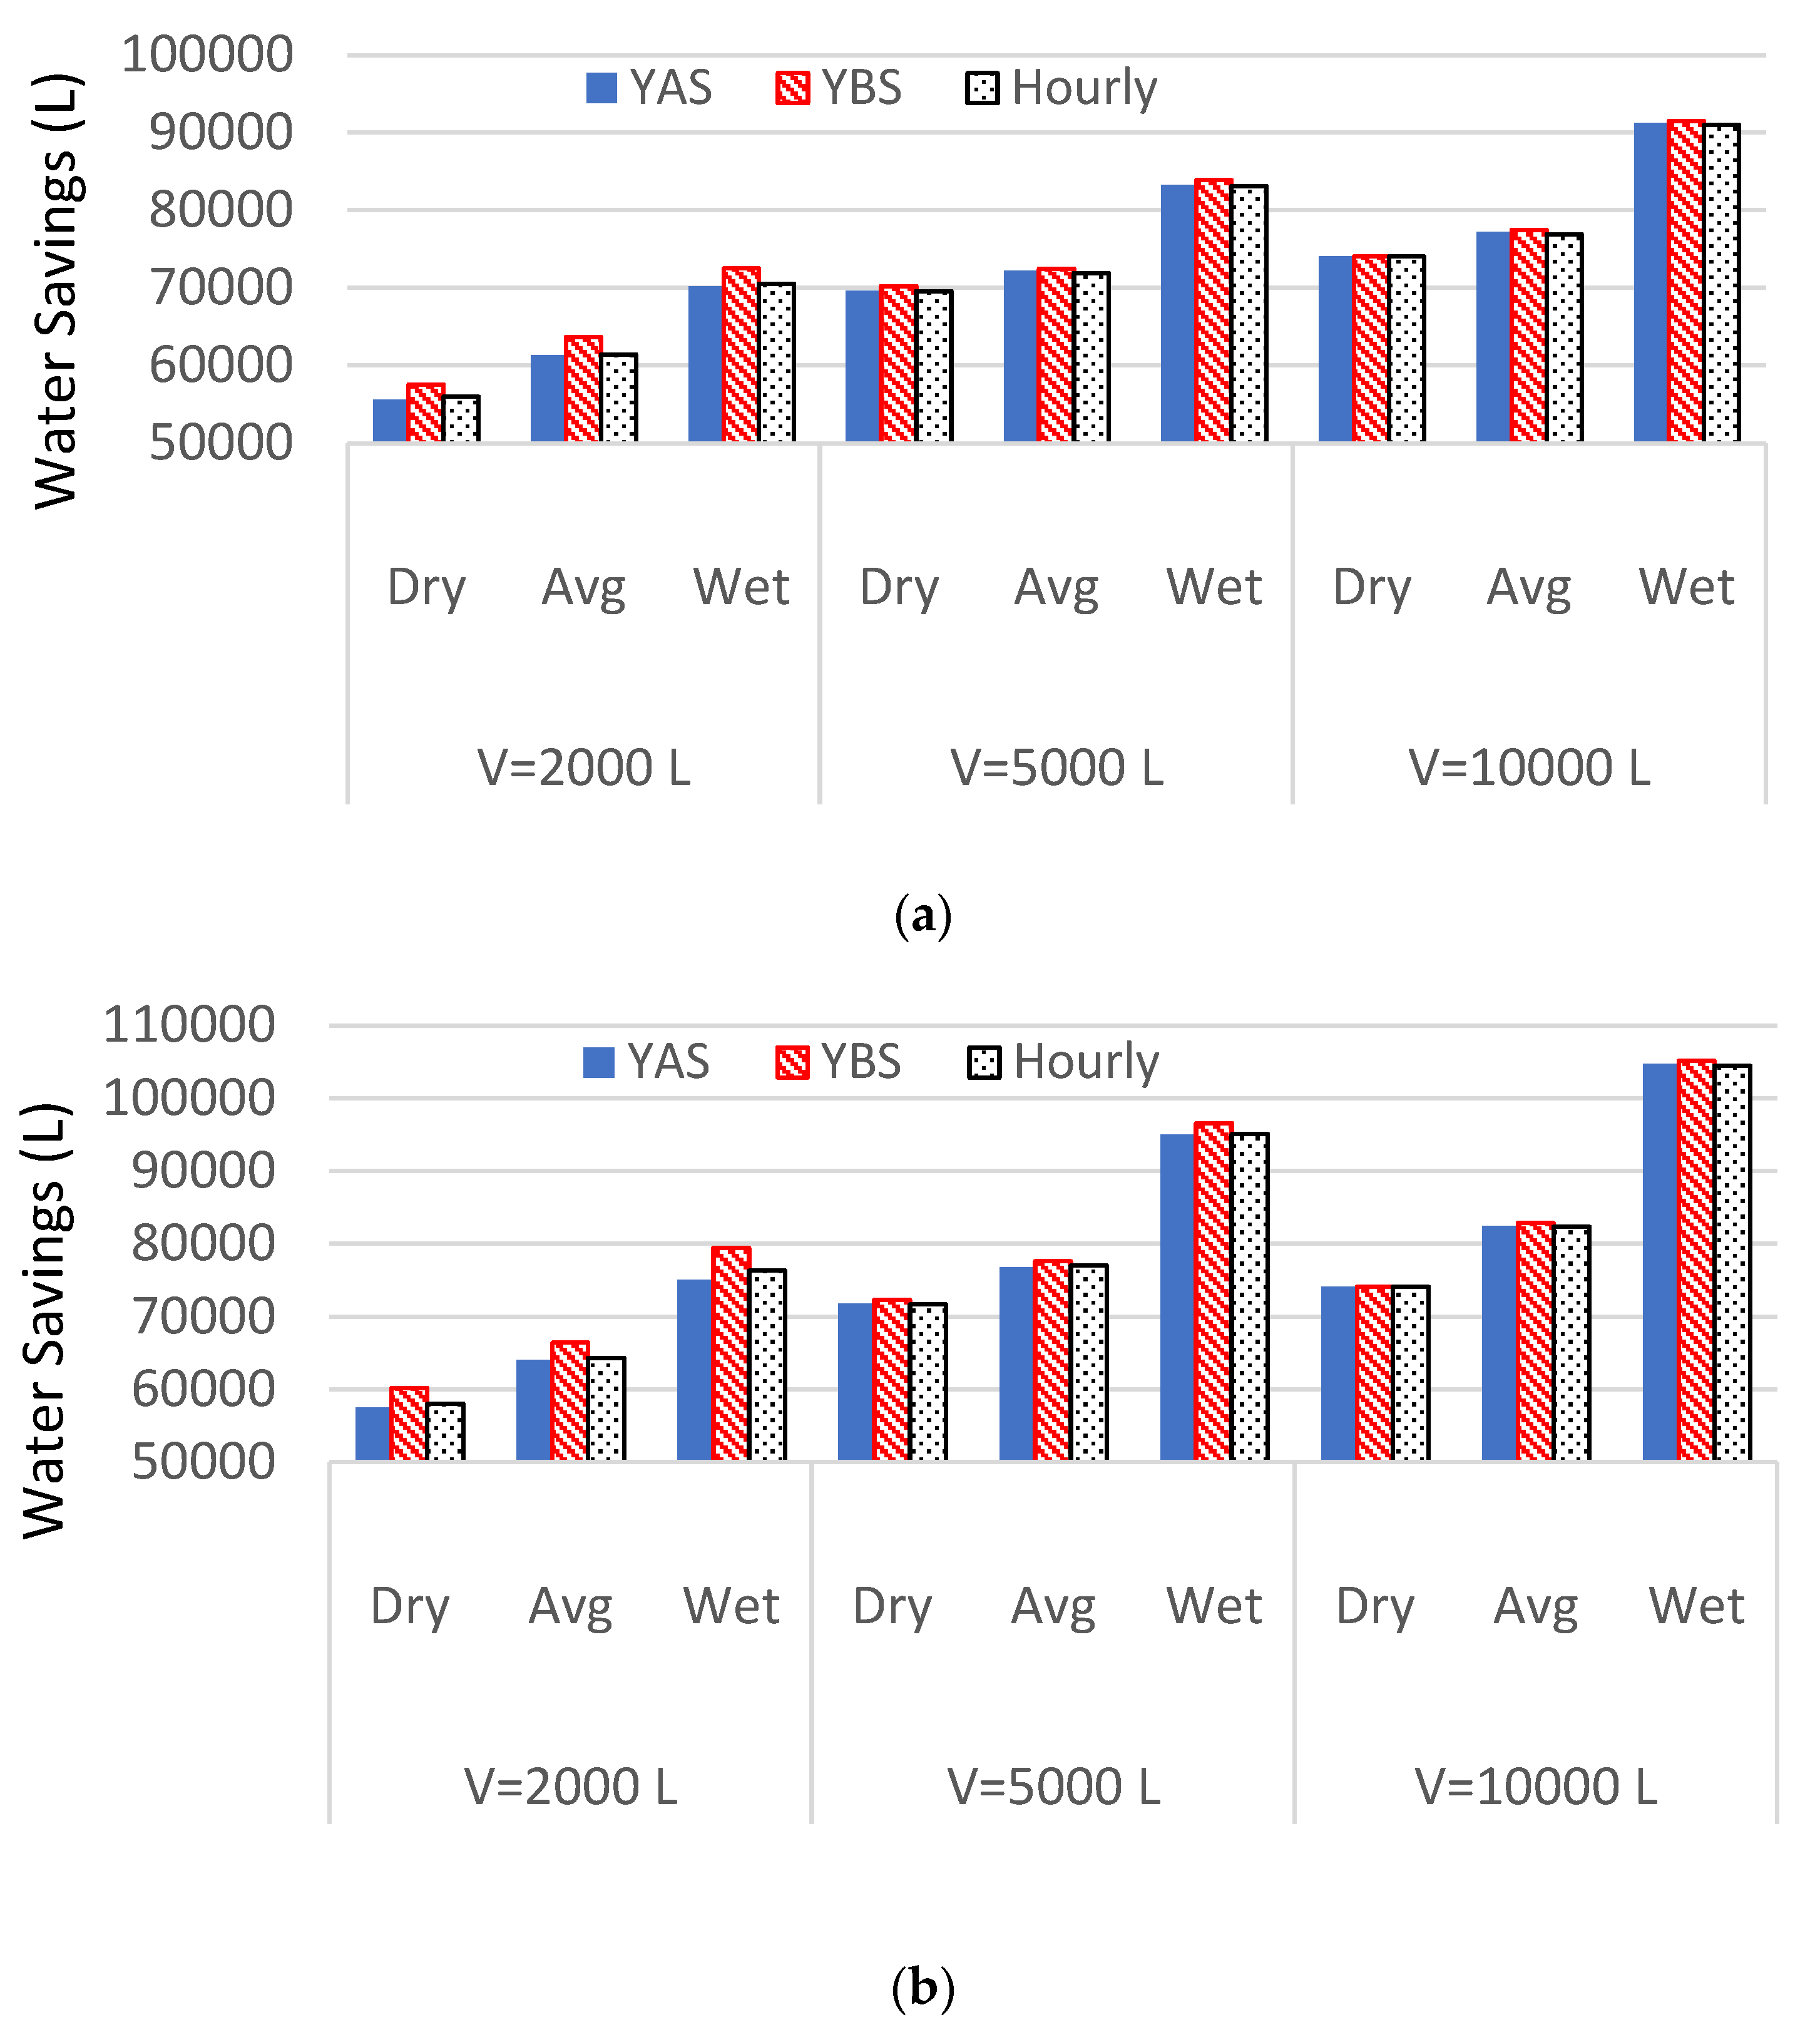
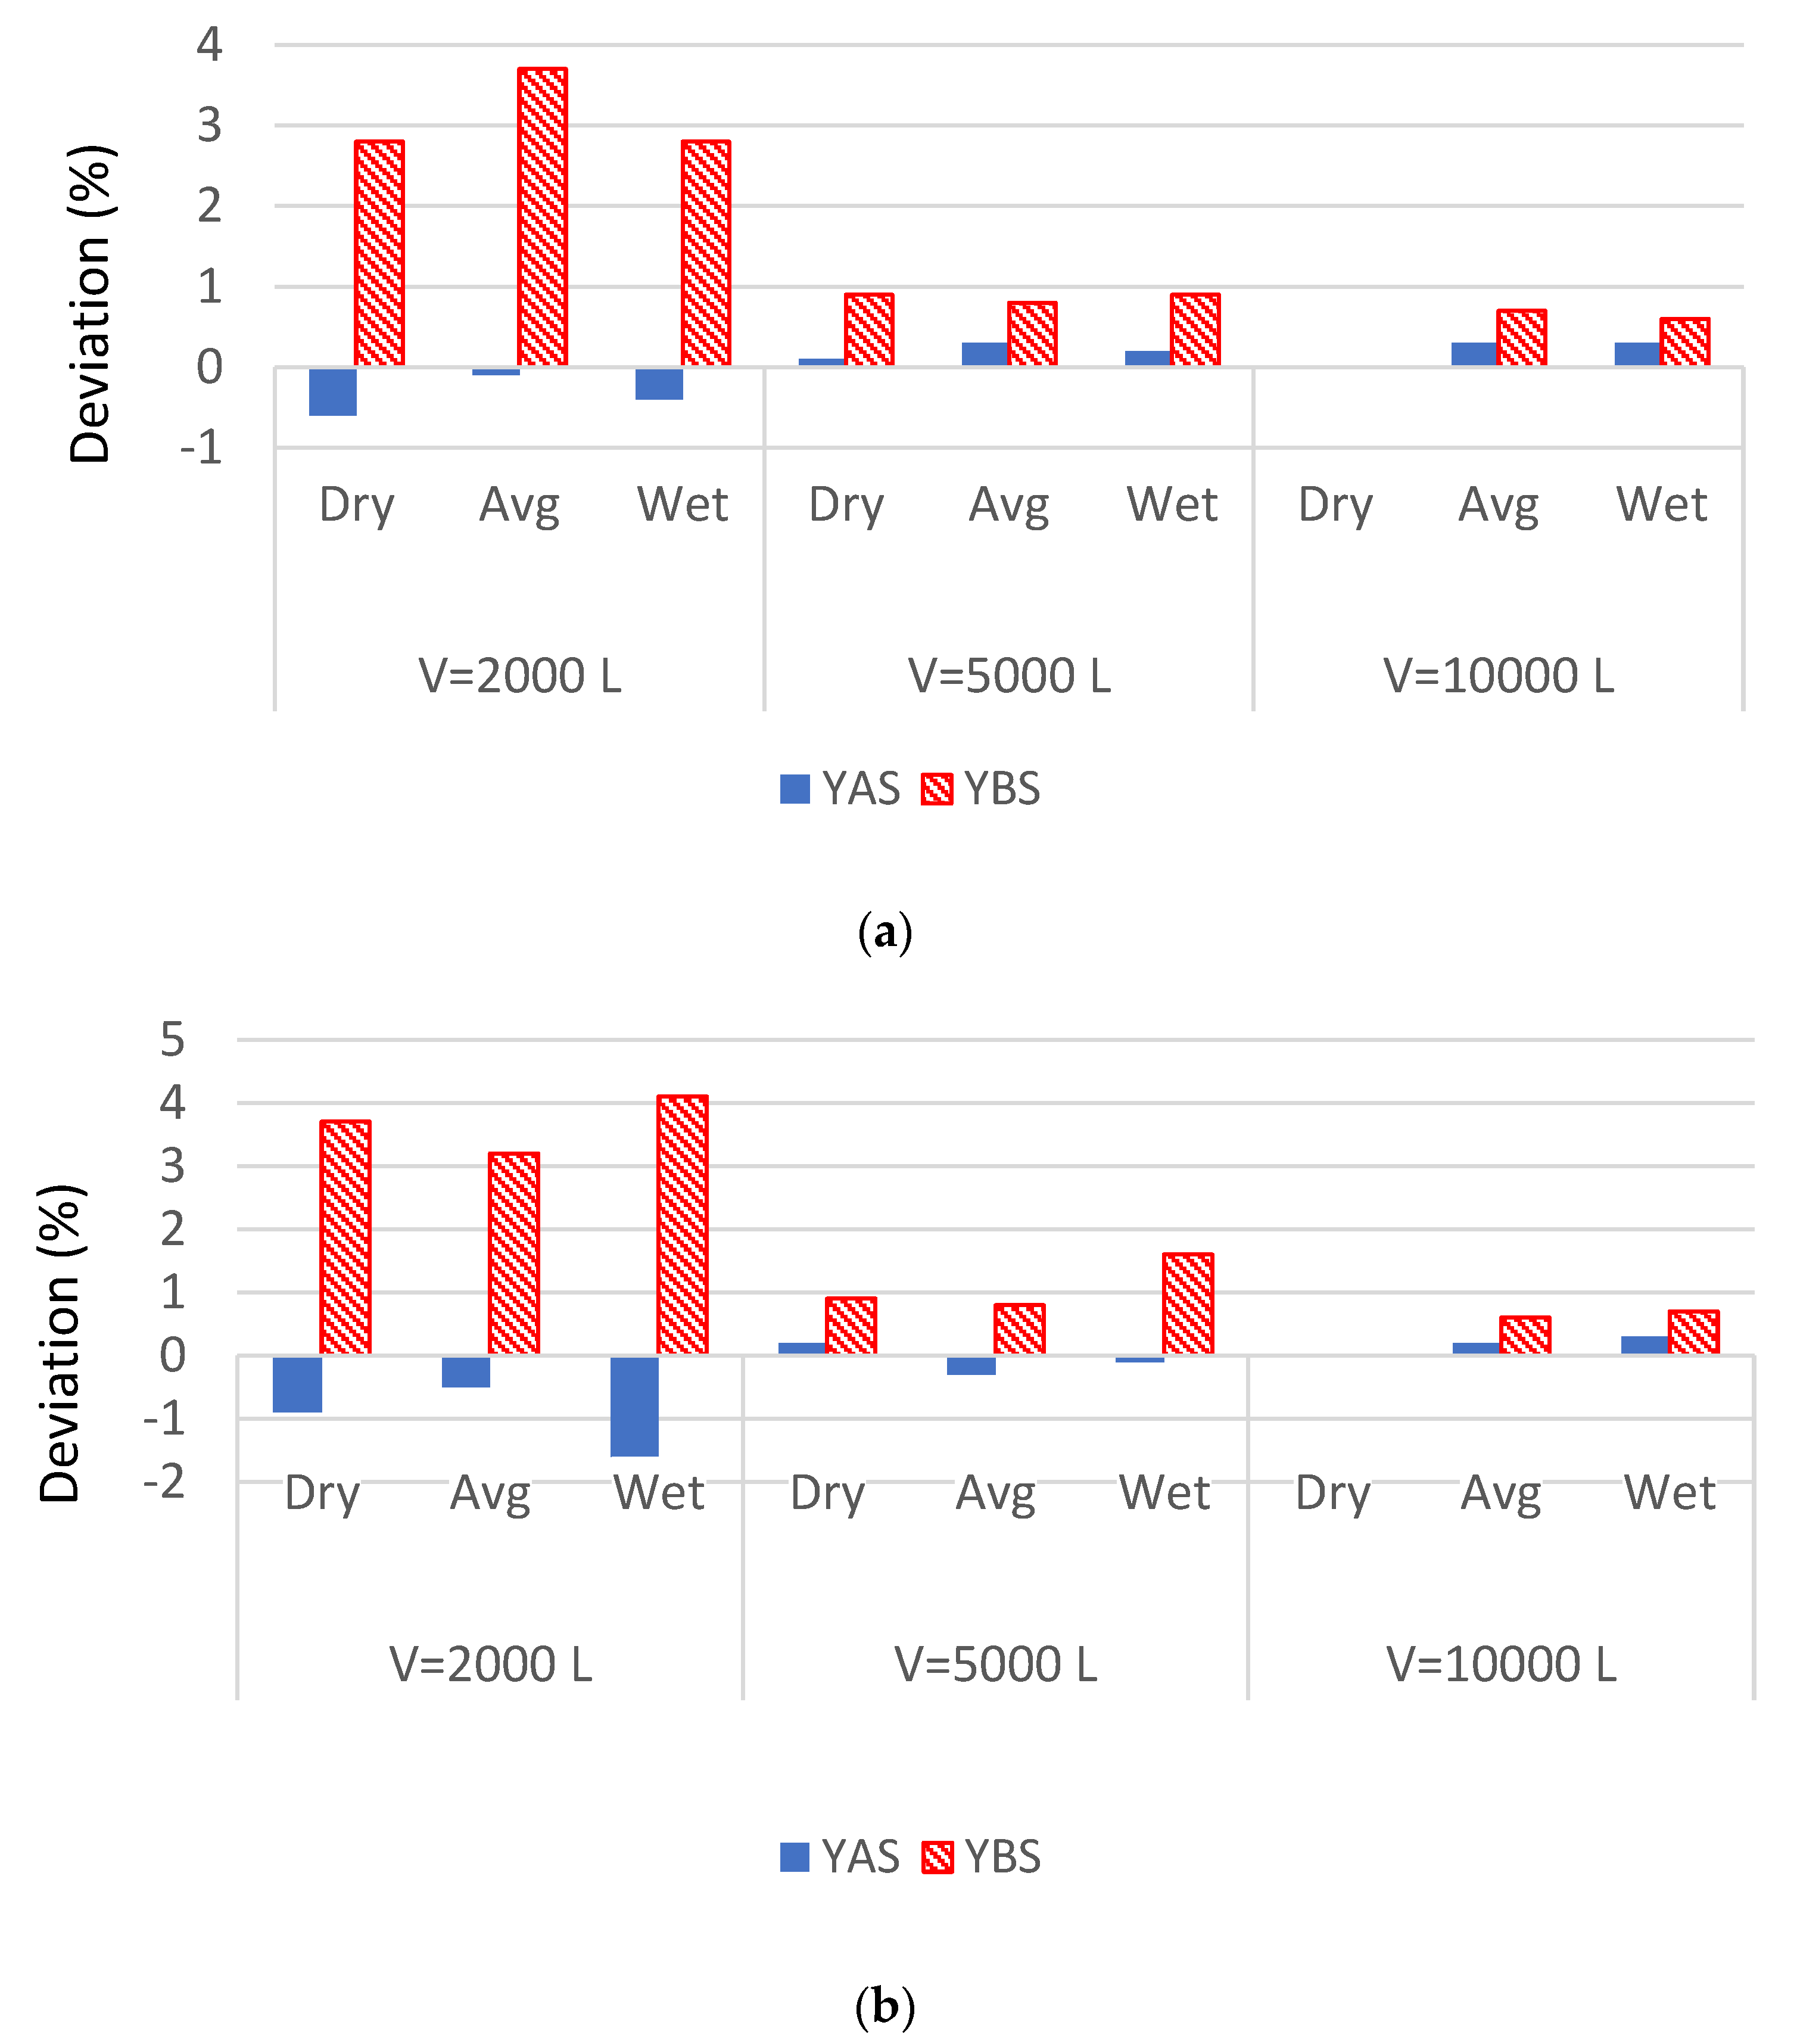
3.1. Comparison with Daily (YAS and YBS) Models
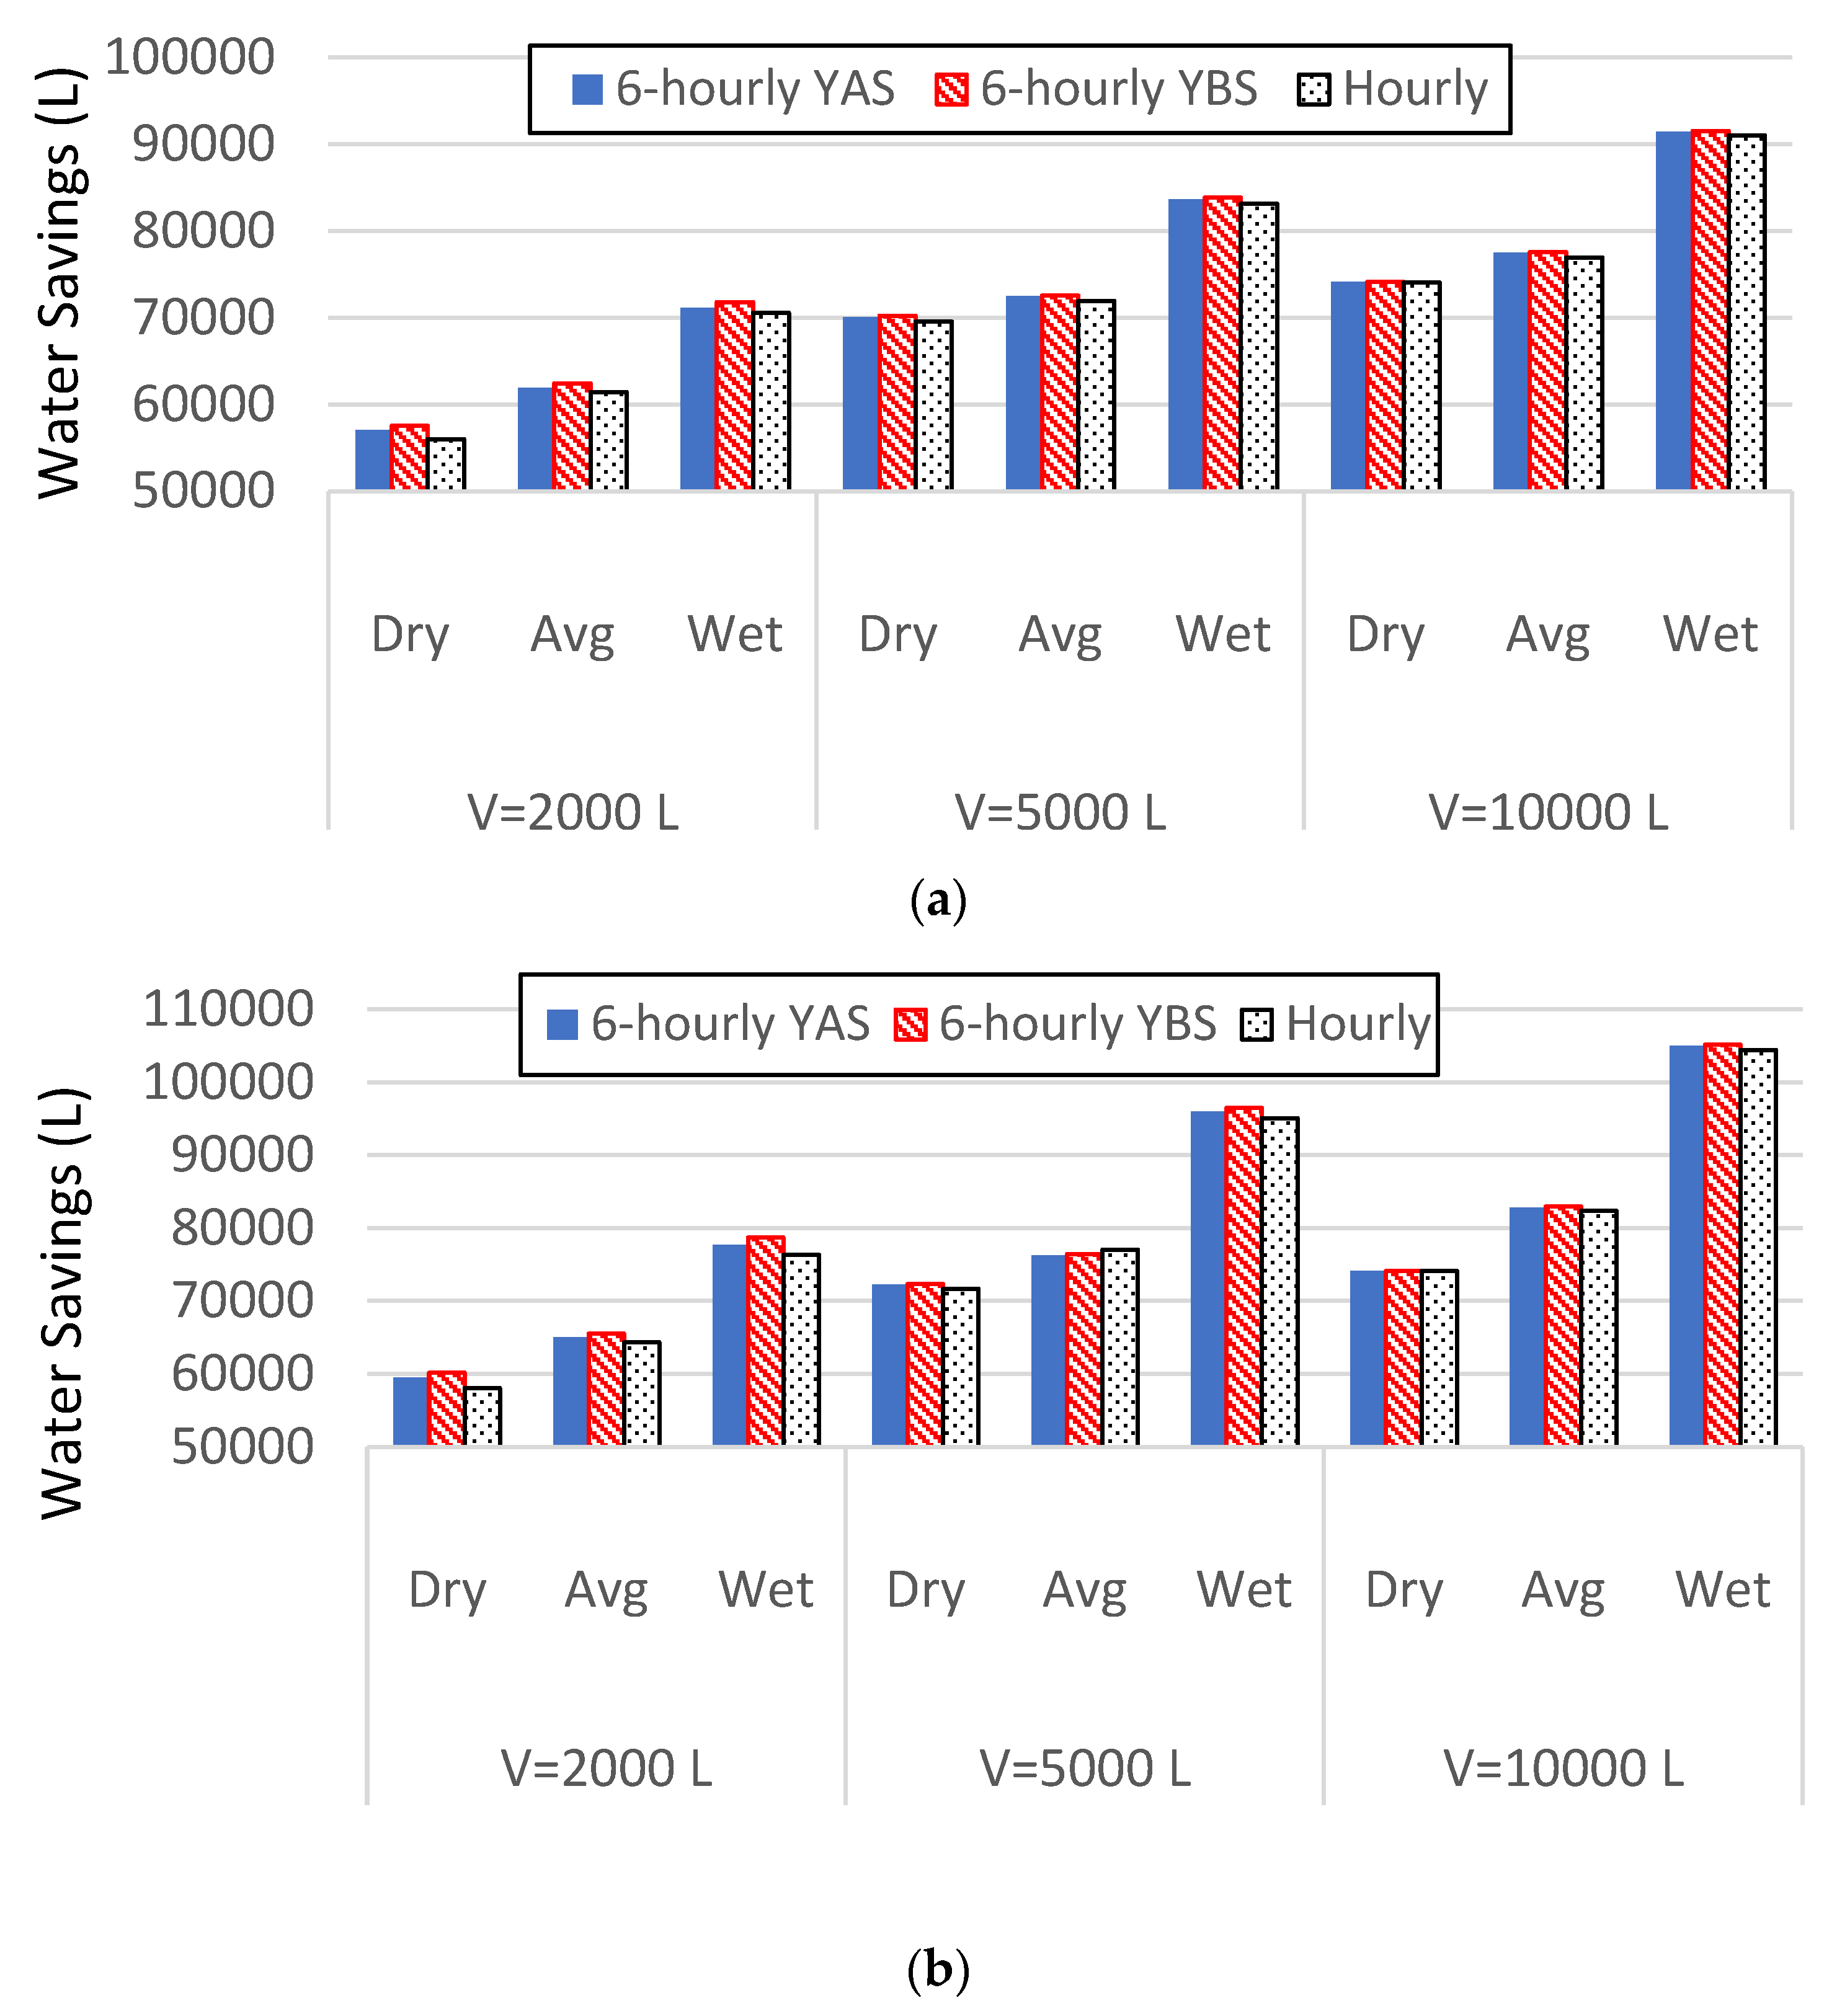
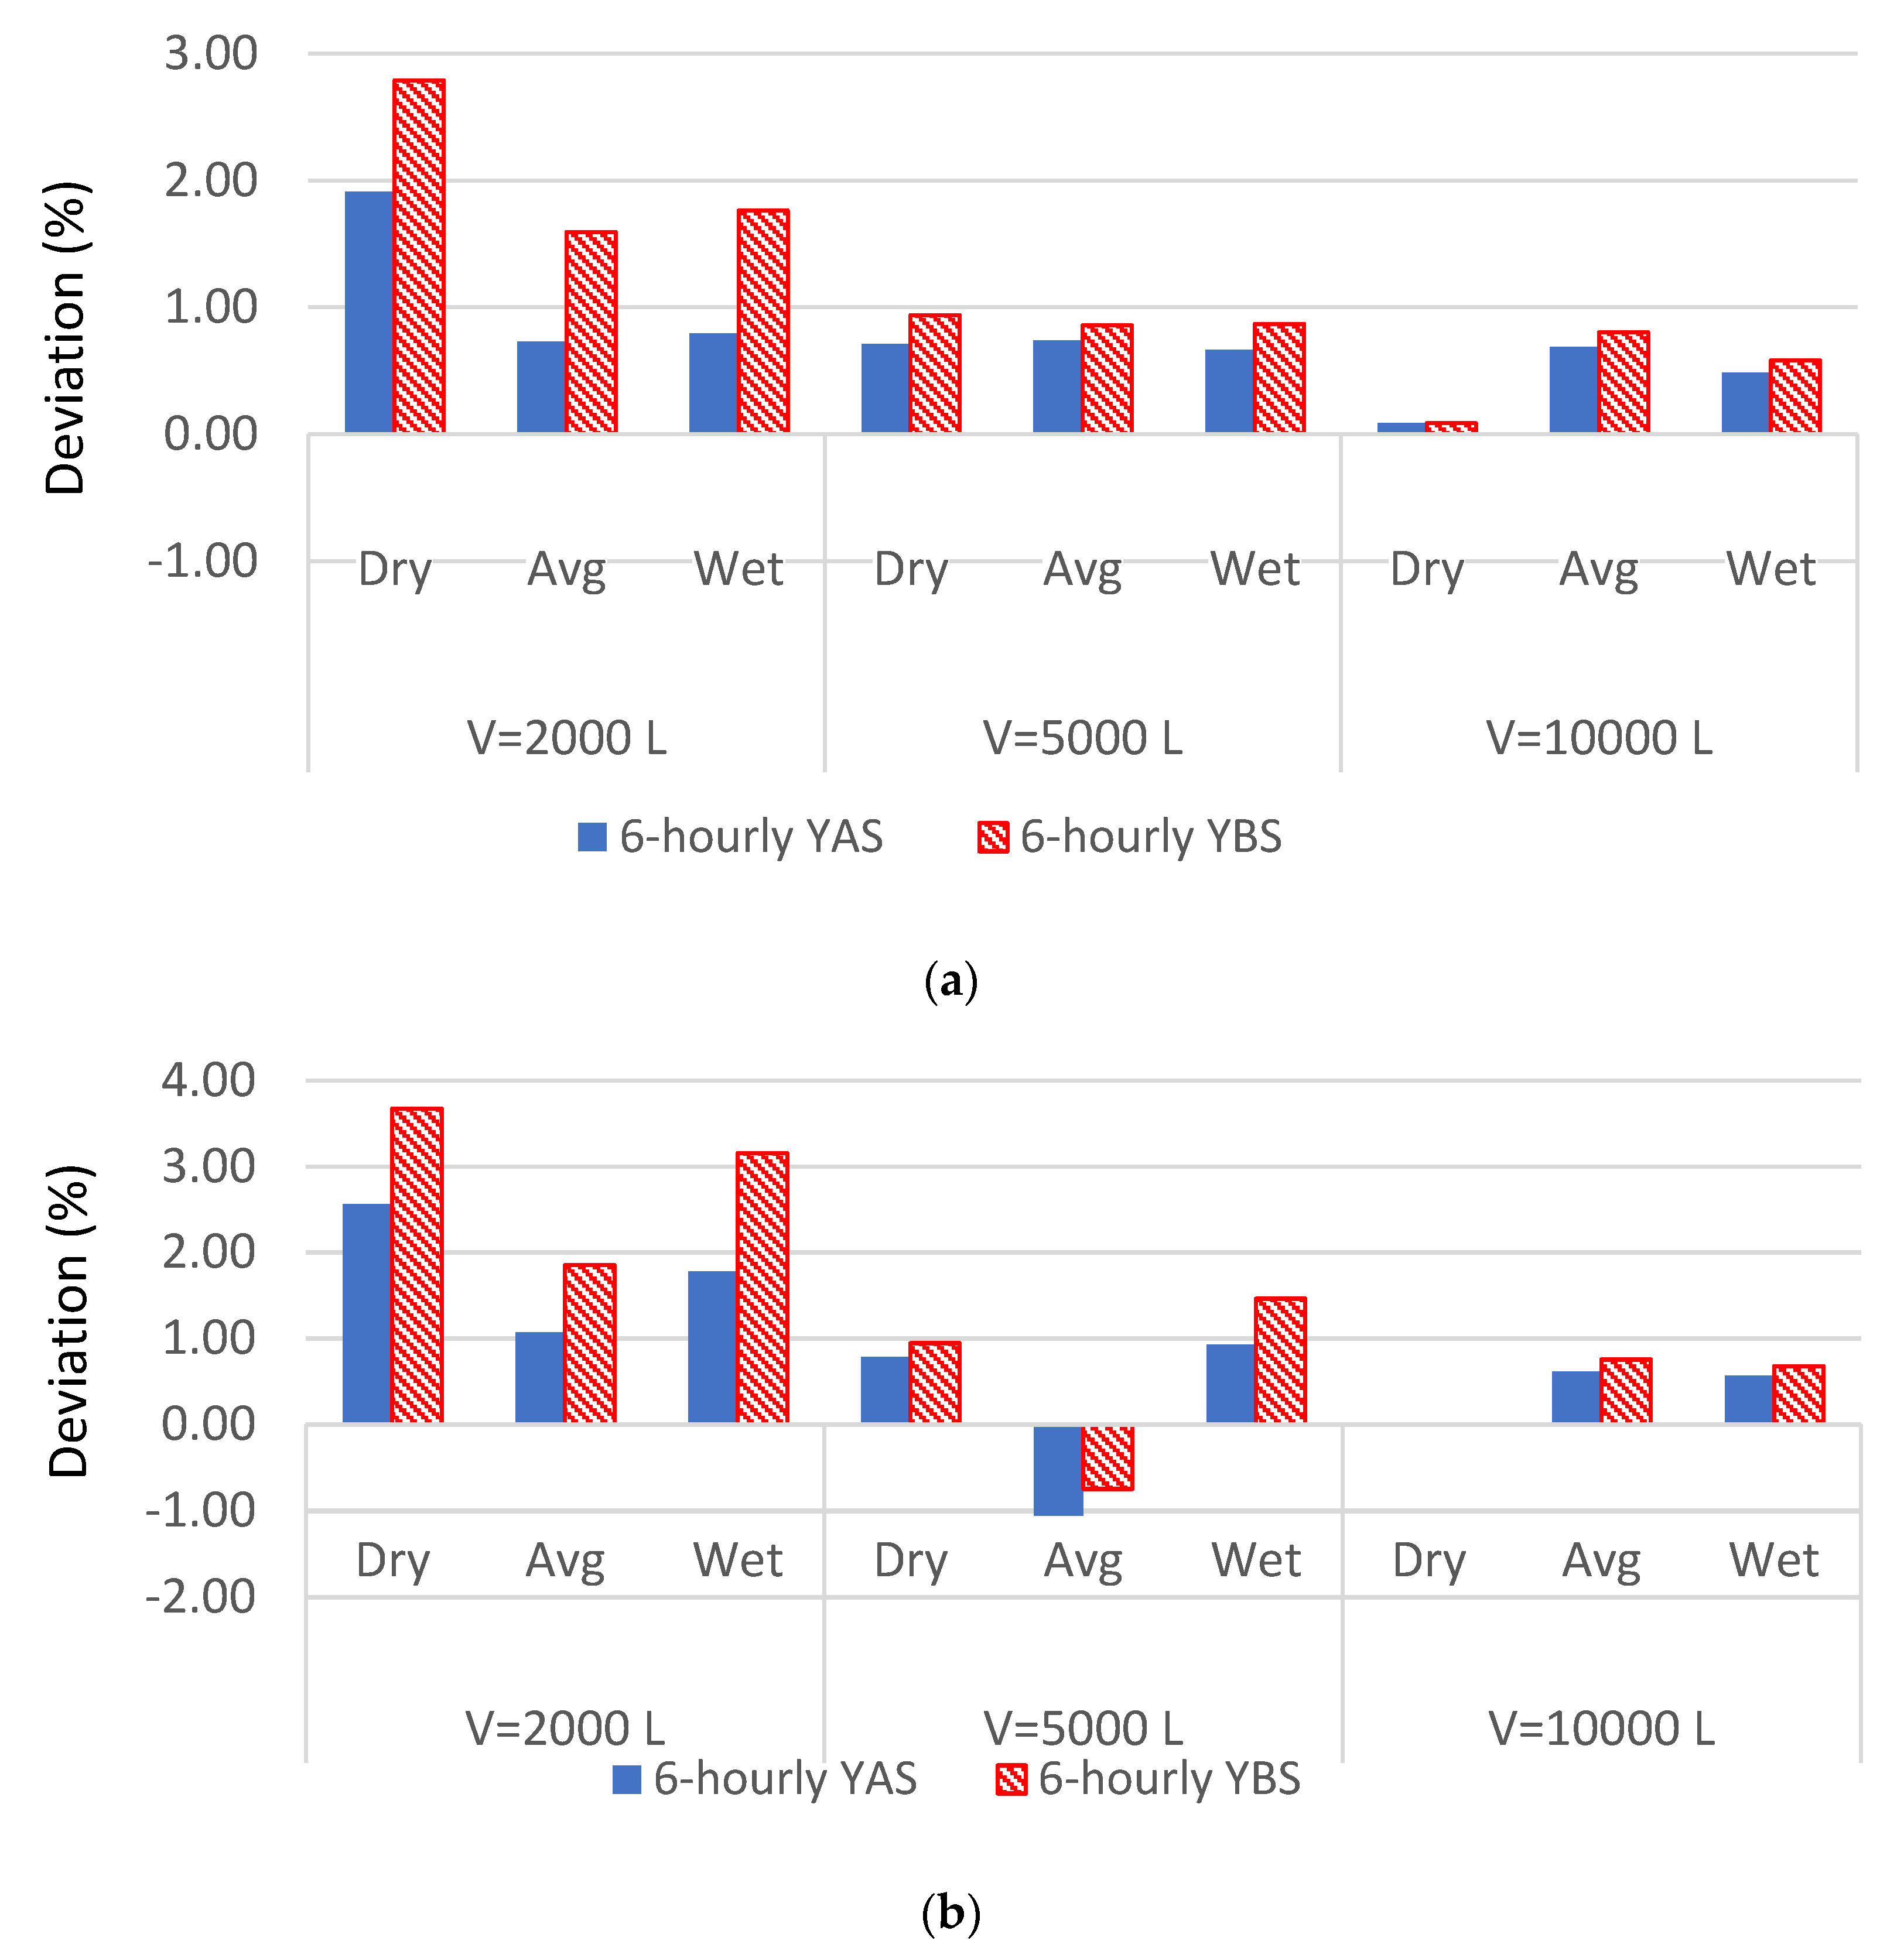
3.2. Comparisons with 6-Hourly (YAS and YBS) Timestep Models
3.3. Comparisons for Reliability Values
4. Conclusions
Author Contributions
Funding
Institutional Review Board Statement
Informed Consent Statement
Data Availability Statement
Conflicts of Interest
References
- Khan, Z.; Alim, M.A.; Rahman, M.M.; Rahman, A. A continental scale evaluation of rainwater harvesting in Australia, Resources. Conserv. Recycl. 2021, 167, 105378. [Google Scholar] [CrossRef]
- Shadeed, S.; Alawna, S. Optimal Sizing of Rooftop Rainwater Harvesting Tanks for Sustainable Domestic Water Use in the West Bank, Palestine. Water 2021, 13, 573. [Google Scholar] [CrossRef]
- Zhang, S.; Jing, X.; Yue, T.; Wang, J. Performance assessment of rainwater harvesting systems: Influence of operating algorithm, length and temporal scale of rainfall time series. J. Clean. Prod. 2020, 253, 120044. [Google Scholar] [CrossRef]
- Bailey, R.T.; Beikmann, A.; Kottermair, M.; Taboroši, D.; Jenson, J.W. Sustainability of rainwater catchment systems for small island communities. J. Hydrol. 2018, 557, 137–146. [Google Scholar] [CrossRef]
- Lopes, V.A.; Marques, G.F.; Dornelles, F.; Medellin-Azuara, J. Performance of rainwater harvesting systems under scenarios of non-potable water demand and roof area typologies using a stochastic approach. J. Clean. Prod. 2017, 148, 304–313. [Google Scholar] [CrossRef]
- Guizani, M. Storm Water harvesting in Saudi Arabia: A multipurpose water management alternative. Water Resour. Manag. 2016, 30, 1819–1833. [Google Scholar] [CrossRef]
- Lizárraga-Mendiola, L.; Vázquez-Rodríguez, G.; Blanco-Piñón, A.; Rangel-Martínez, Y.; González-Sandoval, M. Estimating the Rainwater Potential per Household in an Urban Area: Case Study in Central Mexico. Water 2015, 7, 4622–4637. [Google Scholar] [CrossRef] [Green Version]
- Bocanegra-Martínez, A.; Ponce-Ortega, J.M.; Nápoles-Rivera, F.; Serna-González, M.; Castro-Montoya, A.J.; El-Halwagi, M.M. Optimal design of rainwater collecting systems for domestic use into a residential development. Resources. Conserv. Recycl. 2014, 84, 44–56. [Google Scholar] [CrossRef]
- Imteaz, M.A.; Adeboye, O.; Rayburg, S.; Shanableh, A. Rainwater harvesting potential for southwest Nigeria using daily water balance model. Resources. Conserv. Recycl. 2012, 62, 51–55. [Google Scholar] [CrossRef]
- Bashar, M.Z.I.; Karim, M.R.; Imteaz, M.A. Reliability and Economic Analysis of Urban Rainwater Harvesting: A Comparative Study within Six Major Cities of Bangladesh. Resour. Conserv. Recycl. 2018, 133, 146–154. [Google Scholar] [CrossRef]
- Mehrabadi, M.H.R.; Saghafian, B.; Fashi, F.H. Assessment of residential rainwater harvesting efficiency for meeting non-potable water demands in three climate conditions. Resour. Conserv. Recycl. 2013, 73, 86–93. [Google Scholar] [CrossRef]
- Basinger, M.; Montalto, F.A.; Lall, U. A rainwater harvesting system reliability model based on nonparametric stochastic rainfall generator. J. Hydrol. 2010, 392, 105–118. [Google Scholar] [CrossRef]
- Ali, S.; Zhang, S.; Yue, T. Environmental and economic assessment of rainwater harvesting systems under five climatic conditions of Pakistan. J. Clean. Prod. 2020, 259, 120–829. [Google Scholar] [CrossRef]
- Alim, M.A.; Rahman, A.; Tao, Z.; Samali, B.; Khan, M.M.; Shirin, S. Feasibility analysis of a small-scale rainwater harvesting system for drinking water production at Werrington, New South Wales, Australia. J. Clean. Prod. 2020, 270, 122437. [Google Scholar] [CrossRef]
- Imteaz, M.A.; Moniruzzaman, M. Spatial variability of reasonable government rebates for rainwater tank installations: A case study for Sydney, Resources. Conserv. Recycl. 2018, 133, 112–119. [Google Scholar] [CrossRef]
- Jing, X.; Zhang, S.; Zhang, J.; Wang, Y.; Wang, Y. Assessing efficiency and economic viability of rainwater harvesting systems for meeting non-potable water demands in four climatic zones of China. Resour. Conserv. Recycl. 2017, 126, 74–85. [Google Scholar] [CrossRef]
- Basheer, M.; Elagib, N.A. Temporal analysis of water-energy nexus indicators for hydropower generation and water pumping in the Lower Blue Nile Basin. J. Hydrol. 2019, 578, 124085. [Google Scholar] [CrossRef]
- Wurthmann, K. Assessing storage requirements, water and energy savings, and costs associated with a residential rainwater harvesting system deployed across two counties in Southeast Florida. J. Environ. Manag. 2019, 252, 109673. [Google Scholar] [CrossRef] [PubMed]
- Chiu, Y.R.; Tsai, Y.L.; Chiang, Y.C. Designing rainwater harvesting systems cost-effectively in a urban water-energy saving scheme by using a GIS-simulation based design system. Water 2015, 7, 6285–6300. [Google Scholar] [CrossRef] [Green Version]
- Vieira, A.S.; Beal, C.D.; Ghisi, E.; Stewart, R.A. Energy intensity of rainwater harvesting systems: A review. Renew. Sustain. Energy Rev. 2014, 34, 225–242. [Google Scholar] [CrossRef] [Green Version]
- Waseem, M.; Lin, Z.; Liu, S.; Zhang, Z.; Aziz, T.; Khan, D. Fuzzy compromised solution-based novel home appliances scheduling and demand response with optimal dispatch of distributed energy resources. Appl. Energy 2021, 290, 116761. [Google Scholar] [CrossRef]
- Waseem, M.; Lin, Z.; Liu, S.; Sajjad, I.A.; Aziz, T. Optimal GWCSO-based home appliances scheduling for demand response considering end-users comfort. Electr. Power Syst. Res. 2020, 187, 106477. [Google Scholar] [CrossRef]
- Imteaz, M.A.; Shanableh, A.; Rahman, A.; Ahsan, A. Optimisation of Rainwater Tank Design from Large Roofs: A Case Study in Melbourne, Australia. Resources. Conserv. Recycl. 2011, 55, 1022–1029. [Google Scholar] [CrossRef]
- Paudel, U.; Imteaz, M.A. Spatial Variability of Reasonable Government Rebates for Rainwater Tank Installations: A Case Study for Adelaide. In Sustainability Perspectives: Science, Policy and Practice; Khaiter, P.A., Erechtchoukova, M.G., Eds.; Springer: Berlin/Heidelberg, Germany, 2019; Chapter 13; ISBN 978-3-030-19549-6. [Google Scholar] [CrossRef]
- Gómez, Y.D.; Teixeira, L.G. Residential rainwater harvesting: Effects of incentive policies and water consumption over economic feasibility. Resour. Conserv. Recycl. 2017, 127, 56–67. [Google Scholar] [CrossRef]
- Imteaz, M.A.; Paudel, U.; Santos, C. Impacts of climate change on weather and spatial variabilities of potential water savings from rainwater tanks. J. Clean. Prod. 2021, 311, 127491. [Google Scholar] [CrossRef]
- Santos, C.; Imteaz, M.A.; Ghisi, E.; Matos, C. The effect of climate change on domestic rainwater harvesting. Sci. Total Environ. 2020, 729, 138967. [Google Scholar] [CrossRef]
- Imteaz, M.A.; Moniruzzaman, M. Potential impacts of climate change on future rainwater tank outcomes: A case study for Sydney. J. Clean. Prod. 2020, 273, 123095. [Google Scholar] [CrossRef]
- Haque, M.M.; Rahman, A.; Samali, B. Evaluation of climate change impacts on rainwater harvesting. J. Clean. Prod. 2016, 137, 60–69. [Google Scholar] [CrossRef]
- Imteaz, M.A.; Boulomytis, V.T.G. Improvement of rainwater harvesting analysis through an hourly timestep model in comparison with a daily timestep model. Water Resour. Manag. 2022, 36, 2611–2622. [Google Scholar] [CrossRef]
- Lade, O.; Oloke, D.; Chinyio, E.; Fullen, M. Use of multi-criteria decision analysis methods for water supply problems: A framework for improved rainwater harvesting. J. Environ. Sci. Eng. A 2012, 1, 909–917. [Google Scholar]
- Eroksuz, E.; Rahman, A. Rainwater tanks in multi-unit buildings: A case study for three Australian cities. Resour. Conserv. Recycl. 2010, 54, 1449–1452. [Google Scholar] [CrossRef]
- Beal, C.; South East Queensland Residential End Use Study: Final Report. Urban Water Security Research Alliance 2011, Technical Report No. 47. Available online: http://www.urbanwateralliance.org.au/publications/UWSRA-tr47.pdf (accessed on 15 July 2022).
- Imteaz, M.A.; Khan, M.S. Pioneer attempt of incorporating four variables in generalised equations for predicting water savings through rainwater tanks. Urban Water J. 2022, 19, 714–731. [Google Scholar] [CrossRef]


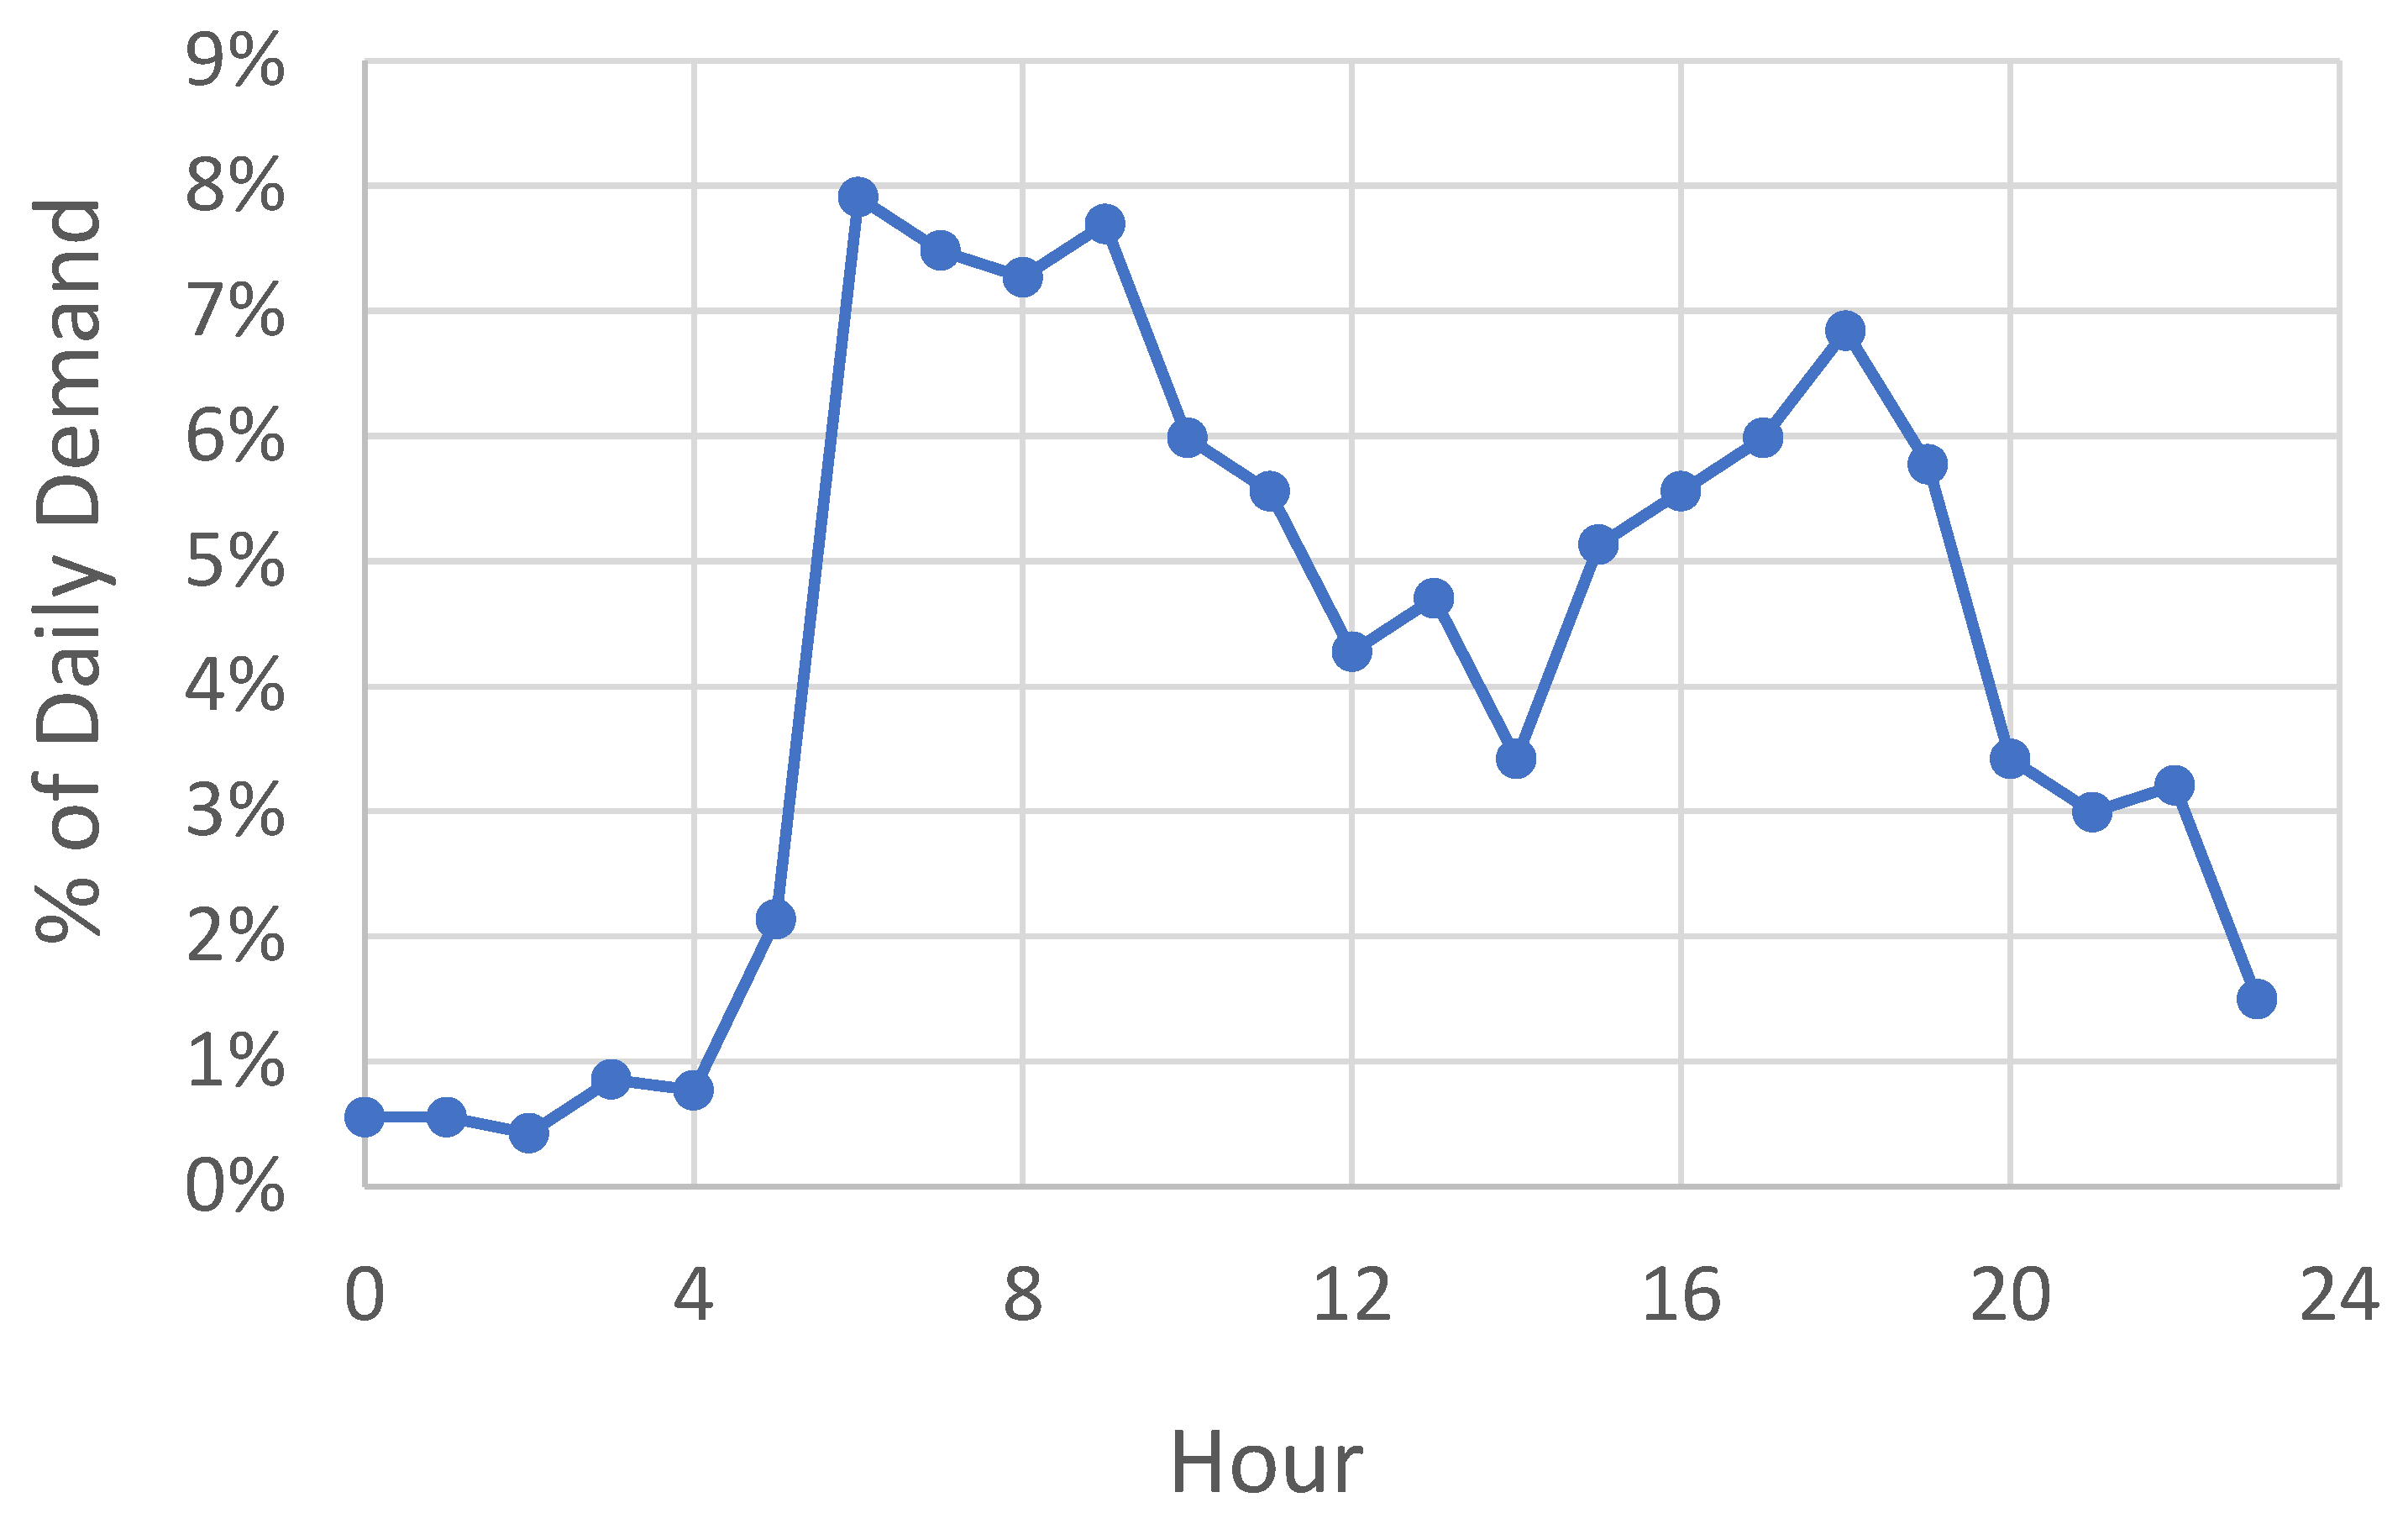
| Period | % of Total Demand |
|---|---|
| Midnight—6 a.m. | 5 |
| 6 a.m.—12 noon | 42 |
| 12 noon—6 p.m. | 29 |
| 6 p.m.—midnight | 24 |
| Midnight—6 a.m. | 5 |
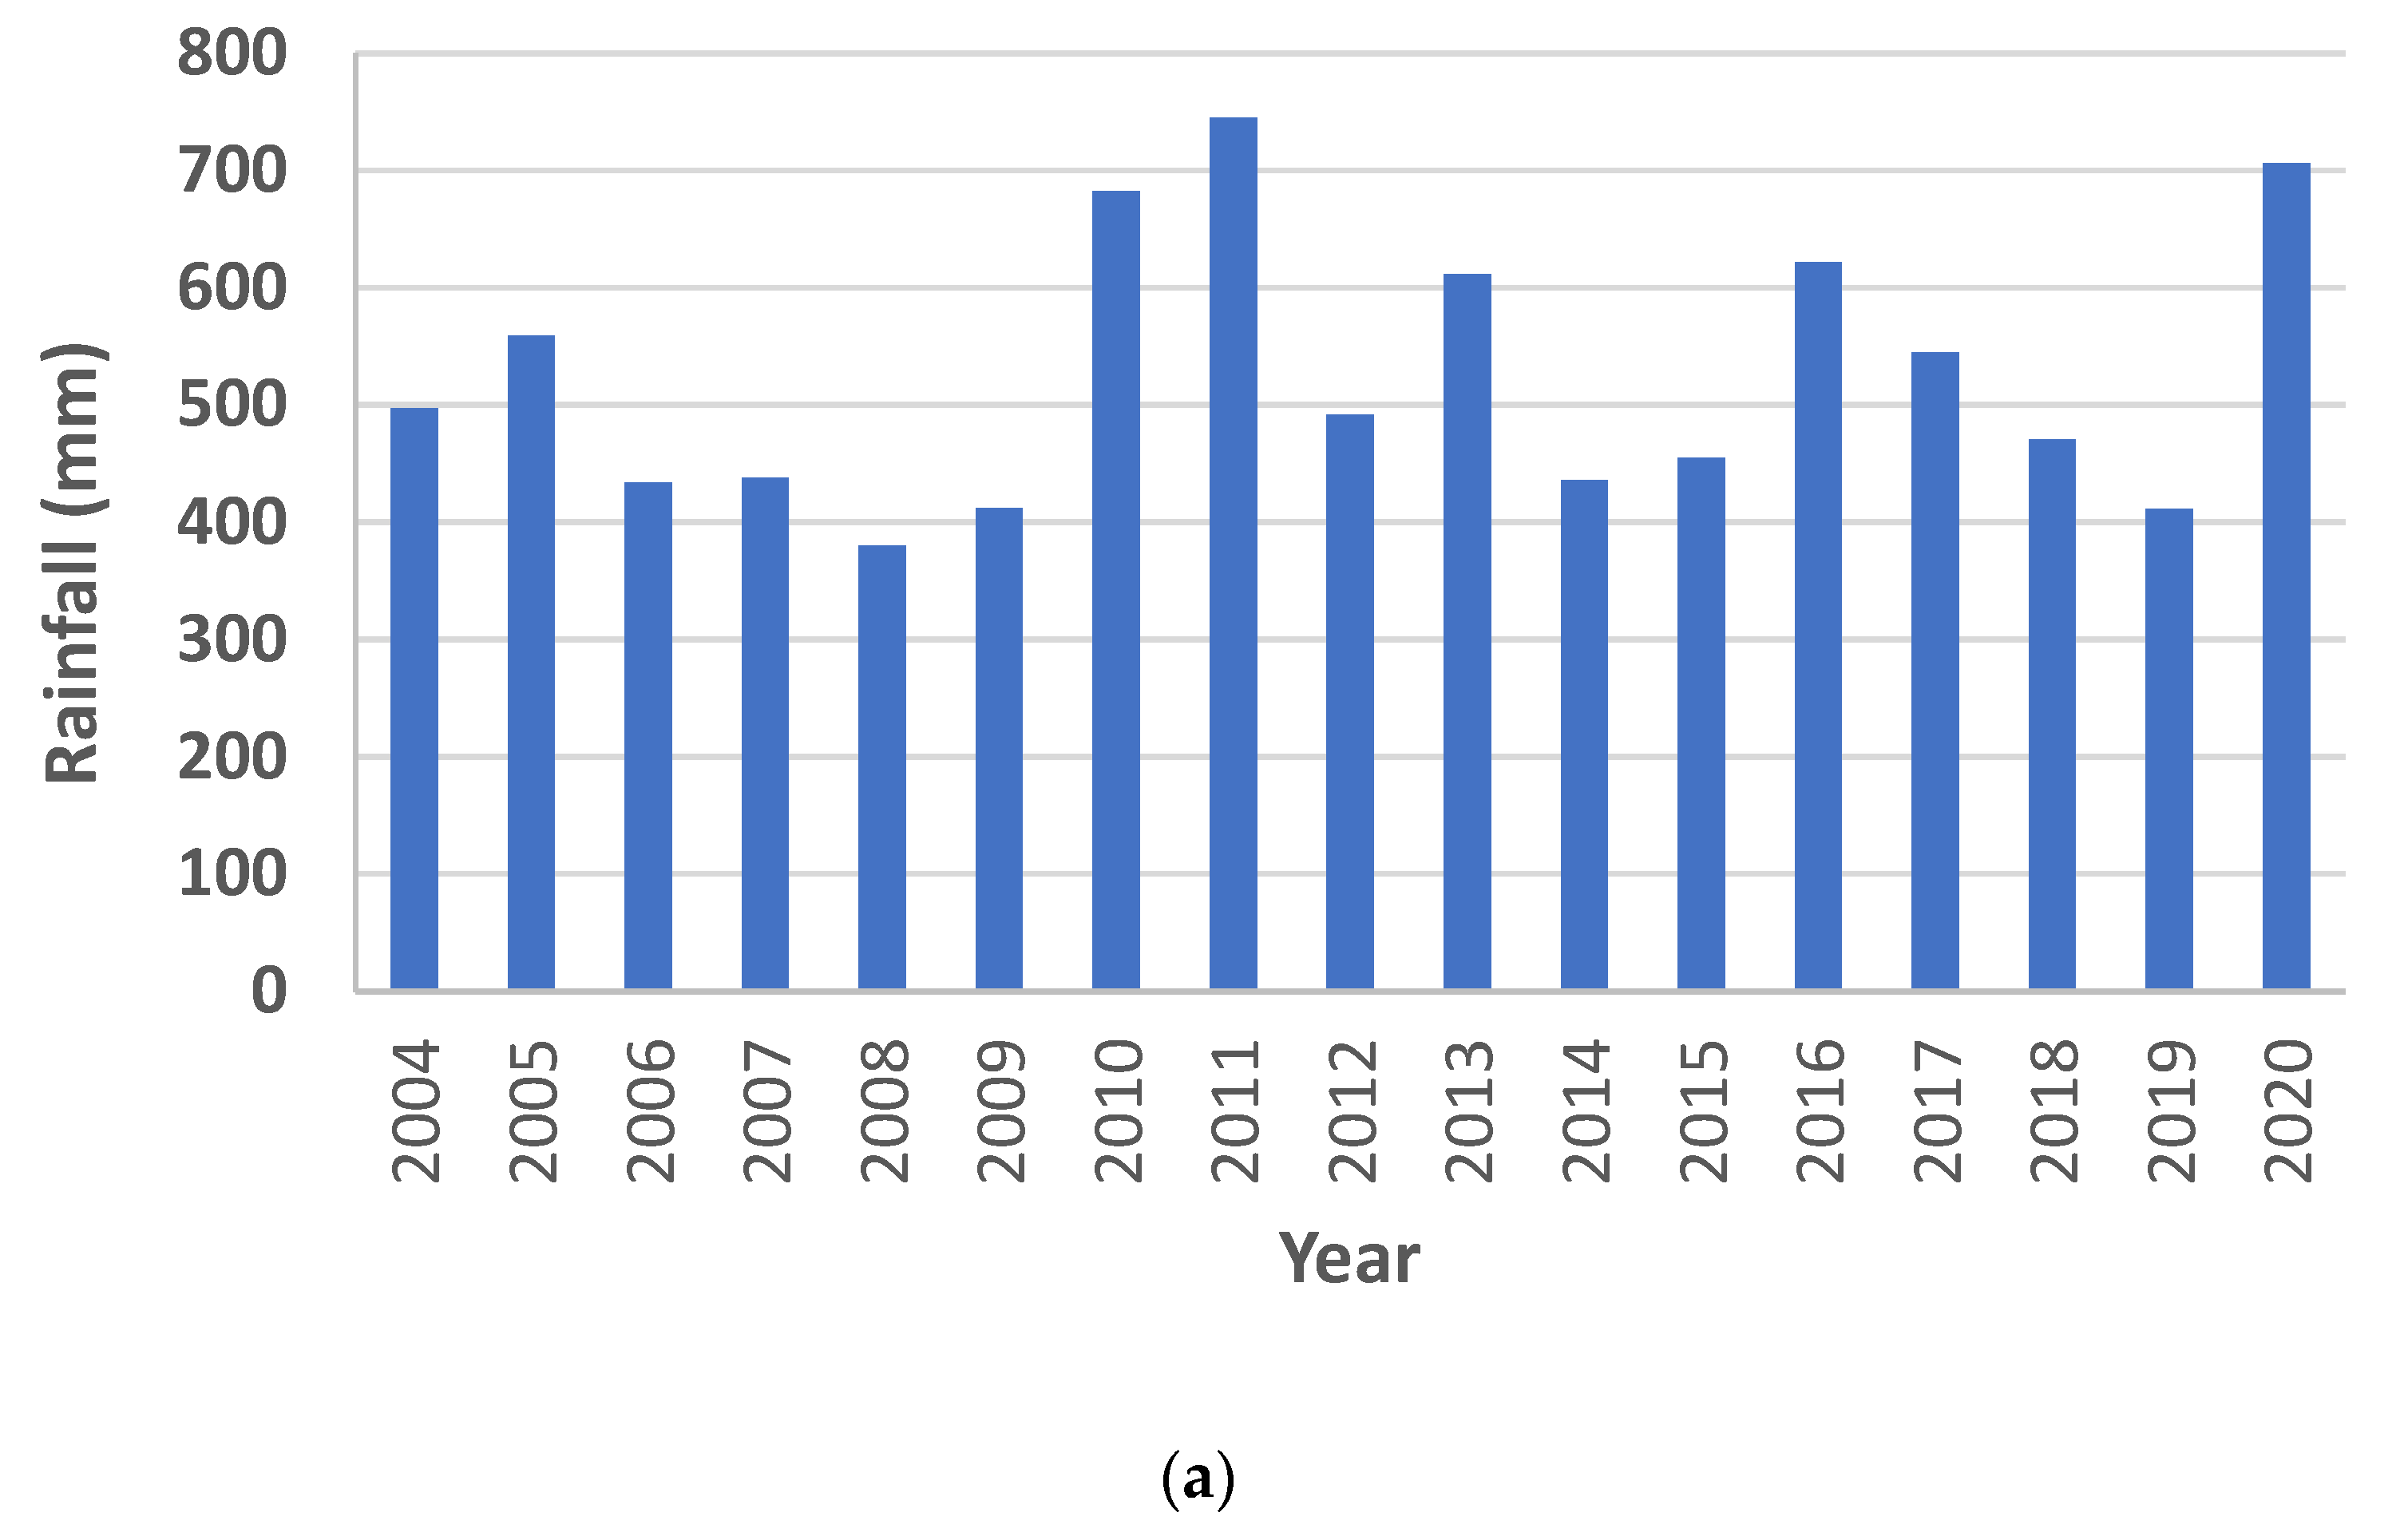
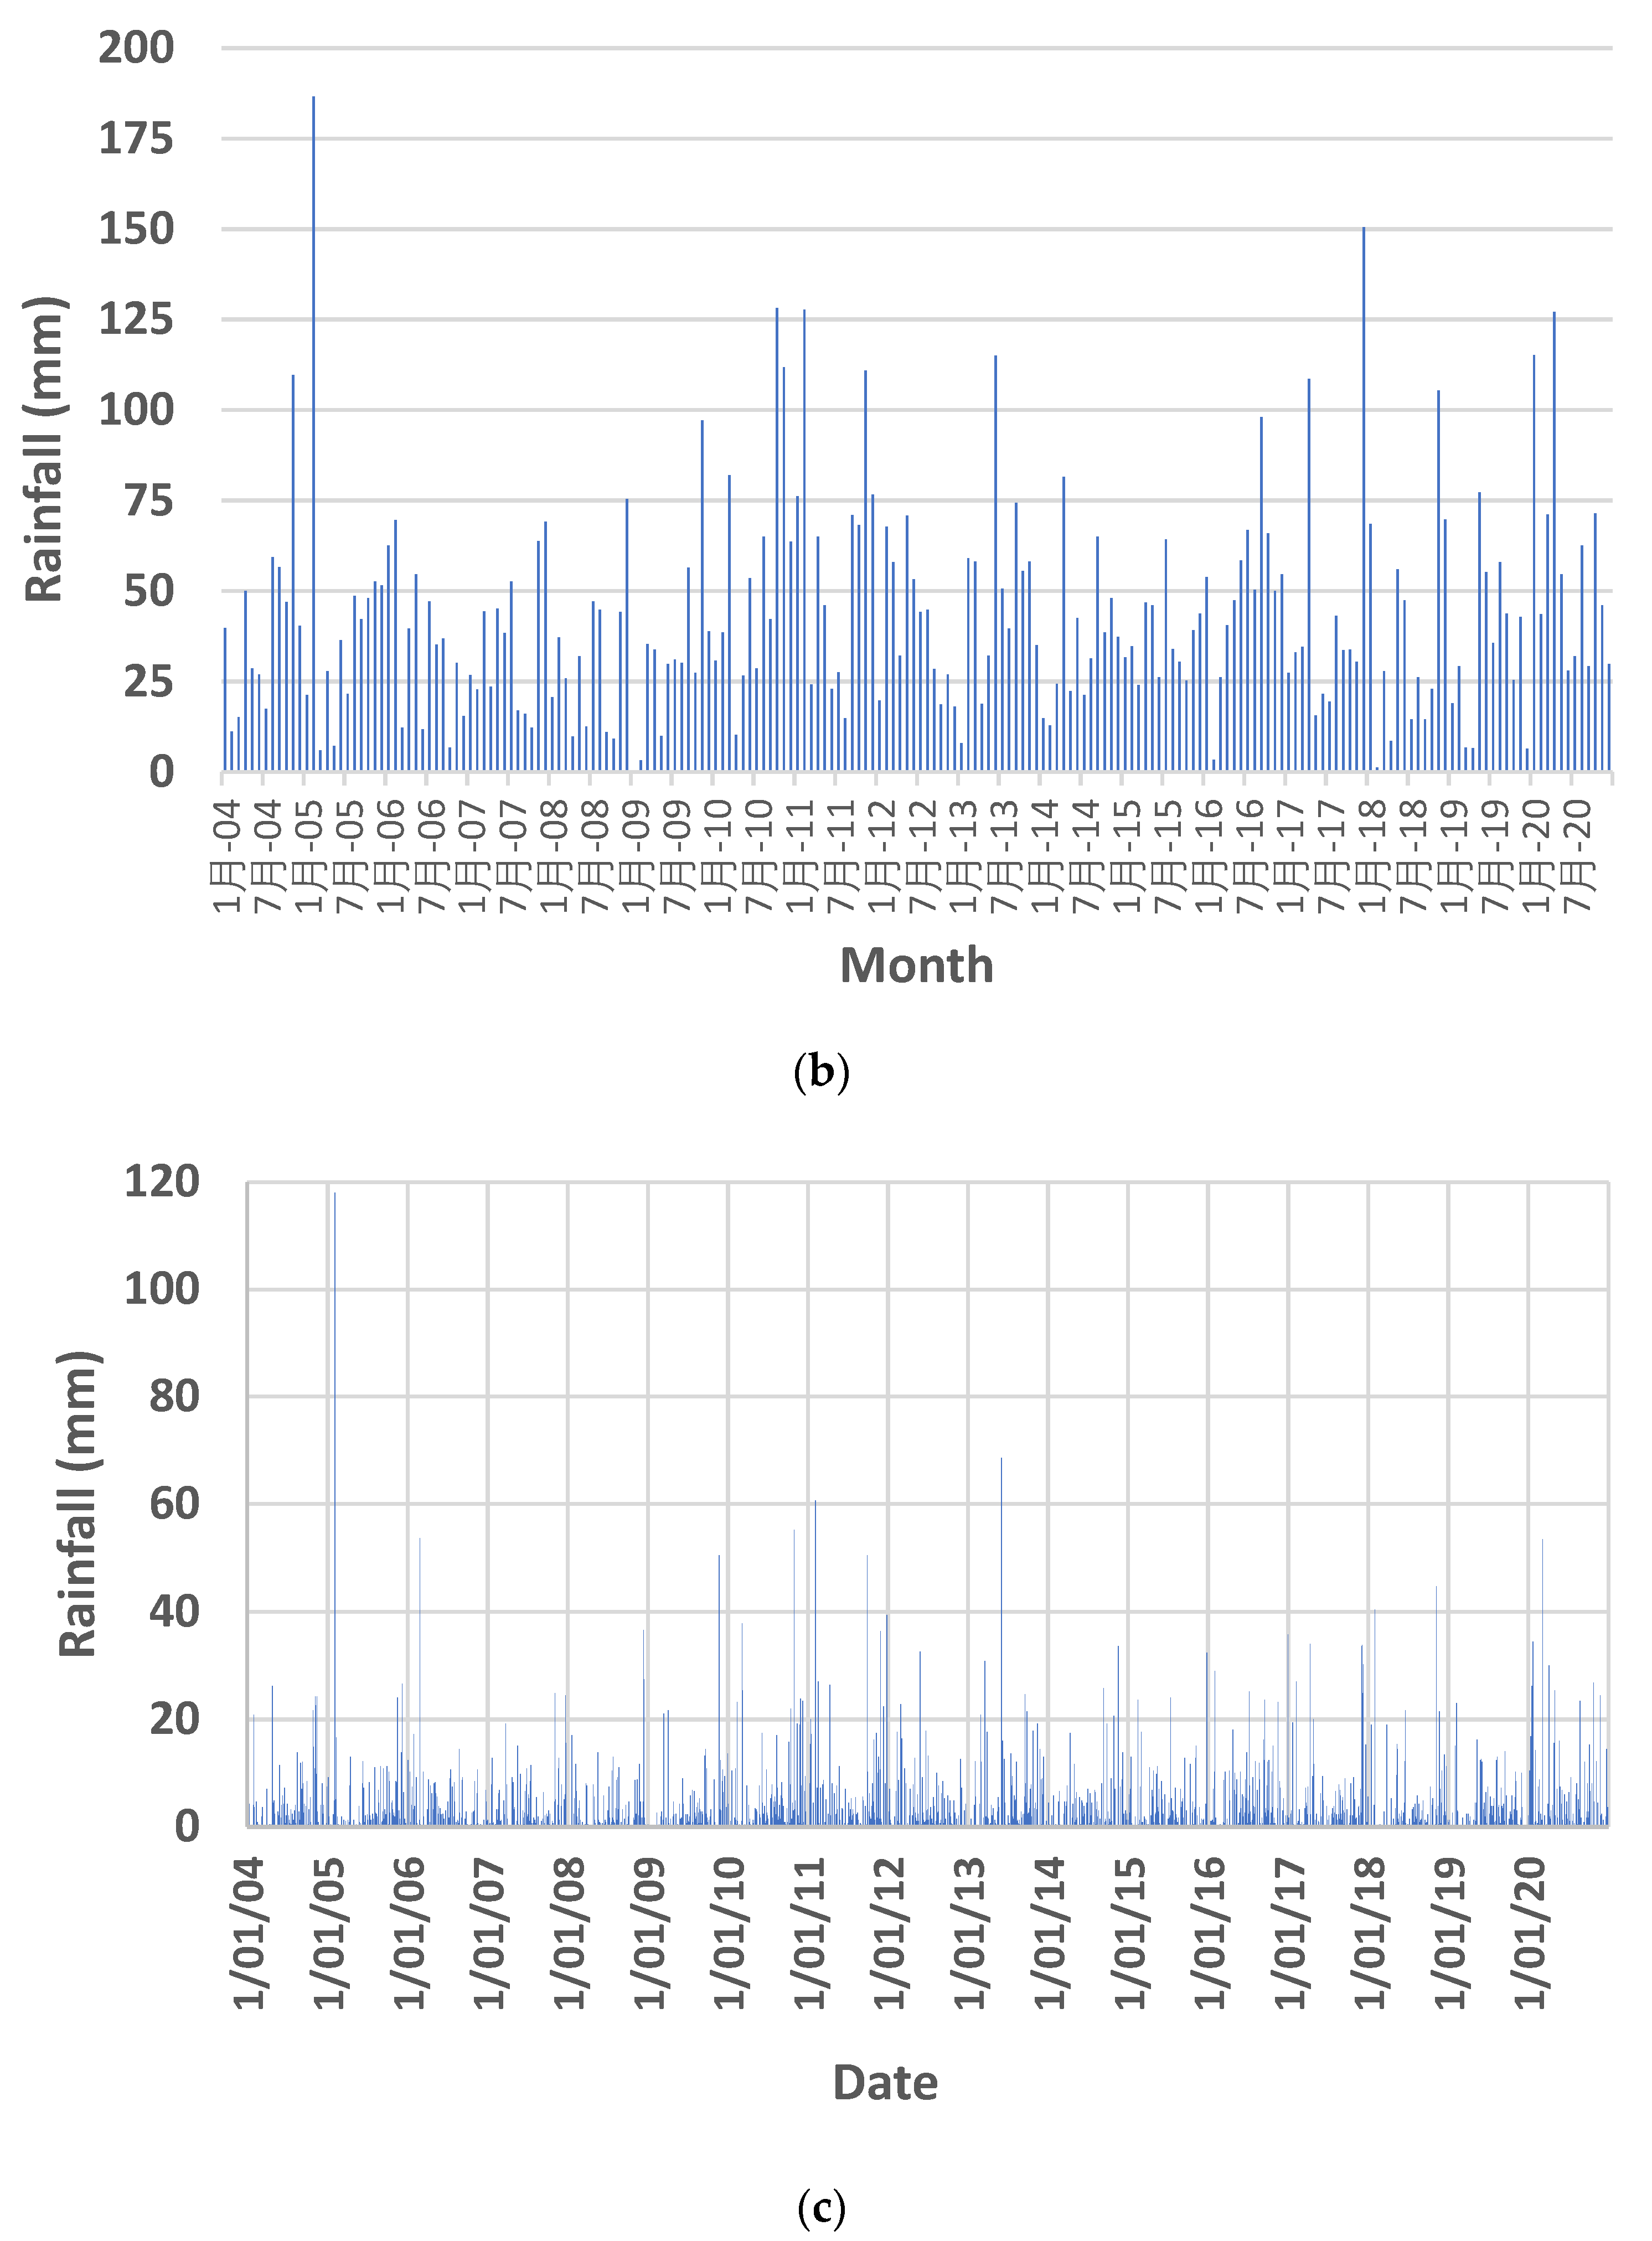
| Weather | Year | Annual Rainfall (mm) |
|---|---|---|
| Dry | 2019 | 406.0 |
| Average | 2017 | 551.6 |
| Wet | 2011 | 731.0 |
| Parameter | Value |
|---|---|
| Station latitude and longitude | 37.73° S and 144.91° N |
| Station elevation | 78 m |
| Historical mean annual rainfall | 587 mm |
| Highest annual rainfall | 817.9 mm |
| Lowest annual rainfall | 350.4 mm |
| Tank Size (kL) | Weather Condition | Daily YAS Model | 6-Hourly YAS Model | 6-Hourly YBS Model | Hourly Model | ||||
|---|---|---|---|---|---|---|---|---|---|
| Daily Demand (L/day) | Daily Demand (L/day) | Daily Demand (L/day) | Daily Demand (L/day) | ||||||
| 300 | 400 | 300 | 400 | 300 | 400 | 300 | 400 | ||
| 2 | Dry | 45.2 | 31.5 | 50.1 | 37.8 | 50.5 | 38.6 | 50.8 | 39.4 |
| 2 | Avg | 48.5 | 35.3 | 54.2 | 41.0 | 54.5 | 41.4 | 56.0 | 43.8 |
| 2 | Wet | 57.3 | 42.2 | 63.2 | 49.6 | 63.8 | 50.3 | 64.3 | 52.2 |
| 5 | Dry | 60.3 | 43.0 | 62.9 | 47.3 | 63.0 | 47.3 | 63.3 | 48.8 |
| 5 | Avg | 60.0 | 44.9 | 64.3 | 48.8 | 64.5 | 49.0 | 65.6 | 52.6 |
| 5 | Wet | 71.8 | 57.8 | 75.2 | 62.7 | 75.4 | 63.1 | 75.7 | 65.0 |
| 10 | Dry | 65.2 | 44.7 | 66.7 | 48.6 | 66.7 | 48.6 | 67.3 | 50.5 |
| 10 | Avg | 65.2 | 49.6 | 69.3 | 53.6 | 69.4 | 53.7 | 70.1 | 56.1 |
| 10 | Wet | 80.3 | 66.9 | 82.7 | 69.8 | 82.7 | 69.9 | 83.0 | 71.4 |
Disclaimer/Publisher’s Note: The statements, opinions and data contained in all publications are solely those of the individual author(s) and contributor(s) and not of MDPI and/or the editor(s). MDPI and/or the editor(s) disclaim responsibility for any injury to people or property resulting from any ideas, methods, instructions or products referred to in the content. |
© 2023 by the authors. Licensee MDPI, Basel, Switzerland. This article is an open access article distributed under the terms and conditions of the Creative Commons Attribution (CC BY) license (https://creativecommons.org/licenses/by/4.0/).
Share and Cite
Imteaz, M.A.; Ahmad, H.; Hossain, I. Pioneer Use of Pseudo Sub-Daily Timestep Model for Rainwater Harvesting Analysis: Acceptance over Hourly Model and Exploring Accuracy of Different Operating Algorithms. Sustainability 2023, 15, 3870. https://doi.org/10.3390/su15053870
Imteaz MA, Ahmad H, Hossain I. Pioneer Use of Pseudo Sub-Daily Timestep Model for Rainwater Harvesting Analysis: Acceptance over Hourly Model and Exploring Accuracy of Different Operating Algorithms. Sustainability. 2023; 15(5):3870. https://doi.org/10.3390/su15053870
Chicago/Turabian StyleImteaz, Monzur A., Hassaan Ahmad, and Iqbal Hossain. 2023. "Pioneer Use of Pseudo Sub-Daily Timestep Model for Rainwater Harvesting Analysis: Acceptance over Hourly Model and Exploring Accuracy of Different Operating Algorithms" Sustainability 15, no. 5: 3870. https://doi.org/10.3390/su15053870