

Measurement of Indoor Thermal Environment and Analysis of Heating Energy Saving in Residential Buildings in Ulaanbaatar, Mongolia

Abstract
:1. Introduction
1.1. Background
1.2. Issue Statement
- The heating season in Mongolia spans eight months, lasting from 15 September to 15 May next year. During this period, the country experiences more than 6200 heating degree days on average.
- The most common type of apartment buildings in Mongolia were constructed during the 1970s and the 1980s using ore-cast panels (426 in the capital city). However, these buildings have a high rate of heat loss and increased energy consumption, reaching 600 kWh/m2 during the heating season.
- The heating consumption in other reinforced concrete, brick and block buildings reached 400 kWh/m2.
- The heat distribution network has low efficiency.
- The government does not subsidize energy costs or payments based on the heating demand. Consequently, sectors that are considered high-risk are likely to experience a significant increase in heating costs.
- The primary heating sources are from coal-fired power plants with low heat efficiency.
1.3. Research Purpose
2. Literature Review of Related Works
- Save energy by enhancing energy efficiency;
- Establish and expand a national electronic information system for consumers to provide information that promotes energy savings and efficient use;
- Identify the allowable limits for heat loss coefficients in buildings based on weather conditions;
- Conduct energy audits of commissioned apartment buildings;
- Improve construction standards and normative documents regarding energy saving and align them with international standards;
- Identify buildings in need of insulation and gradually reduce heat loss by 20%.
3. Methodology
3.1. Questionnaire Survey
3.2. Field Measurement
3.3. Calculation of the Ventilation Rate
3.4. Calculation of the Heat Loss Coefficient
4. Results
4.1. Outline of Investigated Apartments
4.2. Meteorological Data in Ulaanbaatar
4.3. Measurement Results
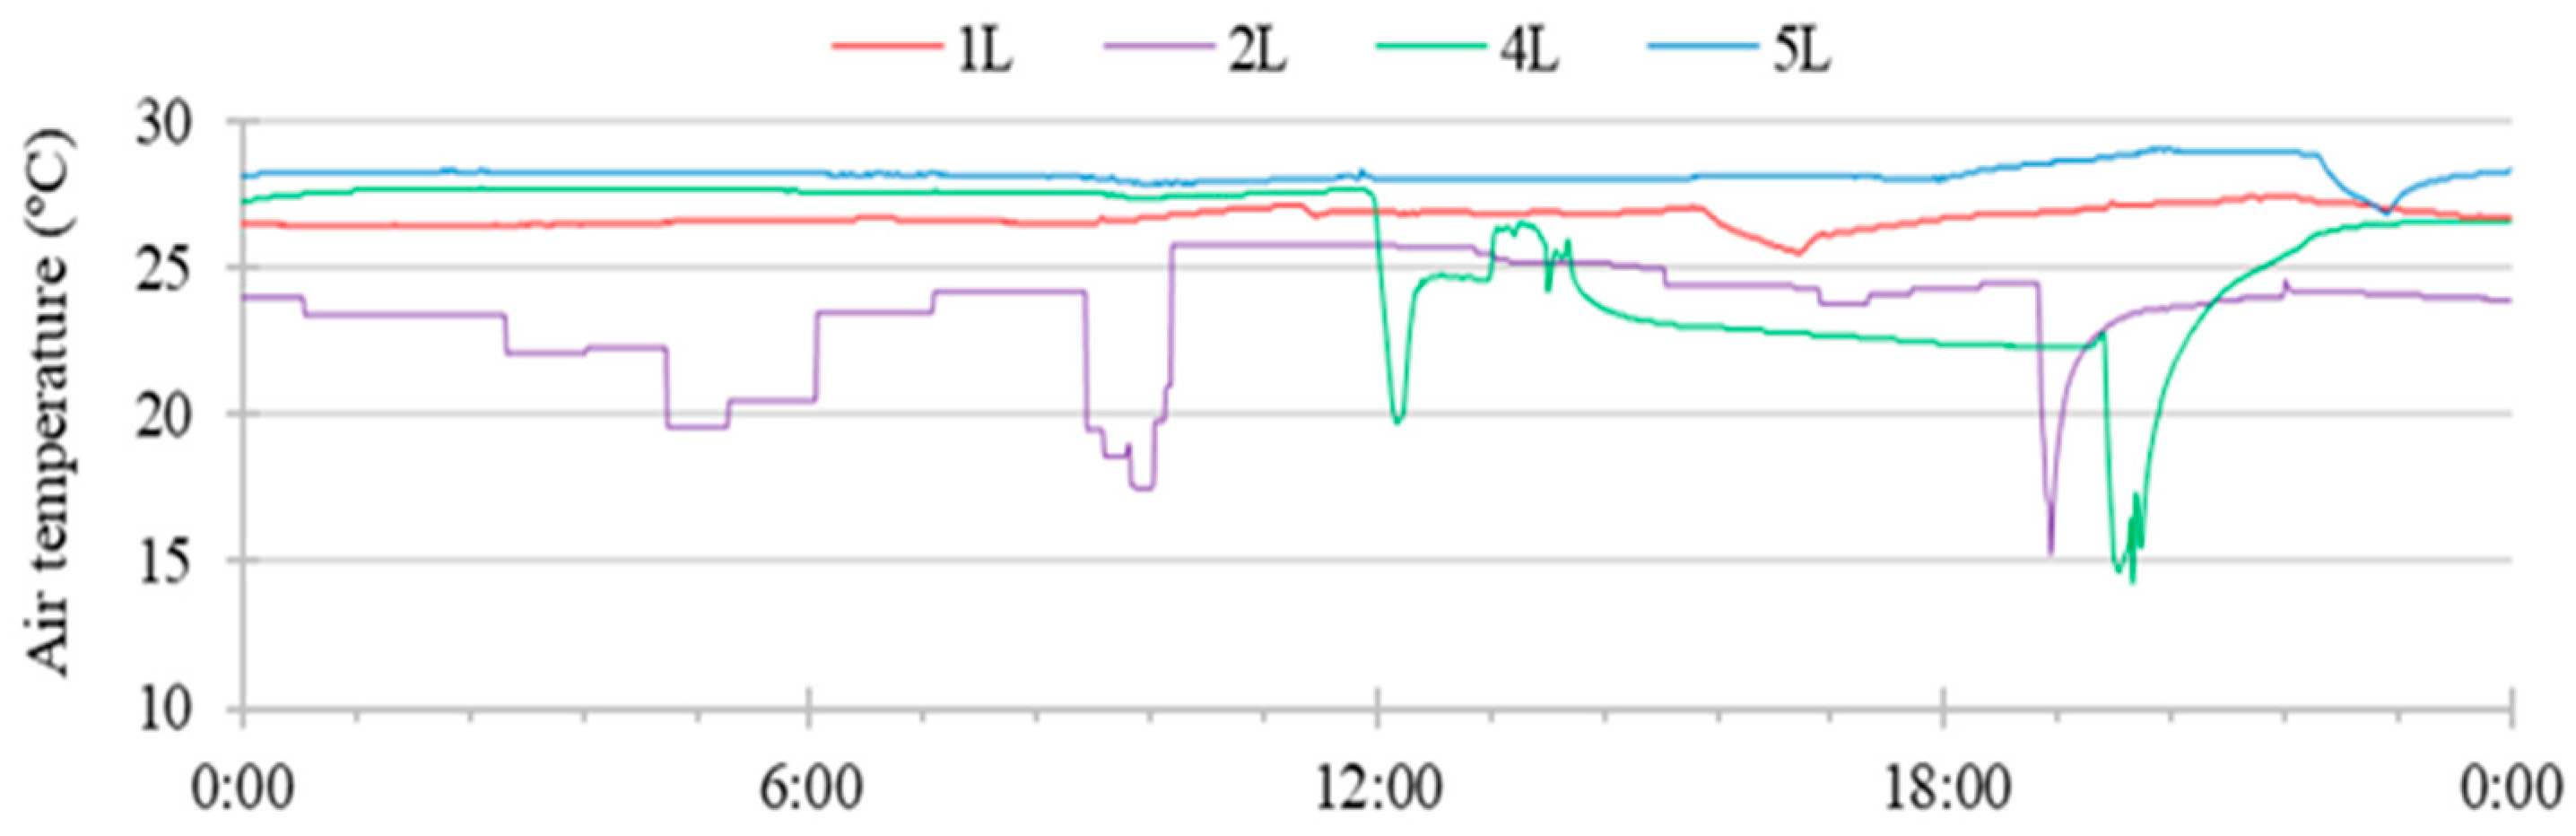
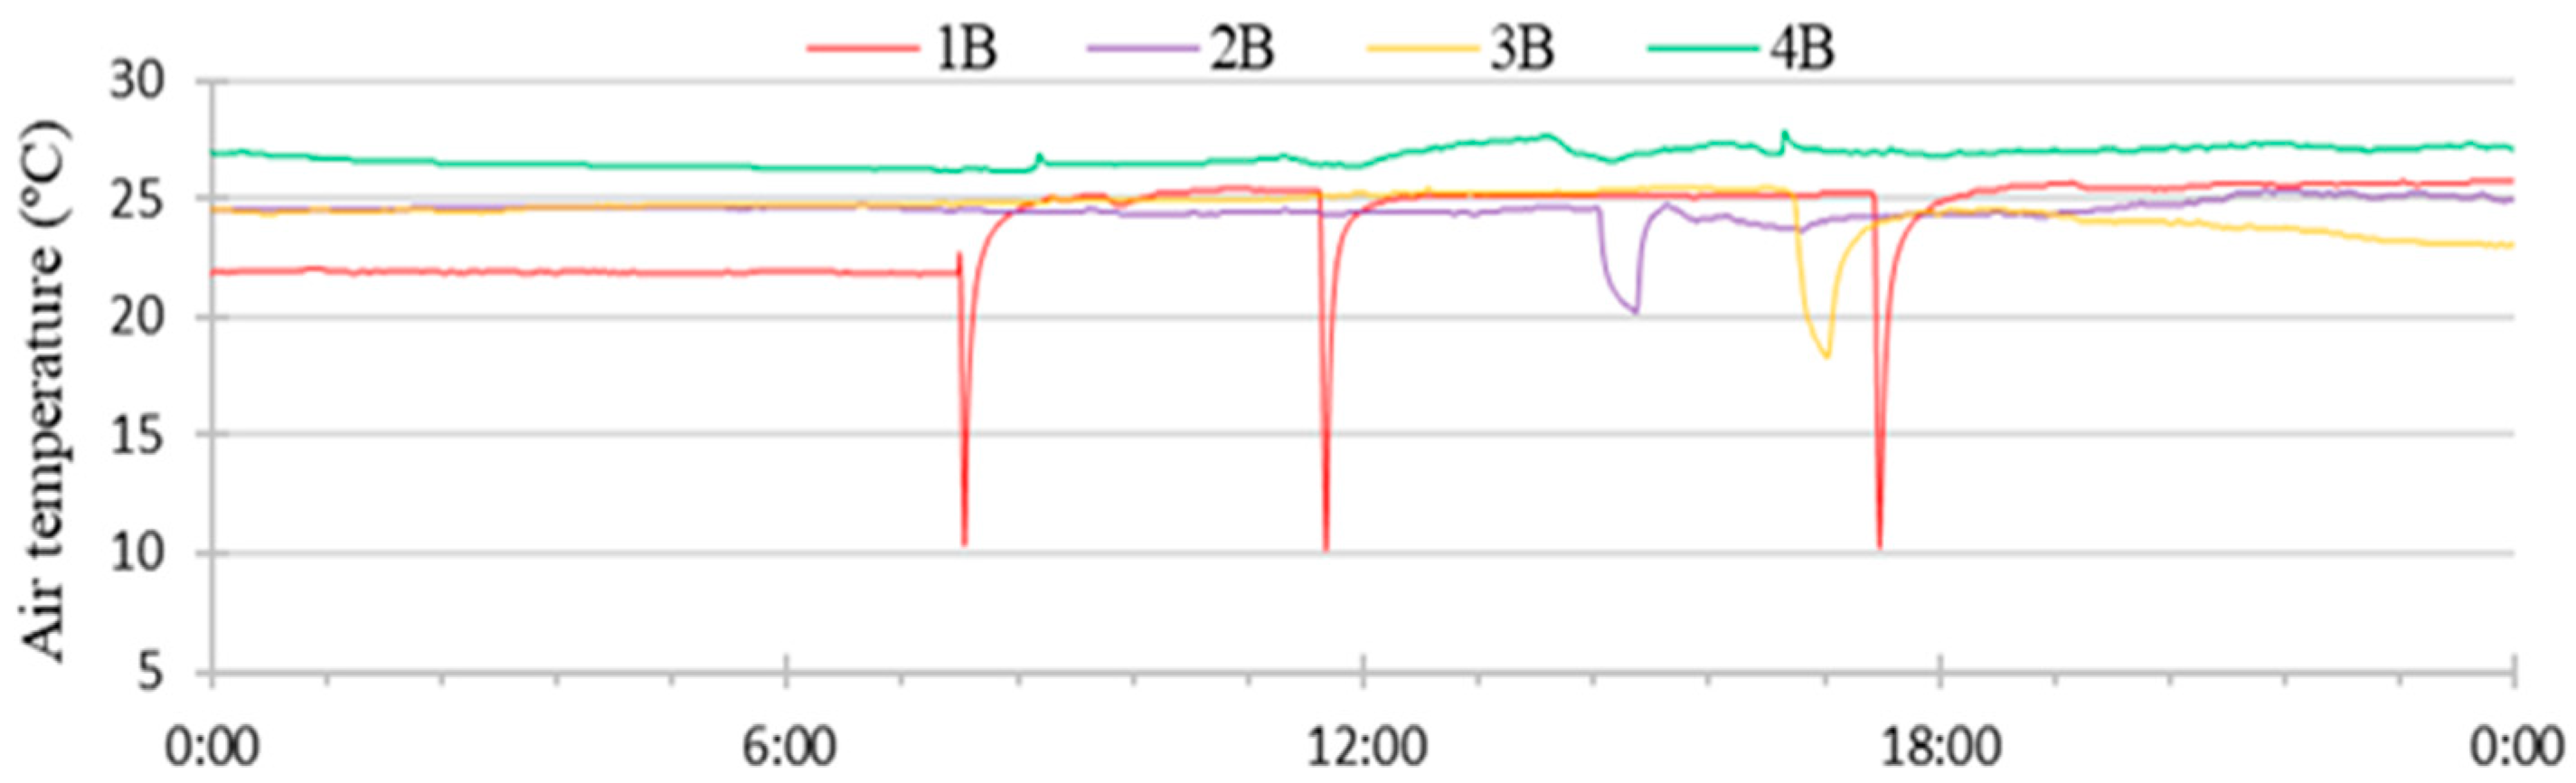
4.3.1. Indoor Air Temperature
4.3.2. Indoor Relative Humidity
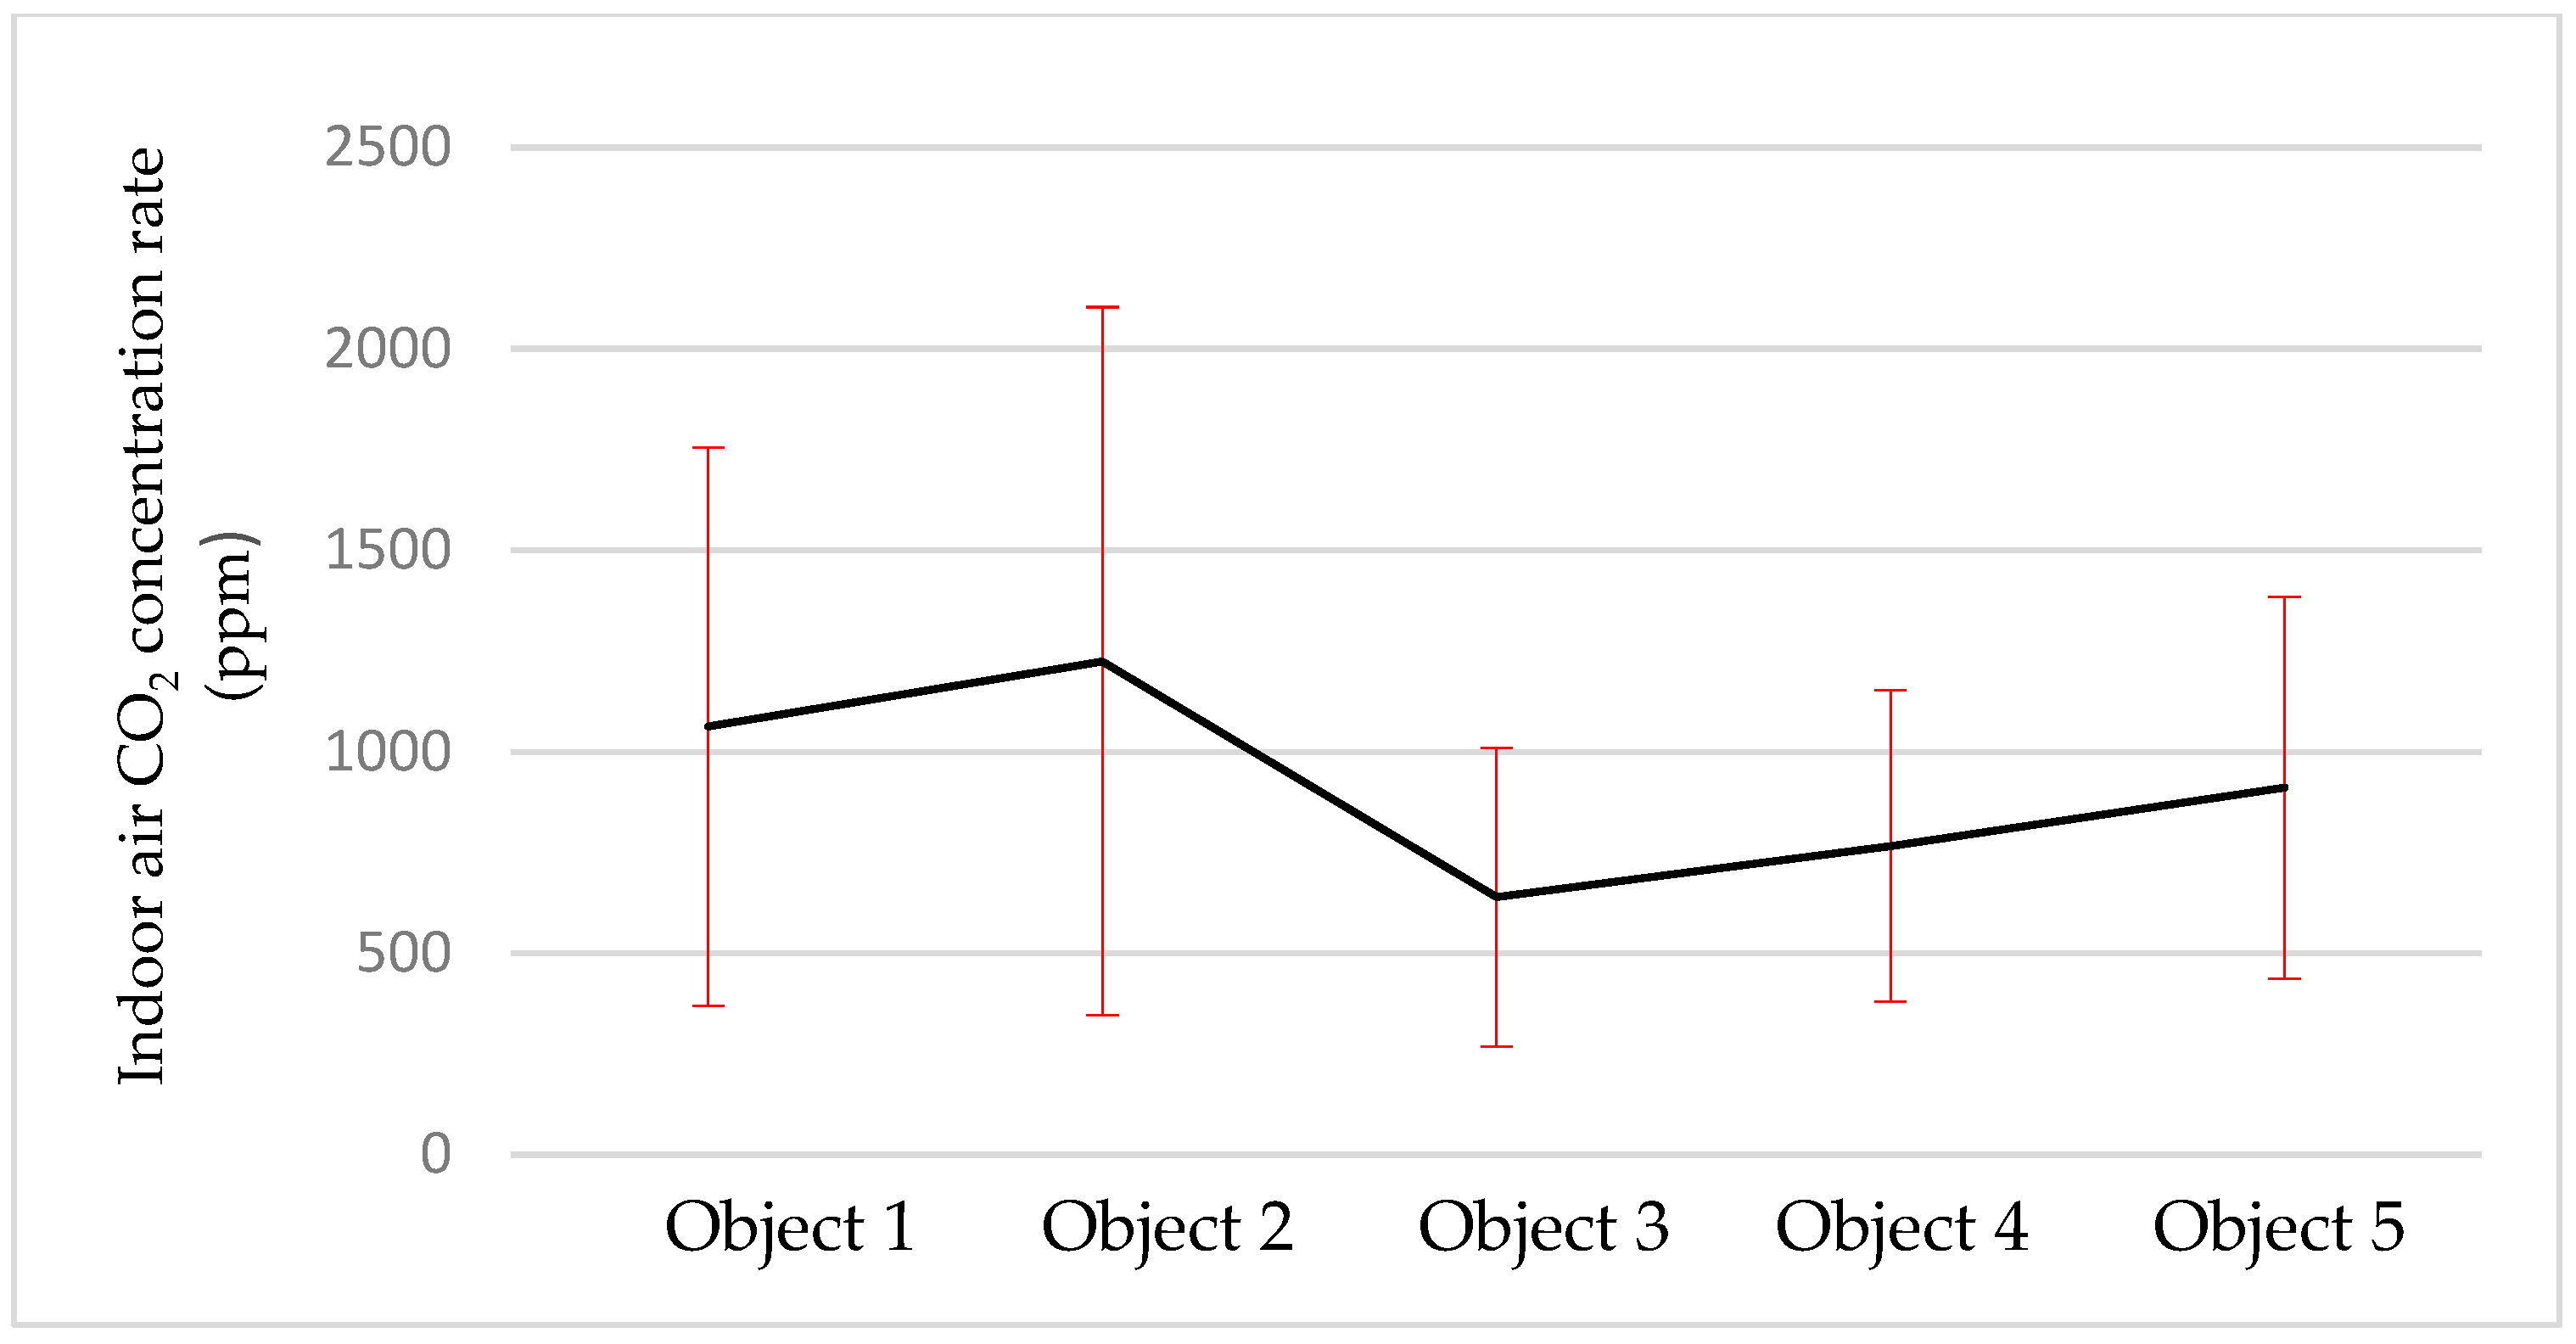
4.4. Air Change Rate
4.5. Estimation of the Heat Loss Coefficient
4.6. Analysis of Building Individual Heat Load Modeling
Analysis of Statistical Results
5. Discussion
5.1. Comparison with Previous Studies
5.2. Limitations of the Study
6. Conclusions
Author Contributions
Funding
Institutional Review Board Statement
Informed Consent Statement
Data Availability Statement
Conflicts of Interest
References
- Statistics Department of Ulaanbaatar. Ulaanbaatar City Statistical 2018. Available online: http://ubstat.mn/StatTable=20 (accessed on 20 January 2022).
- Home Mortgage Corporation. Statistical Office: Housing Supply for the Population of Ulaanbaatar City. Ulaanbaatar. 2012–2013. Available online: https://hmc.mn/oron-suuts-medeelel/v/50 (accessed on 10 May 2023).
- Delgertsogt, D.; Purevdorj, G.; Khaidav, R. Sustainable Development Strategy of District Heating Network in Ulaanbaatar. Ulaanbaatar 2017. Available online: http://mongolenergy.mn/images/medeelel/strategy.pdf (accessed on 14 June 2017).
- Mongolian Ministry of Energy. Production Data of Energy Sector. Ulaanbaatar 2017. Available online: https://www.energy.gov.mn/c/1447 (accessed on 10 May 2023).
- National Statistics Office of Mongolia. 2015 Population and Housing by Census of Mongolia. Ulaanbaatar 2015. Available online: http://www.en.nso.mn/content/166 (accessed on 25 August 2018).
- Energy Regulatory Commission. Available online: https://erc.gov.mn/web/en/contents/19 (accessed on 25 August 2018).
- Ulaanbaatar Heat Distribution Network. Analysis of Building Heat Loss and the Possibility of Reducing Air Pollution; Ulaanbaatar Heat Distribution Network: Ulaanbaatar, Mongolia, 2014. [Google Scholar]
- 2.01.03-92; Ministry of Urban Development, Building Norm Standart. Ulaanbaatar Press: Ulaanbaatar, Mongolia, 1997.
- Energy Regulatory Authority of Mongolia. National Project of Energy Saving. Available online: http://erc.gov.mn/index.php?newsid=654 (accessed on 22 December 2017).
- Satu, P.; Asa, H.; Rinat, A.; Ha, H.; Mari, S.; Malin, M. Energy saving potentials of Moscow apartment buildings in resdiental districts. Energy Build. 2013, 66, 706–713. [Google Scholar]
- Mandakh, S. Research on Air Pollution Prevention and Control in Ulaanbaatar, Mongolia; Liaoning University: Shenyang, China, 2014. [Google Scholar]
- Khandjamts, B. Research on Space Characteristics and Optimal Design of Traditional Residential Buildings in Ulaanbaatar Based on Adapting to Regional Life; South China University of Technology: Guangzhou, China, 2018. [Google Scholar]
- Suguru, E. Study on indoor thermal environment and energy consumption for heating in Ulan Bator, Mongolia. In Proceedings of the 2014 Annual Meeting of Hokkaido Chapter, Ulaanbaatar, Mongolia, 2014; Volume 87, pp. 203–206. Available online: https://jglobal.jst.go.jp/detail?JGLOBAL_ID=201802210489204370 (accessed on 30 May 2018).
- Bilguun, B.; Qingyuan, Z. Indoor environments and energy consumption of dwellings in Ulaanbaatar, Mongolia. J. Environ. Eng. 2018, 83, 443–451. [Google Scholar]
- Ozarisoy, B.; Altan, H. Significance of occupancy patterns and habitual household adaptive behaviour on home-energy performance of post-war social-housing estate in the South-eastern Mediterranean climate: Energy policy design. Energy 2022, 244, 122904. [Google Scholar] [CrossRef]
- Ozarisoy, B.; Altan, H. Bridging the energy performance gap of social housing stock in south-eastern Mediterranean Europe: Climate change and mitigation. Energy Build. 2022, 258, 111687. [Google Scholar] [CrossRef]
- Pawel, M. Allocation of heating costs with consideration to energy transfer from adjacent apartments. Energy Build. 2017, 139, 224–231. [Google Scholar]
- Alexander, S.G.; Darya, V.N.; Nikolay, I.V. Energy Efficiency of Enclosing Structures during Overhaul. Construction of Unique Buildings and Structures. 2013. Available online: https://unistroy.spbstu.ru/en/article/2013.12.7/ (accessed on 10 May 2023).
- D’Ambrosio Alfano, F.R.; Bellia, L.; Boerstra, A.; van Dijken, F.; Ianniello, E.; Lopardo, G.; Minichiello, F.; Romagnoni, P.; Gameiro da Silva, M.C. REHVA Guidebook No 13—Indoor Environment and Energy Efficiency in Schools—Part 1: Principles, Principles: REHVA. 2015. Available online: https://www.rehva.eu/eshop/detail/indoor-environment-and-energy-efficiency-in-educational-buildings (accessed on 10 May 2023).
- Mongolian Statistical Information Service Average Air Temperature, by Station, by Month, Year 2019–2020. Available online: https://www2.1212.mn/tables.aspx?tbl_id=DT_NSO_2400_022V2&13999001_select_all=0&13999001SingleSelect=_T1&AIMAG_CEN_select_all=0&AIMAG_CENSingleSelect=_5&YearM_select_all=0&YearMSingleSelect=_202012_202011_202010_202009_202008_202007_202006_202005_202004_202003_202002_202001_201912_201911_201910_201909_201908_201907_201906_201905_201904_201903_201902_201901&YearY_select_all=0&YearYSingleSelect=&viewtype=linechart (accessed on 15 October 2018).
- Mongolian Ministry of Urban Development. Mongolian Agency for Standardization and Metrology, MNS 4585:2007 Air Quality. Indoor Air temperature (in Mongolian). Ulaanbaatar 2007. Available online: http://greenassessment.mn/upload/files/20160623_MNS_45852016_%D0%90%D0%B3%D0%B0%D0%B0%D1%80%D1%8B%D0%BD_%D1%87%D0%B0%D0%BD%D0%B0%D1%80._%D0%A2%D0%B5%D1%85%D0%BD%D0%B8%D0%BA%D0%B8%D0%B9%D0%BD_%D0%B5%D1%80%D3%A9%D0%BD%D1%85%D0%B8%D0%B9_%D1%88%D0%B0%D0%B0%D1%80%D0%B4%D0%BB%D0%B0%D0%B3%D0%B0_.pdf (accessed on 20 December 2007).
- Mongolian Ministry of Urban Development. Mongolian Agency for Standardization and Metrology, MNS 5825:2007 Residential and Public. Indoor Micro Climate (in Mongolian). Ulaanbaatar 2007. Available online: https://estandard.gov.mn/standard/v/1148 (accessed on 20 December 2007).
- Information and Research Institute of Meteorology, Hydrology and Environment. Available online: irimhe.namem.gov.mn (accessed on 10 June 2019).
- ISO7730:2005; Ergonomics of the Thermal Environment Analytical Determination and Interpretation of Thermal Comfort Using Calculation of the PMV and PPD Indices and Local Thermal Comfort Criteria. International Organization for Standardization: Geneva, Switzerland, 2005.


| Sensor Model | Measurement Parameter | Accuracy |
|---|---|---|
| HIOKI-LR5001 | Temperature (°C) | ±0.5 °C |
| Relative humidity (%) | ±5% |
| Object | Floor Area (m2) | Location Floor/Total Story | Orientation of the Main Windows | Built Year | Building View Structure Type | |
|---|---|---|---|---|---|---|
| 1 | 68.9 | 6/10 | E | 2012 |  | Block-filled and insulated |
| 2 | 53.5 | 8/9 | W | 2013 |  | Fully cast reinforced concreteand insulated |
| 3 | 49.9 | 6/10 | N | 2016 |  | Reinforced concrete, insulated |
| 4 | 58.5 | 4/6 | S | 2012 |  | Brick-filling and insulated |
| 5 | 35 | 3/10 | W | 2012 |  | Brick-filled and insulated |
| Object | Area m2 | Exterior Wall Area m2 | Heat Conduction Coefficient | Leakage Heat Loss Coefficient | Air Ventilation Rate | Ventilation Heat Loss Coefficient |
|---|---|---|---|---|---|---|
| Object 1 | 68.9 | 12.2 | 0.195 | 0.039 | 65.2 | 1.167 |
| Object 2 | 43.5 | 9.3 | 0.178 | 0.036 | 71.8 | 1.656 |
| Object 3 | 49.9 | 8.5 | 0.199 | 0.040 | 53.0 | 1.310 |
| Object 4 | 58.5 | 14.5 | 0.202 | 0.040 | 58.3 | 1.229 |
| Object 5 | 35.0 | 6.3 | 0.137 | 0.027 | 46.5 | 1.639 |
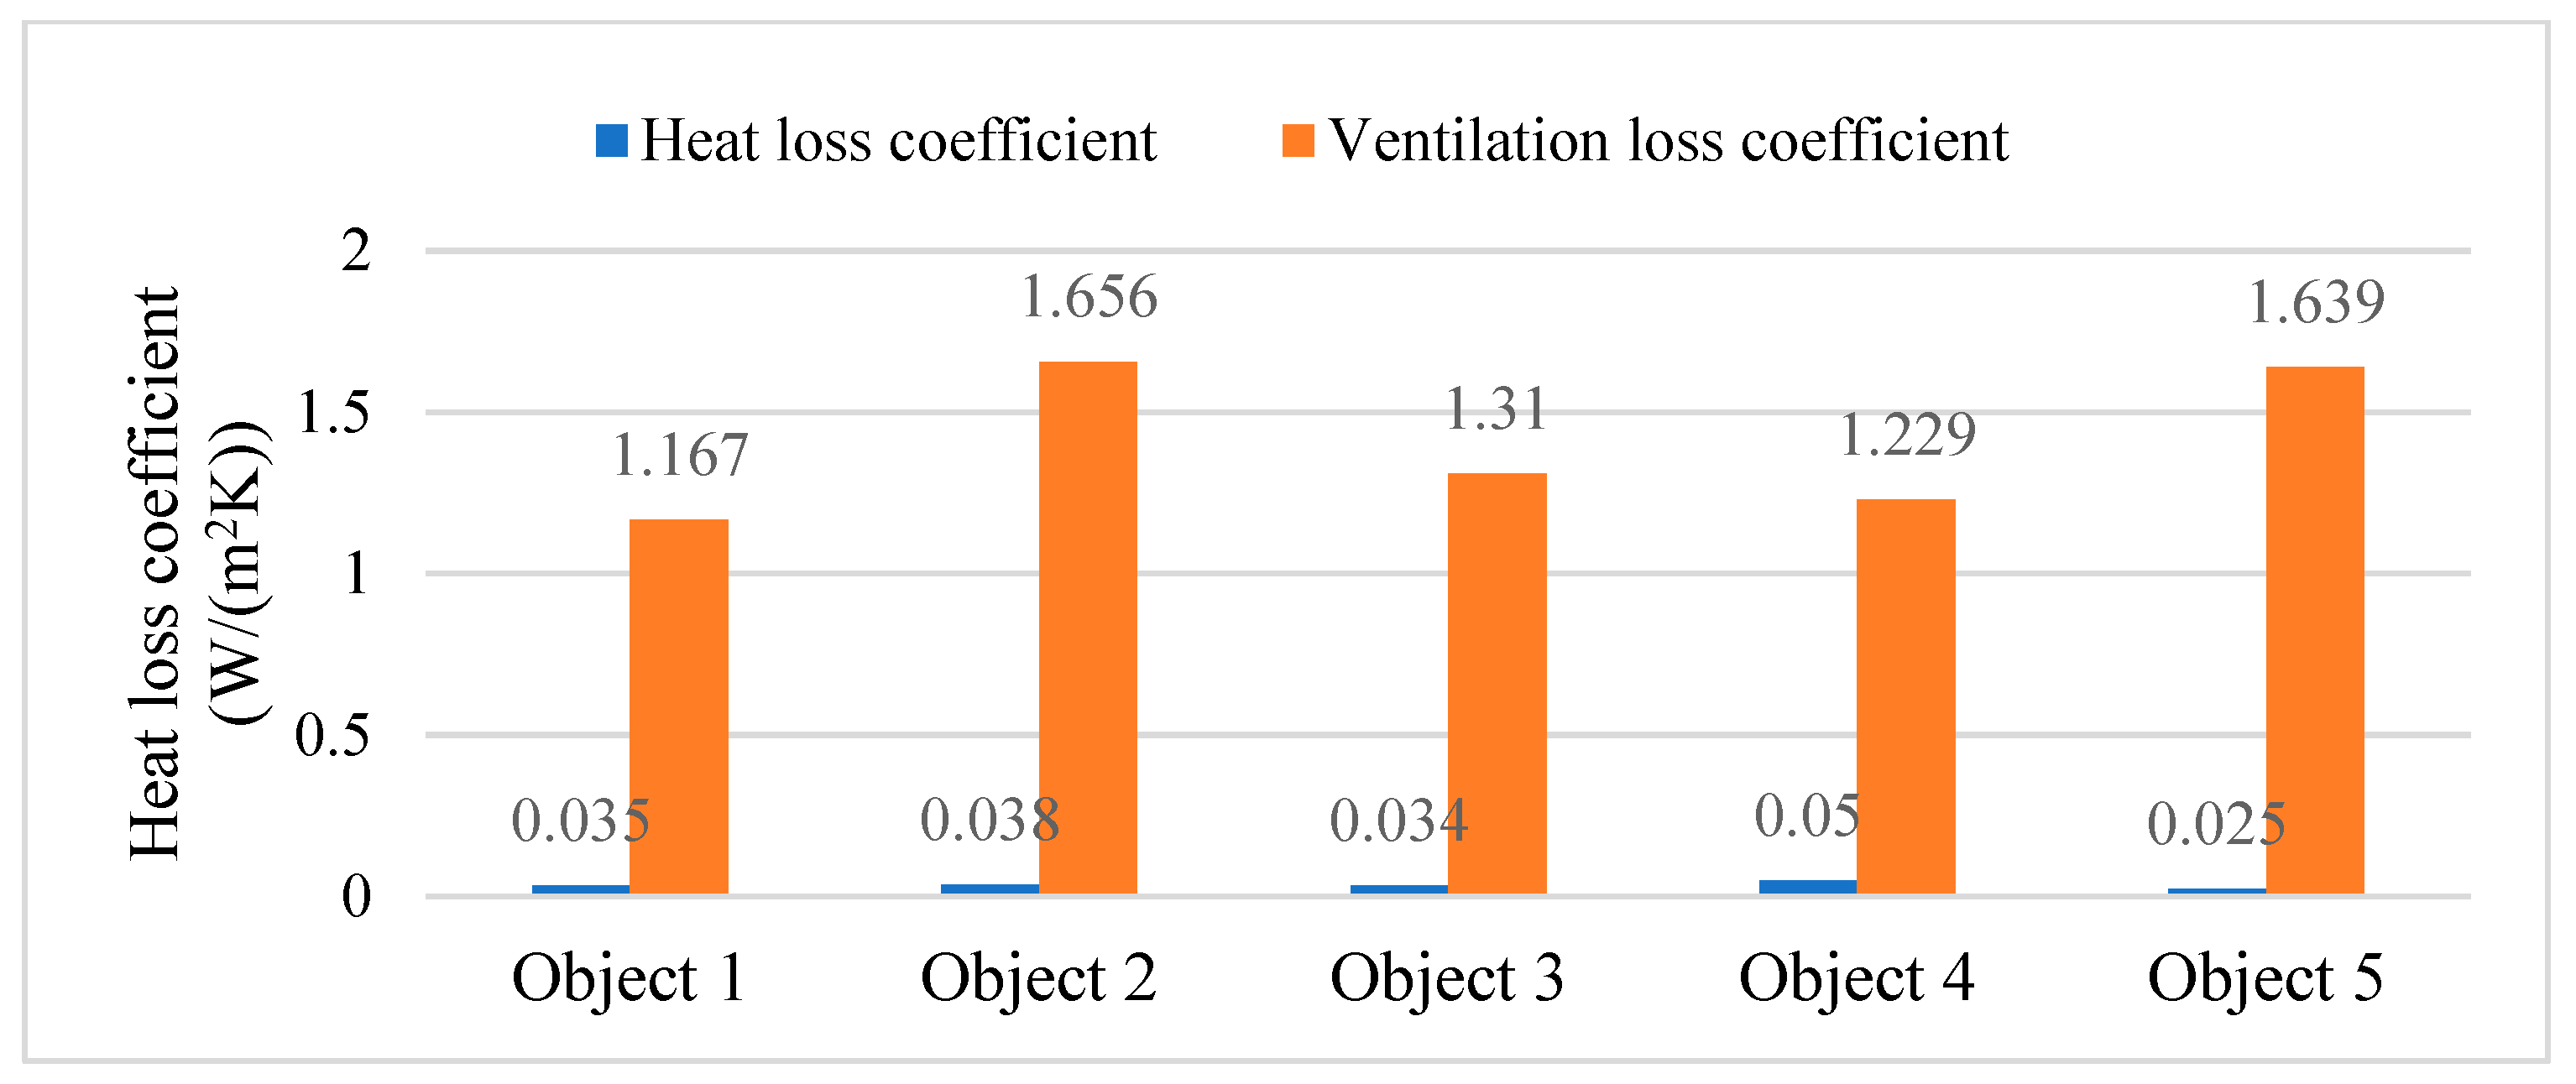
| Object | Area m2 | Heat Loss Coefficient | Ventilation Heat Loss Coefficient | Empiric Heat Loss Coefficient |
|---|---|---|---|---|
| Object 1 | 68.9 | 0.035 | 1.167 | 1.202 |
| Object 2 | 43.5 | 0.038 | 1.656 | 1.694 |
| Object 3 | 49.9 | 0.034 | 1.310 | 1.344 |
| Object 4 | 58.5 | 0.050 | 1.229 | 1.280 |
| Object 5 | 35.0 | 0.025 | 1.639 | 1.663 |
| Correlation Matrix | ||||||
|---|---|---|---|---|---|---|
| Object | 1 | 2 | 3 | 4 | 5 | |
| Correlation | Air ventilation | 1.000 | ||||
| Insulation | 0.024 | 1.000 | ||||
| Indoor temperature | 0.135 | 0.062 | 1.000 | |||
| Windows type | 0.078 | 0.054 | 0.099 | 1.000 | ||
| Windows direction | 0.096 | 0.113 | 0.114 | −0.013 | 1.000 | |
| Heat loss | 0.561 | 0.217 | 0.396 | 0.348 | 0.368 | |
| Sig. (1-tailed) | Air ventilation | |||||
| Insulation | 0.027 | |||||
| Indoor temperature | 0.028 | 0.000 | ||||
| Windows type | 0.020 | 0.046 | 0.049 | |||
| Windows direction | 0.001 | 0.003 | 0.014 | 0.765 | ||
| Heat loss | 0.044 | 0.000 | 0.000 | 0.000 | 0.000 | |
| Total Variance Explained | ||||||
|---|---|---|---|---|---|---|
| Component | Initial eigenvalues | Extraction sums of squared loadings | ||||
| Total | % of Variance | Cumulative % | Total | % of Variance | Cumulative % | |
| Air ventilation | 2.766 | 30.097 | 30.097 | 2.766 | 30.097 | 2.766 |
| Insulation | 1.045 | 26.699 | 56.796 | 1.045 | 56.796 | 1.045 |
| Indoor temperature | 0.867 | 25.728 | 82.524 | |||
| Windows type | 0.575 | 8.252 | 90.777 | |||
| Windows direction | 0.482 | 2.913 | 93.689 | |||
| Other | 0.264 | 6.311 | 100.000 | |||
Disclaimer/Publisher’s Note: The statements, opinions and data contained in all publications are solely those of the individual author(s) and contributor(s) and not of MDPI and/or the editor(s). MDPI and/or the editor(s) disclaim responsibility for any injury to people or property resulting from any ideas, methods, instructions or products referred to in the content. |
© 2023 by the authors. Licensee MDPI, Basel, Switzerland. This article is an open access article distributed under the terms and conditions of the Creative Commons Attribution (CC BY) license (https://creativecommons.org/licenses/by/4.0/).
Share and Cite
Batsumber, Z.; He, J. Measurement of Indoor Thermal Environment and Analysis of Heating Energy Saving in Residential Buildings in Ulaanbaatar, Mongolia. Sustainability 2023, 15, 10598. https://doi.org/10.3390/su151310598
Batsumber Z, He J. Measurement of Indoor Thermal Environment and Analysis of Heating Energy Saving in Residential Buildings in Ulaanbaatar, Mongolia. Sustainability. 2023; 15(13):10598. https://doi.org/10.3390/su151310598
Chicago/Turabian StyleBatsumber, Zolsaikhan, and Jiang He. 2023. "Measurement of Indoor Thermal Environment and Analysis of Heating Energy Saving in Residential Buildings in Ulaanbaatar, Mongolia" Sustainability 15, no. 13: 10598. https://doi.org/10.3390/su151310598