Article

The Impact of Green Technology Investment Levels on Competitive Supply Chain Integration Decisions

1
School of Economics and Management, Beijing Jiaotong University, Beijing 100044, China
2
School of Economics and Management, Inner Mongolia Agricultural University, Hohhot 010010, China
3
School of Management, Wuhan Polytechnic University, Wuhan 430048, China
*
Author to whom correspondence should be addressed.
Sustainability 2023, 15(13), 10386; https://doi.org/10.3390/su151310386
Submission received: 11 May 2023 / Revised: 22 June 2023 / Accepted: 26 June 2023 / Published: 30 June 2023

Abstract

:
The current study focuses on vertical supply chain integration, with a special emphasis on the competitive environment of green investment markets and green investments. The current study investigates the relationship between the final product’s green service level and integration and non-integration methods within two separate supply chain models, namely the Nash competition and Stackelberg game models. To attain its goals, the study utilises an inverse derivation technique and comparative analysis. The current study investigates the best integration approach depending on the level of environmental investment in the supply chain’s final product. The findings revealed that the inter-chain rivalry in green investment and the sensitivity coefficient associated with green investment impacted the integration decisions of competing chains in the Nash competition. Furthermore, when the coefficient of the sensitivity to green investment was greater than 0.375, the choice to integrate logistics service supply chains in a horizontal Nash competition was independent of the amount of service competition intensity. In such cases, taking a different strategy than the rival chain might potentially increase the grade of eco-friendly services provided by one’s own chain.

1. Introduction

In recent years, environmental issues such as atmospheric pollution and resource depletion have become forefront societal concerns and their environmental threats are enormous [1]. Then, the concept of green development became widely accepted by the public. For manufacturers in the supply chain, producing and developing green products and investing in green innovation technologies can improve their brand, meet consumers’ green needs, further enhance their competitiveness, and help them save costs and improve their efficiency in the long term [2,3]. When manufacturers face competition between supply chains, they seek vertical integration within the supply chain to enhance the overall competitiveness of the supply chain.
With the advent of the low-carbon economy, consumers increasingly demand higher levels of green products, showing high purchase intentions and paid prices, affecting the supply chain operation [4,5]. Supply chain participants must face the changes in the consumer market and make green technology investments to enhance the effectiveness of both the forward and reverse supply chains [6]. In turn, green technology investment is defined as the expenditure of capital, knowledge, and other resources for acquiring or effectively using technologies related to waste product recycling, energy conservation, green product design, pollution prevention, and environmental management [7]. For example, Apple invested in and applied green manufacturing technologies to help reduce the environmental impact of its production, reducing carbon emissions associated with aluminum metals by more than 72% by 2022. Siemens announced a $110 million investment to reduce corporate carbon emissions. In addition, the government has also actively developed policies to support manufacturers’ green technology investment activities. For example, Vietnam explicitly stated that green technology investment is encouraged and supported and must be adopted for recognition as a high-tech enterprise. Investment in green technology is critical for companies and governments.
The degree of competition has intensified, and competition is not limited to business-to-business. Instead, it has expanded to competition between supply chains [8]. There may be competition between horizontal chains in terms of multiple factors such as price and services [9]. Then, in the era of green development, competition between supply chains also faces the level of investment in green technology. This competition affects consumers’ willingness to purchase goods and services, which in turn affects the profit of the supply chain. Therefore, how companies within the supply chain make decisions to counter the threat of horizontal supply chains and improve the overall efficiency of the supply chain is an important issue.
Supply chain integration is defined as the strategic collaboration between supply chain partners and the coordinated management of inter-organisational operational activities, including information and joint decision-making in functional areas [10]. For example, Huawei actively established strategic alliances with downstream retailers, including distribution agreements with two Australian companies, CertaOne and Madison Technologies. Belle Group quickly integrated its online sales channels with the acquisition of Youbao.com when the dominance of traditional sales channels was threatened. Therefore, integration between companies within the supply chain is occurring through models such as collaborative sales, collaborative promotion, and collaborative investment in production to counter the threat of external competition.
The pressing research inquiry pertains to the collaboration between manufacturers and supply chain participants in a competitive landscape that involves varying degrees of investment in environmentally friendly technology. The extant body of literature pertaining to competition among chains primarily focuses on price competition, with comparatively less attention being paid to the influence of competition on green technology investment within the context of green development. Consequently, drawing from prior research, our study centres on the coefficient of green investment sensitivity and the intensity of competition among logistics enterprises. Our primary research inquiries were as follows. (1) In the context of intense competition between chains, how can supply chain managers effectively implement strategies in the presence of varying degrees of sensitivity to green investments? (2) What is the effect of varying integration choices on the profitability of a firm’s own chain and that of rival chains? (3) When faced with low levels of inter-chain competition and varying degrees of sensitivity towards green investments, what strategies should supply chain managers employ? (4) What is the effect of varying integration choices on the profitability of both the individual chain and rival chains? Drawing from the aforementioned key inquiries, our analysis centres on the correlation between the integration determinations and the stakeholders’ financial gains within supply chains, as well as the most advantageous equilibrium approach. The paper makes a significant contribution by examining the supply chain integration decisions of core firms in various competitive environments in light of service providers’ investments in green technology in response to consumer demand for environmentally friendly products. In theoretical terms, the MATLAB version R2023a software was utilised to construct a theoretical model that generated undifferentiated curves representing equal decision benefit values. These curves were then combined with mathematical derivation and simplification to analyse the boundaries of the equilibrium conditions for a competitive chain. This analysis helped determine the optimal integration decision for the chain, considering the different integration choices. By employing a combination of graphical and mathematical solutions, this approach provided a more comprehensive and systematic analysis of the overall profit situation for two supply chain enterprises operating in a competitive environment with environmental benefits. In practical terms, the research investigates the significance of selecting an integration strategy for one’s own chain, considering the combined influence of the range of the green technology investment coefficients and the intensity of the competition between chains. By comparing the scenarios involving integration and non-integration, the study assesses the environmental benefits obtained by both the individual chain and competing chains. This analysis provides valuable insights into the selection of integration strategies for supply chain enterprises and their potential impacts on environmental outcomes.
The succeeding segments of the manuscript are organised in the subsequent fashion. Section 2 presents a succinct summary of the relevant literature. In Section 3, the models, notation, and assumptions are presented, along with an overview of some of the associated considerations. In Section 4, an analysis is conducted on the decision-making scenarios related to three discrete integration models. Section 5 presents an analysis of the decision scenarios across different integration models, comparing equilibrium strategies, optimal strategies, and supply chain profits. Section 6 provides a summary of the results.

2. Literature Review

The literature related to the research theme of this study focuses on supply chain competition, investment in green technologies, and the competition and coordination between firms within the supply chain.

2.1. Green Investment in the Supply Chain

Green investment is an act of incorporating environmental protection into investment decisions in the contemporary economy in line with the requirements of sustainable development [11]. With the increasing global awareness of environmental protection, more and more companies are becoming aware of the importance of investing in green technology. Green technologies can help companies reduce environmental pollution, save energy, improve efficiency, and enhance their social image and market competitiveness. A growing number of scholars are now researching green investment in the supply chain. Yi et al. studied the impact of government subsidies and emission taxes on the development of green technology in supply chains where manufacturers were responsible for green technology investments and retailers marketed products to consumers with green preferences [12]. Jauhari studied sustainable inventory management in closed-loop supply chains and found that green investments were effective in reducing emissions and increasing waste reporting, improving the environmental performance of the supply chain [13]. Liu et al. investigated the dynamic investment strategy of green technologies and the impact of government subsidy incentives on investment and sustainable production decisions, using a supply chain of individual manufacturers and suppliers [14]. Dong et al. analysed strategic investments in green product development in the supply chain and found that green product development investments by manufacturers resulted in greener products and greater environmental tax savings for manufacturers than green product development investments by retailers [15]. Jiang et al. used a pair of cooperatively competitive supply chains consisting of original equipment manufacturers and contract manufacturers to analyse their green technology innovation investment decisions and found that the outcomes of green innovation, wholesale prices, and incentive rate decisions were significantly impacted by the market size and competitive intensity within a cooperatively competitive relationship [16]. Shi et al. investigated the effects of green product development and green marketing strategies on supply chain sustainability and found that when the green marketing cost factor was high enough, both supply chain members and the environment benefit [17]. Du et al. investigated platform-led green advertising by simultaneously considering a product’s green performance and a consumer’s green preference [18]. Wang et al. used the game-theoretic approach, which is suitable to operation decision research, to model a supply chain consisting of one supplier and one retailer and discussed who should invest in green technology in a decentralised supply chain under demand uncertainty [19]. Huang et al. proposed that in the context of green development, companies would reduce pollution through green investments and investigated how inventory management in the supply chain could be carried out to achieve a balance between profit growth and environmental protection when considering investments in green technologies [20].
In addition, many scholars have conducted research on supply chain decisions related to green investments. Gupta et al. studied the decision-making issues of optimal pricing, profitability, and carbon emission levels of supply chain members under centralised and decentralised supply chain structures, considering green technology investments by suppliers and manufacturers [21]. Zhou et al. considered the impact of a system of energy credits and green credits on green technology investment and pricing decisions in a two-tier supply chain [22]. Zhang and Yousaf mentioned that innovation and process improvement in green supply chains require significant investment and found that green investment had an impact on the optimal degree of green improvements in the supply chain [23]. Yang et al. proposed that manufacturers should make specific green investments to enhance the greenness of their supply chains and investigated a dual-channel structure strategy for green manufacturing in the context of environmentally responsible behaviours of manufacturers and consumers [24]. Yang investigated the green investment strategy of e-commerce firms and the interaction between this strategy and the e-commerce sales model selection strategy of supply chain members from a profit maximization perspective [25]. Li et al. found that, with investments and subsidies in green technologies, both manufacturers and retailers tended to cooperate in green marketing [26]. Sarkar and Bhuniya stated that green investments play a crucial role in sustainable supply chain management and found through their research that the concept of service facilities under green investments helped customers select products and maximize profits in the supply chain. Therefore, at a time when green development is being implemented, green investment in the supply chain is beneficial to the overall sustainability of the supply chain [27].

2.2. Competitive Supply Chain

The prevalence of competitive behaviour in supply chains is a common occurrence within a market economy and has garnered scholarly interest [28,29]. Lee conducted an analysis of a third-order closed-loop supply chain comprising a manufacturer, a collector, and two duopoly recyclers. The findings of the study revealed that heightened price competition among recyclers had an adverse impact on the overall profitability of the supply chain [30]. Seyedhosseini et al. conducted an analysis to examine the impact of different vertical game structures and the competitive game behaviours of two duopoly retailers on the overall profitability of the supply chain, the profitability of individual participants, and the optimal strategy. Their findings suggested that implementing two-stage tariff contracts effectively coordinated the profits of all the participants in the supply chain [31]. Chen and Xiao [32] developed a game that simulated a two-tier supply chain consisting of a supplier and multiple competing retail stores. The impact of competitive behaviour was observed on the decisions pertaining to retail pricing, replenishment, and the formulation of a wholesale price agreement. Fan et al. developed a model to analyse competition among multiple merchants in a green supply chain. The study investigated the optimal strategies under two competition models, namely the Cournot competition and the Stackelberg competition models [33]. In their study, Ma et al. developed six models to investigate the pricing tactics employed by two competing manufacturers and a retailer in a two-stage supply chain. Their findings revealed that investments in eco-friendly manufacturing practices enhanced the competitive edge of firms to a certain extent [34]. OEmer and PM [35] considered an advanced planning and scheduling (APS) problem in a manufacturing supply chain. Li et al. conducted an analysis of pricing and greening strategies within a two-channel supply chain that involved manufacturers producing environmentally friendly products. The study considered channel rivalry and resulted in the development of a contract aimed at coordinating a decentralized dual-channel green supply chain [36]. The study conducted by Zhu et al. examined the issue of eco-friendly product design within a supply chain that was driven by market forces. The researchers found that the pricing strategies of the retailers and their competition in terms of the greenness of their products had an impact on the greenness equilibrium level [37].
Scholars are also interested in the inter-chain rivalry and coordination in supply chains that incorporate green investments. Madani and Morteza built a competition model with the government as the leader and green and non-green supply chains as the followers to examine decision-making concerns, such as price and green strategies, in supply chain competition [38]. According to Zheng et al. [39], who compared the roles of normal supply chains and reverse supply chains in reverse competition and investigated the equilibrium decisions of supply chains under three different competitive structures, the effectiveness of centralized decision-making is the best approach for both chains. According to Ai et al., chain rivalry can have a considerable impact on supply chain profit margins, and they hypothesized that revenue-sharing agreements and contracts for wholesale prices under different conditions could have coordinating impacts on the supply chain [40]. According to Li and Li’s analysis of a game model of two sustainable supply chains under product sustainability competition [41], vertical integration facilitated the supply chain when the level of competition was low. They also discovered that the level of competition in product sustainability influenced the two-chain system’s equilibrium structure. Baron et al. addressed the consequences of single-chain bargaining in a two-chain competitive system by taking into account asymmetric Nash bargaining in wholesale prices and discovered that supply chain systems can be coordinated using different integration techniques at different competitive intensities [42]. Liu explored the optimum selection technique for green product R&D in two sustainable competitive supply chains and established a two-part price contract to achieve supply chain coordination. It was discovered that supply chain rivalry has an effect on pricing, benefit distribution, and other characteristics of the supply chain, whereas measures such as contract formulation and integration decisions can help coordinate supply chain development. This body of research is reasonably mature and deep in terms of the theoretical frameworks and modelling approaches, which assists this paper’s examination of the supply chain integration choices in the context of green investment competition [43].

2.3. Supply Chain Integration Decisions

The management of the degree of fit for processes within and across enterprises, including supplier integration, customer integration, and internal integration [44,45,46,47], is known as supply chain integration. It also refers to the strategic collaboration of manufacturers and supply chain partners in terms of information integration, resource coordination, and organizational interconnection. Many academics have conducted relevant research on supply chain integration decisions, which can assist supply networks in developing and producing win-win outcomes. Wei et al. [48] studied the integration strategies of manufacturers and retailers in a supply chain with complementary products and discovered that the total profit of the supply chain increased with the number of integration players and that the choice to vertically integrate was advantageous to the supply chain’s profitability. Lin et al. [49] evaluated the effects of three distinct techniques on two competitor supply chains: forward integration, backward integration, and no vertical integration. According to the research, unilateral backward integration was beneficial to manufacturer profitability, unilateral forward integration was detrimental to manufacturer profitability, and vertical integration resulted in the selling of higher-quality items at lower prices. Saberi S et al. [50] presented a multiperiod supply chain using a freight carriers network model. In this model, manufacturers, retailers, and carriers maximised the net present value (NPV) of their investments using ecologically friendly technology. Zhang et al. [51] investigated the link between the overall profit of a supply chain and the overall profit of a competitor’s supply chain in a service efficiency competition with or without integration methods. To some extent, the decision to integrate was beneficial to the overall profit of their own supply chain. Yu et al. [52] investigated a fresh produce supply chain with competing retailers. They discovered that vertical integration not only reduced output losses but also made the 3PL profitable. Gürsoy and Kara [53] studied the just-in-time distribution network modelling under raw material quality and time constraints. Li and Chen [54] discovered that forward integration might result in a win-win situation for both the manufacturer and the retailer in a three-tier supply chain simulation.
In addition, many scholars have studied the integration decisions in green supply chains. Wang C. and Wang L. studied the impact of different integration strategies on supply chain profits when shipping companies made green investments, using a green maritime supply chain [55]. Saha et al. found that two competing supply chain members achieved higher profits through horizontal integration [56]. Bai et al. [57] found that a manufacturer’s integration strategy with suppliers was associated with the efficiency of the manufacturer’s energy efficiency investments. From the perspective of game theory, Du et al. [58] incorporated the environmental perspective into the supply chain operation and built a Stackelberg-like model to analyse the decentralised decision-making of manufacturers and retailers. Nielsen et al. analysed the optimal pricing and investment decisions of two competing green supply chains and found that a vertical integration strategy outperformed a horizontal integration strategy with a high cross-price elasticity of green products [59]. Shang et al. developed a model of competition and cooperation between two manufacturers of green and non-green supply chains under two-way government intervention, where a horizontal integration of manufacturers not only increased their own profits but also enhanced their environmental welfare [60]. Cheng et al. explored the competition between green and non-green supply chains, where a vertical integration between manufacturers and retailers helped increase the greenness of their products and deliver more benefits to consumers. This showed that supply chain integration decisions can coordinate competition between supply chains and contribute to the overall development of green supply chains [61]. Zhang et al. discussed the influence of service efficiency investments on the integration decisions of a competitive supply chain in the context of sustainable development [51]. However, companies face a number of challenges and constraints in developing green technology investments and supply chain integration decisions. Some companies may lack sufficient capital to invest in green technology or lack sufficient knowledge and experience. In a competitive market environment, companies need to consider how to optimize their production efficiency, control costs, and enhance market competitiveness through supply chain integration. Therefore, competitive supply chain integration decisions that consider green technology investments have become an important issue for companies.
In summary, competitive supply chain integration decisions considering an investment in green technologies is an important issue facing firms, and researchers have conducted many useful explorations and studies. Therefore, based on the previous research, this paper focuses on the issue of competitive supply chain integration decisions considering green technology investments.

3. Problem Statement and Underlying Presumptions

The present study employs the logistics service supply chain (LSSC) framework, wherein the logistics service provider (LSP) invests in environmentally friendly service technology for logistical services. This framework serves as an illustration of how to align customers’ green product preferences with their needs, thereby catering to the requirements of clients who prioritise service efficiency. In a highly competitive service market, the logistics service integrator (LSI) engages in competition with other firms of a comparable nature. What are the integration strategies that the LSI can utilise to aid logistics service providers in making more sustainable investments in their services? The present investigation establishes a pair of comparable and competing logistics service supply chains, each comprising a logistics service integrator (LSI) and a logistics service provider (LSP) at two hierarchical levels. The composition of each chain consists of a logistics service integrator (LSI) and a logistics service provider (LSP). Both logistics service supply chains are oriented towards the identical market for logistics services. UPS and DHL are competitors due to their similar market focus, which results from their tailored supply chains. DHL Air Cargo functions as the logistics service integrator within the DHL supply chain, whereas the China Foreign Trade Transportation (Group) Corporation serves as the logistics service provider operating within China. The secondary logistics service supply chain can adopt either an integrated or non-integrated approach, resulting in two distinct LSSC frameworks: decentralised (D) and centralised (C). In the event that the LSSC opts against integration, the decentralised framework will engage in a Stackelberg game, wherein each LSP and LSI will independently make decisions aimed at maximising their respective profits. In the event that the LSSC opts for integration, the resulting centralised structure will engage in the Stackelberg game. Upon the decision of integration by the LSSC, the LSI will function as the central hub of the unified entity, providing an extensive array of logistical services to external stakeholders. Theoretically, the integration of two LSSCi (where i is 1 or 2) can result in four possible LSSC structure combinations, namely the CC model (where both LSSCs opt for integration), the CD model (where LSSC1 chooses to integrate while LSSC2 chooses not to integrate), the DC model (where LSSC1 chooses not to integrate while LSSC2 chooses to integrate), and the DD model (where both LSSCs choose not to integrate), as evidenced by the data presented in Table 1.
Given the reciprocal market positions or bargaining power of LSSC1 and LSSC2, and the presence of the Nash competition between the two secondary LSSCs, it can be observed that both chains will execute their optimal strategies simultaneously. This paper solely examines three secondary LSSC competition models, namely the dual centralised model (CC), the hybrid model (CD), and the dual decentralised model (DD). These models were selected due to their symmetrical competition structure, which was attributed to the symmetry of the integration model. The models in question are illustrated in Figure 1.
In a centralised supply chain, the decisions about green technology investment and customer price are made collaboratively by logistics service providers (LSPs) and logistics service intermediates (LSIs). A Stackelberg dynamic game is observed in a decentralised supply chain setting, where the LSP takes the lead in decision-making by determining the level of investment in green technology and the wholesale unit price of logistics services in response to market competition for green technology investment. Following that, the LSI chooses the pricing to be offered to the consumer in order to maximise profit. According to Liu’s [9] service competition supply chain model, this study establishes the demand function for the LSSCi’s logistics service.
q i = a p i + e i u e 3 i , i = 1 , 2
where q i is the market order quantity; a indicates the potential market demand for logistics services; p i and p 3 i denote the service prices of the logistics in different logistics service supply chains, respectively; and u [ 0 , 1 ] denotes the substitution coefficient between two LSSCs. the higher the value of u , the more intense the competition between chains. e i and e 3 i represent the logistics service efficiency in different logistics service supply chains, respectively. The cost of green technology is k e i 2 , k > 0 , k and denotes the green investment sensitivity factor. A smaller k indicates a smaller cost of services to invest in for the same level of investment in green technology. A larger k indicates a larger cost of services to be invested in for the same level of investment in green technology.
The present investigation posits that the unit operating costs of both the LSP and LSI exhibit risk neutrality and informational symmetry. The unpredictability of the contract between the two LSSCs is deemed noteworthy. The optimisation process does not take into account the specific methodology utilised for the allocation of profits among the integrator. Rather than considering multiple factors, the integration process focuses solely on the two parties involved. Table 2 provides a comprehensive inventory of the symbols employed in the current investigation, along with their respective definitions.
Ultimately, the variable Π z i y , i = 1 , 2 denotes the maximum profit attained by the member z belonging to chain i, as per the specifications of model y. z { L S I i , L S P i } represents the logistics service integrator and provider, respectively. The three LSSC models are designated as y { C C , C D , D D } under inter-chain Nash competition. The efficiency of the supply chain’s service level investment in service providers, as per model y, is denoted by the symbol e i y . According to model y, the variable h i y represents the wholesale unit price charged by the provider businesses operating within the supply chain i. The pricing of logistics services for the supply chain i in market units, under model y, is represented by the symbol p i y . The variable denoted by the symbol q i y represents the quantity of service orders pertaining to the supply chain i within the framework of model y.

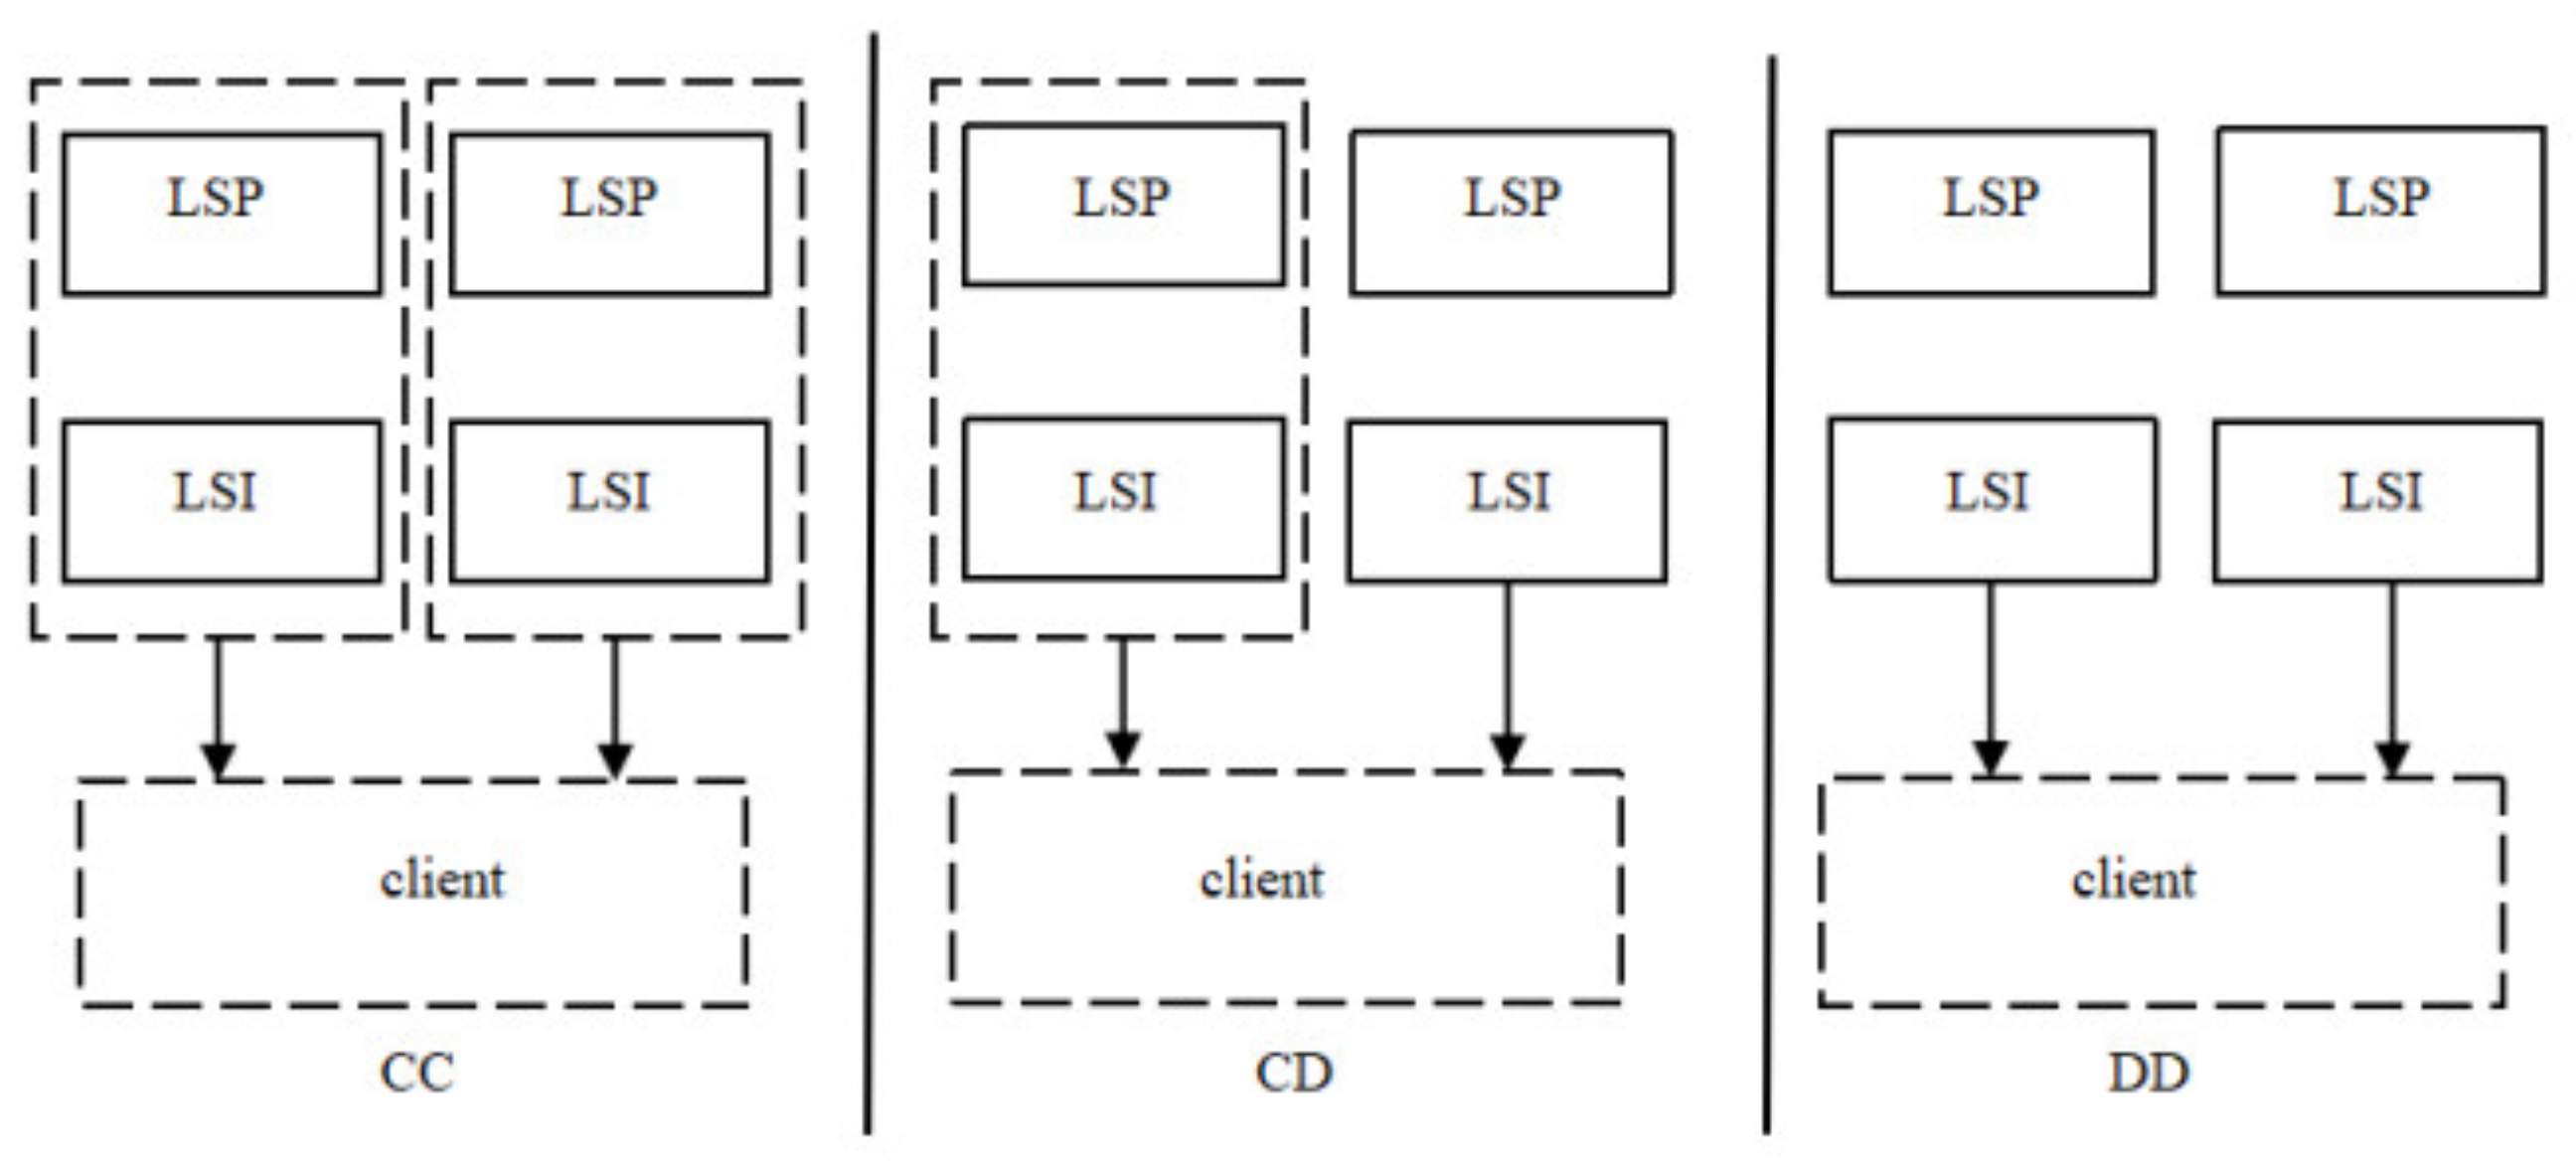
4. Making Decisions Using Various Integration Decision Models

4.1. Model for Dual Concentration (CC)

Under the CC model, both LSSCs choose an integration strategy with a centralised structure. The procedural steps of the game involve the selection of a centralised structure by both LSSCs, followed by a collaborative determination of the level of logistic green services by L S P i and L S I i . The optimisation of the overall profit is contingent upon determining the optimal values of e i and the unit price of the logistics services p i to be procured externally. The profit function of the supply chain i objective can be readily derived under a centralised structure.
Π L S S C i = ( p i c L S P c L S I ) q i k e i 2
The initial partial differentials of Π P i in relation to p i and e i can be derived by substituting the demand function and determining the optimal solution for Π L S S C i .
Π L S S C i p i = a + c L S I + c L S P + e i u e 3 i 2 p i
Π L S S C i e i = p i 2 k e i c L S I c L S P
The Hesse matrix is definite in the negative, the 2 Π L S S C i p i 2 * 2 Π L S S C i e i 2 2 Π L S S C i p i e i * 2 Π L S S C i e i p i > 0 . Therefore, it can be inferred that k > 1 4 .
Consequently, by setting both Equations (2) and (3) to zero, the resulting simultaneous solution will provide the equilibrium solution for the optimal supply chain i. The optimal profit of a given proposition can be determined by substituting it into its target profit function.
Suggestion 1: Given the parameters a , c L S I , c L S P , k , and u , the desired results of the CC competition model are as follows.
  • The solution at equilibrium can be written as the following.
    p i C C = 2 k a + ( c L S I + c L S P ) ( 2 k + u 1 ) 4 k + u 1
    e i C C = a c L S I c L S P 4 k + u 1
    q i C C = 2 k ( a c L S I c L S P ) 4 k + u 1
  • The maximum profit achievable by the two LSSCs can be written as the following.
    Π L S S C i C C = Π L S I i C C = k ( 4 k 1 ) ( a c L S I c L S P ) 2 ( 2 k + u 1 ) 2

4.2. Modelling Mixing (CD)

The hybrid CD model consist of the configurations of competitions that involve participants from different categories or groups. In the context of inter-chain Nash competition, it can be observed that CD and DC demonstrate structural equivalence due to the fact that they both entail a single LSSC that selects either centralisation or decentralisation. The similarity between the two can be attributed to the symmetry in their structure. In order to make a generalisation, it is proposed that L S S C 1 selects a centralised organisational framework, whereby the L S I 1 and L S P 1 are interconnected and collaborate as a cohesive unit to offer comprehensive services to the logistics services industry. Conversely, L S S C 2 employs a decentralised structure, wherein the various components operate independently. The L S P 2 offers logistics services to its downstream clients and assesses the extent of its provision of environmentally friendly logistics services. The L S I 2 determines the prevailing market rate for the logistics services offered to its clientele. The L S P 2 and L S I 2 , in collaboration, constitute L S S C 2 . The hybrid model of competition (CD) is characterised by the occurrence of horizontal Nash competition between L S S C 1 and L S S C 2 .
The game involves a series of steps, beginning with the initial phase where the L S P 2 determines the optimal wholesale unit price for traditional services, denoted as h 2 , and the level of green services, denoted as e 2 , that are offered downstream to the L S I 2 . In the second stage, the downstream L S I 2 determines the unit pricing for the logistics service market, denoted as p 2 , while the integrators of L S S C 1 jointly select their logistics service market unit price, denoted as p 1 , and green service level, denoted as e 1 , with the ultimate goal of maximising the profits of each member. According to the hybrid structure, the target profit functions for L S S C 1 and L S S C 2 are as follows.
The objective function of the aforementioned entity can be written as the following.
Π L S S C 1 = ( p 1 c L S P c L S I ) q 1 k e i 2
The objective function of the L S S C 2 model can be written as the following.
Π L S P 2 = ( h 2 c L S P ) q 2 k e 2 2
Π L S I 2 = ( p 2 h 2 c L S I ) q 2
The inverse derivation approach is utilised to solve the objective profit function of both LSSCs by substituting the demand function. To derive the reaction function of p 2 with regard to h 2 and e 2 , the optimisation process for Π L S S C 2 involves achieving a first order derivative of Π L S I 2 with respect to p 2 that equals zero.
p 2 = 1 2 ( a + e 2 + h 2 + c L S I u e 1 )
By computing the first-order partial derivatives of Π L S S C 1 with respect to both p 1 and e 1 and equating them to zero, we can effectively optimise Π L S S C 1 .
p 1 = 2 k ( a u e 2 ) + ( 2 k 1 ) ( c L S I + c L S P ) 4 k 1
e 1 = a u e 2 c L S I c L S P 4 k 1
By computing the initial partial derivatives of Π L S P 2 with respect to h 2 and e 2 and equating them to zero, we can obtain the reaction function of p 2 . This function can then be substituted into the upstream Π L S P 2 .
h 2 = 4 k ( a u e 1 ) 4 k c L S I + ( 4 k 1 ) c L S P 8 k 1
e 2 = a u e 1 c L S I c L S P 8 k 1
The Hesse matrix negative definite allows us to derive k > 1 4 . Finally, by associating Equation (11) to Equation (15), we can obtain the equilibrium solutions of the optimisation of L S S C 1 and L S S C 2 . The aforementioned assertion can be verified by substituting the variables into the profit functions of the parties involved and, subsequently, ascertaining their respective optimal profits.
Suggestion 2: Given the parameters a , c L S P , c L S I , k , and u , the CD competition model is designed to achieve a set of optimal results, which are as follows.
(1)
The equilibrium answers can be written as the following.
p 1 C D = 2 k ( 8 k 1 u ) a + ( 1 + 16 k 2 2 k ( 5 u ) u 2 ) ( c L S I + c L S P ) 1 + 32 k 2 12 k u 2
e 1 C D = ( 8 k 1 u ) ( a c L S I c L S P ) 1 + 32 k 2 12 k u 2
q 1 C D = ( 8 k 1 u ) ( a c L S I c L S P ) 1 + 32 k 2 12 k u 2
p 2 C D = 6 k ( 4 k 1 u ) a + ( 1 + 8 k 2 6 k ( 1 u ) u 2 ) ( c L S I + c L S P ) 1 + 32 k 2 12 k u 2
h 2 C D = 4 k ( 4 k 1 u ) ( a c L S I ) + ( 1 + 16 k 2 4 k ( 2 u ) u 2 ) c L S P 1 + 32 k 2 12 k u 2
e 2 C D = 4 k ( 4 k 1 u ) ( a c L S I c L S P ) 1 + 32 k 2 12 k u 2
q 2 C D = 2 k ( 4 k 1 u ) ( a c L S I c L S P ) 1 + 32 k 2 12 k u 2
(2)
The optimal revenue for both participants of the LSSC remains to be determined.
Π L S I 1 C D = k ( 4 k 1 ) ( 8 k 1 u ) 2 ( a c L S I c L S P ) 2 ( 1 + 32 k 2 12 k u 2 ) 2
Π L S I 2 C D = k ( 8 k 1 ) ( 4 k 1 u ) 2 ( a c L S I c L S P ) 2 ( 1 + 32 k 2 12 k u 2 ) 2
Π L S P 2 C D = 4 k 2 ( 2 k 1 u ) 2 ( a c L S I c L S P ) 2 ( 1 + 32 k 2 12 k u 2 ) 2
(3)
The two LSSCs’ combined overall ideal profit can be written as the following.
Π L S S C 1 C D = k ( 4 k 1 ) ( 8 k 1 u ) 2 ( a c L S I c L S P ) 2 ( 1 + 32 k 2 12 k u 2 ) 2
Π L S S C 2 C D = k ( 12 k 1 ) ( 4 k 1 u ) 2 ( a c L S I c L S P ) 2 ( 1 + 32 k 2 12 k u 2 ) 2
The equilibrium solutions and optimal profitability of the hybrid structures DC and CD exhibit a numerical symmetry, thus precluding their repetition.

4.3. Model of Double Decentralisation (DD)

When both local self-governing bodies opt not to integrate, namely when L S P 1 and L S I 1 form L S S C 1 and L S P 2 and L S I 2 form L S S C 2 , the two chains engage in horizontal Nash competition, thereby forming a double-dispersed competition model (DD). The procedural sequence of the game is outlined as follows. The company L S P i employs a strategy to determine the most advantageous wholesale unit price for its logistics services, denoted as h i , and its green service level, identified as e i and L S I i , with the aim of maximising its own profits. Subsequently, the L S P i will confront the market to establish the corresponding market unit price for its logistics services, referred to as p i .
The profit function objective for the supply chain i within a double decentralised structure can be expressed as follows.
Π L S P i = ( h i c L S P ) q i k e i 2
Π L S I i = ( p i h i c L S I ) q i
By utilising the demand function, a retrograde derivative is employed to determine the optimal profit function for the supply chain i. To derive the reaction function of p i with regard to h i and e i , Π L S I i is first optimised so that the first order derivative of Π L S I i with respect to p i is zero.
p i = 1 2 ( a + e i + h i + c L S I u e 3 i )
By computing the first-order partial derivatives of Π L S P i with respect to both h i and e i , and subsequently equating them to zero, we can effectively optimise the value of Π L S P i .
h i = 4 k ( a u e 3 i ) 4 k c L S I + ( 4 k 1 ) c L S P 8 k 1
e i = a c L S I c L S P u e 3 i 8 k 1
Using the Hesse matrix negative definite, 2 Π L S P i h i 2 * 2 Π L S P i e i 2 2 Π L S P i h i e i * 2 Π L S P i e i h i > 0 , so k > 1 8 can be obtained.
The optimal state of balance in the theoretical supply chain system. By utilising Equations (30)–(32) in conjunction with the objective profit function and performing an optimisation analysis, it is possible to ascertain its location.
Suggestion 3: When the parameters a , c P , c C , k , and u are provided, the DD competition model’s ideal outcomes are as follows.
(1)
The following are the optimal results for the DD competition model.
p i D D = 6 k a + ( 2 k + u 1 ) ( c L S I + c L S P ) 8 k + u 1
h i D D = 4 k ( a c L S I ) + ( 2 k + u 1 ) c L S P 8 k + u 1
e i D D = a c L S I c L S P 8 k + u 1
q i D D = k ( a c L S I c L S P ) 8 k + u 1
(2)
The maximum profits attained by the logistics service providers (LSPs) and logistics service integrators (LSIs) on the two logistics service supply chains (LSSCs) are as follows.
Π L S P i D D = k ( 8 k 1 ) ( a c L S I c L S P ) 2 ( 8 k + u 1 ) 2
Π L S I i D D = 4 k 2 ( a c L S I c L S P ) 2 ( 8 k + u 1 ) 2
(3)
The two LSSCs’ combined overall ideal profit can be written as the following.
Π L S S C i D D = k ( 12 k 1 ) ( a c L S I c L S P ) 2 ( 8 k + u 1 ) 2

5. Comparative Examination of Green Services for Various Integration Choice Models

5.1. Comparing a Chain’s Green Service Standards when Competing Chains Opt Not to Integrate (D)

This section provides a detailed analysis of the supply chains of UPS and DHL, utilising them as illustrative examples. LSSC1 and LSSC2 are engaged in a competitive relationship. LSSC1 employs the nomenclature LSI1 to denote UPS and LSP1 to denote SF Holdings Limited. Meanwhile, LSI2 is utilised to refer to DHL, and LSP2 designates the China Foreign Trade Transportation (Group) Corporation in LSSC2. The UPS supply chain offers both integration and non-integration alternatives, while the DHL supply chain serves as a competing chain. As a result, the two logistics service supply chains (LSSCs) will establish a CD structure and a DD structure, respectively, in the event that the DHL supply chain opts not to integrate. At present, a comparison has been made between the green service level magnitude of the UPS supply chain under the DD and CD structures. The values exhibited a constant nature with e i D D < e i C C and e 1 C D = e 2 D C , e 1 D C = e 2 C D , which directly reflects the symmetry of the competitive model. The following corollary can be obtained.
Lemma 1:
When  e 1 C D e 1 D D = 0 , u = u 1 ( k ) , then
(i)
In cases where 1 4 < k < 0.375  and  0 < u < u 1 ( k )  occur, then  e 1 C D > e 1 D D .
(ii)
In cases where 1 4 < k < 0.375  and  u 1 ( k ) < u < 1  occur, then  e 1 C D < e 1 D D .
(iii)
In cases where k 0.375  and  0 < u < 1  occur, then  e 1 C D > e 1 D D .
The proof is presented in the Appendix A.
The outcomes are displayed in Figure 2. In area A1, Π L S S C 1 C D > Π L S S C 1 D D , and in area A2, Π L S S C 1 C D < Π L S S C 1 D D .
As illustrated in Figure 2, e 1 C D > e 1 D D in area A1 and e 1 C D < e 1 D D in area A2. According to Lemma 1, UPS and SF Holdings Limited attained a higher degree of environmentally friendly services by selecting a non-integration approach in situations where the green investment sensitivity coefficient was low and the intensity of inter-chain competition was high. This deduction remained true for scenarios where the green investment sensitivity coefficient and inter-chain competition intensity were both low. Despite intense competition between the two supply chains, UPS and SF Holdings Limited had the potential to provide superior environmentally friendly services by strategically integrating their operations, particularly in situations where there was a heightened sensitivity towards green investments.
The theorem that follows can be deduced from Lemma 1.
Theorem 1.
When the competitive chain chooses not to integrate, The determination of whether a competing LSSC should integrate is dependent on the level of competition within the supply chain and the variety of cost components associated with the service inputs for its own LSSC.
(i)
In cases where  0.25 < k < 0.375   and   0 < u < u 1 ( k )  occurred, a self-LSSC option was integrated.
(ii)
In cases where  0.25 < k < 0.375  and  u 1 ( k ) < u < 1  occurred, a self-LSSC option was not integrated.
(iii)
In cases where  k 0.375  and  0 < u < 1  occurred, a self-LSSC option was integrated.
The first theorem demonstrated that in the event that the competing chain opted against integration, the determination of the LSI to amalgamate with the upstream LSP in its supply chain was impacted by two factors: the service input cost coefficient k and the service competition intensity u. As illustrated in Figure 1, it can be observed that within region A1, the integration of the own supply chain led to a comparatively superior level of service. This can be attributed to the relatively lower degree of service competition and a smaller service input cost coefficient prevailing at this juncture. In the context of market competition, the supply chain of a company may choose to integrate its upstream and downstream members in order to gain a competitive advantage and increase its overall profitability, even if a rival chain opted for a decentralised structure. This tendency was particularly evident when the integration benefit of the local service intermediaries (LSIs) outweighed the cost of the service inputs. Conversely, in region A2, the supply chain may choose not to integrate, as doing so would result in a higher service input cost and a lower service level. Consequently, in the event that the competing chain chose to adopt a decentralised framework, its corresponding supply chain chose to maintain a separation between its logistics service providers (LSPs) and logistics service intermediaries (LSIs). This measure was implemented with the purpose of allowing downstream local service integrators (LSIs) to avoid the intense competitive landscape, while also preventing upstream local service providers (LSPs) from getting entangled in the cutthroat competition of the downstream LSIs. The determination of whether or not to engage in integration with upstream LSPs primarily hinges on the green investment sensitivity coefficient pertaining to the LSIs within their respective supply chains, rather than the intensity of the service competition. To improve the level of service offered to their customers, it is a prevalent practice for logistics service intermediaries (LSIs) operating in a supply chain to avoid the integration of their upstream and downstream members.
Lemma 2.
When  e 2 C D e 2 D D = 0  and  u = u 2 ( k ) , then
(i)
In cases where  0.25 < k < 0.375  and  0 < u < u 2 ( k )  occurred, then  e 2 C D < e 2 D D .
(ii)
In cases where  0.25 < k < 0.375  and  u 2 ( k ) < u < 1  occurred, then  e 2 C D < e 2 D D .
(iii)
In cases where  k 0.375  and  0 < u < 1  occurred, then  e 2 C D < e 2 D D .
Based on the findings of Lemma 2, it can be inferred that in cases where DHL and the China Foreign Trade Transportation (Group) Corporation opted for a decentralised approach to decision-making and chose not to integrate, and where the green investment sensitivity coefficient was significantly high, UPS and SF Holdings Limited attained a superior level of green service for the DHL supply chain by also choosing not to integrate, irrespective of the degree of competition between the two supply chains. The UPS and SF Holdings Ltd. merger commenced with the objective of augmenting the calibre of eco-friendly services for the DHL supply chain. This determination was made based on the low sensitivity factor towards green investment and particular criteria related to the level of competition among the supply chains. Thirdly, if specific requirements were met and there was a significant level of competition between the chains, coupled with a decrease in the sensitivity factor towards green investments, UPS and SF Holdings Ltd. opted not to integrate in order to enhance the level of green services for the DHL supply chain.
As illustrated in Figure 3, e 2 C D < e 2 D D in area B1, and e 2 C D > e 2 D D in area B2.
The following theorem can be derived from Lemma 2.
Theorem 2.
The decision of the competing LSSC to refrain from integration is a widely acknowledged fact. It is also recognised that either alternative integration or non-integration will yield an equivalent effect on the overall profitability of the competing LSSC. The impact of the two LSSCs on each other will be contingent upon the degree of competition and the range of the input cost factors for services.
(i)
In cases where  0.25 < k < 0.375  and  0 < u < u 2 ( k )  occurred, when one supply chain chose not to integrate, the rival supply chain achieve a higher level of green services.
(ii)
In cases where  0.25 < k < 0.375  and  u 2 ( k ) < u < 1  occurred, it was more profitable for the rival supply chain when the one supply chain chose to integrate.
(iii)
In cases where  k 0.375  and  0 < u < 1  occurred, when one supply chain chose not to integrate, the rival supply achieve a higher level of green services.
Theorem 2 posited that in the event that the competing LSSC chose not to integrate, the LSSC in question would adopt a distinct integration strategy contingent upon the fluctuations in the level of LSI competition, denoted as “u”, and the LSP green investment sensitivity coefficient, denoted as “k”. The alteration in the approach would subsequently affect the magnitude of the competitor LSSC’s service level. As illustrated in Figure 3, it can be observed that in cases where the competing chain was decentralised, the smaller region D1 in the upper left quadrant was associated with this phenomenon. The integration of the LSIs with upstream LSPs was primarily determined by the green investment sensitivity factor when operating within their own chain and was not influenced by the degree of competitive intensity of the service, particularly when the green investment sensitivity factor was significant k 0.375 . When the green investment sensitivity coefficient was high, the rival chain chose to integrate, while its own chain refrained from integrating its upstream and downstream members, leading to a higher service level for the rival chain, irrespective of the level of service competition for the LSIs in its own chain.
Figure 4 presents a consolidated view of Figure 2 and Figure 3; when ( k , u ) C 2 , then e 1 C D < e i D D < e 2 C D . Therefore, when chain two chose not to integrate under the lower green investment sensitivity coefficient and higher green investment competition degree, chain one chose not to integrate when chain one preferred to invest in a higher logistics service supply chain green service level. If Chain 1′s strategy shifts from not integrating to integrating, the two sides originally equal logistics service supply chain green service level ( e 1 D D = e 2 D D ) instead of chain 1 green service level down ( e 1 C D < e 1 D D ), chain 2 green service level up ( e 2 D D < e 2 C D ), which is more than worth the loss for chain 1, so chain 1 would rather give up the benefits of integration, rather than put themselves in a service disadvantageous position.
When ( k , u ) C 1 , then e 2 C D < e i D D < e 1 C D . When chain two chose not to integrate, the higher green investment sensitivity coefficient and the lower green investment competition level caused chain one to take integration measures, which not only obtained integration benefits to internalise service costs, but also divided the otherwise identical green service levels of both parties, providing greater incentives to improve their own green service levels ( e 1 D D < e 1 D D ) while lowering chain two’s green service levels ( e 2 C D < e 2 D D ) to achieve their own service advantages.

5.2. Comparing the Green Service Levels of a Chain when Rival Chains Choose to Integrate (C)

When LSSC2 decided to incorporate (C), an outcome was achieved as a result. At present, we compared the correlation between the profit size and LSSC1 under the CC and DC frameworks.
Lemma 3.
When  e 1 C D e 1 C C = 0 , u = u 2 ( k ) , then
(i)
In cases where  1 4 < k < 0.375  and  0 < u < u 2 ( k )  occurred, then  e 1 C D > e 1 C C ,  e 1 D C = e 2 C D < e i D D < e i C C < e 1 C D = e 2 D C .
(ii)
In cases where  1 4 < k < 0.375  and  u 2 ( k ) < u < 1  occurred, then  e 1 C D < e 1 C C ,  e 1 C D = e 2 D C < e i D D < e i C C < e 1 D C = e 2 C D .
(iii)
In cases where  k 0.375  and  0 < u < 1  occurred, then  e 1 C D > e 1 C C ,  e 1 D C = e 2 C D < e i D D < e i C C < e 1 C D = e 2 D C .
The proof is presented in the Appendix A.
As shown in Figure 5, e 1 C D > e 1 C C in the area D1, and e 1 C D < e 1 C C in the area D2.
Based on the findings of Lemma 3, it can be inferred that UPS and SF Holdings Limited opted for integration as a means of providing superior green services. Conversely, DHL and the China Foreign Trade Transportation (Group) Corporation selected a decentralised approach in instances where the green investment sensitivity coefficient and inter-chain competition intensity were both low. In the scenario where inter-chain competition was intense and the significance of environmentally friendly investments was relatively low, the non-integration decision taken by UPS and SF Holdings Limited could potentially lead to an increased provision of eco-friendly services within the UPS chain. Irrespective of the extent of the rivalry between the two supply chains, in scenarios where the green investment sensitivity factor was significantly elevated, the non-integration decision made by UPS and SF Holdings Limited may lead to a greater provision of eco-friendly services in the UPS chain.
The following theorem can be derived from Lemma 3.
Theorem 3.
The decision of whether or not to integrate an LSSC is contingent upon several factors, including the degree of competition between the chains and various cost considerations related to the service inputs.
(i)
When competitive chains choose to integrate, In cases where  0.25 < k < 0.375  and  0 < u < u 2 ( k )  occurred, a self-LSSC option was not integrated.
(ii)
When competitive chains choose to integrate, In cases where  0.25 < k < 0.375  and  u 2 ( k ) < u < 1  occurred, a self-LSSC option was integrated.
(iii)
When competitive chains choose to integrate, In cases where  k 0.375  and  0 < u < 1  occurred, a self-LSSC option was not integrated.
The third theorem established that the decision of an LSI in a competing chain to integrate with an upstream LSP was influenced by the service input cost factor k and the level of service competition u. In region D1, there was a tendency for independent chains that opted not to integrate to provide a superior level of service, whereas in region D2, the independent chains that chose to integrate were more likely to offer a higher level of service. The decision of the LSIs in their own chains to integrate with upstream LSPs was primarily dependent on the green investment sensitivity coefficient and was not influenced by the size of the service competition intensity when the former was high. In instances where the green investment sensitivity factor was elevated, the LSIs within their respective chains exhibited a tendency to refrain from integrating their upstream and downstream members in order to offer superior customer service, irrespective of the level of competition for services in the event that the competing chain opted for integration. This remained true irrespective of the level of competition for services.
Lemma 4.
When  e 2 C D e 2 C C = 0 , then  u = u 2 ( k )
(i)
In cases where  0.25 < k < 0.375  and  0 < u < u 2 ( k )  occurred, then  e 2 C D < e 2 C C .
(ii)
In cases where  0.25 < k < 0.375  and  u 2 ( k ) < u < 1  occurred, then  e 2 C D > e 2 C C .
(iii)
In cases where  k 0.375  and  0 < u < 1  occurred, then  e 2 C D < e 2 C C .
Lemma 4 led to the conclusion that, regardless of how fiercely the two chains competed, when DHL and the China Foreign Trade Transportation (Group) Corporation decided to integrate centrally, UPS and SF Holdings Limited decided to do the same, enabling the DHL chain to receive a higher level of green service when the green investment sensitivity coefficient was significantly large. When specific requirements were met and the degree of inter-chain competition was strong enough, UPS and SF Holdings Ltd. decided to combine, increasing the number of green services that the DHL chain received. The DHL chain received a greater level of green services when the green investment sensitivity factor was low and the amount of inter-chain competition satisfied specific requirements, due to a non-integration choice made by UPS and SF Holdings Ltd.
As shown in Figure 6, e 2 C D < e 2 C C in the area E1, and e 2 C D > e 2 C C in the area E2.
The following theorem can be derived from Lemma 4.
According to Theorem 4, the decision of a competing LSSC to integrate would have an equivalent impact on the overall profitability of said LSSC, regardless of whether or not its own LSSC chose to integrate. The impact of the two LSSCs on each other would be contingent upon the degree of competition and the range of the cost components associated with the service input.
(i)
When competitive chains choose to integrate, 0.25 < k < 0.375 and 0 < u < u 2 ( k ) occurred, it was more profitable for rival chains if the one chain chose to integrate.
(ii)
When competitive chains choose to integrate, 0.25 < k < 0.375 and u 2 ( k ) < u < 1 occurred, if the one chain chose not to integrate, the rival chain achieve a higher level of green services.
(iii)
When competitive chains choose to integrate, k 0.375 and 0 < u < 1 occurred, it was more profitable for rival chains if the one chain chose to integrate.
According to Theorem 4, if the competing LSSC chose to integrate, its corresponding LSSC would adopt a unique integration strategy based on the differences in the level of LSI competition (represented by u) and the LSP green investment sensitivity factor (represented by k). The modification in the approach would consequently have an impact on the extent of the rival LSSC’s level of service. In instances where a decentralised competing chain was observed, as illustrated in Figure 6, the quadrant situated in the upper left-hand corner (E1) was linked to a reduced factor of the service input cost and a diminished degree of competition. As a result, in the event that the decentralised blockchain chose to incorporate, it would elevate the level of service provided by the competing blockchain. On the other hand, the quadrant situated at the lower right corner (E2) exhibited a reduced factor of the service input cost and an elevated level of competition. In this particular scenario, the integration of the decentralised chain would lead to a decrease in the level of service provided by the competing chain. In cases where the green investment sensitivity factor (GISF) demonstrated a high value, the local service instance (LSI) operating within its own chain was obligated to make a decision regarding integration with the upstream local service provider (LSP), regardless of the degree of the service competition intensity. To explicate, in instances where the global industry similarity factor (GISF) demonstrated a substantial magnitude, the competing chain assumed accountability for the determination of integration. On the other hand, the local similarity index (LSI) induced the chain to incorporate its own upstream and downstream constituents.
By combining Figure 5 and Figure 6, as shown in Figure 7, e 1 C D < e i C C < e 2 C D in region F2. Therefore, when chain two chose to integrate under the lower green investment sensitivity coefficient and higher green investment competition degree, chain one chose not to integrate. At this time, incentive chain one provided a higher green service level of logistics service supply chain, because when the strategy of chain one changed from integration to non-integration, the two sides originally equalling the logistics service supply chain green service level ( e 1 C C = e 2 C C ) changed, incentivizing chain one to improve its green service level ( e 1 C C < e 1 D C ) and lowering chain two’s green service level ( e 2 D C < e 2 C C ). Therefore, chain one took the initiative to change to the non-integration state, and although it relinquished the integration benefit, it divided the service gap with chain two and gained the service advantage.
When ( k , u ) D 1 , e 2 C D < e i C C < e 1 C D . When chain two chose to integrate the higher green investment sensitivity coefficient and lower degree of green investment competition, chain one took integration measures, which improved its own green service level ( e 1 D C < e 1 C C ), decreased the green service level of chain two ( e 2 C C < e 2 D C ), and eliminated the service advantage of chain two.
Synthesizing the above discussion, this paper can draw the following inferences.
Corollary 1.
Regardless of whether rival chains chose to integrate, the integration strategy of one’s own logistics service supply chain would be affected by the green investment sensitivity coefficient and the degree of green investment competition from the green service level of the logistics service supply chain, as follows.
When two logistics service supply chains tend to choose the same strategy, although both parties provide an equal green service level of the logistics service supply chain, the purpose of their own logistics service supply chain is different. If both parties choose not to integrate (DD), their own logistics service supply chain avoids the service disadvantage incentive. If both parties choose to integrate (CC), their own logistics service supply chain eliminates the service advantage incentive of the rival chain. When two logistics service supply chains tend to choose different strategies (DC or CD), the aim of each of their own logistics service supply chains incentivise the improvement of their own green service levels, while reducing the other’s desire to invest in green service levels, ultimately achieving their own service advantages.

5.3. Numerical Analysis
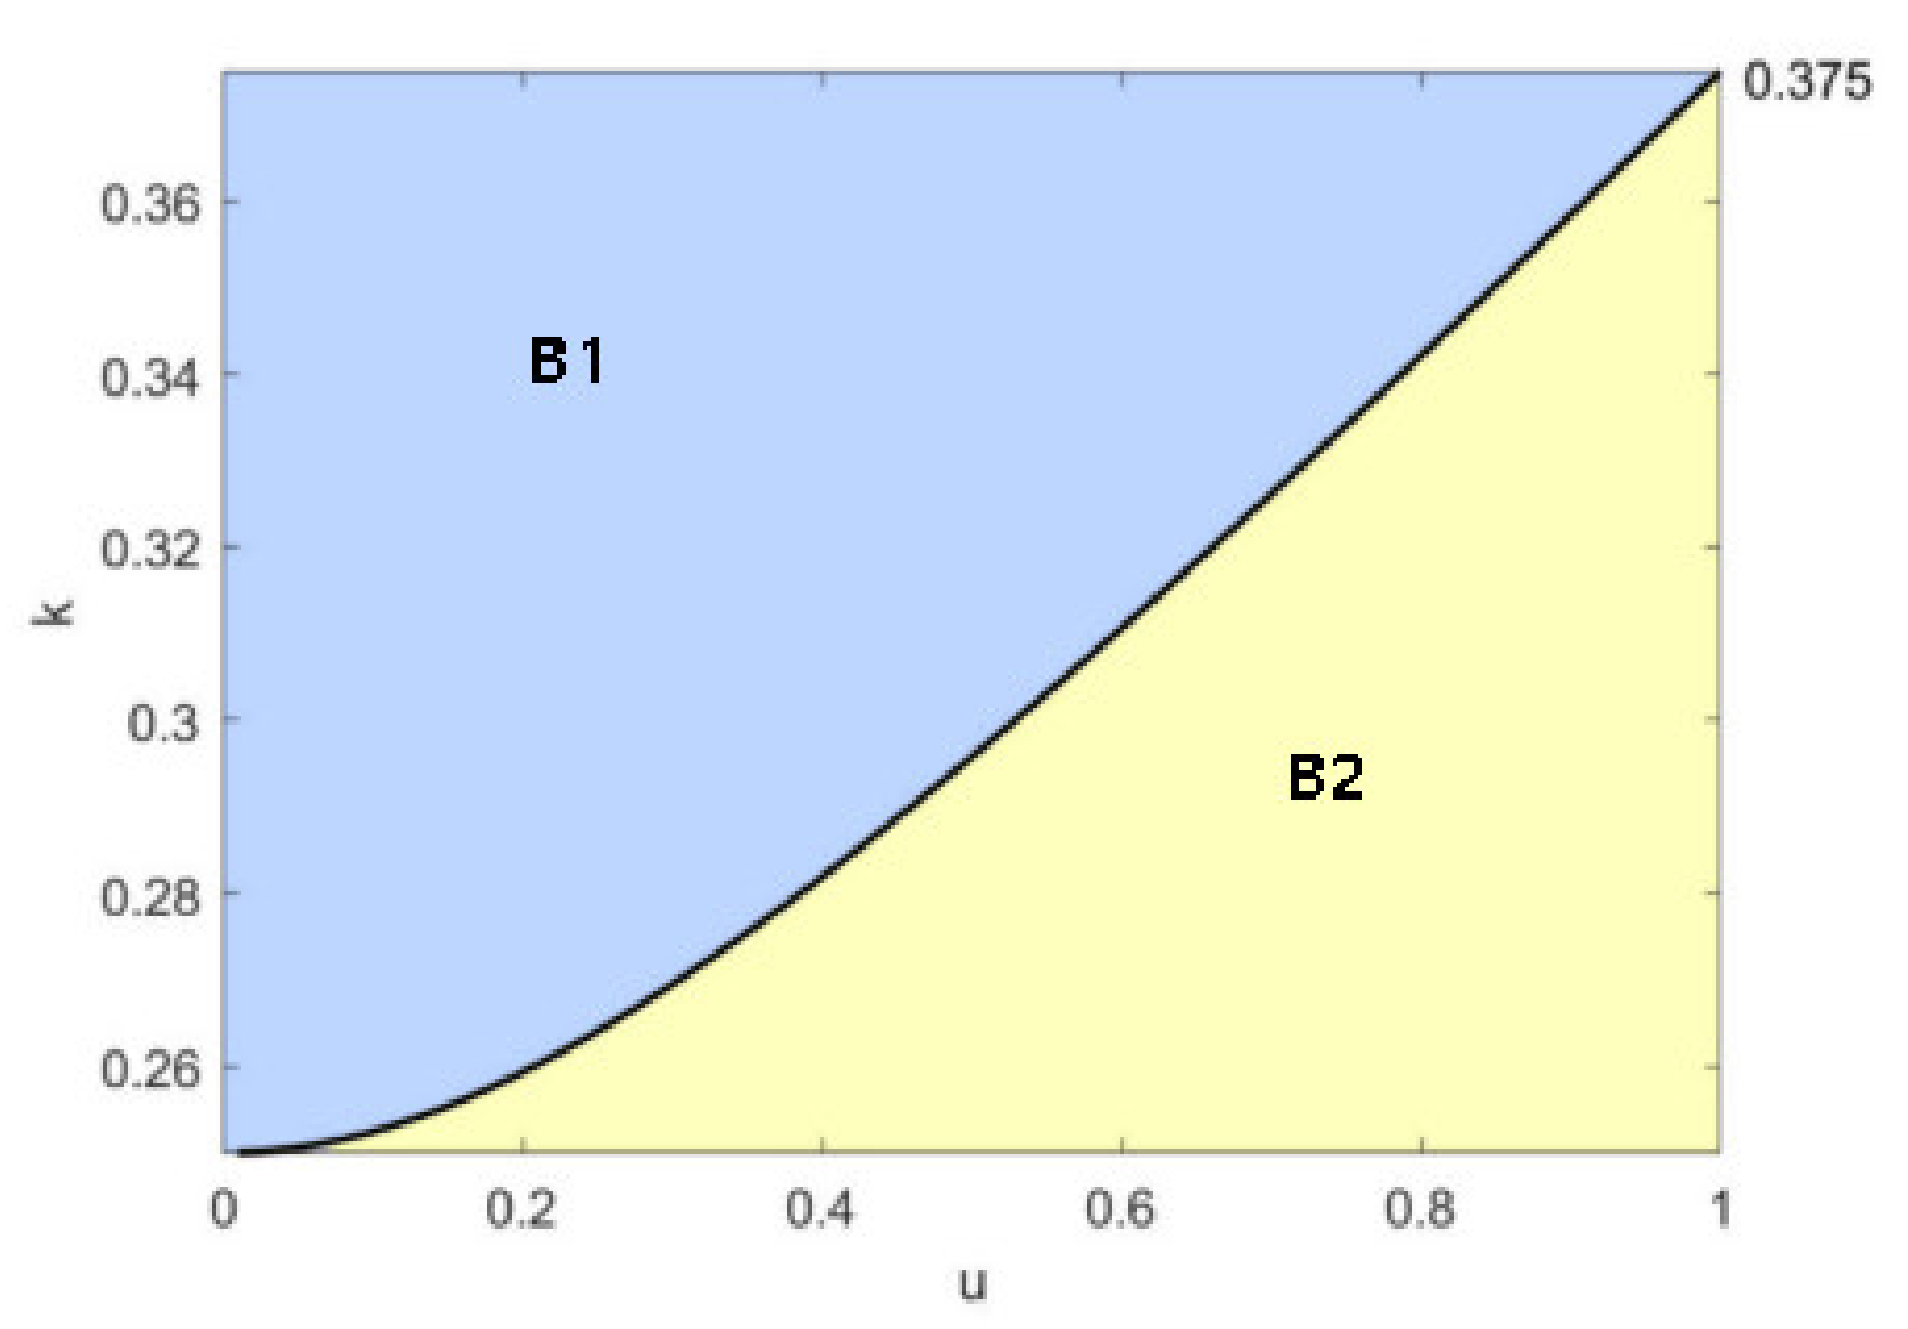
In this section, numerical simulations were used to analyse and verify the main findings of this paper. Under the premise of satisfying the basic assumptions of the model, the initial assignment of the relevant parameters was based on three different combinations of the theorem regarding the degree of competition between the two chains and the service input cost coefficient, which were assigned as follows ① a = 100 , c L S I = 4 , c L S p = 3 , k = 0.35 , u = 0.35 . ② a = 100 , c L S I = 4 , c L S p = 3 , k = 0.35 , u = 0.9 . ③ a = 100 , c L S I = 4 , c L S p = 3 , k = 0.5 , u = 0.5 . The results of the numerical analysis are shown in Table 3, Table 4 and Table 5, respectively, based on the initial assignment of the relevant parameters above and the results of the optimal decision solving for the different decision models.
(1)
As shown in Table 3, when the degree of competition and service input cost coefficients between the two chains were at low levels, comparing the dual centralised model (CC) and the hybrid model (CD) revealed that when the rival chain LSSC1 chose to integrate (C), LSSC2 chose the integration decision to achieve a higher level of green services. Comparing the hybrid model (CD) and the dual decentralised model (DD) revealed that when the counterparty chain LSSC2 chose not to integrate (D), LSSC1 chose the integration decision to achieve a higher level of green services and higher profits.
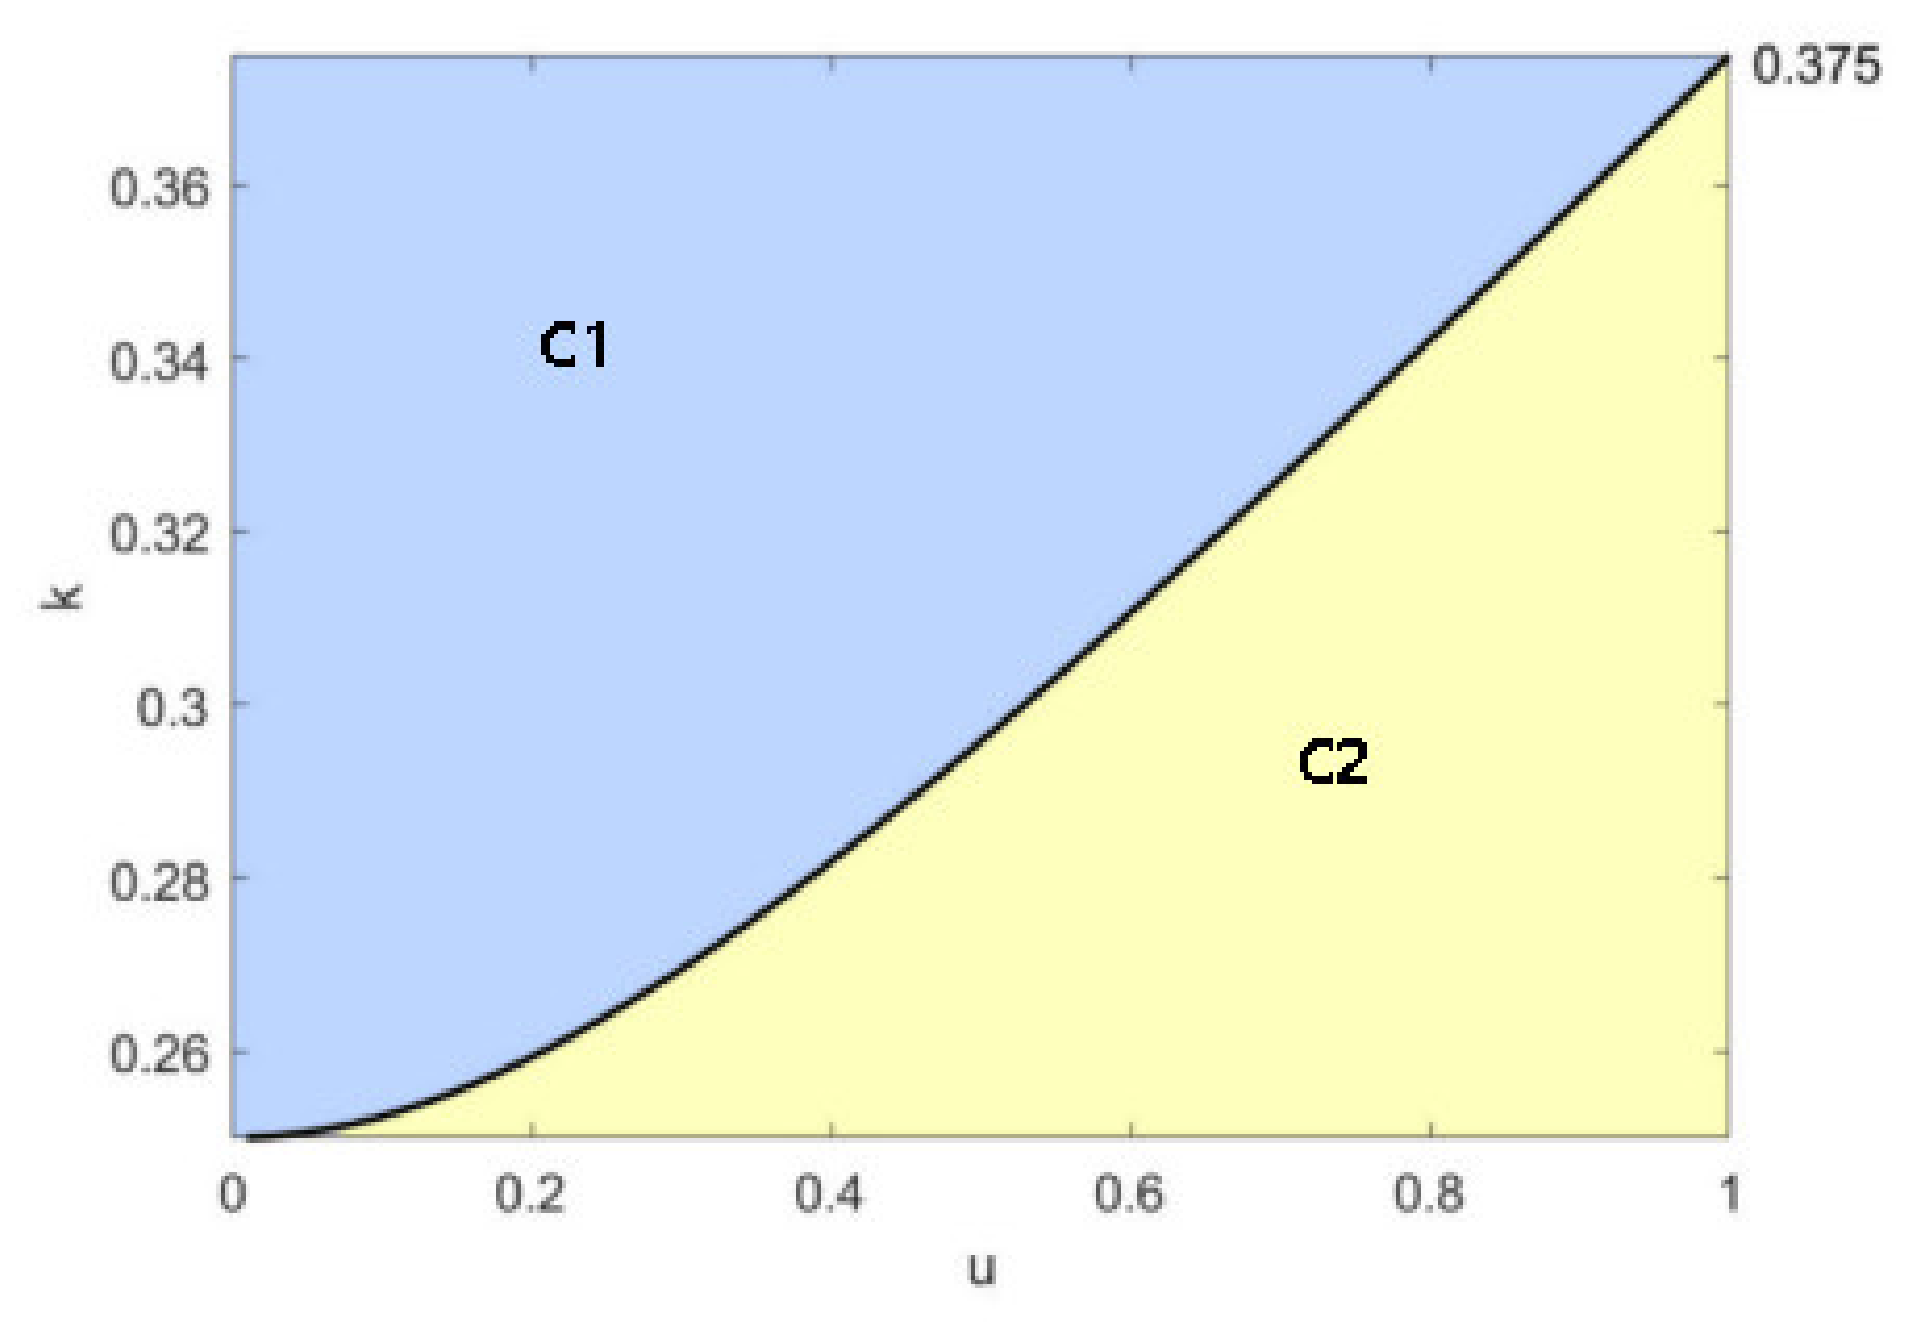
(2)
As shown in Table 4, when the competition level between the two chains was at a low level and the service input cost coefficient was at a high level, comparing the dual concentration model (CC) and the hybrid model (CD) revealed that when the rival chain LSSC1 chose to integrate (C), LSSC2 chose the non-integration decision to achieve a higher green service level. Comparing the hybrid model (CD) and the dual dispersion model (DD) revealed that when the rival chain LSSC2 chose not to integrate (D), LSSC1 chose the non-integration decision to achieve a higher level of green service.
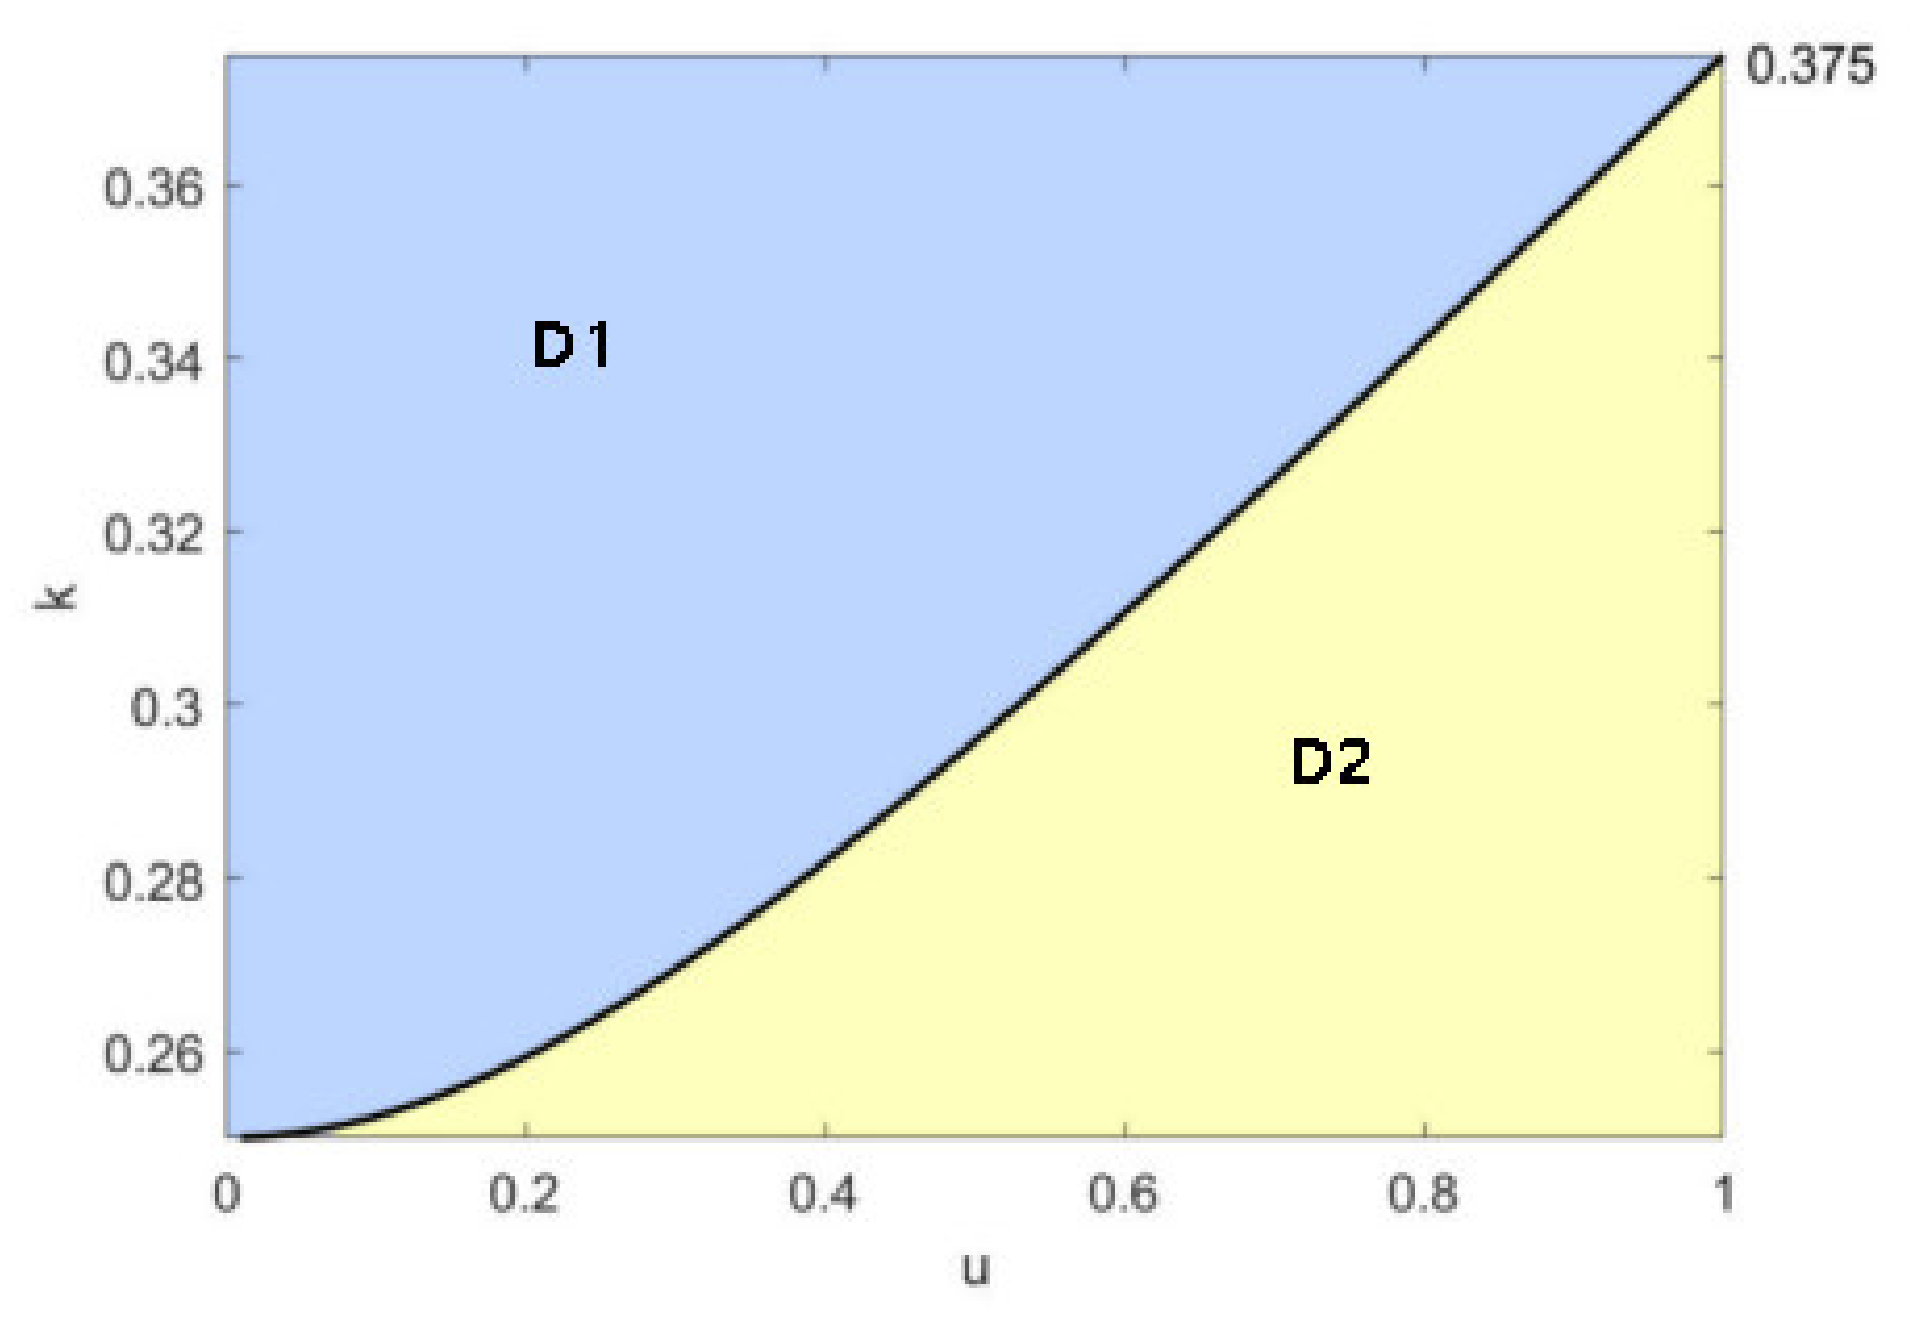
(3)
As shown in Table 5, when the degree of competition and service input cost coefficients between the two chains were at a high level, comparing the dual centralised model (CC) and the hybrid model (CD) revealed that when the rival chain LSSC1 chose to integrate (C), LSSC2 chose the integration decision to achieve a higher green service level. Comparing the hybrid model (CD) and the dual decentralised model (DD) revealed that when the rival chain LSSC2 chose not to integrate (D), LSSC1 chose the integration decision to achieve a higher level of green service.

6. Conclusions and Implications

Based on the analysis of the different integration models and the corresponding decision situations, the study offers the following findings.

6.1. Main Conclusions

(1)
In the cases where the green investment sensitivity coefficient exceeded a certain threshold, the decision to integrate the logistics service supply chain (LSSC) was decoupled from the level of service competition in two logistics service supply chains that were subject to horizontal Nash competition. In this instance, the variation in the service level of the LSSC was contrary to that of the competing chain. This implied that irrespective of the chosen course of action, the service level of the LSSC and its competitor chain were diametrically opposed.
Through the implementation of a divergent approach from its competitor, the LSSC optimised its service level while concurrently diminishing the service level of the competing chain. This phenomenon had the potential to confer a competitive edge to the LSSC within the marketplace.
(2)
The utilisation of the green investment sensitivity coefficient had the potential to mitigate the influence of competition on the decision-making process of firms with regard to their adoption of low-carbon supply chain (LSSC) practices. When the coefficient of sensitivity towards green investment was high, the decision of the competitor chain to integrate led to an increase in profits for its own chain, while causing a decrease in profits for the rival chain. In instances where the green investment sensitivity coefficient was elevated and the competitor chain opted for integration, the decision made by the one chain may result in an increase in the profits of the rival chain, while simultaneously causing a decline in the profits of its own chain. In the event that the competitor chain opted not to integrate, while the one chain chose to integrate, it is plausible that the profits of the one chain may escalate, while that of the rival chain may decline, particularly in cases where the green investment sensitivity coefficient is high. A high green investment sensitivity coefficient led to a scenario where the competitor chain opted for non-integration while the one chain chose integration, resulting in a boost in the rival chain’s profits but a decline in the one chain’s profits.
(3)
Initially, in the event that the competing chain opted for integration and the degree of sensitivity towards green investment was minimal, the corresponding chain implemented an integration tactic as a reaction to the reduced level of rivalry. This approach not only enhanced the quality of the chain’s own green service, but also diminished the quality of the competing chain’s green service. In the context of heightened competition, if a rival chain opted to integrate and the green investment sensitivity coefficient was low, the non-integration strategy employed by the one chain potentially enhanced the level of green service offered by the one chain, while concurrently diminishing the level of green service provided by the rival chain. When faced with a low sensitivity to green investment and competition from a rival chain, the decision to not integrate proved beneficial. In such scenarios, adopting a non-integration strategy not only enhanced the level of green service provided by the chain but also negatively impacted the rival chain. In cases where a competing chain opted out of integration and the degree of sensitivity towards green investment was minimal, the decision to integrate made by the chain in question under heightened competition not only elevated the standard of green services offered by said chain but also diminished the standard of green services offered by the rival chain.
(4)
The green investment sensitivity factor regulated the extent to which the level of competition affected LSSC decisions. When the green investment sensitivity coefficient remained constant, the best course of action for the supply chain shifted as the level of competition increased from being the same as the rival chain to being the opposite.
(5)
The service competition intensity and LSP green investment sensitivity coefficient both had an impact on each LSSC’s decision to integrate when the two LSSCs were competing against one another. When competing chains decided whether to adopt integration techniques, indicators such as the green investment sensitivity coefficient and the level of service competition affected the vertical integration decisions of their own chains.

6.2. Managenrial and Theoretical Implications

(1)
In the cases where the expenses associated with enhancing the eco-friendly service level of a unit were notably high, implementing a strategy that differed from that of the competing chain proved to be a viable approach to enhance the green service level.
(2)
The management implemented a non-integration strategy as a viable approach to enhance the green service level of their chain, particularly when the expenses associated with upgrading the service level of a unit were typically substantial. In instances where a chain opted for a non-integration approach, the managerial team executed an integration scheme to substantially enhance the chain’s level of eco-friendly service.
(3)
When a chain implemented the integration strategy, the manager employed it as a viable approach to enhance the quality of environmentally friendly services within the chain during periods of low competition. Conversely, during periods of high competition, the manager employed the non-integration strategy as an effective measure. In the context of chain management, the non-integration strategy was employed by managers to enhance the quality of their chain’s green service in situations where competitive intensity was relatively low. Conversely, in situations where competitive intensity was high, managers opted for the integration strategy to achieve the same objective.
(4)
The more managers adopted the opposite strategy to that of the rival chains, the more successful it was to increase the green service level of their own chain when the cost of enhancing the unit service level needed to be fixed. This was due to increased intense competition between the chains.
(5)
When making decisions about the vertical structure, it was important to consider not only one’s own future development strategy, but also the horizontal competitive factors of the market. The right combination of internal factors and external competition can only enable the enterprise to maximise profits. It is only through the timely adjustment of one’s vertical strategy according to different market environments and reasonable risk avoidance that one can enhance one’s competitiveness.

6.3. Limitations and Future Research Direction

This composition exhibited certain deficiencies. One possible scenario was that the two LSSCs could engage in a master–slave game, while another possibility was that the green investment sensitivity coefficients of the two LSPs may not have been equivalent. This study solely considered the scenario wherein the input coefficients for the service efficiency and equal rights were equivalent across both chains. It was possible for the member firms within a supply chain to have multiple dimensions that did not necessarily have to be mutually exclusive. Further investigation is necessary to explore the collective impact of multiple dimensions on the integration determination of the competitive supply chain. The present investigation focuses exclusively on analysing the influence of a single component of the firm’s service level on the decision-making process of integrating the competitive supply chain.

Author Contributions

Conceptualization, X.Z. and X.Y.; methodology, X.Z. and J.Z.; software, X.Z. and W.Q.; validation, X.Z., X.Y., J.Z. and W.Q.; formal analysis, X.Z., X.Y. and J.Z.; investigation, X.Z., X.Y., J.Z. and W.Q.; writing—original draft preparation, X.Z. and J.Z.; writing—review and editing, X.Z., X.Y., J.Z. and W.Q. All authors have read and agreed to the published version of the manuscript.

Funding

This research was supported by High Level Talent Research Launch Program in Inner Mongolia Agricultural University under grant number NDYB2020-28, National Natural Science Foundation of China (NSFC) under grant number 72163025, Program for Young Talents of Science and Technology in Universities of Inner Mongolia Autonomous Region under grant number NJYT22035, and the Natural Science Foundation of Inner Mongolia Autonomous Region under grant number 2021MS07022, Special Fund Program for Basic Research Business Expenses in Inner Mongolia Agricultural University under grant number BR220201.

Acknowledgments

The authors are grateful to the anonymous reviewers and editorial team for their constructive comments on the study.

Conflicts of Interest

The authors declare no conflict of interest.

Appendix A

Proof of Lemma 1.
e 1 C D e 1 D D = ( 8 k 1 u ) ( a c L S I c L S P ) 1 + 32 k 2 12 k u 2 a c L S I c L S P 8 k + u 1 = ( a c L S I c L S P ) [ ( 8 k 1 u ) ( 8 k + u 1 ) 1 32 k 2 + 12 k + u 2 ] ( 1 + 32 k 2 12 k u 2 ) ( 8 k + u 1 ) = 4 k ( a c L S I c L S P ) ( 8 k 1 ) ( 1 + 32 k 2 12 k u 2 ) ( 8 k + u 1 )
where
e 1 C D e 1 D D = g 1 f 1 ( k , u ) , k 0.25
where
g 1 = 4 k ( a c L S I c L S P ) ( 8 k 1 ) 8 k + u 1 > 0
f 1 ( k , u ) = 1 + 32 k 2 12 k u 2
Therefore, let f 1 ( k , u ) = 0 , which provides the undifferentiated curve u = u 1 ( k ) .
As shown in Figure 2, when 0.25 < k < 0.375 and u 1 ( k ) ( 0 , 1 ) , u 1 ( k ) monotonically increased with respect to k .
Located on the upper left-hand side of the curve that has not yet been differentiated, u = u 1 ( k ) , i.e., 0.25 < k < 0.375 and 0 < u < u 1 ( k ) . Therefore, f 1 ( k , u ) > 0 and e 1 C D > e 1 D D .
Located on the lower right portion, i.e., 0.25 < k < 0.375 and u 1 ( k ) < u < 1 , where f 1 ( k , u ) < 0 , then e 1 C D < e 1 D D .
When k 0.375 , f 1 ( k , u ) was monotonic about u , f 1 ( k , 0 ) = 1 + 32 k 2 12 k > 0 , and f 1 ( k , 1 ) = 32 k 2 12 k > 0 .
We established that when k 0.375 and 0 < u < 1 f 1 ( k , u ) > 0 , then e 1 C D > e 1 D D . Thus, Lemma 1 is proved. □

References

  1. Xu, X.; Yang, Y. Municipal hazardous waste management with reverse logistics exploration. Energy Rep. 2022, 8, 4649–4660. [Google Scholar] [CrossRef]
  2. Zheng, X.; Govindan, K.; Deng, Q.; Feng, L. Effects of design for the environment on firms’ production and remanufacturing strategies. Int. J. Prod. Econ. 2019, 213, 217–228. [Google Scholar] [CrossRef]
  3. Ikram, M.; Ferasso, M.; Sroufe, R.; Zhang, Q. Assessing green technology indicators for cleaner production and sustainable investments in a developing country context. J. Clean. Prod. 2021, 322, 129090. [Google Scholar] [CrossRef]
  4. Qiao, A.; Choi, S.; Pan, Y. Multi-party coordination in sustainable supply chain under consumer green awareness. Sci. Total Environ. 2021, 777, 146043. [Google Scholar] [CrossRef]
  5. Meng, Q.; Li, M.; Liu, W.; Li, Z.; Zhang, J. Pricing policies of dual-channel green supply chain: Considering government subsidies and consumers’ dual preferences. Sustain. Prod. Consum. 2021, 26, 1021–1030. [Google Scholar] [CrossRef]
  6. Chang, X.; Xu, G.; Wang, Q.; Zhong, Y. A Game Theoretic Approach for Eco-Design and Remanufacturing Considering Take-Back Policy. Sustainability 2020, 12, 7174. [Google Scholar] [CrossRef]
  7. Saunila, M.; Rantala, T.; Ukko, J.; Havukainen, J. Why invest in green technologies? Sustainability engagement among small businesses. Technol. Anal. Strat. Manag. 2019, 31, 653–666. [Google Scholar] [CrossRef]
  8. Zhang, D. A network economic model for supply chain versus supply chain competition. Omega Int. J. Manage. S. 2006, 34, 283–295. [Google Scholar] [CrossRef]
  9. Wang, J.; Liu, J. Vertical contract selection under chain-to-chain service competition in shipping supply chain. Transp. Policy 2019, 81, 184–196. [Google Scholar] [CrossRef]
  10. Jajja, M.S.S.; Chatha, K.A.; Farooq, S. Impact of supply chain risk on agility performance: Mediating role of supply chain integration. Int. J. Prod. Econ. 2018, 205, 118–138. [Google Scholar] [CrossRef]
  11. Sun, H.; Wan, Y.; Zhang, L.; Zhou, Z. Evolutionary game of the green investment in a two-echelon supply chain under a government subsidy mechanism. J. Clean. Prod. 2019, 235, 1315–1326. [Google Scholar] [CrossRef]
  12. Yi, Y.; Wang, Y.; Fu, C.; Li, Y. Taxes or subsidies to promote investment in green technologies for a supply chain considering consumer preferences for green products. Comput. Ind. Eng. 2022, 171, 108371. [Google Scholar] [CrossRef]
  13. Ahmad Jauhari, W. Sustainable inventory management for a closed-loop supply chain with energy usage, imperfect production, and green investment. Clean. Logist. Supply Chain. 2022, 4, 100055. [Google Scholar] [CrossRef]
  14. Liu, L.; Wang, Z.; Zhang, Z. Matching-Game Approach for Green Technology Investment Strategies in a Supply Chain under Environmental Regulations. Sustain. Prod. Consum. 2021, 28, 371–390. [Google Scholar] [CrossRef]
  15. Dong, C.; Liu, Q.; Shen, B. To be or not to be green? Strategic investment for green product development in a supply chain. Transp. Res. Part E Logist. Transp. Rev. 2019, 131, 193–227. [Google Scholar] [CrossRef]
  16. Jiang, S.; Ye, F.; Lin, Q. Managing green innovation investment in a Co-opetitive supply chain under capital constraint. J. Clean. Prod. 2020, 291, 125254. [Google Scholar] [CrossRef]
  17. Shi, J.; Yang, D.; Zheng, Z.; Zhu, Y. Strategic investment for green product development and green marketing in a supply chain. J. Clean. Prod. 2022, 366, 132868. [Google Scholar] [CrossRef]
  18. Du, S.; Wang, L.; Hu, L.; Zhu, Y. Platform-led green advertising: Promote the best or promote by performance. Transp. Res. Part E Logist. Transp. Rev. 2019, 128, 115–131. [Google Scholar] [CrossRef]
  19. Wang, C.; Zou, Z.; Geng, S. Green Technology Investment in a Decentralized Supply Chain under Demand Uncertainty. Sustainability 2021, 13, 3752. [Google Scholar] [CrossRef]
  20. Huang, Y.-S.; Fang, C.-C.; Lin, Y.-A. Inventory management in supply chains with consideration of Logistics, green investment and different carbon emissions policies. Comput. Ind. Eng. 2020, 139, 106207. [Google Scholar] [CrossRef]
  21. Gupta, R.; Goswami, M.; Daultani, Y.; Biswas, B.; Allada, V. Profitability and pricing decision-making structures in presence of uncertain demand and green technology investment for a three tier supply chain. Comput. Ind. Eng. 2023, 179, 109190. [Google Scholar] [CrossRef]
  22. Zhou, D.; Yu, Y.; Wang, Q.; Zha, D. Effects of a generalized dual-credit system on green technology investments and pricing decisions in a supply chain. J. Environ. Manag. 2019, 247, 269–280. [Google Scholar] [CrossRef] [PubMed]
  23. Zhang, X.; Yousaf, H.A.U. Green supply chain coordination considering government intervention, green investment, and customer green preferences in the petroleum industry. J. Clean. Prod. 2020, 246, 118984. [Google Scholar] [CrossRef]
  24. Yang, D.; Xiao, T.; Huang, J. Dual-channel structure choice of an environmental responsibility supply chain with green investment. J. Clean. Prod. 2019, 210, 134–145. [Google Scholar] [CrossRef]
  25. Yang, M. Green investment and e-commerce sales mode selection strategies with cap-and-trade regulation. Comput. Ind. Eng. 2023, 177, 109036. [Google Scholar] [CrossRef]
  26. Li, Z.; Pan, Y.; Yang, W.; Ma, J.; Zhou, M. Effects of government subsidies on green technology investment and green marketing coordination of supply chain under the cap-and-trade mechanism. Energy Econ. 2021, 101, 105426. [Google Scholar] [CrossRef]
  27. Sarkar, B.; Bhuniya, S. A sustainable flexible manufacturing–remanufacturing model with improved service and green investment under variable demand. Expert Syst. Appl. 2022, 202, 117154. [Google Scholar] [CrossRef]
  28. Wang, D.; Ge, G.; Zhou, Y.; Zhu, M. Pricing-decision analysis of green supply chain with two competitive manufacturers considering horizontal and vertical fairness concerns. Environ. Sci. Pollut. Res. 2022, 29, 66235–66258. [Google Scholar] [CrossRef]
  29. Guo, S.; Choi, T.-M.; Shen, B. Green product development under competition: A study of the fashion apparel industry. Eur. J. Oper. Res. 2020, 280, 523–538. [Google Scholar] [CrossRef]
  30. Lee, D.H. Pricing Decisions in a Competitive Closed-Loop Supply Chain with Duopolistic Recyclers. Math. Probl. Eng. 2020, 2020, 5750370. [Google Scholar] [CrossRef] [Green Version]
  31. Seyedhosseini, S.M.; Hosseini-Motlagh, S.-M.; Johari, M.; Jazinaninejad, M. Social price-sensitivity of demand for competitive supply chain coordination. Comput. Ind. Eng. 2019, 135, 1103–1126. [Google Scholar] [CrossRef]
  32. Chen, K.; Xiao, T. Pricing and replenishment policies in a supply chain with competing retailers under different retail behaviors. Comput. Ind. Eng. 2017, 103, 145–157. [Google Scholar] [CrossRef]
  33. Fan, P.; Wang, Y.; Dong, Y. Competitive Analysis of Operation Mode of Enterprise Value Chain under the Background of Green Economy. Math. Probl. Eng. 2021, 2021, 6681545. [Google Scholar] [CrossRef]
  34. Ma, P.; Zhang, C.; Hong, X.; Xu, H. Pricing decisions for substitutable products with green manufacturing in a competitive supply chain. J. Clean. Prod. 2018, 183, 618–640. [Google Scholar] [CrossRef] [Green Version]
  35. Yılmaz, F.; Pardalos, P.M. Minimizing average lead time for the coordinated scheduling problem in a two-stage supply chain with multiple customers and multiple manufacturers. Comput. Ind. Eng. 2017, 114, 244–257. [Google Scholar] [CrossRef]
  36. Li, B.; Zhu, M.; Jiang, Y.; Li, Z. Pricing policies of a competitive dual-channel green supply chain. J. Clean. Prod. 2016, 112, 2029–2042. [Google Scholar] [CrossRef]
  37. Zhu, W.; He, Y. Green product design in supply chains under competition. Eur. J. Oper. Res. 2017, 258, 165–180. [Google Scholar] [CrossRef]
  38. Madani, S.R.; Rasti-Barzoki, M. Sustainable supply chain management with pricing, greening and governmental tariffs determining strategies: A game-theoretic approach. Comput. Ind. Eng. 2017, 105, 287–298. [Google Scholar] [CrossRef]
  39. Zheng, Y.; Shu, T.; Wang, S.; Chen, S.; Lai, K.K.; Gan, L. Analysis of product return rate and price competition in two supply chains. Oper. Res. 2018, 18, 469–496. [Google Scholar] [CrossRef]
  40. Ai, X.; Chen, J.; Ma, J. Contracting with demand uncertainty under supply chain competition. Ann. Oper. Res. 2012, 201, 17–38. [Google Scholar] [CrossRef]
  41. Li, X.; Li, Y. Chain-to-chain competition on product sustainability. J. Clean. Prod. 2016, 112, 2058–2065. [Google Scholar] [CrossRef]
  42. Baron, O.; Berman, O.; Wu, D. Bargaining within the Supply Chain and Its Implications in an Industry. Decis. Sci. 2016, 47, 193–218. [Google Scholar] [CrossRef]
  43. Feng, Q.; Liu, T. Selection Strategy and Coordination of Green Product R&D in Sustainable Competitive Supply Chain. Sustainability 2022, 14, 8884. [Google Scholar] [CrossRef]
  44. Frohlich, M.T.; Westbrook, R. Arcs of integration: An international study of supply chain strategies. J. Oper. Manag. 2001, 19, 185–200. [Google Scholar] [CrossRef]
  45. Koufteros, X.; Vonderembse, M.; Jayaram, J. Internal and external integration for product development: The contingency effect of uncertainty, equivocality, and platform strategy. Decis. Sci. 2005, 36, 97–133. [Google Scholar] [CrossRef]
  46. Swink, M.; Narasimhan, R.; Wang, C. Managing beyond the factory walls: Effects of four types of strategic integration on manufacturing plant performance. J. Oper. Manag. 2007, 25, 148–164. [Google Scholar] [CrossRef]
  47. Vickery, S.K.; Jayaram, J.; Droge, C.; Calantone, R. The effects of an integrative supply chain strategy on customer service and financial performance: An analysis of direct versus indirect relationships. J. Oper. Manag. 2003, 21, 523–539. [Google Scholar] [CrossRef]
  48. Wei, J.; Zhao, J.; Hou, X. Integration strategies of two supply chains with complementary products. Int. J. Prod. Res. 2019, 57, 1972–1989. [Google Scholar] [CrossRef]
  49. Lin, Y.; Parlaktuerk, A.K.; Swaminathan, J.M. Vertical Integration under Competition: Forward, Backward, or No Integration? Prod. Oper. Manag. 2014, 23, 19–35. [Google Scholar] [CrossRef]
  50. Saberi, S.; Cruz, J.M.; Sarkis, J.; Nagurney, A. A competitive multiperiod supply chain network model with freight carriers and green technology investment option. Eur. J. Oper. Res. 2018, 266, 934–949. [Google Scholar] [CrossRef]
  51. Zhang, X.; Zhao, Q.; Zhang, J.; Yue, X. Logistics Service Supply Chain Vertical Integration Decisions under Service Efficiency Competition. Sustainability 2023, 15, 3915. [Google Scholar] [CrossRef]
  52. Yu, Y.; Xiao, T.; Feng, Z. Price and cold-chain service decisions versus integration in a fresh agri-product supply chain with competing retailers. Ann. Oper. Res. 2020, 287, 465–493. [Google Scholar] [CrossRef]
  53. Gürsoy, B.; Kara, S.S. Modelling of Just-In-Time Distrubution Network Under Raw Material Quality and Time Constraints; Kare Publishing: Kiev, Ukraine, 2021; Volume 3. [Google Scholar]
  54. Li, W.; Chen, J. Manufacturer’s vertical integration strategies in a three-tier supply chain. Transp. Res. Part E Logist. Transp. Rev. 2020, 135, 101884. [Google Scholar] [CrossRef]
  55. Wang, C.; Wang, L. Green investment and vertical alliances in the maritime supply chain. Environ. Dev. Sustain. 2022, 25, 6657–6687. [Google Scholar] [CrossRef]
  56. Saha, S.; Nielsen, I.; Sana, S.S. Effect of Optimal Subsidy Rate and Strategic Behaviour of Supply Chain Members under Competition on Green Product Retailing. Math. Probl. Eng. 2021, 2021, 6661103. [Google Scholar] [CrossRef]
  57. Bai, Q.; Chen, J.; Xu, J. Energy conservation investment and supply chain structure under cap-and-trade regulation for a green product. Omega 2023, 119, 102886. [Google Scholar] [CrossRef]
  58. Du, S.; Hu, L.; Wang, L. Low-carbon supply policies and supply chain performance with carbon concerned demand. Ann. Oper. Res. 2017, 255, 569–590. [Google Scholar] [CrossRef]
  59. Nielsen, I.; Majumder, S.; Szwarc, E.; Saha, S. Impact of Strategic Cooperation under Competition on Green Product Manufacturing. Sustainability 2020, 12, 10248. [Google Scholar] [CrossRef]
  60. Shang, W.; Wang, B.; Xia, D. A game between green and non-green supply chains considering two-way government intervention and manufacturer competition. Front. Environ. Sci. 2022, 10, 1002124. [Google Scholar] [CrossRef]
  61. Cheng, W.; Wu, Q.; Ye, F.; Li, Q. The Impact of Government Interventions and Consumer Green Preferences on the Competition between Green and Nongreen Supply Chains. Sustainability 2022, 14, 5893. [Google Scholar] [CrossRef]
Figure 1. Models of the competition between the secondary LSSCs.
Sustainability 15 10386 g001
Figure 2. Relationship diagram between e 1 C D and e 1 D D .
Sustainability 15 10386 g002
Figure 3. Relationship diagram between e 2 C D and e 2 D D .
Sustainability 15 10386 g003
Figure 4. Relationship diagram between e 1 C D , e 1 D D and e 2 C D , e 2 D D .
Sustainability 15 10386 g004
Figure 5. Relationship diagram between e 1 C D and e 1 C C .
Sustainability 15 10386 g005
Figure 6. Relationship diagram between e 2 C D and e 2 C C .
Sustainability 15 10386 g006
Figure 7. Relationship diagram between e 1 C D , e 1 C C and e 2 C D , e 2 C C .
Sustainability 15 10386 g007
Table 1. Four structural combinations of the two secondary LSSCs.
L S S C 1   Chooses   to   Integrate L S S C 1   Chooses   not   to   Integrate
L S S C 2 chooses to integrateCCDC
L S S C 2 chooses not to integrateCDDD
Table 2. Description of the variables and symbols.
SymbolsDescription
L S S C Logistics services supply chain
L S I i Logistics service integrator i
L S P i Logistics service provider i
c L S I Unit operating costs of the integrators
c L S P Service provider’s unit operating costs
Π L S P i Service provider i’s profit
Π L S I i Profit of the integrator i
Π L S S C i Total profit of the chain i
q i Number of orders for logistics services for the chain i
p i Market unit price of logistics services for the chain i
e i Level of investment in green services for the service provider i
h i Wholesale unit price of logistics services for the service provider i
a Potential basic demand in the logistics market
u Intensity of competition between the different integrators
k Service provider’s green investment sensitivity factor
b Coefficient of the reduction in the unit cost of green investment in logistics services, also known as the unit improvement factor
Table 3. Equilibrium decisions for the different integration decision models at k = 0.35 and u = 0.35.
VariablesIntegration of the Decision-Making Models
Model for Dual Concentration (CC)Modelling Mixing
(CD)
Model of Double Decentralisation
(DD)
p 1 93.8164.9896.70
p 2 6.36
e 1 124225.6943.26
e 2 10.90
q 1 86.8225.6915.14
q 2 5.45
π   L S S C 1 484,3447131.062095.59
π L S S C 2 67.83
Table 4. Equilibrium decisions for the different integration decision models at k = 0.35 and u = 0.9.
VariablesIntegration of the Decision-Making Models
Model for Dual Concentration (CC)Modelling Mixing
(CD)
Model of Double Decentralisation
(DD)
p 1 57.0864477
p 2 1122.33
e 1 71.5419.934.44
e 2 723.33
q 1 50.0819.912.06
q 2 361.67
π   L S S C 1 3363.5121,0861328.79
π L S S C 2 298,977.78
Table 5. Equilibrium decisions for the different integration decision models at k = 0.5 and u = 0.5.
VariablesIntegration of the Decision-Making Models
Model for Dual Concentration (CC)Modelling Mixing
(CD)
Model of Double Decentralisation
(DD)
p 1 6991.54685.714
p 2 57.727
e 1 6284.54626.571
e 2 33.818
q 1 6284.54613.286
q 2 16.909
π   L S S C 1 17,2983573.9671765.102
π L S S C 2 714.793
Disclaimer/Publisher’s Note: The statements, opinions and data contained in all publications are solely those of the individual author(s) and contributor(s) and not of MDPI and/or the editor(s). MDPI and/or the editor(s) disclaim responsibility for any injury to people or property resulting from any ideas, methods, instructions or products referred to in the content.

