Article

Salt Cavern Thermal Damage Evolution Investigation Based on a Hybrid Continuum-Discrete Coupled Modeling

1
State Key Laboratory of Shale Oil and Gas Enrichment Mechanisms and Effective Development, Beijing 100083, China
2
State Energy Center for Shale Oil Research and Development, Beijing 100083, China
3
Key Laboratory of Petroleum Engineering Beijing, Ministry of Education, Beijing Key Laboratory of Urban Oil & Gas Distribution Technology, China University of Petroleum, Beijing 102249, China
4
Sinochem Energy Logistics Corporation, Ltd., Beijing 100031, China
5
China Petroleum Engineering & Construction Corp. Beijing Engineering Company, Beijing 100085, China
*
Author to whom correspondence should be addressed.
Sustainability 2023, 15(11), 8718; https://doi.org/10.3390/su15118718
Submission received: 19 April 2023 / Revised: 24 May 2023 / Accepted: 24 May 2023 / Published: 28 May 2023
(This article belongs to the Special Issue Advances in Rock Mechanics and Geotechnical Engineering)

Abstract

:
The integrity and stability of salt caverns for natural gas storage are subjected to a gas cycling loading operation. The coupled effect of confining pressure and temperature on the response of the salt cavity surrounding the wall is essential to stability analysis. In this study, a hybrid continuum-discrete model accounting for the thermal-mechanical process is proposed to investigate the thermal-damage evolution mechanism towards a field case with blocks falling off the salt cavity. The salt cavity is modeled by continuum zones, and the potential damage zones are simulated by discrete particles. Three specimens at different locations around the surrounding wall are compared in the context of severe depressurization. The dynamic responses of rock salt, including temperature spatiotemporal variation, microscopic cracking patterns, and energy evolution exhibit spatial and confinement dependence. A series of numerical simulations were conducted to study the influence of microproperties and thermal properties. It is shown that the evolution of cracks is controlled by (1) the thermal-mechanical process (i.e., depressurization and retention at low pressure) and (2) the anomalous zone close to the brim of the salt cavity surrounding the wall. The zone far away from the marginal surrounding wall is less affected by temperature, and only the mechanical conditions control the development of cracks. This continuum/discontinuum approach provides an alternative method to investigate the progressive thermal damage and its microscopic mechanism.

1. Introduction

Salt rock is an attractive candidate for hosting energy storage, due to its favorable low permeability [1,2,3,4]. The salt caverns, which are constructed by the solution mining process, have been used as gas storage for several decades. However, when the salt cavern is subjected to gas-cycling loading, there are potential risks of fractures generation, block fall, and even collapse on the cavern roof [5,6,7]. The thermal damage evolution induced by the cycling loading process is still unknown and is worth investigating by innovative methods.

1.1. Problem Statement

A field case with blocks falling off from the roof of a salt cavern in Jintan, Jiangsu province of China has been demonstrated by Li et al. [8]. Compared with the sonar results between the four years, there is a 4-m displacement at the shoulder of the salt cavity, indicating the cavern geometry has been altered (see Figure 1). The field engineers assumed that it was the consequence of the thermal effects induced by the gas-cycling loadings. They suspected that the thermal stress led to spalling and resulted in the collapse of the roof eventually, after a 4-year operation. A proposed thermal-mechanical modeling in FLAC3D has been established, and the numerical work confirmed the thermal effect had impacted the stability of the salt cavern to some extent. Additionally, the operation conditions triggering the roof collapse are concluded. Despite the previous research achievements, some fundamental mechanisms of the thermal-dynamic response of rock salt are yet to be understood, particularly the onset and propagation of thermal micro-cracks, i.e., the thermal damage process induced by the thermal effect during gas-cycling loading in a salt cavern.

1.2. Micromechanism of Thermal Damage

Thermo-mechanical responses of containment rocks are critical to the design and safe operation of underground energy storage [9]. The thermal effect induced by a gas injection-and-withdrawal process in a salt cavern was discussed comprehensively [10] (2019), who indicated that a tensile crack is possibly created at the surrounding rock of the salt cavity. Following Bérest’s work, both experimental and numerical investigations were conducted to investigate the thermo-mechanical response of salt caverns during rapid cooling [11,12,13,14,15,16,17]. To ensure the integrity and stability of salt caverns, fractures, and rock damage should be avoided [18,19,20,21]. Rock damage is defined as the degradation of the macroscopic properties, such as strength, stiffness, etc [22,23,24]. The damage is the consequence of microcracks propagation, coalescence [25,26,27,28,29], and stiffness degradation [30]. The damage mechanics in rock engineering studies the evolution of damage that starts from microcracks and results in rupture failure in the macroscale of the structure [31]. Creep, one of the features of rock salt, is accompanied by microfractures [2]. Under cyclic loading, the fatigue-induced damage of salt rock at first is relatively small and then increases rapidly when it is close to failure [32]. Quick cyclic loading is prone to damage [33]. Ding et al. [34] investigated the grain-scale micromechanisms of the deformation of salt rock and concluded that viscoelastic and hysteretic behaviors are associated with the microprocesses at grain boundaries. Li et al. [35] investigated the damage pattern of rock salt subjected to cycling loadings for CAES and concluded that different responses of the internal structure to fatigue and creep lead to the interaction between creep and fatigue. The micromechanisms of thermal damage in rock salt are even more complicated and challenging.

1.3. Development of Hybrid Modeling

Numerical simulation is considered an important method to study the stability performance during the operation’s full life cycle and the associated mechanisms of salt caverns for energy storage [36]. The finite element method (FEM) has been utilized extensively for the salt-cavity integrity analysis. Many constitutive damage-mechanics models have been developed for salt rock. However, those constitutive models are not able to predict damage and other dynamic behaviors associated with microfractures.
The discrete element method (DEM) [37] was proposed later than FEM, as an alternative method, and has its own advantages over other methods. DEM treats rock materials as an assembly of rigid particles bonded with certain segregated contact modes. Discrete elements are independent and allow departing from the rock mass. When forces acting on the particles exceed their bond strength, the contact bond breaks. In DEM, the fracture is deciphered explicitly, the damage progress is reproduced as microcracks coalesce into macrofractures, and the dynamic process can be simulated simultaneously. When compared with FEM, the damage mechanism in DEM is not based on complex damage constitutive correlations; instead, the breakage between particles is simple, while the macroscopic damage is the consequence of individual “breakage”, the assembling of discrete dynamic behavior, and the properties of the individual particle. Zhao et al. [38] proposed a grain texture model (GTM) with DEM, and, for the first time, this model can capture the major macromechanical characteristics of textured rock, including the failure process. Despite the unique features of DEM in dealing with the dynamic process, the computation efficiency is limited owing to the huge number of particles. Usually, computation efficiency depends on the number of particles and the size of the domain.
In order to overcome the shortcoming of computational efficiency in DEM, and meanwhile to investigate the dynamic behavior of rock engineering problems, hybrid models based on the continuum-discrete method are adopted. Hu et al. [39] (2021) employed a 3D continuum-discrete coupled method to establish the triaxial Hopkinson bar system, in which the steel bars and a cubic specimen were modeled by continuum zones and bonded-particle sections, respectively. This model was able to simulate the dynamic responses of the rock under different load conditions. Zhang et al. [40,41] (2017, 2019) demonstrated the capability of hybrid discrete-continuum modeling to simulate hydraulic fracturing propagation and interactions with natural fractures. The continuum-discrete coupled model has advantages in reproducing confinement loading via continuum and, meanwhile, accounts for the microstructure and the dynamic microbehavior of the target specimen via a discrete method. In general, the hybrid method is promising in addressing dynamic deformation, the fracturing behaviors of rock, and the related dynamic problems. Particularly, the continuum-discrete hybrid model established a correlation between macroscopic performance and the microscopic mechanism in the damage of rock.
The field case with blocks falling off from the roof of a salt cavern in Jintan, China was investigated with a thermal-mechanical model in FLAC3D (Li et al., 2021) [8]. However, the thermal effects on the micromechanism and microcracking evolution are lacking, and the progressive damage mechanism during the operation is still unknown. In this study, a 3D continuum-discrete coupled hybrid model is established to investigate the thermal-mechanical dynamic behavior of the surrounding rock of the salt cavity subjected to gas cycling loadings. The salt cavern is represented by continuum zones, while the rock specimens on the roof with potential damage risks are simulated by discrete-element modeling. The hybrid model accounts for the influence of temperature variation. The thermal-mechanical coupling mechanism in the hybrid model is described in Section 2 of this paper. In Section 3, three specimens at different locations around the surrounding wall of the salt cavern are selected to understand the thermal damage process in the context of severe depressurization during operation. A parametric study is performed in Section 4 to discuss the influence of confining loading and the effects of rock properties parameters on cracking development. Based on this, the conclusions are presented in Section 5.

2. Numerical Method

A 3D continuum-discrete coupled hybrid model is presented in this section. This model is an improved one after Li et al. (2021) [8]. The salt cavern is represented by continuum zones using fast Lagranian analysis of continua (FLAC3D), while the rock specimens on the roof where the collapse occurs are represented by discrete element modeling, implemented by particle flow code (PFC3D), shown in Figure 2. The coupling methodology is described as follows in detail.

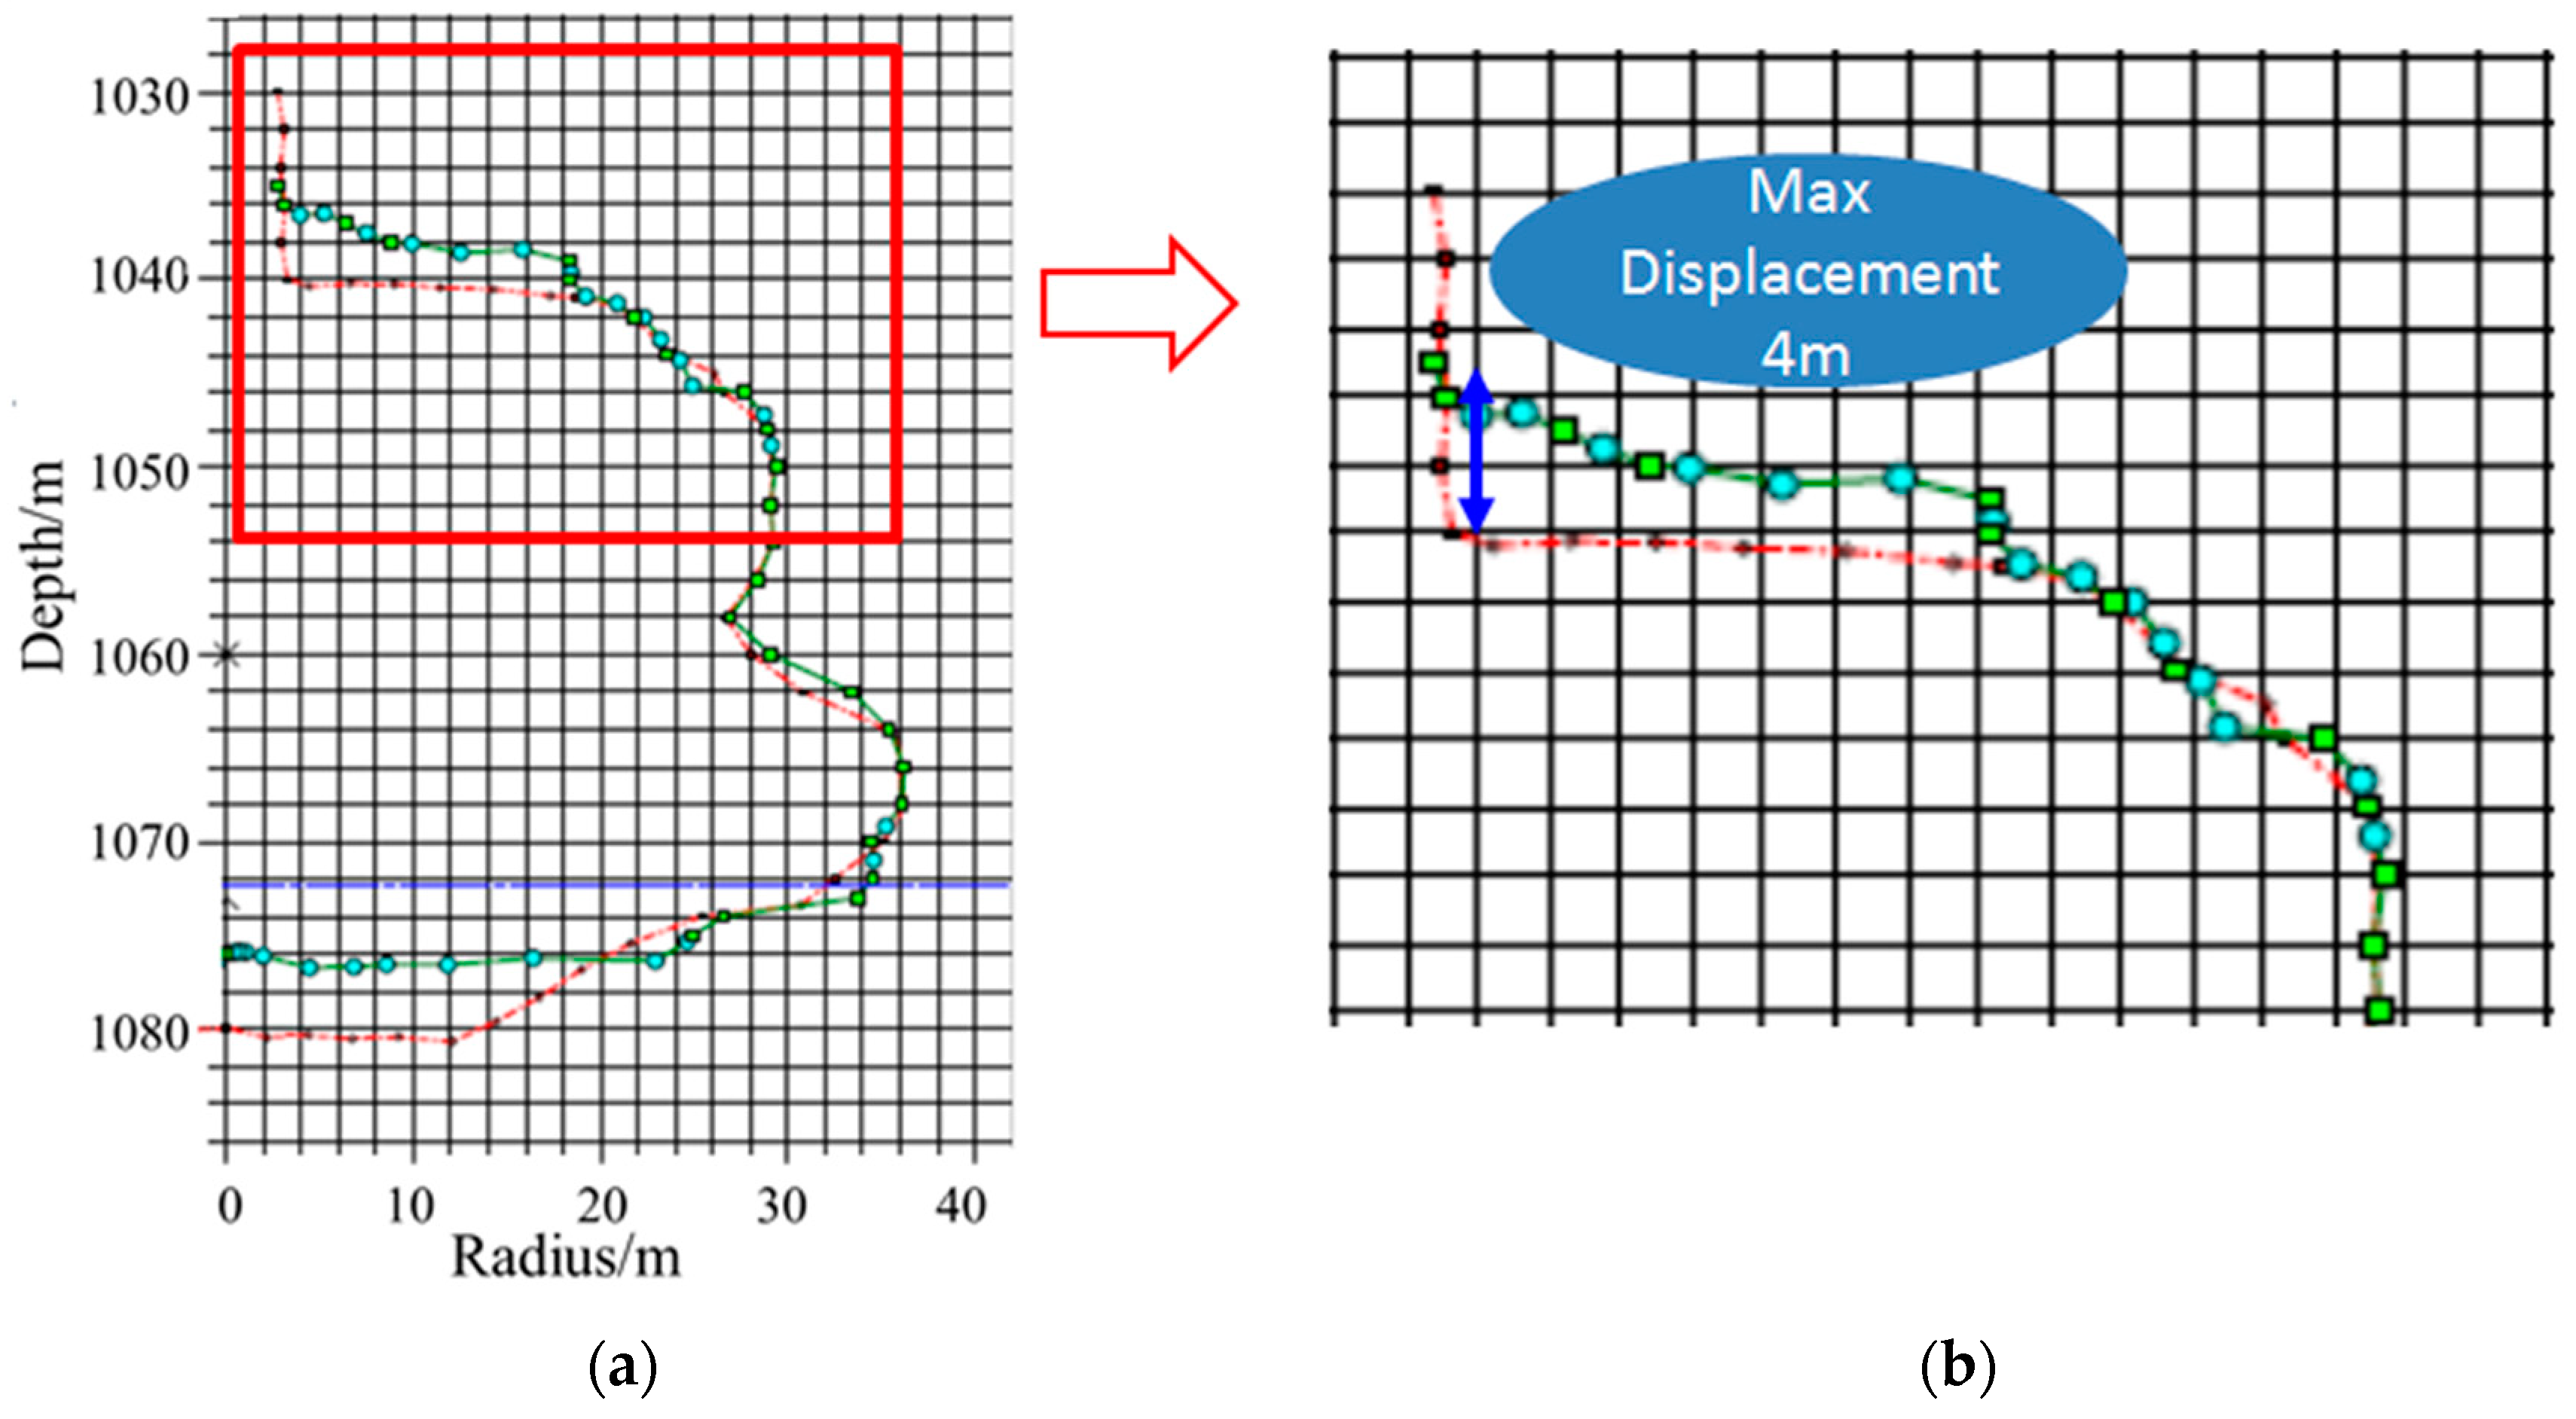
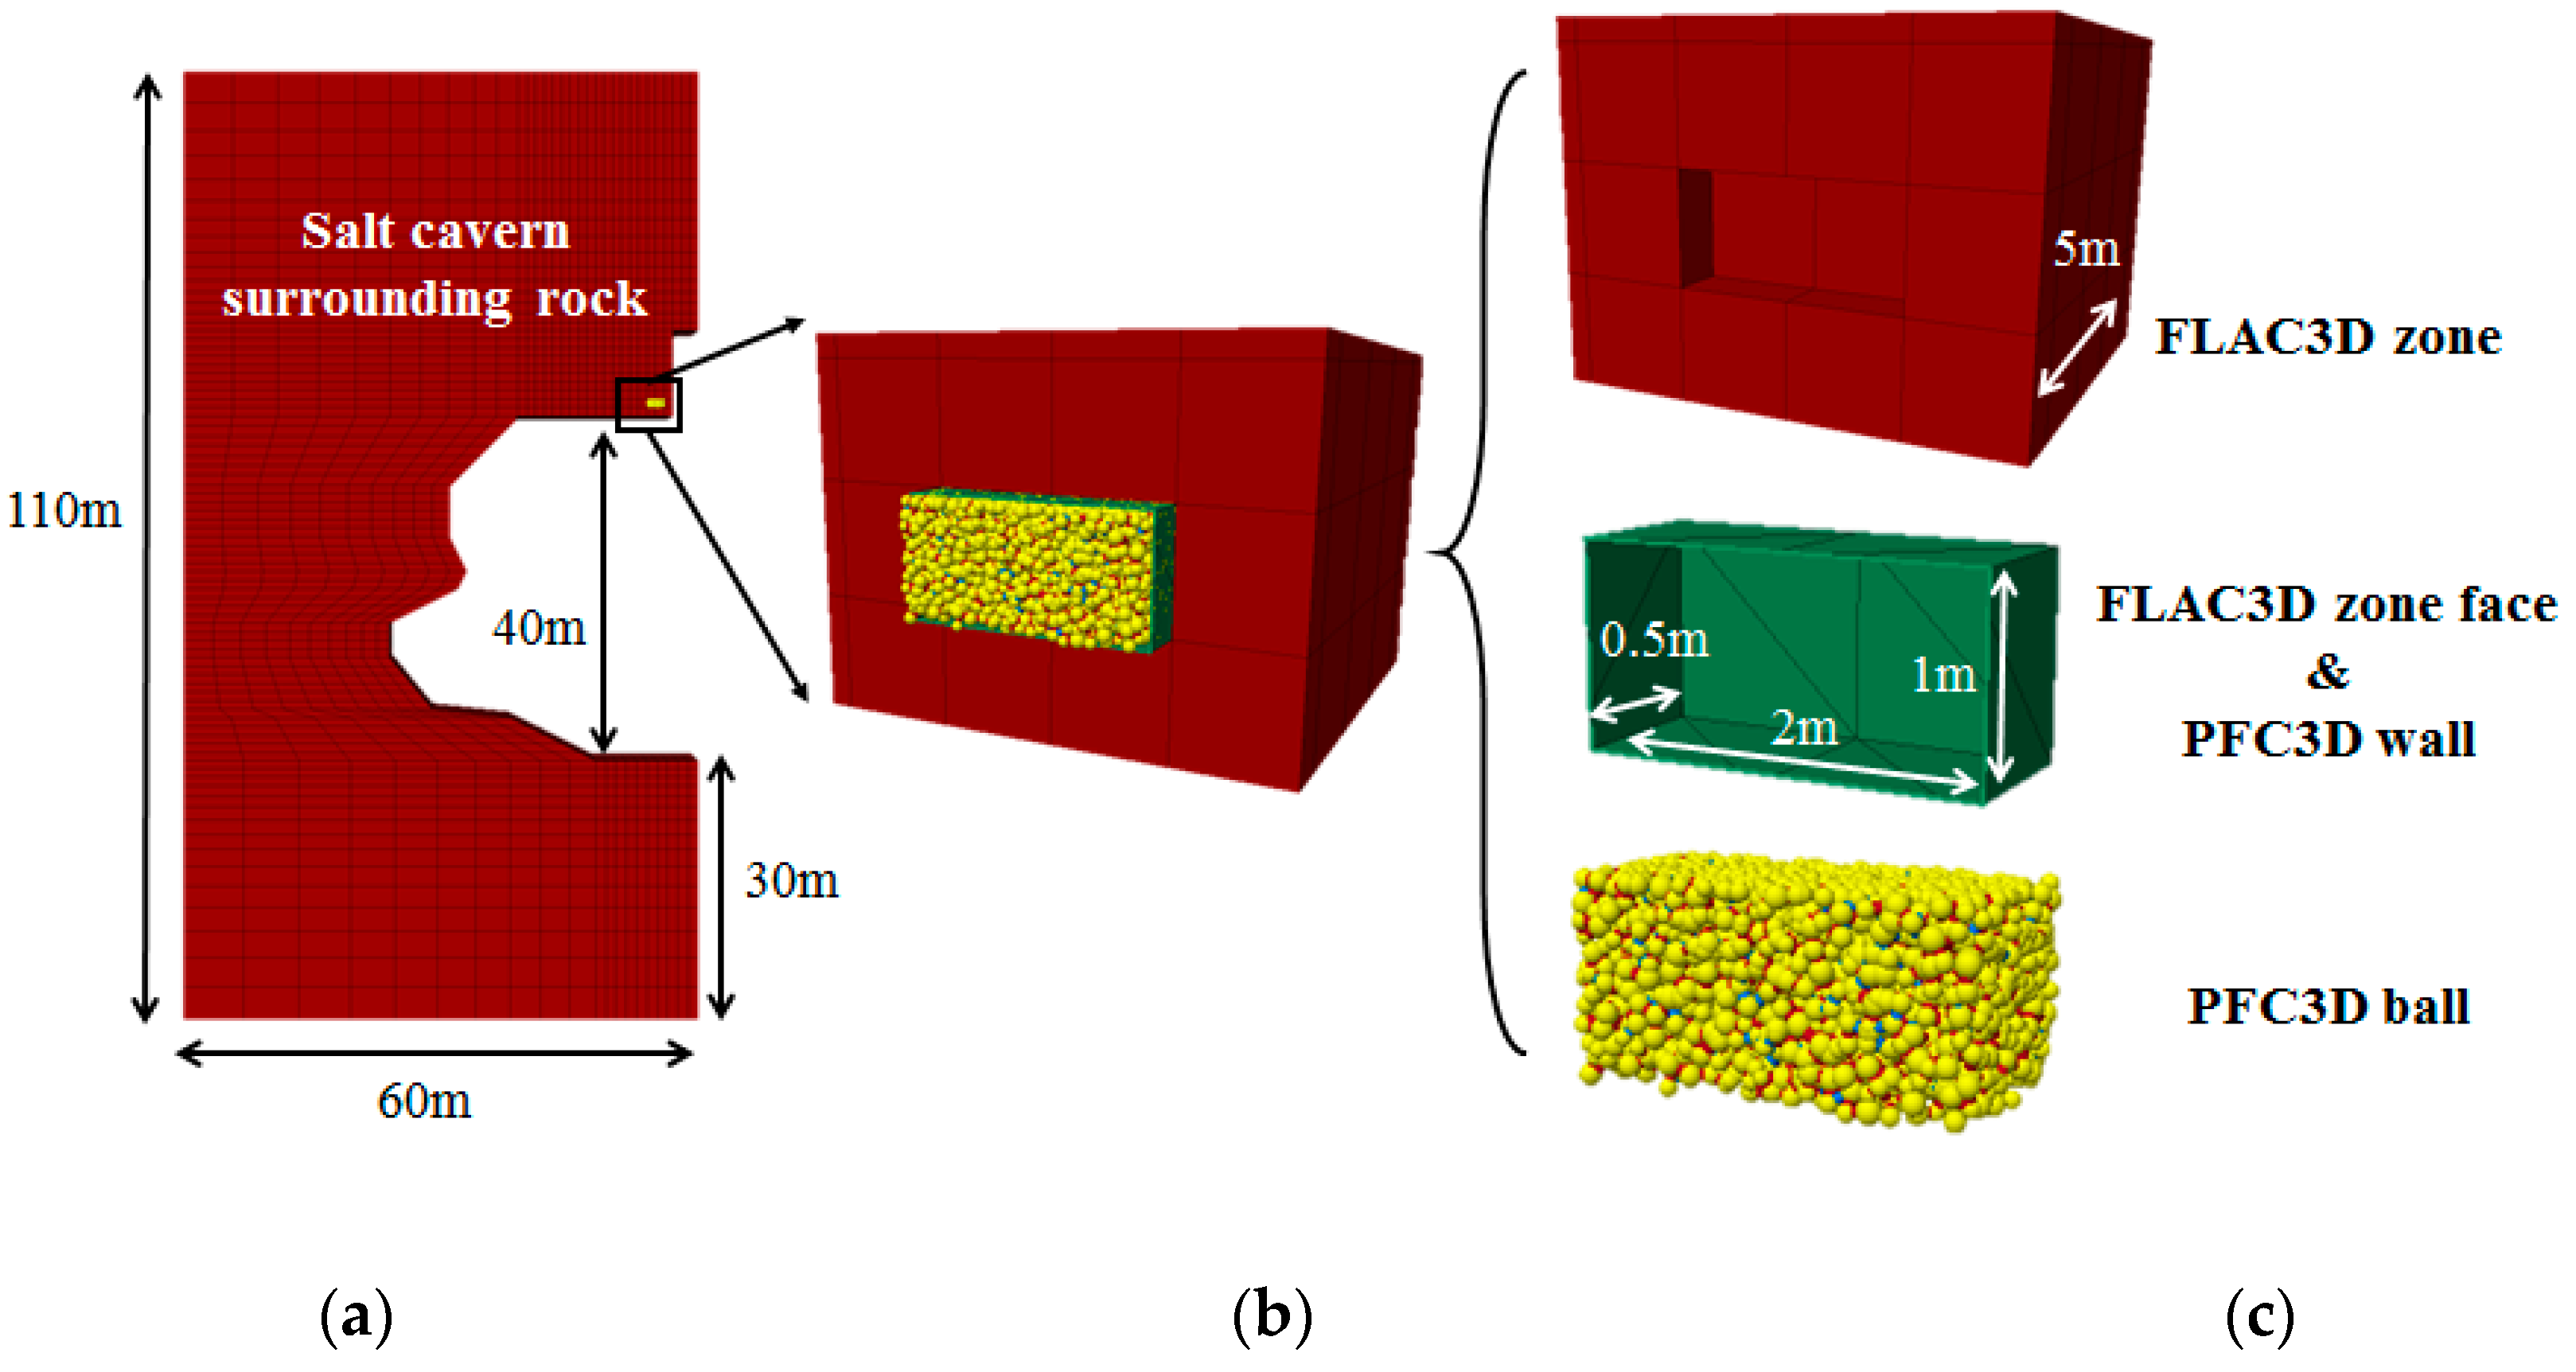
2.1. Model Description

To investigate the thermal damage induced by the operation condition, a 3D continuum-discrete coupled model is adopted using FLAC3D-PFC3D. As shown in Figure 3, the salt cavern surrounding rock is a continuous medium and FLAC3D is employed. To improve the computational efficiency, the simulation objective is one quarter of the entire salt cavity. The geometry of the FLAC3D domain is a length of 60 m, a width of 30 m, and a height of 110 m. The FLAC3D zone face and PFC3D wall are the interface, the geometry is 0.5   m × 1   m × 2   m . The rock properties used in the FLAC3D continuum-based method are listed in Table 1.
The PFC3D domain is embedded in a FLAC3D domain, consisting of 10,607 particles, and is located at the cavity shoulder. The location is selected due to its potential damage risk, where the block falls apart from the surrounding rock. For those selected sections, PFC is employed to mimic the dynamic and irreversible damage behavior of the rock salt, aiming at reproducing the evolution of microfractures. From the view of the discrete element method, the rock specimen is regarded as assemblies of discrete rigid particles connected with certain contacts. The movements of particles are governed by Newton’s second law. The contact bond breaks when the contact force exceeds the tensile or shear strength of the contact bonds, caused by motion between adjacent particles. The input parameters of the FLAC3D and PFC3D models are listed in Table 1 and Table 2, respectively.

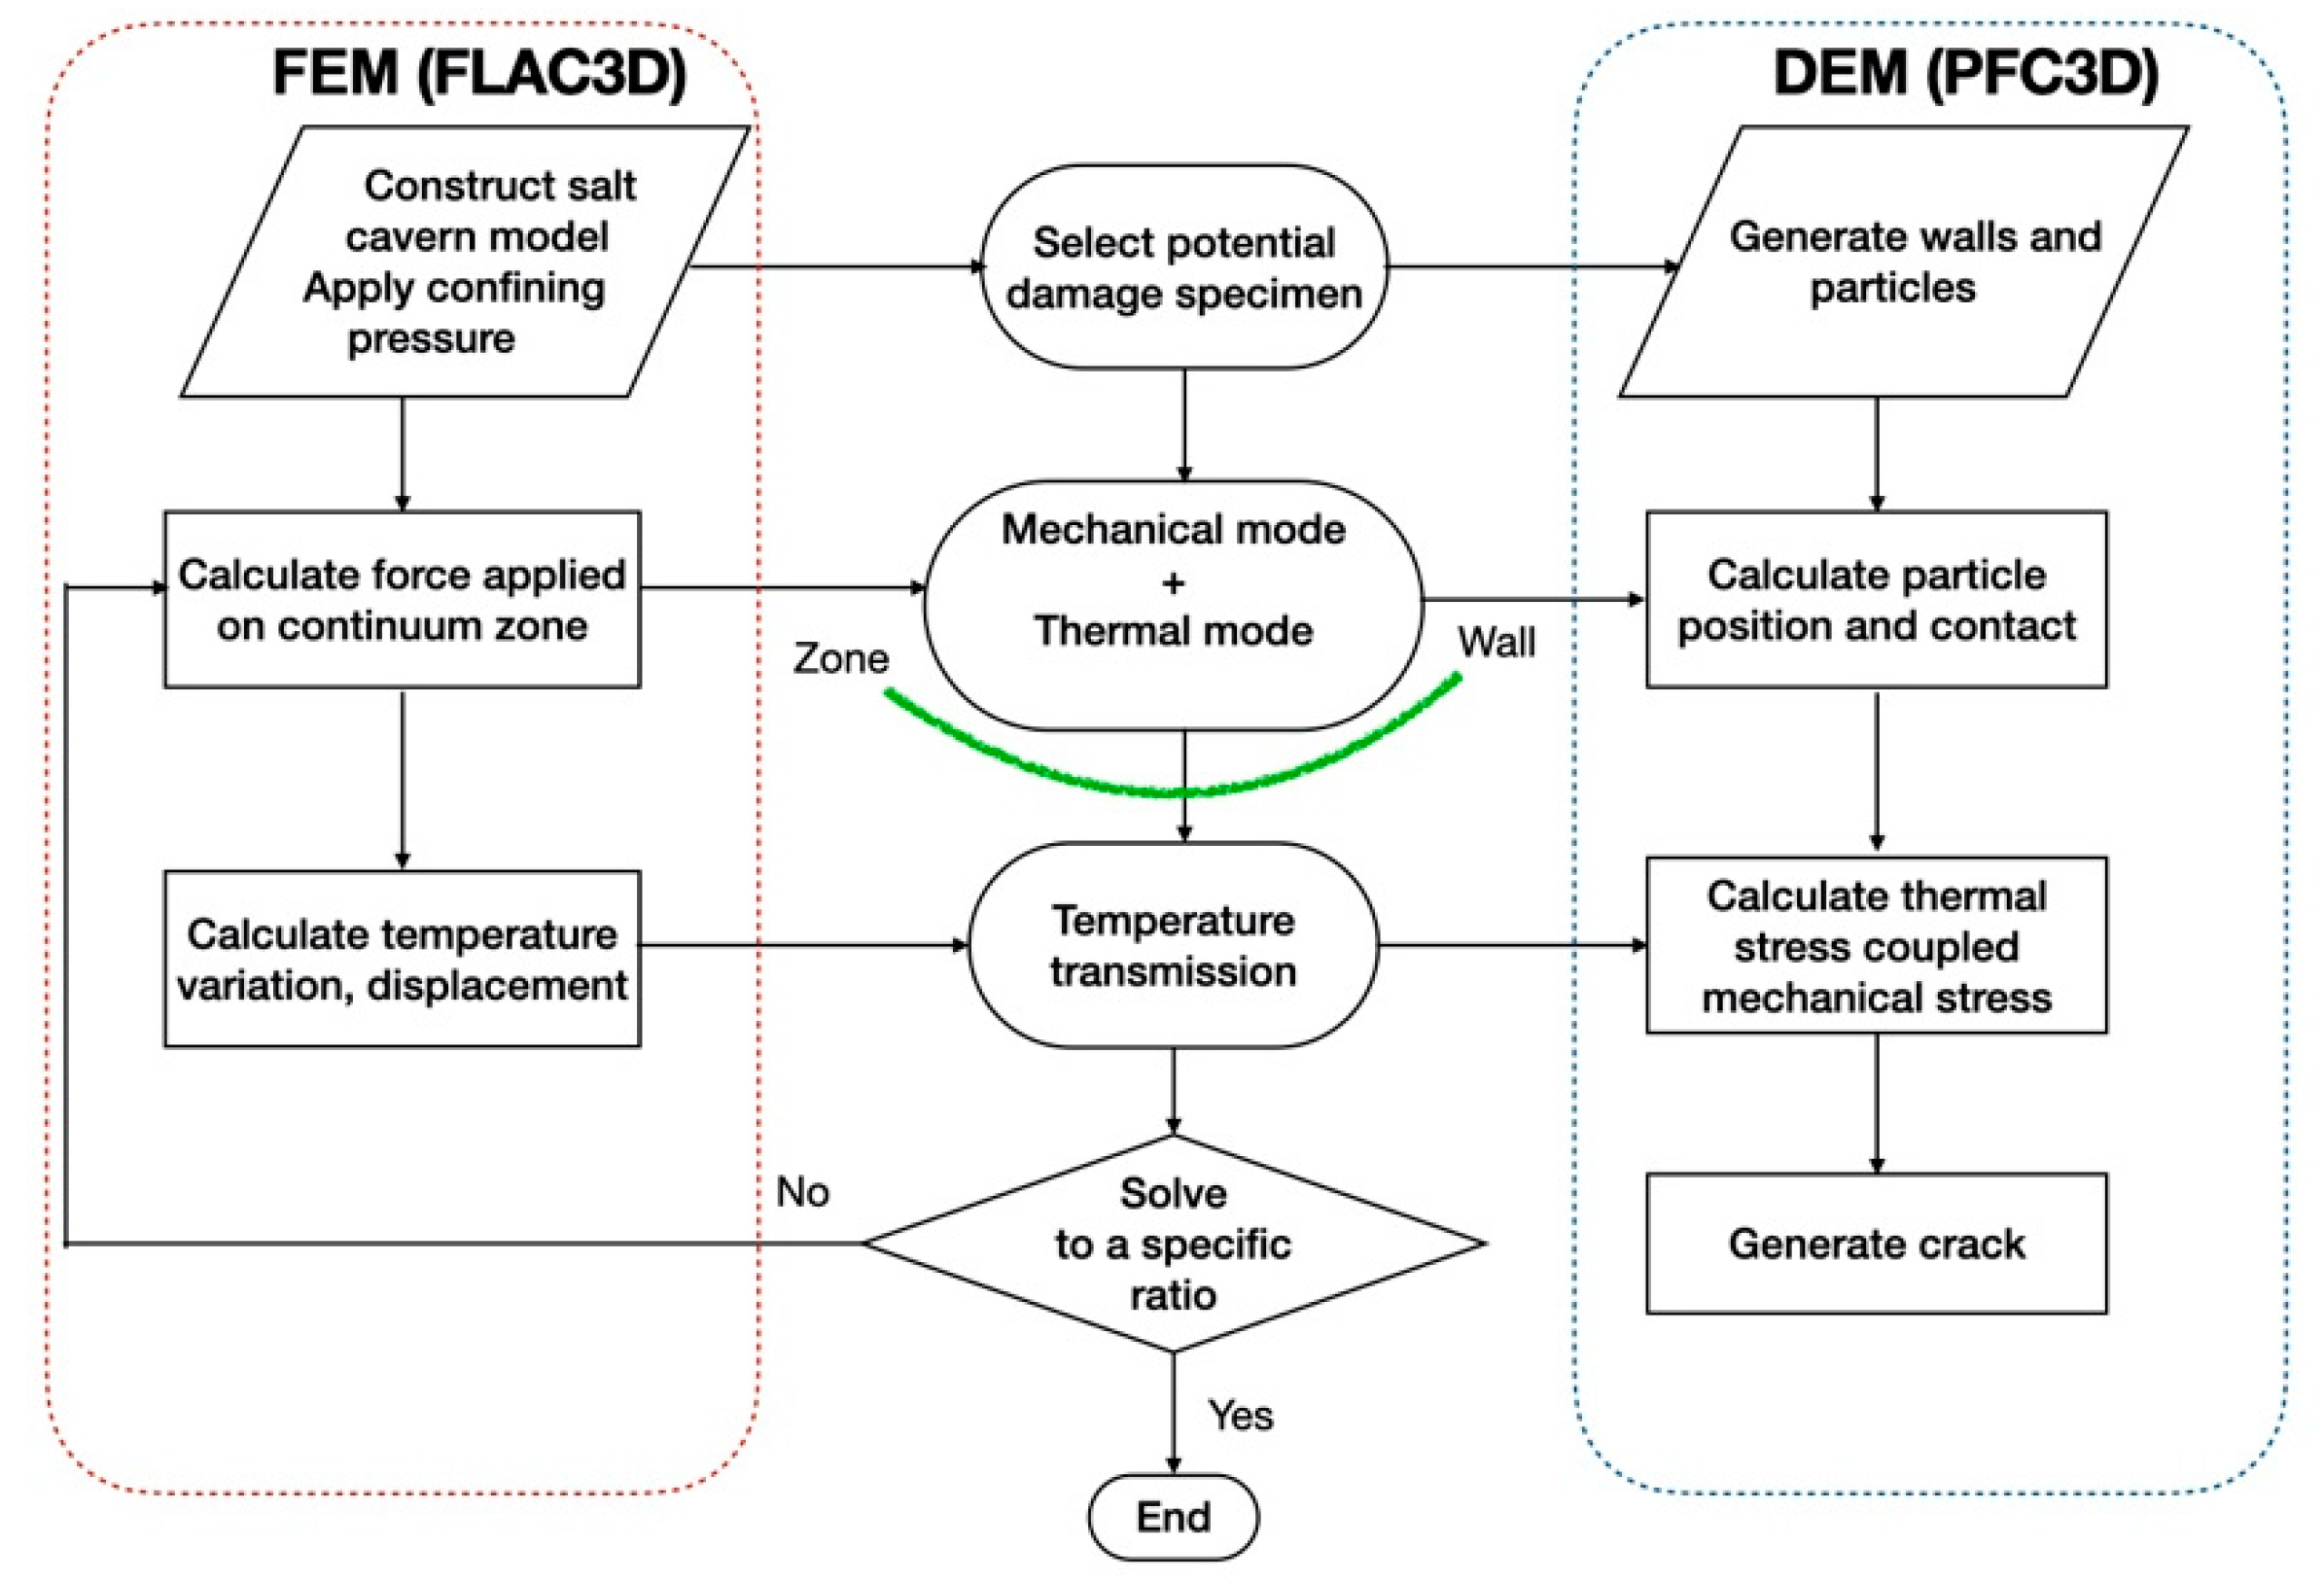
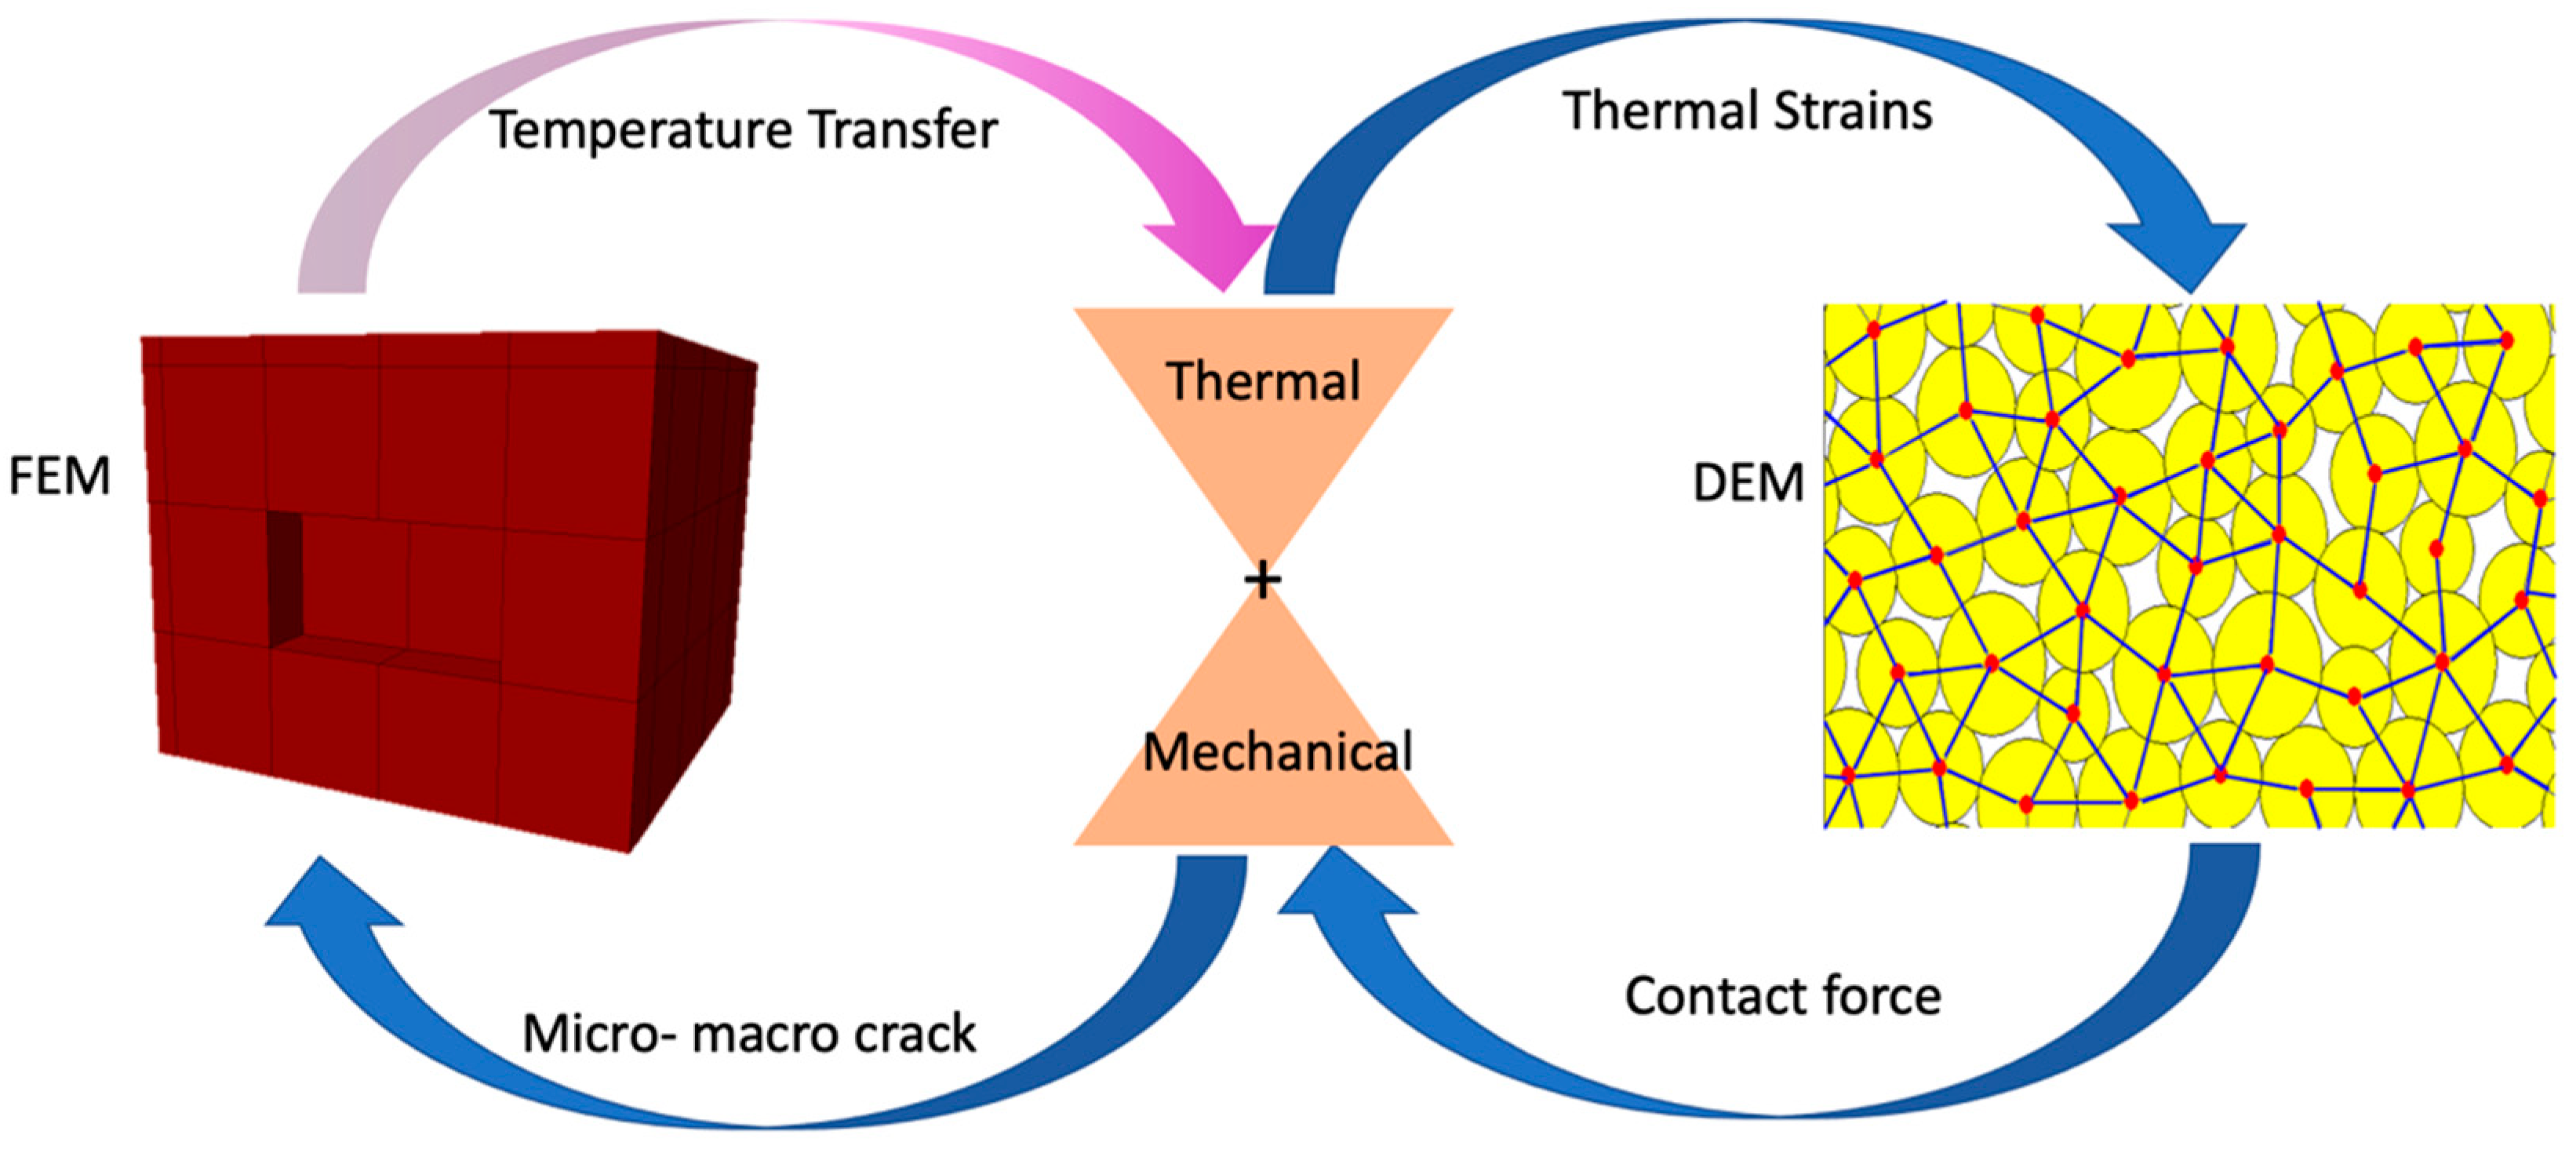
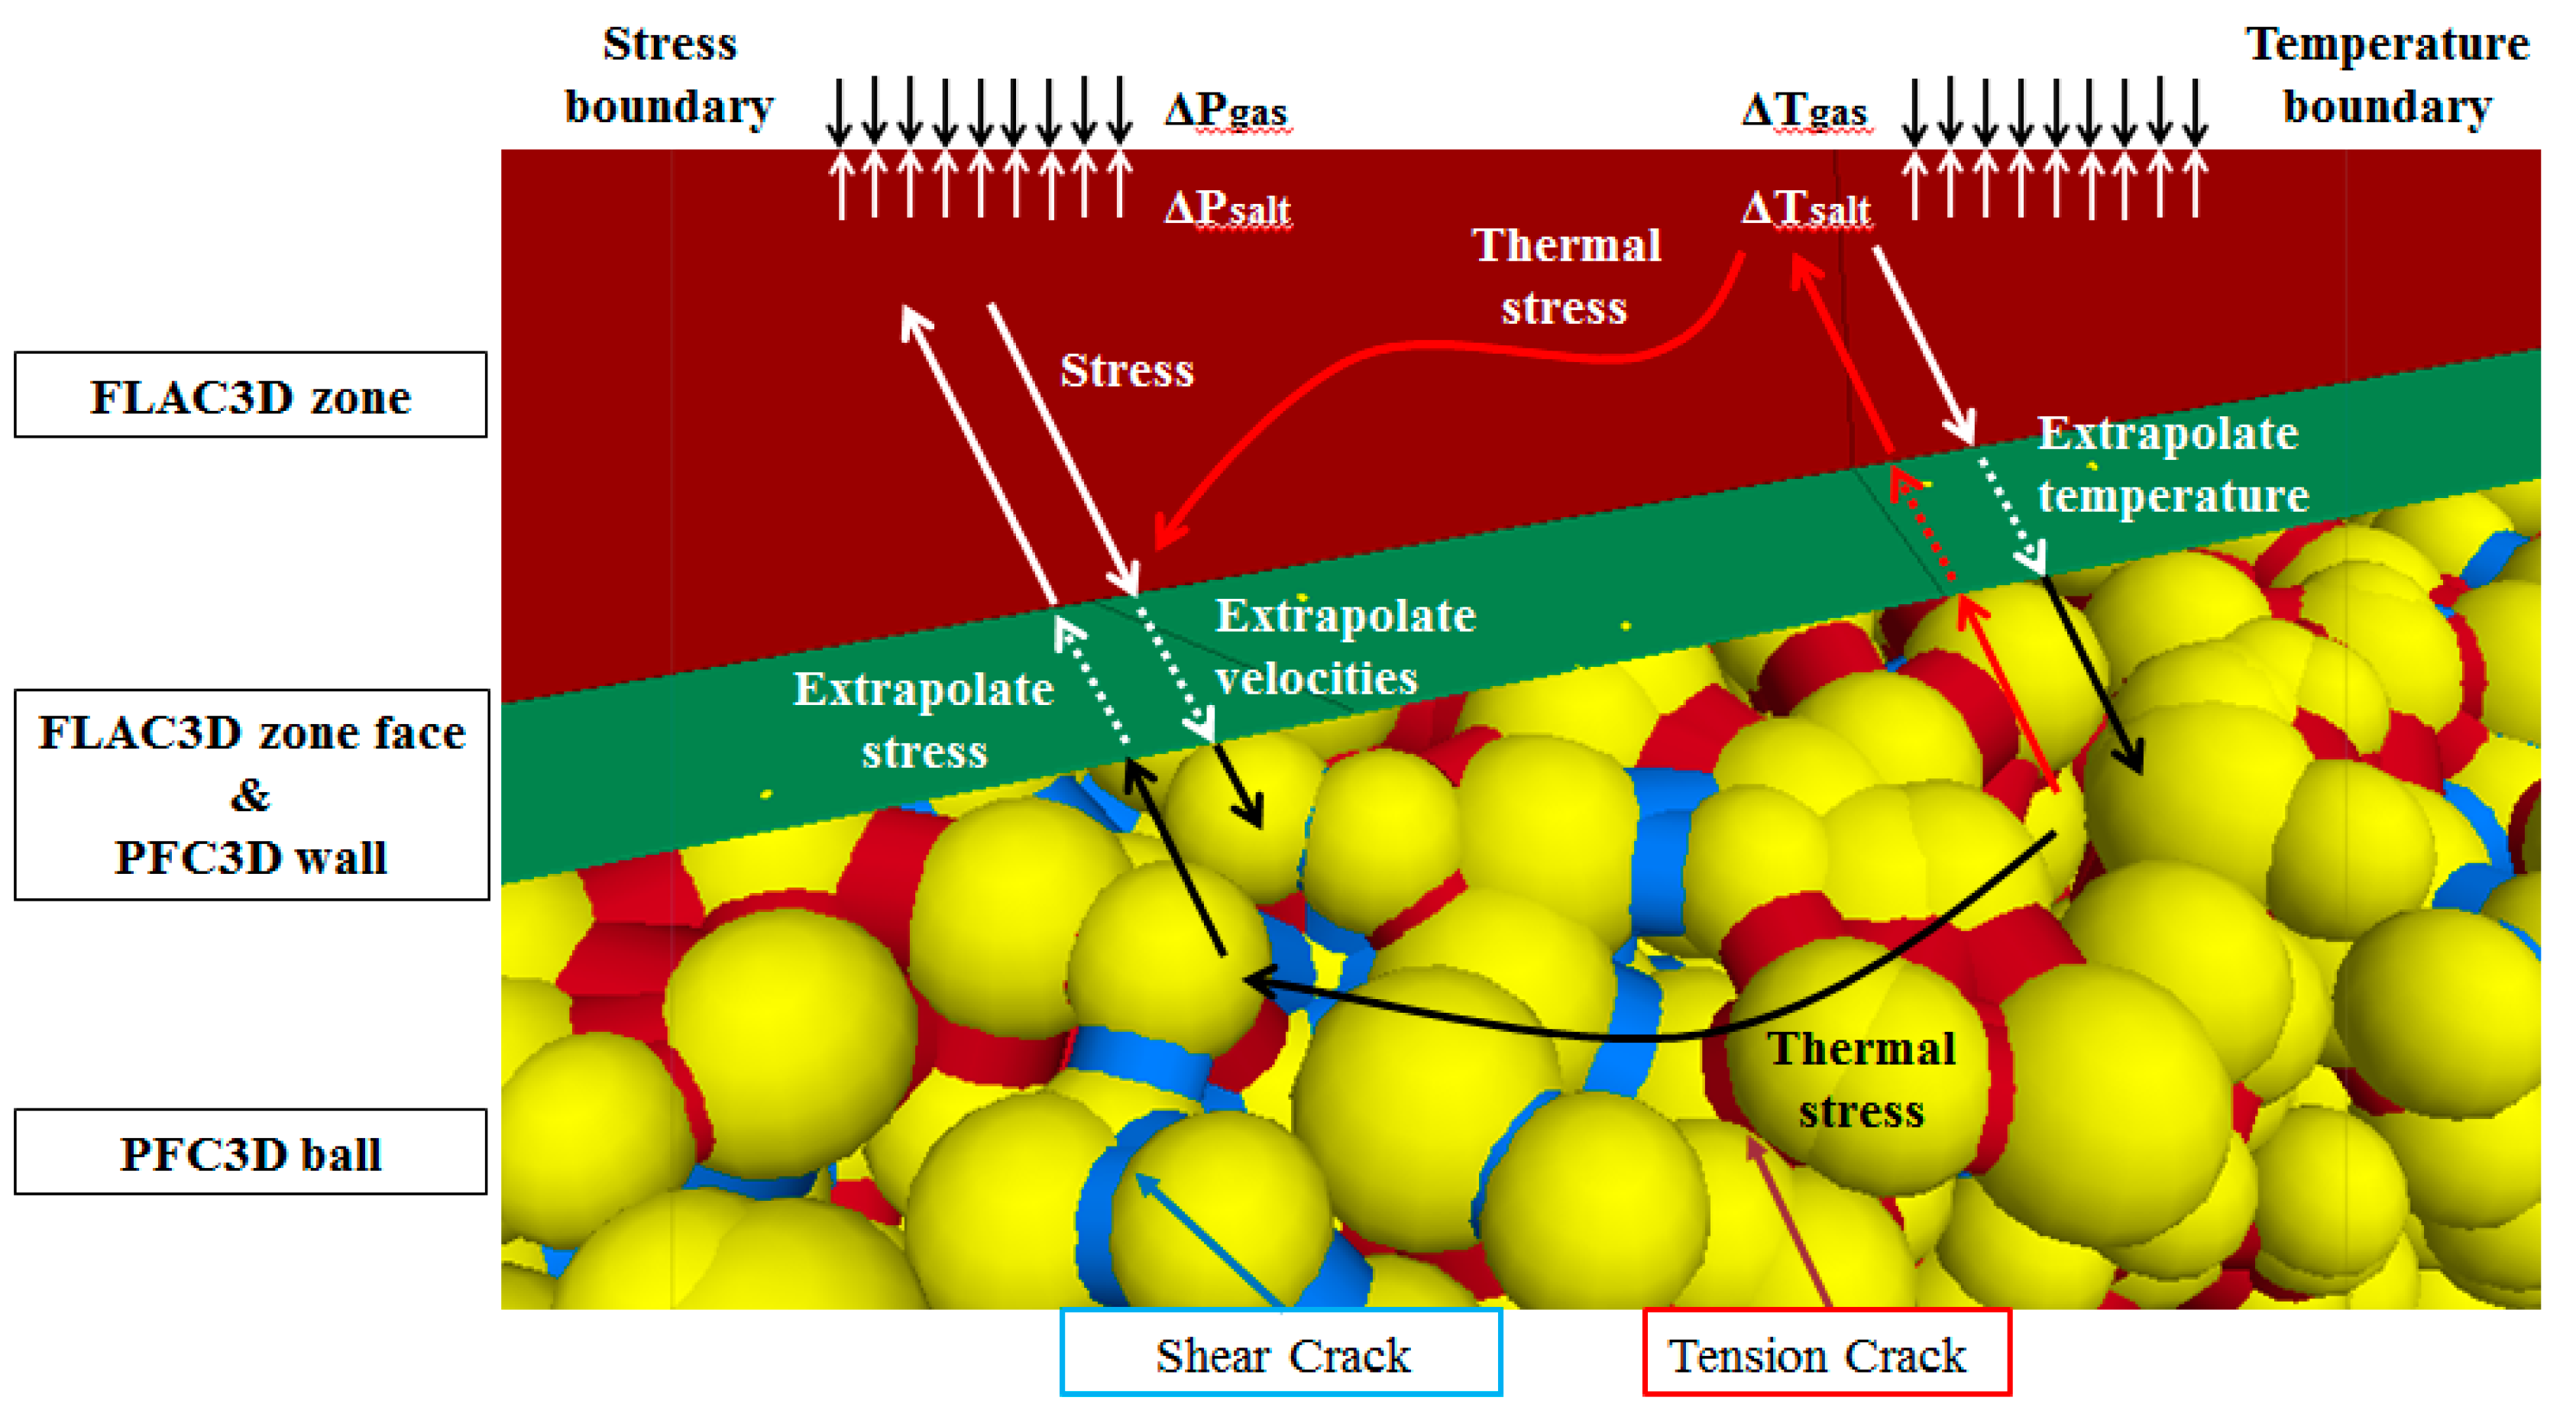
2.2. Coupling Mechanism of FLAC-PFC

Figure 3 illustrates the workflow of the DEM-PFC coupled simulation for the thermal-mechanical process of a salt cavern subjected to gas cycling loading. The continuum behavior of the salt cavity is simulated with FLAC, and the DEM model of the rock salt specimen enclosed by a surrounding wall is established by using the commercial code PFC3D. The thermal mode is coupled with the mechanical mode in each computation step. The thermal-mechanical interactive interface between FLAC and PFC is developed to account for the temperature-boundary settings in the FLAC zone, the wall–zone interface, and the particle wall in PFC. The thermal-mechanical coupling process occurs only in one direction (Figure 4): the changes in temperature induce the thermal strains which lead to the change of the mechanical stress, while the influence of mechanical changes on the heat conduction calculation is not considered. The contact forces between particles, displacement, and the distribution of cracks are updated. The model is solved to a pre-determined ratio.
The DEM model accounts for the thermal expansion of particles with linear parallel-bond contacts (Itasca, 2017; Li et al., 2016; Li et al., 2017) [26,42,43]. Figure 4 illustrates the heat conduction in a network composed of thermal reservoirs and pipes: yellow disks represent particles; red dots indicate the heat source; blue lines passing through the contact points of two circular particles are the active thermal pipes. For a bonded linear parallel-bond contact, its mechanical contact is associated with thermal contact. Two consequences can be induced by the thermal-mechanical coupling: first, the particle size is modified due to thermal strain; second, the normal component of the contact force is affected by the temperature changes. The corresponding increment of particle radius R induced by a temperature increment T is:
R = α R T
where α is the coefficient of linear thermal expansion, in the unit of 1/ ° C. It is a micro property associated with the particle material.
The normal component of the force vector carried by the bond is assumed to be affected by the change in temperature. The relationship between the present parallel bond and active thermal pipe is expressed as:
Δ F ¯ n = k ¯ n A Δ U n = k ¯ n A ( a ¯ L ¯ Δ T )
where k ¯ n is the bond’s normal stiffness, A is the area of the bond’s cross-section, a ¯ is the expansion coefficient of bond material, L ¯ is the bond length, and Δ T is the temperature increment, which equals the average temperature change of the two particles at two ends of the pipe associated with the contact bond.
Figure 5 demonstrates the interaction between the continuum FLAC3D zone and discrete particles. The interface (wall zone) consists of FLAC3D zone surfaces and PFC3D walls, which are created coinciding with the zone faces. The PFC walls are composed of edge-connected triangular faces, and the balls are in contact with the wall facet, wrapping the zone face. The coupling mechanism for FLAC-PFC works by updating the force system at facet vertices in PFC, which is determined by contact forces and moments at each ball–facet contact. The forces along with stiffness are communicated at grid points/nodes. The acting contact force and movement are distributed at grid points/nodes by equivalent forces. The grid points/nodes at the coupling wall zone and grids of zones move synchronously, and the updating force involves continuum zone computation in FLAC. Similarly, the deformation of the continuum zone leads to the movement of the coupling wall zone. In response to the forces and velocities acting at the coupling wall zone, in DEM the particles displace and generate cracks when the stress at contact bonds exceeds the prescribed tensile or shear stress.

3. Thermal Progressive Damage Evolution

Figure 6 illustrates the cycling gas-loading process over the 5-year period. Five years is the time period for sonar monitoring for salt-cavity volume convergence. Particularly, at the time of 3.14 years, the temperature and pressure drop abruptly (from 16 MPa to 8 MPa) when there is gas withdrawal. However, not all the stages of the process of gas injection and withdrawal are xposure to the risk of thermal damage. Li et. al. (2021) [8] investigated cavern L and found that when the gas withdrawal is fast and followed by retaining low pressure, thermal cracking or even fractures occur. Therefore, we focus on the cracking development after 3.14-years of operation by comparing three different locations of surrounding wall of the salt cavity.

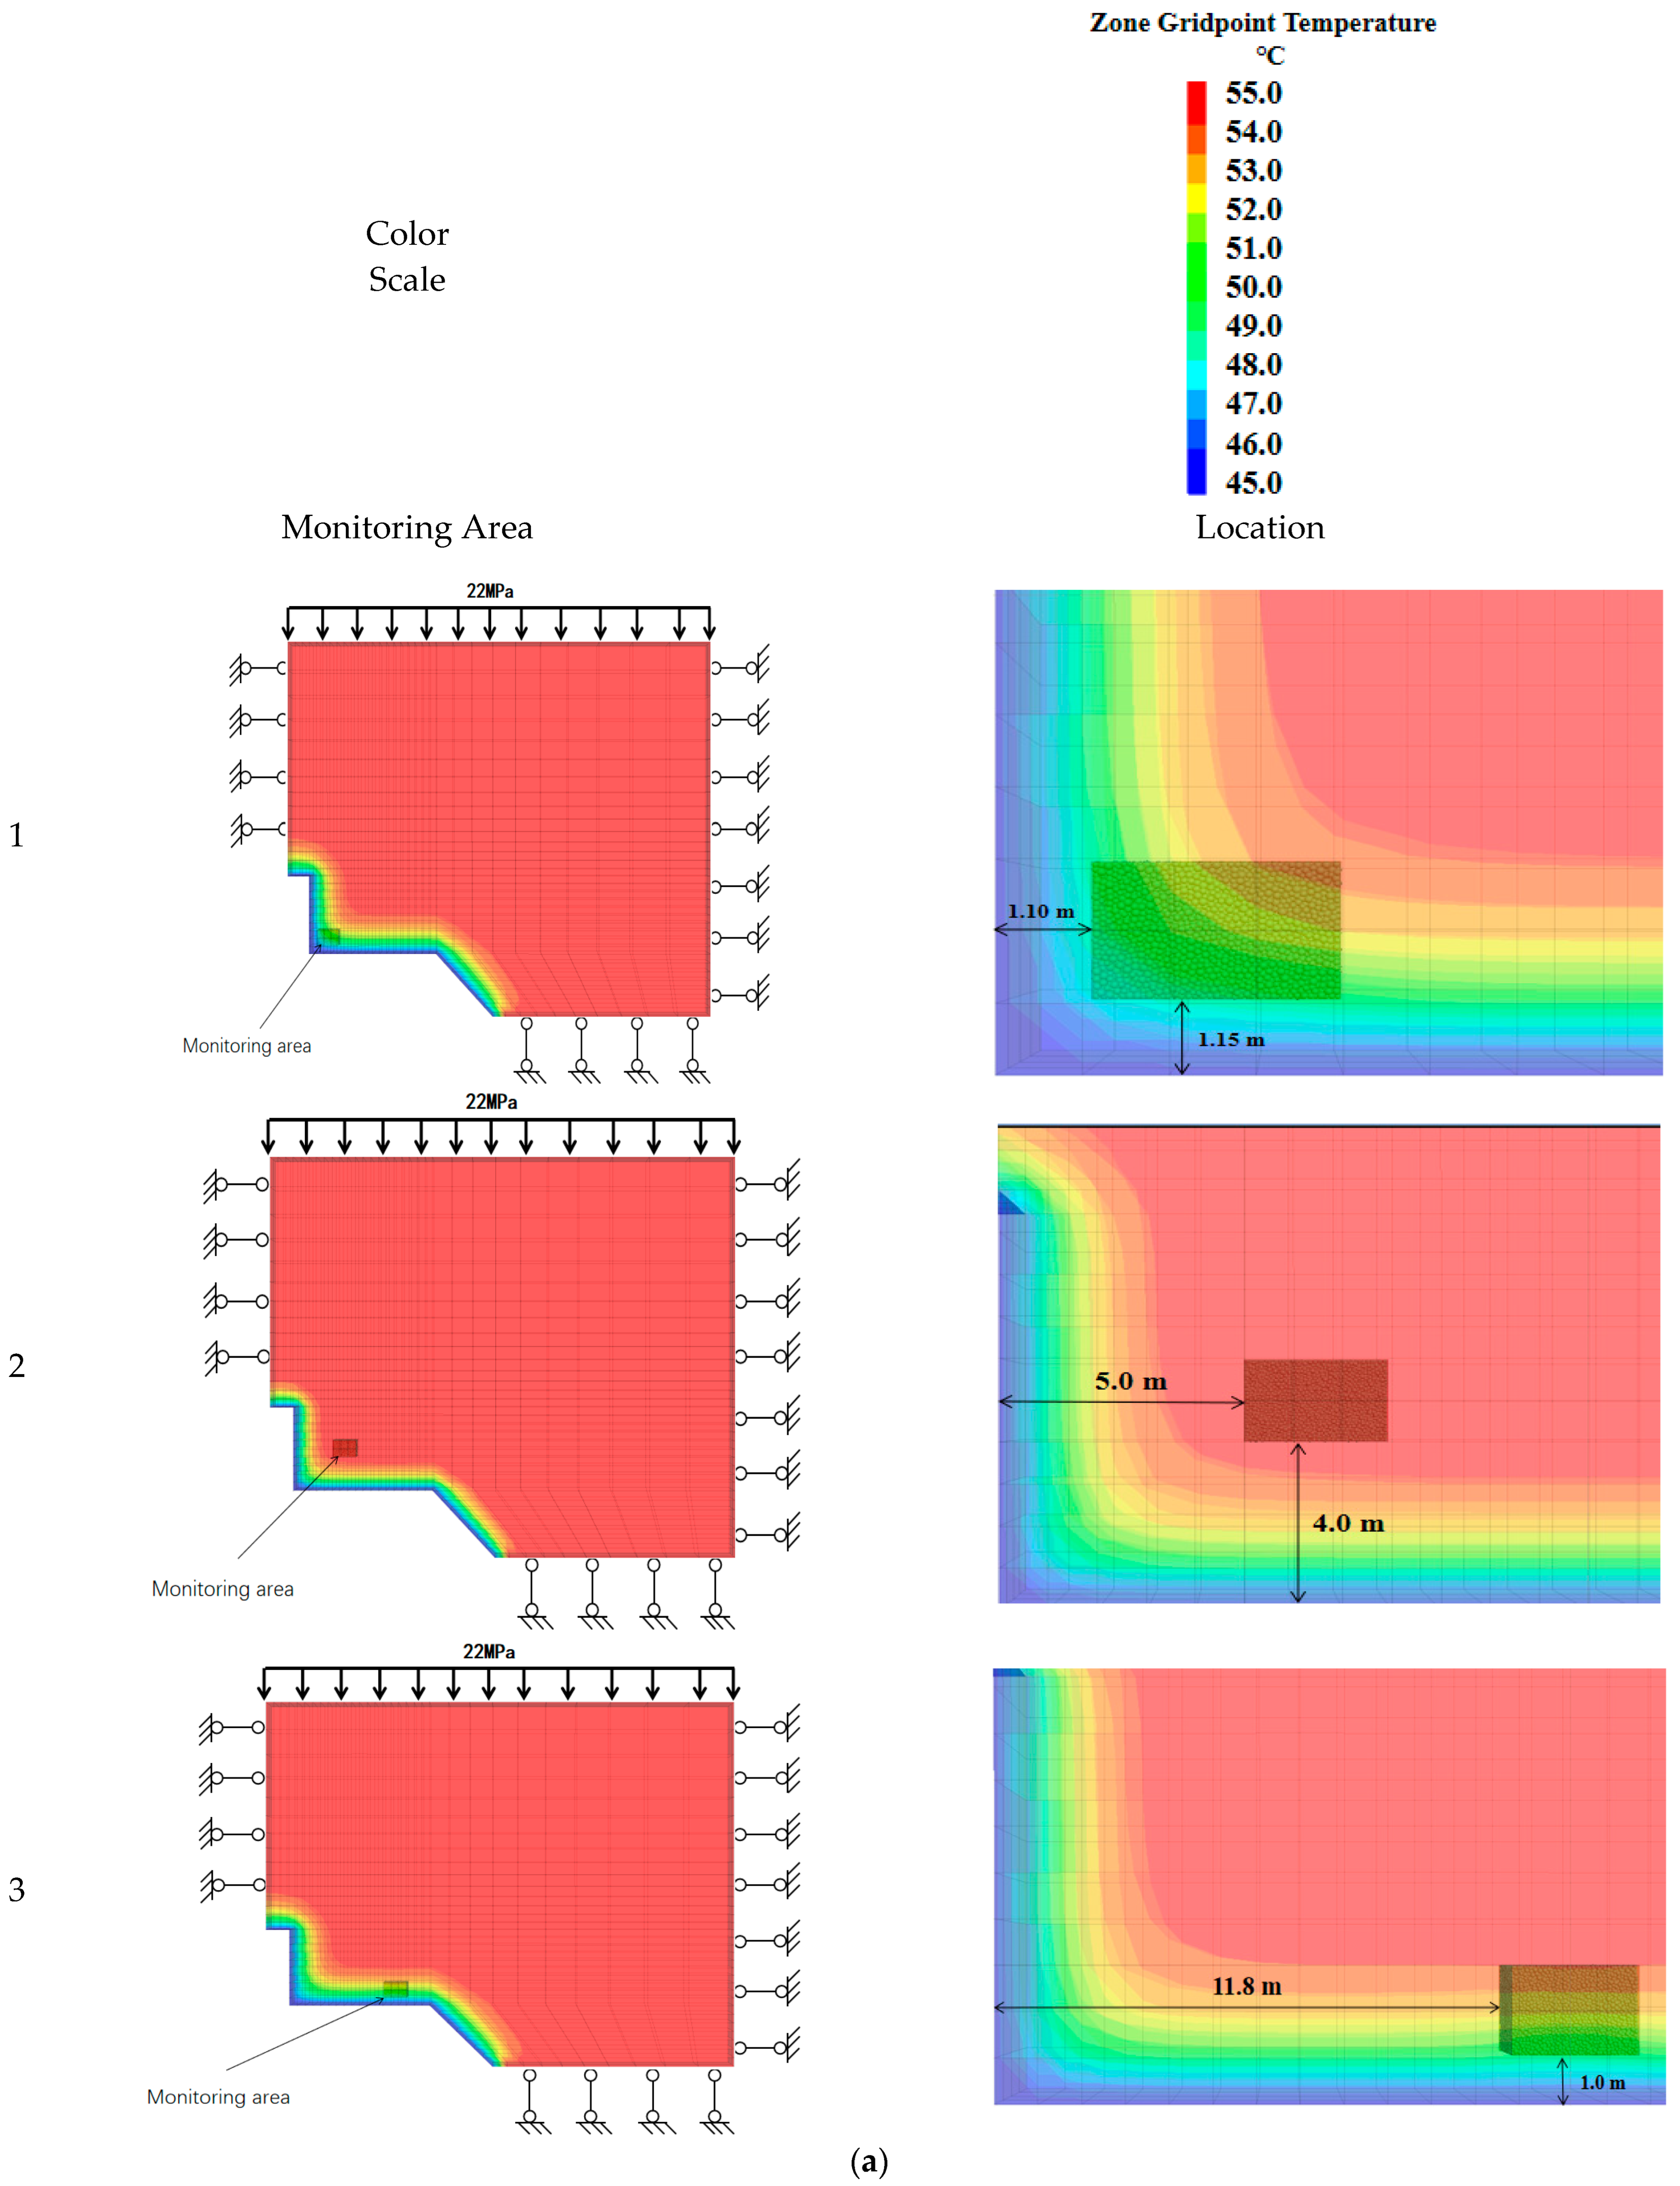
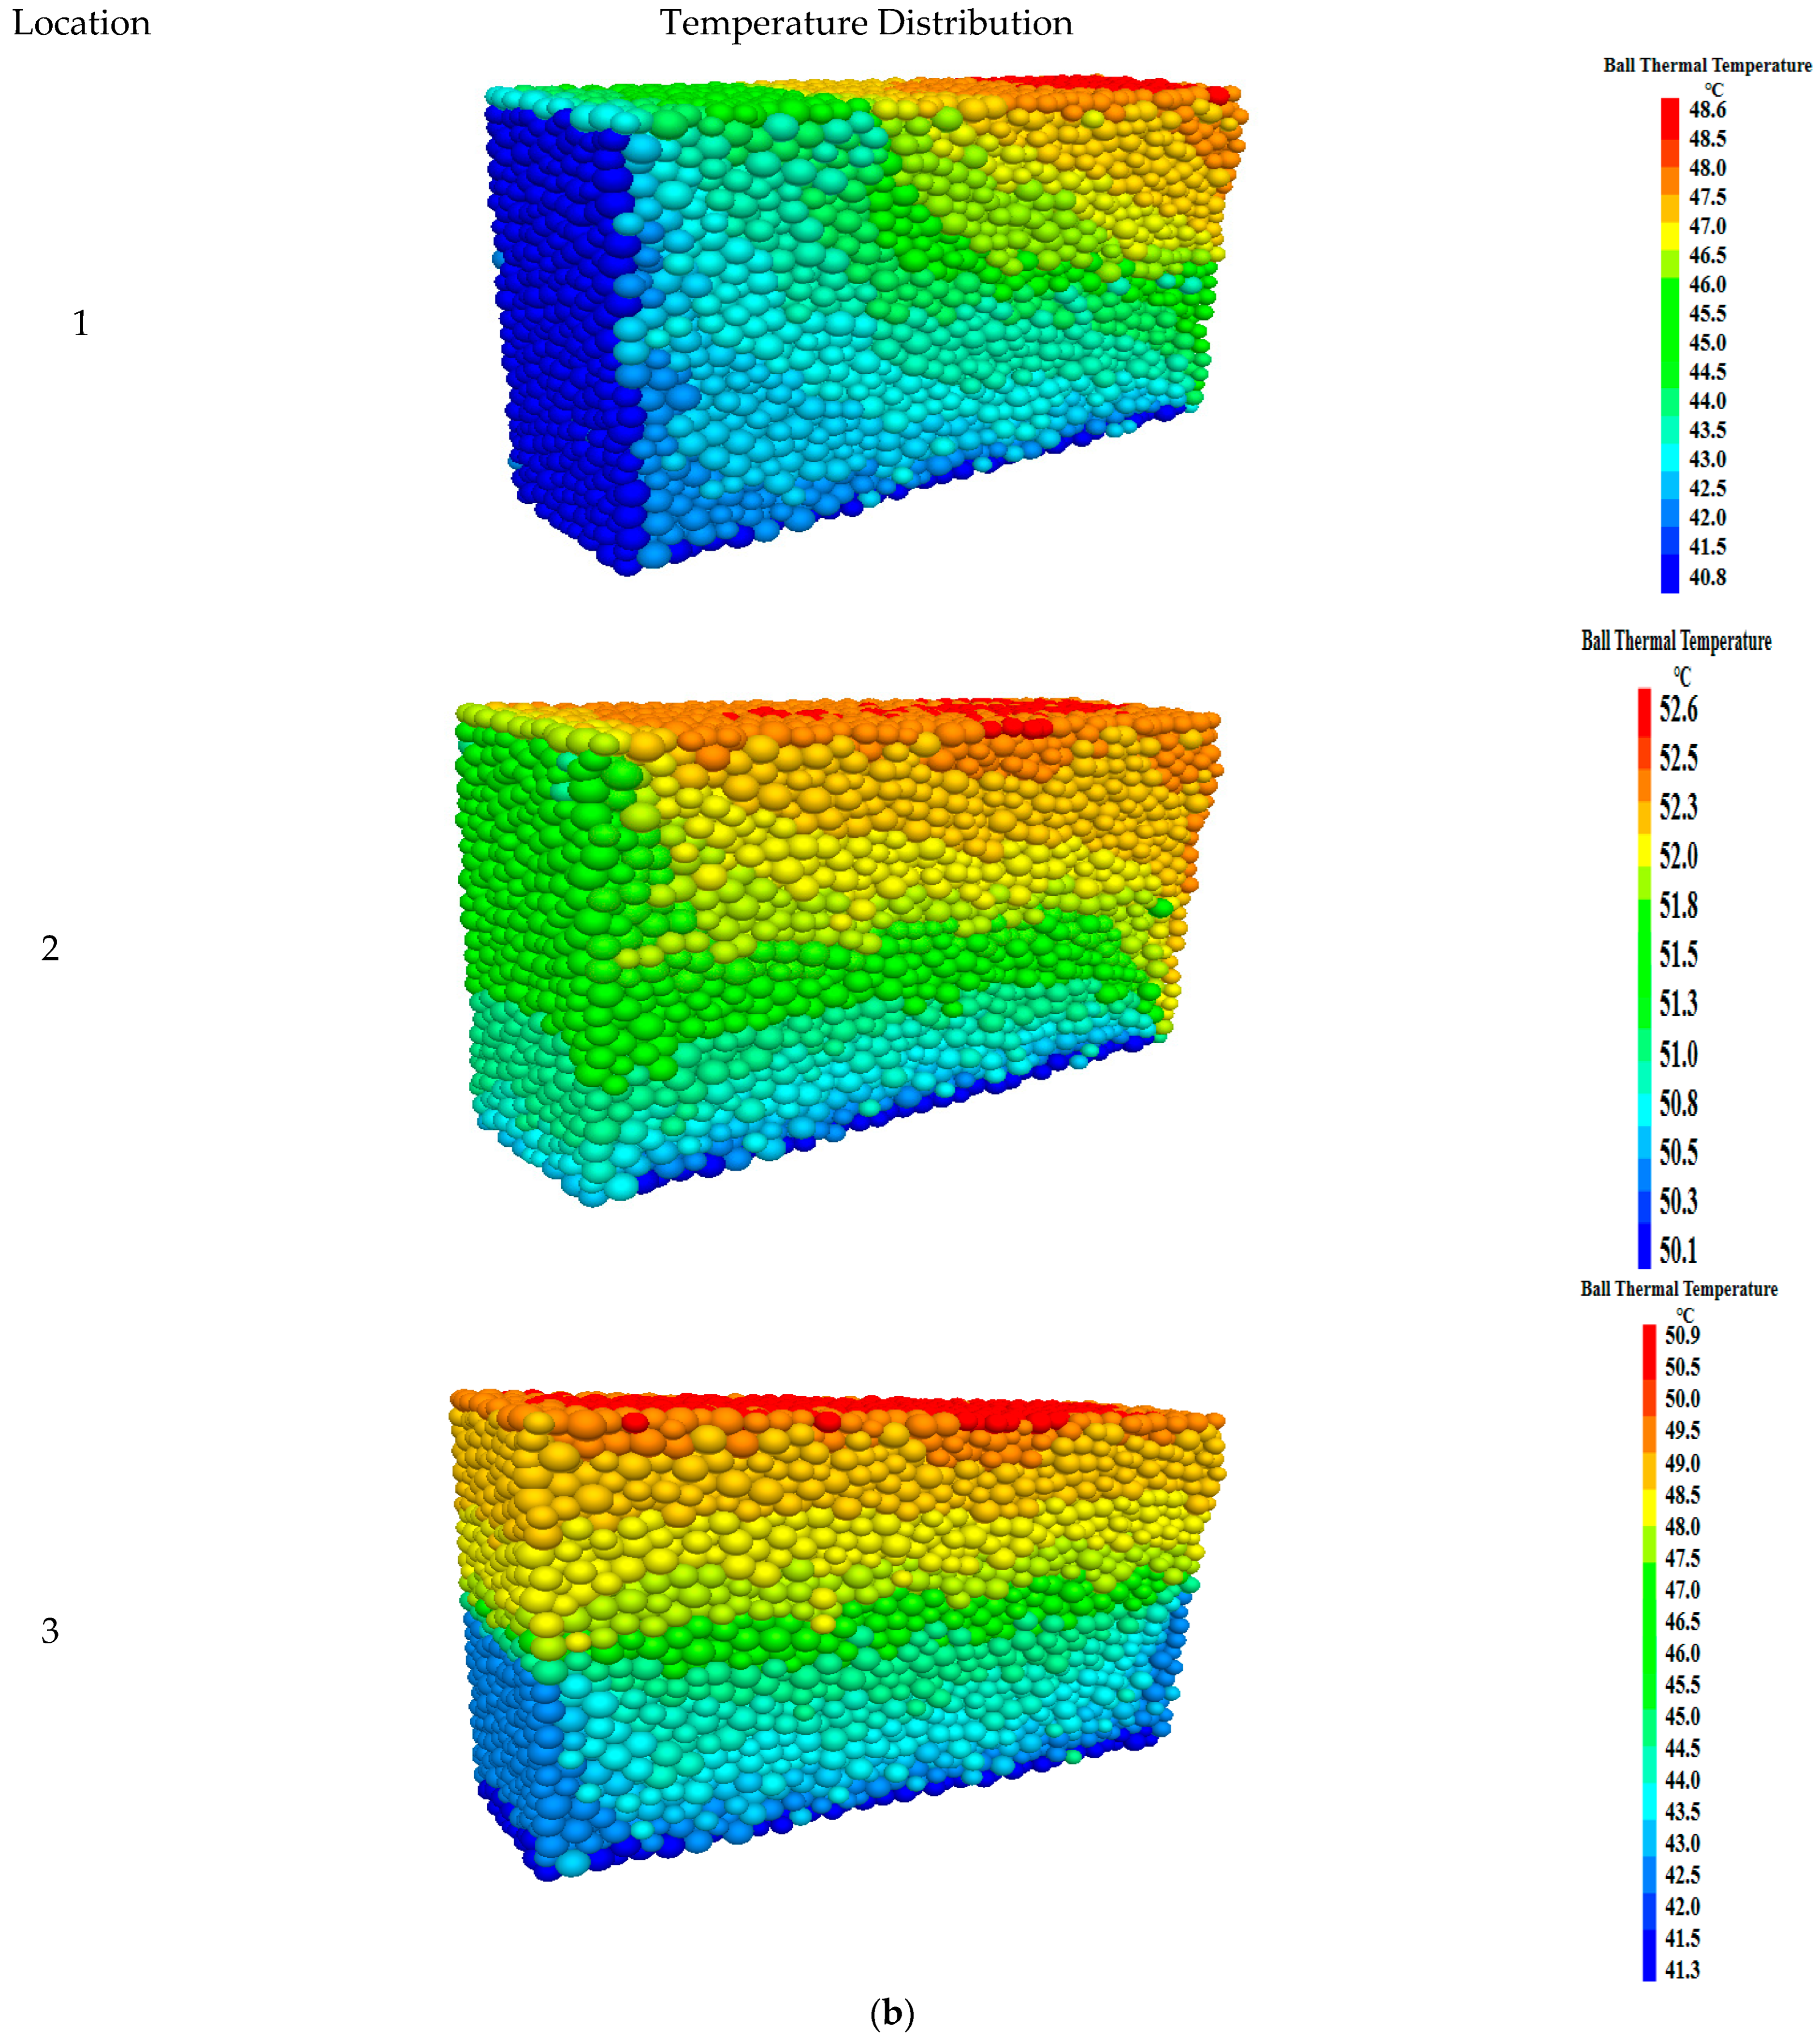
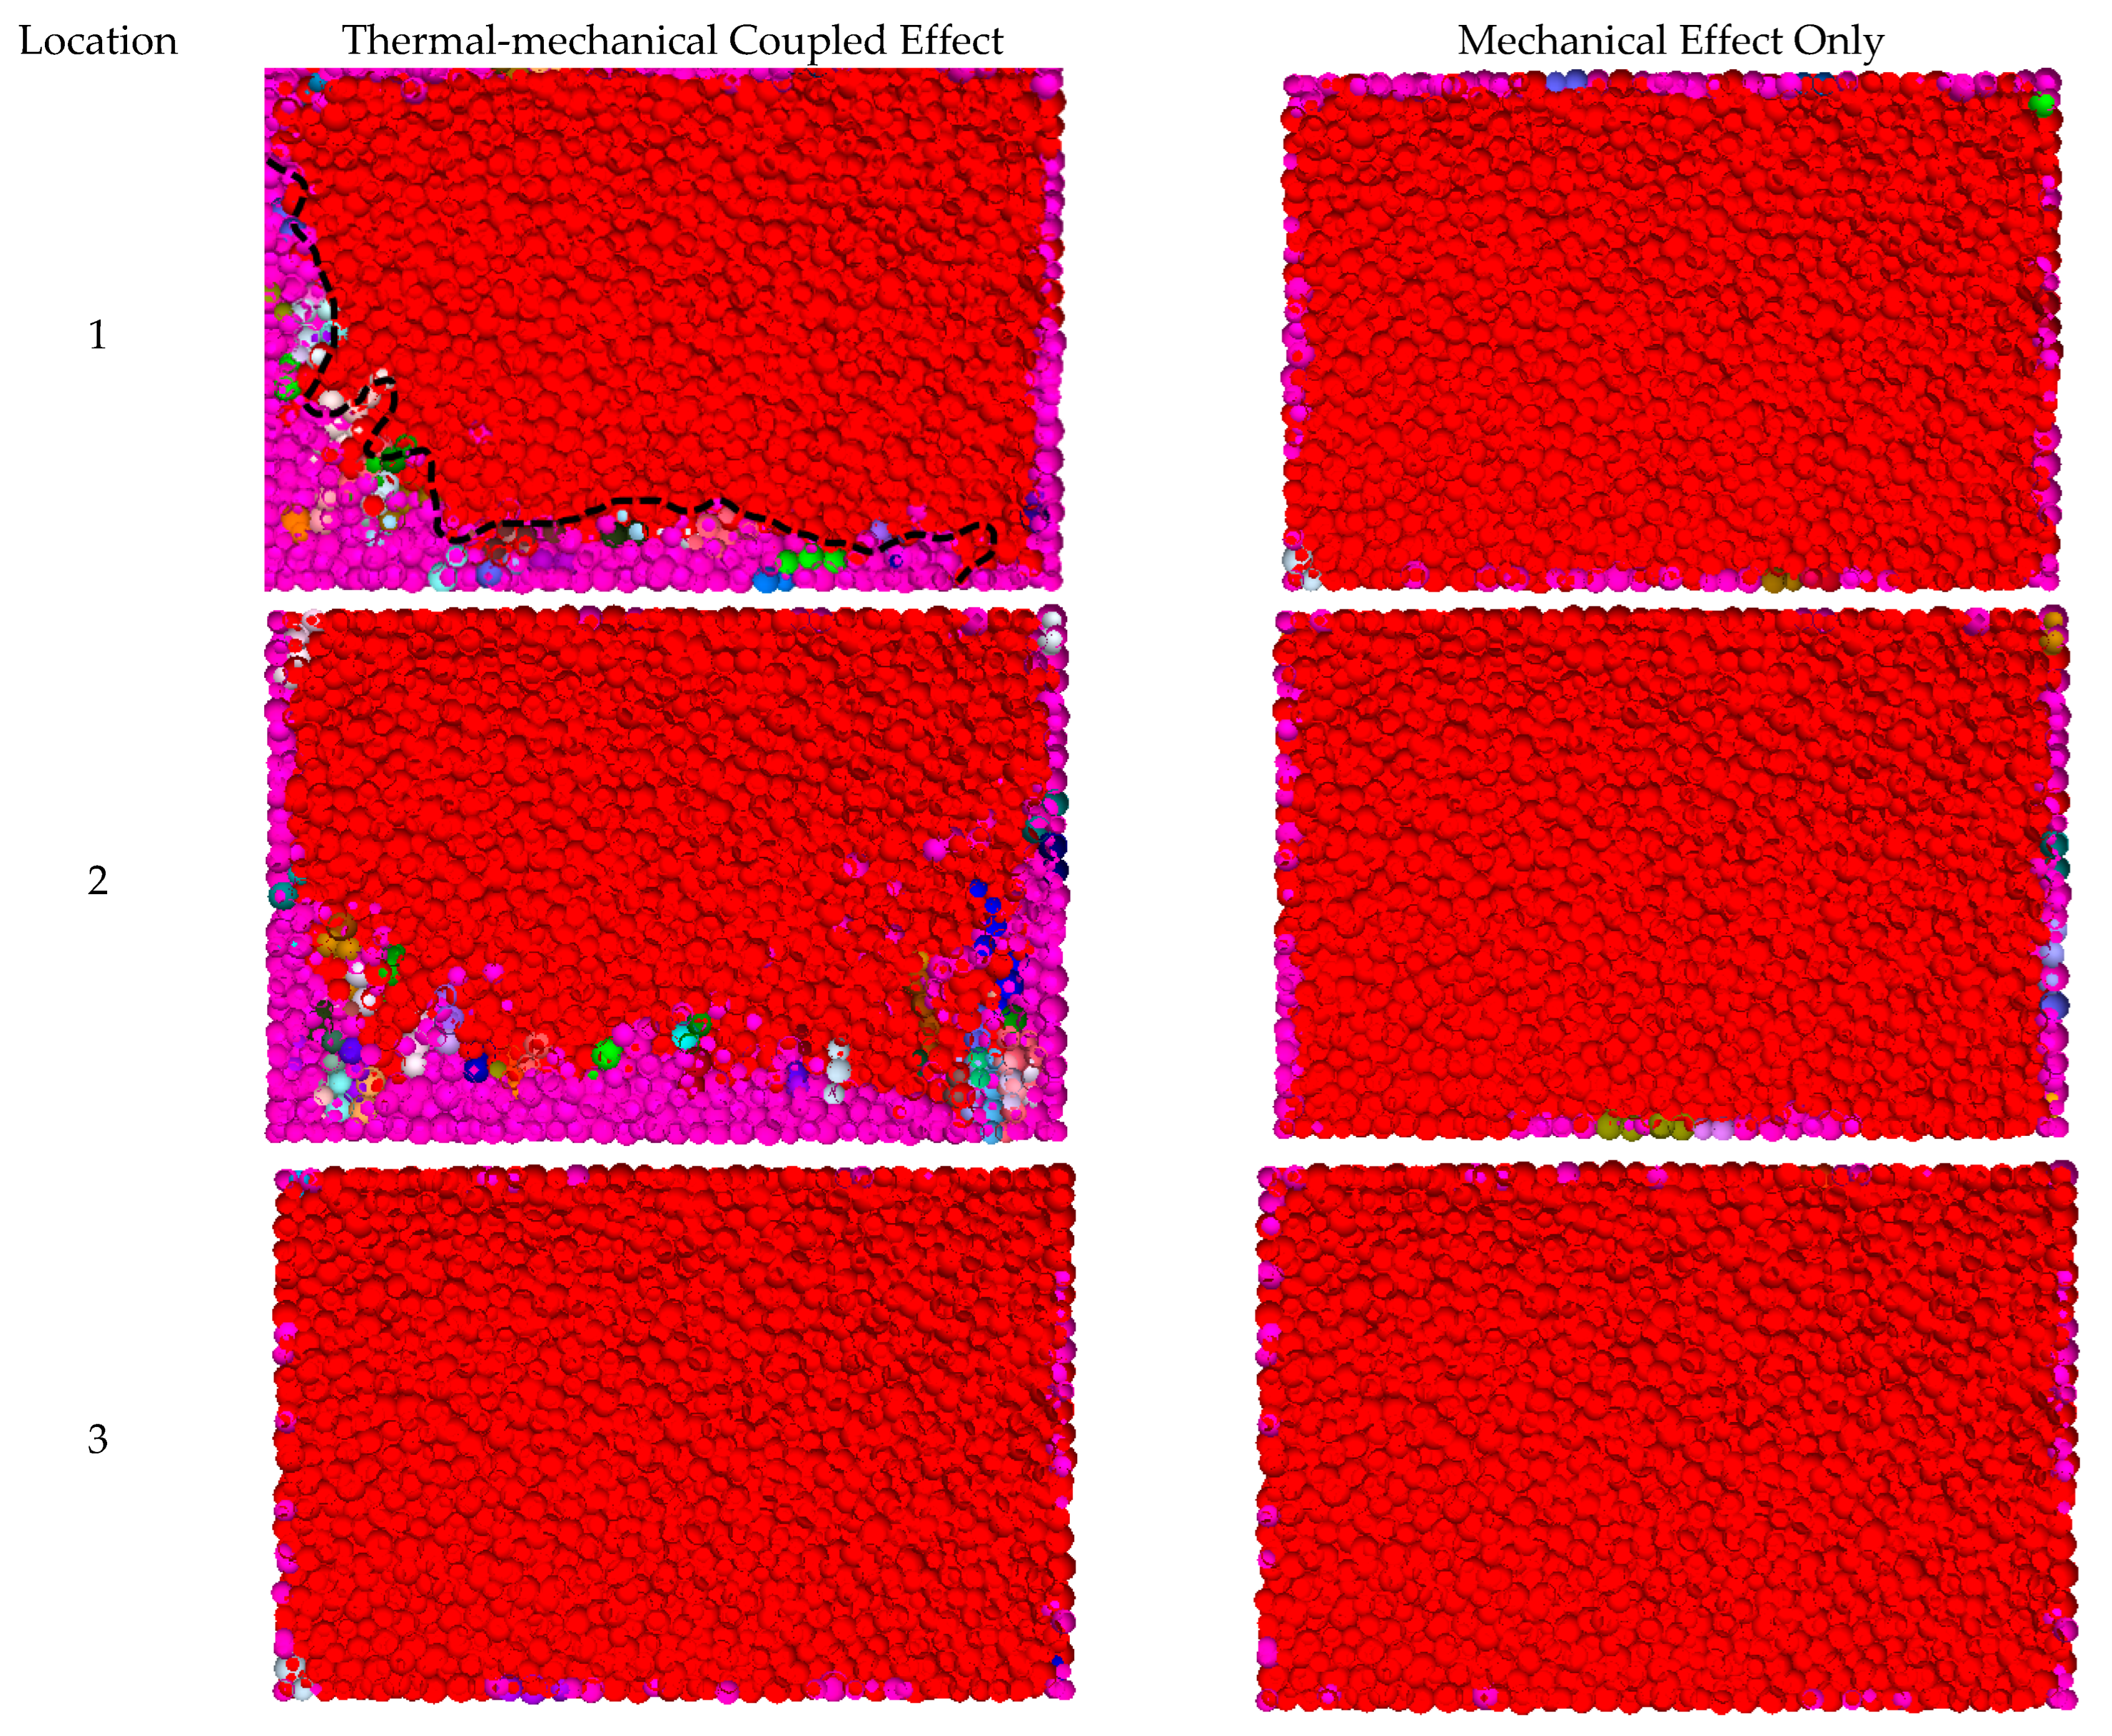
3.1. Thermal Effect at Three Observed Locations

For the field case of cavern L (Li et al., 2021) [8], a sharp pressure drop occurs due to gas withdrawal at 3.14-years of operation, before and after, the pressure drop reaches 7   MPa (Figure 7a). The three selected monitoring areas and corresponding locations in the hybrid model are (1) at the knee point of the cavity shoulder, i.e., the convexity; (2) the right part of the knee point; and (3) 11.8   m away from the cavity surrounding wall brim.
The initial temperature of rock-salt formation changes linearly with the depth at a temperature gradient of 2.55   ° C / 100   m . The salt cavern is located from −1030 m to −1080 m, assuming the ground temperature is 20   ° C and the temperature of the cavity is approximately 45   ° C . In response to the gas withdrawal and the consequent sharp pressure drop at 3.14 years of operation, the temperature decreases correspondingly. The temperature decreases gradually from the surface to the neighboring deeper domain in the formation. Overall, the temperature distribution of the monitoring areas after sharp gas depressurization exhibits obvious confinement dependence on the locations. Location 1 is the closest spot to the brim of the surrounding wall with the lowest temperature. Location 2 has the highest temperature; however, the temperature variation range is small. Locations 2 and 3 are less affected by the thermal effect. The closer to the salt cavity surrounding the wall brim, the more distinct the thermal influence it receives.
To assess the thermal effect on the response of the salt cavern surrounding wall, we proposed a thermal-mechanical factor T M F , which is defined as:
T M F = C r a c k ( T h e r m a l M e c h a n i c a l ) C r a c k ( M e c h a n i c a l ) T o t a l   C r a c k   ( T h e r m a l M e c h a n i c a l )
TMF is the ratio of the difference between the crack number induced by the coupled thermal-mechanical effect and the crack number only induced by the mechanical effect to the total crack number. The higher T M F   indicates that the thermal effect is dominant. T M F is close to 0.5, indicating both the thermal and mechanical working together. If T M F is approximately 0, the cracking is simply induced by the mechanical effect and is irrelevant to the thermal effect.
Figure 8 illustrates the crack development comparison between the thermal-mechanical coupled effect and the mechanical effect only for three different locations. The different particle colors represent the different detached broken particles formed as a result of cracking. At locations 1, 2, and 3, the T M F = 0.65 ,   0.18 ,   and   0.58 , respectively. Location 1, nearest to the cavity, is affected by the thermal effect most. Location 1 is sensitive to the thermal effect and the microcracking is controlled by the ball heat capacity, coefficient of thermal expansion, zone conductivity, conductivity coefficient of thermal contact mode, etc.

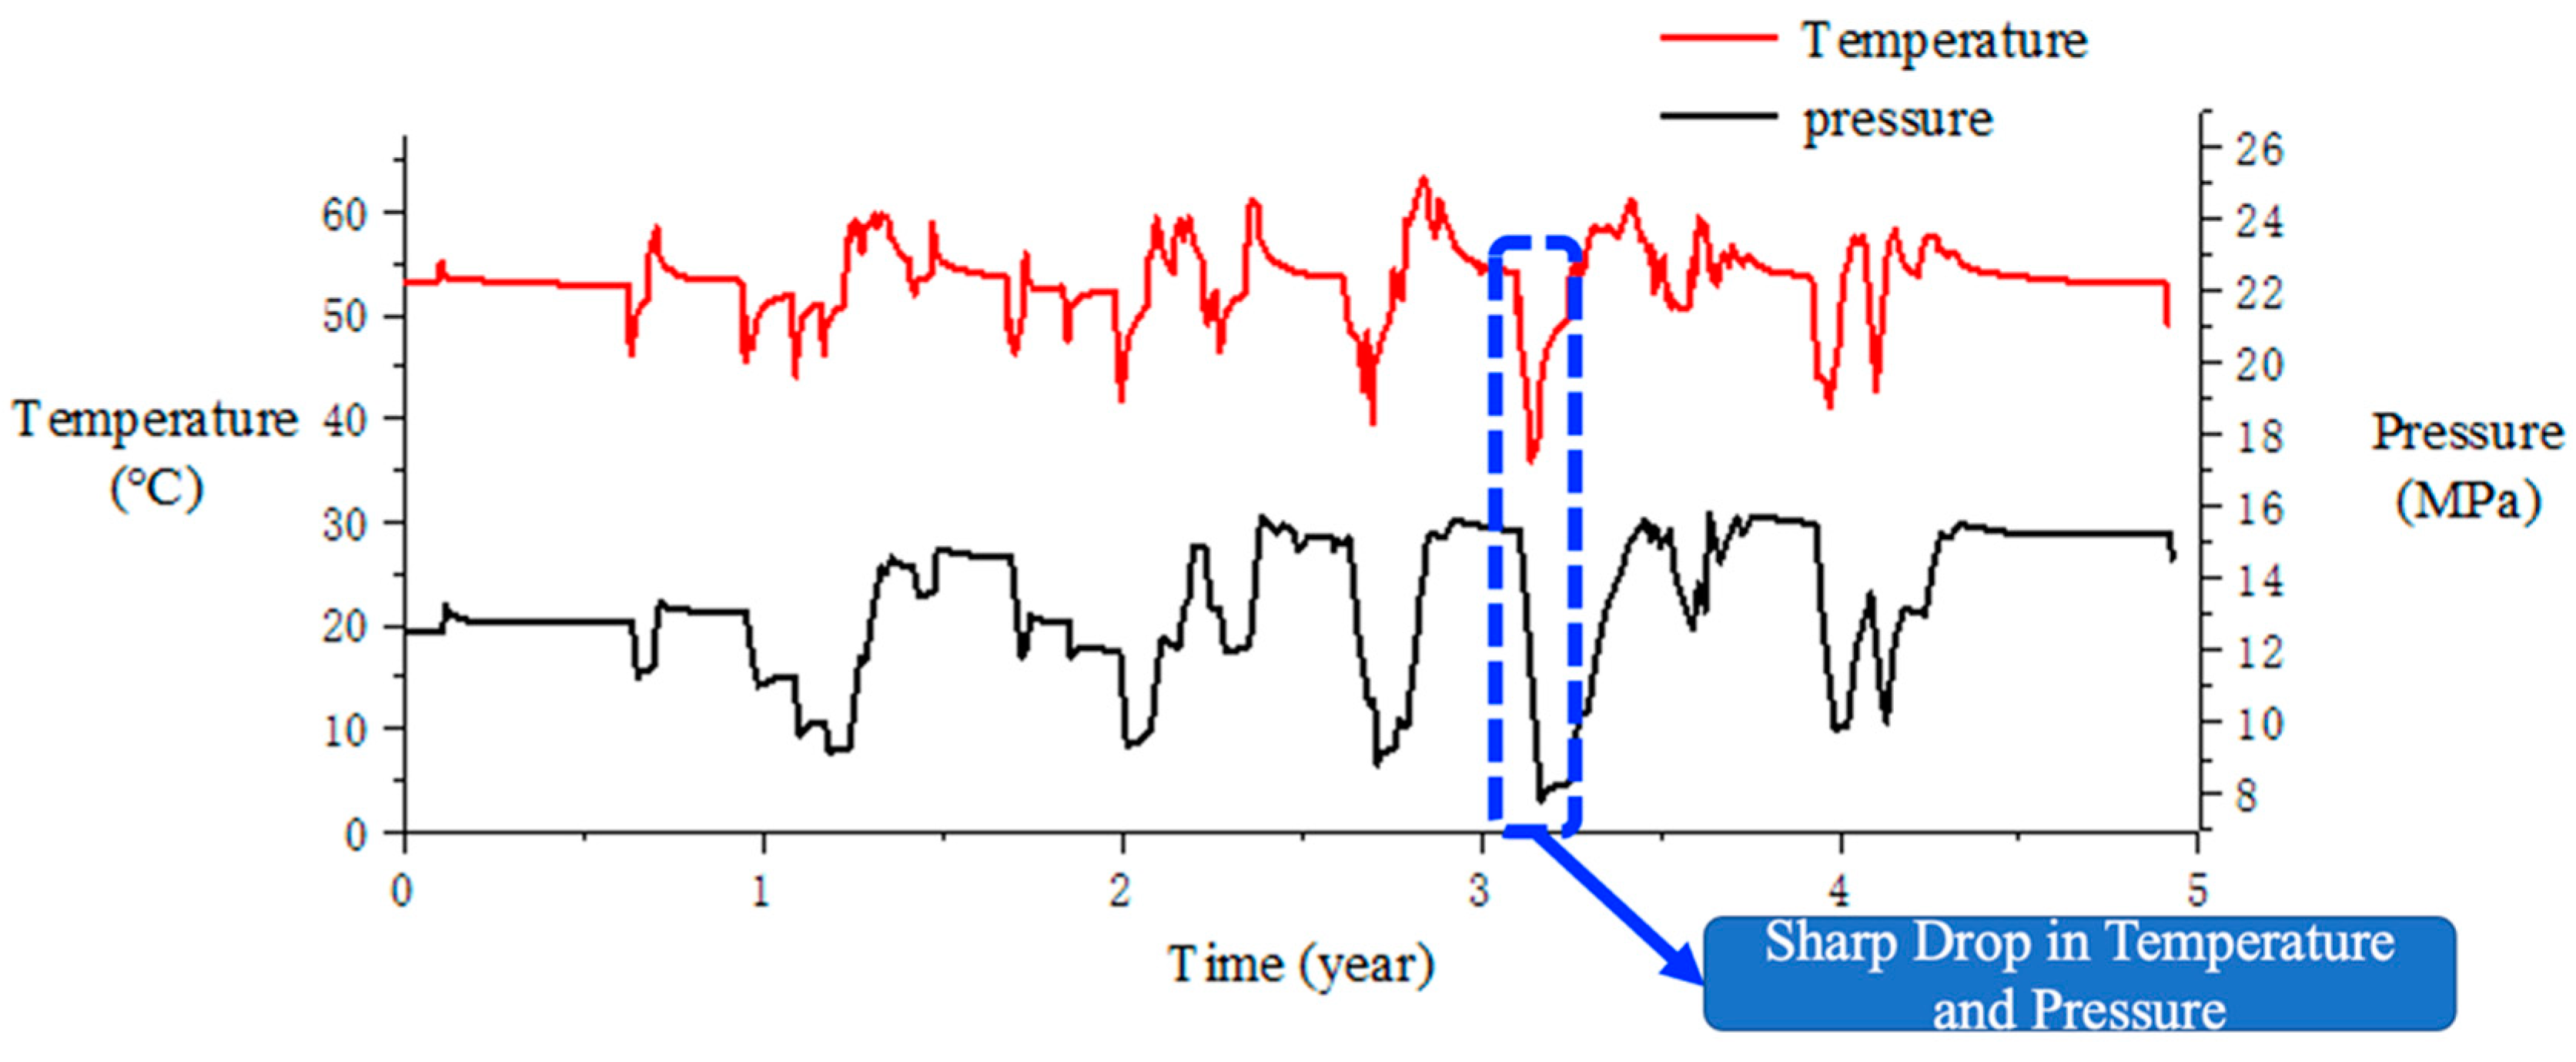
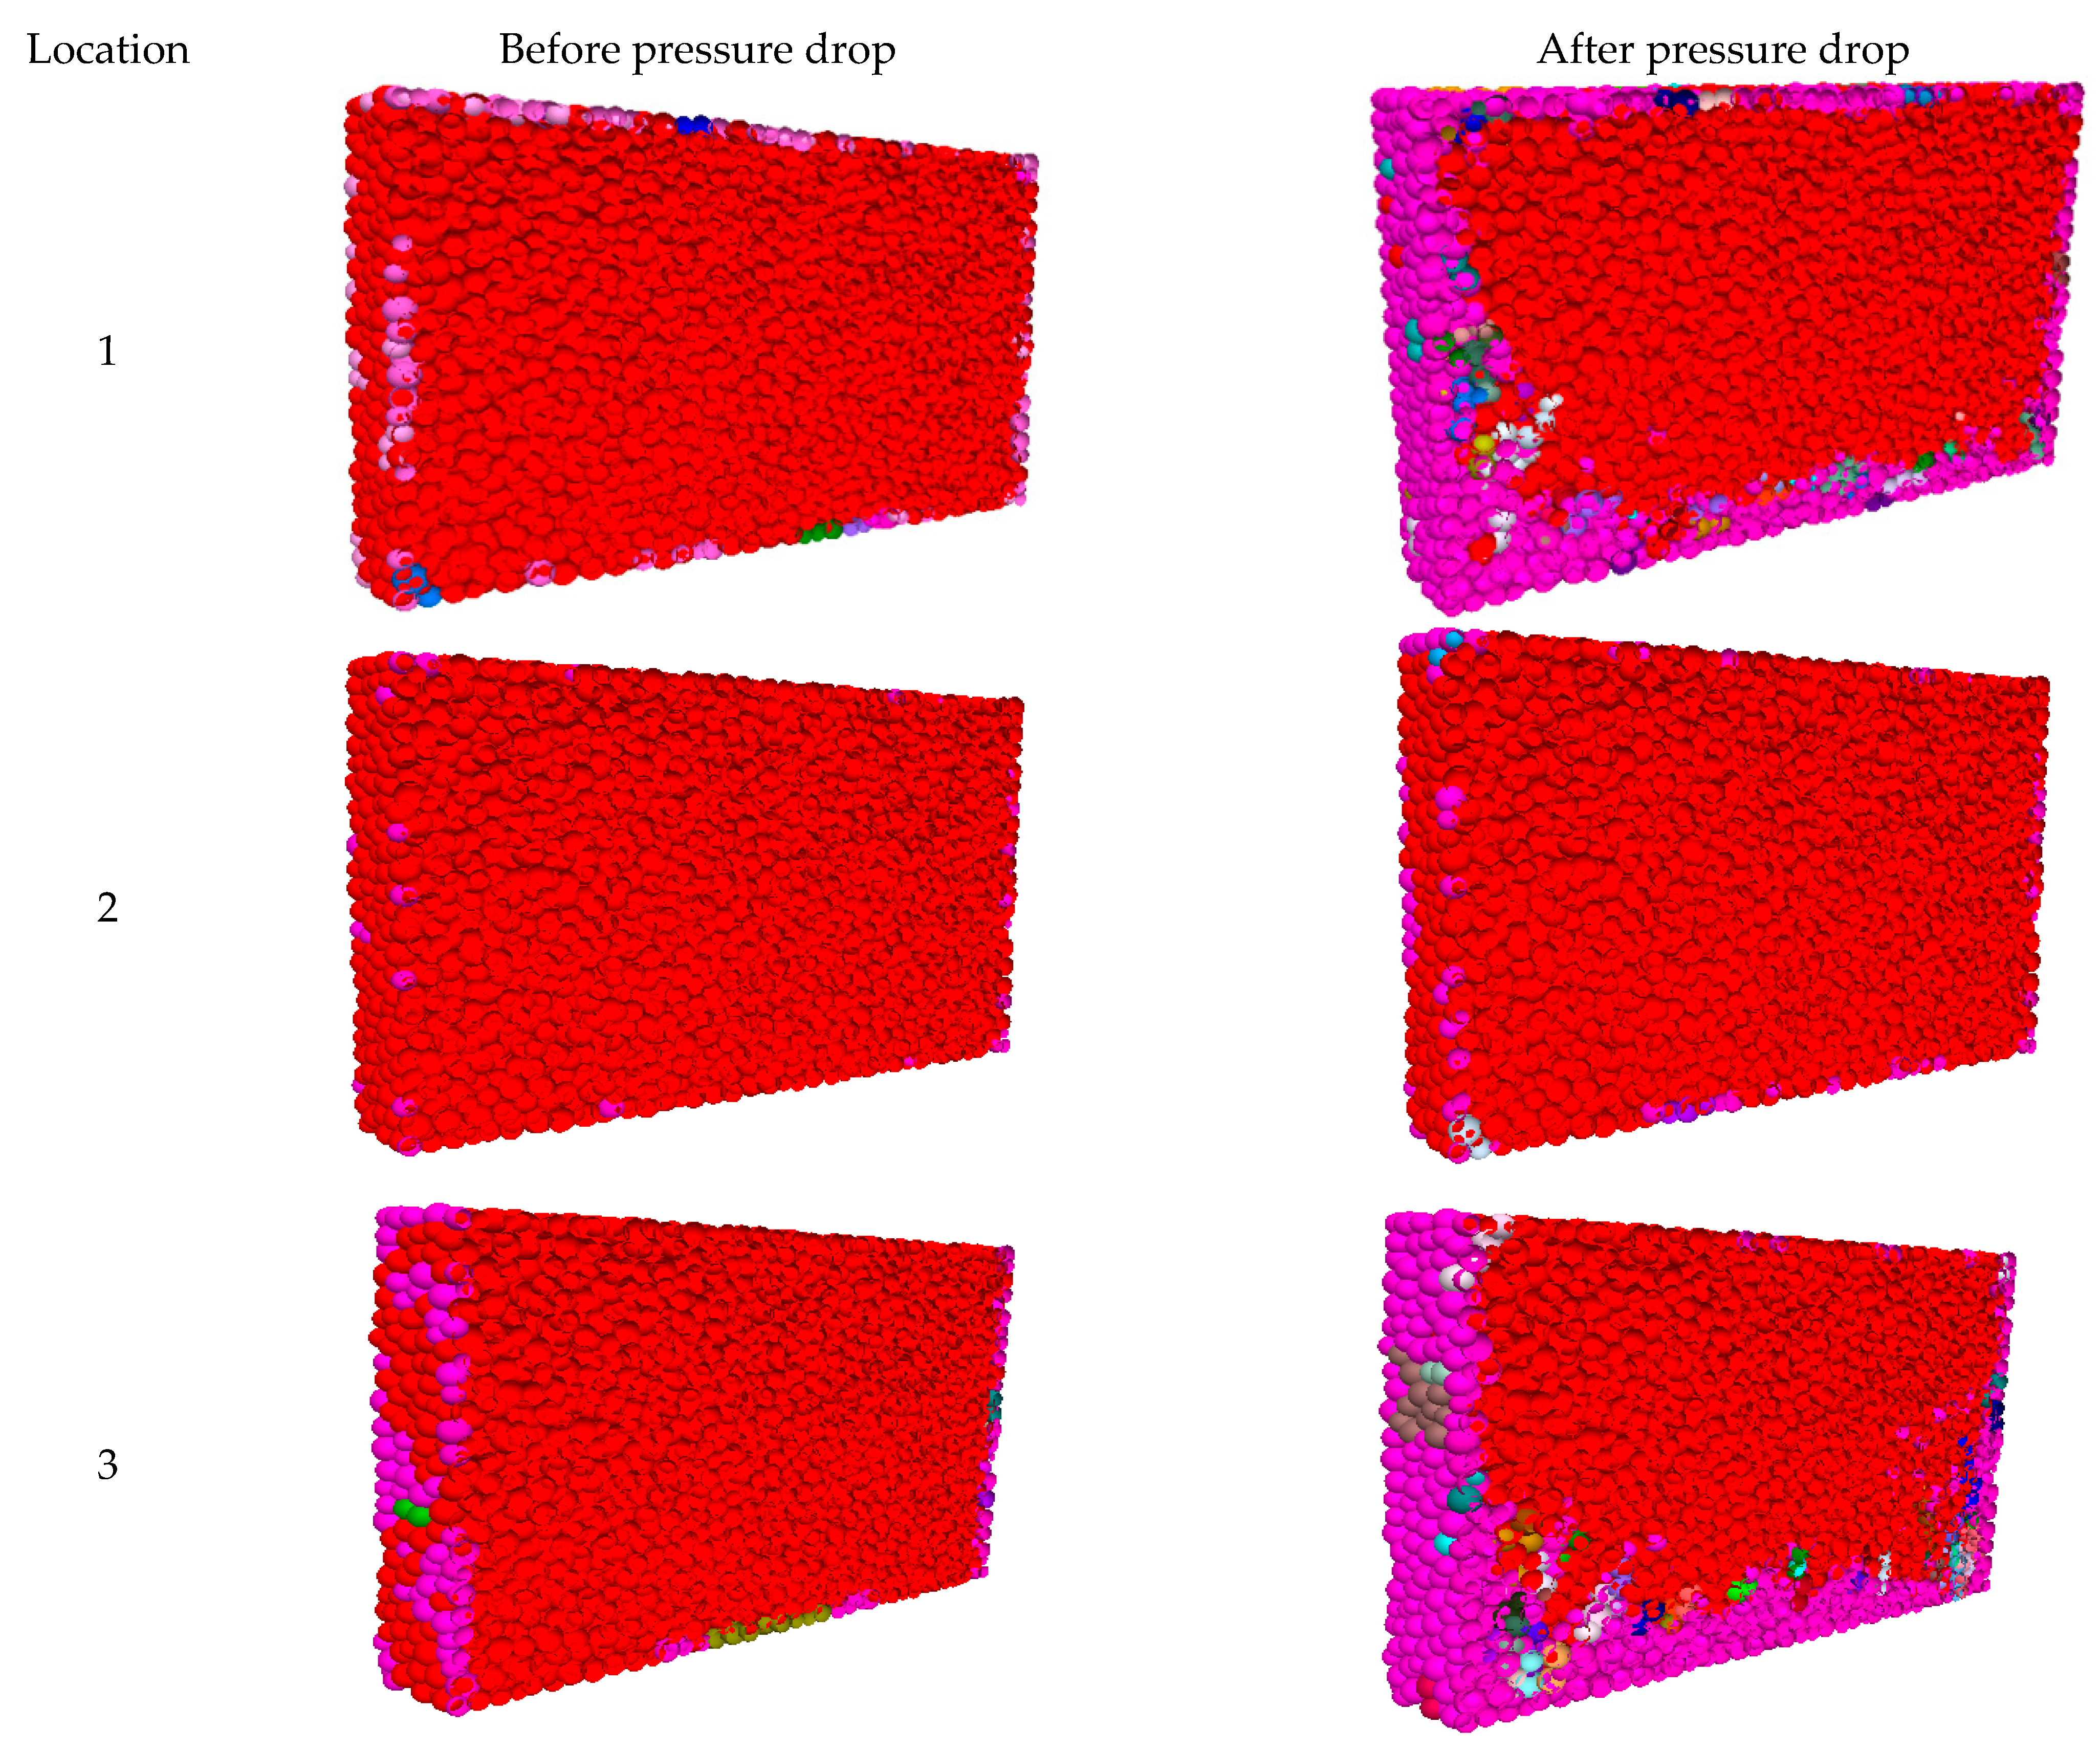
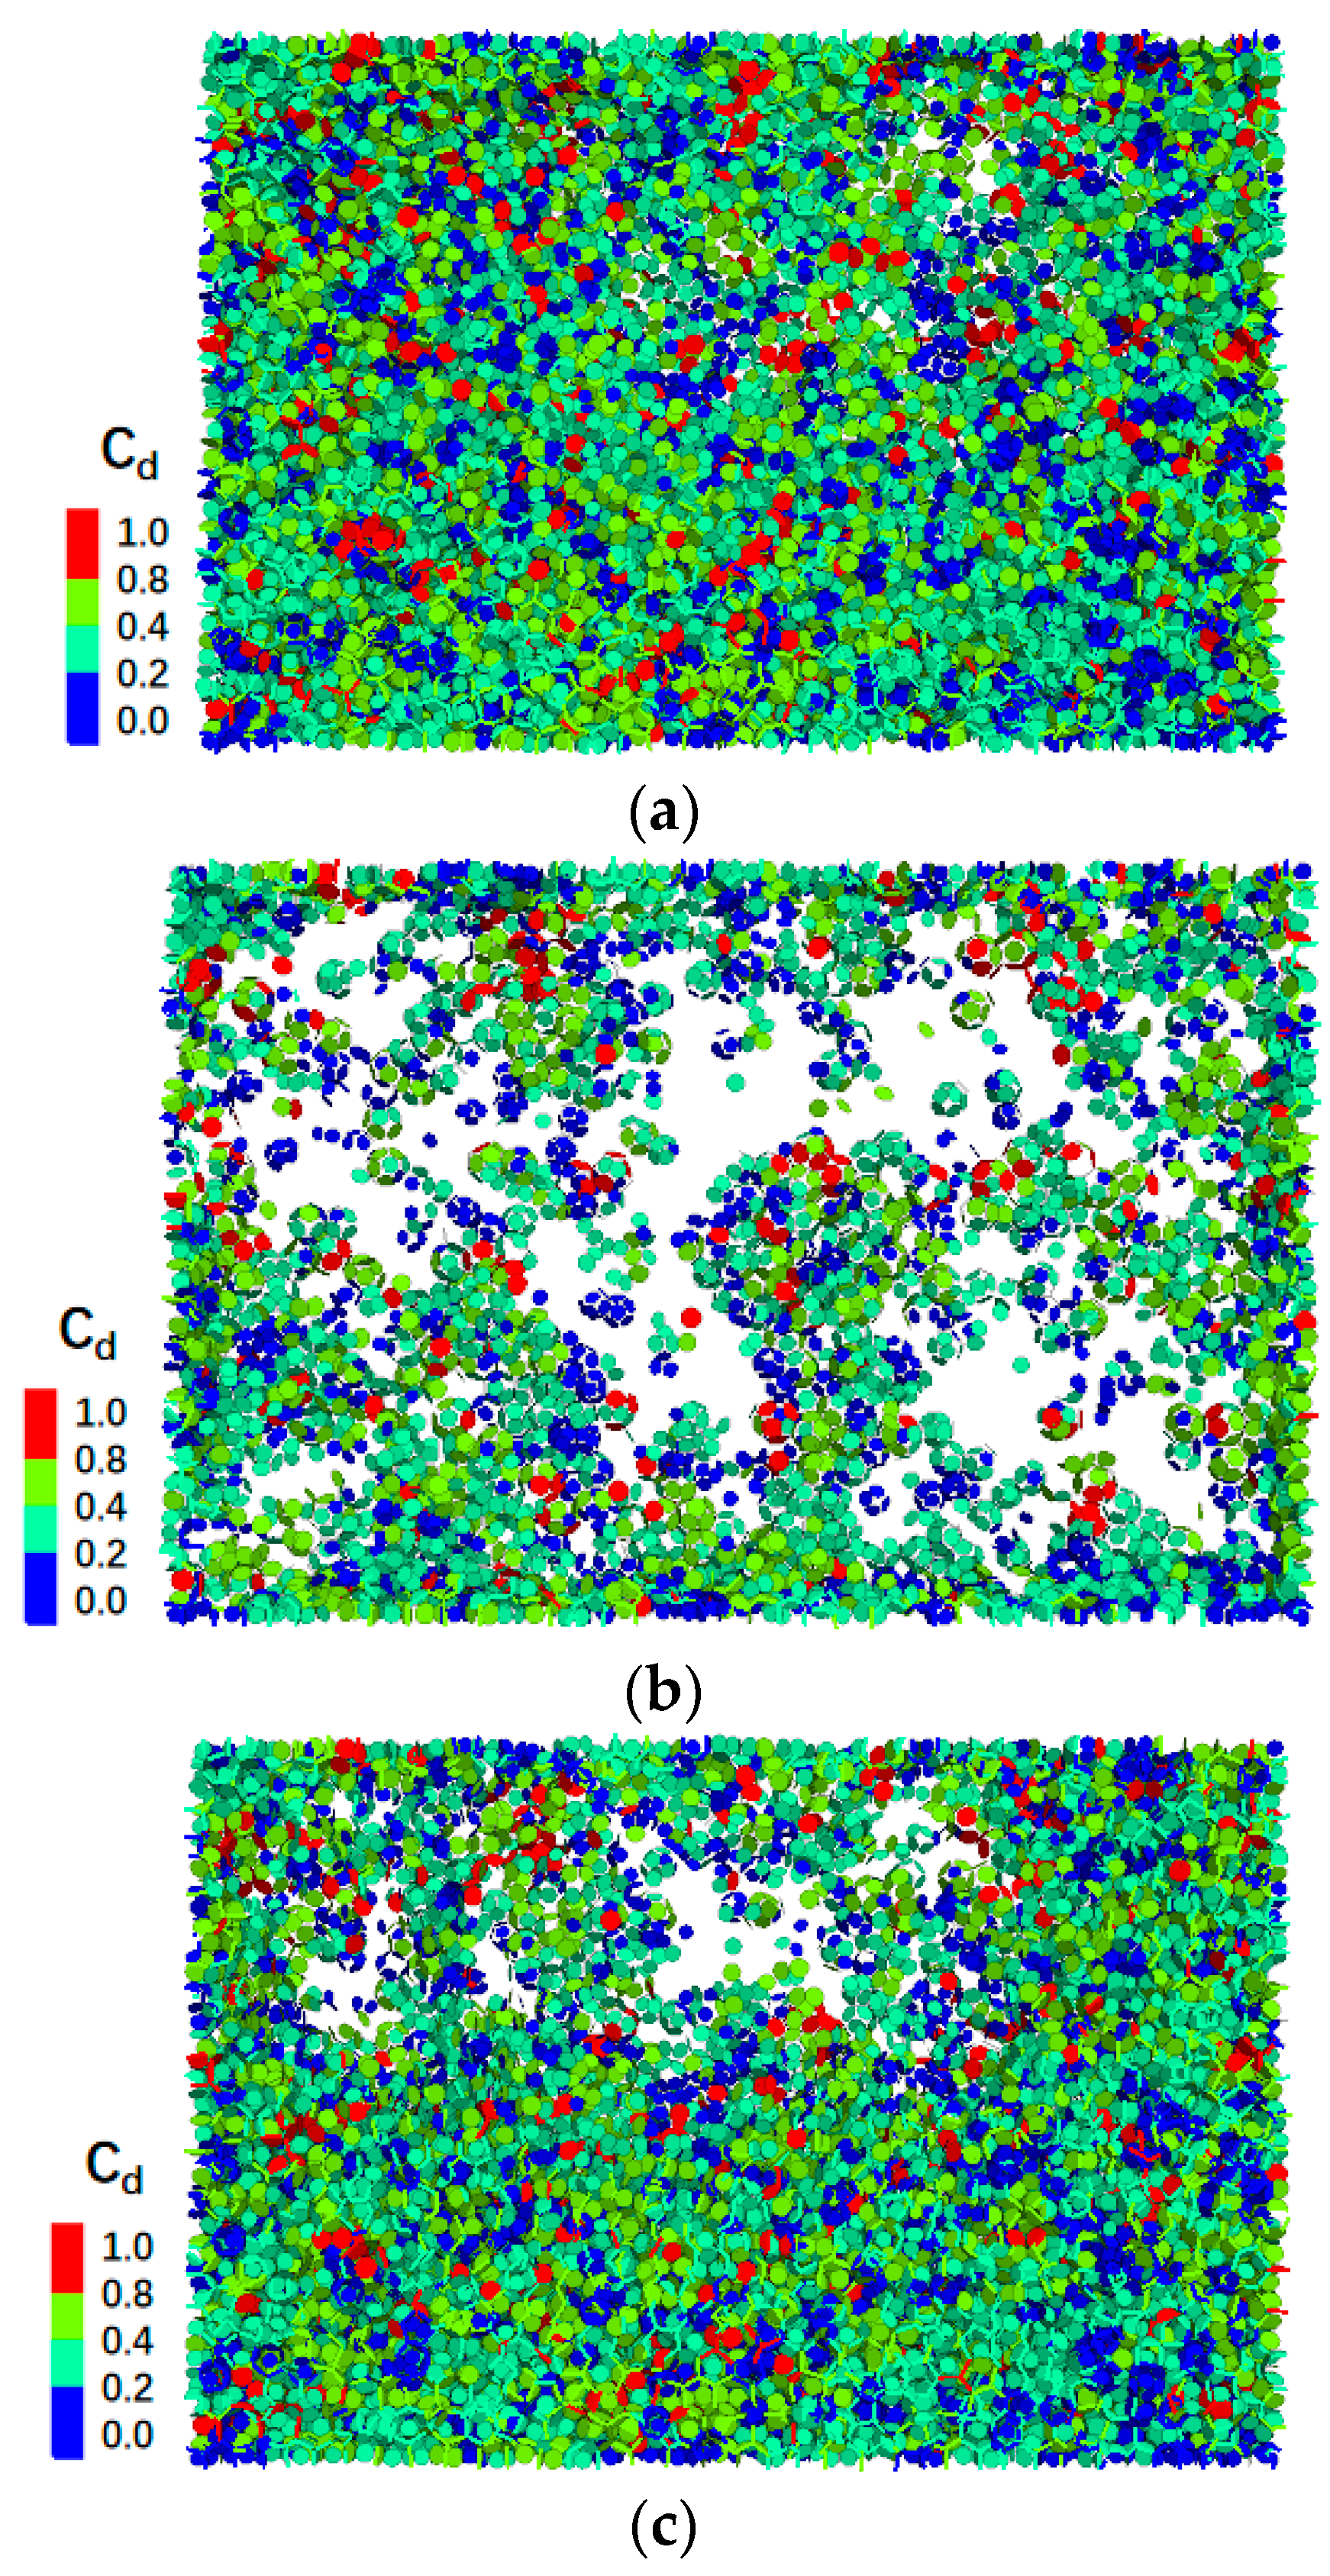
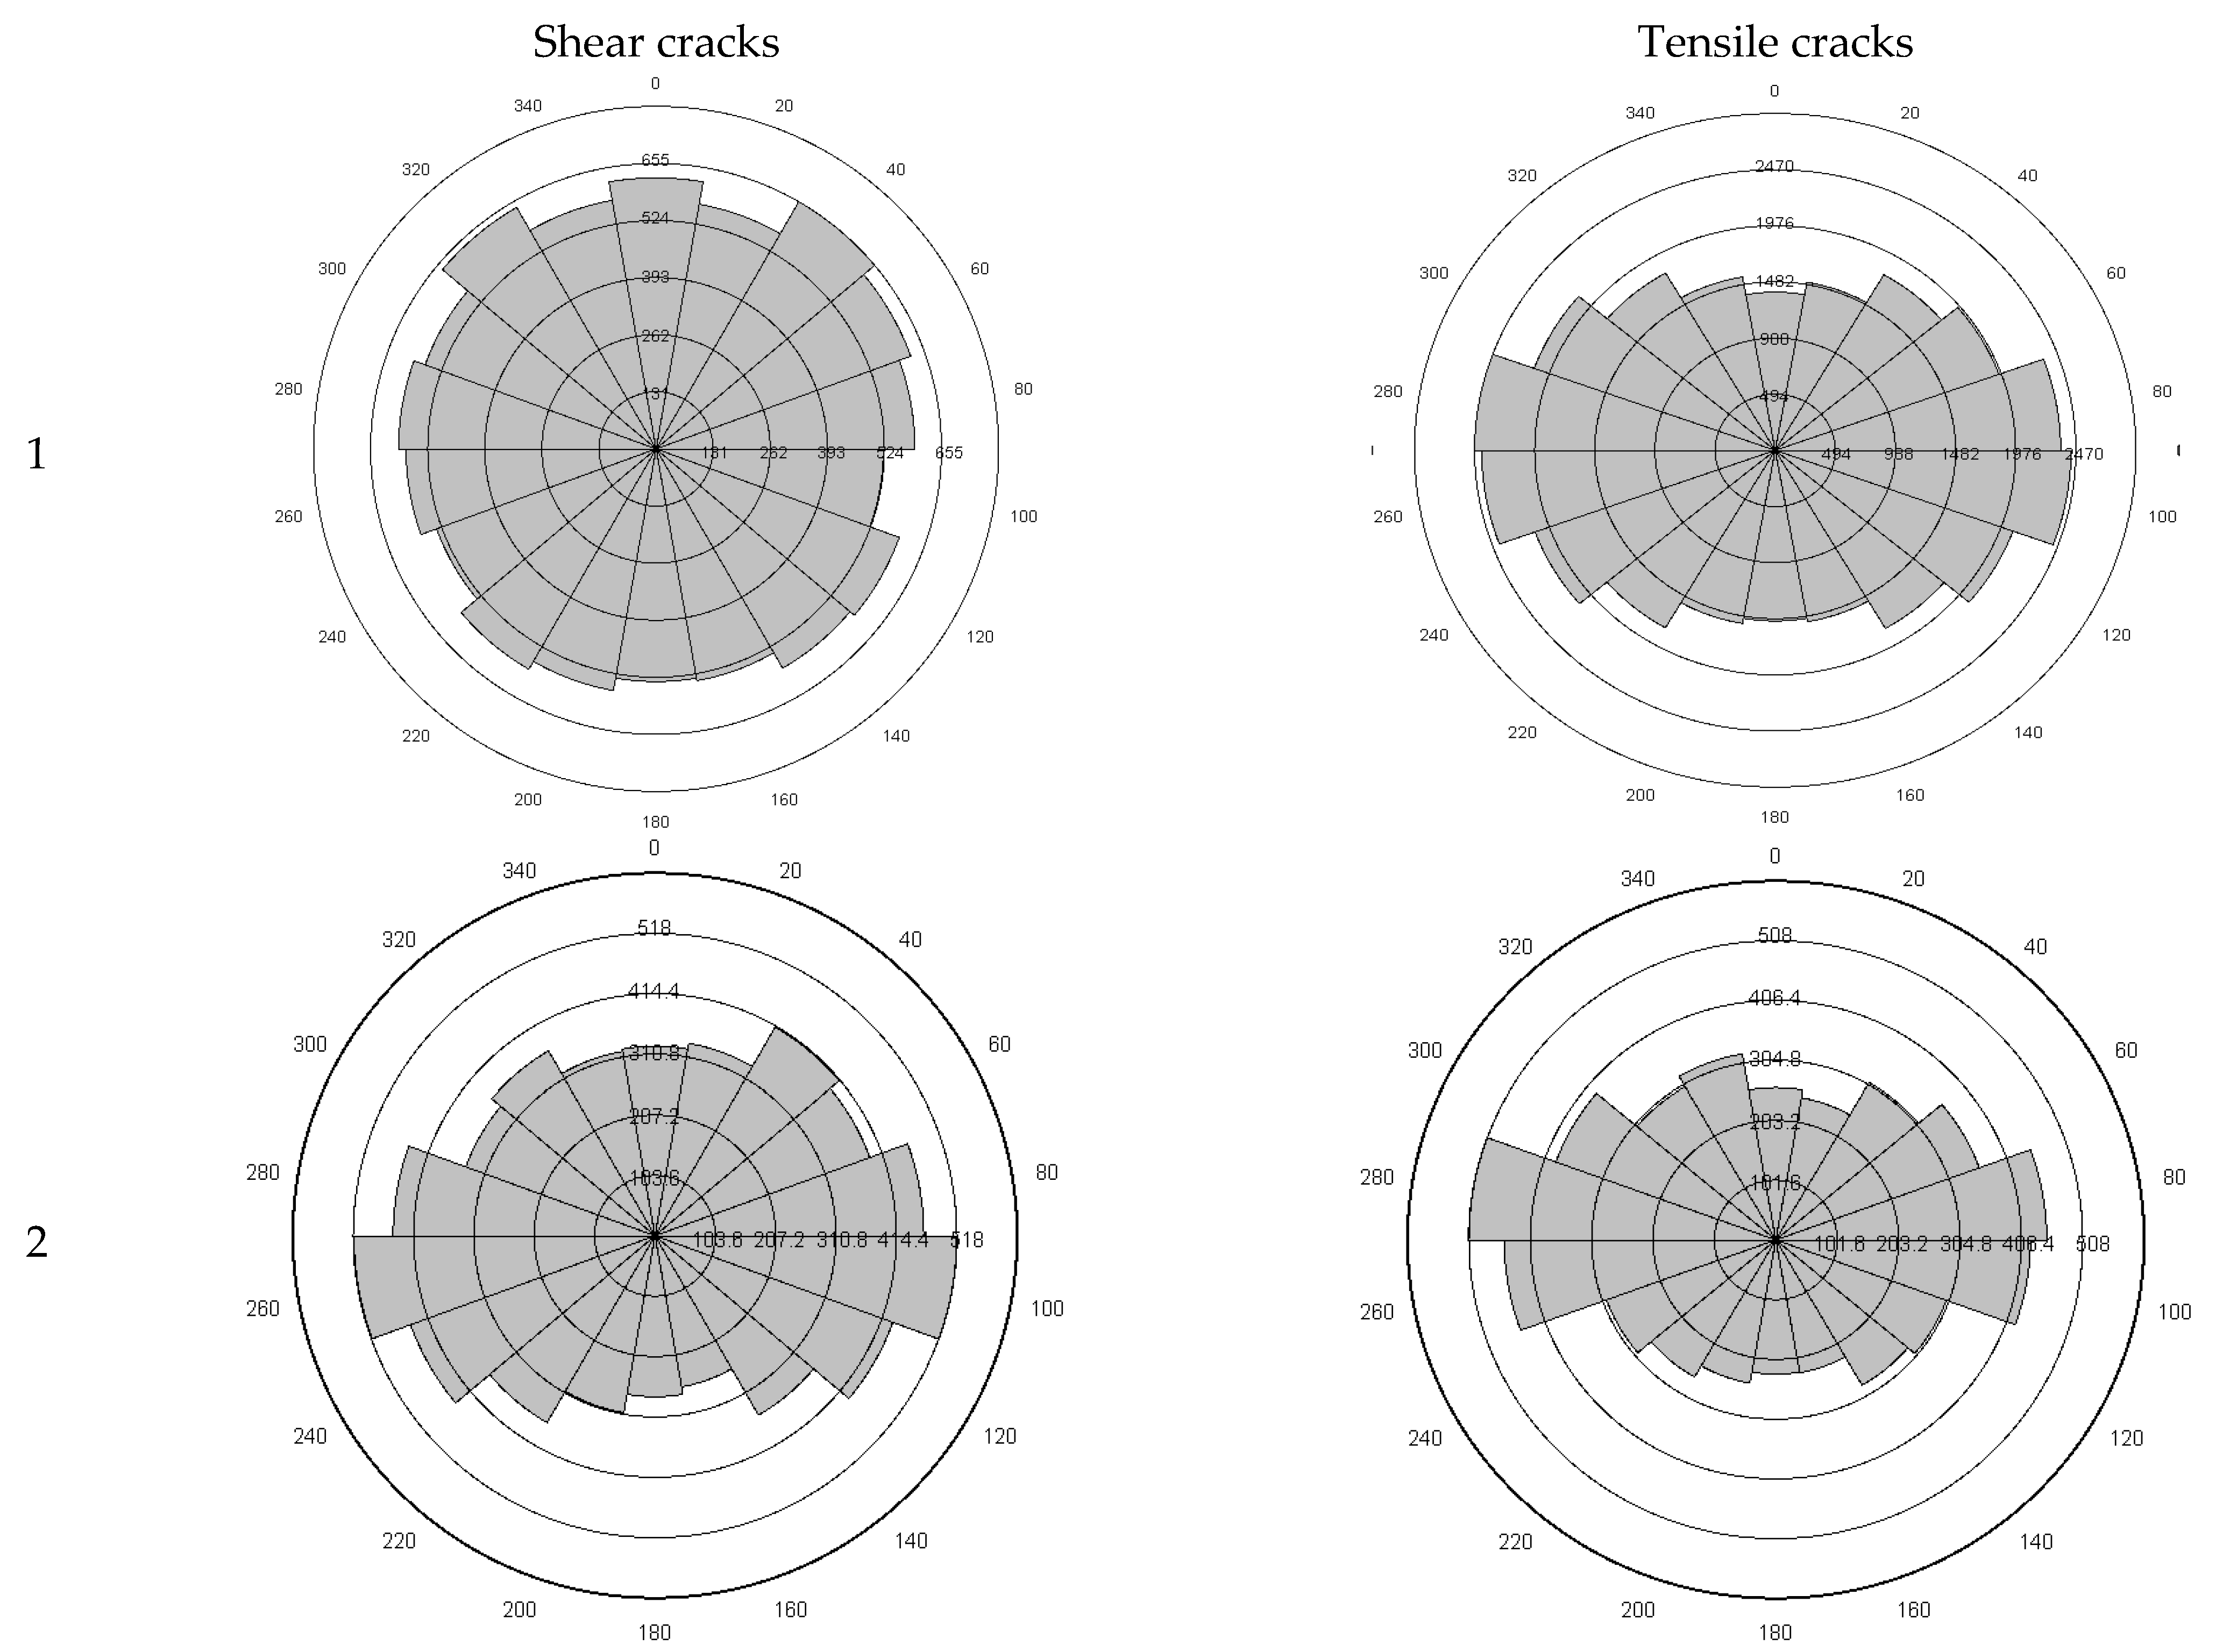
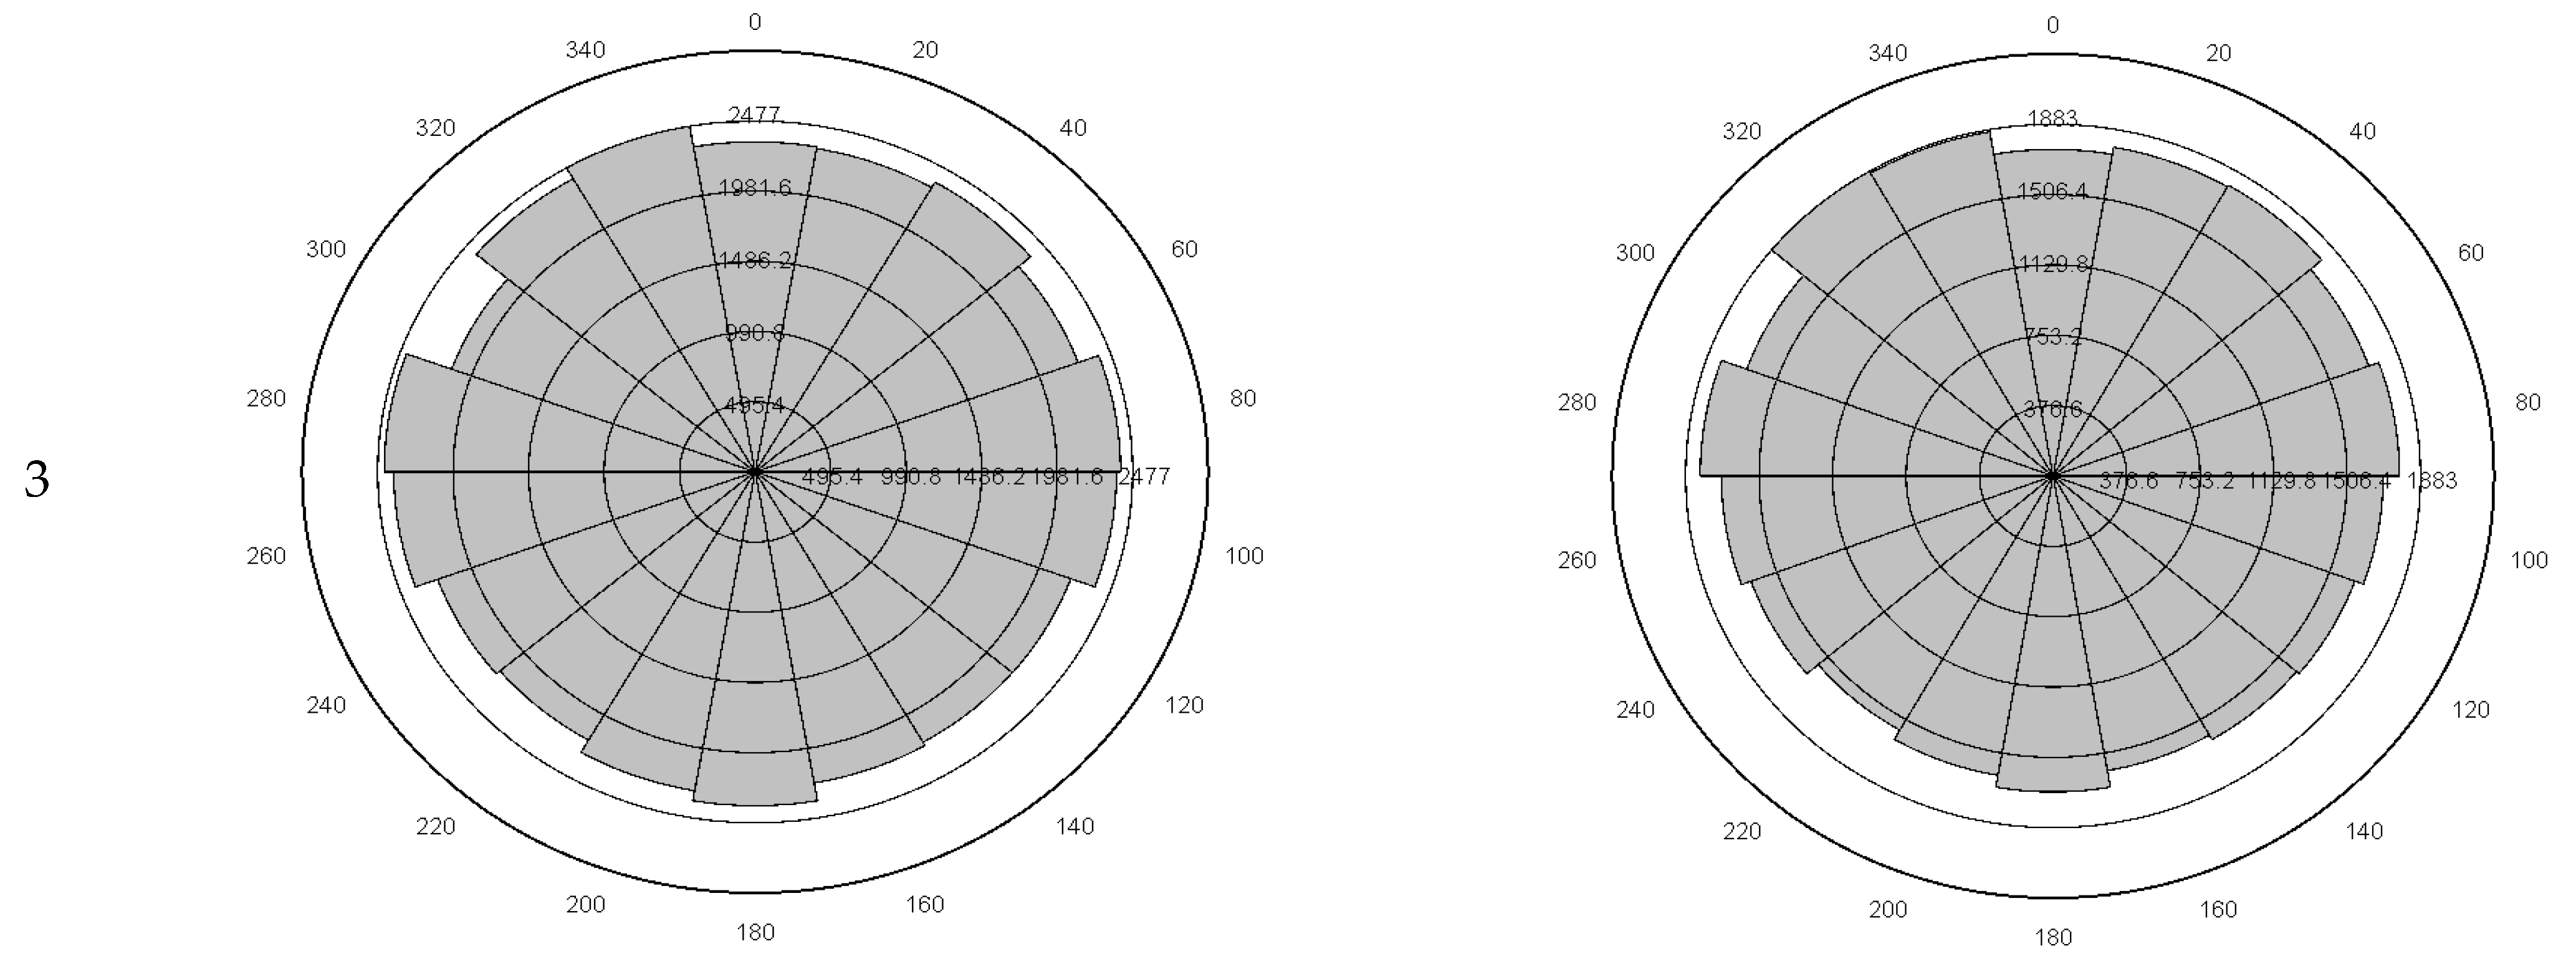
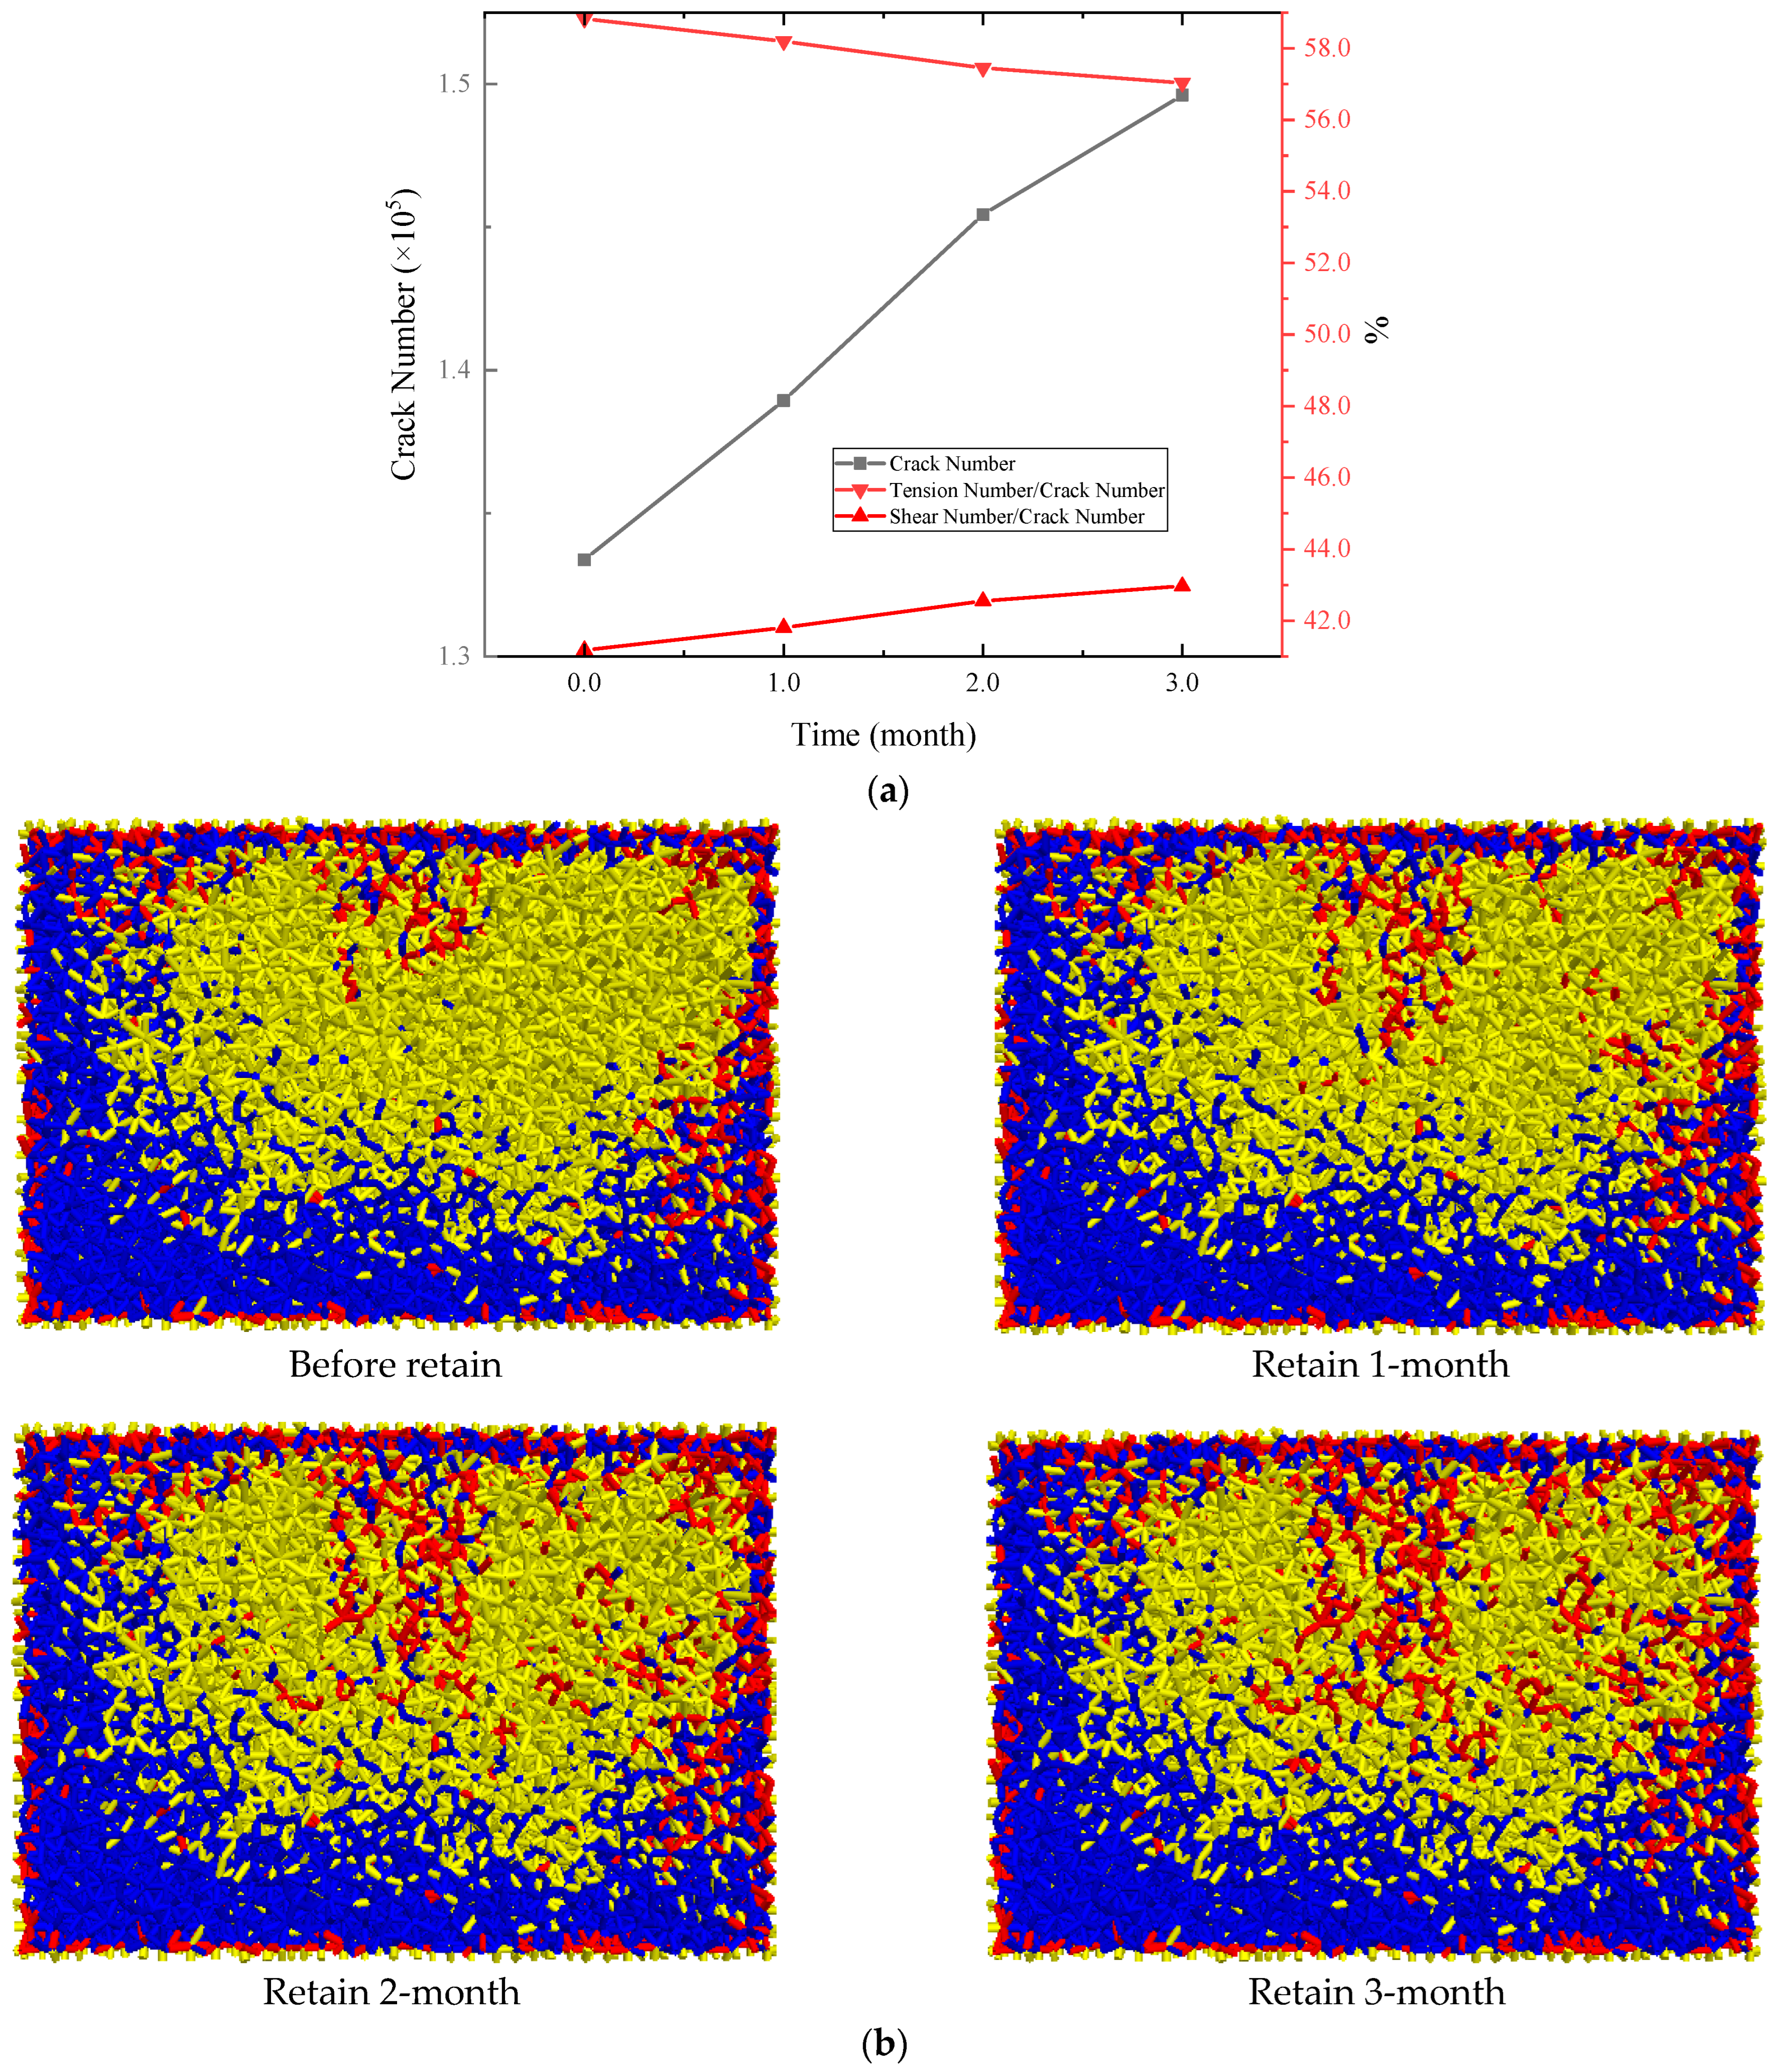
3.2. Dynamic Response to Depressurization and Progressive Damage Characteristics

Crack increments at three different locations are compared (Figure 9). The crack numbers at locations 1 and 3 are much higher than the number at location 2. The closer to the center of the cavern, the more affected by the thermal effect, and the more cracks formed. Particularly for location 1, close to the section of the most irregular geometrical of the caverns, which is the concentration of high stress, and has the potential local failure zones resulting from microcracking and might lead to damage. The tension crack is the dominant crack mode, as the tension cracking is the failure consequence of tension force (Equation (2)) induced by the thermal effect. Only the normal component of contact force between particles is affected by thermal expansion, resulting in tension failure. However, the influence of temperature is limited to some extent. The thermal effects are negligible beyond 10 m away from the brim of the surrounding wall of the salt cavity. At location 2, it is noticed that the increasing rate of tension crack decreases with time. Figure 10 illustrates the comparison of cracks development due to severe pressure drop, before and after. It can be seen clearly from the side view of the DEM specimen. After the depressurization, it is observed at location 1 that the cracks are generated and propagated starting from the lower left corner close to the cavity brim, the shear cracks are dominant. The sideview shows that the microcracking induced the discontinuities and was prone to particles falling off. Location 3 is much closer to the brim of the cavity along the edge and cracks are formed and propagate on both sides of the DEM specimen. Location 2 is farther away from the cavity wall, hence there are fewer cracks, and the cracks propagate from the left lower corner dominated by tension cracks.
In the PFC3D model, the fracture mass density is defined as the total fracture surface area per unit volume. The definition of fracture area is as followings:
If the domain is cubic, L is the length of the side of the cube. The number of fractures with sizes between l1 and l2 is given by:
n ( l 1 l l 2 ) =   l 1 l 2 n ( l ) L 3 d l = a ( l 2 1 a l 1 1 a 1 a L 3 )
The term a fixes the total fracture density by a range of fracture sizes.
d m ( l c ) l c n ( l ) l 2 L 3 d l
The damage process is associated with cracking induced by cycles of gas pressurization and depressurization in the salt cavern.
To better evaluate the distribution of microcracks in discrete modeling, a normalized relative index c d is employed. The base point is 1.25 × 10⁻³ m2/m3, as it is the value of the fracture surface area per unit volume. The absolute index c d is the fracture mass density, which is defined as the fracture surface area per unit volume. The normalized concentration degree of crack index c d ranging from 0 to 1 is defined as the absolute index normalized by the maximum to minimum value among all the cracks. Figure 11 shows the comparison of three different locations of the surrounding wall of the salt cavity, which are: (a) location 1—at the knee point of the cavity shoulder, i.e., the convexity closest to the rim; (b) location 2—right part off the knee point, deep in the rock salt formation; (c) location 3— 11.8   m away from the cavity surrounding the wall edge, the most farthest from the centerline of the cavity. The microcrack forms and distributes into the entire specimen in location 1. The crack distribution is more concentrated compared with the other two locations far away from the convexity. The microcracks become less intensive in the region that is not close to the inner cavity with no convexity–concavity. The damage failure exhibits operation confinement and shape dependence. Figure 12 indicates the trend of the crack number using the normalized relative index c d . It shows that most of the cracks are with c d = 0.2 . To investigate the heterogeneities of thermal cracking in rock salt, Figure 13 illustrates the rose diagrams of tensile and shear cracks at location 1, location 2, and location 3, respectively. The radial length of each bin indicates the number of shear or tensile cracks oriented within the corresponding angles. It shows that tensile cracks tend to initiate in the horizontal orientation at location 1 which is close to the cavity surrounding the wall. While the orientation of shear cracks in all three selected locations is uniformly distributed.

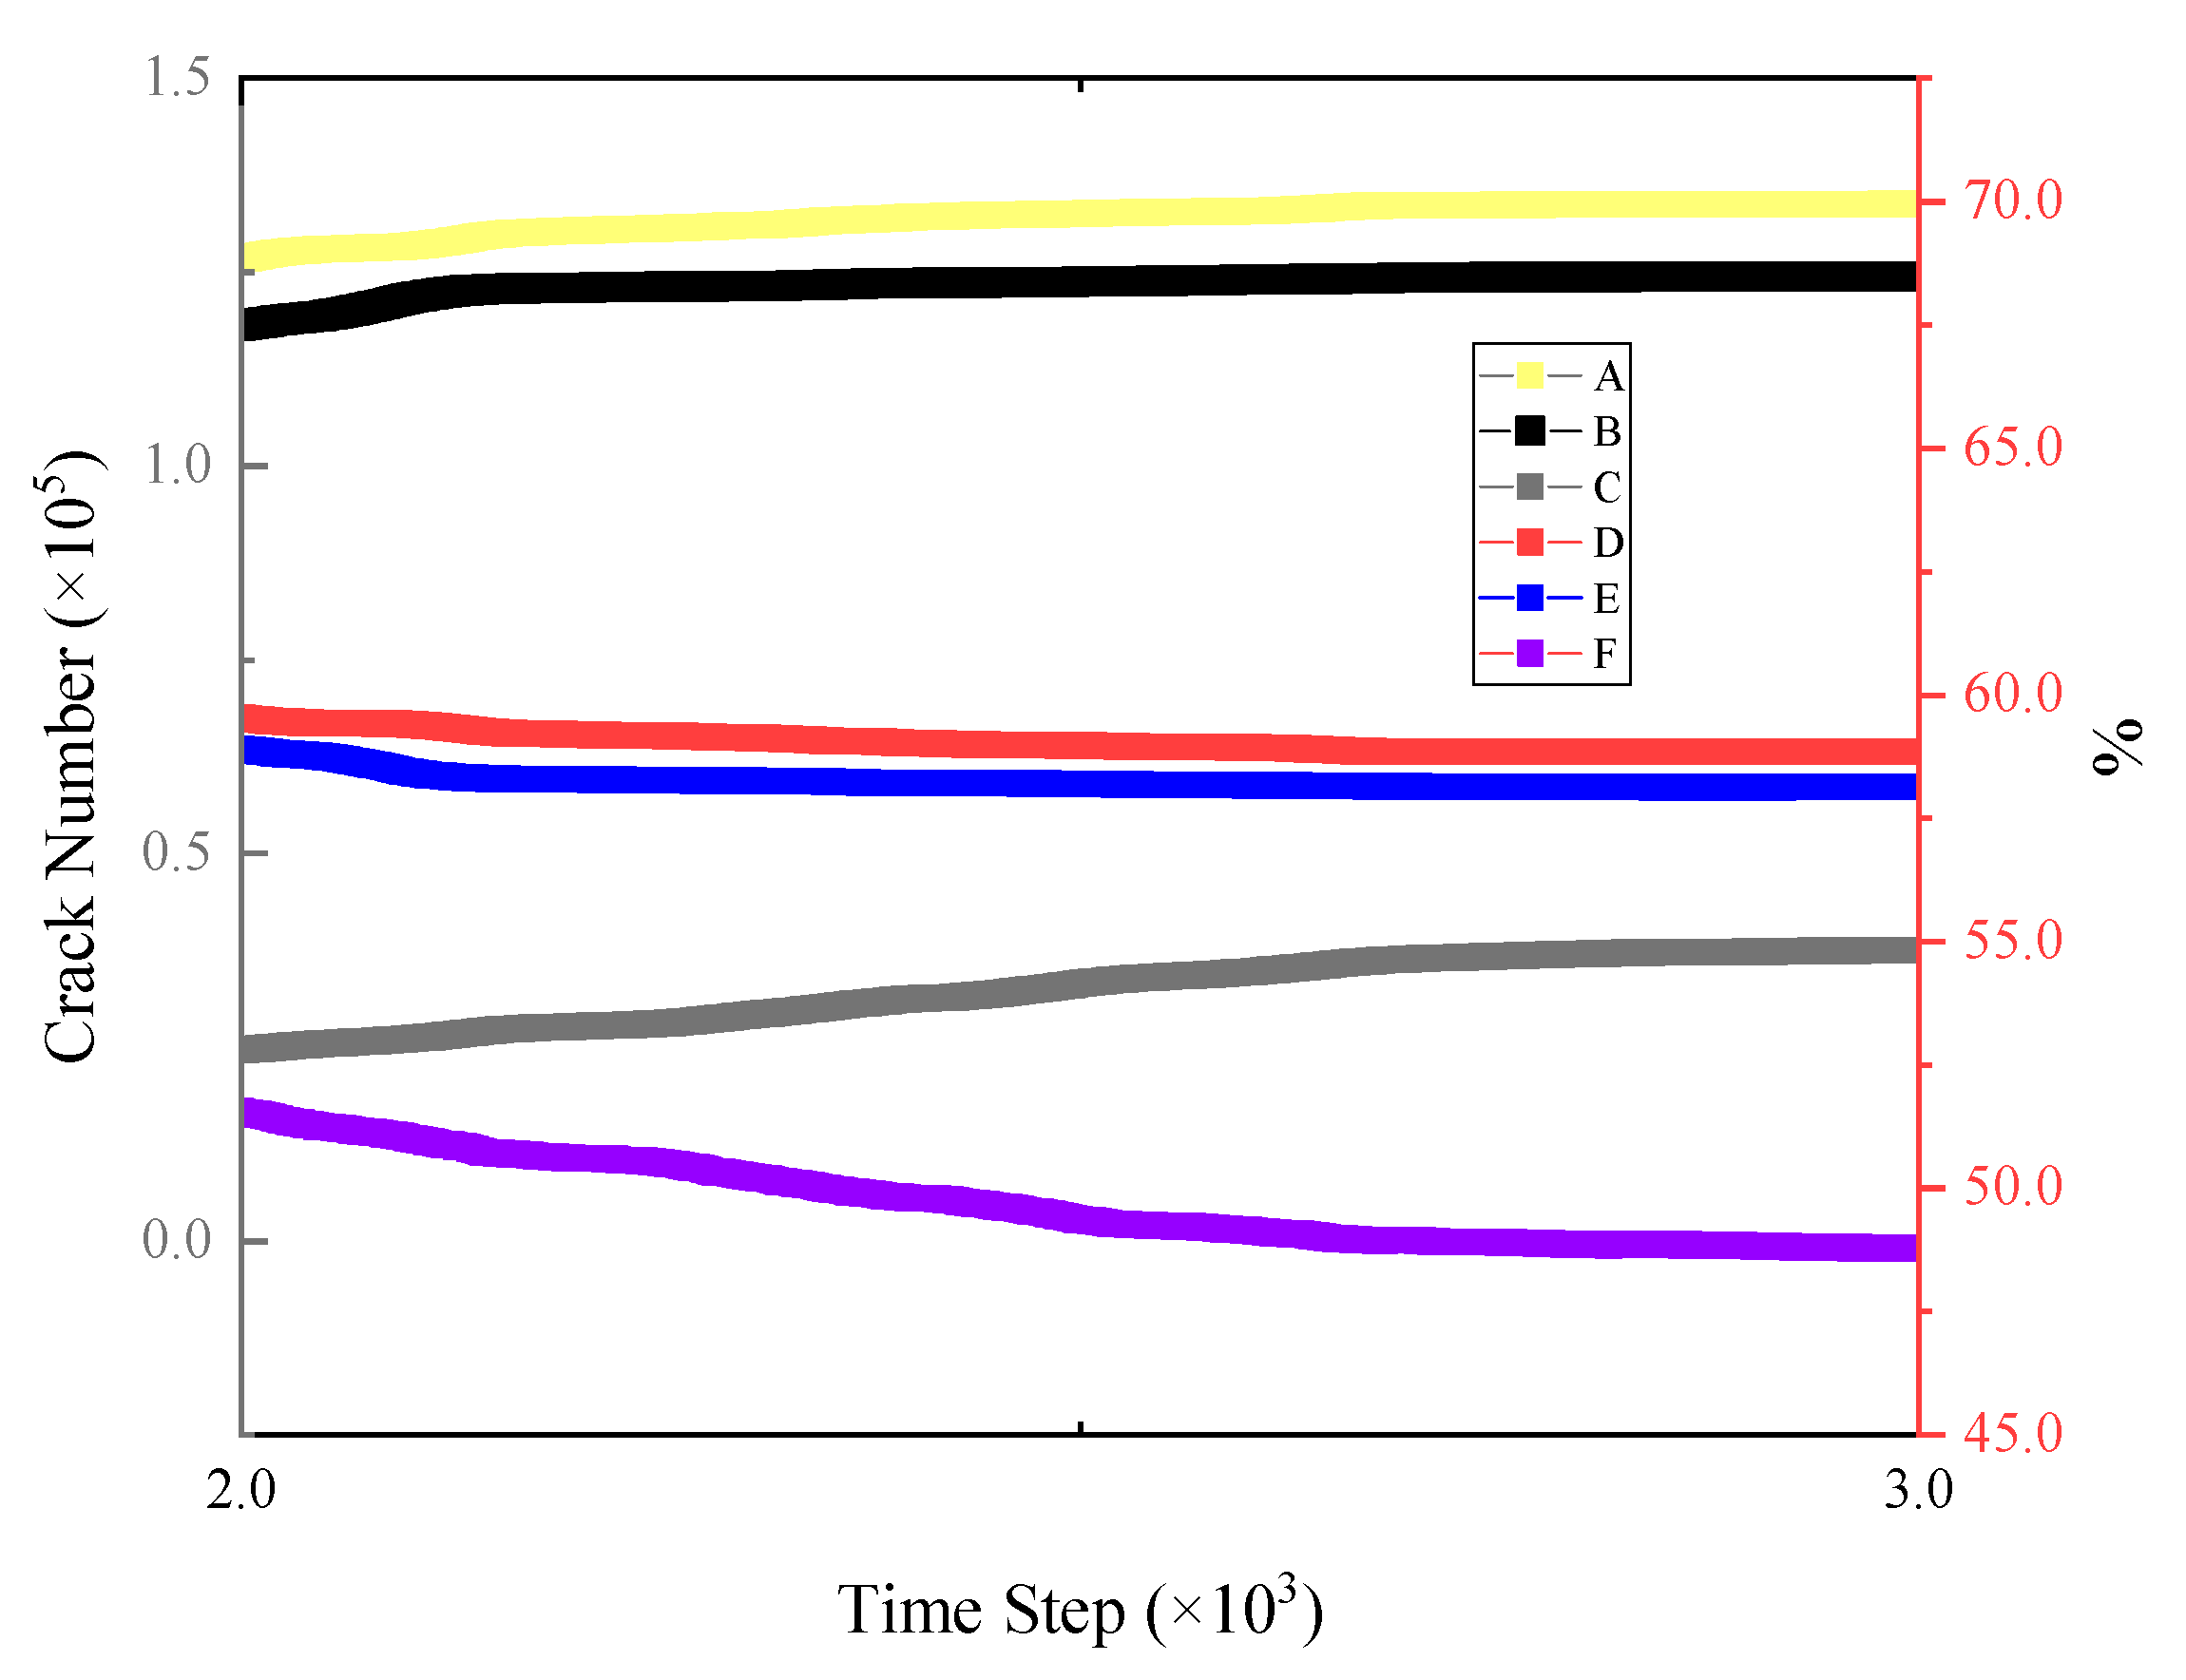
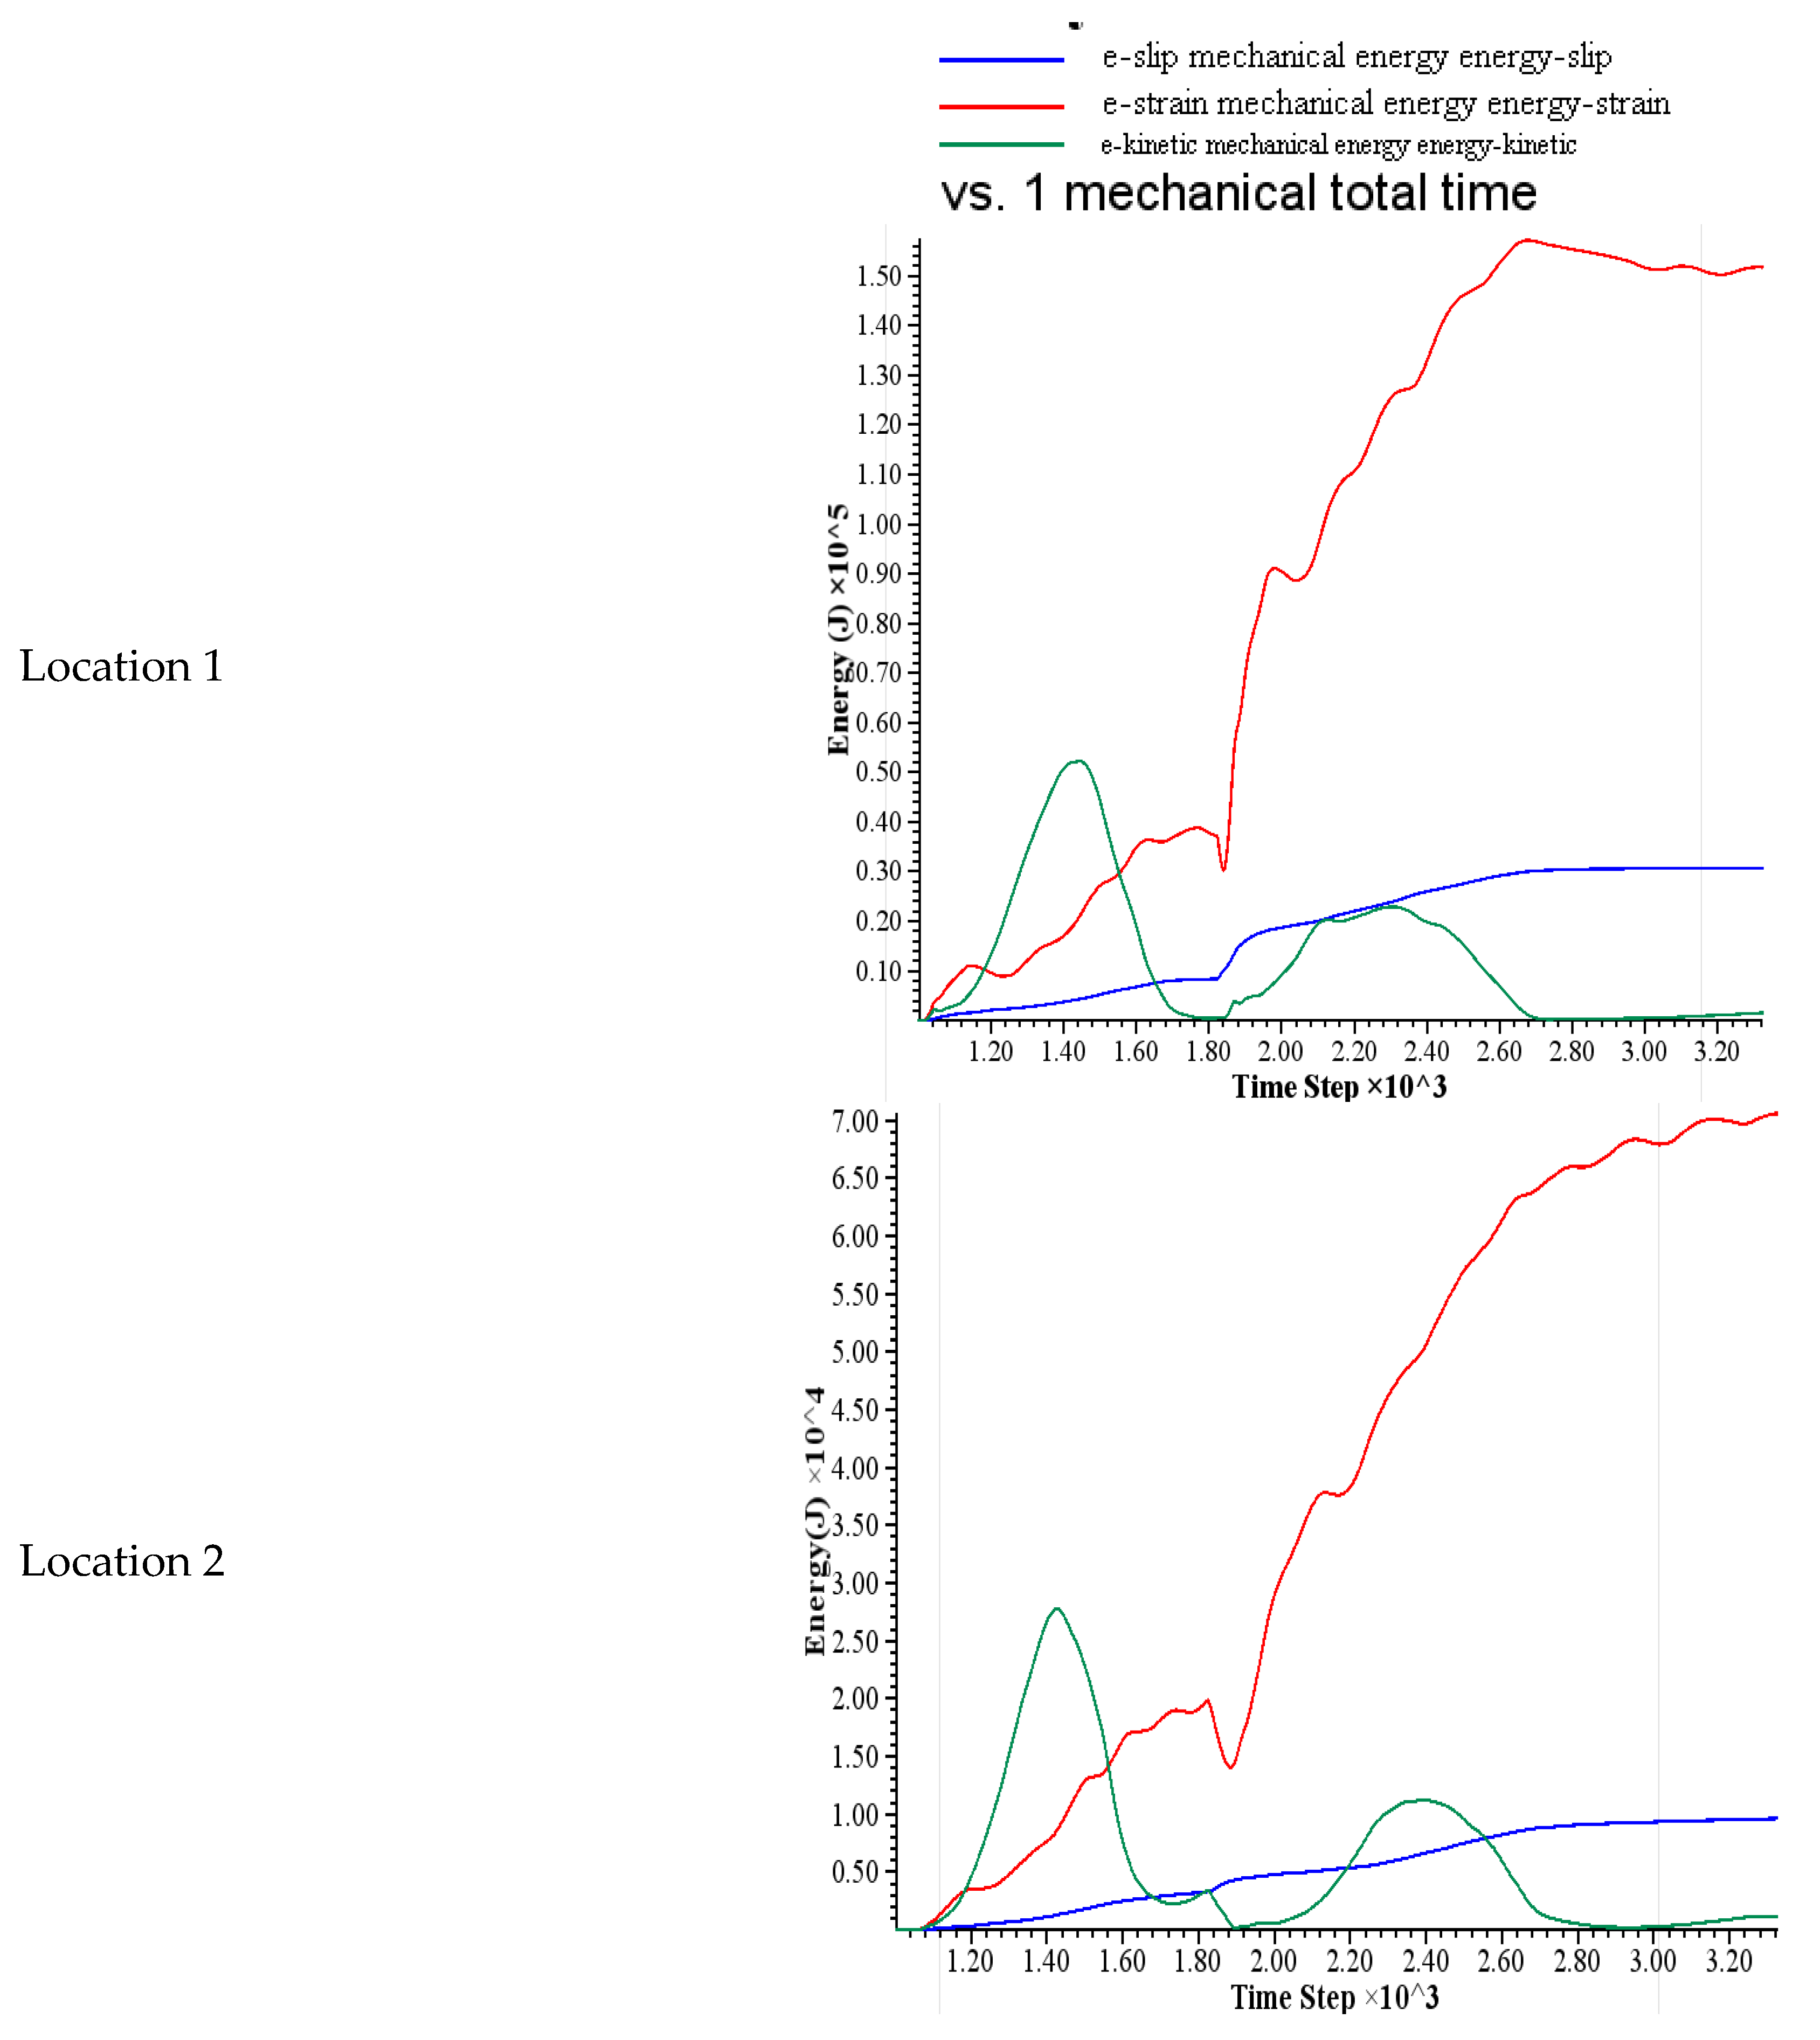
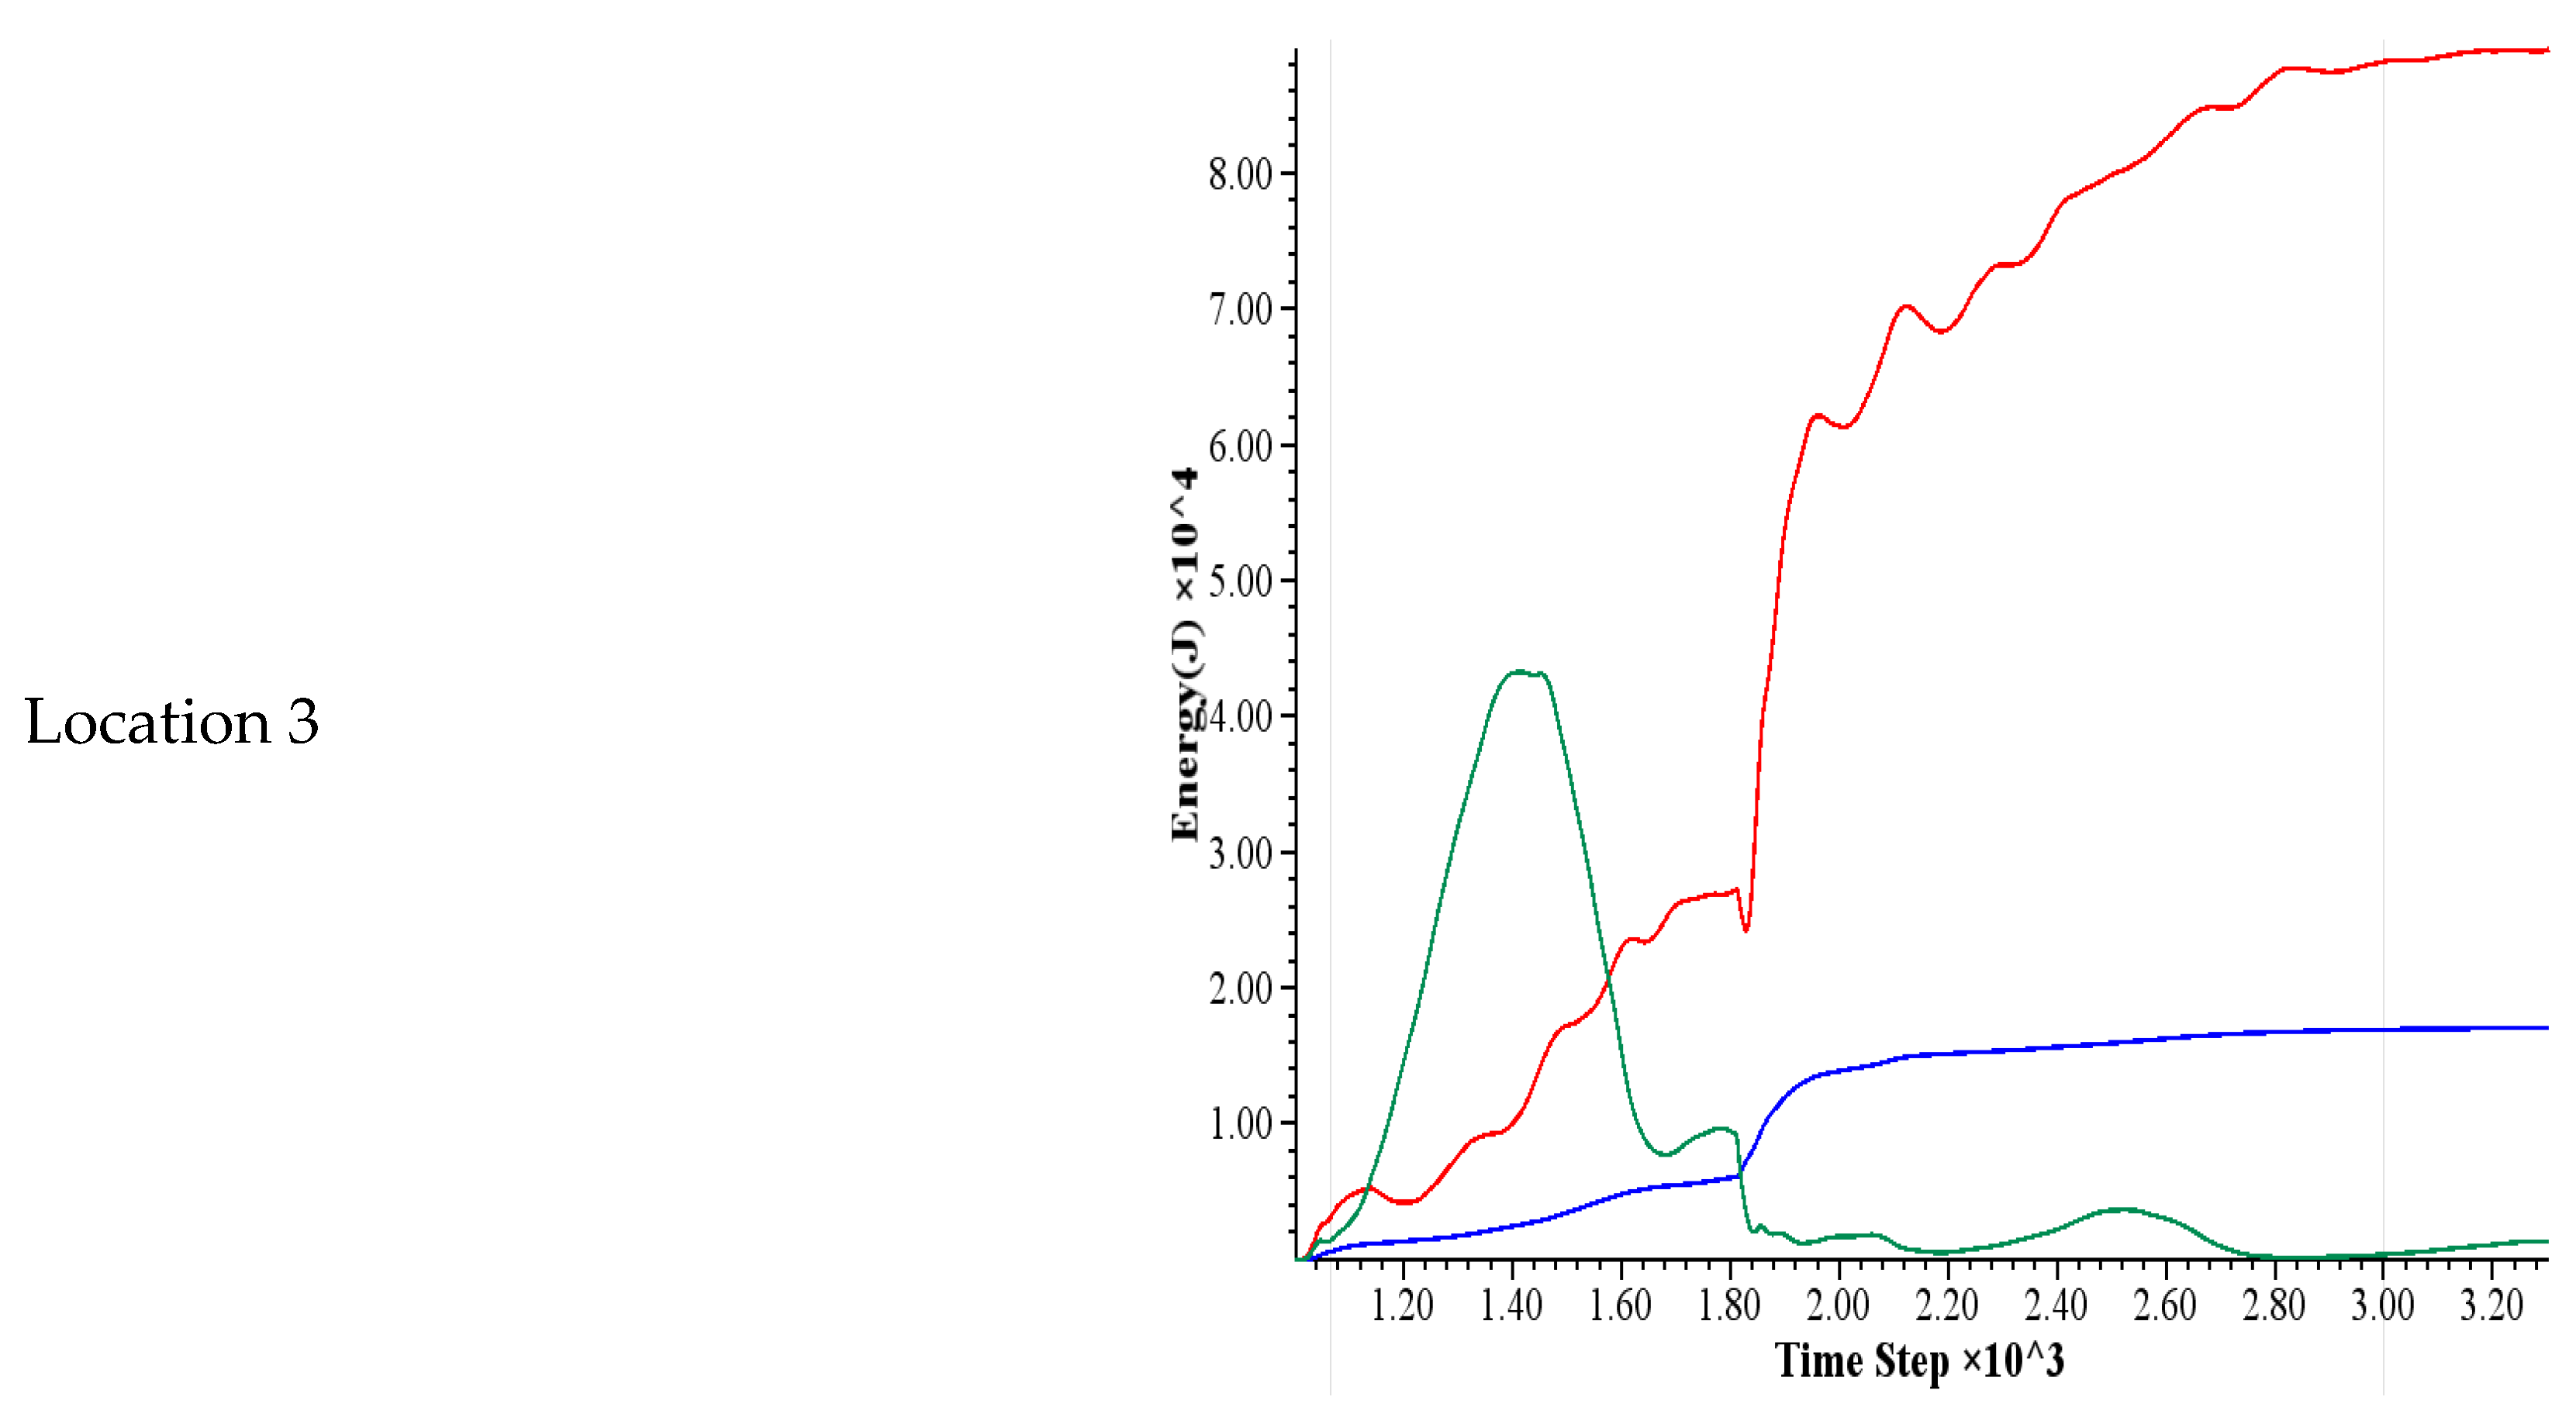
3.3. Energy Tracking

When rock is subjected to loading, the energy dissipates with the elastic process. Numerical simulation is used to track the development of the strain energy, the slip energy, and the kinetic energy. Those energy partitions reflect the energy evolution during fractures propagation subjected to the thermal-mechanical coupling process. When the thermal effects are taken into account, the total stress is the summation of the mechanical stress and the thermal stress.
Strain energy, E K , is defined as the energy stored in the linear springs (Itasca Inc., 2019).
E K = 1 2 ( ( F n l ) 2 K n + F l s K S 2 )
F n l : linear normal force;
F l s : linear shear force;
K n : Normal stiffness;
K S : Shear stiffness;
Slip energy E μ , is defined as the total energy dissipated by frictional slip.
E μ : = E μ 1 2 ( ( F s l ) o + F s l ) Δ δ μ
( F s l ) o : linear shear force at the beginning of the timestep;
F l s : linear shear force;
Δ δ μ : shear displacement component decomposed into slip component;
E kinetic : kinetic energy of the particle.
E kinetic = 1 2 m v 2
m: particle mass;
V: particle velocity.
The evolution of these energy partitions is significantly impacted by the sharp pressure drop, as shown in Figure 14. At location 1, the strain energy decreases slightly followed by a dramatic rise and an increase of crack numbers. The initiation of cracks is positively correlated to the dissipation of strain energy, as the stain energy is stored in the contacts of neighboring particles. The higher rate of energy dissipation means that more cracks initiate. Slip energy rises gradually, indicating the increase of the relative deformation between particles. There is fluctuation in kinetic energy at all the three locations. The particle motion leads to the accumulation of energy to create new cracks. At first, the kinetic energy along the slip energy starts to rise rapidly, probably due to the thermal effect. Meanwhile, the strain energy, E s t r a i n , assumed stored majority input work gradually increases. The breakage of contact bonds indicates more microcracks are initiated. With the reduction of kinetic energy, the kinetic energy is converted to other forms of energy, which leads to the consistent growth of the strain energy. Then, fewer new micro-cracks are developed, and the relative particle motion reduces. As a result, kinetic energy is decreasing gradually. The energy evolution can be attributed to the confinement condition (i.e., the pressure drop in this case), and is clearly associated with fracture generation and propagation.
To evaluate the thermal effect on the energy of the microscopic particle system, we proposed a thermal-mechanical energy factor. T M K ,   T M L ,   T M S , and T M K are defined as:
T M K = A K B K A K
where AK is the kinetic energy of particles under thermal-mechanical force and BK is the kinetic energy of particles under mechanical force only.
The larger the TMK is, the greater the influence of the thermal effect on the kinetic energy of particles, and the closer TMK is to one, indicating that the kinetic energy of particles is dominated by the thermal effect. TMK is close to zero, indicating that the kinetic energy of particles is affected by dynamic mechanical force only.
T M L = A L B L A L
where AL is the sliding energy of particles under thermal-mechanical force and BL is the sliding energy of particles under mechanical force only.
T M S = A S B S A S
where AS is the strain energy of particles under thermal-mechanical force and BS is the strain energy of particles under mechanical force only.
From Figure 15, it is not difficult to see that the TMLs of position 1 and position 2 are near the red line, indicating that the thermal effect has an influence on the sliding energy. According to the slope of each line, it can be seen that from location 1 to location 2 and then to location 3, which is, the farther away from the sensitive brim of the salt cavity, the influence of the thermal effect gradually attenuates.

4. Results and Discussion

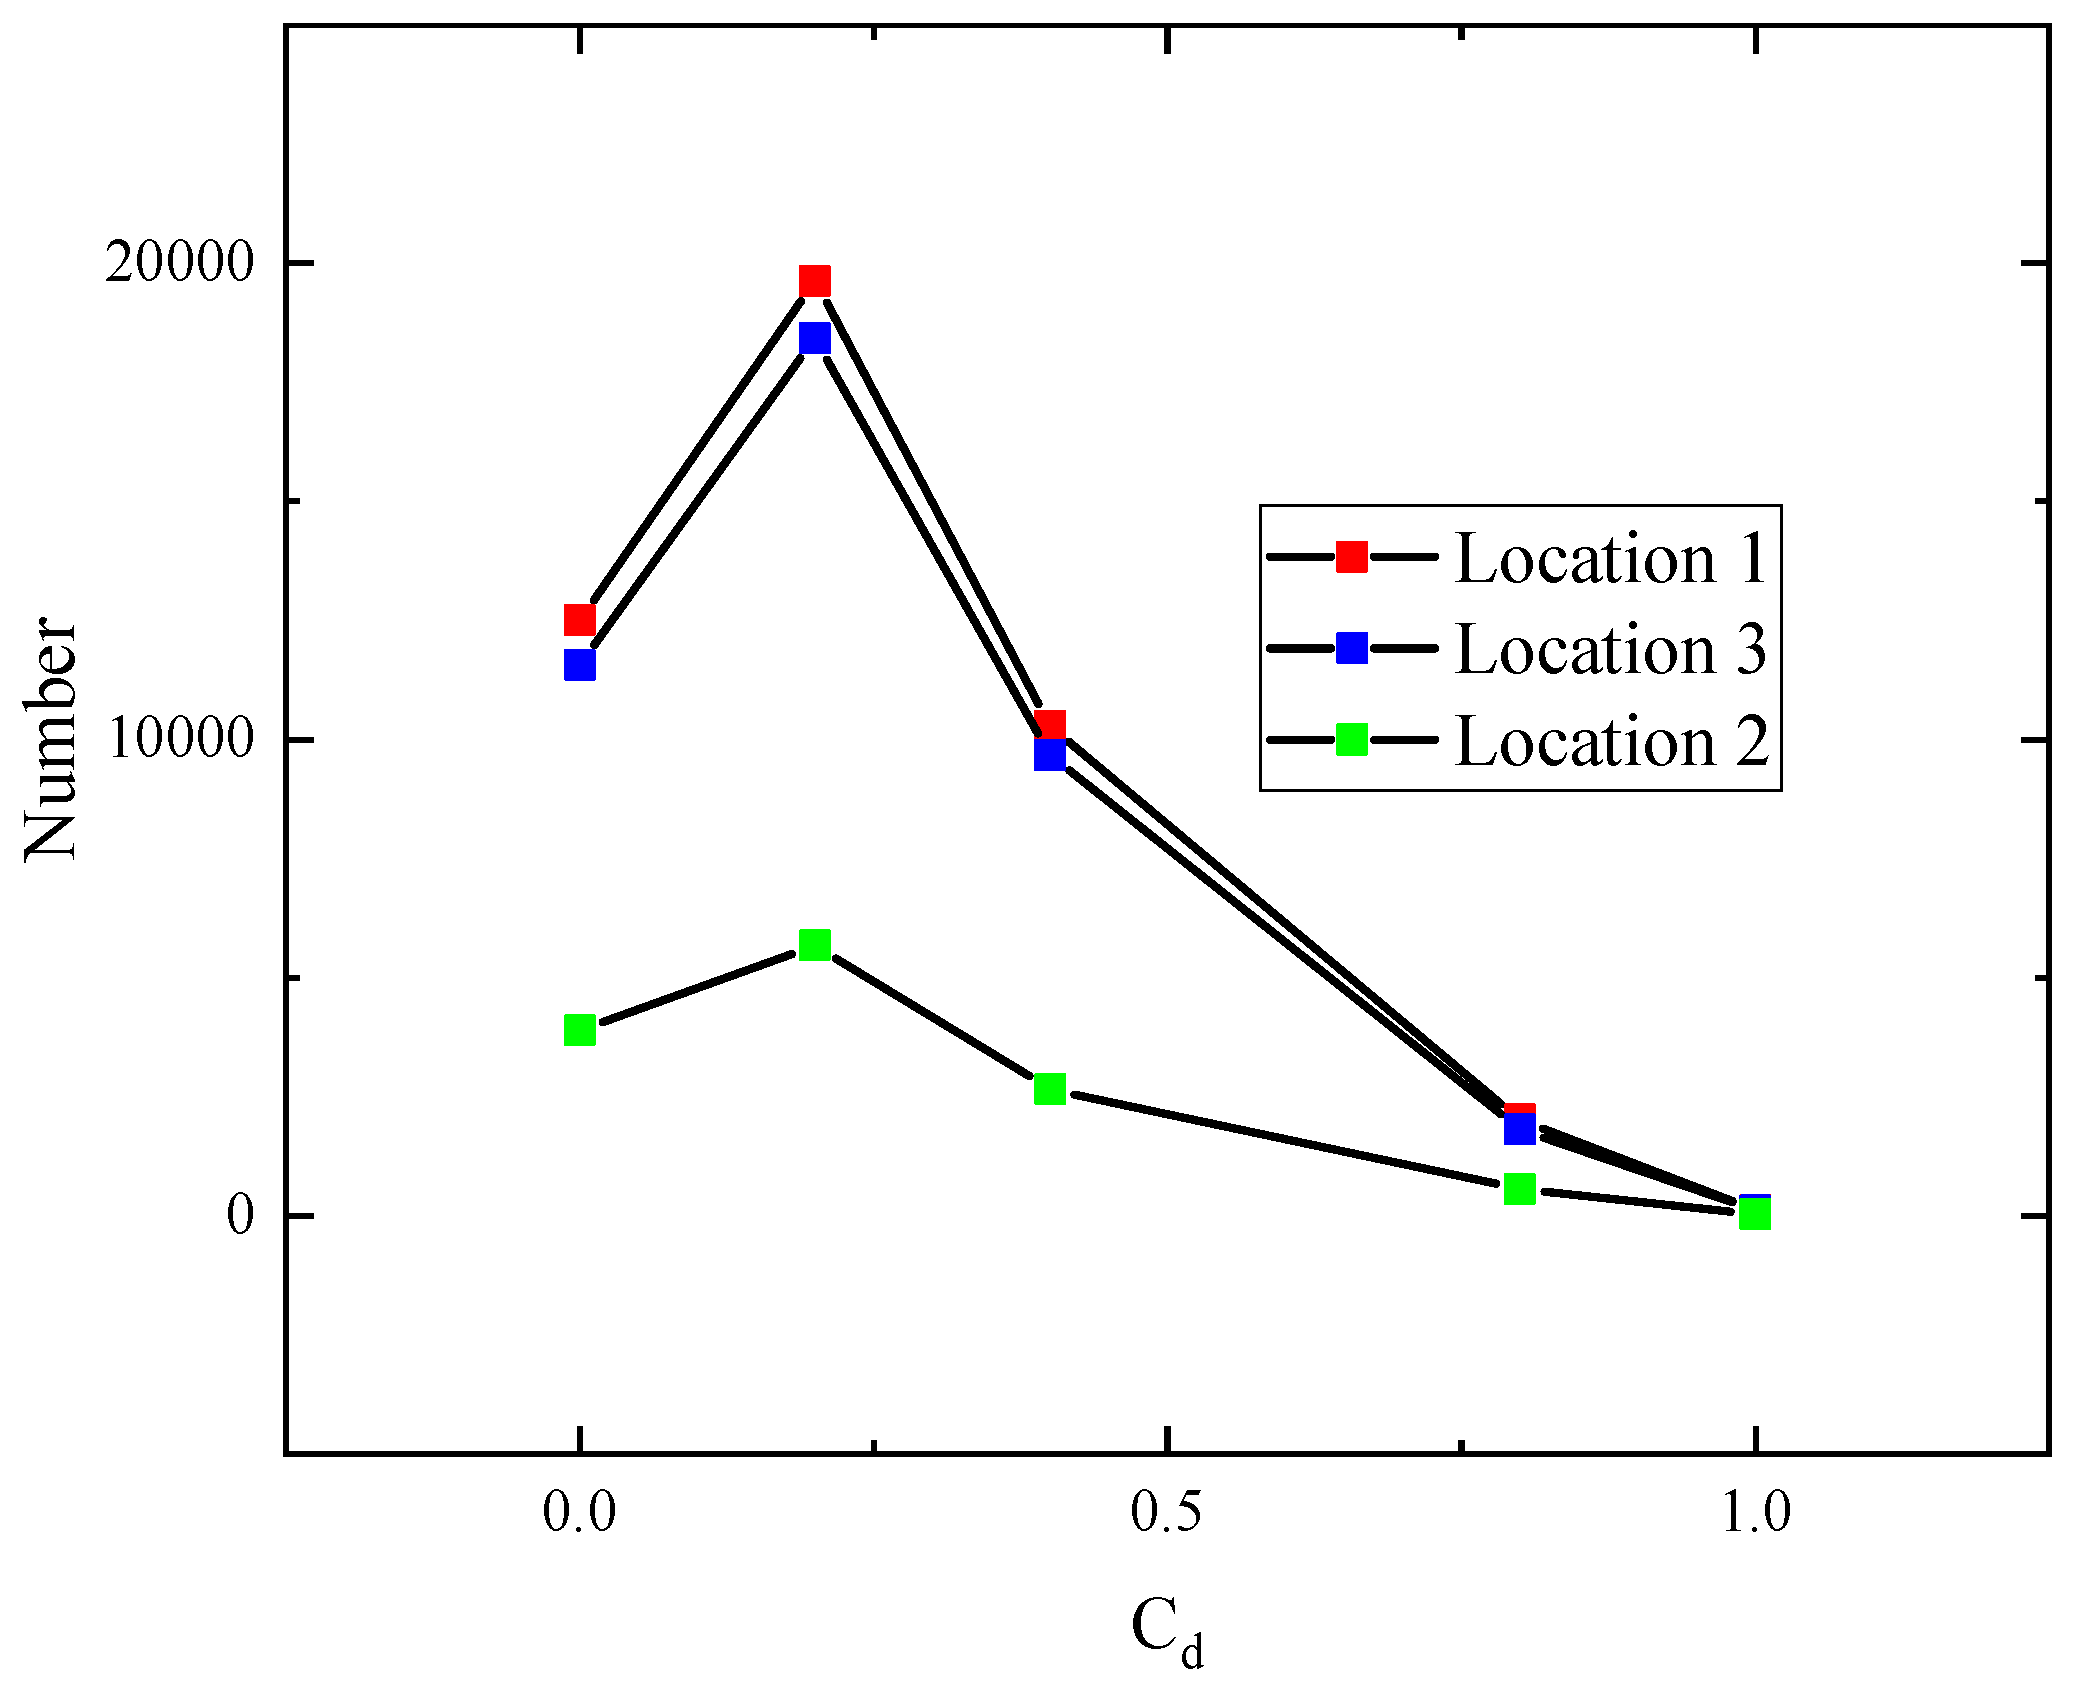
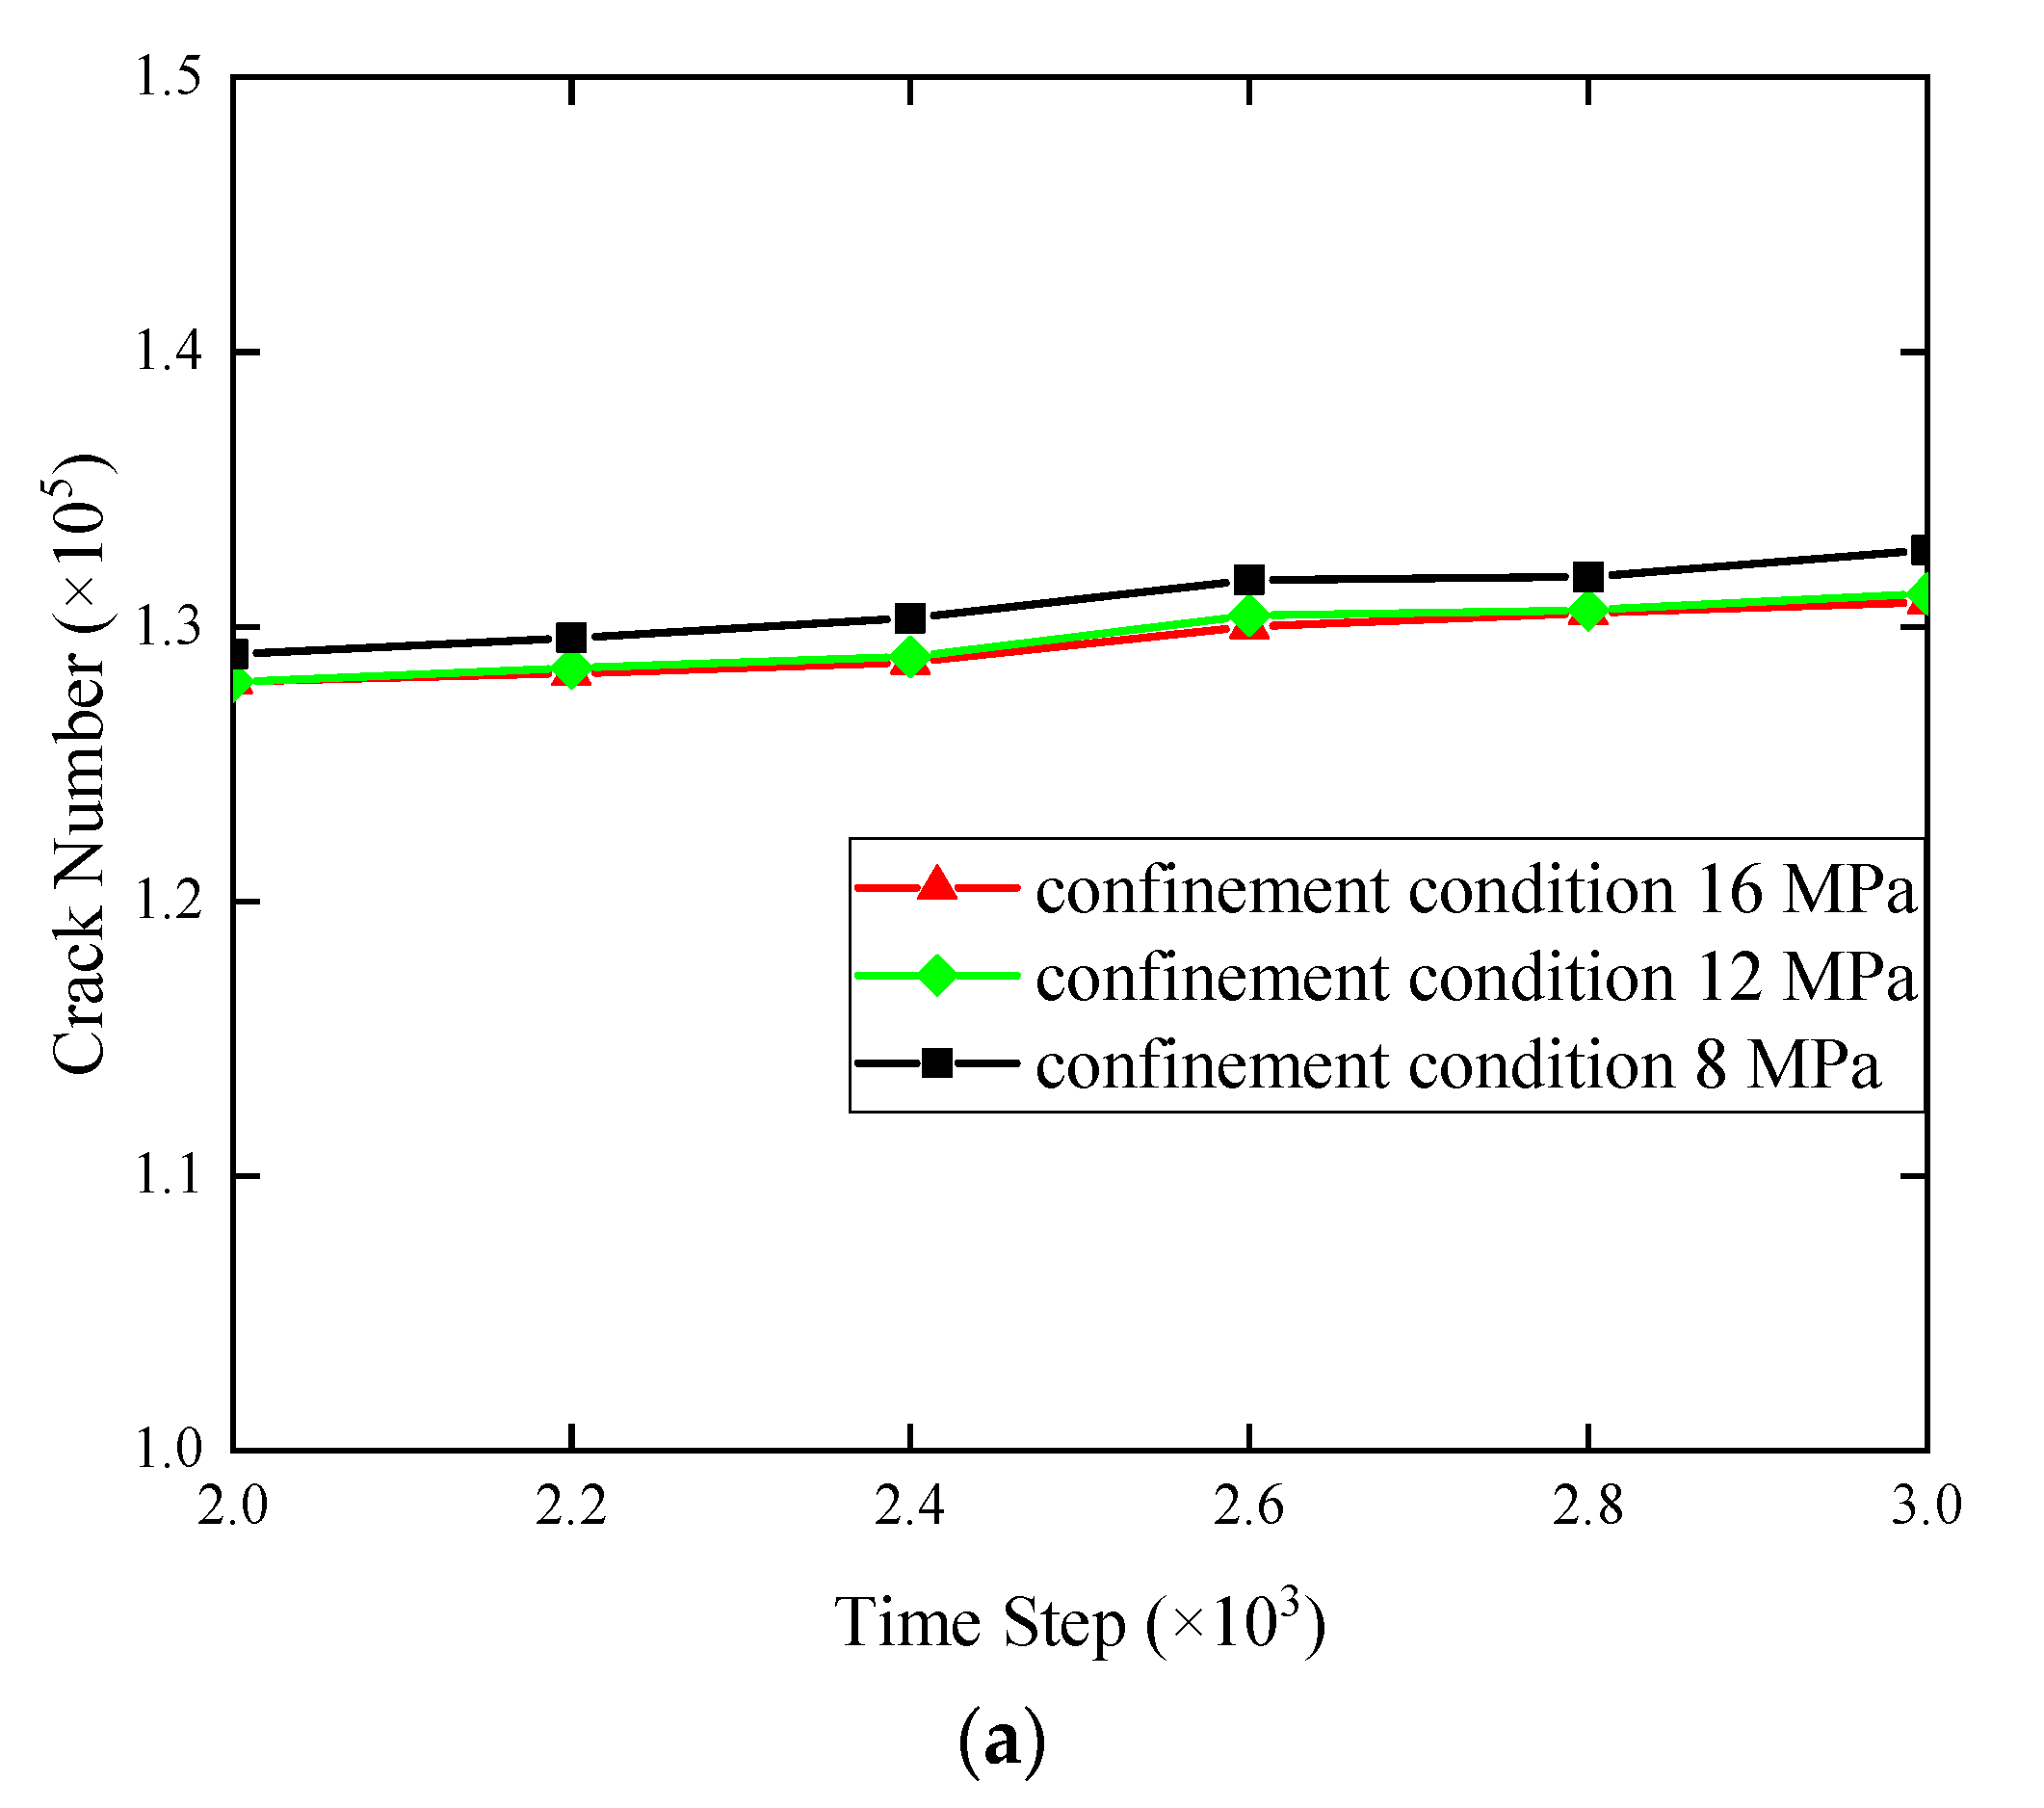
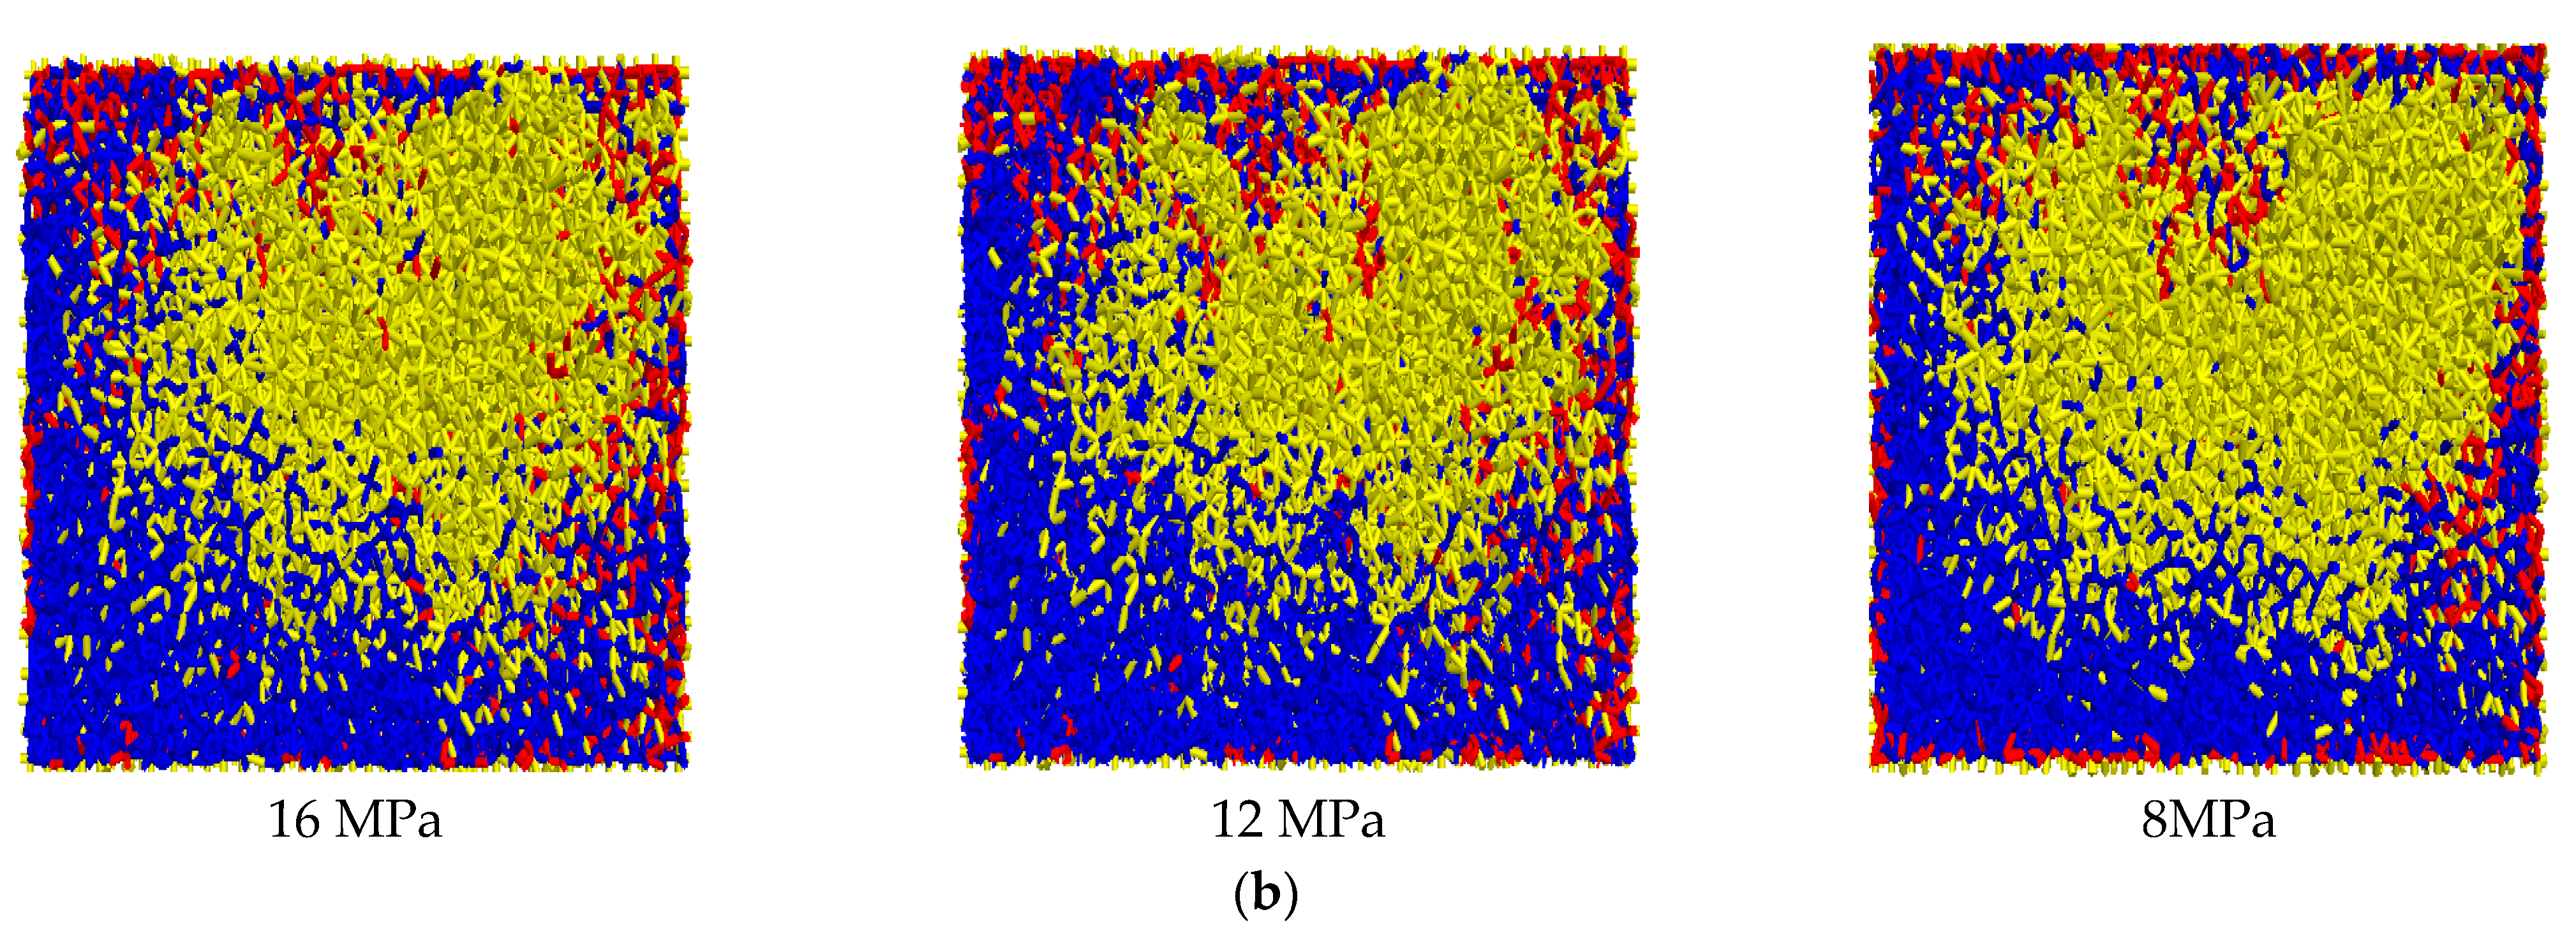
4.1. Influence of Confining Pressure

The thermodynamic response of the surrounding wall in a salt cavern subjected to a gas-cycling loading process is further investigated in the context of different confinement conditions. The operation pressure range of cavern L (Li et al., 2021) [8] is 16 MPa to 8 MPa. Three different confining pressures are schemed, which are 16 MPa, 12 MPa, and 8 MPa, respectively.
Figure 16 shows the influence of the confinement pressure at location 1 (see Figure 7), which is at the knee point of the cavity shoulder (i.e., the closest location to the surrounding wall brim). The reduction of confining pressure (from 16 MPa to 8 MPa) augments the cracks generation during the depressurization process. The propagation and accumulation of microcracks depend on the variation of the confining pressure. Lower confinement enhances the thermal damage of the salt cavity.
The pressure is first increased to 8 MPa and then is retained at 8 MPa for a period. As shown in Figure 17, more microcracks initiate when the pressure is retained at 8 MPa. Tensile cracking is the dominant crack mode during the lower-pressure operation. However, the proportion of tensile cracks reduces with time due to the limitation of temperature extension. The more damage accumulates at that lower pressure and increases with the retaining time. Low pressure coupled with retaining time enhances the development of microcracks, ultimately resulting in a damage zone.

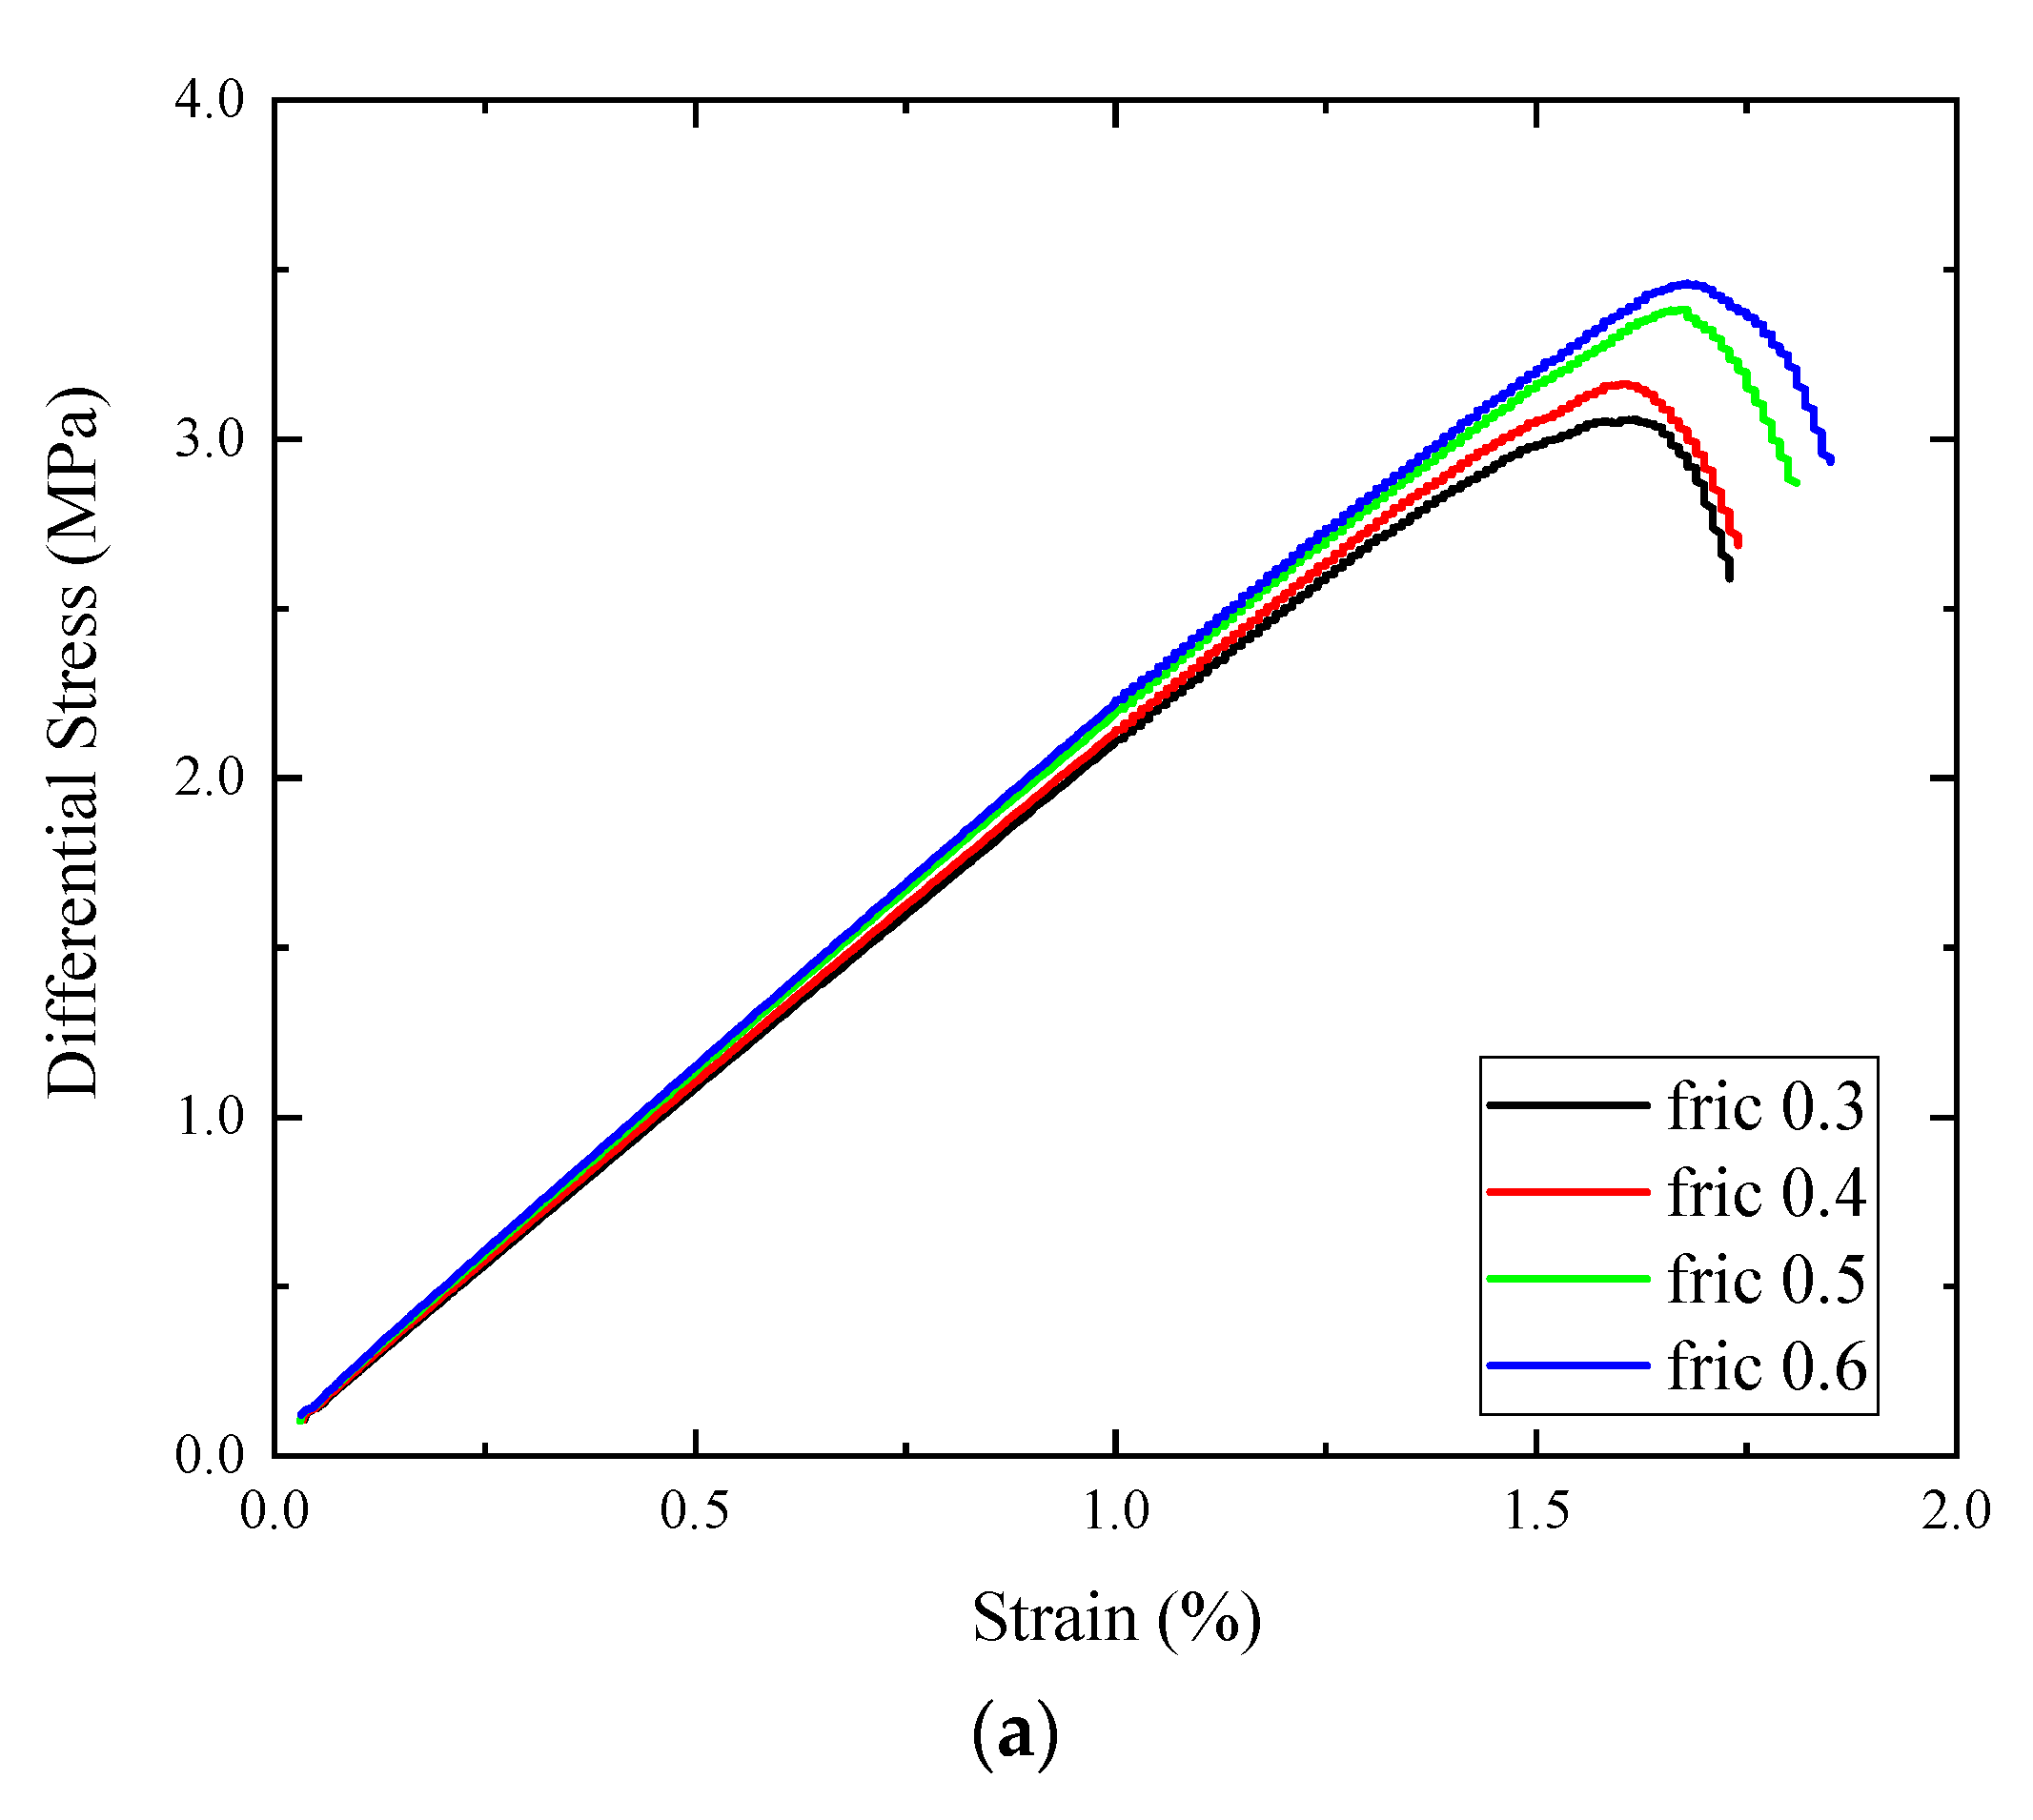
4.2. Effect of Particle Microproperties

The development of cracks is affected by the microproperties of the particle, including the normal-to-shear stiffness ratio and the coefficient of interparticle friction. As shown in Figure 18, with the increase of the normal-to-shear stiffness ratio, more cracks initiate, leading to the lower yield strength.
Figure 19 illustrates the effect of the interfacial friction coefficient. In general, the friction coefficient has a slight effect on stress–strain curve. With the increase of the friction coefficient, the deformation resistance of particles is enhanced. It is shown that when the friction coefficient increases from 0.5 to 0.8, the larger friction between the particles makes it difficult to exceed the tensile or shear strength of the bonds. Therefore, fewer cracks are generated.

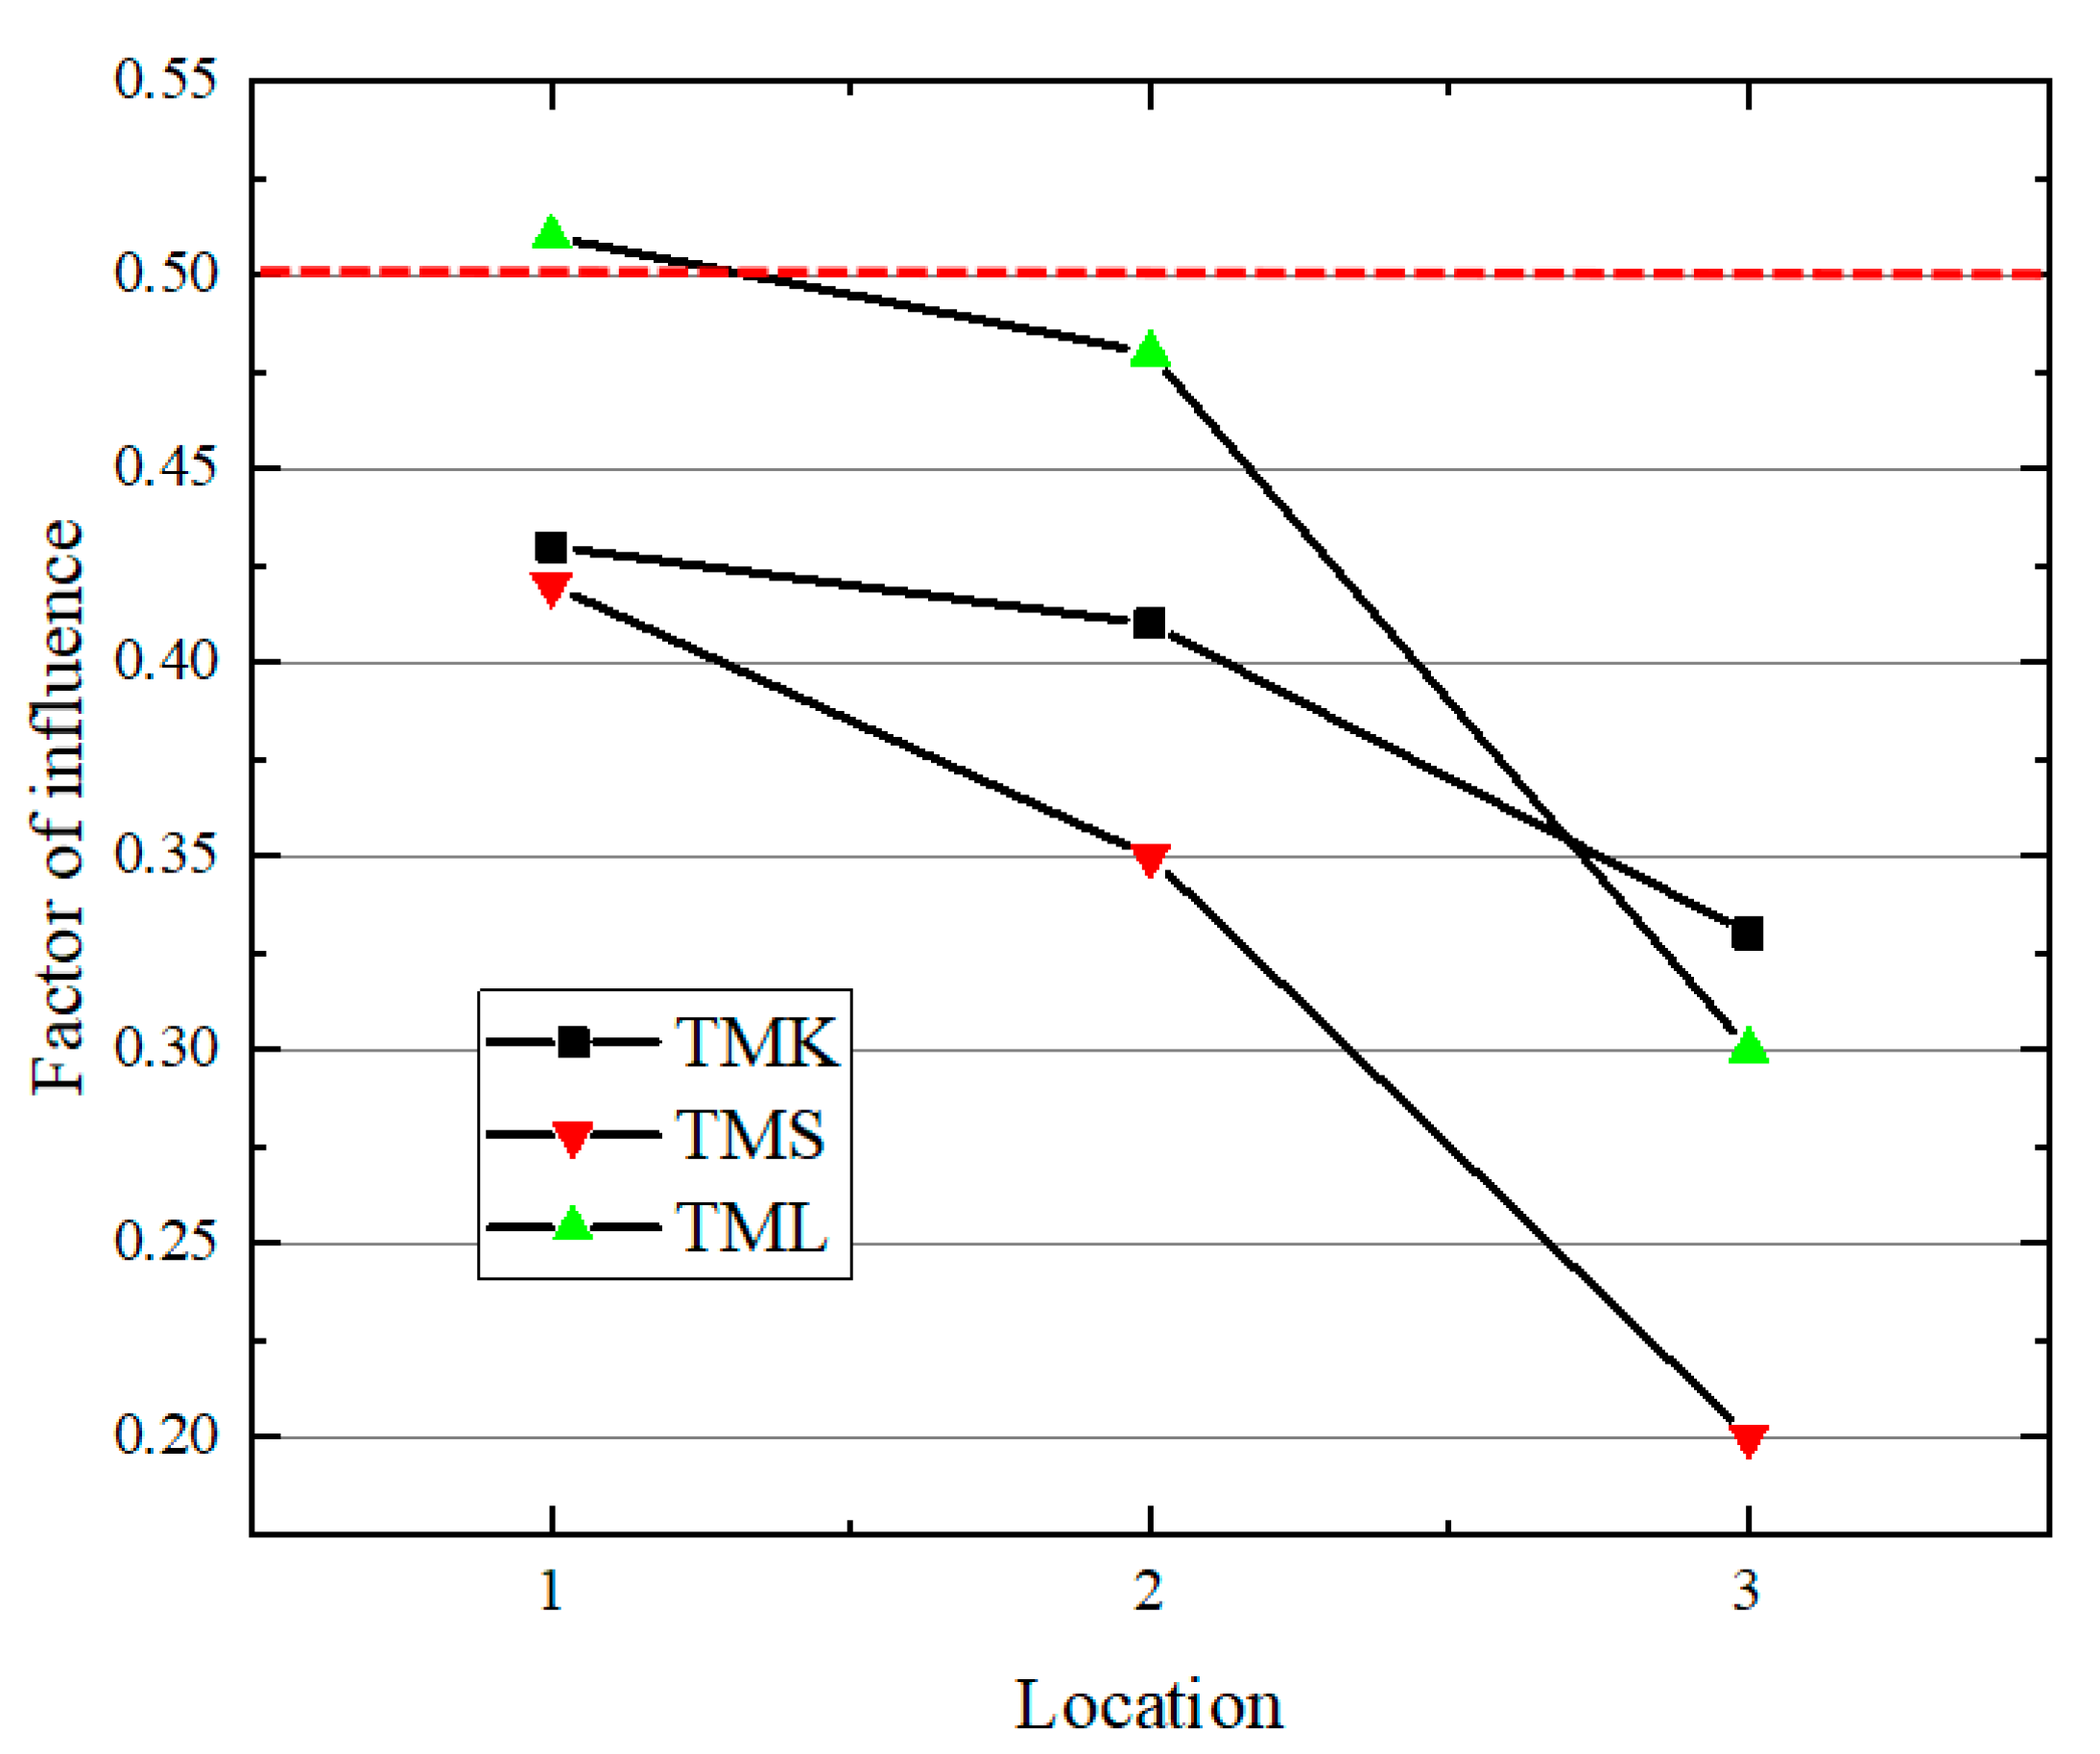
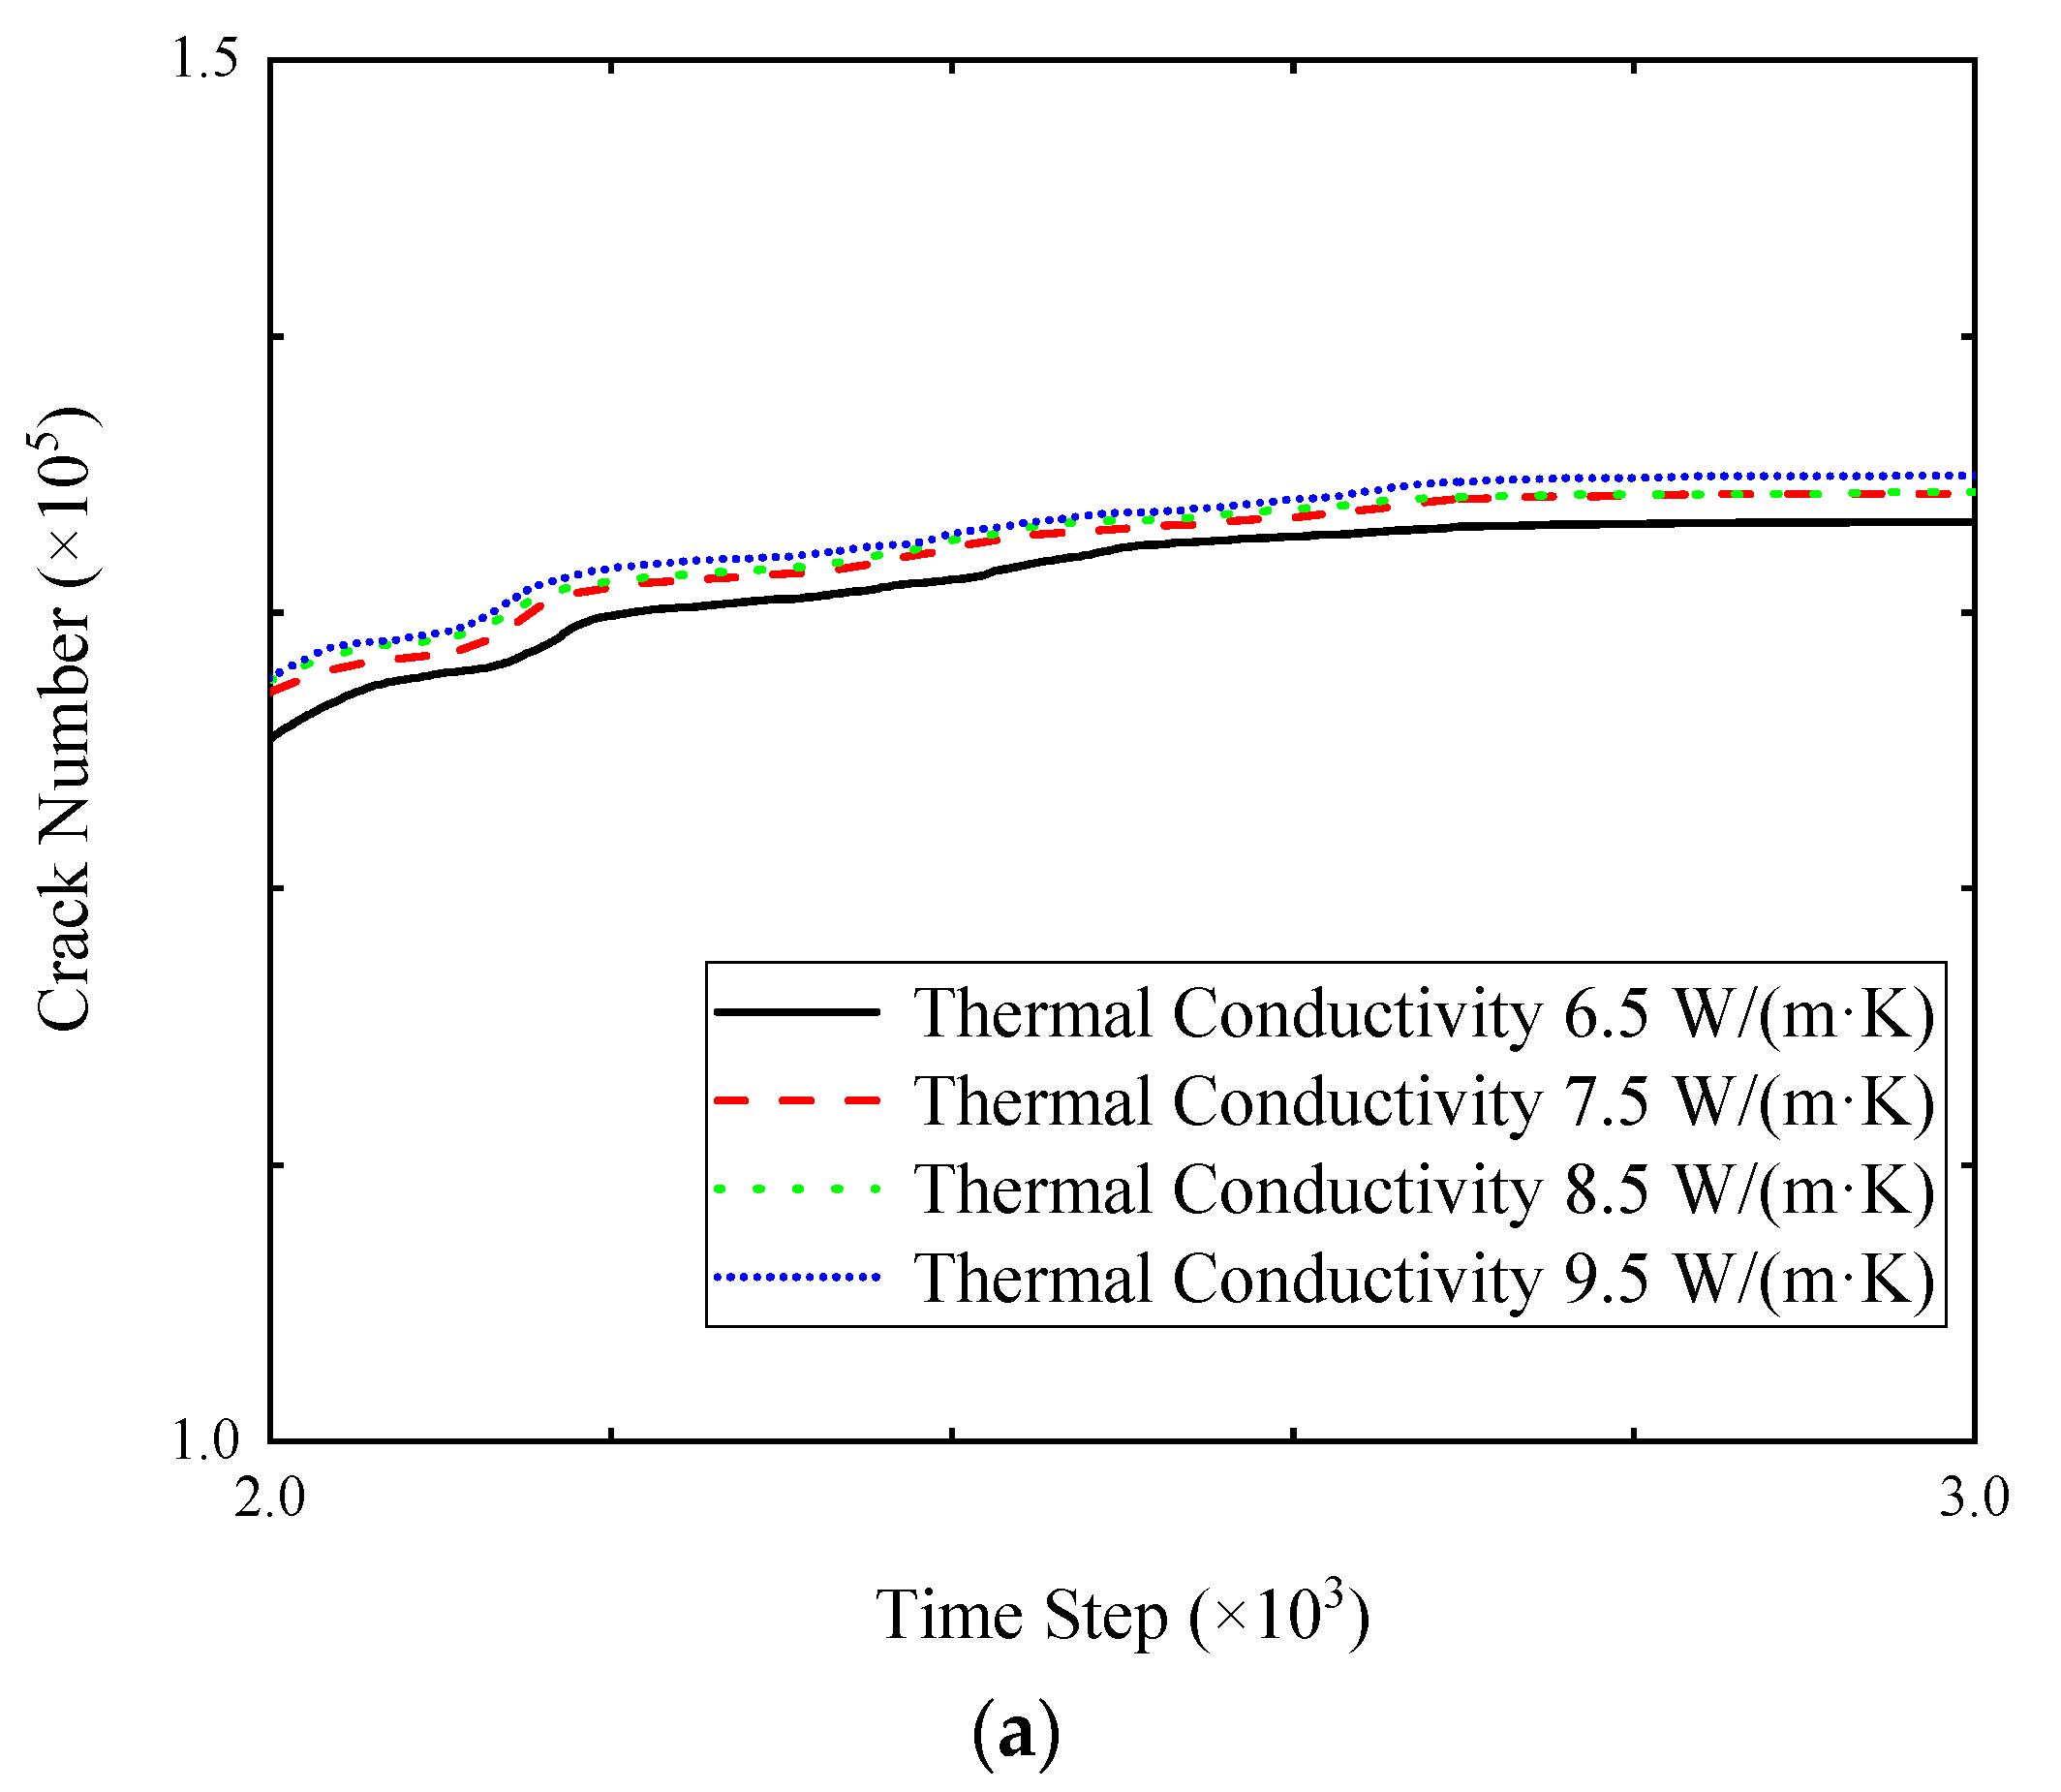
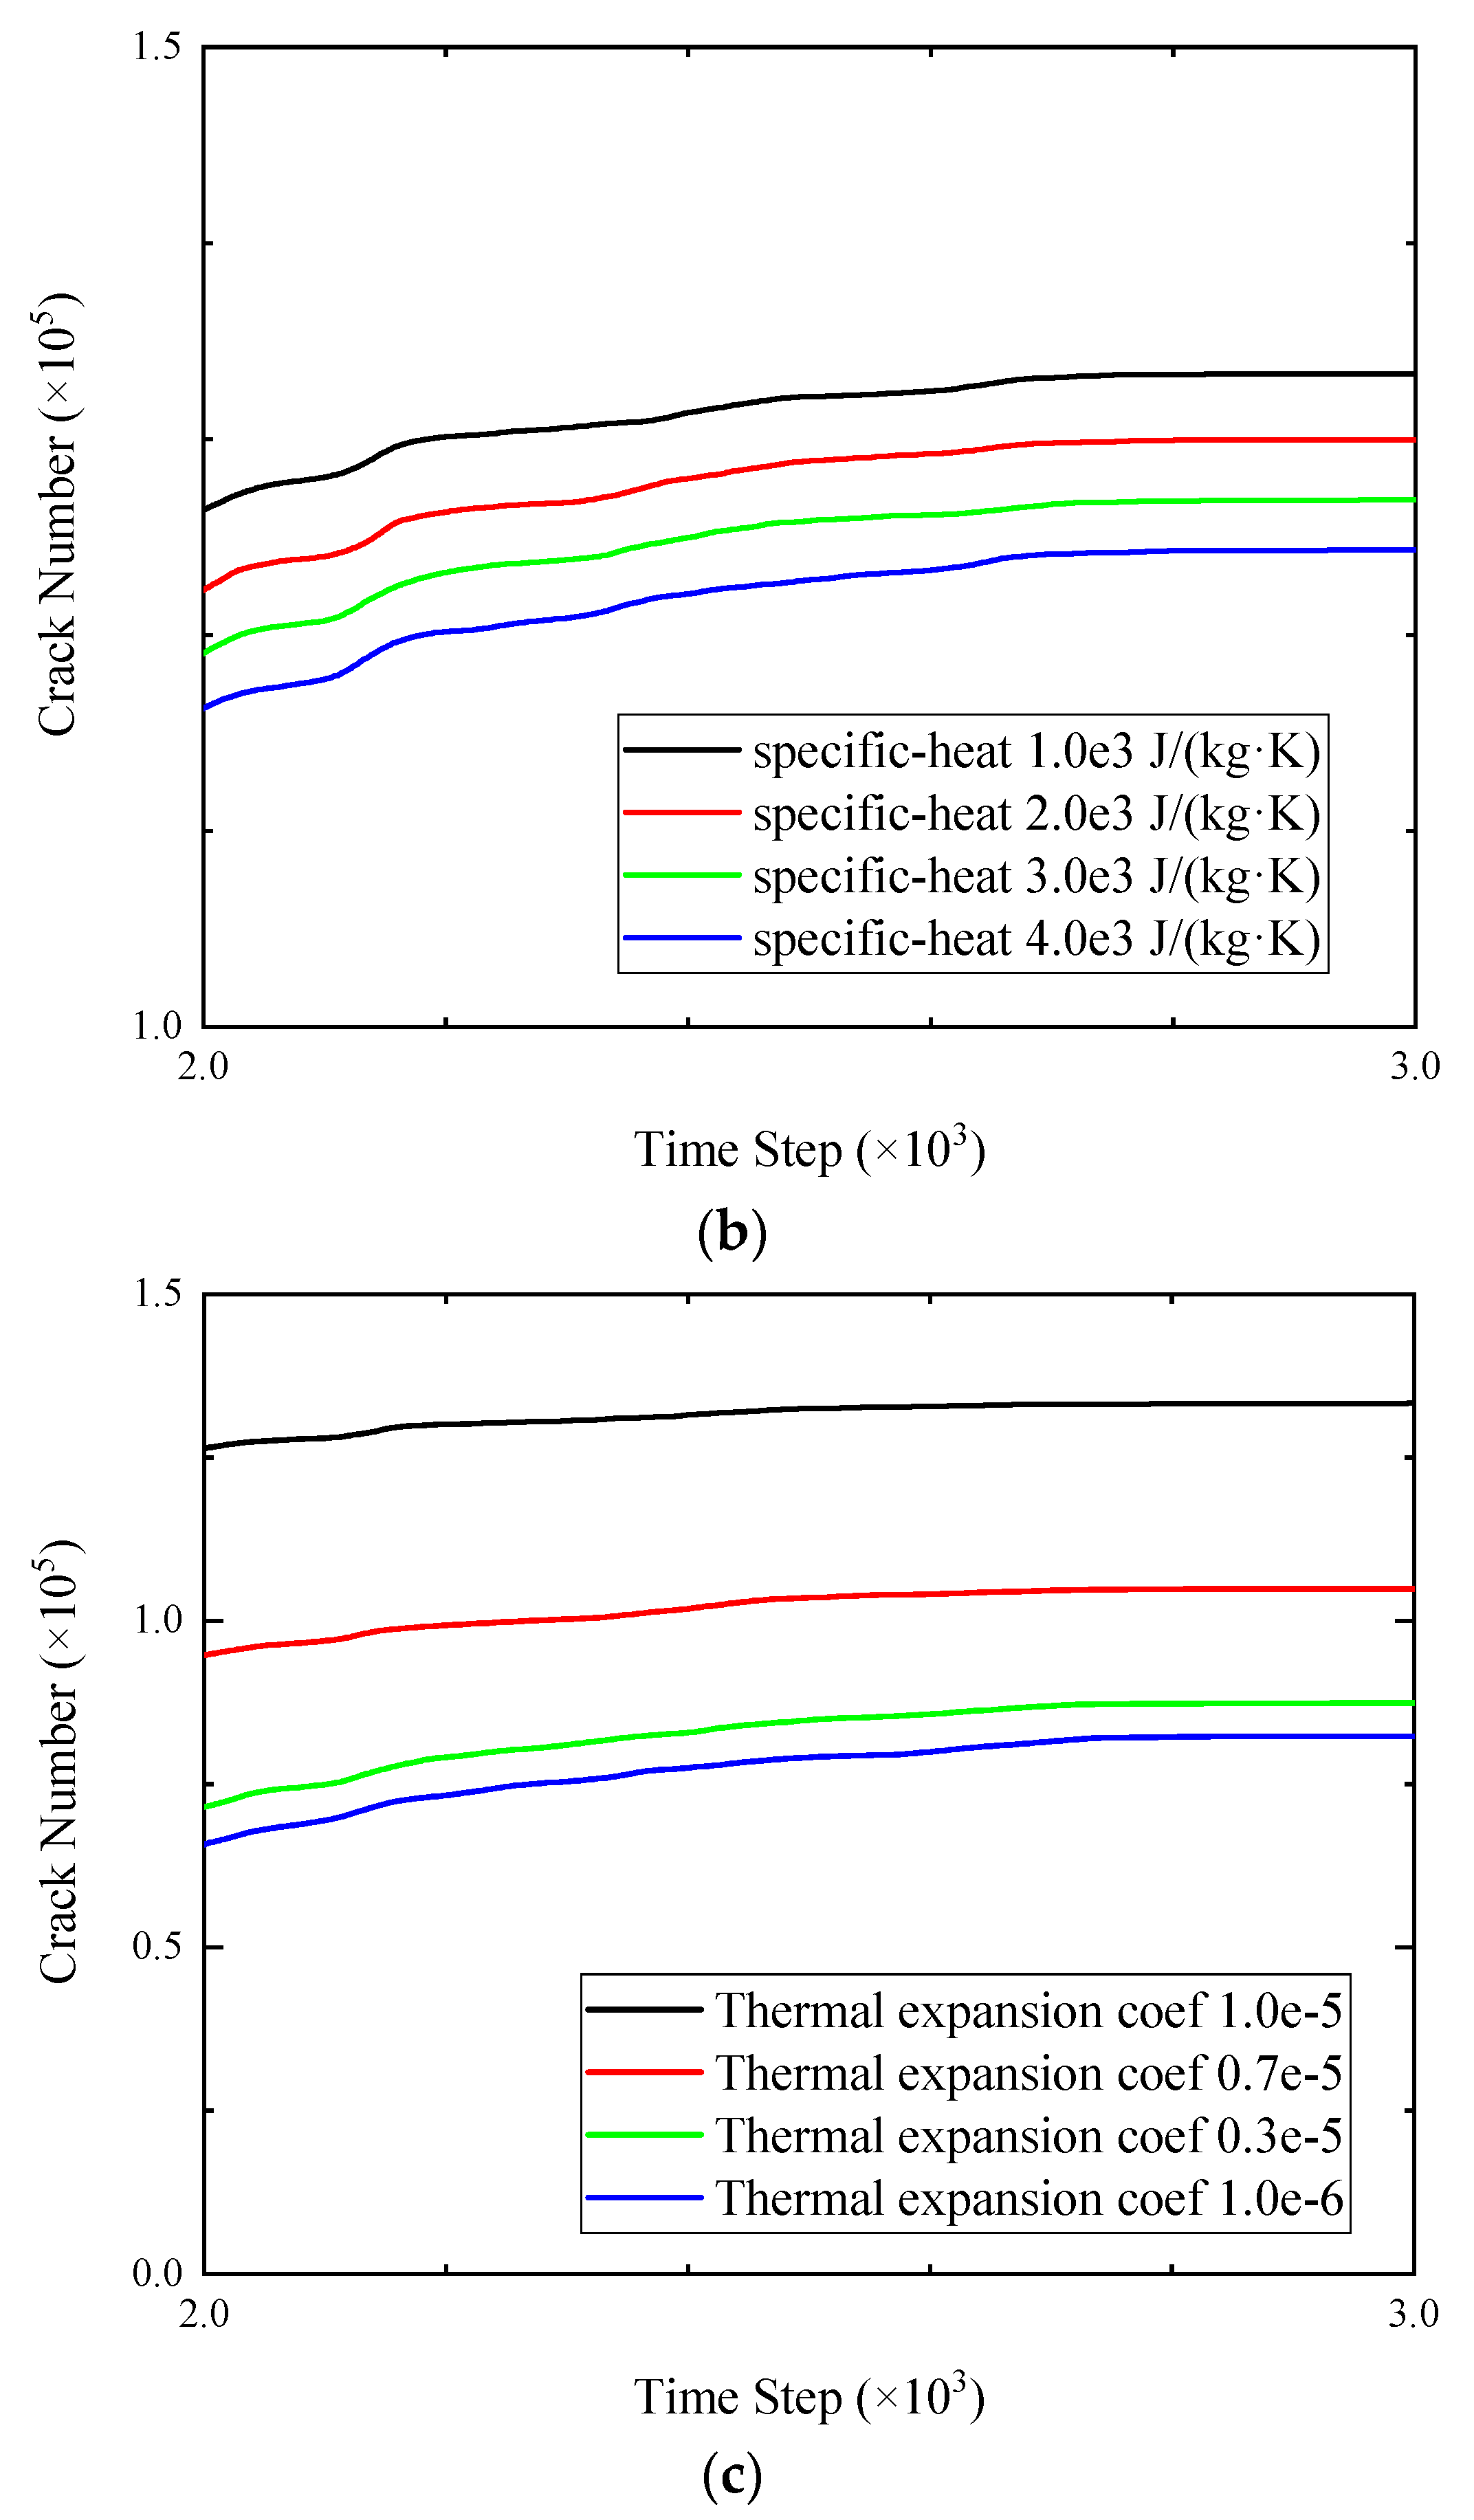
4.3. Effect of Thermal Properties

Simulations with various thermal conductivities, particle-specific heats, and thermal expansion coefficients are carried out to understand the effect of the thermal properties. All the other parameters are set to be the same as the case with pressure equal to 16 MPa at operation. As shown in Figure 20, the increase in thermal conductivity leads to an increment in crack number. On the other hand, a larger particle-specific heat enhances the energy stored between particles and slows down the heat conduction and the thermal expansion of the particles. Thus, fewer cracks are generated. The thermal-expansion coefficient is positively correlated with the number of cracks by augmenting the force carried by the bond. Hence, the thermal properties of the particles have an important impact on the crack generation and propagation, and the macro-behavior of the surrounding rock wall of a salt cavern as well.

5. Conclusions

A thermal-mechanical model was proposed to study a field case with blocks falling off from the salt cavern roof using a 3D hybrid continuum-discrete method. This hybrid model has advantages in allowing for implementing the gas-loading operation conditions via continuum modeling; meanwhile, the thermal-mechanical effects and processive damage were systematically investigated with the proposed micromechanical numerical framework of the hybrid model. The main conclusions are as the followings:
Three specimens at different locations around the surrounding wall of a salt cavern were selected to understand the thermal-damage evolution process under the severe depressurization condition. The crack microscopic patterns were subjected to the cavern’s anomalous geometry. The energy evolution associated with fracture creation exhibited spatiotemporal confinement dependence.
Cycling loading at a lower confining pressure and the longer retaining time of low-pressure led to progressive microcracking, which further resulted in the development of macrofractures and the formation of the damage zone. The tensile crack was the dominant crack mode. The anisotropic distribution of crack orientation was observed in the zone close to the edge of the surrounding wall, which was the consequence of tension failure induced by the thermal effect. The thermal effect induced by gas injection and withdrawal was limited. The zone far away from the marginal surrounding wall was less affected by temperature and only the mechanical conditions controlled the development of cracks.
The proposed 3D continuum-discrete coupled thermal-mechanical hybrid model overcomes the limitation of the continuum method and was capable of analysis of rock heterogeneity by accounting for the thermal-mechanical effect and naturally capturing the microcrack initiation and propagation by discrete modeling. The hybrid model was successfully applied in the assessment of thermal-damage evolution. This study can shed light on the analysis of thermal-mechanical coupling and the understanding of the influence of microcrack development on the macroscopic behavior of salt rock. In the future, the validity of the continuum-discrete coupled thermal-mechanical hybrid model should be verified by more field data and the thermal effect of the gas injection and withdrawal process needs to be investigated for energy storage in the deep stratum.

Author Contributions

Conceptualization, W.L.; Investigation, K.F. and W.L.; Methodology, X.N.; Software, K.F.; Supervision, G.Y.; Writing—original draft, W.L.; Writing—review and editing, K.F. All authors have read and agreed to the published version of the manuscript.

Funding

This study is funded by the National Natural Science Foundation of China project (Grant NO. 42102304). Open Research Fund of State Key Laboratory of Shale Oil and Gas Enrichment Mechanisms and Effective Development—State Energy Center for Shale Oil Research and Development.

Institutional Review Board Statement

Not applicable.

Informed Consent Statement

Not applicable.

Data Availability Statement

Not applicable.

Acknowledgments

The authors also thank Jintan Underground Gas Storage, China Oil and Gas Piping Network Corporation for their advice on this study.

Conflicts of Interest

The authors declare that they have no known competing financial interests or personal relationships that could have appeared to influence the work reported in this paper.

References

  1. Li, S.-Y.; Urai, J.L. Rheology of rock salt for salt tectonics modeling. Pet. Sci. 2016, 13, 712–724. [Google Scholar] [CrossRef] [Green Version]
  2. Jackson, M.P.; Hudec, M.R. Salt Tectonics: Principles and Practice; Cambridge University Press: Cambridge, UK, 2017. [Google Scholar]
  3. Arson, C. Micro-macro mechanics of damage and healing in rocks. Open Géoméch. 2020, 2, 1–41. [Google Scholar] [CrossRef] [Green Version]
  4. AbuAisha, M.; Rouabhi, A.; Billiotte, J.; HadjeHassen, F. Noneisothermal twoephase hydrogen transport in rock salt during cycling in underground caverns. Int. J. Hydrogen Energy 2021, 46, 6632–6647. [Google Scholar] [CrossRef]
  5. Bérest, P.; Brouard, B.; Djizanne, H.; Hévin, G. Thermomechanical effects of a rapid depressurization in a gas cavern. Acta Geotech. 2014, 9, 181–186. [Google Scholar] [CrossRef]
  6. Sicsic, P.; Bérest, P. Thermal cracking following a blow out in a gas-storage cavern. Int. J. Rock Mech. Min. Sci. 2014, 7, 320–329. [Google Scholar] [CrossRef]
  7. Böttcher, N.; Görke, U.-J.; Kolditz, O.; Nagel, T. Thermo-mechanical investigation of salt caverns for short-term hydrogen storage. Environ. Earth Sci. 2017, 76, 98. [Google Scholar] [CrossRef]
  8. Li, W.; Nan, X.; Chen, J.; Yang, C. Investigation of thermal-mechanical effects on salt cavern during cyclying loading. Energy 2021, 232, 120969. [Google Scholar] [CrossRef]
  9. Wu, W.; Lu, D.; Romagnoli, A. A temperature gradient test system for investigating thermo-mechanical responses of containment materials of underground storage facilities. Rock Mech. Bull. 2023, 2, 100043. [Google Scholar] [CrossRef]
  10. Bérest, P. Heat transfer in salt caverns. Int. J. Rock Mech. Min. Sci. 2019, 120, 82–95. [Google Scholar] [CrossRef]
  11. Serbin, K.; Ślizowski, J.; Urbańczyk, K.; Nagy, S. The influence of thermodynamic effects on gas storage cavern convergence. Int. J. Rock Mech. Min. Sci. 2015, 79, 166–171. [Google Scholar] [CrossRef]
  12. Khaledi, K.; Mahmoudi, E.; Datcheva, M.; Schanz, T. Stability and serviceability of underground energy storage caverns in rock salt subjected to mechanical cyclic loading. Int. J. Rock Mech. Min. Sci. 2016, 86, 115–131. [Google Scholar] [CrossRef]
  13. Khaledi, K.; Mahmoudi, E.; Datcheva, M.; Schanz, T. Analysis of compressed air storage caverns in rock salt considering thermo-mechanical cyclic loading. Environ. Earth Sci. 2016, 75, 1149. [Google Scholar] [CrossRef]
  14. Blanco-Martín, L.; Rouabhi, A.; Billiotte, J.; Hadj-Hassen, F.; Tessier, B.; Hévin, G.; Hertz, E. Experimental and numerical investigation into rapid cooling of rock salt related to high frency cycling of storage caverns. Int. J. Rock Mech. Min. Sci. 2018, 102, 120–130. [Google Scholar] [CrossRef] [Green Version]
  15. Soubeyran, A.; Rouabhi, A.; Coquelet, C. Thermodynamic analysis of carbon dioxide storage in salt caverns to improve the Power-to-Gas process. Appl. Energy 2019, 242, 1090–1107. [Google Scholar] [CrossRef]
  16. Li, W.; Zhu, C.; Han, J.; Yang, C. Thermodynamic response of gas injection-and-withdrawal process in salt cavern for underground gas storage. Appl. Therm. Eng. 2019, 163, 114380. [Google Scholar] [CrossRef]
  17. Li, W.; Miao, X.; Yang, C. Failure analysis for gas storage salt cavern by thermo-mechanical modelling considering rock salt creep. J. Energy Storage 2020, 32, 102004. [Google Scholar] [CrossRef]
  18. Warren, J.K. Salt usually seals, but sometimes leaks: Implications for mine and cavern stabilities in the short and long term. Earth-Sic. Rev. 2017, 165, 302–341. [Google Scholar] [CrossRef]
  19. Wang, T.; Li, J.; Jing, G.; Zhang, Q.; Yang, C.; Daemen, J. Determination of the maximum allowable gas pressure for an underground gas storage salt cavern–A case study of Jintan, China. J. Rock Mech. Geotech. Eng. 2019, 11, 251–262. [Google Scholar] [CrossRef]
  20. Habibi, R.; Moomivand, H.; Ahmadi, M.; Asgari, A. Stability analysis of complex behavior of salt cavern subjected to cyclic loading by laboratory measurement and numerical modeling using LOCAS (case study: Nasrabad gas storage salt cavern). Environ. Earth Sci. 2021, 80, 317. [Google Scholar] [CrossRef]
  21. Yin, H.; Yang, C.; Ma, H.; Shi, X.; Zhang, N.; Ge, X.; Li, H.; Han, Y. Stability evaluation of underground gas storage salt caverns with micro-leakage interlayer in bedded rock salt of Jintan, China. Acta Geotech. 2020, 15, 549–563. [Google Scholar] [CrossRef]
  22. Fairhurst, C. The Waste Isolation Pilot Plant: A Potential Solution for the Disposal of Transuranic Waste; National Academy of Sciences: Washington, DC, USA, 1996. [Google Scholar]
  23. Hunsche, U.; Hampel, A. Rock salt—The mechanical properties of the host rock material for a radioactive waste repository. Eng. Geol. 1999, 52, 271–291. [Google Scholar] [CrossRef]
  24. Ngo, D.; Pellet, F. Numerical modeling of thermally-induced fractures in a large rock salt mass. J. Rock Mech. Geotech. Eng. 2018, 10, 844–855. [Google Scholar] [CrossRef]
  25. Zhu, C.; Arson, C. A thermo-mechanical damage model for rock stiffness during anisotropic crack opening and clusure. Acta Geotech. 2014, 9, 847–867. [Google Scholar] [CrossRef]
  26. Li, W.; Soliman, M.; Han, Y. Microscopic numerical modeling of Thermo-Hydro-Mechanical mechanisms in fluid injection process in unconsolidated formation. J. Pet. Sci. Eng. 2016, 146, 959–970. [Google Scholar] [CrossRef]
  27. Ding, J.; Chester, F.; Chester, J.; Shen, X.; Arson, C. Microcrack Network Development in Salt-Rock During Cyclic Loading at Low Confining Pressure. In Proceedings of the 51st US Rock Mechanics/Geomechanics Symposium, San Francisco, CA, USA, 25–28 June 2017. ARMA, American Rock Mechanics Association. [Google Scholar]
  28. Shen, X.; Arson, C.; Ding, J.; Chester, F.M.; Chester, J.S. Mechanisms of Anisotropy in Salt Rock Upon Microcrack Propagation. Rock Mech. Rock Eng. 2020, 53, 3185–3205. [Google Scholar] [CrossRef]
  29. Wu, X.; Li, Y.; Tang, C. Comparative study on heat extraction performance of three enhanced geothermal systems. Rock Mech. Bull. 2023, 2, 100041. [Google Scholar] [CrossRef]
  30. Shen, X.; Ding, J.; Arson, C.; Chester, J.S.; Chester, F.M. Micromechanical modeling for rate-dependent behavior of salt rock under cyclic loading. Int. J. Numer. Anal. Methods Géoméch. 2020, 45, 28–44. [Google Scholar] [CrossRef]
  31. Shojaei, A.; Shao, J. Porous Rock Fracture Mechanics with Application to Hydraulic Fracturing, Drilling and Structural Engineering; Woodhead Publishing: Duxford, UK, 2017. [Google Scholar]
  32. Wang, J.; Zhang, Q.; Song, Z.; Liu, X.; Wang, X.; Zhang, Y. Microstructural variations and damage evolvement of salt rock under cyclic loading. Int. J. Rock Mech. Min. Sci. 2022, 152, 105078. [Google Scholar] [CrossRef]
  33. Han, Y.; Ma, H.; Cui, H.; Liu, N. The Effects of Cycle Frequency on Mechanical Behavior of Rock Salt for Energy Storage. Rock Mech. Rock Eng. 2022, 55, 7535–7545. [Google Scholar] [CrossRef]
  34. Ding, J.; Chester, F.M.; Chester, J.S.; Shen, X.; Arson, C. Coupled Brittle and Viscous Micromechanisms Produce Semibrittle Flow, Grain-Boundary Sliding, and Anelasticity in Salt-Rock. J. Geophys. Res. Solid Earth 2021, 126, e2020JB021261. [Google Scholar] [CrossRef]
  35. Li, Z.; Suo, J.; Fan, J.; Fourmeau, M.; Jiang, D.; Nelias, D. Damage evolution of rock salt under multilevel amplitude creep-fatigue loading with acoustic emission monitoring. Int. J. Rock Mech. Min. Sci. 2023, 164, 105346. [Google Scholar] [CrossRef]
  36. Zhu, C.; Shen, X.; Arson, C.; Pouya, A. Numerical study of thermo-mechanical effects on the viscous damage behavior of rock salt caverns. In Proceedings of the 51st US Rock Mechanics/Geomechanics Symposium, San Francisco, CA, USA, 25–28 June 2017. [Google Scholar]
  37. Jing, L.; Stephansson, O. Fundamental of Discrete Element Methods for Rock Engineering Theory and Applications; Elsevier Science: Amsterdam, The Netherlands, 2007. [Google Scholar]
  38. Zhao, X.; Elsworth, D.; He, Y.; Hu, W.; Wang, T. A grain texture model to investigate effects of grain shape and orientation on macro-mechanical behavior of crystalline rock. Int. J. Rock Mech. Min. Sci. 2021, 148, 104971. [Google Scholar] [CrossRef]
  39. Hu, W.; Liu, K.; Potyondy, D.; Zhang, Q. 3D continuum-discrete coupled modelling of triaxial Hopkinson bar tests on rock under multiaxial static-dynamic loads. Int. J. Rock Mech. Min. Sci. 2020, 134, 104448. [Google Scholar] [CrossRef]
  40. Zhang, F.; Dontsov, E.; Mack, M. Fully coupled simulation of a hydraulic fracture interacting with natural fractures with a hybrid discrete-continuum method. Int. J. Numer. Anal. Methods Géoméch. 2017, 41, 1430–1452. [Google Scholar] [CrossRef]
  41. Zhang, F.; Damjanac, B.; Maxwell, S. Investigating Hydraulic Fracturing Complexity in Naturally Fractured Rock Masses Using Fully Coupled Multiscale Numerical Modeling. Rock Mech. Rock Eng. 2019, 52, 5137–5160. [Google Scholar] [CrossRef]
  42. Itasca Consulting Group, Inc. FLAC3D Users Manual; Itasca Consulting Group, Inc.: Minneapolis, MN, USA, 2017. [Google Scholar]
  43. Li, W.; Han, Y.; Wang, T.; Ma, J. DEM micromechanical modeling and laboratory experiment on creep behavior of salt rock. J. Nat. Gas Sci. Eng. 2017, 46, 38–46. [Google Scholar] [CrossRef]
Figure 1. A field case in Jintan, sonar results of Cavern L in the years 2009 and 2015, respectively [8]. (a) Sonar monitoring results of the cavity; (b) Displacement difference before and after cavity collapse.
Sustainability 15 08718 g001
Figure 2. Hybrid continuum-discrete model for a salt cavern subjected to gas-cycling loading. (a) Salt cavern surrounding rock continuum part; (b) Selected continuous-discrete coupling part; (c) The size of the discrete part of the ball ranges from 0.04 to 0.06 m.
Sustainability 15 08718 g002
Figure 3. The workflow for simulation of the hybrid continuum-discrete model.
Sustainability 15 08718 g003
Figure 4. Coupled continuum-discrete model for thermal-mechanical coupling process.
Sustainability 15 08718 g004
Figure 5. Coupled thermal-mechanical interaction at the FLAC-PFC interface.
Sustainability 15 08718 g005
Figure 6. Gas temperature and pressure variations during five years of gas-cycling loading operation (Li et al., 2021) [8].
Sustainability 15 08718 g006
Figure 7. Three selected locations for observation of microcrack development in PFC (a); and the corresponding temperature (b) after sharp pressure drop due to gas withdrawal at 3.14 years of operation.
Sustainability 15 08718 g007aSustainability 15 08718 g007b
Figure 8. Comparison of crack development at three locations for coupled thermal-mechanical effect and mechanical effect only.
Sustainability 15 08718 g008
Figure 9. Temporal and spatial evolution of crack increments: A—Location 1; B—Location 3; C—Location 2; D—The ratio of tensile cracks to total cracks at Location 1; E—The ratio of tensile cracks to total cracks at Location 3; F—The ratio of tensile cracks to total cracks at Location 2.
Sustainability 15 08718 g009
Figure 10. Comparison of crack development at three locations before and after the sharp pressure drop.
Sustainability 15 08718 g010
Figure 11. Concentration degree of distribution of microcracks at (a) Location 1; (b) Location 2; (c) Location 3.
Sustainability 15 08718 g011
Figure 12. Crack number variation with concentration degree normalized relative index c d .
Sustainability 15 08718 g012
Figure 13. Orientation distribution of shear/tension cracks at different locations.
Sustainability 15 08718 g013aSustainability 15 08718 g013b
Figure 14. Energy evolution at three different locations.
Sustainability 15 08718 g014aSustainability 15 08718 g014b
Figure 15. Thermal effect on energy of microscopic particle system at three different locations.
Sustainability 15 08718 g015
Figure 16. Influence of confining pressure on (a) crack increments; (b) failure mode; Yellow represents the intact particles; Blue represents the detached particles induced by tension force; Red represents the detached particles induced by shear force.
Sustainability 15 08718 g016aSustainability 15 08718 g016b
Figure 17. Temporal and spatial evolution of microcracking at operation pressure of 8 MPa: (a) crack increment; (b) damage propagation process with retain time.
Sustainability 15 08718 g017
Figure 18. Effect of normal-to-shear ratio on (a) stress–strain curves; (b) microcrack increments.
Sustainability 15 08718 g018aSustainability 15 08718 g018b
Figure 19. Effect of interfacial friction coefficient on (a) stress–strain curves; (b) microcrack increments.
Sustainability 15 08718 g019aSustainability 15 08718 g019b
Figure 20. Microcrack increments with variations of (a) thermal conductivity; (b) particle-specific heat; and (c) thermal expansion coefficient.
Sustainability 15 08718 g020aSustainability 15 08718 g020b
Table 1. Rock mass properties for rock salt in FLAC3D.
ParametersUnitsValues
Young’s modulusGPa30
Poisson’s ratio/0.3
Densitykg/m32160
Friction angle, φdegrees45
Tensile strengthMPa4
Cohesion strengthMPa4
Thermal conductivityW/m· ° C 6.5
Specific heatJ/kg· ° C 880
Linear thermal expansion coefficient ° C −15 × 10−5
Table 2. Model parameters in PFC3D.
ParametersUnitsValues
Particle densitykg/m32160
Coefficient of interparticle friction/0.3/0.4/0.5/0.6
Normal-to-shear stiffness ratio/1.0/1.2/1.4/1.6
Thermal conductivityW/m· K 6.5/7.5/8.5/9.5
specific heatJ/kg· ° C 1000/2000/3000/4000
Thermal expansion coefficient 1 / ° C 1 × 10⁻⁵/0.7 × 10−5/0.3 × 10−5/1 × 10−6
Disclaimer/Publisher’s Note: The statements, opinions and data contained in all publications are solely those of the individual author(s) and contributor(s) and not of MDPI and/or the editor(s). MDPI and/or the editor(s) disclaim responsibility for any injury to people or property resulting from any ideas, methods, instructions or products referred to in the content.

