Article

Impact of Trade Policy Uncertainty and Sustainable Development on Medical Innovation for Developed Countries: An Application of DID Approach

by
Muhammad Nadir Shabbir
1,*,
Muhammad Usman Arshad
2,
Muhammad Amir Alvi
3 and
Kainat Iftikhar
4
1
School of International Trade and Economics, Central University of Finance and Economics, Beijing 100081, China
2
Department of Commerce, University of Gujrat, Gujrat 50700, Pakistan
3
Department of Business Administration, University of Sialkot, Sialkot 51040, Pakistan
4
School of Finance, Central University of Finance and Economics, Beijing 100081, China
*
Author to whom correspondence should be addressed.
Sustainability 2023, 15(1), 49; https://doi.org/10.3390/su15010049
Submission received: 6 September 2022 / Revised: 29 November 2022 / Accepted: 2 December 2022 / Published: 20 December 2022
(This article belongs to the Special Issue Business, Innovation, and Economics Sustainability)

Abstract

:
Covering the period from 1980 through 2020, with an emphasis on COVID-19, this paper analyzes how trade policy uncertainty and sustainable development policies affected investment in medical innovation. In a twofold difference-in-differences (DiD) approach, using autoregressive distributed lag (ARDL), the paper takes account of exogenous and heterogeneous exposure to trade policy uncertainty and trade policy adjustment in developing nations, which limited tariff increases on imported products. Both long- and short-term effects have been analyzed. Beyond patent applications, margin responses, and exports, the study indicates that eliminating tariff uncertainty boosts innovation. Developing countries have had little effect on the long-term ramifications of sectoral innovation patterns, political shifts, and imported technology. A negative response to the innovation shock and a positive response by R&D corroborate bidirectional and unidirectional causality, respectively. They demonstrate a long-term link between medical innovation, trade policy uncertainty, and R&D spending. As regards sustainable development, GDP growth and HDI have positive, and GINI index and CO2 emissions, have negative long-run relations with medical innovation. This study contributes to the literature on innovation and policy uncertainty together with sustainable development factors in developed countries, and especially on innovation trends in the medical sector, where there is a current policy ambiguity regarding the influx of foreign technology and its significance.

1. Introduction

This study investigates the impact of trade policy uncertainty on investments in medical innovation in industrialized nations. Businesses may benefit from deferring capital expenditures until economic conditions improve, as well researched by [1,2,3,4] and emerging empirical literature explains firms’ investment behavior is consistent with this basic mechanism [5,6,7,8,9]. Investment in innovation or innovation across industries has gotten little attention, but study of employment, physical capital, productivity, and economic sectors has been common.
Policy uncertainty, which is detrimental to economic growth, makes innovations more difficult to implement, and policy uncertainty has increased over the past few years. Because of these factors, the evaluation of the impact that policy uncertainty has on innovation is essential [5]. The US-China trade rivalry, Brexit, the renegotiation of the North American Free Trade Agreement (NAFTA), among others, impact medical innovation. Uncertainty in relation to COVID-19, as well as the most recent event of conflict between Ukraine and Russia, have now the largest impact on the world economy, via the energy crisis, inflation rise, and increase of public debt, fiscal deficits and borrowing costs, which have collectively resulted in an increase in tariffs as a result of a concern for commerce. These events have an inevitable impact on investment in R&D in multiple sector, including medicine.
First of all, the term “medical innovation” is used here to describe developments in the field of medicine, including advances in surgical and diagnostic machinery, pharmaceuticals, and vaccinations, with a focus on the COVID-19 period and innovation of its vaccine. Data from 2019 and then 2020, the height of the pandemic, are included in the sample.
Second, the escalation of tariffs has become an increasing commercial worry due to the aforementioned events including but not limited to the ongoing trade dispute between the United States and China, the departure of the United Kingdom from the European Union, the North American Free Trade Agreement, and breakthroughs in medicine (COVID-19). The trade war roller coaster poses the greatest risk of global recession to investors, businesses, and monetary authorities. There is renewed worry about health care costs, with medical innovation blamed as a major contributor. An increase in health care costs has the same effect as a rise in taxes or utility rates. As a result, less money is available for other uses by individuals, businesses, and the government (in its role as the primary payer of medical expenditures).
Keith argued that this trend is consistent with data from other recent years and that the increased volume of pharmaceutical consumption is mostly from treating more patients and applying new scientific knowledge. Greater numbers of patients reflect an ageing population with an increase in chronic ailments and co-morbidities, and a reduction in the gap between disease prevalence and treatment rates for many diseases. Moreover, new bodies of knowledge, including advances in our scientific comprehension of disease mechanisms and the significance of individual treatments, as well as new clinical best practices, increase the volume of treatments.
The trade war rollercoaster poses the greatest threat of a global recession to the world’s financial markets, businesses, and monetary authorities. Some argue that the uncertainty around tariffs is perhaps more damaging than the tariffs themselves. [10] continue to operate inside the core theoretical framework that they developed earlier. Some protections are removed as part of the terms of preferential trade agreements (PTAs), which call for reduced protection overall. In July of 2010, there were 283 PTAs, which is a substantial increase from the number in 1990; more recently, according to the documents of the WTO, the number of PTAs has climbed to 330, which is a notable increase from 2010. This proved that exporters can benefit from PTAs even when trade barriers are modest or nonexistent, and that uncertainty about trade policy hinders investment and entry into export markets.
Freer trade promotes creativity, which in turn stimulates technological development and economic expansion. Improving our understanding of how trade policy in the 1990s affected innovation in 60 countries. [11] make use of international firm-level patent data. Increased patenting is evidence of innovation, not only information protection, and it is likely that policy liberalization enhanced knowledge production by 7% in the 1990s. The study indicated that increased import competition and market access stimulate innovation. Reference [12] looked at the effect of trade policy on innovation on a global scale by analyzing Chinese firm’s product data from 2000 to 2006. As a result of exporters’ membership in the World Trade Organization (WTO), this aggregate model can foretell both price and quantity. The authors claim that the major source of U.S. welfare gains from China’s WTO participation is China’s reduced input tariffs.
After the United States halted tariff increases on Chinese imports, Ref. [13] investigated the endogenous and heterogeneous sensitivity to trade policy uncertainty resolution. They found statistical and economic evidence of a beneficial impact from lowered tariff uncertainty. Even accounting for sectoral innovation patterns, policy changes, and foreign technology influx into China, the results hold up. The development of new medical treatments and the subsequent expansion of related industries are intertwined. Diseases both old and new can be prevented and treated thanks to the availability of knowledge, procedures, drugs, biologics, technology, and services. The exponential expansion of healthcare can be traced back to the explosion of new medical technologies [14,15,16]. Investor returns are key to comprehending the ascent of medical companies and the medical R&D spending that fueled it.
According to [16], health economists attribute the rise in global health care spending to the fact that countries are investing more in cutting-edge medical technology, medical assistance, and hospitals, along with medical innovation. Both direct and indirect financial incentives have been shown to increase innovation (direct and indirect payments are provided for medical devices and prescription medications, respectively). According to [17,18], economic development and reduced global inequality have resulted from improvements in health. Per capita income is one indicator of economic growth over the past century, and data from developing countries shows that improved health is on par with other aspects of development (GDP). The scale and growth of the healthcare sector have sparked public debate, as the improvement in longevity and quality of life may be the most beneficial shift of the last century. Healthcare spending in the United States is largely attributable to the purchase of medical machinery, biologics, pharmaceuticals, and ancillary services. Profitability in the United States is constrained by both public and private reimbursement restrictions; Medicare and Medicaid accounted for 44% of spending in the United States in 2012, according to the Centers for Medicare and Medicaid Services (CMS). In Europe, the government covers 85% of healthcare costs.
Health care manufacturers rely on public capital markets to finance research and development, while the public markets do not typically provide funding for health care manufacturing. Hospitals must rely on debt or charity to cover 35% of all healthcare costs. Due to a dearth of public equity investment in critical healthcare disciplines, private clinics account for 22% of healthcare expenditures, and for-profit medical innovation businesses dominate public stock markets. U.S. government policies impact medical R&D profits because of the country’s monopoly on the global market for pharmaceuticals and medical devices. According to [19], in 2012, the United States accounted for 48% of global spending on health care, despite the fact that its GDP represented only 24% of the global total. The United States only accounts for 39% of global spending on biopharmaceuticals because many developing countries now spend far more than previously. U.S. markets contribute more to overall earnings than sales do because of higher markups, leading one to the conclusion that medical R&D must undergo payment revisions that risk U.S. markups, and that U.S. re-imbursement policies affect the value of assets.
Research and development (R&D) investments in medical innovation are, it is generally agreed, motivated by profits in international markets rather than in home markets. Companies producing medical goods in Sweden, for instance, are more likely to invest in research and development if they can sell their products internationally as opposed to solely in their home country. The development of a nation is impacted by its healthcare economy and related policies. Medicare spending in the future and the economic development of a small European country are both sensitive to current US policy. Comparative research on the effects of different countries’ health care systems has been conducted by only a small number of health economists. Reference [20] examines the complex interplay of R&D investment and outcomes such as product differentiation and high-tech exports. Evidence suggests that other macroeconomic factors, such as development level and financial openness, usually condition linearity. Data demonstrates that R&D investment, innovation, productivity, and medium/high-tech exports have mixed effects; nevertheless, the threshold effects for R&D, innovation, and productivity are largest in the United States. However, the degrees of innovation indicators or threshold variables determine the nature of the effects, whether positive or negative. This study lends credence to the idea that a country’s level of economic growth might serve as a criterion indicator for formulating an innovation policy.
In the preamble to its Declaration in 1986 titled “Right to Development,” the United Nations General Assembly stated that “development is a comprehensive economic, social, cultural, and political process, which aims at the constant improvement of the well-being of the entire population and of all individuals on the basis of their active, free, and meaningful participation in development and in the fair distribution of benefits resulting therefrom.” This declaration stated that “development is a process, which aims at the constant improvement of the well-being of the entire population” [4,21].
The World Commission on Environment and Development defined sustainable development (SD) in 1987 as “development that meets the requirements of the present without sacrificing future generations’ needs” [22]. The Swiss Monitoring of Sustainable Development Project (MONET) defined SD as “ensuring dignified living conditions with regard to human rights by generating and maintaining the largest possible variety of possibilities for freely setting life plans.” Environmental, economic, and social resources should be used fairly between present and future generations [23].
It becomes obvious from the preceding criteria that SD necessitates the determination of the eco-social developmental objectives with which sustainability is attained. In addition, the ideas behind sustainable development are founded on three fundamental aspects (pillars): social (equity), economic (growth), and environmental (conservation) [23].
Despite its roots in the works of [21,24,25] the modern sustainability or environmental movement did not gain prominence until the 1980s with the publication of the Brundtland Report [26]. The Brundtland Commission, also known as the World Commission on Environment and Development (WCED) (referred to above), was established in 1984 and operated until 1987 with the goal of directing the nations of the world toward sustainable development. The Brundtland study from 1987 detailed their findings. Because to this research, sustainable development is now a commonly used term in the vocabularies of policymakers, experts, and planners.
As part of our continuing study, medical patent applications from 48 industrialized countries between 1980 and 2020 are used. We keep tabs on almost every company that files a patent, recording details such as the filing date, the technical class (which we associate with product codes), and the filing country. Using this information, we constructed a panel data set focused on the patenting of healthcare innovations. By exploiting the gap between “column 2” tariffs and MFN duties, the empirical technique dampens sector-specific innovation.
Our analysis of R&D and medical innovation in the present paper takes into consideration industrial and technological advances, and our comparison of innovation in the medical industry before and after post-normal trade relations (PNTRs). Patentability and buried R&D are context- and time-dependent; industry-fixed effects erase only time-variable variations. Finally, the Difference in Difference (DID) perspective has been applied to the study of the timeliness of technical innovation in order to capture the effect of sustainable development growth on medical innovation.
This structure is maintained throughout the rest of the investigation. To better construct a fundamental analysis, the authors will describe the literature evaluation and hypothesis creation in Section 2. The economic context of the study is discussed in Section 3, while the research methods and design, including sample and population size, variable and model formulations, and data analysis strategy, are discussed in Section 4. Section 5 discusses the findings, while Section 6 covers the study’s limitations, conclusions, and discussion of policy implications.

1.1. COVID-19 and Uncertainty

At the time of writing, COVID-19 is the major factor influencing the healthcare sector and new medical developments. The advent of the pandemic saw a surge in medical innovation, which had a significant effect on trade uncertainty, new product development, and investment. A second identifiable shock to medical innovation is the gap between before and after the COVID pandemic.
Numerous facets of daily life were made more precarious by the COVID-19 pandemic [27] and many aspects of the virus itself are still a dilemma [28]. The authors emphasize the importance of worldwide cooperation and the relevance of international governmental, business, and non-profit sectors working together to keep producing vaccines [29,30] because no one can predict when the world will return to normal. In many nations, lockdowns and quarantines serve to heighten people’s already high levels of anxiety and tension [31]. Masks and ventilators are two examples of the medical goods that have driven countries to compete for products, leading to hospitals and health institutions rationing their supply of these essentials. Because of these events, anxiety has spread over the world.
Reference [32] suggests that current levels of uncertainty are larger compared to the 2008–2009 Great Recession and are more akin to the Great Depression. They also claim that COVID-19′s significant uncertainty is to blame for the present economic slump. Reference [33] validates COVID-19 impact on political and regulatory uncertainties.
Due to high levels of uncertainty, businesses may be hesitant to move forward with investments [34] or take on new debt [35], both of which may exacerbate the current economic downturn and slow the flow of new funds into the system. According to [36], no disease has ever had such a profound impact on the stock market as COVID-19.
These results lend credence to the argument that the unknown nature of COVID-19 contributed to slower economic development, higher than usual bankruptcy rates, and elevated unemployment. Government officials, business leaders, and regular people alike have been paralyzed by the uncertainty of this pandemic. All of this makes it harder for executives in the private, public, and nonprofit sectors to make decisions.

1.2. Total R&D Spending on Medical Technology

Medical Device Industry

The healthcare ecosystem is undergoing a transformation because of factors such as shifting spending habits in the medical devices industry, an increased emphasis on digitization, a more diverse talent footprint, and a greater focus on ecosphere collaborations with technology companies, start-ups, and service providers. The importance of digital technologies and the disruptions they have caused have been more apparent, as has the way the healthcare industry is reinventing itself across the value chain. In 2019, the top 15 medical device original equipment manufacturers (OEMs) account for over 75% of the total R&D expenditures made by the industry worldwide. The top five spenders account for 38% of the world total, with money going into non-imaging diagnostics, surgical procedures, and prostheses. The following ten countries account for 33% of all R&D spending worldwide, mainly on imaging and non-imaging diagnostics: North America spends 59% of the worldwide R&D budget, followed by Europe (34%), and the Asia-Pacific region (APAC) (7%). 
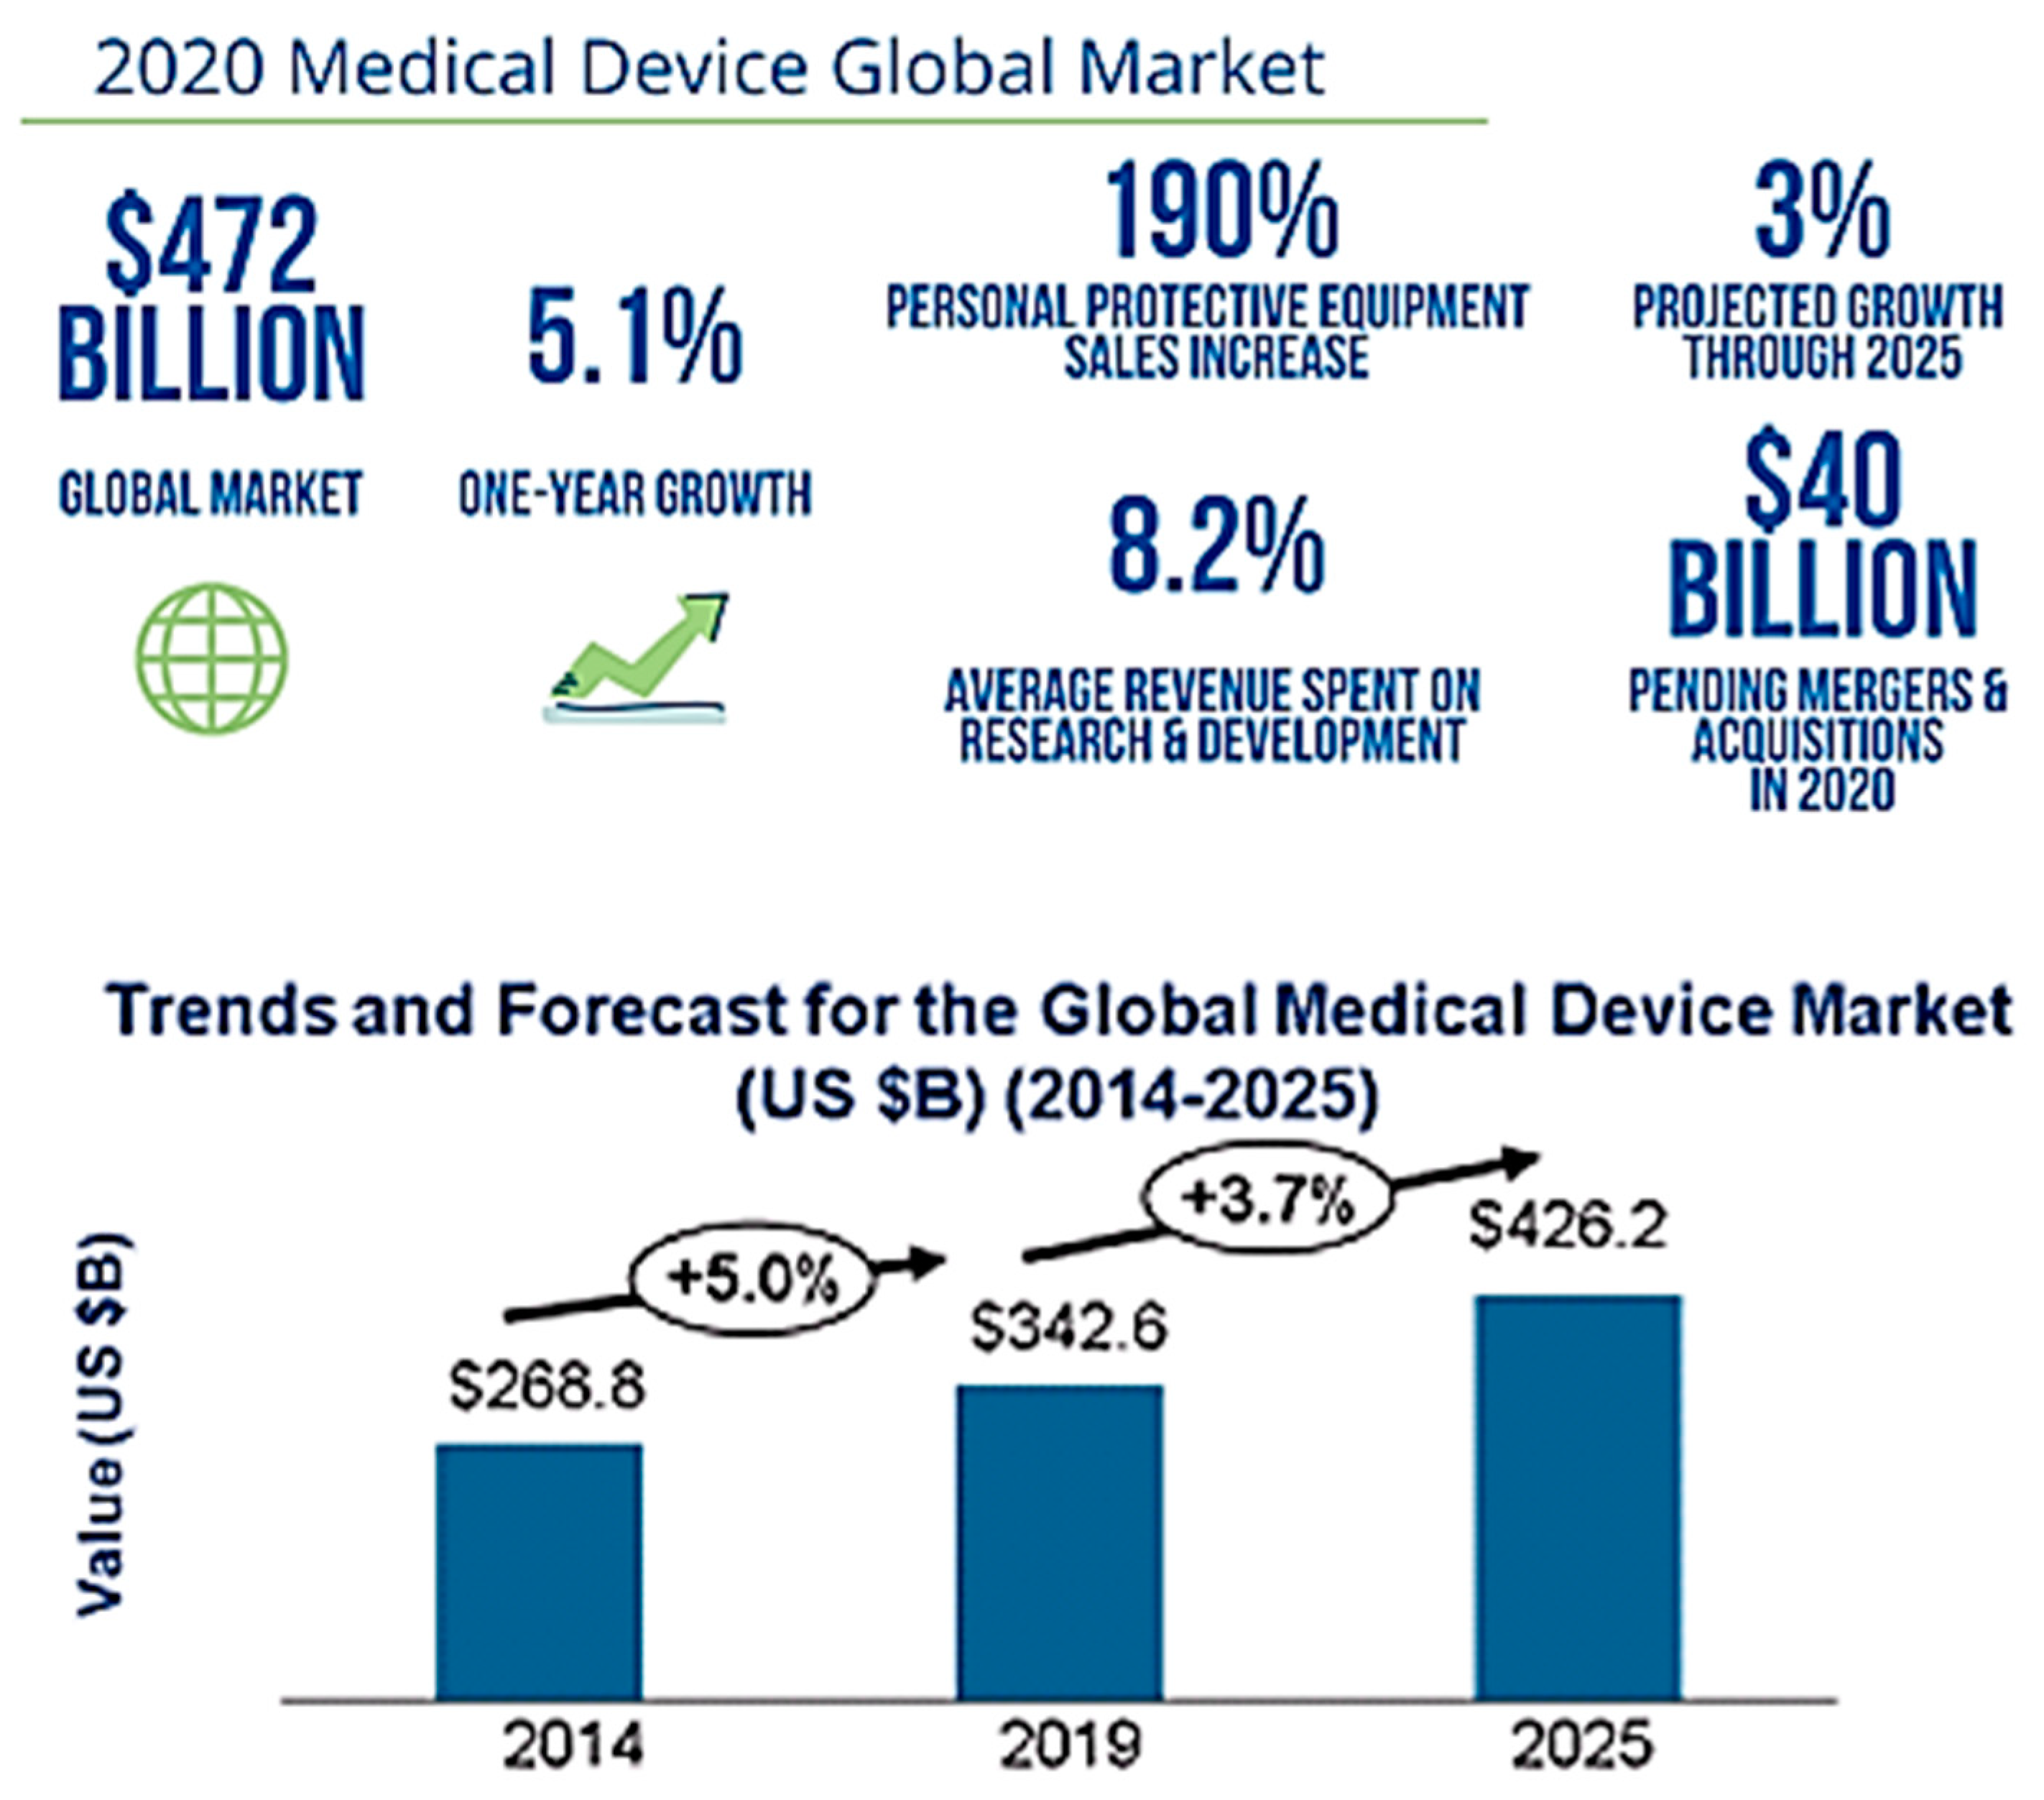
Figure 1 shows the total R&D investment in the medical sector according to its revenue as well as total patents for medical innovations.
Medical technology is characterized by a steady flow of advances resulting from industry-wide R&D and tight user collaboration. In medical technology, the average global R&D expenditure rate is 8% of sales, with a total of $472 billion with 5.1% growth yearly. Many products have an 18–24 month lifespan before being replaced.
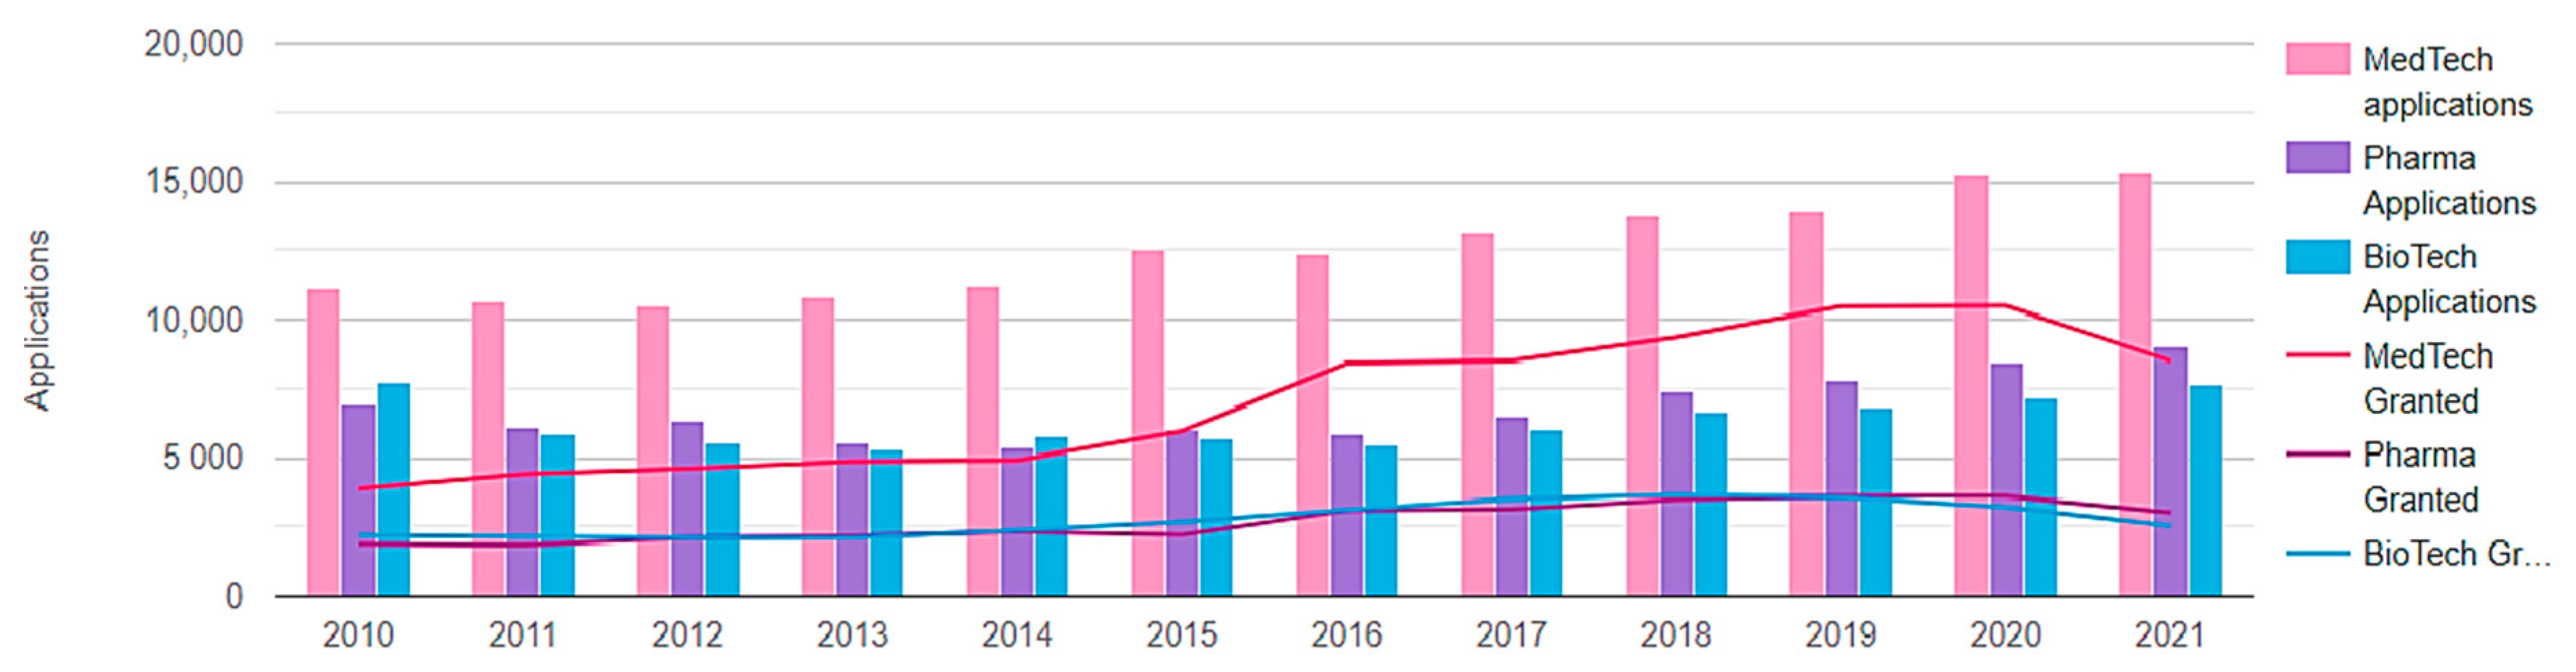
Comparatively, globally 9000 pharmaceutical and 7600 biotechnology patents were filed in 2021 for overall economies, as illustrated in Figure 2. While EPO filings in medical technology have risen in the last two decades, pharma and biotech patent applications have stagnated. In 2021, 55% of patent applications will be granted. Pharmaceutical and biotechnology have a 33% share. The global medical device market is estimated to rise by 3.7% annually, giving total expenditures of $426.2 billion till 2025.

2. Literature Review and Hypothesis Development

There is a correlation between trade policy uncertainty, R&D expenditures, and medical innovation in industrialized and developed countries, and that correlation is the focus of this study. It explains how economies work and why this particular empirical research was conducted. An important finding emerges from integrating uncertain technological possibilities into a business model featuring diverse companies. In this paper, we extend research from [37] to examine the firm’s innovation-decision process. Monopolies have seized control of the whole economic system. By reimbursing businesses for previously invested capital, productivity can be boosted. Reference [38] describes selection of appropriate technologies.

2.1. TPU, R&D and Innovation

Literature on developing novel products and services often highlights the importance of a sizable market. The United States was already China’s largest export market before the adoption of permanent normal trade relations (PNTR), but the threat of sudden hikes in tariffs may have caused businesses to delay exports and development. According to [39], exports were initiated by businesses once most favored nation (MFN) status had been made permanent. U.S. patents are a must for exporting companies. The number of patent applications submitted in highly vulnerable sectors in the United States is compared here to draw this conclusion. Our research shows that an increased interest in PNTR follows an increase in the number of patent applications submitted to and approved by the US Patent and Trademarks Office (USPTO). Despite the high expense of patenting and the fact that corporations normally only file patents overseas when they intend to export, there has been a rise in innovation as a result of rising U.S. exports [11].
The study is based on two different lines of academic inquiry. First, the real options literature provided the insight that while facing uncertainty, one can derive value by waiting and postponing an irreversible investment (partially). There have been a number of recent research studies on the impact of uncertainty on investment behavior [1,2,4,40,41,42,43]. The impact of policy uncertainty on investment has been previously the subject of analysis and empirical investigation [5,9,39,44,45]. The effects of uncertainty on research and development (R&D) and innovation (I&D) have been completely ignored in the vast majority of studies on this topic, which have instead focused on physical capital investment, employment, and productivity. However, there are exceptions since, as [40] shows, where there is a lot of uncertainty, R&D is less likely to react to changes in demand. Reference [9] looks at the healthcare industry in the United States and shows how uncertainty from the government spurs medical innovation while cutting back on research and development. Reference [37] show that technical advances made possible by PNTR funding directly lowered marginal export costs. By showing that eliminating trade policy uncertainty promotes innovation investment across industries, our study fills a void in the existing literature.
Moreover, the current body of research on diverse companies and international commerce places an emphasis on the complementarity that exists between expanding access to foreign markets and investing in activities that boost productivity [46,47,48]. Other studies investigate the effects that exporting has on a company’s level of production [49,50,51,52]. This article does not focus on the current state of exports or productivity; rather, it emphasizes investments in trade policy and new product development. The concept of uncertainty marked the most significant departure in the prior body of research.
Expanding access to international markets and funding productivity-boosting initiatives go hand in hand, according to recent research on heterogeneous enterprises and international trade [46,47]. The effects of exporting on productivity are the subject of further studies [25,49,51,53]. The topics of innovation investment and trade policy are discussed in this article rather than export status and productivity. Uncertainty was the biggest change in the prior literature. Using the work of [39,54], we present a dynamic business model with heterogeneous enterprises and introduce technology choice in the face of uncertainty. The option value of waiting and market access [48] are two real options that are combined in this method. Consistent with [54], the model proposes that only the most productive businesses stand to gain from innovation, and that the decision to innovate is determined endogenously by market size. In contrast to [54], where the cost of innovation is still to be incurred, many companies are in the “band of inaction,” where they do not invest and keep their technology at a low level, due to uncertainties over foreign trade policy. The following hypothesis is made easier to test when uncertainty is reduced, as this increases the incentive for enterprises to experiment with new ideas.
H1. 
Under the DID approach, patents (innovation) are profoundly impacted by trade policy uncertainties (TPU) and R&D.

2.2. Sustainable Development

Reference [55] reveals self-reinforcing dynamics between technology, medical specialization, personalized medicine, and academic resource concentration. The way medical innovation has been sponsored, designed, and promoted since the 1950s has created path dependency, which exacerbates the sustainability difficulties healthcare systems face. We conclude that healthcare sustainability needs innovative design concepts.
Researchers from many countries have always been interested in sustainable economic growth and its influencing elements. In recent years, academics in industrialized countries have focused on environmental technologies that enter other countries’ economic cycles after being copyrighted through technology transfer [56].
Innovative enterprises are less likely than others to fail during a crisis such as the COVID-19 epidemic and do well. Innovative companies are also more hopeful. Moreover, adaptation modulates the relationship between innovation and survivability. Innovative firms are more likely to create new products, remote work arrangements, and increase delivery, pivoting, and online activity during the pandemic crisis than non-innovators [57].
H2. 
Sustainable development indicators significantly affect patents (innovation) under the DID model.
A long-term analysis of innovation is described in [58] which suggests that patents or R&D spending may be critical. After generating direct metrics of technological innovation based on patents and R&D spending, she found a weak correlation between total factor productivity (TFP) and technology shocks. It is expected that the findings of [58] will show how inadequate basic patent counts are since they ignore the enormous economic variability of patents, as discussed in [59,60]. Whether they are slow changes, as defined by [61], or shocks as explored by [62], it is expected that landscape changes put stress on existing regimes, making space for radical niche innovation. However, it is common knowledge that not all economic downturns or global shocks lead to significant innovations, at least not right away. The results of such crises may be less than ideal [61].
By focusing on the most significant patents, those in the right tail of our measure, we are able to create aggregate and sectorial indicators of technological development [63]. Their technology indexes include the years 1840 through 2010, and feature developments from a wide variety of sources, including for-profit and non-profit businesses, the public sector, and the United States government. These indices are excellent predictors of future output because they accurately portray the development of technology waves across time. The study by [64] set out to test the validity of periodization and historical narratives of technological transitions against hard data based on trends in invention output and innovator biographies. The following hypothesis was created by this study’s examination of two worries about the long-term patterns in innovation in the industrial sector, which were shown by analyzing data on innovation output.
H3A. 
Both in the short and longer term, patents (innovation) are significantly influenced by R&D and TPU.
H3B. 
From both short run and long run perspectives, sustainable development factors have a major impact on patents (innovation).

3. Economic Framework

This part introduces elements of the economics of international trade, and explains why a government may choose to fund technological advancements. In this paper, we apply the research of [45] to derive important findings about the national and corporate choices to invest in innovation. Competition between monopolies is the main economically distinct field. Payment on a non-recoverable investment might enhance a company’s output [38].

3.1. Theoretical Background

We take into account a setup with two nations, one local and one foreign. In this case, n stands for the country, d for the domestic, and x for the international. There is just one type I and one differentiated sector j. Consider for simplicity a single differentiated sector j, characterized by monopolistic competition, and in which each firm produces a variety I using only labor. Different companies have different levels of productivity, as determined by i. Putting money into cutting-edge technology can make businesses more productive. Hidden costs arise from R&D investments and include things such as buying new equipment, paying for the education or training of specialists, researching and gathering data on emerging technologies. Spending on R&D results in superior technology, which in turn lowers the marginal cost of production from point A to point B; failing to spend results in inferior technology and initial productivity of i0.
We have utilized all countries as importers or exporters, domestic and international. For example, if Australia is a ‘domestic’ country, then the other 47 developed countries are ‘international’ countries. For Austria, however, Australia is an ‘international’ country. The number of patents which have been applied for in the field of MedTech has been employed as a measure of innovation. Either the patent is applied for domestically or abroad.
As a sector that contributes to product diversity, our industry is subject to an ad valorem tariff of Tx = x1. There are no consistent expenses associated with breaking into a foreign market because all industries are subject to the same tariffs. This means that every single domestic firm has a presence in international markets. Finally, in every era, regardless of business productivity, there is always an exogenous risk of exit 1. Low-tech production earnings are included in the equilibrium per-period operational profits determined by the total of domestic and export revenues,
π ( φ i 0 ) = π d ( φ i 0 ) + π x ( φ i 0 ) = B d φ i 0 σ 1 + B x τ x σ φ i 0 σ 1
After accounting for our expenditures on R&D, the following is the profit we made,
π ( φ i 1 ) = π d ( φ i 1 ) + π x ( φ i 1 ) = B d φ i 1 σ 1 + B x τ x σ φ i 1 σ 1

3.2. Innovation and Uncertainty Decision

Consider the scenario of a domestic company with the means to invest in R&D in order to boost productivity, but whose leadership is concerned about the state of foreign markets. R&D is more financially rewarding when it can be applied to a larger consumer base. Future access to foreign markets is, however, uncertain as a result of shifting trade policy as T = 1. Foreign tariffs are unclear due to ambiguity. The company must decide between making an R&D investment in the current period or delaying it till period t. It is only the outside survival rate that is a mystery. Investing in research and development (R&D) leads to a steady flow of income from both domestic and international sales of manufactured goods and services.
Π I ( τ s ,   φ 1 ) = Π d I ( φ 1 ) + Π x I ( τ s , φ 1 )
Without taking into account the effects of time, the anticipated domestic profits are as shown below,
Π d I ( φ 1 ) = π d ( φ 1 ) + t = 1 β t π d ( φ 1 ) = π d ( φ 1 ) 1 β
The following formula depicts the possible gain from exporting.
Π x I ( τ s , φ 1 ) = π x ( τ s , φ 1 ) + t = 1 β t π x ( , τ s , φ 1 )
An estimate of b’s future value ‘es’, the firm’s productivity using high-type technology, is computed using s, where s is a reference to knowledge on trade policy. Using only the most basic of technologies, we have calculated the value of a company without factoring in any potential gains from exports or technological upgrades.
Π ( τ s , φ 0 ) = Π d ( φ 0 ) + Π d ( τ s , φ 0 )
The forecasted domestic profit is given as
Π d ( φ 0 ) = π d ( φ 0 ) + t = 1 β t π d ( φ 0 ) = π d ( φ 0 ) 1 β
After that, the forecasted export profit is given as,
Π x ( τ s , φ 0 ) = π x ( τ s , φ 0 ) + E x t = 1 β t π x ( τ s , φ 0 )
In this context, f demonstrates that there should be no ambiguity over future market access for there to be a positive return on investment. It is referred to as investment when the estimated value of investing, net of sunk investment cost, is more than the expected value of producing using low-type technology. At this point, there is no benefit in waiting because there is no use in delaying the investment. This is the phase of apathy regarding financial investments.
[ π d ( φ 1 )     π d ( φ 0 ) ] + [ π x ( τ s D   , φ 1 ) π x ( τ s D   , φ 0 ) ] = I   ( 1 β )
In its stead, the sector must either make expenditures immediately or keep producing low-tech machinery until the market recovers. An optimal stopping problem is an investment that stops and waits for a longer period of time, given this pliable investment decision. The following equation illustrates how Bellman’s equation is used to solve the decision problem faced by a corporation,
F ( τ s ,   φ ) = max { Π d I ( φ 1 ) Π d (   φ 0 ) + Π d I ( τ s , φ 1 ) Π x (   τ s ,   φ 0 ) I = β E x F ( τ s ,   φ ) }
With regard to this optimal stopping problem, the domain of T is split into two parts: a continuation region and a stopping region. Generally speaking, ideal termination intervals can occur at the same time as continuation intervals. The range of T may be shown to be neatly bifurcated into a continuing zone and a halting area under reasonable hypotheses, using a single threshold value of T and R,
Π d I ( φ 1 )     Π d ( φ 0 )   +   Π d I ( τ s U , φ 1 ) Π x ( τ s U , φ 0 )     I = β E x F   ( τ s U ,   φ )
An example of investment apathy under uncertainty is given by the following equation:
F ( τ s U ,   φ )   =   Π d I ( φ 1 )     Π d ( φ 0 )   +   Π x I ( τ s U , φ 1 ) Π x ( τ s U , φ 0 )     I
Rearranging Equation (10) by subtracting Equation (12) is important for analyzing the rule of uncertainty, as shown below,
V s = max { 0 ,   Β E x V s   [ π d ( φ 1 ) π d ( φ 0 ) ]   [ π x ( τ s , φ 1 ) π x ( τ s , φ 0 ) ] + ( 1 β )   I }

3.3. Trade Policy Regime

Based on the ideas presented in [45] this policy regime mimics the structure of trade policy. The three distinct trade policy states, s = 0, 1, and 2, are described using a Markov chain. Trade protection can range from 0 (no protection) to 2 (double the protection of 0) to 3 (complete protection). The only time trade policy uncertainty is present is during the transitional phase (s > 0), and it is non-absorbent under extreme conditions.
S = [ λ 00 0 0 λ 10 λ 11 λ 12 0 0 λ 22 ]
where λ 11 = (1 − γ), λ 12 = γλ, and λ 10 = γ (1 − λ) are the numbers. All companies are equally vulnerable to the effects of a shock in trade policy since they share the same goals and face the same dangers.
From Equations (1) to (14), all the empirical expressions are the part of the theoretical mechanism, showing the trade regime and partial equilibrium expressions. For the robustness check and potential endogeneity, after Base double DID method the IV method has been utilized, for which 2SLS, reduced form, with first stage regression analysis has been compared with OLS method.

4. Data and Methodology

4.1. Population and Sample

The population review for this study covered the sample of 48 developed nations and drew upon annual data 1980–2020. Previous studies have focused solely on the exporting country and the importing country (the United States in these cases). It is stated in both the introduction and this data section that 48 developed countries have been selected for the present study. The developed countries devote a disproportionate share of their GDP to research and development and innovation, making them industry leaders. Secondly, this group of countries imports medical technology from each other even though they are a major exporter of technology to emerging nations. In order to examine the state of medical innovation and the degree of policy uncertainty in this particular set of nations, this sample has been selected. There are two reasons why we are concentrating on the years after 1990 in our analysis. Over 100 countries will have joined the World Trade Organization between 1990 and 2020. It is worth noting that the World Trade Organization (WTO) took the place of the General Agreement on Tariffs and Trade (GATT) on 1 January 1995. While the first country joined the WTO in 1995, the most recent member was admitted in 2016. Each country’s data will be broken down into pre- and post-accession periods. Policy unpredictability was reduced for a number of reasons. After joining the World Trade Organization, the PNTR became binding. In accordance with [65], we focus on the time period after each country became a member of the WTO following the PNTR. As for the second reason, we picked this group specifically to analyze trade policy shifts after the financial crisis of 2008. Almost every country in the world has been affected by the current financial crisis, linked inter alia to COVID-19. The peak of the pandemic in 2020 made it impossible to trade, but within that time period, medical advancements, studies, and related commerce all increased. Medical technology, vaccinations, and research aid influenced international free trade policies. Developing countries can benefit from this field of research. Trade policy uncertainty and innovation are impacted by a number of factors, all of which are described in Table 1.

4.2. Econometric Modeling

The empirical strategy makes use of time-country variation by employing a technique known as the generalized double difference-in-differences. The sector variation is not taken into consideration because the sector is always the same. When industries with varying degrees of exposure to the unpredictability of trade policy are compared, patterns of patenting and innovation are found to be very similar. Assuming that this presumption is correct, the difference-in-differences technique can be used to determine whether or not there is a causal connection between trade policy uncertainty and innovation [66].
These are the empirical models that were generated by following the methodology described before.

4.2.1. Difference in Difference (DID) Method

Within the confines of this investigation, we have carried out an estimation of the generalized double difference-in-differences model that is presented below.
Ln (pjnt) = α + ωnt + ωjt + δ1 ln (TPU) + δ2 lnR&D + μ
The post PNTR was then incorporated into the model as an interaction term with TPU, which allowed us to derive the subsequent model.
Ln (pjnt) = α + ωnt + ωjt + δ1postPNTRt × ln (TPU) + δ2 lnR&D + μ
In this case, the dependent variable is the log of the total number of innovation patents ln (pjnt) issued in year t for technology j by all applicants in country n. The j and n in the patent’s four-digit technology code denote the applicant’s (patentee’s) country of residence, not the patent office to which the application was submitted. The nt and jt cyphers represent, respectively, nation time, country technology time, and technology time. The fourth term on the right consists of the post-PNTR dummy (Post-PNTRt), the trade policy uncertainty exposure (ln (TPU), and the term of interest. Using the following formula, we can calculate the uncertainty exposure measure (lnTPU), which is the weighted average of the log discrepancies between column 2 tariffs and MFN tariffs
Ln   ( TPU j ) = h w j h ln ( t 2 t 1 )
The researchers believe that this value symbolizes either the importance of each HS product that can be made with technology j, or the degree of uncertainty the researchers have when trying to map an unpatented approach to a product. This is sourced from [67], which also provides figures showing how the (IPC) and the (HS) codes correspond to one another.

4.2.2. Sustainable Development

As mentioned above, for the impact of sustainable development on innovation in the perspective of social, economic and environmental development as well as the social inequality parameters, the generalized Difference in difference method has been used for mentioned analysis as DID has the ability to resolve any endogenous issues that may arise during the policy review process.
Ln (pjnt) = α + ωnt + ωjt + δ1 ln (TPU) + δ2 lnR&D + δ3 ln (HDI) + δ4 lnGDPG + δ5 ln (GINI) + δ6 lnCO2+ μ
Reference [68] reports research to investigate the connection between sustainable development and financial investments in technological advancement. The authors drew parallels between the BRICS countries and the G7 nations. Reference [69] demonstrates that research and development in West Africa has a statistically significant positive impact on human development. This highlights the potentials of human development that can be tapped into by maintaining research and development efforts.

4.2.3. Long-Run and Short-Run Effect

Using a technique called the panel Autoregressive Distributed lag (ARDL) method, we can analyze TPU and R&D investment’s long- and short-term effects on innovation in the medical industries of high income countries.
Yit = α + α1Xit + β1Yi,t−1 + β2Xi,t−1 + εit
The overall shape of the ARDL model can be seen in Equation (17). The goal of this study is to extract the ECM of the panel data and examine long- and short-term co-integration correlations between determinants in order to reveal short-term dynamics, using the panel ARDL method. Additionally, results were similar using other co-integration methods, including [70] and tradition [71] techniques. Co-integration was considered, but the panel autoregressive distributed lag method was chosen instead because of its additional benefits.
Dln ( p jnt ) t = α + i = 1 k d δ 1 ln ( T P U ) t 1 + i = 1 k d δ 2   lnR & D t 1 + Φ 1   ln ( TPU ) t 1 + Φ 2   lnR & D t 1 + μ
The F test cannot be used to test the co-integration assumption since it does not have a standard allocation based on whether the model elements are wholly I (0), fully I (1), or a combination of both; the number of estimators; or the presence or absence of a trend, intercept, or both. As a potential solution to the endogeneity problem, [20] suggested looking at industrialized countries in the future.
Dln ( p jnt ) t = α + i = 1 k d δ 1 ln ( TPU ) t 1 + i = 1 k d δ 2   ln R & D t 1 + i = 1 k d δ 3 ln n SD G t 1 + Φ 1   ln ( TPU ) t 1 + Φ 2   lnR & D t 1 + Φ 3   l n S D G t 1 + μ

4.3. Data Estimation Method

The perspective of [72], which was a determined before-and-after study in many social sciences, was used to investigate patents in the medical sector in both industrialized countries. In contrast, [73] investigated the fast-food industry in New Jersey and Pennsylvania. The Differences-in-Differences estimate (DID) and labor market regulations were studied in [74], which examined workers’ compensation and absenteeism.
The DID gives more weight to results that have been observed in order and pays less attention to those that have not been. In [75], we see examples of possible prejudice against people using DID and record three approaches to combating such biases. With a sufficient number of samples, block bootstrap may reliably determine standard errors. Compressing data always results in the same sized standard errors, regardless of the number of states involved (though the power of this test declines fast). Autocorrelation can be used to compute standard errors when there are enough groups to do so. For this reason, we eliminated error biases by splitting the data into pre and after periods. To check for multicollinearity, we employed the variance inflation factor (VIF) method. When VIF = 1, [76] discovered no correlation between the explanatory variables, but when VIF > 10, they discovered multicollinearity. If the VIF was greater than 5, it meant there was multicollinearity [77].
Next, the long-run characteristics of the model are estimated and inferred using the methods proposed in [78,79]. It is more difficult to conduct the research due to the presence of different stationary variables, also known as I (1) variables. The main premise of the co-integration research is that the standard ARDL approach is invalid in the existence of I (1) variables, and this literature investigates long-run correlations between I (1) variables. We have compiled a list of methods for alternatively estimating and testing hypotheses concerning I (1) variables, as per [80]. The challenge of cointegration analysis was studied by [80], which looked at the ARDL Modelling Approach. Long-term structural modelling within a fully parameterized VAR framework was investigated in [70,81]. If the ARDL methodology used here were applied to systems with both short- and long-term identifying limitations, we would be back at the Cowles Commission approach described in Panel ARDL [82,83].

5. Empirical Results

5.1. Descriptive Statistics

The descriptive statistics for developed countries are listed in Table 2. This includes the mean, standard deviation, minimum, and maximum values. R&D spending is influenced by patent and trade policy uncertainties. During the study’s time period, patent applications for innovations averaged 6.926 % per year across all industrialized nations, which cover only medical sector. In comparison to R&D spending, the mean TPU is 0.898%. For a full evaluation of the model’s stability, additional controls are listed below as well as the indicators related to sustainable development, HDI, GDPG, GINI and CO2 emissions.

5.2. Correlation Matrix

Using a correlation analysis, Table 3 shows how the variables in this study are interconnected. There is a 99% positive confidence interval around the coefficient values of 0.033 for trade policy uncertainty, 0.306 for R&D, and 0.214 for new therapeutic methods when applied to medical innovation. Additional correlations exist between R&D, import tariffs (ImpT), and total trade volume (TPU) of 0.174 and 0.133, respectively [84]. Non-trade measures (NTMs) are an integral part of trade regulation. NTM is positively correlated with TPU and R&D, but negatively correlated with imports and FDI.

5.3. Multicollinearity Diagnostic Test

The VIF is used with multivariate models in Table 4 in order to check for multicollinearity. Reference [85] defines multicollinearity as the absence of correlation between independent variables when the variance inflation factor (VIF) is equal to one. The results of the study’s explanatory components are presented in Table 4, which shows that there is no multicollinearity. Panel regression models are more accurate and consistent when there is no collinearity since the presence of multicollinearity lowers the statistical power of these models.

5.4. Does More Patenting Mean More Innovation?

Table 5 displays the baseline findings of the generalized DID estimation approach applied to R&D expenditures, TPU expenditures, and innovation expenditures with control variables that make use of the time and country fixed effects. The TPU estimates with fixed impact are displayed in the first column of this table, and they show diferences between industries that have a high and a low exposure to policy uncertainty. While columns 2 through 6 present the results of R&D spending directed toward innovation, this column provides the controls for WTO-related policy changes that were put into effect at the same period. These measurements include, among other things, indicators of limits on foreign direct investment (FDI), non-tariff barriers, import tariffs, and imports. TPU has a negative, time-fixed effect on innovation, which is to be expected given that these results are for low-income economies with unclear policies [86].
The act of patenting an idea has been linked to various indicators of innovation [87]. R&D investment benefits innovation, as seen in column 2; governments can increase patents by raising R&D spending [88]. This table’s columns 3 through 6 present the control variables we have chosen to increase the table’s robustness: foreign direct investment (FDI), imports (Imports), import tariff (Import Tariff), and NTM (New Trade Measure). Our research shows that while FDI, imports, and NTM all have positive effects on innovation, imports and import taxes have negative effects. Import tariffs are the primary indicator for regulating the flow of goods in response to demand and the flow of patented and unpatented innovation through trade; such trade is becoming a disaster for the developed countries in terms of technology and gain from trade, e.g., US-China “trade war”, as consistent with [66]. As expected, the TPU coefficient is positive and statistically significant, suggesting that the elimination of trade policy uncertainty is associated with increased innovation.
Before the PNTR summit in 2001, trade policy uncertainty had no connection to innovation. The post PNTR dummy is re-inserted into the main model and interacts with all variables, and the results for post PNTR time events are displayed in Table 6 using the generalized DID estimation method among the innovation, TPU, and R&D expenditures with control variables by employing the time and country fixed effects. This table evaluates the DID estimates of post PNTR analysis, which includes the effects of country time and country technology, in columns 2 through 6. Analyzing innovation and TPU events in the post-PNTR era requires looking at the outcomes of control variables incorporated with the PNTR dummy factor, which may be found in columns 2 through 6.
According to the facts provided in the first column of this table, a substantial and positive relationship exists between innovation and TPU. This leads to the conclusion that an increase in pre-WTO TPU exposure results in a greater amount of post-PNTR patenting activity for new applicants. In addition, the findings presented in column 2 demonstrate that research and development has a significant influence, both positively and negatively, on innovation. These findings demonstrate that spending on R&D prior to the WTO had a direct impact on patenting after the PNTR period, which is consistent with [18,39,57].
Results of two-stage least square (2SLS) estimation of Post PNTR*lnTPU with country time and country technology fixed effects are shown in Table 7 below. Different iterations of the 2SLS estimation results are displayed. Due to the fact that “column 2” tariffs from Smoot–Hawley can be used to instrument the baseline uncertainty exposure metric, OLS estimate has been performed before attempting reduced form, first stage, and 2SLS estimation. Since almost all variation results from the “column 2” tariffs introduced by Smoot–Hawley in 1930, the uncertainty exposure measure, lnTPU, is probably exogenous, as stated in [66]. Since smaller log differences between “column 2” and MFN taxes would indicate that the United States intentionally applies MFN tariffs, this would bias the findings against showing an uncertainty effect on innovation.
Both Ordinary Least Squares and Partial Least Squares models demonstrate that all variables are significant, with P.TPU, PFDI, and P.impT having negative effects on innovation and PRD having positive effects. The instrumental variable “Column 2” tariff has a positive effect on innovation in developed countries, as shown by reduced form equation estimations and first stage estimation. The estimated effect was found to be statistically significant and comparable in size to the baseline estimate.

5.5. Sustainable Development: Base Line Result

Table 8 shows the baseline findings of the generalized DID estimation approach for Innovation, TPU, and R&D with time and country fixed effects. TPU and R&D results are similar as before. Table 8, columns 1 to 4 evaluate HDI, GDPG, GINI, and CO2. The inequality index and CO2 have negative and significant impacts on medical innovation, but HDI and GDPG have positive and significant impacts. The results reveal a link between GDPG and medical innovation and these results are in line with [89]. Innovation performance and human development appear linked and this finding is supported by [69], finding that innovation positively affects human development in Africa. However, [90] found no link between innovation and human development. From column 4, CO2 emissions have a negative and statistically significant impact on innovation. This conclusion agrees with [91], who found that CO2 emissions had a bidirectional causal effect on innovation. Another study in different regions found similar results for G6 countries [92], and boosted CO2 emissions in BRICS and MENA countries. Reference [93] found that innovation reduces China’s CO2 emissions.
Long-term and short-term effects of TPU and R&D on innovation are discussed in Table 9, along with results from the Panel ARDL model used with and without a control variable. Long-term and short-term estimations are broken down independently for each model. The long-term estimation results for model 1 suggest that the TPU and R&D computed factors for long-term innovation fluctuation are statistically significant in positive directions, indicating that medical innovation in industrialized nations is on the rise. The results are consistent with the hypotheses. The wide variety of possible new ideas is significantly impacted by TPU’s effects on the countries of a destination [86]. Results from a short-term estimation imply that shifts in TPU and R&D have a little impact on innovation, while results from a long-term estimation imply that there is no long-term co-integration among the factors. The variance between the two sets of estimates is large, suggesting that innovation is positively influenced by both uncertainty and R&D spending only when strategic, long-term investments are made.

5.6. Long-Run and Short-Run Estimates (ARDL)

In model 2 of Table 9, long-run estimate results show that the TPU, R&D, and control variables estimated elements for long-term innovation variations are statistically significant when control variables are introduced to test model robustness. Results from the short-run estimations show that shifts in TPU, R&D, and control factors have little impact on innovation, and the presence of a large number of EC terms suggests that long-run co-integration does not exist. The estimation results for the two terms differ substantially, demonstrating that uncertainty and R&D expenditures have a beneficial effect on innovation only when long-term investment plans are carried out rather than short-term ones; however import and import tariff has substantial impact in innovation in short run as well [94,95,96].
Model 3 indicates that, in the long run, increasing GDPG improves technological innovation. This result is consistent with the findings reported in [91,97] that economic position affects a firm’s decision on how to engage in innovative activities, both in developing and established nations. We show that CO2 emissions positively affect technological innovation in the long run. Reference [98] states the most innovative countries do not reduce emissions as innovation improves. These findings could be due to inventors’ unwillingness to focus upon climate mitigation technology. Technology transfer allows access to mitigation technologies globally, according to [99]. However, intellectual property rights do not allow free access to patented technology, thus a few patent-holders hold onto them [100,101]. Technological innovation seems crucial for addressing environmental challenges. New solutions are needed to reduce carbon emissions while maintaining output and consumption. Human development influences innovation in the long run for developed countries, as [102] found that human capital is important for technical innovation. “Human capital is integral to technical innovation,” they say. Innovation in industry and society requires skilled workers. Knowledge investment encourages innovation and technical progress, and thus spending should go to research and training. The GINI index has a negative impact on innovation in long run: a higher index leads to higher inequality which leads to less innovation circulation. For the short run, only GDPG has a significant impact on innovation with TPU and R&D investments; the significance of the EC term indicates the long run cointegration among the sustainable development and innovation.

6. Conclusions, Policy Implications and Limitations

6.1. Conclusions

This study analyses developed countries’ adoption of sustainable development strategies between 1980 and 2020, and the effects of trade policy uncertainties on medical innovation and R&D spending. It makes use of comprehensive data on innovation across all medical sectors and wealthy nations, as well as exogenous and heterogeneous exposure to trade policy uncertainty. By eliminating tariff uncertainty and securing MFN tariffs through a genuine trade agreement, the PNTR sparked innovation without raising tariff levels. Reducing tariff uncertainty has large economic and statistical effects on medical innovation, and these impacts are suggestive of real innovation rather than merely an increase in patent applications. Further investigation into the theoretical framework’s mechanics finds that rising countries are the primary drivers of the negative innovation response, whereas R&D spending is the primary driver of the positive innovation response.
The results hold true even after accounting for potential policy shifts and influxes of foreign technology in developed nations. These findings emphasize the significance of trade agreements in lowering tariff uncertainty and fostering economic expansion. Recent events, such as the “trade war” between the United States and China, the United Kingdom’s exiting the European Union, and the revision of major trade agreements such as NAFTA have all made tariff uncertainty a crucial factor for companies.
Innovation has long been considered as a way for businesses and countries to grow economically. With the impact of international institutions in the medical sector, innovation policy has become part of the national policies of many developed and developing countries. Many nations have innovation strategies. Real welfare for countries is not only reached through economic progress, however. Sustainable development incorporates social and environmental improvement as well as economic growth.
In addition, based on the included premise, this study investigates the effect of trade policy uncertainty on innovation using exogenous exposure and controlling for confounding variables. It determines the short- and long-term impact of TPU and R&D expenditures on innovation in developed economies. Long-term changes in innovation are statistically significant and favorable, demonstrating an increase in medical innovation in developed countries. The findings support the medical innovation concept.
In the 2030 Agenda for Sustainable Development, SDG 9 covers industry, innovation and infrastructure, and serves as a method to achieve the other goals. Today, innovation serves sustainable development and national income, and sustainable development boosts innovation pace. On the basis of our hypotheses, the purpose of this study was to determine whether or not this aim was accomplished in both the short and long term. According to the findings of the study, GDPG and HDI have a favorable impact on innovation, whereas inequality and CO2 emissions have a detrimental effect. Because economic growth provides the means for its continuation, innovation is more than just a tool for economic progress. The three pillars of development—economic, social, and environmental—should all be served by innovation.

6.2. Policy Implication

The importance of fostering medical innovation has been emphasized by economists. Our paper shows that trade liberalization may assist in economic growth by reducing policy uncertainty, which in turn would boost innovation in developed and high income countries. When evaluating the success of economic programmes, economists and politicians must take the influence of policy uncertainty into account. For instance, trade protectionism rose after the global financial crisis of 2008. Many countries use anti-dumping investigations or label others as currency manipulators in place of tariffs. The future of the global trading system is becoming increasingly uncertain in light of recent events such as the Brexit vote and open calls for protectionist measures by the U.S. government. Because they create market uncertainty, protectionist measures may not only increase the costs of doing business, but also stifle new product development and other forms of company innovation.
This study fills many voids that previously existed in the existing body of research. The most important takeaway from this research is that novel concepts can originate in any aspect of successful environmentally friendly growth. This indicates that every nation that has an innovation-related sustainable development objective must have initiatives in place in order to meet that goal. This paper discusses the ebb and flow of TPU as well as sustainable development and their impact on innovation, providing a major addition to the body of published work. Finding both the short-term and long-term correlations between innovation performance and other characteristics is one of the most important contributions to the body of knowledge. It is envisaged that the findings of the study would provide valuable insight into the growth strategies and policies of a variety of countries.

6.3. Limitations and Future Study Direction

Regarding the limitations, the purpose of this study was to investigate the changes that have occurred in the medical industry in 48 industrialized countries between the years 1980 and 2020. Because of this, the scope of this study and the number of observations are limited to medical advancements. The authors recommend that future researchers either examine the cross-sectional impact of innovation in developing countries by focusing on the same sector, or undertake relevant studies on the innovation of numerous sectors over an updated period.

7. Patents

This section is not required to be included, but it might be if there are patents that came about as a result of the work that was reported in this manuscript.

Author Contributions

Conceptualization, M.N.S. and K.I.; Formal analysis, M.N.S. and K.I.; Investigation, M.U.A.; Methodology, M.U.A. and M.A.A.; Software, K.I.; Supervision, M.U.A. and M.A.A.; Validation, M.U.A.; Visualization, M.U.A.; Writing—original draft, M.N.S.; Writing—review & editing, M.N.S. and M.A.A. All authors have read and agreed to the published version of the manuscript.

Funding

This research received no external funding.

Institutional Review Board Statement

Not applicable.

Informed Consent Statement

Not applicable.

Data Availability Statement

The datasets used and/or analyzed during the current study have been taken from the database (WIPO, WDI and TRAINS), and made available from the corresponding author on reasonable request.

Conflicts of Interest

The authors declare no conflict of interest.

References

  1. Bernanke, B.S. Irreversibility, Uncertainty, and Cyclical Investment. Q. J. Econ. 1983, 98, 85–106. [Google Scholar] [CrossRef] [Green Version]
  2. Dixit, A. Entry and Exit Decisions under Uncertainty. J. Political Econ. 1989, 97, 620–638. [Google Scholar] [CrossRef]
  3. Dixit, A.K.; Pindyck, R.S. Investment under Uncertainty, 1st ed.; Princeton university Press: Princeton, NJ, USA, 1994; Available online: https://press.princeton.edu/books/hardcover/9780691034102/investment-under-uncertain (accessed on 15 November 2022).
  4. Rodrik, D. Policy uncertainty and private investment in developing countries. J. Dev. Econ. 1991, 36, 229–242. [Google Scholar] [CrossRef] [Green Version]
  5. Baker, S.R.; Bloom, N.; Davis, S.J. Measuring Economic Policy Uncertainty. Q. J. Econ. 2016, 131, 1593–1636. [Google Scholar] [CrossRef]
  6. Gulen, H.; Ion, M. Policy Uncertainty and Corporate Investment. Rev. Financ. Stud. 2015, 29, 523–564. [Google Scholar] [CrossRef] [Green Version]
  7. Handley, K.; Limão, N. Nber Working Paper Series Trade and Investment Under Policy Uncertainty: Theory and Firm Evidence. 2012. Available online: https://www.aeaweb.org/articles?id=10.1257/pol.20140068 (accessed on 15 June 2012).
  8. Julio, B.; Yook, Y. Policy uncertainty, irreversibility, and cross-border flows of capital. J. Int. Econ. 2016, 103, 13–26. [Google Scholar] [CrossRef] [Green Version]
  9. Koijen, R.S.J.; Philipson, T.J.; Uhlig, H. Financial Health Economics. Econometrica 2016, 84, 195–242. [Google Scholar] [CrossRef] [Green Version]
  10. Handley, K.; Limão, N. Trade and Investment under Policy Uncertainty: Theory and Firm Evidence. Am. Econ. J. Econ. Policy 2012, 7, 189–222. [Google Scholar] [CrossRef] [Green Version]
  11. Coelli, F.; Moxnes, A.; Ulltveit-Moe, K.H. Better, Faster, Stronger: Global Innovation and Trade Liberalization. Rev. Econ. Stat. 2016, 1–42. [Google Scholar] [CrossRef]
  12. Amiti, M.; Dai, M.; Feenstra, R.C.; Romalis, J. How Did China’s WTO Entry Benefit US Consumers? 2017. Available online: https://www.nber.org/system/files/working_papers/w23487/revisions/w23487.rev0.pdf?sy=487 (accessed on 2 October 2022).
  13. Coelli, F. Trade Policy Uncertainty and Innovation: Evidence from China. 2018. Available online: https://papers.ssrn.com/sol3/papers.cfm?abstract_id=4169514 (accessed on 2 October 2022).
  14. Cutler, D. Technology, Health Costs, and the NIH. NIH Roundtable Econ. 1995; prepared. [Google Scholar]
  15. Fuchs, V. Economics, Values, and Health Care Reform. Am. Econ. Rev. 1996, 86, 1–24. [Google Scholar] [PubMed]
  16. Newhouse, J.P. Medical Care Costs: How Much Welfare Loss? J. Econ. Perspect. 1992, 6, 3–21. [Google Scholar] [CrossRef] [PubMed] [Green Version]
  17. Becker, G.S.; Philipson, T.J.; Soares, R.R. The Quantity and Quality of Life and the Evolution of World Inequality. Am. Econ. Rev. 2005, 95, 277–291. [Google Scholar] [CrossRef] [PubMed] [Green Version]
  18. Murphy, K.M.; Topel, R.H. The Value of Health and Longevity. J. Political Econ. 2006, 114, 871–904. [Google Scholar] [CrossRef] [Green Version]
  19. Egan, M.; Philipson, T.J. International Health Economics (19280). 2013. Available online: https://www.nber.org/papers/w19280 (accessed on 1 March 2013).
  20. Hammar, N.; Belarbi, Y. R&D, innovation and productivity relationships: Evidence from threshold panel model. Int. J. Innov. Stud. 2021, 5, 113–126. [Google Scholar] [CrossRef]
  21. Subedi, S.P. Declaration on the Right to Development—Main Page. 1986. Available online: https://legal.un.org/avl/ha/drd/drd.html (accessed on 1 June 1986).
  22. Ebner, D.; Rupert, D.; Baumgartner, R. The relationship between sustainable development and corporate social responsibility. In Corporate Responsibility Research Conference (CRRC); Queens University: Kingston, ON, Canada, 2006. [Google Scholar]
  23. Keiner, M. Re-emphasizing sustainable development? The concept of Evolutionability? Environ. Dev. Sustain. 2005, 6, 379–392. [Google Scholar] [CrossRef]
  24. Carson, R. Silent Spring, Anniversary edition ed.; Mariner Books: Boston, MA, USA, 1962. [Google Scholar]
  25. Thoreau, H.D. Walden; Houghton Mifflin: Boston, MA, USA, 1854. [Google Scholar]
  26. Garren, S.J.; Brinkmann, R. Sustainability Definitions, Historical Context, and Frameworks. In The Palgrave Handbook of Sustainability: Case Studies and Practical Solutions; Brinkmann, R., Garren, S.J., Eds.; Springer International Publishing: Cham, Switzerland; Berlin, Germany,, 2018; pp. 6–10. [Google Scholar]
  27. Caggiano, G.; Castelnuovo, E.; Kima, R. The global effects of Covid-19-induced uncertainty. Econ. Lett. 2020, 194, 109392. [Google Scholar] [CrossRef]
  28. Fauci, A.S.; Lane, H.C.; Redfield, R.R. Covid-19—Navigating the Uncharted. N. Engl. J. Med. 2020, 382, 1268–1269. [Google Scholar] [CrossRef]
  29. Corey, B.L.; Mascola, J.R.; Fauci, A.S.; Collins, F.S. A strategic approach to COVID-19 vaccine R&D. Science 2020, 368, 948–950. [Google Scholar] [CrossRef]
  30. Gates, B. Responding to Covid-19—A Once-in-a-Century Pandemic? N. Engl. J. Med. 2020, 382, 1677–1679. [Google Scholar] [CrossRef]
  31. Qiu, J.; Shen, B.; Zhao, M.; Wang, Z.; Xie, B.; Xu, Y. A nationwide survey of psychological distress among Chinese people in the COVID-19 epidemic: Implications and policy recommendations. Gen. Psychiatry 2020, 33, e100213. [Google Scholar] [CrossRef] [PubMed]
  32. Baker, S.R.; Bloom, N.; Davis, S.J.; Terry, S.J. COVID-Induced Economic Uncertainty (26983). 2020. Available online: https://ideas.repec.org/p/nbr/nberwo/26983.html (accessed on 2 March 2020).
  33. Sharif, A.; Aloui, C.; Yarovaya, L. COVID-19 pandemic, oil prices, stock market, geopolitical risk and policy uncertainty nexus in the US economy: Fresh evidence from the wavelet-based approach. Int. Rev. Financ. Anal. 2020, 70, 101496. [Google Scholar] [CrossRef]
  34. Chu, J.; Fang, J. Economic policy uncertainty and firms’ labor investment decision. China Finance Rev. Int. 2020; ahead-of-print. [Google Scholar] [CrossRef]
  35. Guo, Y.-R.; Cao, Q.-D.; Hong, Z.-S.; Tan, Y.-Y.; Chen, S.-D.; Jin, H.-J.; Tan, K.-S.; Wang, D.-Y.; Yan, Y. The origin, transmission and clinical therapies on coronavirus disease 2019 (COVID-19) outbreak—An update on the status. Mil. Med. Res. 2020, 7, 11. [Google Scholar] [CrossRef] [PubMed] [Green Version]
  36. Baker, S.R.; Bloom, N.; Davis, S.J.; Kost, K.; Sammon, M.; Viratyosin, T. The Unprecedented Stock Market Reaction to COVID-19. Rev. Asset Pricing Stud. 2020, 10, 742–758. [Google Scholar] [CrossRef]
  37. Handley, K.; Limão, N. Trade and Investment under Policy Uncertainty: Theory and Firm Evidence. World Sci. Stud. Int. Econ. 2018, 70, 89–122. [Google Scholar]
  38. Bustos, P. Trade Liberalization, Exports, and Technology Upgrading: Evidence on the Impact of MERCOSUR on Argentinian Firms. Am. Econ. Rev. 2011, 101, 304–340. [Google Scholar] [CrossRef]
  39. Handley, K.; Limão, N. Policy Uncertainty, Trade, and Welfare: Theory and Evidence for China and the United States. In World Scientific Studies in International Economics; World Scientific: Singapore, 2018; Volume 70, pp. 123–175. [Google Scholar] [CrossRef] [Green Version]
  40. Bloom, N. The Impact of Uncertainty Shocks. Econometrica 2009, 77, 623–685. [Google Scholar] [CrossRef] [Green Version]
  41. Bloom, N. Fluctuations in uncertainty. Vopr. Èkon. 2016, 4, 30–55. [Google Scholar] [CrossRef]
  42. Bloom, N.; Floetotto, M.; Jaimovich, N.; Saporta-Eksten, I.; Terry, S.J. Really Uncertain Business Cycles. Econometrica 2018, 86, 1031–1065. [Google Scholar] [CrossRef]
  43. Guiso, L.; Parigi, G. Investment And Demand Uncertainty. Q. J. Econ. 1999, 114, 185–227. [Google Scholar] [CrossRef]
  44. Fernández-Villaverde, J.; Guerrón-Quintana, P.; Kuester, K.; Rubio-Ramírez, J. Fiscal Volatility Shocks and Economic Activity. SSRN Electron. J. 2011, 105, 3352–3384. [Google Scholar] [CrossRef] [Green Version]
  45. Handley, K.; Limão, N. Policy Uncertainty, Trade, and Welfare: Theory and Evidence for China and the United States. Am. Econ. Rev. 2017, 107, 2731–2783. [Google Scholar] [CrossRef] [Green Version]
  46. Atkeson, A.; Burstein, A.T. Innovation, firm dynamics, and international trade. J. Political Econ. 2010, 118, 433–484. [Google Scholar] [CrossRef] [Green Version]
  47. Costantini, J.A.; Melitz, M.J. The Dynamics of Firm-Level Adjustment to Trade Liberalization. In The Organization of Firms in a Global Economy; Harvard University Press: Cambridge, MA, USA, 2009; pp. 107–141. [Google Scholar]
  48. Lileeva, A.; Trefler, D. Improved Access to Foreign Markets Raises Plant-Level Productivity… for Some Plants. Q. J. Econ. 2010, 125, 1051–1099. [Google Scholar] [CrossRef] [Green Version]
  49. Bernard, A.; Jensen, J. Exceptional exporter performance: Cause, effect, or both? J. Int. Econ. 1999, 47, 1–25. [Google Scholar] [CrossRef] [Green Version]
  50. Van Biesebroeck, J. Exporting raises productivity in sub-Saharan African manufacturing firms. J. Int. Econ. 2005, 67, 373–391. [Google Scholar] [CrossRef]
  51. Clerides, S.; Lach, S.; Tybout, J.R. Is Learning by Exporting Important? Micro-Dynamic Evidence from Colombia, Mexico, and Morocco. Q. J. Econ. 1998, 113, 903–947. [Google Scholar] [CrossRef] [Green Version]
  52. De Loecker, J. Do exports generate higher productivity? Evidence from Slovenia. J. Int. Econ. 2007, 73, 69–98. [Google Scholar] [CrossRef] [Green Version]
  53. Yan, H.; Xiao, W.; Deng, Q.; Xiong, S. Analysis of the Impact of U.S. Trade Policy Uncertainty on China Based on Bayesian VAR Model. J. Math. 2022, 2022, 1–8. [Google Scholar] [CrossRef]
  54. Bustos, P. The impact of trade Liberalization on skill upgrading: Evidence from Argentina Firms. CREI, 2007; Unpublished. [Google Scholar]
  55. Demers-Payette, O.; Lehoux, P.; Daudelin, G. Responsible research and innovation: A productive model for the future of medical innovation. J. Responsible Innov. 2016, 3, 188–208. [Google Scholar] [CrossRef]
  56. Abedi, S.; Moeenian, M. Investigating the effects of environmental patents and climate change mitigation technologies on sustainable economic growth in the Middle East. Int. J. Low-Carbon Technol. 2021, 16, 910–920. [Google Scholar] [CrossRef]
  57. Khan, K.; Liu, S.; Xiong, B.; Zhang, L.; Li, C. Innovation to Immune: Empirical Evidence from COVID-19 Focused Enterprise Surveys. Front. Psychol. 2022, 13, 850842. [Google Scholar] [CrossRef] [PubMed]
  58. Shea, J. What Do Technology Shocks Do? 1999. Available online: https://econpapers.repec.org/bookchap/nbrnberch/11249.htm (accessed on 15 April 1999).
  59. Griliches, Z. Patent Statistics as Economic Indicators: A Survey. 1998. Available online: http://www.jstor.org.eur.idm.oclc.org/stable/2727442 (accessed on 1 December 1998).
  60. Kortum, S.; Lerner, J. Stronger protection or technological revolution: What is behind the recent surge in patenting? Carnegie-Rochester Conf. Ser. Public Policy 1998, 48, 247–304. [Google Scholar] [CrossRef] [Green Version]
  61. Geels, F.W. Technological transitions as evolutionary reconfiguration processes: A multi-level perspective and a case-study. Res. Policy 2002, 31, 1257–1274. [Google Scholar] [CrossRef] [Green Version]
  62. Driel, H.V.; Schot, J. Radical Innovation as a Multilevel Process: Introducing Floating Grain Elevators in the Port of Rotterdam. Technol. Cult. 2005, 46, 51–76. [Google Scholar] [CrossRef] [Green Version]
  63. Kelly, B.; Papanikolaou, D.; Seru, A.; Taddy, M. Measuring Technological Innovation over the Long Run. Am. Econ. Rev. Insights 2021, 3, 303–320. [Google Scholar] [CrossRef]
  64. Taalbi, J. Innovation in the long run: Perspectives on technological transitions in Sweden 1908–2016. Environ. Innov. Soc. Transit. 2021, 40, 222–248. [Google Scholar] [CrossRef]
  65. Pierce, J.R.; Schott, P.K. The Surprisingly Swift Decline of US Manufacturing Employment. Am. Econ. Rev. 2016, 106, 1632–1662. [Google Scholar] [CrossRef] [Green Version]
  66. Coelli, F.; Moxnes, A.; Ulltveit-Moe, K.H. The Impact of Trade Policy on Innovation: Evidence from Patent Data. 2016. Available online: https://www.freit.org/WorkingPapers/Papers/FirmLevelTrade/FREIT1063.pdf (accessed on 13 October 2022).
  67. Lybbert, T.J.; Zolas, N.J. Getting patents and economic data to speak to each other: An ‘Algorithmic Links with Probabilities’ approach for joint analyses of patenting and economic activity. Res. Policy 2014, 43, 530–542. [Google Scholar] [CrossRef] [Green Version]
  68. Santana, N.B.; Mariano, E.; Camioto, F.D.C.; Rebelatto, D.A.N. National innovative capacity as determinant in sustainable development: A comparison between the BRICS and G7 countries. Int. J. Innov. Sustain. Dev. 2015, 9, 384. [Google Scholar] [CrossRef]
  69. Azuh, D.E.; Ejemeyovwi, J.O.; Adiat, Q.; Ayanda, B.A. Innovation and Human Development Perspectives in West Africa. SAGE Open 2020, 10, 2158244020983277. [Google Scholar] [CrossRef]
  70. Johansen, S.; Juselius, K. Maximum Likelihood Estimation and Inference on Cointegration—With Applications to the Demand for Money. Oxf. Bull. Econ. Stat. 1990, 52, 169–210. [Google Scholar] [CrossRef]
  71. Johansen, S. A Statistical Analysis of Cointegration for I(2) Variables. Econom. Theory 1995, 11, 25–59. [Google Scholar] [CrossRef]
  72. Snow, J. On the Mode of Communication of Cholera; John Churchill: Bridport, UK, 1855. [Google Scholar]
  73. Card, D.; Krueger, A.B. Minimum Wages and Employment: A Case Study of the Fast-Food Industry in New Jersey and Pennsylvania: Reply. Am. Econ. Rev. 2000, 90, 1397–1420. [Google Scholar] [CrossRef]
  74. Meyer, B.; Viscusi, W.K.; Durbin, D. Workers’ Compensation and Injury Duration: Evidence from a Natural Experiment. Am. Econ. Rev. 1995, 85, 322–340. [Google Scholar] [CrossRef]
  75. Bertrand, M.; Duflo, E.; Mullainathan, S. How Much Should We Trust Differences-In-Differences Estimates? Q. J. Econ. 2004, 119, 249–275. [Google Scholar] [CrossRef] [Green Version]
  76. Levine, R. Financial Development and Economic Growth: Views and Agenda. J. Econ. Lit. 1997, 35, 688–726. [Google Scholar] [CrossRef] [Green Version]
  77. Gujarati, D.N.; Porter, D.C. Basic Econometrics; McGraw-Hill Irwin: New York, NY, USA, 2009. [Google Scholar]
  78. Hendry, D.; Pagan, A.; Sargan, J. Dynamic Specification. 1984. Available online: https://econpapers.repec.org/bookchap/eeeecochp/2-18.htm (accessed on 1 June 1984).
  79. Wickens, M.R.; Breusch, T.S. Dynamic Specification, the Long-Run and The Estimation of Transformed Regression Models. Econ. J. 1988, 98, 189. [Google Scholar] [CrossRef]
  80. Phillips, P.C.B.; Loretan, M. Estimating Long-Run Economic Equilibria. Rev. Econ. Stud. 1991, 58, 407–436. [Google Scholar] [CrossRef] [Green Version]
  81. Pesaran, M.H.; Shin, Y.; Smith, R.P. Pooled Mean Group Estimation of Dynamic Heterogeneous Panels. J. Am. Stat. Assoc. 1999, 94, 621. [Google Scholar] [CrossRef]
  82. Im, K.S.; Pesaran, M.; Shin, Y. Testing for unit roots in heterogeneous panels. J. Econ. 2003, 115, 53–74. [Google Scholar] [CrossRef]
  83. Westerlund, J. Testing for Error Correction in Panel Data. Oxf. Bull. Econ. Stat. 2007, 69, 709–748. [Google Scholar] [CrossRef] [Green Version]
  84. Shen, H.; Hou, F. Trade policy uncertainty and corporate innovation evidence from Chinese listed firms in new energy vehicle industry. Energy Econ. 2021, 97, 105217. [Google Scholar] [CrossRef]
  85. Perez-Melo, S.; Kibria, B.M.G. On Some Test Statistics for Testing the Regression Coefficients in Presence of Multicollinearity: A Simulation Study. Stats 2020, 3, 40–55. [Google Scholar] [CrossRef] [Green Version]
  86. Borojo, D.G.; Yushi, J.; Miao, M.; Liu, Y. The impacts of trade policy uncertainty on trade flow of emerging economies and low-income developing countries. Econ. Res. Ekon. Istraživanja 2022, 1–21. [Google Scholar] [CrossRef]
  87. Griliches, Z. Patent Statistics as Economic Indicators: A Survey. J. Econ. Lit. 1990, 28, 1661–1707. [Google Scholar]
  88. Dong, Y.; Wei, Z.; Liu, T.; Xing, X. The Impact of R&D Intensity on the Innovation Performance of Artificial Intelligence Enterprises-Based on the Moderating Effect of Patent Portfolio. Sustainability 2020, 13, 328. [Google Scholar] [CrossRef]
  89. Ulku, H. R&D, Innovation, and Economic Growth: An Empirical Analysis. 2004. Available online: https://papers.ssrn.com/sol3/papers.cfm?abstract_id=879010 (accessed on 2 October 2022).
  90. Silva, P.; Moreira, A.C. The Relationship between Culture and Human Development: An Analysis through the Lens of Innovation and Corruption. In Recent Advances in the Roles of Cultural and Personal Values in Organizational Behavior; IGI Global: Hershey, AR, USA, 2020; pp. 187–212. [Google Scholar]
  91. Mensah, C.N.; Long, X.; Boamah, K.B.; Bediako, I.A.; Dauda, L.; Salman, M. The effect of innovation on CO2 emissions of OCED countries from 1990 to 2014. Environ. Sci. Pollut. Res. 2018, 25, 29678–29698. [Google Scholar] [CrossRef]
  92. Dauda, L.; Long, X.; Mensah, C.N.; Salman, M. The effects of economic growth and innovation on CO2 emissions in different regions. Environ. Sci. Pollut. Res. 2019, 26, 15028–15038. [Google Scholar] [CrossRef]
  93. Long, X.; Luo, Y.; Wu, C.; Zhang, J. The influencing factors of CO2 emission intensity of Chinese agriculture from 1997 to 2014. Environ. Sci. Pollut. Res. 2018, 25, 13093–13101. [Google Scholar] [CrossRef] [PubMed]
  94. Altıntaş, H.; Kassouri, Y. Is the environmental Kuznets Curve in Europe related to the per-capita ecological footprint or CO2 emissions? Ecol. Indic. 2020, 113, 106187. [Google Scholar] [CrossRef]
  95. Bottazzi, L.; Peri, G. The International Dynamics of R&D and Innovation in the Long Run and in the Short Run. Econ. J. 2007, 117, 486–511. [Google Scholar] [CrossRef]
  96. Koc, S.; Bulus, G.C. Testing validity of the EKC hypothesis in South Korea: Role of renewable energy and trade openness. Environ. Sci. Pollut. Res. 2020, 27, 29043–29054. [Google Scholar] [CrossRef] [PubMed]
  97. Tomaszewski, M.; Świadek, A. The impact of the economic conditions on the innovation activity of the companies from selected Balkan states. Econ. Res. Ekon. Istraživanja 2017, 30, 1896–1913. [Google Scholar] [CrossRef] [Green Version]
  98. Albino, V.; Ardito, L.; Dangelico, R.M.; Petruzzelli, A.M. Understanding the development trends of low-carbon energy technologies: A patent analysis. Appl. Energy 2014, 135, 836–854. [Google Scholar] [CrossRef]
  99. Raiser, K.; Naims, H.; Bruhn, T. Corporatization of the climate? Innovation, intellectual property rights, and patents for climate change mitigation. Energy Res. Soc. Sci. 2017, 27, 1–8. [Google Scholar] [CrossRef]
  100. Chuzhi, H.; Xianjin, H. Characteristics of Carbon Emission in China and Analysis on Its Cause. China Popul. Resour. Environ. 2008, 18, 38–42. [Google Scholar] [CrossRef]
  101. Wang, Z.; Yang, Z.; Zhang, Y.; Yin, J. Energy technology patents–CO2 emissions nexus: An empirical analysis from China. Energy Policy 2012, 42, 248–260. [Google Scholar] [CrossRef]
  102. Xia, Z.; Yu, H.; Xia, Y.; Li, W. Effects of Human Capital on Technological Innovation: A Literature Review. Int. Conf. Manag. Serv. Sci. 2011, 1–3. [Google Scholar] [CrossRef]
Figure 1. Global R&D Spend in the Medical Devices Industry.
Sustainability 15 00049 g001
Figure 2. Evolution of European Patents by Technical Field.
Sustainability 15 00049 g002
Table 1. Data Variables, Description and Expected Impact.
Variable Capacity DescriptionSourceDurationExp Sign
Patent Dependent VariableFor a set period of time, a government agency or licence offers the holder certain rights and/or title, most notably the sole power to prohibit anyone from producing, using, or creating new products.WIPO1980–2020(+)
TPU = ln ( t 2 t 1 ) Independent VariableThe TPU measures the difference between “column 2” tariffs and MFN tariffs using a weighted average log scale. So Countries not covered by NTR are commonly referred to as “Column 2” countries, meaning duty rates for products from these countries are listed in Column two of the HTS.TRAINS1980–2020(+)
R&DIndependent VariableThe funds are invested in methodical creative labor with the goal of increasing the body of known information and applying this knowledge to the development of novel practical uses.WDI1980–2020(+)
FDIControl VariableExpansion of a foreign company’s operations into a domestic market by acquiring a majority share of a domestic company.WDI1980–2020(+)
NTMControl VariableNon-tariff barriers (NTBs)/Non-tariff measures (NTMs) are forms of trade restrictions that aim to limit the import and export of goods and services without imposing tariffs.TRAINS1980–2020(+)
ImportsControl Variable Imports are the monetary value of all goods and market services that come from outside the country.WDI1980–2020(+)
Import TariffControl VariableTariffs levied on goods by the government of the country doing the importing at the point of their international border crossing; also known as customs duty.TRAINS1980–2020(−)
HDIIndependent VariableThe Human Development Index ranks countries based on life expectancy, education, and per capita income.WDI1980–2020(+)
GDPGIndependent VariableGDP growth rate (GDPG) measures economic growth. It compares one quarter’s GDP to the previous one and to the same quarter the year before.WDI1980–2020(+)
GINIIndependent VariableThe Gini index measures social inequality population. 0 (perfect equality) to 1 (extreme inequality). Higher Gini index, greater inequality.WDI1980–2020(−)
CO2Independent Variable WDI1980–2020(−)
Note: The information in this table, which covers the time period 1980–2020 on an annual basis, was compiled using information from the reputable databases WDI, WIPO, and TRAINS. The values assigned for respective variables are Patents as innovation (PAT), Trade Policy Uncertainty (TPU), Research and Development Expenditures (R&D), Foreign Direct Investment (FDI), Country’s Imports (Imp), Imports Tariff (ImpT), and Non-Tariff Measures (NTM).
Table 2. Descriptive Statistics.
VariablesObsMeanStd. Dev.MinMax
PAT19686.9262722.501697−0.5596213.39915
TPU19680.8979161.593976−4.879269.75245
R&D19681.1262751.403365−10.4996.673655
Imp19681.59460.262559−0.236282.320002
FDI19680.4320861.852886−16.67626.842958
ImpT19684.5477285.257731−16.5167.015
NTM196837.7666725.689613.1799.37
HDI19680.79083210.12689120.0120.959
GDPG1968−0.17802314.66668 −133.807339.67396
GINI196835.0391517.34996−85.3120
CO21968213839.1750227.4−550105775810
Note: This table provides descriptive data for 48 developed countries from 1980–2020, covering all selected descriptive and predictive factors, and allowing for 1968 observations.
Table 3. Correlation Matrix.
VariablesPATTPUR&DImpFDIImpTNTMHDIGDPGGINICO2
PAT1.000
TPU−0.0331.000
R&D0.306 ***0.174 ***1.000
Imp−0.380 ***0.0080.0171.000
FDI−0.022−0.037 *0.166 ***0.345 ***1.000
ImpT−0.191 ***0.133 ***−0.084 ***−0.167 ***−0.124 ***1.000
NTM0.214 ***0.065 ***0.035−0.112 ***−0.091 ***−0.062 ***1.000
HDI0.224 ***0.051**0.442 ***0.159 ***0.282 ***−0.457 ***0.056 **1.000
GDPG−0.078 ***0.202 ***0.141 ***0.120 ***0.0320.073 ***−0.116 ***0.0231.000
GINI0.043 *0.123 ***0.019−0.051 *−0.050 *0.077 ***0.084 ***−0.190 ***−0.0131.000
CO2−0.120 ***0.096 ***0.086 ***−0.0100.0290.153 ***0.033−0.075 ***0.051 **0.0071.000
Note: The interrelationships among the dependent, independent, instrumental, and control variables are displayed in the following table. Graphing the direction of a relationship between two variables is illuminating. Human Development Index (HDI), Gross Domestic Product (GDP) Growth (GDPG), Inequality Index (GINI), and Carbon Dioxide Emissions (CO2) are all correlated with sustainability elements in the table. *** p < 0.01, ** p < 0.05, * p < 0.1.
Table 4. Multicollinearity Diagnostic Test.
Models TPUR&D Imp FDIImpT NTMHDIGDPGGINICO2Mean VIF
1VIF10.9984 1
1/VIF10.9984
2VIF1.001.011.051.021.04 1.03
1/VIF0.9970.9910.9500.9770.965
3VIF1.001.011.071.031.041.03 1.03
1/VIF0.9950.9890.9390.9700.9580.971
4VIF1.011.46 1.391.101.211.371.26
1/VIF0.9880.684 0.7210.9050.8270.728
Note: The VIF test statistics are provided above; these were derived from a multicollinearity test performed on each model based on equations 5 through 8.
Table 5. Difference in Difference (DID)—Baseline Results.
Variables123456
TPU0.00495 *0.00463 *0.00485 *0.00451 *0.00556 **0.00282 **
(0.00262)(0.00262)(0.00262)(0.00262)(0.00258)(0.0152)
R&D 0.0513 ***0.0501 ***0.0470 ***0.0393 ***0.111 ***
(0.00772)(0.00771)(0.00771)(0.00761)(0.0374)
FDI 0.00128 ***0.00123 ***0.00116 ***0.000283
(0.000102)(0.000102)(0.000100)(0.000508)
Imp −0.315 ***−0.269 ***−0.529 ***
(0.0309)(0.0305)(0.165)
ImpT −0.0756 ***−0.0543 ***
(0.00207)(0.00647)
NTM 0.0193 **
(0.00753)
Observations48,21648,21648,21648,21648,21648,216
R20.1170.1190.1210.1230.1430.156
Fixed-Effectyesyesyesyesyesyes
Note: The estimate for the generalized double difference in difference across all models may be found in column (1) of this table. Here, TPU acts as an independent variable. The constant effect, the time effect, and the technology effect for each country were all accounted for, but not reported. The country’s NTM, foreign imports, foreign direct investment limitations, and import tariff statistics have all been subject to further controls. The information covers the years 1980 through 2020. In parenthesis, the standard deviation is shown. (*** p < 0.01, ** p < 0.05, * p < 0.1).
Table 6. Difference in Difference (DID)—Post PNTR Results.
Variables123456
P.TPU0.733 ***0.698 ***0.759 ***0.740 ***0.597 ***0.597 ***
(0.0245)(0.0225)(0.0226)(0.0235)(0.0224)(0.0224)
P.R&D 1.063 ***1.059 ***1.066 ***1.041 ***1.041 ***
(0.0113)(0.0113)(0.0115)(0.0109)(0.0109)
P.Imp −0.0074 ***−0.0074 ***−0.0071 ***−0.0072 ***
(0.000344)(0.000345)(0.000328)(0.000332)
P.ImpT 0.00960 ***0.0118 ***0.0118 ***
(0.00327)(0.00310)(0.00310)
P.NTM 0.0322 ***0.0322 ***
(0.000443)(0.000443)
P.FDI 0.000444
(0.000338)
Observations48,21648,21648,21648,21648,21648,216
R20.8340.8590.8610.8610.8740.874
Fixed-Effectyesyesyesyesyesyes
Note: The estimate for the generalized double difference in difference across all models may be found in column (1) of this table. The term involving the interaction of the post NTR dummy and the TPU is the independent variable. The constant effect, the time effect, and the technology effect for each country were all accounted for, but not reported. There are now stricter regulations on the country’s NTM, foreign imports, foreign direct investment, and import tariff information. The information covers the years 1980 through 2020. In parenthesis, the standard deviation is shown. (*** p < 0.01).
Table 7. Instrumental Variable (IV) Generalized Estimates.
VariablesOLSRF2SLSFS
P.TPU0.333 * 3.820 ***
(0.175) (0.548)
P.R&D0.851 ***0.767 ***0.475 ***0.131 ***
(0.0631)(0.0579)(0.0954)(0.0099)
P.NTM0.0138 ***0.0112 ***0.0223 ***0.0064 ***
(0.00238)(0.00220)(0.00413)(0.0004)
P.FDI−0.0130 ***−0.0143 ***0.00425 **−0.0007 ***
(0.00268)(0.00260)(0.00188)(0.0003)
P.ImpT−0.140 ***−0.113 ***−0.271 ***−0.0647 **
(0.0203)(0.0173)(0.0378)(0.0025)
lnτcol2 0.767 *** 0.2428 ***
(0.0579) (0.0237)
Observations1968196819681968
R20.1780.2230.65250.7362
Note: Estimates of the inverse hyperbolic sine of patents and trade policy uncertainty are shown in this table using the 2sls generalized double difference in difference method. Column 2 tariff is used to estimate TPU as an instrumental variable. The constant effect, the time effect, and the technology effect for each country were all accounted for, but not reported. Estimates in the Ordinary Least Squares (OLS), First Stage (2sls), and Reduced Form (RF) formats are presented in Columns 1–4. The country NTM, foreign imports, foreign direct investment limitations, and import tariff statistics are now subject to further controls. The information covers the years 1980 through 2020. In parenthesis, the standard deviation is shown. (*** p < 0.01, ** p < 0.05, * p < 0.1).
Table 8. Difference in Difference (DID) baseline results for sustainable development.
Variables1234
TPU0.342 ***0.323 ***0.309 ***0.288 ***
(0.0124)(0.0123)(0.0122)(0.0122)
R&D0.0600 ***0.0755 ***0.0764 ***0.0864 ***
(0.00760)(0.00741)(0.00734)(0.00733)
HDI2.693 ***0.902 ***1.167 ***0.951 ***
(0.154)(0.0423)(0.0430)(0.0442)
GDPG 0.0851 ***0.0498 ***0.0448 ***
(0.00479)(0.00491)(0.00489)
GINI −0.0165 ***−0.0157 ***
(0.000576)(0.000575)
CO2 −0.198 ***
(0.0101)
Observations48216482164821648216
R20.1250.1340.1490.156
Fixed-Effectyesyesyesyes
Note: The estimate for the generalized double difference in difference across all models may be found in column (1) of this table. Here, TPU acts as an independent variable. The constant effect, the time effect, and the technology effect for each country were all accounted for, but not reported. Additional independent variables of sustainable development have been included regarding the country’s human development index(HDI), GDP growth(GDPG), GINI index, and carbon dioxide emissions (CO2). The data span is from 1980-to 2020. Standard errors in parentheses. (*** p < 0.01).
Table 9. Long-Run and Short-Run Estimates (ARDL).
Variables123
Panel A—Long-Run Estimates
TPU4.967 ***4.3720 ***0.404 ***
(0.700)(0.8656)(0.104)
R&D1.557 ***3.9667 ***0.536 ***
(0.198)(0.1436)(0.0991)
FDI −0.7914 ***
(0.1031)
Imp 4.0532 ***
(0.3655)
ImpT −0.3257 ***
(0.0888)
HDI 0.0922 **
(0.567)
GDPG 0.0309 ***
(0.00672)
GINI −0.201 ***
(0.165)
CO2 1.401 **
(0.564)
Panel B—Short-Run Estimates
EC−0.0425−0.0078−0.142 ***
(0.0278)(0.0101)(0.0339)
D.TPU−0.005410.03010.141
(0.189)(0.0952)(0.164)
D.R&D0.0174−0.17680.357
(0.252)(0.1967)(0.292)
D.FDI 0.0082
(0.0131)
D.Imp 1.4716 **
(0.5813)
D.ImpT −0.0474 *
(0.0266)
D.HDI −0.405
(3.764)
D.GDPG 0.0463 ***
(0.00761)
D.GINI 0.960
(1.086)
D.CO2 −3.505
(5.880)
Observations192019201920
Note: Both the long- and short-term analyses conducted with the panel ARDL model are evaluated in this table. The long-term and short-term effects of the independent variables TPU and R&D spending are estimated in column 1. Long-term and short-term variations due to foreign direct investment (FDI), imports, and import tariffs are all accounted for in column 2. The information covers the years 1980 through 2020. Panel A discussed projections for the long term, whereas Panel B focused on the immediate effects. In parenthesis, the standard deviation is shown. (*** p < 0.01, ** p < 0.05, * p < 0.1).
Disclaimer/Publisher’s Note: The statements, opinions and data contained in all publications are solely those of the individual author(s) and contributor(s) and not of MDPI and/or the editor(s). MDPI and/or the editor(s) disclaim responsibility for any injury to people or property resulting from any ideas, methods, instructions or products referred to in the content.

