
Forex Investment Optimization Using Instantaneous Stochastic Gradient Ascent—Formulation of an Adaptive Machine Learning Approach

 , , and
Abstract
:1. Introduction
2. Related Work
3. The Proposed Methodology
3.1. Assumptions
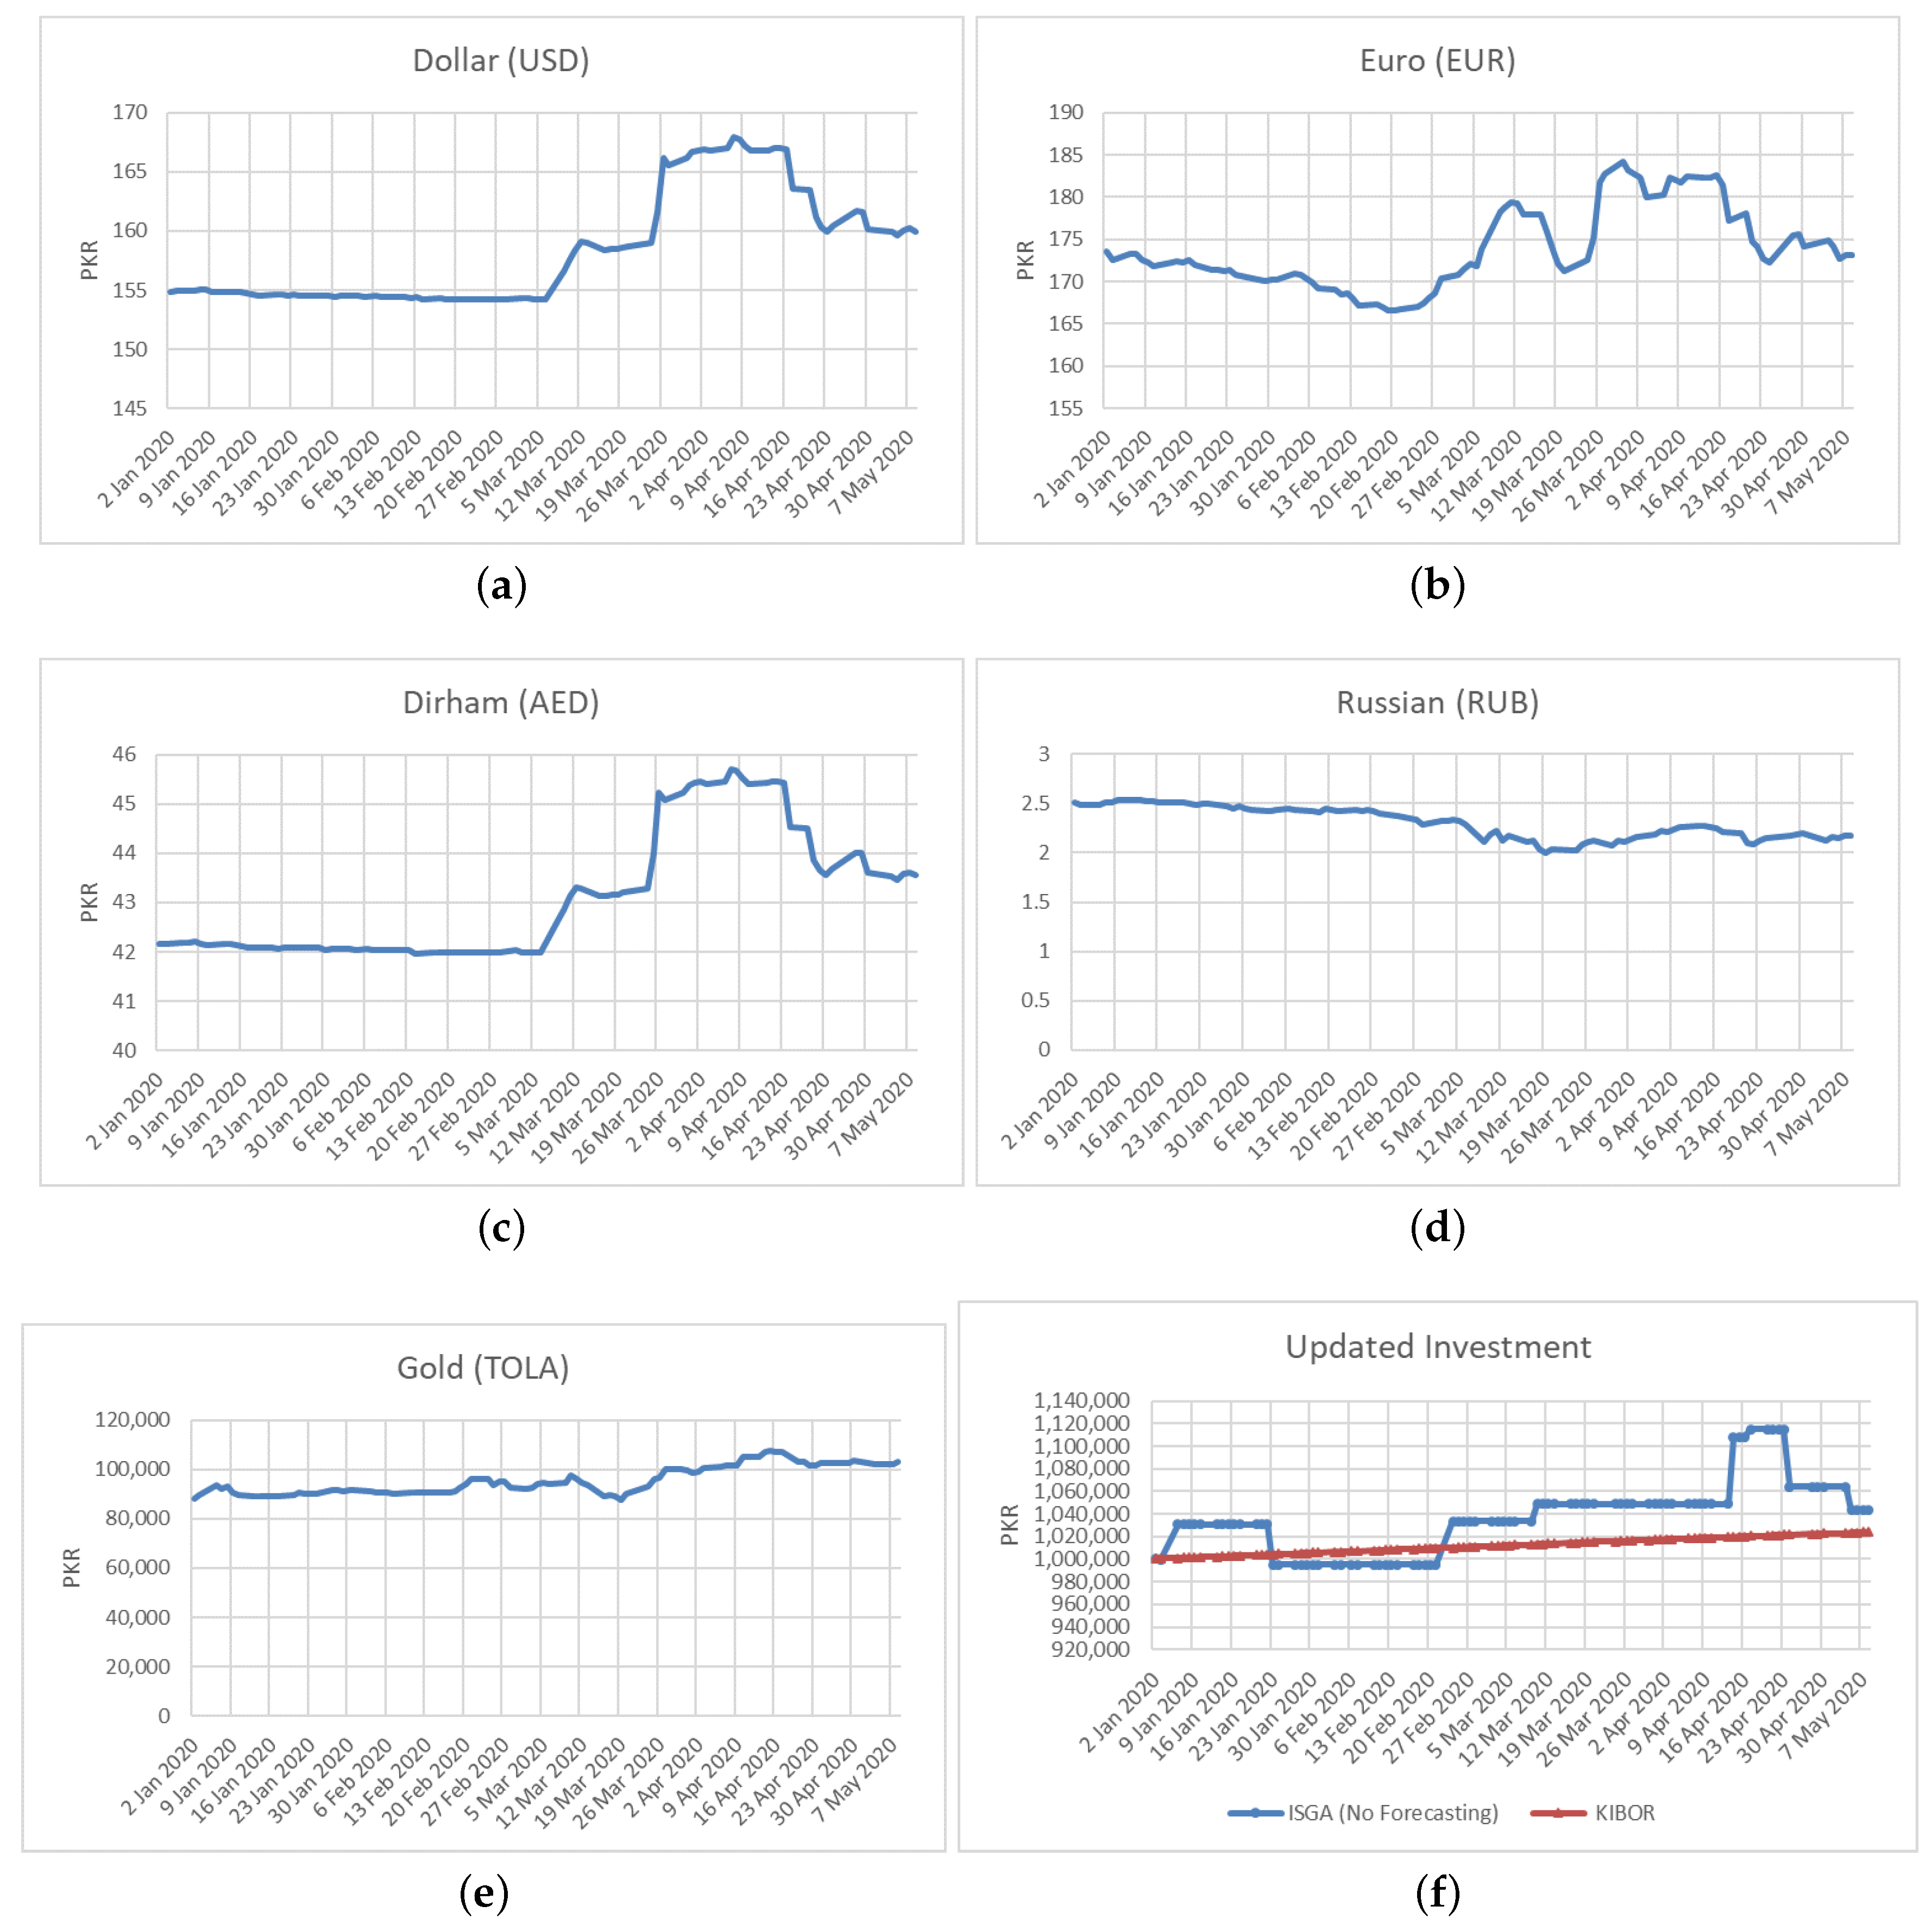
- We considered five entities (n = 5) dollar (USD), Euro (EUR), Dirham (AED), rubble (RUB), and gold for the investment strategy;
- We considered that the rates of these entities are updated once a day;
- The rates of all entities were considered for an open market;
- The rates of all entities were considered in Pakistani rupees (PKR);
- Fractional buying and purchasing of entities are possible.
3.1.1. Problem Statement
3.1.2. Problem Formulation
3.1.3. Profit Function
3.1.4. Optimization Problem
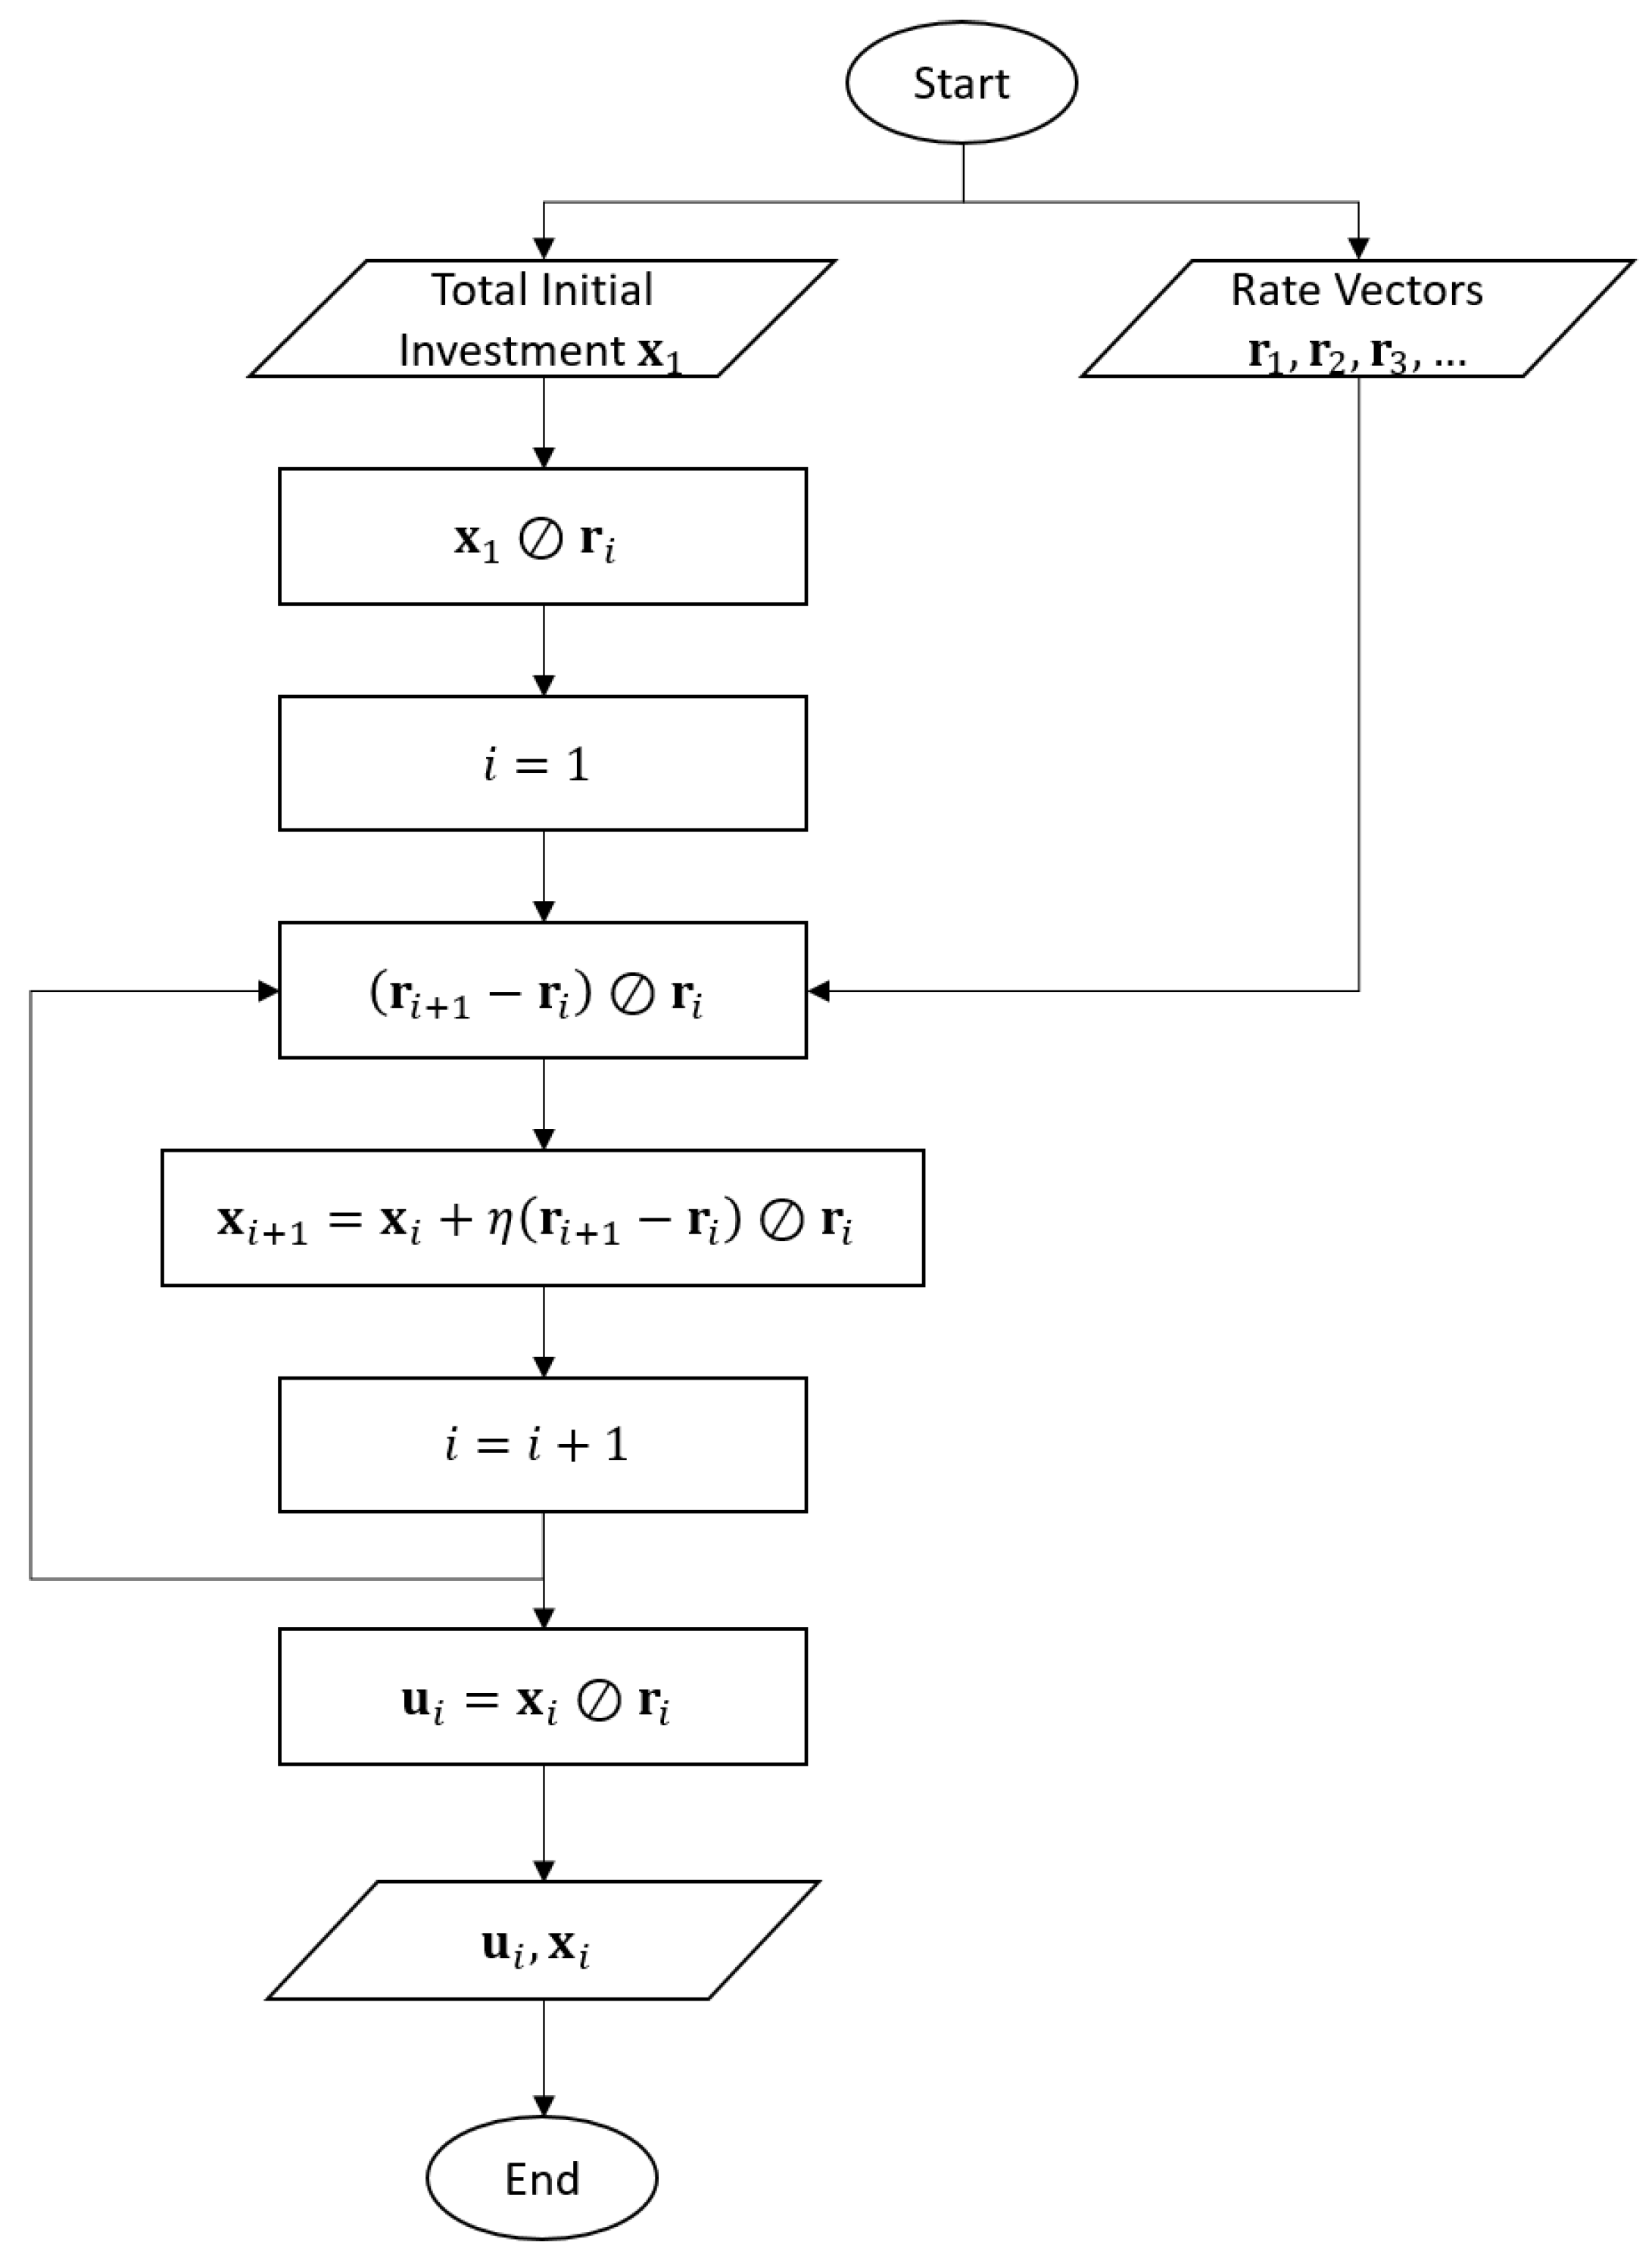
| Algorithm 1: Proposed Instantaneous Stochastic Gradient Ascent Pseudocode |
| Inputs : |
| Initial investment vector |
| Rate Vectors |
| Algorithm: |
| while (rate is being updated) |
| end |
| Output : |
4. Experiment and Results
5. Conclusions
Author Contributions
Funding
Institutional Review Board Statement
Informed Consent Statement
Data Availability Statement
Conflicts of Interest
References
- Chambers, J.; Yan, W.; Garhwal, A.; Kankanhalli, M. Currency security and forensics: A survey. Multimed. Tools Appl. 2015, 74, 4013–4043. [Google Scholar] [CrossRef] [Green Version]
- Fauzi, M.A.; Paiman, N.; Othman, Z. Bitcoin and cryptocurrency: Challenges, opportunities and future works. J. Asian Financ. Econ. Bus. 2020, 7, 695–704. [Google Scholar] [CrossRef]
- Vranken, H. Sustainability of bitcoin and blockchains. Curr. Opin. Environ. Sustain. 2017, 28, 1–9. [Google Scholar] [CrossRef] [Green Version]
- Schneider, G.; Troeger, V.E. War and the world economy: Stock market reactions to international conflicts. J. Confl. Resolut. 2006, 50, 623–645. [Google Scholar] [CrossRef]
- Mihajlovna, S.K. US-China Trade War: Possible Consequences for Russia and the World Economy; Saint Petersburg State University: St. Petersburg, Moscow, Russia, 2020. [Google Scholar]
- Hughes, D. The End of US Petrodollar Hegemony? In Proceedings of the BISA Annual Conference, Bath, UK, 12–15 June 2018. [Google Scholar]
- Taskinsoy, J. Diminishing American Power: The US-China Trade War, Sanctions, and Coronavirus. In Sanctions, and Coronavirus (August 20, 2020); Elsevier: Amsterdam, The Netherlands, 2020. [Google Scholar]
- Guo, D.; Zhou, P. The rise of a new anchor currency in RCEP? A tale of three currencies. Econ. Model. 2021, 104, 105647. [Google Scholar] [CrossRef]
- Lau, L.J. The China–US trade war and future economic relations. China World 2019, 2, 1950012. [Google Scholar] [CrossRef]
- Oosthoek, K. Flash crash for cash: Cyber threats in decentralized finance. arXiv 2021, arXiv:2106.10740. [Google Scholar]
- Grossbard, J. Justin Grossbard. 2022 Forex Statistics. Available online: https://www.compareforexbrokers.com/forex-trading/statistics/ (accessed on 25 May 2022).
- Bredin, D.; Hyde, S. FOREX Risk: Measurement and evaluation using value-at-risk. J. Bus. Financ. Account. 2004, 31, 1389–1417. [Google Scholar] [CrossRef]
- Dumas, B.; Solnik, B. The world price of foreign exchange risk. J. Financ. 1995, 50, 445–479. [Google Scholar] [CrossRef]
- Maggiori, M.; Neiman, B.; Schreger, J. The rise of the dollar and fall of the euro as international currencies. AEA Pap. Proc. 2019, 109, 521–526. [Google Scholar] [CrossRef] [Green Version]
- Siddiqui, K. The US Dollar and the World Economy; ZBW: Kiel, Germany, 2020. [Google Scholar]
- Menon, J. Dealing with multiple currencies: What options for the transitional economies of Southeast Asia? J. Asia Pac. Econ. 2008, 13, 131–146. [Google Scholar] [CrossRef]
- Craig, B.R.; Waller, C.J. Dual-currency economies as multiple-payment systems. Econ. Rev. 2000, 36, 2–13. [Google Scholar]
- Menon, J. Dealing with Dollarization: What Options for the Transitional Economies of Southeast Asia? Asian Development Bank: Mandaluyong, Philippines, 2007. [Google Scholar]
- Colacelli, M.; Blackburn, D.J. Secondary currency: An empirical analysis. J. Monet. Econ. 2009, 56, 295–308. [Google Scholar] [CrossRef]
- Voutilainen, M.; Turunen, R.; Ojala, J. Multi-currency regime and markets in early nineteenth-century Finland. Financ. Hist. Rev. 2020, 27, 115–138. [Google Scholar] [CrossRef]
- Haji, S.H.; Abdulazeez, A.M. Comparison of optimization techniques based on gradient descent algorithm: A review. PalArch’s J. Archaeol. Egypt/Egyptol. 2021, 18, 2715–2743. [Google Scholar]
- ter Ellen, S.; Verschoor, W.F.; Zwinkels, R.C. Dynamic expectation formation in the foreign exchange market. J. Int. Money Financ. 2013, 37, 75–97. [Google Scholar] [CrossRef]
- Netrapalli, P. Stochastic gradient descent and its variants in machine learning. J. Indian Inst. Sci. 2019, 99, 201–213. [Google Scholar] [CrossRef]
- Chen, Z. The impact of trade and financial expansion on volatility of real exchange rate. PLoS ONE 2022, 17, e0262230. [Google Scholar] [CrossRef]
- Sidehabi, S.W.; Tandungan, S. Statistical and machine learning approach in forex prediction based on empirical data. In Proceedings of the 2016 International Conference on Computational Intelligence and Cybernetics, Makassar, Indonesia, 22–24 November 2016; pp. 63–68. [Google Scholar]
- Mahalakshmi, G.; Sridevi, S.; Rajaram, S. A survey on forecasting of time series data. In Proceedings of the 2016 International Conference on Computing Technologies and Intelligent Data Engineering (ICCTIDE’16), Kovilpatti, India, 7–9 January 2016; pp. 1–8. [Google Scholar]
- Tseng, F.M.; Tzeng, G.H.; Yu, H.C.; Yuan, B.J. Fuzzy ARIMA model for forecasting the foreign exchange market. Fuzzy Sets Syst. 2001, 118, 9–19. [Google Scholar] [CrossRef]
- Rout, M.; Majhi, B.; Majhi, R.; Panda, G. Forecasting of currency exchange rates using an adaptive ARMA model with differential evolution based training. J. King Saud-Univ.-Comput. Inf. Sci. 2014, 26, 7–18. [Google Scholar] [CrossRef] [Green Version]
- Yura, Y.; Takayasu, H.; Nakamura, K.; Takayasu, M. Rapid detection of the switching point in a financial market structure using the particle filter. J. Stat. Comput. Simul. 2014, 84, 2073–2090. [Google Scholar] [CrossRef]
- Latif, J.; Xiao, C.; Tu, S.; Rehman, S.U.; Imran, A.; Bilal, A. Implementation and use of disease diagnosis systems for electronic medical records based on machine learning: A complete review. IEEE Access 2020, 8, 150489–150513. [Google Scholar] [CrossRef]
- Latif, J.; Xiao, C.; Imran, A.; Tu, S. Medical imaging using machine learning and deep learning algorithms: A review. In Proceedings of the 2019 2nd International Conference on Computing, Mathematics and Engineering Technologies (iCoMET), Sukkur, Pakistan, 30–31 January 2019; pp. 1–5. [Google Scholar]
- Sezer, O.B.; Gudelek, M.U.; Ozbayoglu, A.M. Financial time series forecasting with deep learning: A systematic literature review: 2005–2019. Appl. Soft Comput. 2020, 90, 106181. [Google Scholar] [CrossRef]
- Hu, Z.; Zhao, Y.; Khushi, M. A survey of forex and stock price prediction using deep learning. Appl. Syst. Innov. 2021, 4, 9. [Google Scholar] [CrossRef]
- Kim, K.J. Financial time series forecasting using support vector machines. Neurocomputing 2003, 55, 307–319. [Google Scholar] [CrossRef]
- Jaiwang, G.; Jeatrakul, P. Enhancing support vector machine model for stock trading using optimization techniques. In Proceedings of the 2018 International Conference on Digital Arts, Media and Technology (ICDAMT), Chiangrai, Thailand, 25–28 February 2018; pp. 23–28. [Google Scholar]
- Achkar, R.; Elias-Sleiman, F.; Ezzidine, H.; Haidar, N. Comparison of BPA-MLP and LSTM-RNN for stocks prediction. In Proceedings of the 2018 6th International Symposium on Computational and Business Intelligence (ISCBI), Basel, Switzerland, 27–29 August 2018; pp. 48–51. [Google Scholar]
- Jarusek, R.; Volna, E.; Kotyrba, M. FOREX rate prediction improved by Elliott waves patterns based on neural networks. Neural Netw. 2022, 145, 342–355. [Google Scholar] [CrossRef]
- Saud, A.S.; Shakya, S. Analysis of gradient descent optimization techniques with gated recurrent unit for stock price prediction: A case study on banking sector of Nepal stock exchange. J. Inst. Sci. Technol. 2019, 24, 17–21. [Google Scholar] [CrossRef] [Green Version]
- Lee, C.I.; Chang, C.H.; Hwang, F.N. Currency exchange rate prediction with long short-term memory networks based on attention and news sentiment analysis. In Proceedings of the 2019 International Conference on Technologies and Applications of Artificial Intelligence (TAAI), Beijing, China, 1–3 August 2019; pp. 1–6. [Google Scholar]
- Yong, Y.L.; Lee, Y.; Gu, X.; Angelov, P.P.; Ngo, D.C.L.; Shafipour, E. Foreign Currency Exchange Rate Prediction Using Neuro-fuzzy Systems. Available online: https://core.ac.uk/download/pdf/153320499.pdf (accessed on 1 May 2022).
- de Almeida, B.J.; Neves, R.F.; Horta, N. Combining Support Vector Machine with Genetic Algorithms to optimize investments in Forex markets with high leverage. Appl. Soft Comput. 2018, 64, 596–613. [Google Scholar] [CrossRef]
- Group, W.B. World Bank Fast-Tracks Support for COVID-19 (Coronavirus) Response to Pakistan; World Bank: Singapore, 2020. [Google Scholar]
- Bank, A.D. ADB $500 Million Loan to Help Protect Poor, Strengthen Pakistan’s COVID-19 Health and Economic Response; Asian Development Bank: Mandaluyong, Philippines, 2020. [Google Scholar]
- IMF Country Report no. 21/73 Pakistan—Ministry of Finance; IMF: Washington, DC, USA, 2021.


| Date | Dollar (USD) | Euro (EUR) | Dirham (AED) | Russian Ruble (RUB) | Gold (Tola) | Updated Proposed Investment | Updated KIBOR Investment |
|---|---|---|---|---|---|---|---|
| 2 January 20 | 154.88 | 173.64 | 42.17 | 2.51 | 88,300 | 1,000,000.00 | 1,000,273.97 |
| 3 January 20 | 154.90 | 172.61 | 42.17 | 2.49 | 89,650 | 999,268.39 | 1,000,547.95 |
| 6 January 20 | 154.96 | 173.24 | 42.19 | 2.49 | 93,400 | 1,030,970.06 | 1,000,821.92 |
| 7 January 20 | 155.01 | 173.33 | 42.20 | 2.51 | 92,100 | 1,030,970.16 | 1,001,095.89 |
| 8 January 20 | 155.08 | 172.59 | 42.22 | 2.51 | 93,000 | 1,030,970.03 | 1,001,369.86 |
| 9 January 20 | 154.89 | 172.21 | 42.17 | 2.53 | 90,500 | 1,030,970.30 | 1,001,643.84 |
| 10 January 20 | 154.83 | 171.81 | 42.15 | 2.53 | 89,800 | 1,030,970.67 | 1,001,917.81 |
| 13 January 20 | 154.85 | 172.22 | 42.16 | 2.54 | 89,000 | 1,030,970.16 | 1,002,191.78 |
| 14 January 20 | 154.85 | 172.42 | 42.16 | 2.52 | 89,200 | 1,030,969.90 | 1,002,465.75 |
| 15 January 20 | 154.78 | 172.28 | 42.14 | 2.52 | 89,000 | 1,030,969.99 | 1,002,739.73 |
| 16 January 20 | 154.66 | 172.56 | 42.11 | 2.51 | 89,000 | 1,030,969.71 | 1003,013.70 |
| 17 January 20 | 154.57 | 172.03 | 42.08 | 2.51 | 89,300 | 1,030,970.07 | 1,003,287.67 |
| 20 January 20 | 154.60 | 171.38 | 42.09 | 2.51 | 89,800 | 1,030,970.81 | 1,003,561.64 |
| 21 January 20 | 154.61 | 171.44 | 42.09 | 2.50 | 90,700 | 1,030,970.65 | 1,003,835.62 |
| 22 January 20 | 154.53 | 171.24 | 42.07 | 2.49 | 90,300 | 1,030,970.99 | 1,004,109.59 |
| 23 January 20 | 154.61 | 171.36 | 42.09 | 2.50 | 90,150 | 995,083.48 | 1,004,383.56 |
| 24 January 20 | 154.57 | 170.78 | 42.08 | 2.50 | 90,300 | 995,083.48 | 1,004,657.53 |
| 27 January 20 | 154.57 | 170.35 | 42.08 | 2.47 | 91400 | 995,083.72 | 1,004,931.51 |
| 28 January 20 | 154.57 | 170.29 | 42.08 | 2.45 | 91,400 | 995,083.78 | 1,005,205.48 |
| 29 January 20 | 154.56 | 170.05 | 42.08 | 2.47 | 90,900 | 995,084.04 | 1,005,479.45 |
| 30 January 20 | 154.47 | 170.22 | 42.05 | 2.45 | 91,400 | 995,083.82 | 1,005,753.42 |
| 31 January 20 | 154.49 | 170.28 | 42.06 | 2.44 | 91,500 | 995,083.75 | 1,006,027.40 |
| 3 February 20 | 154.51 | 170.94 | 42.07 | 2.42 | 91,100 | 995,083.04 | 1,006,301.37 |
| 4 February 20 | 154.41 | 170.75 | 42.04 | 2.44 | 90,700 | 995,083.13 | 1,006,575.34 |
| 6 February 20 | 154.49 | 169.91 | 42.06 | 2.45 | 90,750 | 995,083.62 | 1,006,849.32 |
| 7 February 20 | 154.41 | 169.28 | 42.04 | 2.43 | 90,250 | 995,084.55 | 1,007,123.29 |
| 10 February 20 | 154.43 | 169.10 | 42.04 | 2.42 | 90,450 | 995,084.91 | 1,007,397.26 |
| 11 February 20 | 154.42 | 168.55 | 42.04 | 2.41 | 90,700 | 995,086.15 | 1,007,671.23 |
| 12 February 20 | 154.36 | 168.59 | 42.03 | 2.45 | 90,600 | 995086.05 | 1,007,945.21 |
| 13 February 20 | 154.38 | 168.04 | 42.03 | 2.43 | 90,450 | 995,087.55 | 1,008,219.18 |
| 14 February 20 | 154.17 | 167.20 | 41.97 | 2.42 | 90,750 | 995,090.38 | 1,008,493.15 |
| 17 February 20 | 154.28 | 167.38 | 42.00 | 2.44 | 90,800 | 995,089.61 | 1,008,767.12 |
| 18 February 20 | 154.23 | 167.02 | 41.99 | 2.42 | 91,150 | 995,091.03 | 1,009,041.10 |
| 19 February 20 | 154.26 | 166.64 | 42.00 | 2.43 | 92,500 | 995,092.67 | 1,009,315.07 |
| 20 February 20 | 154.24 | 166.62 | 41.99 | 2.42 | 94,300 | 995,092.79 | 1,009,589.04 |
| 21 February 20 | 154.20 | 166.81 | 41.98 | 2.40 | 96,350 | 995,091.91 | 1,009,863.01 |
| 24 February 20 | 154.21 | 167.05 | 41.98 | 2.37 | 96,300 | 1033756.52 | 1,010,136.99 |
| 25 February 20 | 154.26 | 167.49 | 42.00 | 2.36 | 93650 | 1,033,756.51 | 1,010,410.96 |
| 26 February 20 | 154.25 | 168.01 | 41.99 | 2.35 | 94,975 | 1,033,756.73 | 1,010,684.93 |
| 27 February 20 | 154.21 | 168.66 | 41.98 | 2.34 | 95,200 | 1,033,757.35 | 1,010,958.90 |
| 28 February 20 | 154.23 | 170.36 | 41.99 | 2.29 | 92,500 | 1,033,760.07 | 1,011,232.88 |
| 2 March 20 | 154.37 | 170.83 | 42.03 | 2.32 | 92,300 | 1,033,761.59 | 1,011,506.85 |
| 3 March 20 | 154.29 | 171.49 | 42.00 | 2.33 | 92,400 | 1,033,764.05 | 1,011,780.82 |
| 4 March 20 | 154.21 | 172.17 | 41.98 | 2.34 | 94,100 | 1,033,767.05 | 1,012,054.79 |
| 5 March 20 | 154.27 | 171.84 | 42.00 | 2.32 | 94,800 | 1,033,765.40 | 1,012,328.77 |
| 6 March 20 | 154.24 | 173.88 | 41.99 | 2.29 | 94,100 | 1,033,775.15 | 1,012,602.74 |
| 9 March 20 | 156.58 | 178.30 | 42.63 | 2.11 | 94,500 | 1,033,805.31 | 1,012,876.71 |
| 10 March 20 | 157.45 | 178.78 | 42.87 | 2.19 | 97,400 | 1,048,680.99 | 1,013,150.68 |
| 11 March 20 | 158.42 | 179.37 | 43.13 | 2.22 | 96,300 | 1,048,681.07 | 1,013,424.66 |
| 12 March 20 | 159.13 | 179.21 | 43.32 | 2.13 | 94,500 | 1,048,681.72 | 1,013,698.63 |
| 13 March 20 | 158.98 | 177.91 | 43.28 | 2.18 | 93,600 | 1,048,680.74 | 1,013,972.60 |
| 16 March 20 | 158.41 | 177.90 | 43.13 | 2.11 | 89,000 | 1,048,679.80 | 1,014,246.58 |
| 17 March 20 | 158.43 | 175.89 | 43.13 | 2.12 | 89,500 | 1,048,681.40 | 1,014,520.55 |
| 18 March 20 | 158.52 | 173.75 | 43.16 | 2.04 | 89,300 | 1,048,687.47 | 1,014,794.52 |
| 19 March 20 | 158.58 | 172.18 | 43.17 | 2.00 | 87,500 | 1,048,695.33 | 1,015,068.49 |
| 20 March 20 | 158.68 | 171.19 | 43.20 | 2.04 | 89,900 | 1,048,701.87 | 1,015,342.47 |
| 24 March 20 | 159.01 | 172.57 | 43.29 | 2.02 | 93,200 | 1,048,691.99 | 1,015,616.44 |
| 25 March 20 | 161.61 | 175.23 | 44.00 | 2.09 | 96,100 | 1,048,680.10 | 1,015,890.41 |
| 26 March 20 | 166.13 | 181.75 | 45.23 | 2.11 | 96,600 | 1,048,677.91 | 1,016,164.38 |
| 27 March 20 | 165.54 | 182.72 | 45.07 | 2.13 | 100,100 | 1,048,675.34 | 1,016,438.36 |
| 30 March 20 | 166.14 | 184.24 | 45.23 | 2.08 | 100,100 | 1,048,686.70 | 1,016,712.33 |
| 31 March 20 | 166.70 | 183.14 | 45.38 | 2.13 | 99,500 | 1,048,685.84 | 1,016,986.30 |
| 01 April 20 | 166.83 | 182.74 | 45.42 | 2.11 | 98,500 | 1,048,685.32 | 1,017,260.27 |
| 02 April 20 | 166.93 | 182.27 | 45.45 | 2.14 | 99,300 | 1,048,684.40 | 1,017,534.25 |
| 03 April 20 | 166.77 | 179.99 | 45.40 | 2.16 | 100,600 | 1,048,674.59 | 1,017,808.22 |
| 6 April 20 | 166.99 | 180.27 | 45.46 | 2.19 | 101,300 | 1,048,677.18 | 1,018,082.19 |
| 7 April 20 | 167.90 | 182.36 | 45.71 | 2.22 | 101,700 | 1,048,689.79 | 1,018,356.16 |
| 8 April 20 | 167.76 | 182.06 | 45.67 | 2.21 | 101,500 | 1,048,687.16 | 1,018,630.14 |
| 9 April 20 | 167.19 | 181.71 | 45.52 | 2.24 | 101,600 | 1,048,679.61 | 1,018,904.11 |
| 10 April 20 | 166.79 | 182.43 | 45.41 | 2.26 | 105,200 | 1,048,677.69 | 1,019,178.08 |
| 13 April 20 | 166.83 | 182.38 | 45.42 | 2.27 | 105,100 | 1,048,677.82 | 1,019,452.05 |
| 14 April 20 | 166.95 | 182.38 | 45.45 | 2.27 | 107,200 | 1,108,154.30 | 1,019726.03 |
| 15 April 20 | 166.98 | 182.53 | 45.46 | 2.26 | 107,600 | 1,108,154.30 | 1,020,000.00 |
| 16 April 20 | 166.88 | 181.49 | 45.43 | 2.25 | 107,200 | 1,108,154.13 | 1,020,273.97 |
| 17 April 20 | 163.58 | 177.21 | 44.53 | 2.21 | 106,900 | 1,114,781.47 | 1,020,547.95 |
| 20 April 20 | 163.49 | 178.10 | 44.51 | 2.20 | 103,200 | 1,114,781.40 | 1,020,821.92 |
| 21 April 20 | 161.13 | 174.68 | 43.87 | 2.10 | 103,250 | 1,114,779.05 | 1,021,095.89 |
| 22 April 20 | 160.36 | 174.23 | 43.66 | 2.09 | 101,700 | 1,114,782.31 | 1,021,369.86 |
| 23 April 20 | 159.98 | 172.69 | 43.56 | 2.13 | 101,500 | 1,114,788.39 | 1,021,643.84 |
| 24 April 20 | 160.48 | 172.32 | 43.69 | 2.15 | 102,800 | 1,063,950.55 | 1,021,917.81 |
| 28 April 20 | 161.65 | 175.48 | 44.01 | 2.17 | 102,400 | 1,063,950.60 | 1,022,191.78 |
| 29 April 20 | 161.61 | 175.65 | 44.00 | 2.19 | 102,600 | 1,063,951.09 | 1,022,465.75 |
| 30 April 20 | 160.17 | 174.18 | 43.61 | 2.20 | 103,500 | 1,063,944.41 | 1,022,739.73 |
| 4 May 20 | 159.91 | 174.93 | 43.54 | 2.12 | 102,300 | 1,063,945.89 | 1,023,013.70 |
| 5 May 20 | 159.65 | 174.14 | 43.47 | 2.16 | 102,000 | 1,042,981.22 | 1,023,287.67 |
| 6 May 20 | 160.06 | 172.75 | 43.58 | 2.15 | 101,900 | 1,042,981.23 | 1,023,561.64 |
| 7 May 20 | 160.23 | 173.08 | 43.62 | 2.17 | 102,200 | 1,042,980.84 | 1,023,835.62 |
| 8 May 20 | 159.97 | 173.16 | 43.55 | 2.17 | 103,200 | 1,042,980.60 | 1,024,109.59 |
| Investment Strategy | ROI |
|---|---|
| Random Walk | −22.3 |
| Buy and Hold | −72.2 |
| Sell and Hold | 72.2 |
| Static Genetic Algorithm | 12.5 |
| Average SVM+GA | 43.9 |
| Best SVM+GA | 83.5 |
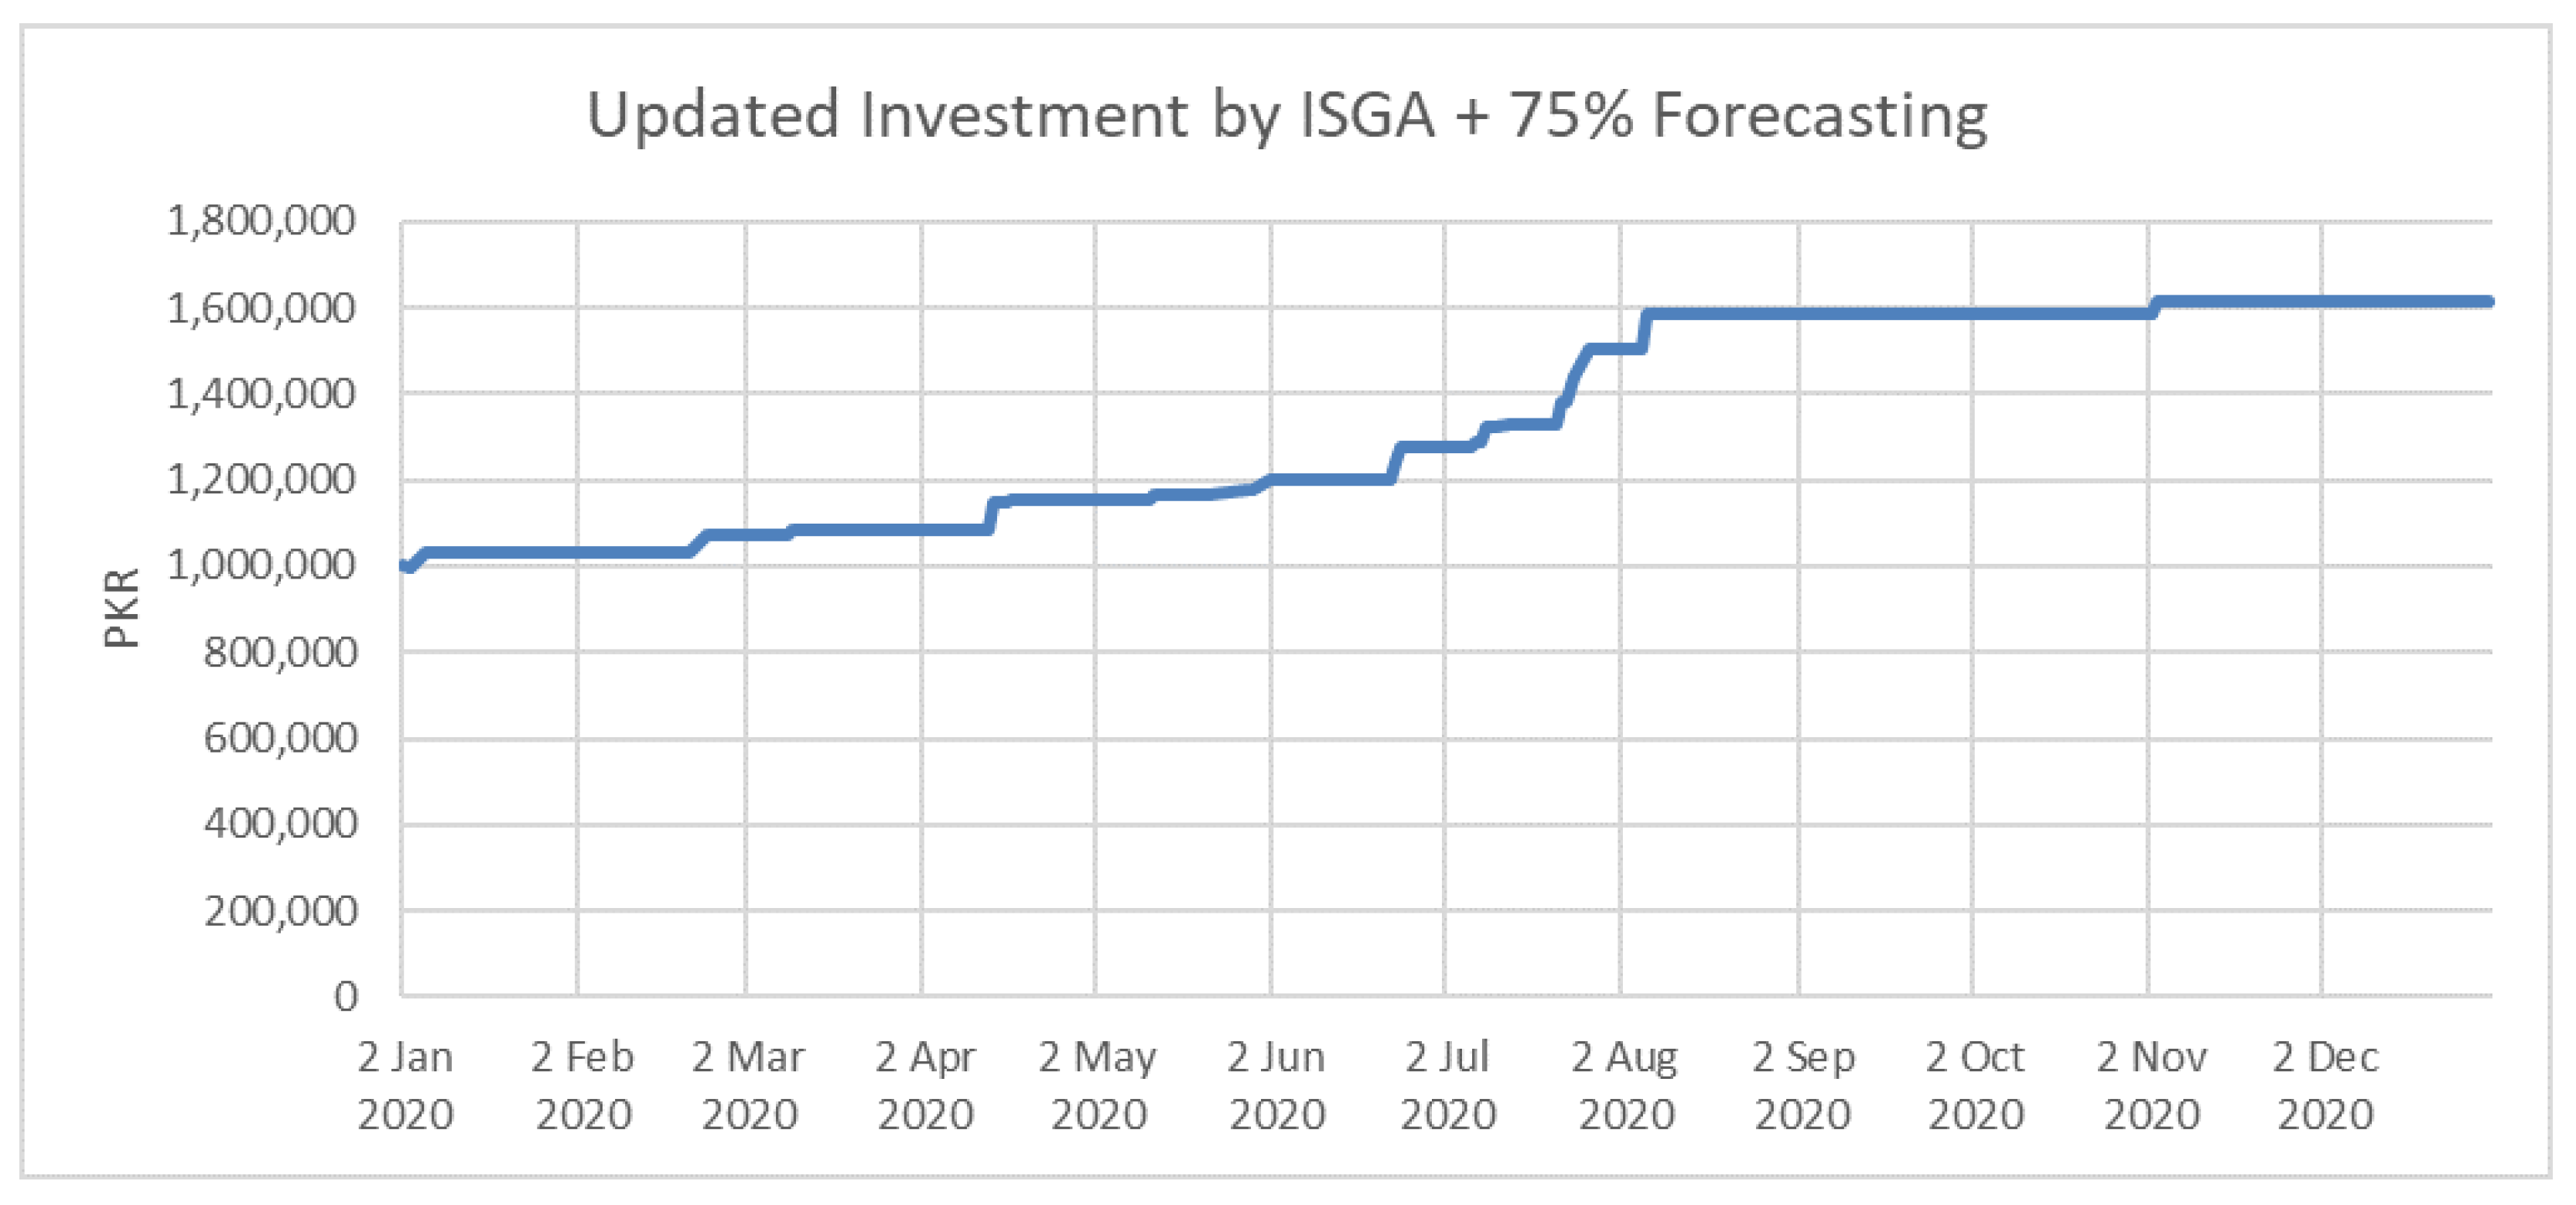
| Average Proposed ISGA + Forecasting | 80.7 |
| Best Proposed ISGA + Forecasting | 92.9 |
Publisher’s Note: MDPI stays neutral with regard to jurisdictional claims in published maps and institutional affiliations. |
© 2022 by the authors. Licensee MDPI, Basel, Switzerland. This article is an open access article distributed under the terms and conditions of the Creative Commons Attribution (CC BY) license (https://creativecommons.org/licenses/by/4.0/).
Share and Cite
Murtza, I.; Saadia, A.; Basri, R.; Imran, A.; Almuhaimeed, A.; Alzahrani, A. Forex Investment Optimization Using Instantaneous Stochastic Gradient Ascent—Formulation of an Adaptive Machine Learning Approach. Sustainability 2022, 14, 15328. https://doi.org/10.3390/su142215328
Murtza I, Saadia A, Basri R, Imran A, Almuhaimeed A, Alzahrani A. Forex Investment Optimization Using Instantaneous Stochastic Gradient Ascent—Formulation of an Adaptive Machine Learning Approach. Sustainability. 2022; 14(22):15328. https://doi.org/10.3390/su142215328
Chicago/Turabian StyleMurtza, Iqbal, Ayesha Saadia, Rabia Basri, Azhar Imran, Abdullah Almuhaimeed, and Abdulkareem Alzahrani. 2022. "Forex Investment Optimization Using Instantaneous Stochastic Gradient Ascent—Formulation of an Adaptive Machine Learning Approach" Sustainability 14, no. 22: 15328. https://doi.org/10.3390/su142215328