Article

Livelihood Sustainability of Herder Households in North Tibet, China

1
Key Laboratory of Ecosystem Network Observation and Modelling, Institute of Geographic Sciences and Natural Resources Research, Chinese Academy of Sciences, A11 Datun Road, Chaoyang District, Beijing 100101, China
2
University of Chinese Academy of Sciences, Beijing 100049, China
3
Research Institute for Global Value Chains, University of International Business and Economics, Beijing 100029, China
4
Key Laboratory for Resource Use and Environmental Remediation, Institute of Geographic Sciences and Natural Resources Research, Chinese Academy of Sciences, A11 Datun Road, Chaoyang District, Beijing 100101, China
*
Author to whom correspondence should be addressed.
Sustainability 2022, 14(9), 5166; https://doi.org/10.3390/su14095166
Submission received: 28 March 2022 / Revised: 16 April 2022 / Accepted: 22 April 2022 / Published: 25 April 2022

Abstract

:
The livelihood sustainability of rural residents has attracted a great deal of attention across the globe, especially in remote mountain areas. In this study, we interviewed 696 householders who were randomly selected from ‘Changtang’ (also called ‘North Tibet’), Tibetan Autonomous Region, China. Under the sustainable livelihood index (SLI) framework, we evaluated the livelihood sustainability of herder households and examined the differences between low- and high-sustainability groups. Our findings revealed the following: (1) The livelihood sustainability of all herder households was generally low; low-sustainability households accounted for 87.07% of the samples. (2) Social, human, and physical capitals accounted for 81.6% of the variance in the SLI of herder households. Less physical capital was the main reason for a lower SLI. (3) Compared with high-SLI households, low-SLI families were characterized by having a higher dependency on natural resources, fewer fixed assets, weaker personal ability, and less participation in social organizations. Moreover, low-sustainability households were more vulnerable to medical expenses. Our study suggests that policymakers should pay closer attention to skills training, promote livelihood diversification, and strengthen social capital security. These actions are recommended for global poverty reduction and to promote the United Nations’ Sustainable Development Goals.

1. Introduction

The livelihood sustainability of rural residents is one of the multidisciplinary hotspots in global research under climate change [1,2,3,4]. Farmer and herder livelihoods face more pressure and shocks in less-developed countries, mainly in alpine and mountain regions [5]. As one of the poorest areas in the world, the livelihood sustainability of rural communities in the Hindu Kush Himalayan (HKH) region is closely related to the achievement of the United Nations’ Sustainable Development Goals [6,7].
Developed by the Department for International Development (DFID) of the UK, the sustainable livelihood framework provides a tool for better understanding poverty at the household and community levels to assist in policy making and institutional reformation. Global changes have exacerbated the vulnerabilities of many countries and regions [8,9,10]. The HKH region is particularly exposed to climate change, with further implications for the livelihoods of its residents [11]. Therefore, it is essential to disentangle the potential unfavorable drivers of livelihood sustainability, especially in poor communities where ecosystems are vulnerable and fragile to global change [12] and residents rely highly on natural resources [11]. One study revealed that climate change and extreme events have exacerbated the instability of agro-pastoral livelihoods in countries such as sub-Saharan Africa [13]. In addition, livelihood vulnerability may show zonal differences; thus, it is usually necessary to identify vulnerable areas and their corresponding influencing factors when adopting effective adaptation strategies [14].
Herder households on the Qinghai–Tibet Plateau live on traditional animal husbandry. They have kept yaks, sheep, and goats in alpine meadows, steppes, and deserts for daily life for thousands of years [15]. However, overgrazing and climate change over the past decades have resulted in alpine grassland degradation on this plateau and have seriously limited the improvement of herder livelihoods [16]. In the Tibetan Autonomous Region of China, there were nearly 40 counties where the poverty rate (the proportion of poor residents) was about 23.7% before 2020 [17]. Based on this, the Chinese government implemented a series of policies, including “grazing exclusion by fencing”, “forage-livestock balance rewards”, “eco-compensation policy (PES)”, and “targeted poverty alleviation”, to improve herder livelihoods and conserve alpine rangelands in Tibet during the last decade [18]. Hulme and Shepherd pointed out that anti-poverty is a complex process which requires a series of specific policies that need government guidance and assistance. Many studies suggest bridging policy objectives with the livelihoods of farmers and herders in underdeveloped areas [19,20]. Research on the livelihood sustainability of herders on the Qinghai–Tibet Plateau will provide a reasonable basis for rural development in this region.
Recently, numerous findings have shown that livelihood capital endowments can directly affect households’ resilience and livelihood strategies in response to external disturbances [14,21,22]. Households with large populations, little arable land, and low incomes may be hit harder by extreme events, such as droughts [22]. Increasing financial and social capital can reduce dependence on natural resources and promote the development of non-agricultural economic activities [21]. In addition, the livelihood diversity of high-altitude mountain dwellers is lower, which seriously threatens the sustainability of farmers’ and herders’ livelihoods [23]. The International Centre for Integrated Mountain Development (ICIMOD) developed a multi-dimensional sustainable livelihood evaluation framework and incorporated a wide range of socio-economic variables that represent human, physical, natural, financial, and social capital [24]. Although livelihood capital endowments significantly influence the choice of livelihood strategies [21,25], livelihood diversity plays an essential and positive role in poverty reduction [26]. In addition, human well-being is inseparable from the environment because of its dependence on ecosystems and their services [27]. Previous studies have emphasized the vulnerability and sensitivity of livelihoods [23,25]. However, most of these studies focus on agricultural areas or semi-agricultural and semi-pastoral areas. They lack an exploration of the relationship between pastoral household livelihoods and environmental factors from the perspective of the composition and diversity of livelihood capital.
North Tibet (also called ‘Changtang’) is located in the hinterland of the Qinghai–Tibet Plateau; here, animal husbandry is an essential livelihood strategy for local herder households [28]. Research findings have indicated that the livelihoods of residents on the Tibetan Plateau have been severely affected by livelihood assets and institutional reforms [29,30]. One study in Ecuador demonstrated the importance of aligning program objectives with community conservation and livelihood goals [31]. The livelihood sustainability of herder households is still unknown under these social, ecological, and economic development (SEED) policies in north Tibet. Another understudied concern is the difference and imbalance of herders’ livelihood under these policies. The sustainability of pastoral livelihoods in pastoral areas can only be fully understood if we can achieve a win-win situation of livelihood sustainability and sustainable development. In this study, we conducted a detailed survey in 2019 to answer the following two questions: (1) how sustainable is the current livelihood of herder households? and (2) what factors affect their livelihood sustainability in north Tibet?

2. Materials and Methods
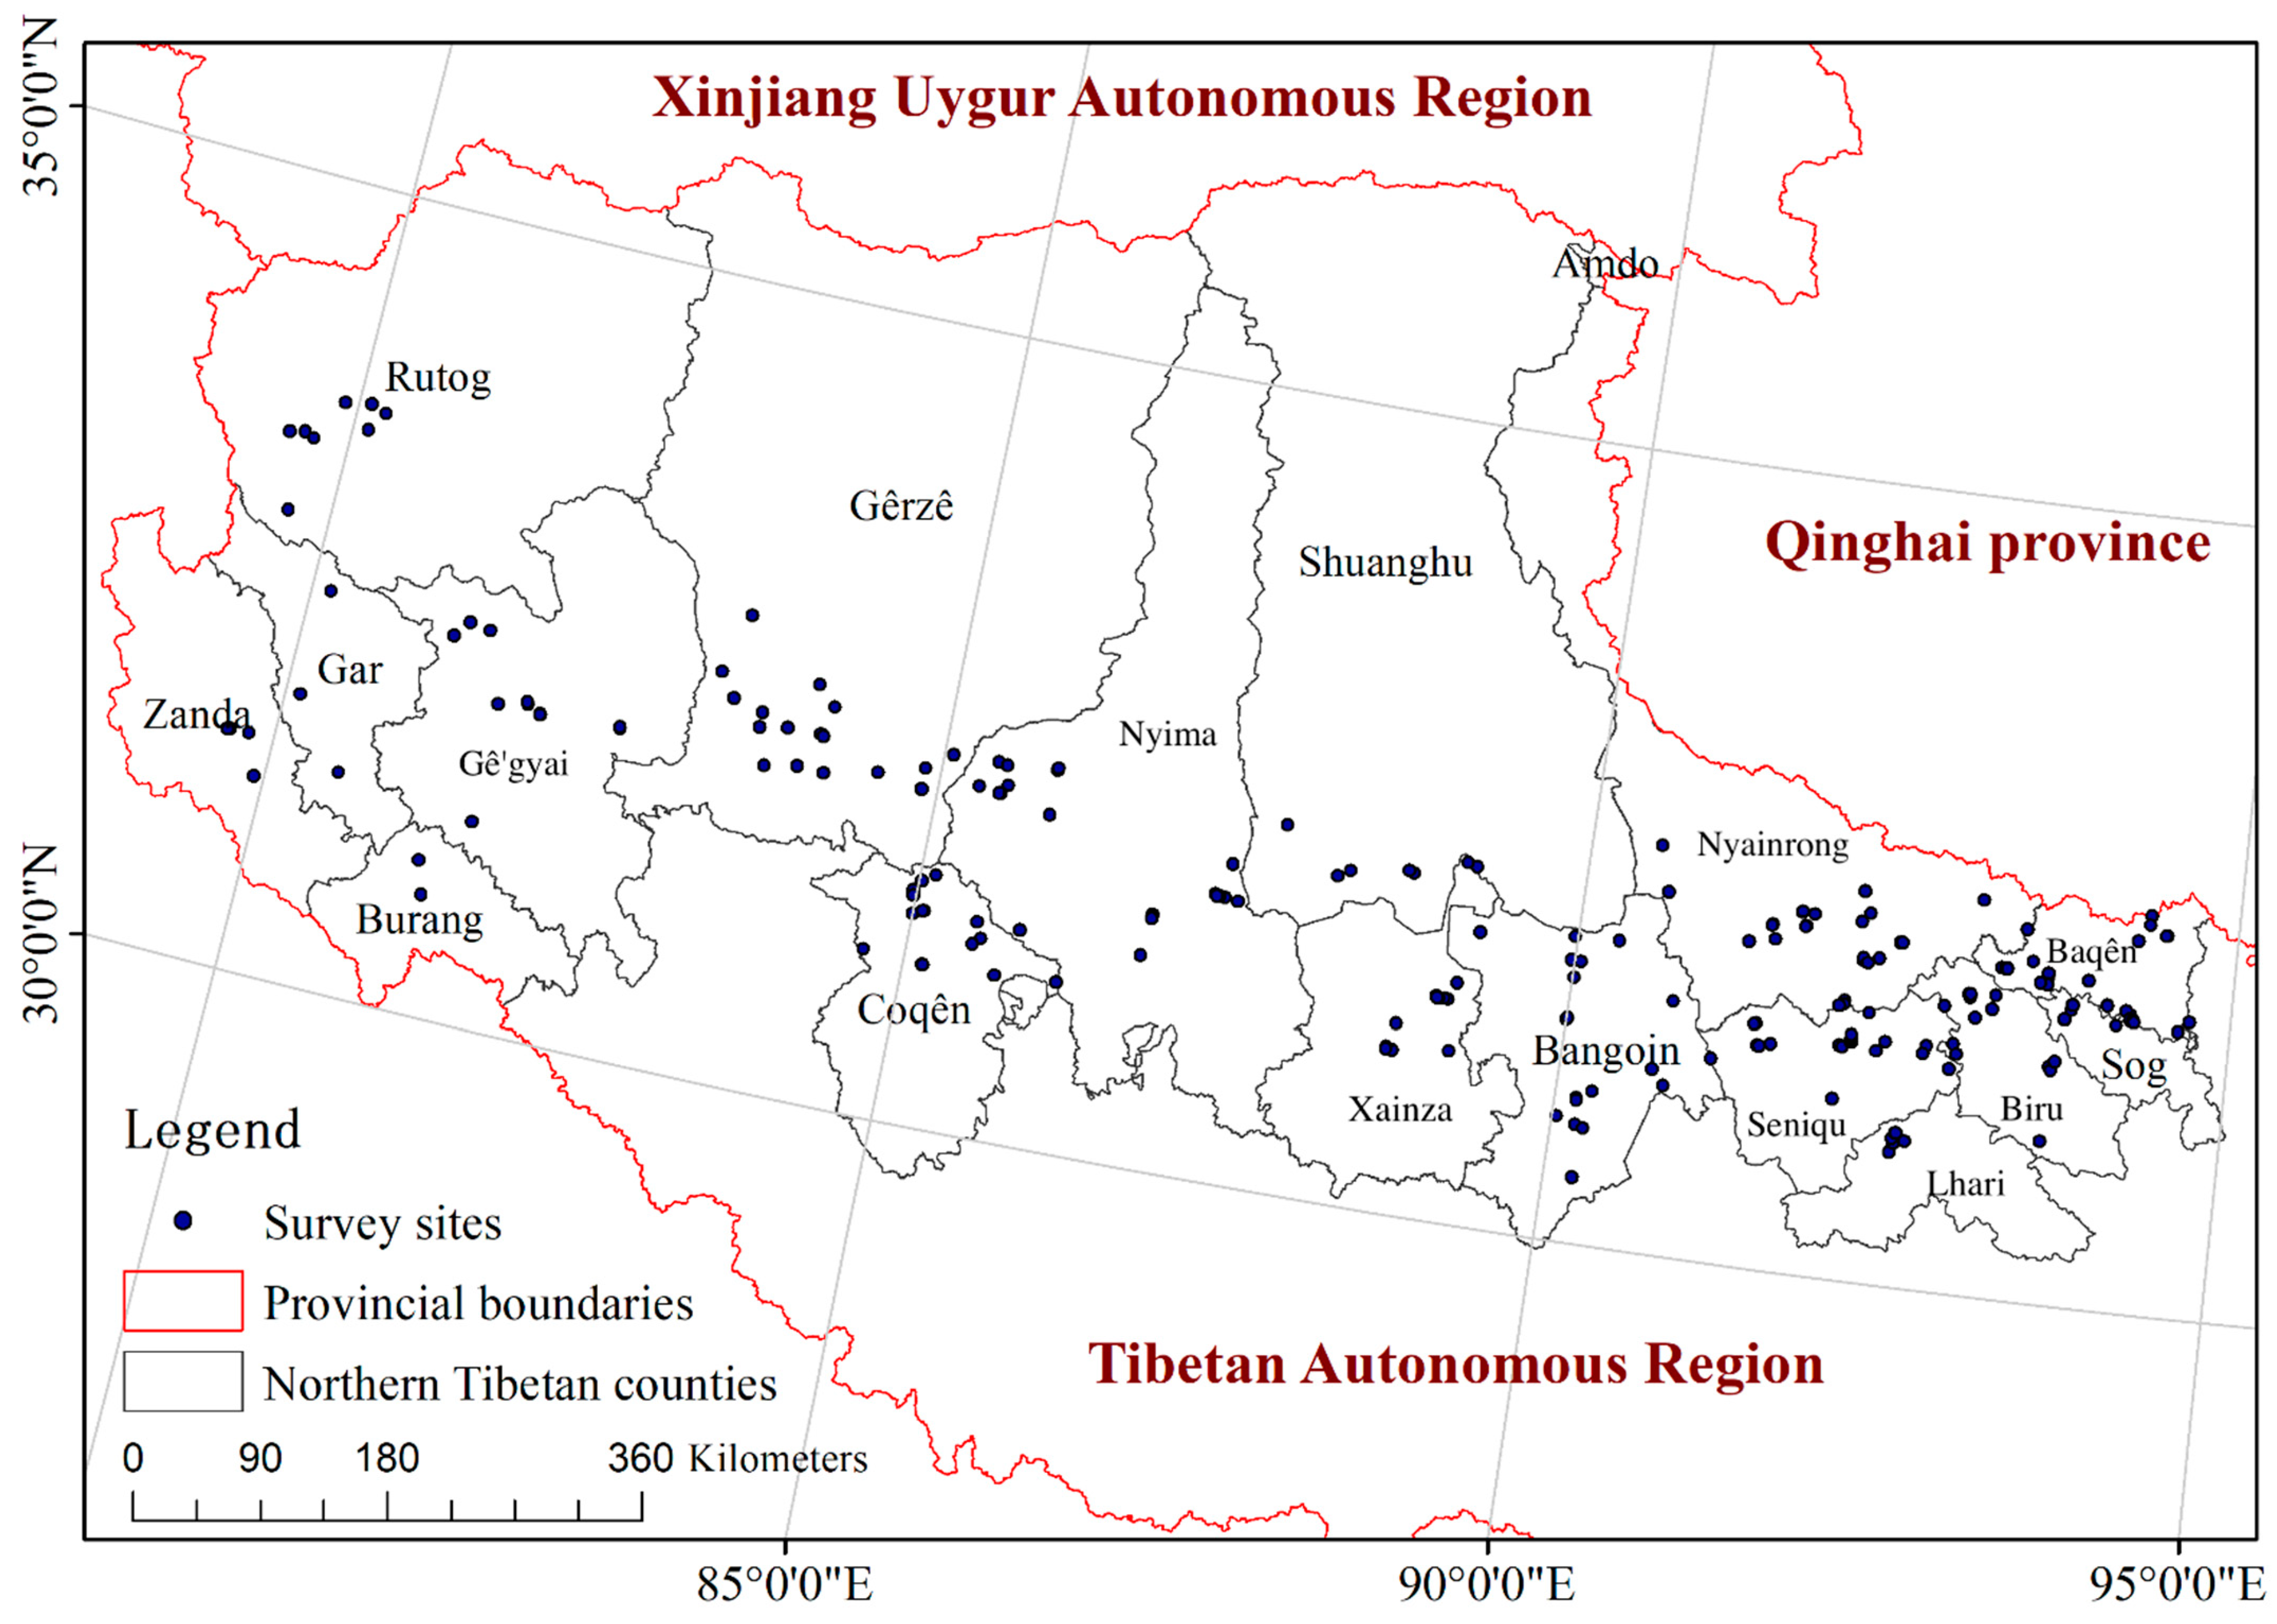
2.1. Study Area

North Tibet covers an area of 595 thousand km2, with an average altitude of over 4500 m. The mean annual temperature is below 0 °C, and the mean annual precipitation ranges from 100 to 300 mm (Figure 1) [32]. The total population of north Tibet increased from 83,900 in 1958 to 634,100 by the end of 2019. The primary livelihood of local herders is livestock production, which accounts for 66.06%. Therefore, north Tibet represents one of the most typical alpine pastoral areas within the Qinghai–Tibetan Plateau.

2.2. Sampling and Data Collection

We conducted face-to-face interviews with herders using semi-structured questionnaires from July to August 2020. Ten herder families were randomly selected from each of the 76 villages in the alpine meadow, steppe, and desert zones across north Tibet (Figure 1). Student assistants from the Tibetan University were trained before the field investigation and served as translators to ensure that all interviewees understood the questionnaires well. Finally, we excluded 64 households from data analyses because they did not complete the questionnaires.

2.3. Livelihood Sustainability Index at the Household Level

Household livelihood consists of human, natural, physical, financial, and social capital [33,34,35,36] (see details in Table 1). We used the sustainable livelihood framework (SLF) proposed by the Department for International Development of the UK in this study (DFID, 1999). The sustainable livelihood index (SLI), which integrates natural, physical, financial, human, and social capitals, can help us to better understand the inherent complexity of poverty and evaluate the dimensions, factors, and opportunities of herder livelihood strategies [16].

2.3.1. Model Formulation and Data Processing

In this study, we used the entropy weight method to calculate the weight of each indicator, and calculated the household livelihood sustainability by weighted summation. Shannon entropy is an effective method for assigning weights to criteria set in multi-attribute decision problems, especially when preferences and decision experiments based on weight allocation are impossible [37]. Entropy value analysis results are more objective than those of qualitative analysis methods, such as the analytic hierarchy process.

2.3.2. Index Standardization

The range standardization method was used to standardize the data. Formulas (1) and (2) were used to process the data for the positive and negative indicators, respectively, and the original data were normalized to [0–1]. In the following equations, u i represents the standardized value, x i represents the original index, α i is the maximum value of the index, and β i is the minimum value of the index.
u i = ( x i β i ) / ( α i β i )
u i = ( α i x i ) ( α i β i )

2.3.3. Index Weight

The entropy method was used to determine the weight of different evaluation indexes.
Calculation index proportion:
s i = x i i = 1 n x i
Calculated index entropy value:
h i = i = 1 n s i ln ( s i )
Standardized entropy:
α i = max h i h i ( α i 1 , i = 1 , 2 , 3 , . , n )
Index weight calculation:
w i = α i / i = 1 n α i

2.3.4. Livelihood Sustainability Index

The SLI was calculated by weighted summation using the standardized values and weights calculated by the above steps. In Formula (7), w i and u i represent the weights and standardized values, respectively, of the indicators related to sustainable livelihoods.
SLI = i = 1 n w i u i
The larger the SLI value, the higher the sustainability of the farmers’ livelihoods. A low SLI value does not mean an unsustainable livelihood because the SLI only ranks the level of herders’ livelihoods [35]. K-means clusterization was used to explore the differentiation of the livelihood sustainability of herders in the northern Tibetan Plateau. The K-means clustering algorithm is an iterative solution to the clustering analysis algorithm and is widely used due to its simplicity and efficiency [38]. We also used the independent sample T-test to determine the difference between the high- and low-SLI groups.

3. Results

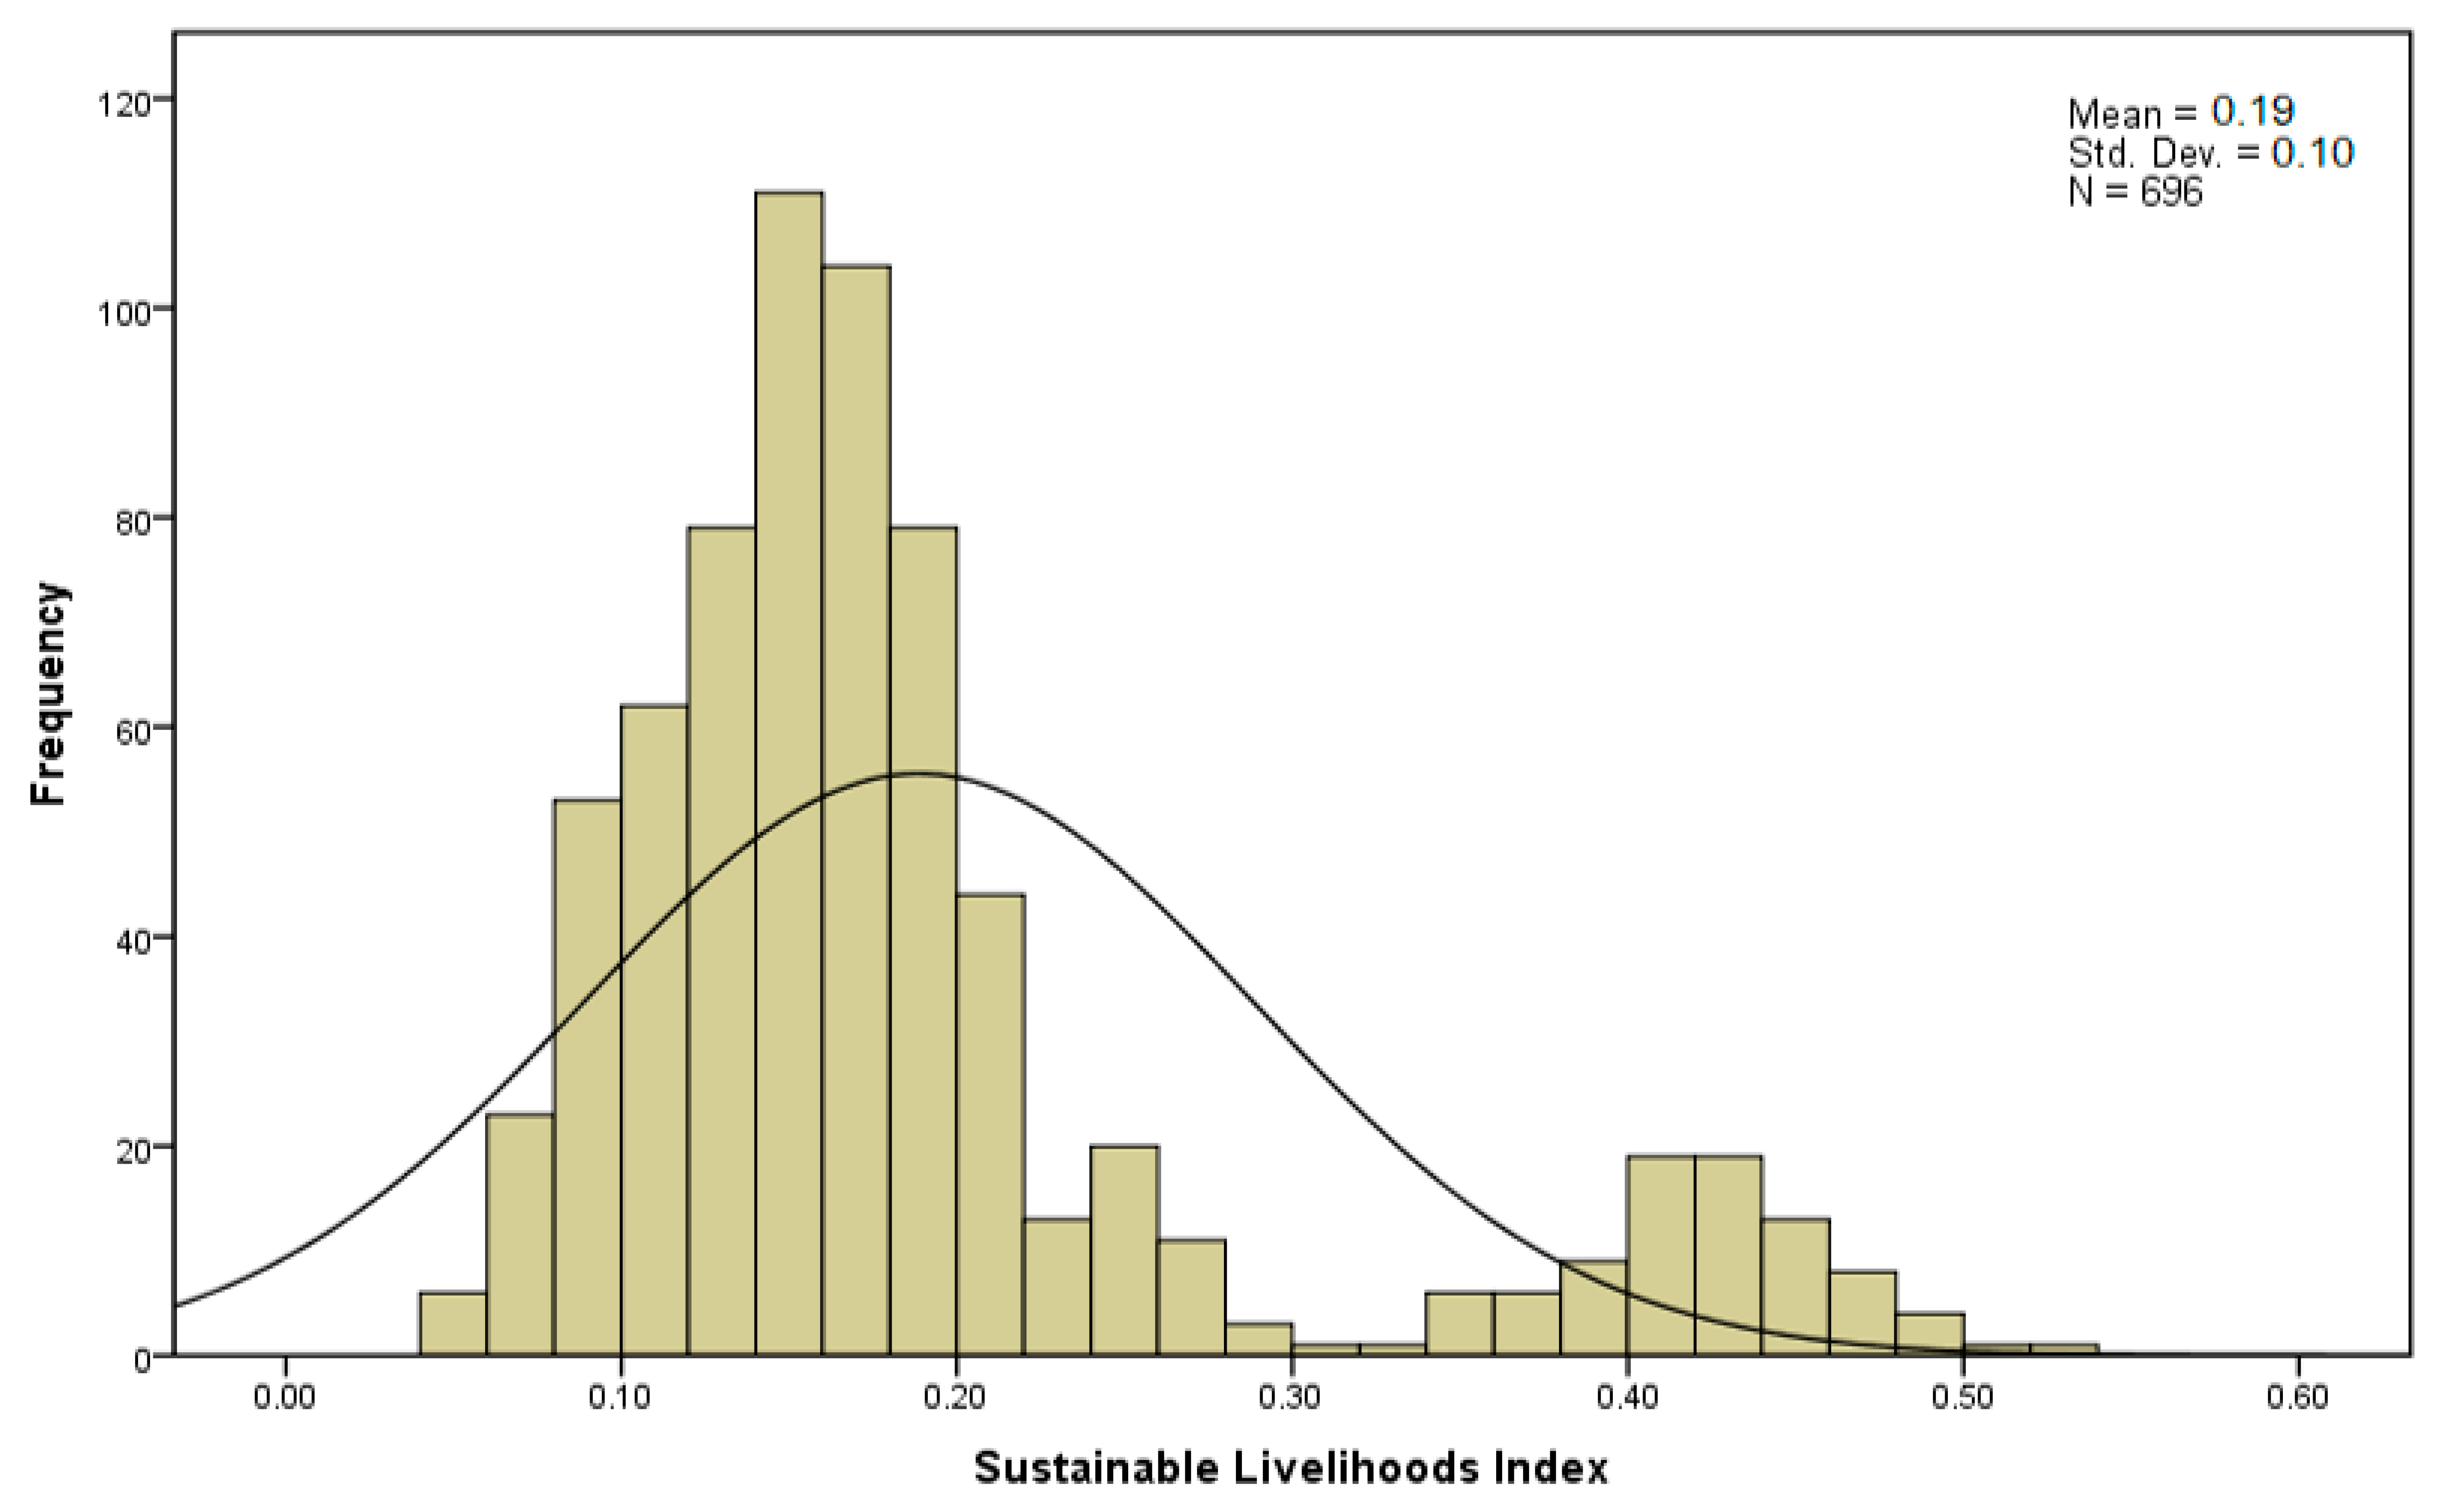
3.1. Livelihood Sustainability of Herder Households

The SLI of herder households in north Tibet ranged from 0.045 to 0.52. We used K-means clustering [38] to identify high- and low-sustainability households. A total of 696 families were divided into 606 homes with a low sustainability index ranging from 0.045 to 0.281 and 90 households with a high sustainability index ranging from 0.287 to 0.525, accounting for 87.07% and 12.93% of all households interviewed, respectively (Figure 2). The independent sample T-test results showed that these findings were all significant at the 1% level, indicating that it was reasonable to divide them into two categories.

3.2. Key Factors for Herder Livelihood Sustainability

The entropy weights were different among the natural, human, financial, physical, and social capitals (Table 2). Social capital accounted for 32% of the total weight of the SLI. Leadership (X13) as social capital was of the highest importance among all indicators (0.259). Organizations (X14) also had a high weight of 0.058. However, the entropy weight of the distance from residence to town (X15) was very small (only 0.002). Human capital accounted for a quarter (28.3%) of the total weight of the SLI. The proportion of skill training (X5) had a higher weight in all indicators (0.192), followed by the dependency ratio (X6; 0.048), the highest education level of the family members (X4; 0.023), and the household labor capacity (X3; 0.020). Physical capital accounted for 21.3% of the total weight of the SLI, among which the fixed assets value (X12) played the most critical role, with an entropy weight of 0.092. Herd size (X11) and household area (X10) accounted for relatively high weights of 0.078 and 0.043, respectively. Natural capital accounted for 9.9% of the total weight of the SLI of herder households. Per capita grassland area contracted (X1) also had a higher weight (0.074). However, grassland quality (X2) was lower (0.025). Financial capital accounted for 8.5% of the total weight of the SLI. Among financial capitals, the net income per capita of the index households (X7) was relatively high (0.046). The entropy weights of the credit rating of loans (X9) and medical expenditures (X8) were 0.030 and 0.008, respectively.

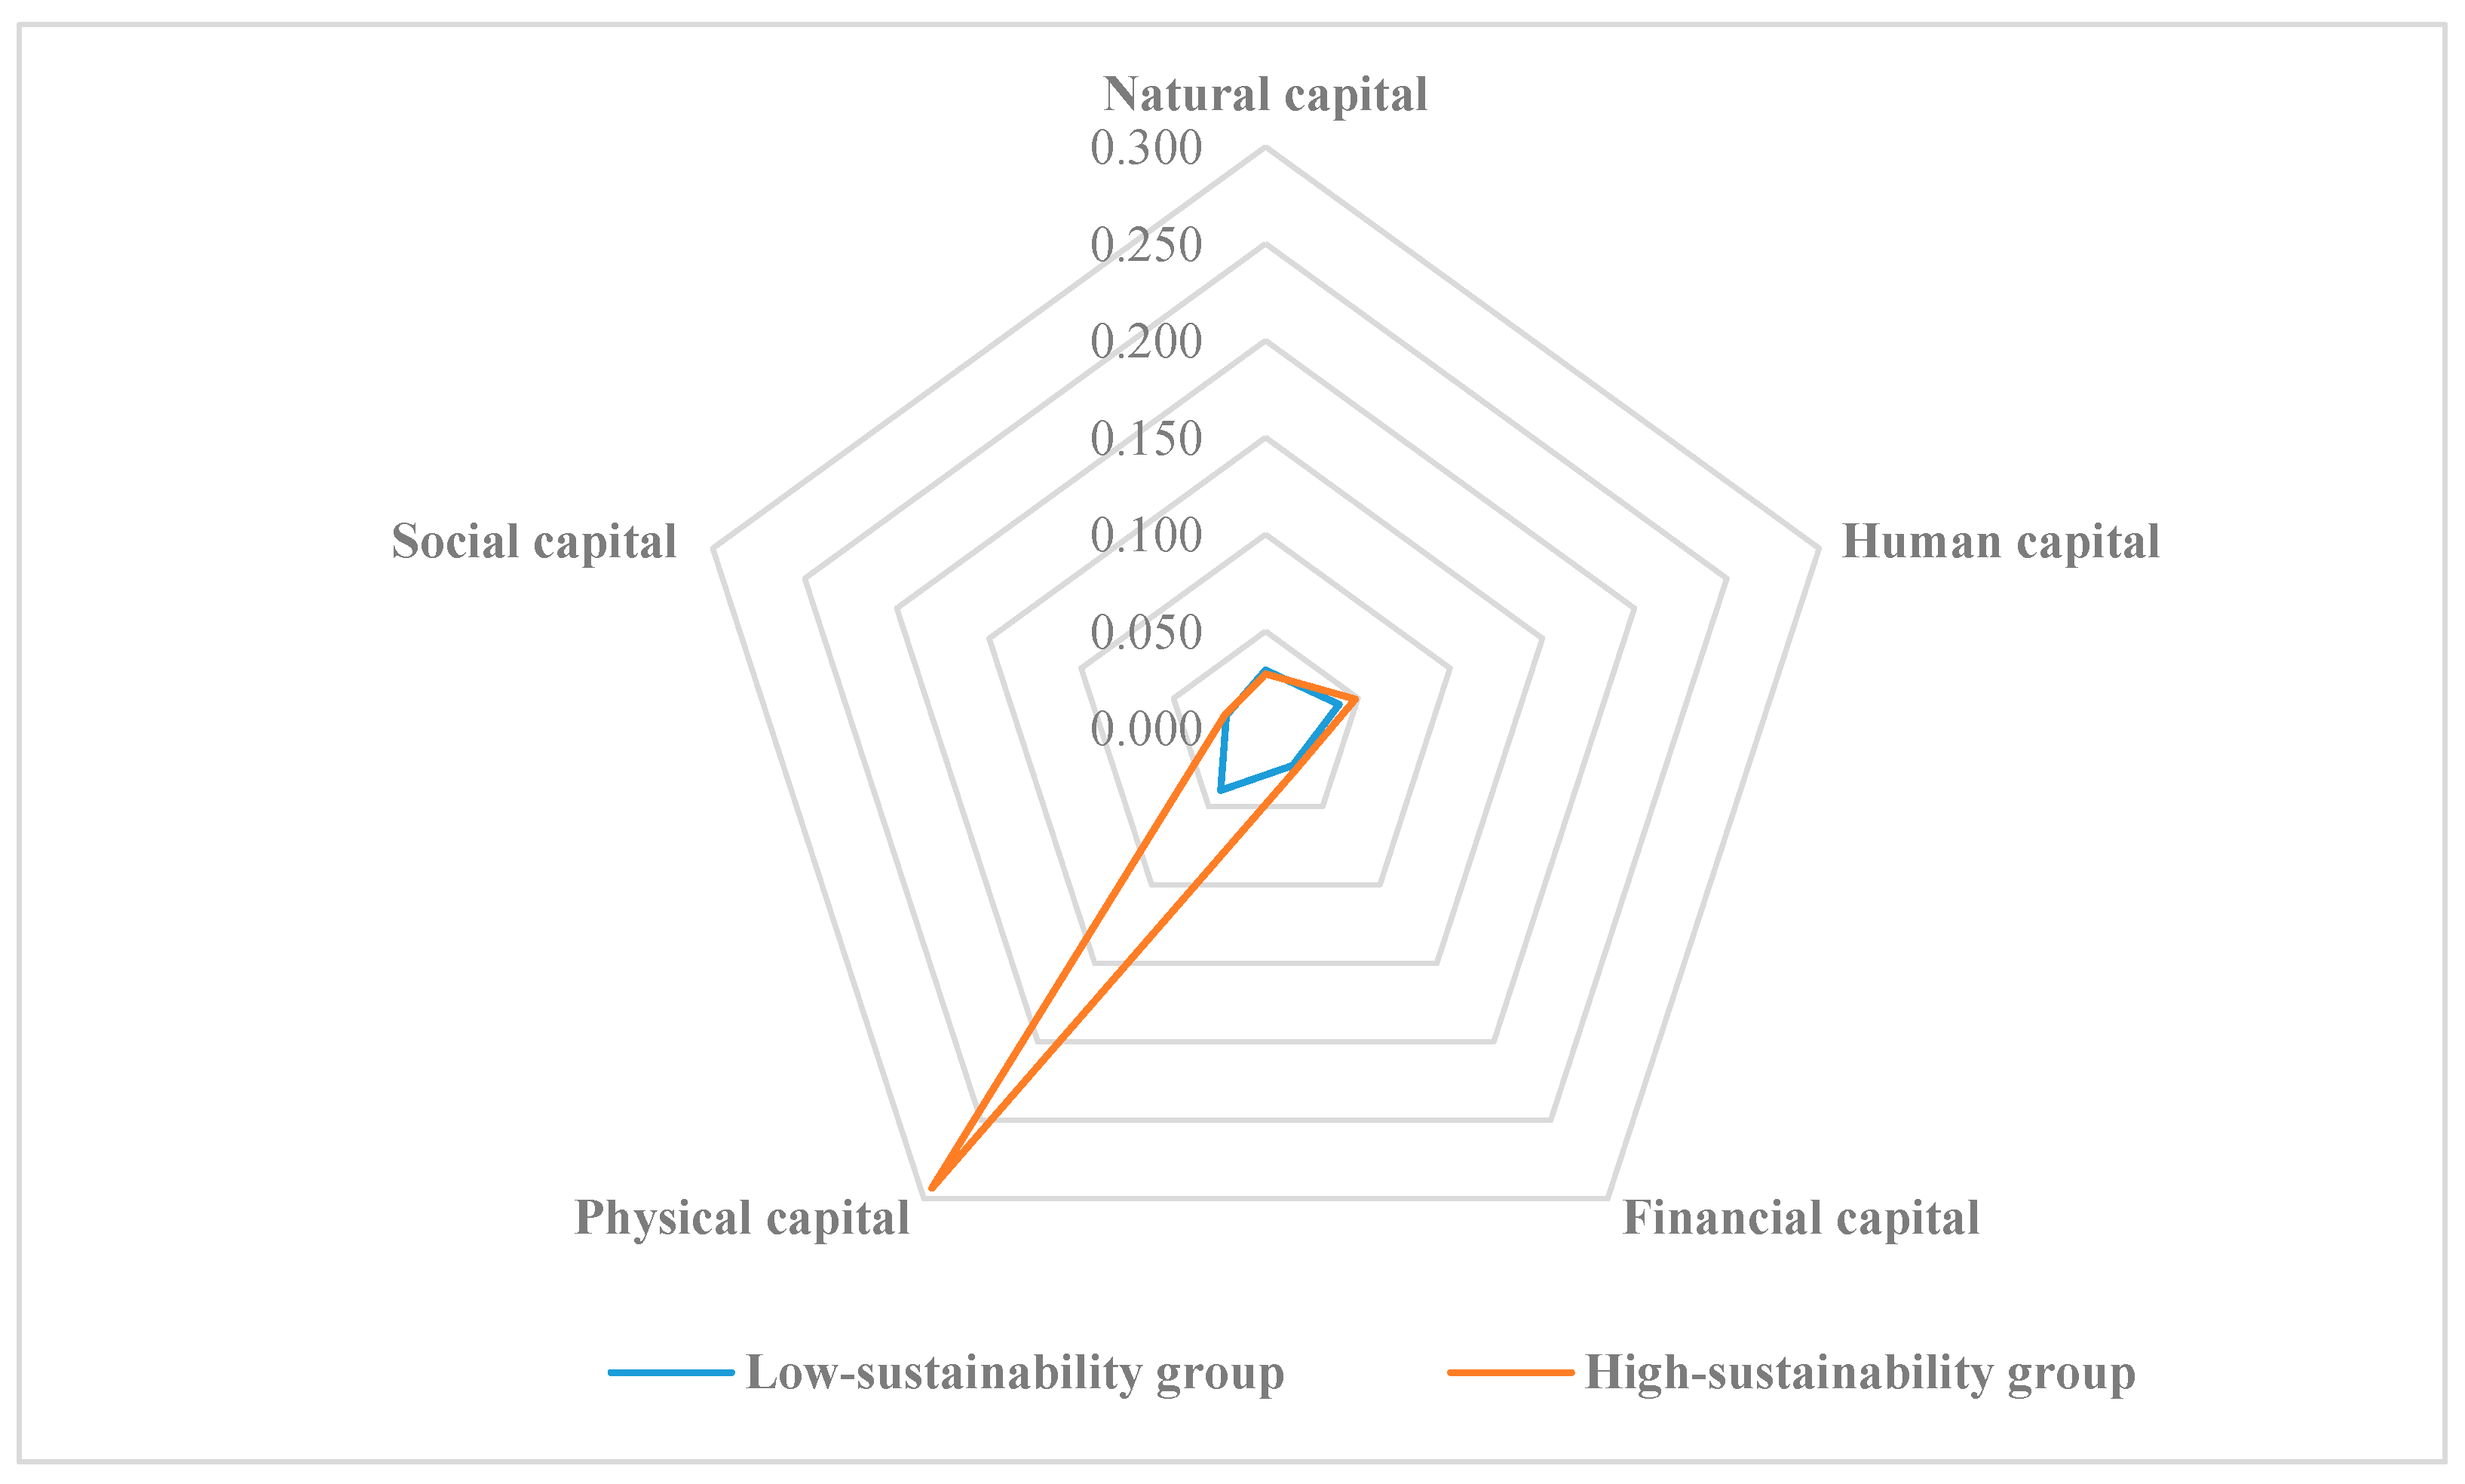
3.3. Differences in Livelihood Sustainability among Different Groups

The physical capital of low sustainability households is significantly lower than that of high sustainability households. In our study, the physical capital index of high-sustainability households (0.293) was 7.51 times higher than that of low grazing households (0.039; Figure 3).
The per capita grassland area of low-sustainability families (122.45 hm2) was more significant than that of high-sustainability families (108.09 hm2). There was no difference in livestock numbers between the low-sustainability households (109.71, standardized sheep units) and high-sustainability households (120.97, standardized sheep units). High-sustainability households had more farm equipment and transportation than low-sustainability households (Table 3). The housing area of high-sustainability families (155.80 m2) was larger than that of low-sustainability families (128.43 m2).
The household labor capacity of the two groups of families in the pastoral areas of northern Tibet was similar, with an average labor force of 2–3 people per household. In high-SLI households, the proportion of skill training was 8.61%, about 2% more than that of low-sustainability families. The number of high-sustainability families participating in cooperatives (606) was 404 households; for low-sustainability families (90), there were 56 households. Members of high-sustainability families tended to have strong leadership skills.
There were also significant differences in financial capital between the high- and low-SLI groups. Low-sustainability households’ per capita net income (14,176 CNY) was about 3271 CNY lower than high-sustainability families (17,447 CNY). The medical expenses showed that low-sustainability families face more significant risks of catastrophic medical expenses. There was no significant difference associated with loan credit rating in the sustainability of pastoral households in north Tibet.
The overall education level is not high in rural north Tibet; here, the highest education level recorded was middle and high school. The dependency ratios in high- and low-sustainability families were nearly the same, at 58.91% and 59.35%, respectively. In addition, there was no significant difference in the mean distance between their houses and the nearest town between low- (12.89 km) and high-sustainability (14.39 km) households.

4. Discussion

4.1. Livelihood Capital and Sustainability

This study evaluated the livelihood sustainability of herder households across north Tibet within the sustainable livelihood framework and based on objective weighting criteria. Social capital and human capital were the key capitals affecting the livelihood sustainability of pastoral areas in northern Tibet. There were differences in the influencing factors of livelihood sustainability in different regions. Su and Shang, in a study of farmers in the Heihe Basin of China, found that financial capital and human capital improved farmers’ livelihood sustainability [39]. It has also been shown that different asset portfolios can affect livelihood sustainability [40]. Physical capital was the principal capital that accounted for the differences between high- and low-sustainability households in our research. Farmers with higher livelihood capital indices have more options to deal with shocks [41]. For example, Thulstrup argues that households with more livelihood capital in rural Vietnam have higher livelihood sustainability [42].

4.2. Livelihood Diversification and Sustainability

The natural and socioeconomic contexts in which people live make an essential impact on household livelihood strategies [43]. The diversification of livelihoods for additional and alternative sources of income is considered an essential pre-eminent driver of family well-being and sustainability [14,26,44]. Off-farm jobs are usually more attractive to farmers in many rural areas around the world [45]. Experiences and lessons learned [46,47] over the past decades indicate that livelihood capital changes promoted by PES programs may help participating households shift to alternative livelihood activities, such as off-farm sectors. In this study, non-pastoral activities, such as permanent employment, self-generating income activities, and off-farm employment, were also key components of sustainable livelihoods [48,49,50,51]. We found that the livelihoods of high-sustainability families in north Tibet are more diverse than low-sustainability families. Skills training and cooperatives are essential factors in the sustainable livelihood impacts of high- and low-sustainability households. In the high-sustainability households of north Tibet, family members receive more professional training, have strong leadership, have more opportunities to engage in non-agricultural employment, participate more often in community-based organizations, and consequently have additional income (Table 3). This is consistent with Zhang’s finding [52] that in the Gannan Plateau, families with diversified and off-farm livelihoods have more sources of income.
Livelihood diversification and non-agricultural livelihoods are two crucial livelihood strategies for developing countries that help to reduce livelihood vulnerability, ensure food security, and reduce the threat of famine [53,54]. Livelihood vulnerability is rooted in the scarcity of resources and a lack of non-agricultural employment opportunities [55,56]. The sources of low-sustainable household income in northern Tibet are relatively few, as they rely more on natural resources and less on non-agricultural industries. Therefore, livelihood diversification from non-agricultural activities is essential for maintaining sustainable livelihoods [57]. To this aim, local government officials have mainly organized livestock production cooperatives. National and local governments have also been providing subsidies, technology, information, and various kinds of help for herders to organize livestock production cooperatives to increase employment and alleviate rural poverty.

4.3. Livelihood Sustainability and Social Security

Social security is a systematic project related to people’s livelihood and well-being and a country’s long-term stability [58]. A large number of studies have shown that social security has a significant effect on the sustainable development of rural areas in the construction of insured public services, such as income redistribution, medical care, pension, education, and infrastructure [59,60,61]. The construction of public services needs to be strengthened in north Tibet. For example, the distance from residence to town did not play a sufficient role in promoting the livelihood sustainability of high-and low-sustainability herder households.
In addition, most families in north Tibet are vulnerable to medical risks. Every family has higher dependency pressures because of the elderly and children. The low level of education leads to a weaker social capital in northern Tibet. The improvement of social security will help to reduce rural livelihood risks. For example, education can improve farmers’ access to other livelihood resources and their ability to adapt to climate change by facilitating the full use of these additional resources [62]. Social capital provides individuals and groups with access to information and resources [63], contributing to individuals’ ability to cope with shocks and adjust to overall change [64,65]. The process of labor migration is influenced by multiple economic, social, and environmental factors [66,67], as well as the age and education level of the laborers [68]. Because of these barriers, many households in north Tibet may be unable to effectively use the payments and surplus labor made available by PES programs to join in on these off-farm livelihood activities.

4.4. Further Suggestions for Improving Livelihood Sustainability

Policy measures should consider the socioeconomic vulnerability in north Tibet. Any positive change that impacts the sustainability of livelihoods requires long-term support [69]. Based on our findings, we recommend the following policy measures to improve the sustainability of livelihoods in north Tibet.

4.4.1. To Improve Pastoral Production Conditions and Promote Livelihood Diversification

Livestock remains the primary livelihood of herder families. More agricultural machinery is conducive to farmers’ livelihood and poverty alleviation [18]. Our results showed that households with more production and living fixed assets, such as sheds (sheep pens), production tools (agricultural machinery and equipment, etc.), and vehicles (cars, motorcycles, etc.), are more sustainable. We suggest that the government provide more farming machinery, and local governments should consider increasing more local non-farm jobs for these households in addition to providing training to develop new earning skills [70]. In addition, the diversification of household incomes needs to be enhanced in similar PES programs [71].

4.4.2. To Improve and Strengthen the Construction of the Social Security System

The essence of social security is to maintain social equity and promote social stability and development. The institutionalization and long-term effects of the social security system make it possible to prevent poverty and organically unite poverty governance and poverty prevention. This requires a need-oriented comprehensive security system. Specifically, this includes strengthening the existing core security systems for education, medical care, and pensions. Further focus should be paid to protecting the rights and interests of vulnerable groups; developing innovative and diversified policies and insurance to ensure poverty alleviation; enhancing the poor’s ability to resist risks; and strengthening the supply of essential public services in impoverished areas.

4.4.3. To Promote Sustainable Development

Policy formulation requires an inclusive approach, emphasizing social and ecological characteristics. Since 2004, the government has launched a series of ecological restoration projects and economic compensatory payment policies [72]. Policies in which individuals or communities enter into conservation contracts and receive payment on the condition that they provide a specified ecosystem service or activity [73] frequently ask poor, resource-dependent households to make changes that involve substantial economic costs [74,75] However, the implementation of these policies also induces more complex interactions between humans and nature [70]. These policies may constrain livelihood options or provide additional opportunities [76]. Policies to diversify the various livelihoods and enhance environmental awareness will contribute to the sustainability of the livelihoods of herder households and promote sustainable development [77,78].

5. Conclusions

This study assessed the sustainability of household livelihoods in north Tibet using the sustainable livelihoods framework. It identified vital capitals that affected the sustainability of herders’ livelihoods and analyzed the differences between different groups. Our research emphasizes the importance of diversifying livelihoods and strengthening the social security system. The difference in livelihood sustainability results from different livelihood capital compositions between poor and wealthy households. Based on multiple socioeconomic variables at the household level, our research aimed to identify vulnerable entities and formulate targeted adaptation policies for each type, thereby generating collective actions to deal with risks. Looking at poverty from the perspective of sustainable livelihoods is conducive to the careful consideration of available resources. Since the sustainable livelihood framework is appropriate to aid development planning holistically, it contributes to a greater understanding and better decision making. The sustainable livelihood index can effectively be an essential indicator of a region’s development over time. This paper contributes to the understanding of the selection of complementary livelihood capital to promote herders’ livelihoods, thus providing a theoretical basis for rural development assessment.

Author Contributions

H.Z. (Huixia Zou)—concepts, ideas, research design, data collection and analysis, and writing. S.L.—ideas, research design, interpretation of the results, writing, and editing. H.Z. (Huiyuan Zou)—data collection and analysis. W.S.—data collection. C.Y.—ideas, research design, interpretation of the results, and editing. Y.N.—part of data collection. All authors have read and agreed to the published version of the manuscript.

Funding

This research was funded by the Second Tibetan Plateau Scientific Expedition and Research (STEP, No. 2019QZKK1002), Science and Technology Department of the Tibetan Autonomous Region of China (No. XZ2019ZR G-154, XZ202101ZD0003N), Science and Technology Service Network Scheme Project of the Chinese Academy of Sciences (STS, No. KFJ-STS-QYZD-168, KFJ-STS-QYZD-2021-22-003), and the National Key R&D Program of China (No. 2021YFD1000303).

Informed Consent Statement

Informed consent was obtained from all subjects involved in the study.

Data Availability Statement

Data are available upon request from the authors.

Acknowledgments

The authors would like to thank Yuan Tian, Cheng Duan, Fusong Han, and Jiangwei Wang for their assistance with the experiments.

Conflicts of Interest

The authors declare no conflict of interest.

References

  1. Donohue, C.; Biggs, E. Monitoring socio-environmental change for sustainable development: Developing a Multidimensional Livelihoods Index (MLI). Appl. Geogr. 2015, 62, 391–403. [Google Scholar] [CrossRef] [Green Version]
  2. Liu, Y.-H.; Xu, Y. A geographic identification of multidimensional poverty in rural China under the framework of sustainable livelihoods analysis. Appl. Geogr. 2016, 73, 62–76. [Google Scholar] [CrossRef]
  3. Liu, Z.-X.; Liu, L.-M. Characteristics and driving factors of rural livelihood transition in the east coastal region of China: A case study of suburban Shanghai. J. Rural Stud. 2016, 43, 145–158. [Google Scholar] [CrossRef]
  4. Masud, M.M.; Kari, F.; Yahaya, S.R.B.; Al-Amin, A.Q. Livelihood Assets and Vulnerability Context of Marine Park Community Development in Malaysia. Soc. Indic. Res. 2016, 125, 771–792. [Google Scholar] [CrossRef]
  5. Hediger, W.; Knickel, K. Multifunctionality and Sustainability of Agriculture and Rural Areas: A Welfare Economics Perspective. J. Environ. Policy Plan. 2009, 11, 291–313. [Google Scholar] [CrossRef]
  6. Joshi, N.C.; Rawat, G.S. An integrated approach for the identification and prioritization of areas based on their livelihood vulnerability index: A case study of agro-pastoral community from Western Indian Himalaya. Mitig. Adapt. Strat. Glob. Chang. 2021, 26, 36. [Google Scholar] [CrossRef]
  7. Sandhu, H.; Sandhu, S. Poverty, development, and Himalayan ecosystems. AMBIO 2015, 44, 297–307. [Google Scholar] [CrossRef] [Green Version]
  8. Nicholls, R.J.; Hoozemans, F.M.J.; Marchand, M. Increasing flood risk and wetland losses due to global sea-level rise: Regional and global analyses. Glob. Environ. Chang. 1999, 9, S69–S87. [Google Scholar] [CrossRef]
  9. Nagoda, S. New discourses but same old development approaches? Climate change adaptation policies, chronic food insecurity and development interventions in northwestern Nepal. Glob. Environ. Chang. 2015, 35, 570–579. [Google Scholar] [CrossRef]
  10. Chandio, A.A.; Jiang, Y.; Amin, A.; Akram, W.; Ozturk, I.; Sinha, A.; Ahmad, F. Modeling the impact of climatic and non-climatic factors on cereal production: Evidence from Indian agricultural sector. Environ. Sci. Pollut. Res. 2021, 29, 14634–14653. [Google Scholar] [CrossRef]
  11. Gerlitz, J.-Y.; Macchi, M.; Brooks, N.; Pandey, R.; Banerjee, S.; Jha, S.K. The Multidimensional Livelihood Vulnerability Index—An instrument to measure livelihood vulnerability to change in the Hindu Kush Himalayas. Clim. Dev. 2017, 9, 124–140. [Google Scholar] [CrossRef]
  12. Yu, O.; Yan, J.; Zhang, Y. Reviews on Regional Climate Change Vulnerability Assessment. Prog. Geogr. 2011, 30, 27–34. [Google Scholar]
  13. Wichern, J.; Descheemaeker, K.; Giller, K.E.; Ebanyat, P.; Taulya, G.; van Wijk, M.T. Vulnerability and adaptation options to climate change for rural livelihoods—A country-wide analysis for Uganda. Agric. Syst. 2019, 176, 14. [Google Scholar] [CrossRef]
  14. Fang, Y.-P.; Fan, J.; Shen, M.-Y.; Song, M.-Q. Sensitivity of livelihood strategy to livelihood capital in mountain areas: Empirical analysis based on different settlements in the upper reaches of the Minjiang River, China. Ecol. Indic. 2014, 38, 225–235. [Google Scholar] [CrossRef]
  15. Wang, P.; Wolf, S.A.; Lassoie, J.P.; Poe, G.L.; Morreale, S.J.; Su, X.-K.; Dong, S.-K. Promise and reality of market-based environmental policy in China: Empirical analyses of the ecological restoration program on the Qinghai-Tibetan Plateau. Glob. Environ. Chang. 2016, 39, 35–44. [Google Scholar] [CrossRef]
  16. Wang, J.; Wang, Y.; Li, S.-C.; Qin, D.-H. Climate adaptation, institutional change, and sustainable livelihoods of herder communities in northern Tibet. Ecol. Soc. 2016, 21, 11. [Google Scholar] [CrossRef] [Green Version]
  17. Li, X.; Zhou, Y.; Chen, Y. Theory and measurement of regional multidimensional poverty. Acta Geogr. Sin. 2020, 75, 753–768. [Google Scholar]
  18. Wang, P.; Yan, J.-Z.; Hua, X.-B.; Yang, L. Determinants of livelihood choice and implications for targeted poverty reduction policies: A case study in the YNL river region, Tibetan Plateau. Ecol. Indic. 2019, 101, 1055–1063. [Google Scholar] [CrossRef]
  19. Hua, X.-B.; Yan, J.-Z.; Liu, X.; Wu, Y.-Y.; Liu, L.-S.; Zhang, Y.-L. Factors influencing the grazing management styles of settled herders: A case study of Nagqu County, Tibetan Plateau, China. J. Mt. Sci. 2013, 10, 1074–1084. [Google Scholar] [CrossRef]
  20. Qiu, J. Trouble in Tibet. Nature 2016, 529, 142–145. [Google Scholar] [CrossRef] [PubMed] [Green Version]
  21. Pour, M.-D.; Barati, A.A.; Azadi, H.; Scheffran, J. Revealing the role of livelihood assets in livelihood strategies: Towards enhancing conservation and livelihood development in the Hara Biosphere Reserve, Iran. Ecol. Indic. 2018, 94, 336–347. [Google Scholar] [CrossRef]
  22. Unks, R.R.; King, E.G.; Nelson, D.R.; Wachira, N.P.; German, L.A. Constraints, multiple stressors, and stratified adaptation: Pastoralist livelihood vulnerability in a semi-arid wildlife conservation context in Central Kenya. Glob. Environ. Chang. 2019, 54, 124–134. [Google Scholar] [CrossRef]
  23. Yan, J.; Zhang, Y.; Zhang, L.; Wu, Y. Livelihood strategy change and land use change—Case of Danzam Village in upper Dadu River watershed, Tibetan Plateau of China. Chin. Geogr. Sci. 2009, 19, 231–240. [Google Scholar] [CrossRef] [Green Version]
  24. Zhang, C.; Fang, Y. Application of capital-based approach in the measurement of livelihood sustainability: A case study from the Koshi River basin community in Nepal. Ecol. Indic. 2020, 116, 106474. [Google Scholar] [CrossRef]
  25. Liu, H.; Hao, H.; Hu, X.; Du, L.; Zhang, Z.; Li, Y. Livelihood Diversification of Farm Households and Its Impact on Cultivated Land Utilization in Agro-pastoral Ecologically-vulnerable Areas in the Northern China. Chin. Geogr. Sci. 2020, 30, 279–293. [Google Scholar] [CrossRef]
  26. Pandey, R.; Jha, S.K.; Alatalo, J.M.; Archie, K.M.; Gupta, A.K. Sustainable livelihood framework-based indicators for assessing climate change vulnerability and adaptation for Himalayan communities. Ecol. Indic. 2017, 79, 338–346. [Google Scholar] [CrossRef]
  27. Wang, F.; Zheng, H.; Wang, X.; Peng, W.; Ma, D.; Li, C. Classification of the Relationship between Household Welfare and Ecosystem Reliance in the Miyun Reservoir Watershed, China. Sustainability 2017, 9, 2290. [Google Scholar] [CrossRef] [Green Version]
  28. Ding, W.-Q.; Ren, W.-B.; Li, P.; Hou, X.-Y.; Sun, X.-L.; Li, X.-L.; Xie, J.-H.; Ding, Y. Evaluation of the livelihood vulnerability of pastoral households in Northern China to natural disasters and climate change. Rangel. J. 2014, 36, 535. [Google Scholar] [CrossRef] [Green Version]
  29. Jianzhong, Y.A.N.; Yingying, W.U.; Yili, Z.; Shaobin, Z.; Yulin, S.H.I. Livelihood Diversification of Peasants and Nomads of. Eastern Transect in Tibetan Plateau. Acta Geogr. Sin. 2009, 64, 221–233. [Google Scholar]
  30. Zeren, G.; Zhang, Z.; Wu, J. How do market-based rangeland institutional reforms affect herders engagement with credit loans within the pastoral regions of the Tibetan Plateau? J. Rural Stud. 2020, 73, 1–9. [Google Scholar] [CrossRef]
  31. Hayes, T.; Murtinho, F.; Wolff, H.; López-Sandoval, M.F.; Salazar, J. Effectiveness of payment for ecosystem services after loss and uncertainty of compensation. Nat. Sustain. 2021, 5, 81–88. [Google Scholar] [CrossRef]
  32. Duan, C.; Shi, P.; Zhang, X.; Zong, N. Suitability analysis for sown pasture planning in an alpine rangeland of the northern. Tibetan Plateau. Acta Ecol. Sin. 2019, 39, 5517–5526. [Google Scholar]
  33. Eakin, H.; Bojórquez-Tapia, L.A. Insights into the composition of household vulnerability from multicriteria decision analysis. Glob. Environ. Chang. 2008, 18, 112–127. [Google Scholar] [CrossRef]
  34. Hua, X.-B.; Yan, J.-Z.; Zhang, Y.-L. Evaluating the role of livelihood assets in suitable livelihood strategies: Protocol for anti-poverty policy in the Eastern Tibetan Plateau, China. Ecol. Indic. 2017, 78, 62–74. [Google Scholar] [CrossRef]
  35. Piya, L.; Joshi, N.P.; Maharjan, K.L. Vulnerability of Chepang households to climate change and extremes in the Mid-Hills of Nepal. Clim. Chang. 2016, 135, 521–537. [Google Scholar] [CrossRef]
  36. Sustainable Livelihoods Guidance Sheets: Section 2. 1999. Available online: https://www.livelihoodscentre.org/documents/114097690/114438878/Sustainable+livelihoods+guidance+sheets.pdf/594e5ea6-99a9-2a4e-f288-cbb4ae4bea8b?t=1569512091877 (accessed on 20 January 2022).
  37. Lotfi, F.H.; Fallahnejad, R. Imprecise Shannon’s Entropy and Multi Attribute Decision Making. Entropy 2010, 12, 53–62. [Google Scholar] [CrossRef] [Green Version]
  38. Kanungo, T.; Mount, D.M.; Netanyahu, N.S.; Piatko, C.D.; Silverman, R.; Wu, A.Y. An efficient k-means clustering algorithm: Analysis and implementation. IEEE Trans. Pattern Anal. Mach. Intell. 2002, 24, 881–892. [Google Scholar] [CrossRef]
  39. Su, F.; Shang, H.Y. Effects of farmers’ livelihood capital on their risk-coping strategies: A case study of Zhangye city in the Heihe River Basin. China Rural Econ. 2012, 8, 79–87. (In Chinese) [Google Scholar]
  40. Paul, C.J.; Weinthal, E.S.; Bellemare, M.F.; Jeuland, M.A. Social capital, trust, and adaptation to climate change: Evidence from rural Ethiopia. Glob. Environ. Chang. 2016, 36, 124–138. [Google Scholar] [CrossRef]
  41. Su, F.; Xu, Z.M.; Shang, H.Y. Study of sustainable livelihoods analysis. Adv. Earth Sci. 2009, 24, 61–69. (In Chinese) [Google Scholar]
  42. Thulstrup, A.-W. Livelihood Resilience and Adaptive Capacity: Tracing Changes in Household Access to Capital in Central Vietnam. World Dev. 2015, 74, 352–362. [Google Scholar] [CrossRef]
  43. Peng, W.; Zheng, H.; Robinson, B.E.; Li, C.; Wang, F. Household Livelihood Strategy Choices, Impact Factors, and Environmental Consequences in Miyun Reservoir Watershed, China. Sustainability 2017, 9, 175. [Google Scholar] [CrossRef] [Green Version]
  44. Gautam, Y.; Andersen, P. Rural livelihood diversification and household well-being: Insights from Humla, Nepal. J. Rural Stud. 2016, 44, 239–249. [Google Scholar] [CrossRef] [Green Version]
  45. Chen, X.; Frank, K.A.; Dietz, T.; Liu, J. Weak Ties, Labor Migration, and Environmental Impacts: Toward a Sociology of. Sustainability. Organ. Environ. 2012, 25, 3–24. [Google Scholar] [CrossRef]
  46. Wunder, S.; Engel, S.; Pagiola, S. Taking stock: A comparative analysis of payments for environmental services programs in developed and developing countries. Ecol. Econ. 2008, 65, 834–852. [Google Scholar] [CrossRef]
  47. Lin, Y.; Yao, S. Impact of the Sloping Land Conversion Program on rural household income: An integrated estimation. Land Use Policy 2014, 40, 56–63. [Google Scholar] [CrossRef]
  48. Twyman, C. Natural resource use and livelihoods in Botswana’s Wildlife Management Areas. Appl. Geogr. 2001, 21, 45–68. [Google Scholar] [CrossRef]
  49. Berhanu, W.; Colman, D.; Fayissa, B. Diversification and livelihood sustainability in a semi-arid environment: A case study from southern Ethiopia. J. Dev. Stud. 2007, 43, 871–889. [Google Scholar] [CrossRef] [Green Version]
  50. Tolera, T.; Senbeta, F. Pastoral system in the face of climate variability: Household adaptation strategies in Borana Rangelands, Southern Ethiopia. Environ. Dev. Sustain. 2020, 22, 3133–3157. [Google Scholar] [CrossRef]
  51. Tsegaye, D.; Vedeld, P.; Moe, S.R. Pastoralists and livelihoods: A case study from northern Afar, Ethiopia. J. Arid Environ. 2013, 91, 138–146. [Google Scholar] [CrossRef]
  52. Zhang, Q.; Zhao, X.; Luo, L.; Wang, Y.; Xue, B. Assessment of the impact of climate change on vulnerability of farmer. householdslivelihood in an ecologically vulnerable alpine region: Taking Gannan Plateau for example. Chin. J. Ecol. 2016, 35, 781–790. [Google Scholar]
  53. Block, S.; Webb, P. The dynamics of livelihood diversification in post-famine Ethiopia. Food Policy 2001, 26, 333–350. [Google Scholar] [CrossRef]
  54. Ellis, F. Household strategies and rural livelihood diversification. J. Dev. Stud. 1998, 35, 1–38. [Google Scholar] [CrossRef]
  55. Archie, K.M.; Dilling, L.; Milford, J.B.; Pampel, F.C. Unpacking the ‘information barrier’: Comparing perspectives on information as a barrier to climate change adaptation in the interior mountain West. J. Environ. Manag. 2014, 133, 397–410. [Google Scholar] [CrossRef]
  56. Davis, B.; Winters, P.; Reardon, T.; Stamoulis, K. Rural nonfarm employment and farming: Household-level linkages. Agric. Econ. 2009, 40, 119–123. [Google Scholar] [CrossRef]
  57. Zhang, L.-P.; Zhang, Y.-L.; Yan, J.-Z.; Wu, Y.-Y. Livelihood diversification and cropland use pattern in agro-pastoral mountainous region of eastern Tibetan Plateau. J. Geogr. Sci. 2008, 18, 499–509. [Google Scholar] [CrossRef]
  58. Zhao, C. Examining Rural Social Security Situation in Xing County, Shanxi Province from a Realistic Perspective. In Proceedings of the 5th International Symposium on Social Science (ISSS 2019), Xian, China, 15–16 December 2019; Atlantis Press: Amsterdam, The Netherlands, 2019; pp. 181–185. [Google Scholar]
  59. Cai, M.; Yue, X. The redistributive role of government social security transfers on inequality in China. China Econ. Rev. 2020, 62, 101512. [Google Scholar] [CrossRef]
  60. Dutta, A.; Fischer, H.W. The local governance of COVID-19: Disease prevention and social security in rural India. World Dev. 2021, 138, 105234. [Google Scholar] [CrossRef]
  61. Yu, L.-R.; Li, X.-Y. The effects of social security expenditure on reducing income inequality and rural poverty in China. J. Integr. Agric. 2021, 20, 1060–1067. [Google Scholar] [CrossRef]
  62. Muttarak, R.; Lutz, W. Is Education a Key to Reducing Vulnerability to Natural Disasters and hence Unavoidable Climate Change? Ecol. Soc. 2014, 19, 8. [Google Scholar] [CrossRef] [Green Version]
  63. Tompkins, E.L.; Adger, W.N. Does Adaptive Management of Natural Resources Enhance Resilience to Climate Change? Ecol. Soc. 2004, 9, 1–14. [Google Scholar] [CrossRef]
  64. Pretty, J.; Smith, D. Social Capital in Biodiversity Conservation and Management. Conserv. Biol. 2004, 18, 631–638. [Google Scholar] [CrossRef]
  65. Speranza, C.I. Resilient Adaptation to Climate Change in African Agriculture; Deutsches Institut für Entwicklungspolitik: Bonn, Germany, 2010; p. 54. [Google Scholar]
  66. Uchida, E.; Xu, J.; Xu, Z.; Rozelle, S. Are the poor benefiting from China’s land conservation program? Environ. Dev. Econ. 2007, 12, 593–620. [Google Scholar] [CrossRef] [Green Version]
  67. Li, X.; Wang, C.; Zhang, G.-Q.; Xiao, L.; Dixon, J. Urbanisation and human health in China: Spatial features and a systemic perspective. Environ. Sci. Pollut. Res. Int. 2012, 19, 1375–1384. [Google Scholar] [CrossRef]
  68. Uchida, E.; Rozelle, S.; Xu, J. Conservation Payments, Liquidity Constraints and Off-Farm Labor: Impact of the Grain for Green Program on Rural Households in China. In An Integrated Assessment of China’s Ecological Restoration Programs; Springer Science and Business Media LLC: Berlin, Germany, 2009; pp. 131–157. [Google Scholar]
  69. Paul, S.; Das, T.K.; Pharung, R.; Ray, S.; Mridha, N.; Kalita, N.; Ralte, V.; Borthakur, S.; Burman, R.R.; Tripathi, A.K.; et al. Development of an indicator based composite measure to assess livelihood sustainability of shifting cultivation dependent ethnic minorities in the disadvantageous Northeastern region of India. Ecol. Indic. 2020, 110, 105934. [Google Scholar] [CrossRef]
  70. Yang, H.-B.; Yang, W.; Zhang, J.; Connor, T.; Liu, J. Revealing pathways from payments for ecosystem services to socioeconomic outcomes. Sci. Adv. 2018, 4, eaao6652. [Google Scholar] [CrossRef] [Green Version]
  71. Bryan, B.A.; Gao, L.; Ye, Y.; Sun, X.; Connor, J.D.; Crossman, N.D.; Stafford-Smith, M.; Wu, J.; He, C.; Yu, D.; et al. China’s response to a national land-system sustainability emergency. Nature 2018, 559, 193–204. [Google Scholar] [CrossRef]
  72. Yu, C.; Zhang, X.; Zhang, J.; Li, S.; Song, C.; Fang, Y.; Wurst, S.; Wu, J. Grazing Exclusion to Recover Degraded Alpine Pastures Needs Scientific Assessments across the Northern Tibetan Plateau. Sustainability 2016, 8, 1162. [Google Scholar] [CrossRef] [Green Version]
  73. Wunder, S. When payments for environmental services will work for conservation. Conserv. Lett. 2013, 6, 230–237. [Google Scholar] [CrossRef]
  74. Bremer, L.L.; Brauman, K.A.; Nelson, S.; Prado, K.M.; Wilburn, E.; Fiorini, A.C.O. Relational values in evaluations of upstream social outcomes of watershed Payment for Ecosystem Services: A review. Curr. Opin. Environ. Sustain. 2018, 35, 116–123. [Google Scholar] [CrossRef]
  75. McAfee, K.; Shapiro, E.N. Payments for Ecosystem Services in Mexico: Nature, Neoliberalism, Social Movements, and the State. Ann. Assoc. Am. Geogr. 2010, 100, 579–599. [Google Scholar] [CrossRef]
  76. Peng, W.; Robinson, B.E.; Zheng, H.; Li, C.; Wang, F.; Li, R. Telecoupled Sustainable Livelihoods in an Era of Rural-Urban Dynamics: The Case of China. Sustainability 2019, 11, 2716. [Google Scholar] [CrossRef] [Green Version]
  77. Yanda, P.Z.; Mabhuye, E.; Mwajombe, A.; Johnson, N.; Yamat, L.E. Dynamics of Land Management and Implications on Pastoral Livelihoods in Northern Tanzania. Environ. Manag. 2021, 12, 2. [Google Scholar] [CrossRef] [PubMed]
  78. Bruno, J.E.; Fernandez-Gimenez, M.E.; Balgopal, M.M. An integrated livelihoods and well-being framework to understand northeastern Colorado ranchers’ adaptive strategies. Ecol. Soc. 2021, 2, 6. [Google Scholar] [CrossRef]
Figure 1. Map of the study area and survey sites across Changtang, Tibetan Autonomous Region, China.
Sustainability 14 05166 g001
Figure 2. Histogram of the frequency distribution of the livelihood sustainability index.
Sustainability 14 05166 g002
Figure 3. Comparisons of livelihood capitals between high- and low sustainability households.
Sustainability 14 05166 g003
Table 1. Index system and descriptive statistics of household livelihood sustainability assessment.
DimensionIndexIndex Explanation
Natural Capital(X1) Per capita grassland area contractedPer capita grassland area contracted (hm2).
(X2) Grassland quality1 is very good, 0 is normal.
Human Capital(X3) Household labor capacityThe number of people between 16 and 64 who are capable of working, excluding students.
(X4) Family’s highest education levelPreschool and illiterate, elementary school, junior high school, high school/secondary school, university/college, and above were assigned values of 0, 1, 2, 3, and 4, respectively, taking the highest education level of the family.
(X5) Proportion of skill trainingThe ratio of the number of skill-trained labor force to the total number of family members.
(X6) Dependency ratioThe ratio of the non-working age population to the working-age population.
Financial Capital(X7) Net income per capitaThe net income of the family divided by the total number of household members (yuan).
(X8) Medical expensesIf medical expenditures per year are more than 10,000 CNY, it is assigned a value of 1; if not, 0.
(X9) Credit rating of loansThe six cases of diamond, gold, silver, copper, micro-credit, and no cases were assigned 5, 4, 3, 2, 1, and 0, respectively.
Physical Capital(X10) Household areaHousehold area of herder (m2).
(X11) Herd sizeThe number of domestic livestock raised (except for the livestock used for agricultural activities) was converted into the number of cattle, horses, and sheep (1 horse = 3 sheep units; 1 cow = 3 sheep units). (Hua et al., 2017)
(X12) Fixed asset valueThe total discounted value of production and living fixed assets, such as sheds (sheep pens), production tools (agricultural machinery and equipment, etc.), and vehicles (cars, motorcycles, etc.). Unit: yuan.
Social Capital(X13) LeadershipFamilies with a village committee member were assigned a value of 1; if not, 0.
(X14) OrganizationWhether the household participates in a cooperative production organization, such as a cooperative (0 = no, 1 = yes).
(X15) Distance from residence to townThe distance between the farmer’s residence and the nearest town (km).
Table 2. SLI composition index and the weight of the subsistence capital index.
Dimension.WeightsIndexWeightsExpected Direction
Natural Capital0.099(X1) Per capita grassland area contracted0.074+
(X2) Grassland quality0.025+
Human Capital0.283(X3) Household labor capacity0.020+
(X4) Family’s highest education level0.023+
(X5) Proportion of skill training0.192+
(X6) Dependency ratio0.048
Financial Capital0.085(X7) Net income per capita0.046+
(X8) Medical expenses0.008
(X9) Credit rating of loans0.030+
Physical Capital0.213(X10) Household area0.043+
(X11) Herd size0.078+
(X12) Fixed asset value0.092+
Social Capital0.320(X13) Leadership0.259+
(X14) Organization0.058+
(X15) Distance from residence to town0.002
Table 3. Comparative analysis of high- and low-sustainability households in terms of livelihood capital indicators.
DimensionIndexHigh-Sustainability Households Mean (Standard Deviation)Low-Sustainability Households Mean (Standard Deviation)t-Value
Natural Capital(X1) Per capita grassland area contracted108.090 (147.410)122.450 (145.920)−0.863
(X2) Grassland quality0.790 (0.410)0.820 (0.382)−0.752
Human Capital(X3) Household labor capacity2.960 (1.460)2.560 (1.396)2.425
(X4) Family’s highest education level2.410 (1.271)2.320 (1.290)0.667
(X5) Proportion of skill training0.086 (0.196)0.061(0.126)1.598 **
(X6) Dependency ratio58.913 (29.337)59.346 (32.136)−0.121 **
Financial Capital(X7) Net income per capita17,446.905 (13,256.630)14,176.893 (9628.840)2.847 ***
(X8) Medical expenses0.010 (0.105)0.070 (0.262)−2.255 ***
(X9) Credit rating of loans1.570 (1.209)1.510 (1.148)0.430
Physical Capital(X10) Household area155.800 (141.504)128.434 (102.456)2.238 ***
(X11) Herd size120.970 (139.386)109.710 (127.498)0.722
(X12) Fixed asset value150,865.920 (259,861.648)80,935.630 (138,094.843)3.893 ***
Social Capital(X13) Leadership0.960 (0.207)0.000(0.000)113.981 ***
(X14) Organization0.670 (0.474)0.620 (0.486)0.874 **
(X15) Distance from residence to town12.887 (15.058)14.387 (17.426)−0.863
Standard errors in parentheses, ** p < 0.05, *** p < 0.01.
Publisher’s Note: MDPI stays neutral with regard to jurisdictional claims in published maps and institutional affiliations.

