Article

Spatial and Temporal Differentiation of Mountain Ecosystem Service Trade-Offs and Synergies: A Case Study of Jieshi Mountain, China

School of Landscape Architecture, Beijing Forestry University, Beijing 100083, China
*
Author to whom correspondence should be addressed.
Sustainability 2022, 14(8), 4652; https://doi.org/10.3390/su14084652
Submission received: 10 March 2022 / Revised: 11 April 2022 / Accepted: 11 April 2022 / Published: 13 April 2022

Abstract

:
There are complex interactions among various services in mountain ecosystems, and the optimization of ecosystem spatial patterns based on the trade-offs and synergies of mountain ecosystem services can effectively improve the comprehensive benefits of a multi-ecosystem service. Jieshi Mountain is a typical historical and cultural mountain in China, and its social and economic development is at the average level in China. It is of great significance to explore the ecosystem services and mountain environmental factors in the trade-offs and synergies of ecosystem services to promote the coordinated development of the man–land relationship. Based on an evaluation of ecosystem service value and comprehensive analysis of the spatial and temporal pattern of trade-offs and synergies in the Jieshi Mountain area from 1980 to 2020, the spatial differentiation of the trade-offs and synergies of four key ecosystem services—water yield, soil retention, carbon storage, and habitat quality—were identified. We found that carbon storage-soil retention and habitat quality-soil retention have a strong trade-off relationship, and the area accounts for a relatively high proportion. In terms of land-cover types, the frequency of the synergistic effect between woodland and cultivated land is higher. There are different correlations between ecosystem service trade-offs and synergies among mountain environmental factors, among which elevation has a higher influence on synergy. Identifying the trade-off and synergy relationship between ecosystem services helps in making decisions about different mountain landscape planning and management strategies.

Graphical Abstract

1. Introduction

Scholars in the field of ecology put forward the concept of “ecosystem services” by studying the relationship between the ecosystem and human beings [1]. The evaluation, maintenance, and promotion of ecosystem services have become a global focus. Research shows that the real interaction between different ecosystem services is complicated [2,3], but it can be abstractly summarized as synergies and trade-offs [4,5]. Due to the influence of people’s demand preferences for ecosystem services, when people consume one or several ecosystem services, they consciously or unconsciously affect the provision of other ecosystem services, which results in the trade-offs and synergies in ecosystem services [4]. The synergy of ecosystem services means that consuming certain ecosystem services causes an increased (win-win) or decreased (double-loss) impact on the related ecosystem services. At present, exploring the trade-offs and synergies between different ecosystem services has become one of the core issues in ecosystem services research [6].
Research into the spatial change between ecosystem service trade-offs and synergies has become a trend in the landscape, ecology, geography, and other related research fields [7,8]. Different services depend on different land-cover types and environmental factors [9], and land-cover types and spatial distribution are one of the direct driving forces affecting the spatial pattern and quantity changes in ecosystem services [10,11,12,13]. The research shows that the supply of ecosystem services has distinct spatial heterogeneity [14], and the change in ecosystem service supply caused by land-cover changes is one of the early research focuses. It is a common practice in the world to improve ecosystem services by adjusting land-use policies. For example, the Payments for Ecosystem Services (PES) policy provides financial incentives to landowners to maintain or enhance ecosystem services [15]; however, due to the objective existence of trade-offs and synergies of ecosystem services, the promotion of a certain ecosystem service may undermine other services without fully recognizing this relationship. A trade-off relationship between provisioning service and culture or regulation service is found [16,17], and whether this relationship is valid in all kinds of landscape types remains to be further studied [18,19]. At present, the research on the trade-offs and synergies of ecosystem services mostly focuses on marine, farmland, wetland, and other ecosystems, and the impact of these ecosystem services on human well-being [20,21,22], while the research on mountain ecosystems is not sufficient.
Mountainous areas provide a variety of ecosystem services, with rich geographical features and natural resources [23]. The horizontal and vertical heterogeneity of mountainous areas has a significant impact on water sources [24], soil and vegetation, and then leads to a change in landscape pattern [25,26]. Large mountain systems (Qinghai-Tibet Plateau, Andes, etc.) could even further affect the distribution and change of total ozone in the atmosphere through their influence on atmospheric circulation [27]. The effective maintenance and management of mountain landscapes can not only have a positive impact on cultural ecosystem services [28] but also has many benefits in terms of biodiversity and regulation services (such as flood mitigation, erosion control, nutrient cycling) [29,30]. Schirpke et al. [31] found that there is a trade-off between the aesthetic value of mountains and wood production, carbon storage, and soil retention after evaluating a number of ecosystem service indicators in South Tyrol, Italy There are complex interactions among various ecosystem services in mountain ecosystems [32] and sufficient attention should be paid to the balancing of trade-offs and synergies in mountain natural environment management [33].
Approximately 22% of the world’s population lives in mountains, and more people are directly affected by mountain ecosystems [34]; for example, residents around the mountain get food, water, and fuel from the mountains, and a wider range of residents are affected by the climatic conditions formed by the mountains. The growing population leads to a higher demand for mountain ecosystem services [35,36]. As a mountainous country, mountainous area is a very common topography in China, with multiple landform types and mountain landscapes. Mountainous areas take about 6.5 million km2, accounting for about 2/3 of the total territory [37]. Compared with plains, the mountain ecosystem is rather fragile and sensitive and greatly affected by environmental change. Therefore, in addition to land-cover changes in mountainous areas, the trade-offs and synergies between mountain environmental characteristics and ecosystem services are also worthy of attention.
In China, hilly mountainous areas are the landforms that are inhabited the most by human beings, with the integration of natural landscape and cultural heritage. The highest peak of the Jieshi Mountain is 691 m above sea level. Jieshi Mountain is influenced by urban development and is strongly affected by wind and water erosion. It has the typical mountainous characteristics of eastern Hebei Province, and has experienced quarrying since the 1970s and was ecologically restored after quarry shut-downs in 2017. Exploring the level of ecosystem services in this region and the role of mountain environmental factors in the trade-offs and synergies of ecosystem services is of great significance for understanding the relationship between mountain ecosystem services and human well-being [33]. The Integrated Valuation of Ecosystem Services and Trade offs (InVEST) model realizes the spatialization of a quantitative evaluation of ecosystem service function value by simulating the changes in the material quality and value of ecosystem service under different land-cover scenarios. This study mainly uses the InVEST model to evaluate the four main ecosystem services in Jieshi Mountain, water yield, soil retention, carbon storage, and habitat quality, combined with the correlation analysis method, to analyze the trade-off and synergy between services, and to further study its relationship between land-cover and environmental factors.

2. Materials and Methods
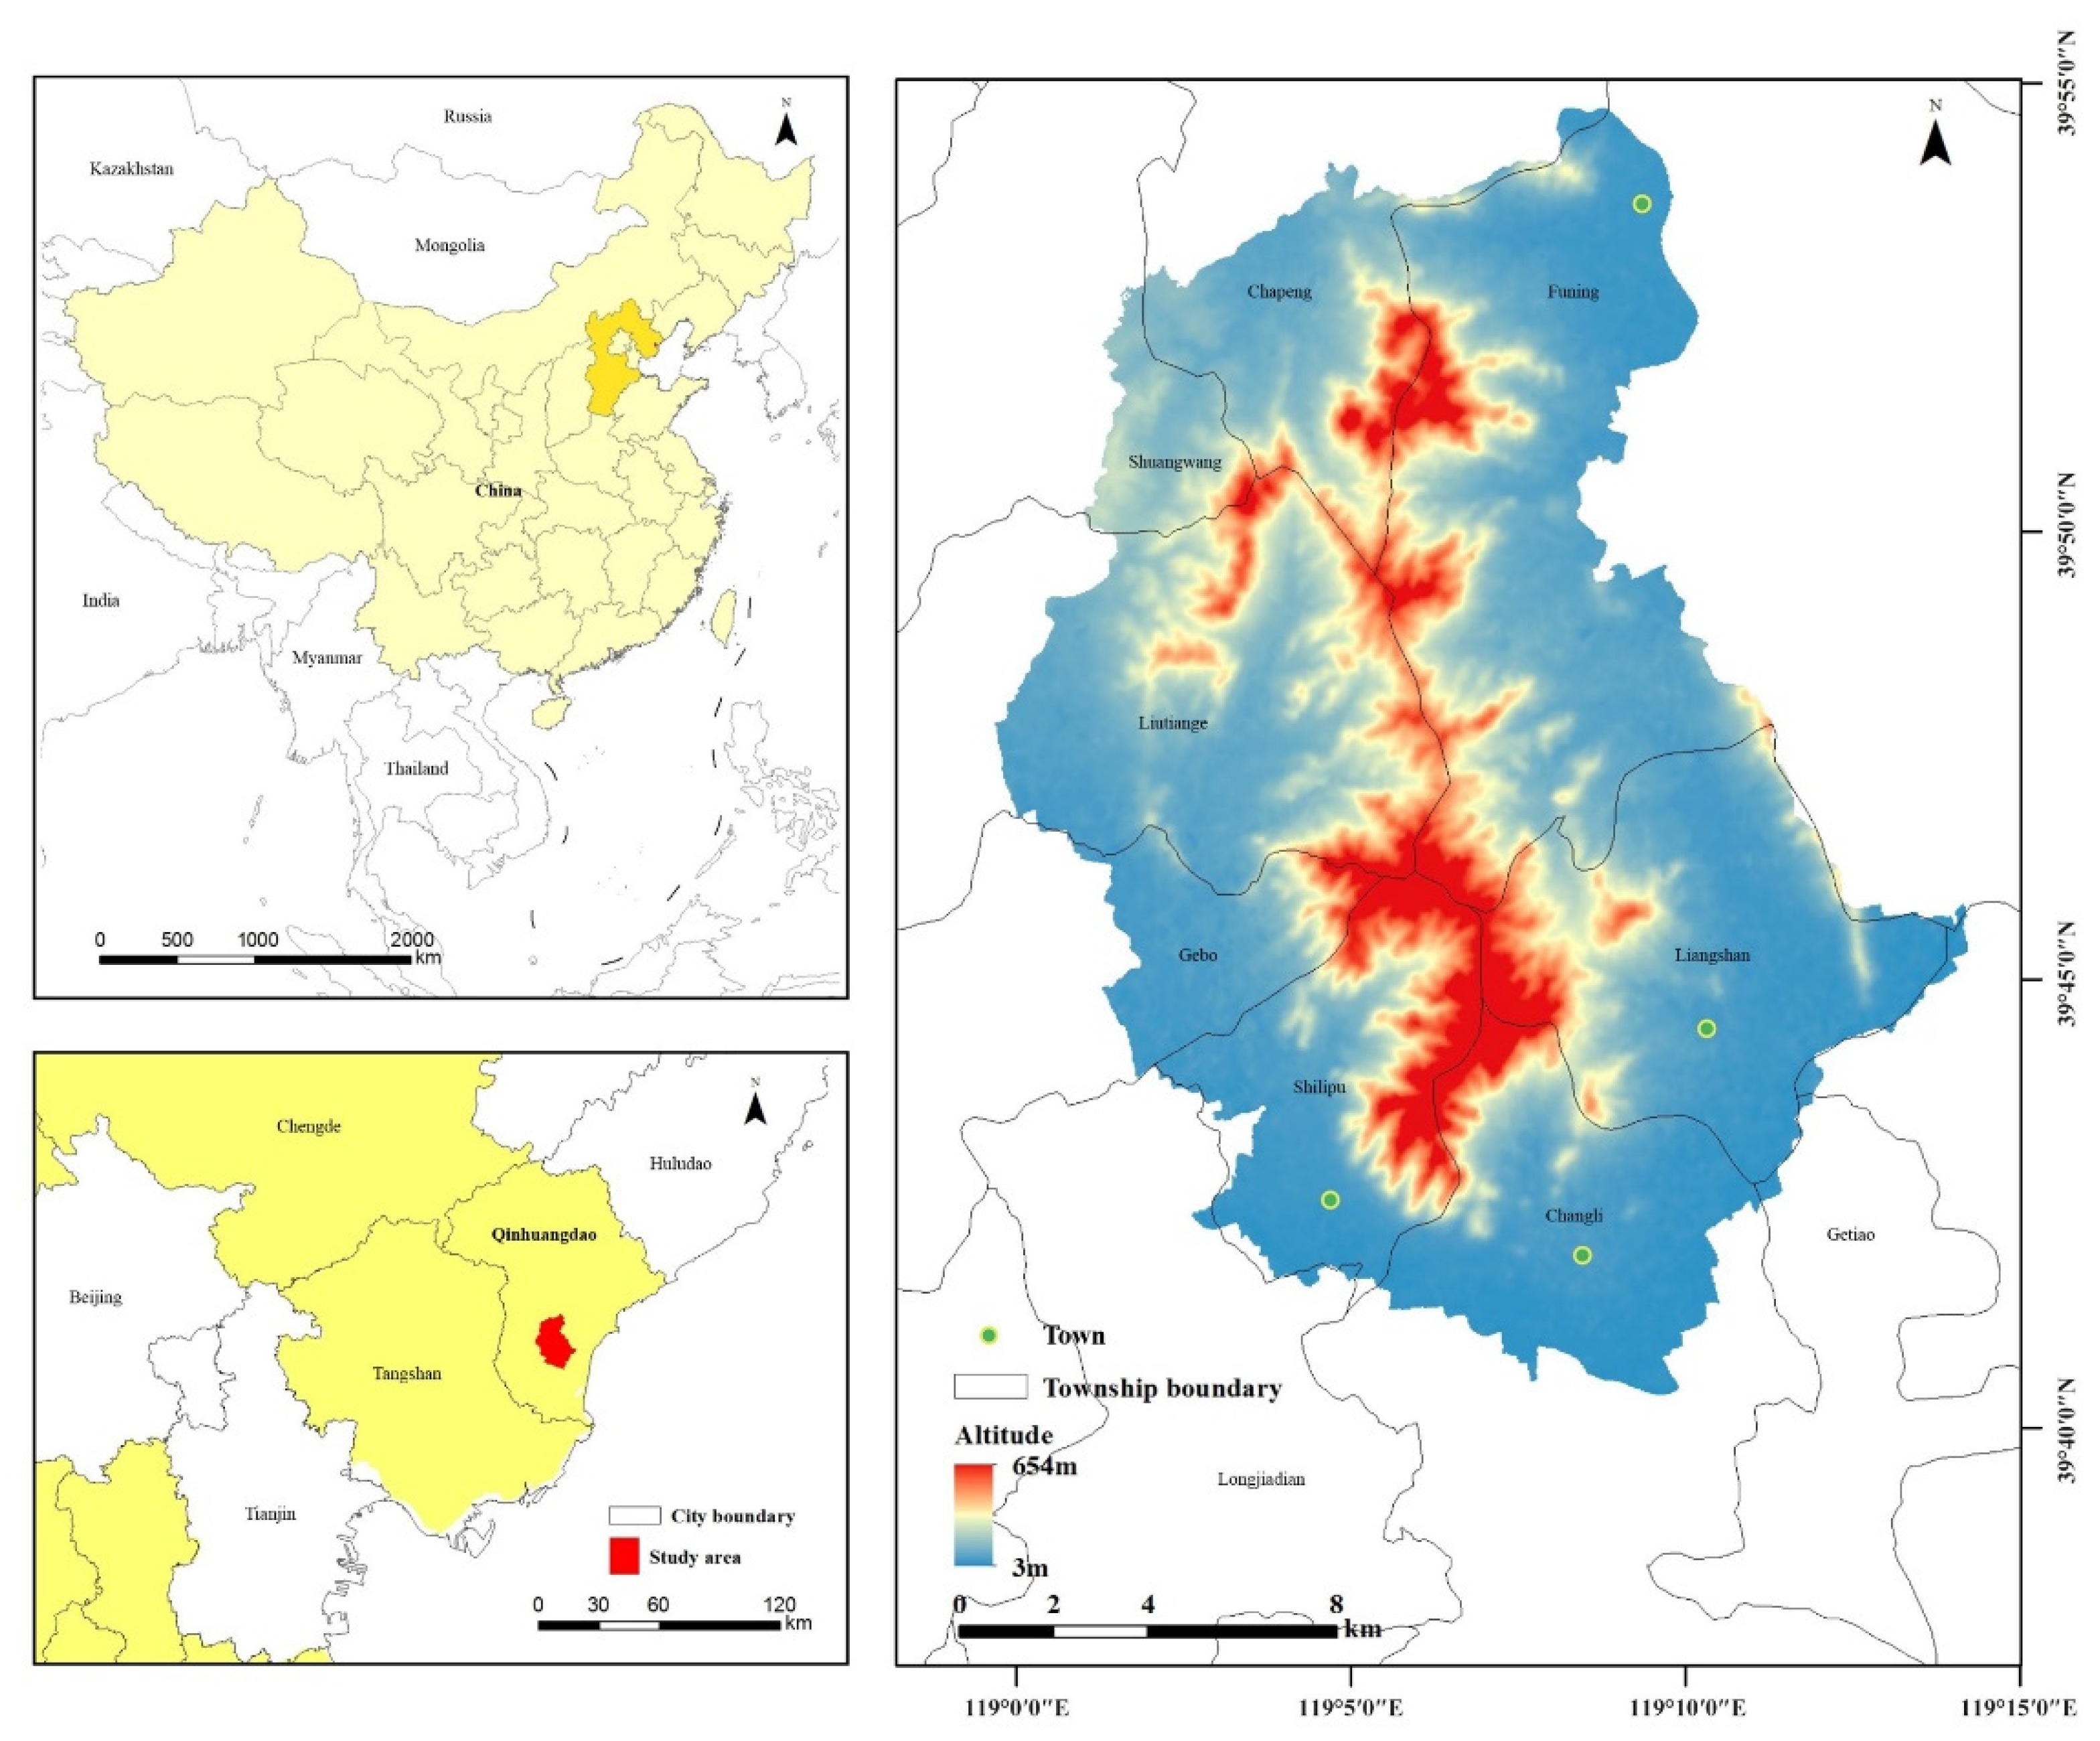
2.1. Study Area

Jieshi Mountain is located at the southernmost tip of the remaining vein of the eastern section of Yanshan Mountain in northern China and belongs to the piedmont plain (Figure 1). It is mainly a low mountainous and hilly area, where the Jieshi Mountain Scenic Area and surrounding counties are located, covering an area of 350 square kilometers. The annual average precipitation is 602.8 mm [38]. The vegetation has typical characteristics of North temperate-zone plants. The study area consists of 9 townships and 119 administrative villages, with a population of about 171,500 and a population density of about 450 people/km2.
There is a long history of interaction between humans and the environment in Jieshi Mountain. As the gateway from the Central Plains to the northeast border area, nine emperors have climbed Jieshi Mountain in history. Liuhe, Baozigou, and Grape Valley have a wine-brewing history of more than 300 years; they are one of the main grape-producing areas in China and have become important industries and tourism resources in the region. Since being quarried in the 1960s, Jieshi Mountain has mined 1–1.5 million tons of ore each year, forming a mine area of 450,000 square meters. Quarries began to be gradually shut down in 2010. Since 2015, the government has started to restore these abandoned mines and carry out ecological restoration on nearby mountains.

2.2. Data Requirements and Preparations

Spatial mapping of ecosystem services can reflect the spatial location characteristics of various ecosystem services, and provide quantitative and intuitive visual expression for the decision-makers, stakeholders, and beneficiaries involved in the decision-making process [39,40]. The spatio–temporal dimensions of ecosystem service trade-offs and synergies can be presented efficiently and intuitively through mapping. Therefore, in this study, the InVEST model is used to evaluate various ecosystem services, and data preparation and processing are carried out according to the data requirements of the InVEST model. Basic data such as the Digital Elevation Model (DEM), Land-Use/Land-Cover (LULC) (Table A1 and Table A2), climate, soil, and other data processing methods are obtained according to the requirements of the InVEST model (Table A3 and Table A4). Environmental factors in mountainous areas are extracted from elevation data. The mountain’s environmental factors include elevation, slope, and aspect, which are obtained from DEM data. Vegetation cover in mountainous areas is one of the main factors affecting ecosystem function; thus, the Normalized Difference Vegetation Index (NDVI) was selected as an environmental factor.
Using the InVEST model as the main tool, we quantitatively evaluated the carbon storage, water yield, soil retention, and habitat quality in Jieshi Mountain in 1980, 2000, 2010, and 2020, at the pixel scale (30 m × 30 m) [41], analyzed the spatial changes and reasons in the four nodes, analyze trade-off and synergies effects, and explained the role of mountain environmental factors in the trade-offs and synergies.

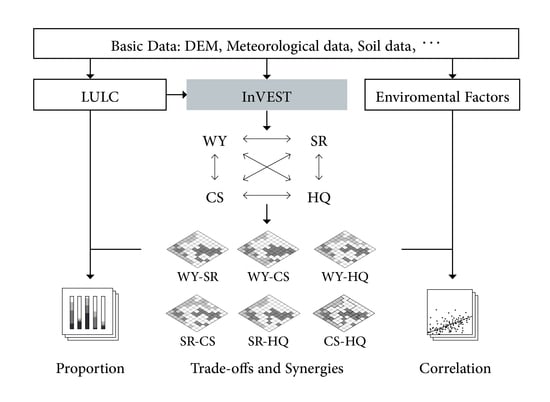
2.3. Ecosystem Service Indicators

The selection of ecosystem service indicators is very important for the accurate assessment of ecosystem services [42]. Based on the principles of relevance to human well-being, regionality, and data availability, we selected four important ecosystem services from the Millennium Ecosystem Assessment (MA) classification framework, namely, carbon storage, water yield, soil retention, and habitat quality, which have a great influence on human well-being. We also considered the importance of water resources utilization and soil retention in the study area as a natural and cultural scenic spot and the surrounding counties and towns within its radiation range. Cultural ecosystem services are mainly non-material services, among which aesthetics, recreation, sports, and other services need to obtain spiritual and emotional value through people’s experience, so it is difficult to quantitatively evaluate. Therefore, the evaluation index of cultural services is not calculated in this study.

2.4. Trade-Offs and Collaborative Computing

Pearson correlation analysis was used to calculate the correlation between the four ecosystem service indicators at different time nodes (1980, 2000, 2010, and 2020). In this study, 2000 points were randomly selected at the pixel scale, and the value of each ecosystem service indicator was extracted from the corresponding points for further correlation analysis. Finally, the mountain environmental factors were aggregated to the corresponding scale, and correlation analysis of the mountain environmental factors’ trade-offs and synergies was carried out.
Based on the grid pixel scale (30 m × 30 m) of the service evaluation results, spatial mapping of the relationship between ecosystem services in the Jieshi Mountain area was carried out, and the Pearson correlation coefficient calculation formula was adopted as follows:
r   = X × Y X × Y n ( X 2 ( X ) 2 n ) × ( Y 2 ( Y ) 2 n )
In the formula, X is one ecosystem service, Y is another ecosystem service, n is the number of years, in this formula n = 4. Substitute soil retention, carbon storage, water yield, and habitat quality services into the formula for pairwise calculations. The correlation coefficient was divided into six levels according to the strength of the trade-offs and synergies’ relationship. From high to low, these are: synergy++ (0.66–1.00), synergy+ (0.33–0.66), synergy (0.00–0.33), and trade-off (−0.33–0.00), trade-off + (−0.66–0.33), trade-off ++ (−1.00–−0.66). The spatial pattern of ecosystem service trade-offs and synergies in Jieshi Mountain from 1980 to 2020 was obtained, and the current spatial distribution map of land-cover types and trade-offs and synergies in Jieshi Mountain was cross-tabulated to investigate the trade-offs and synergies of various land-cover types.

3. Results

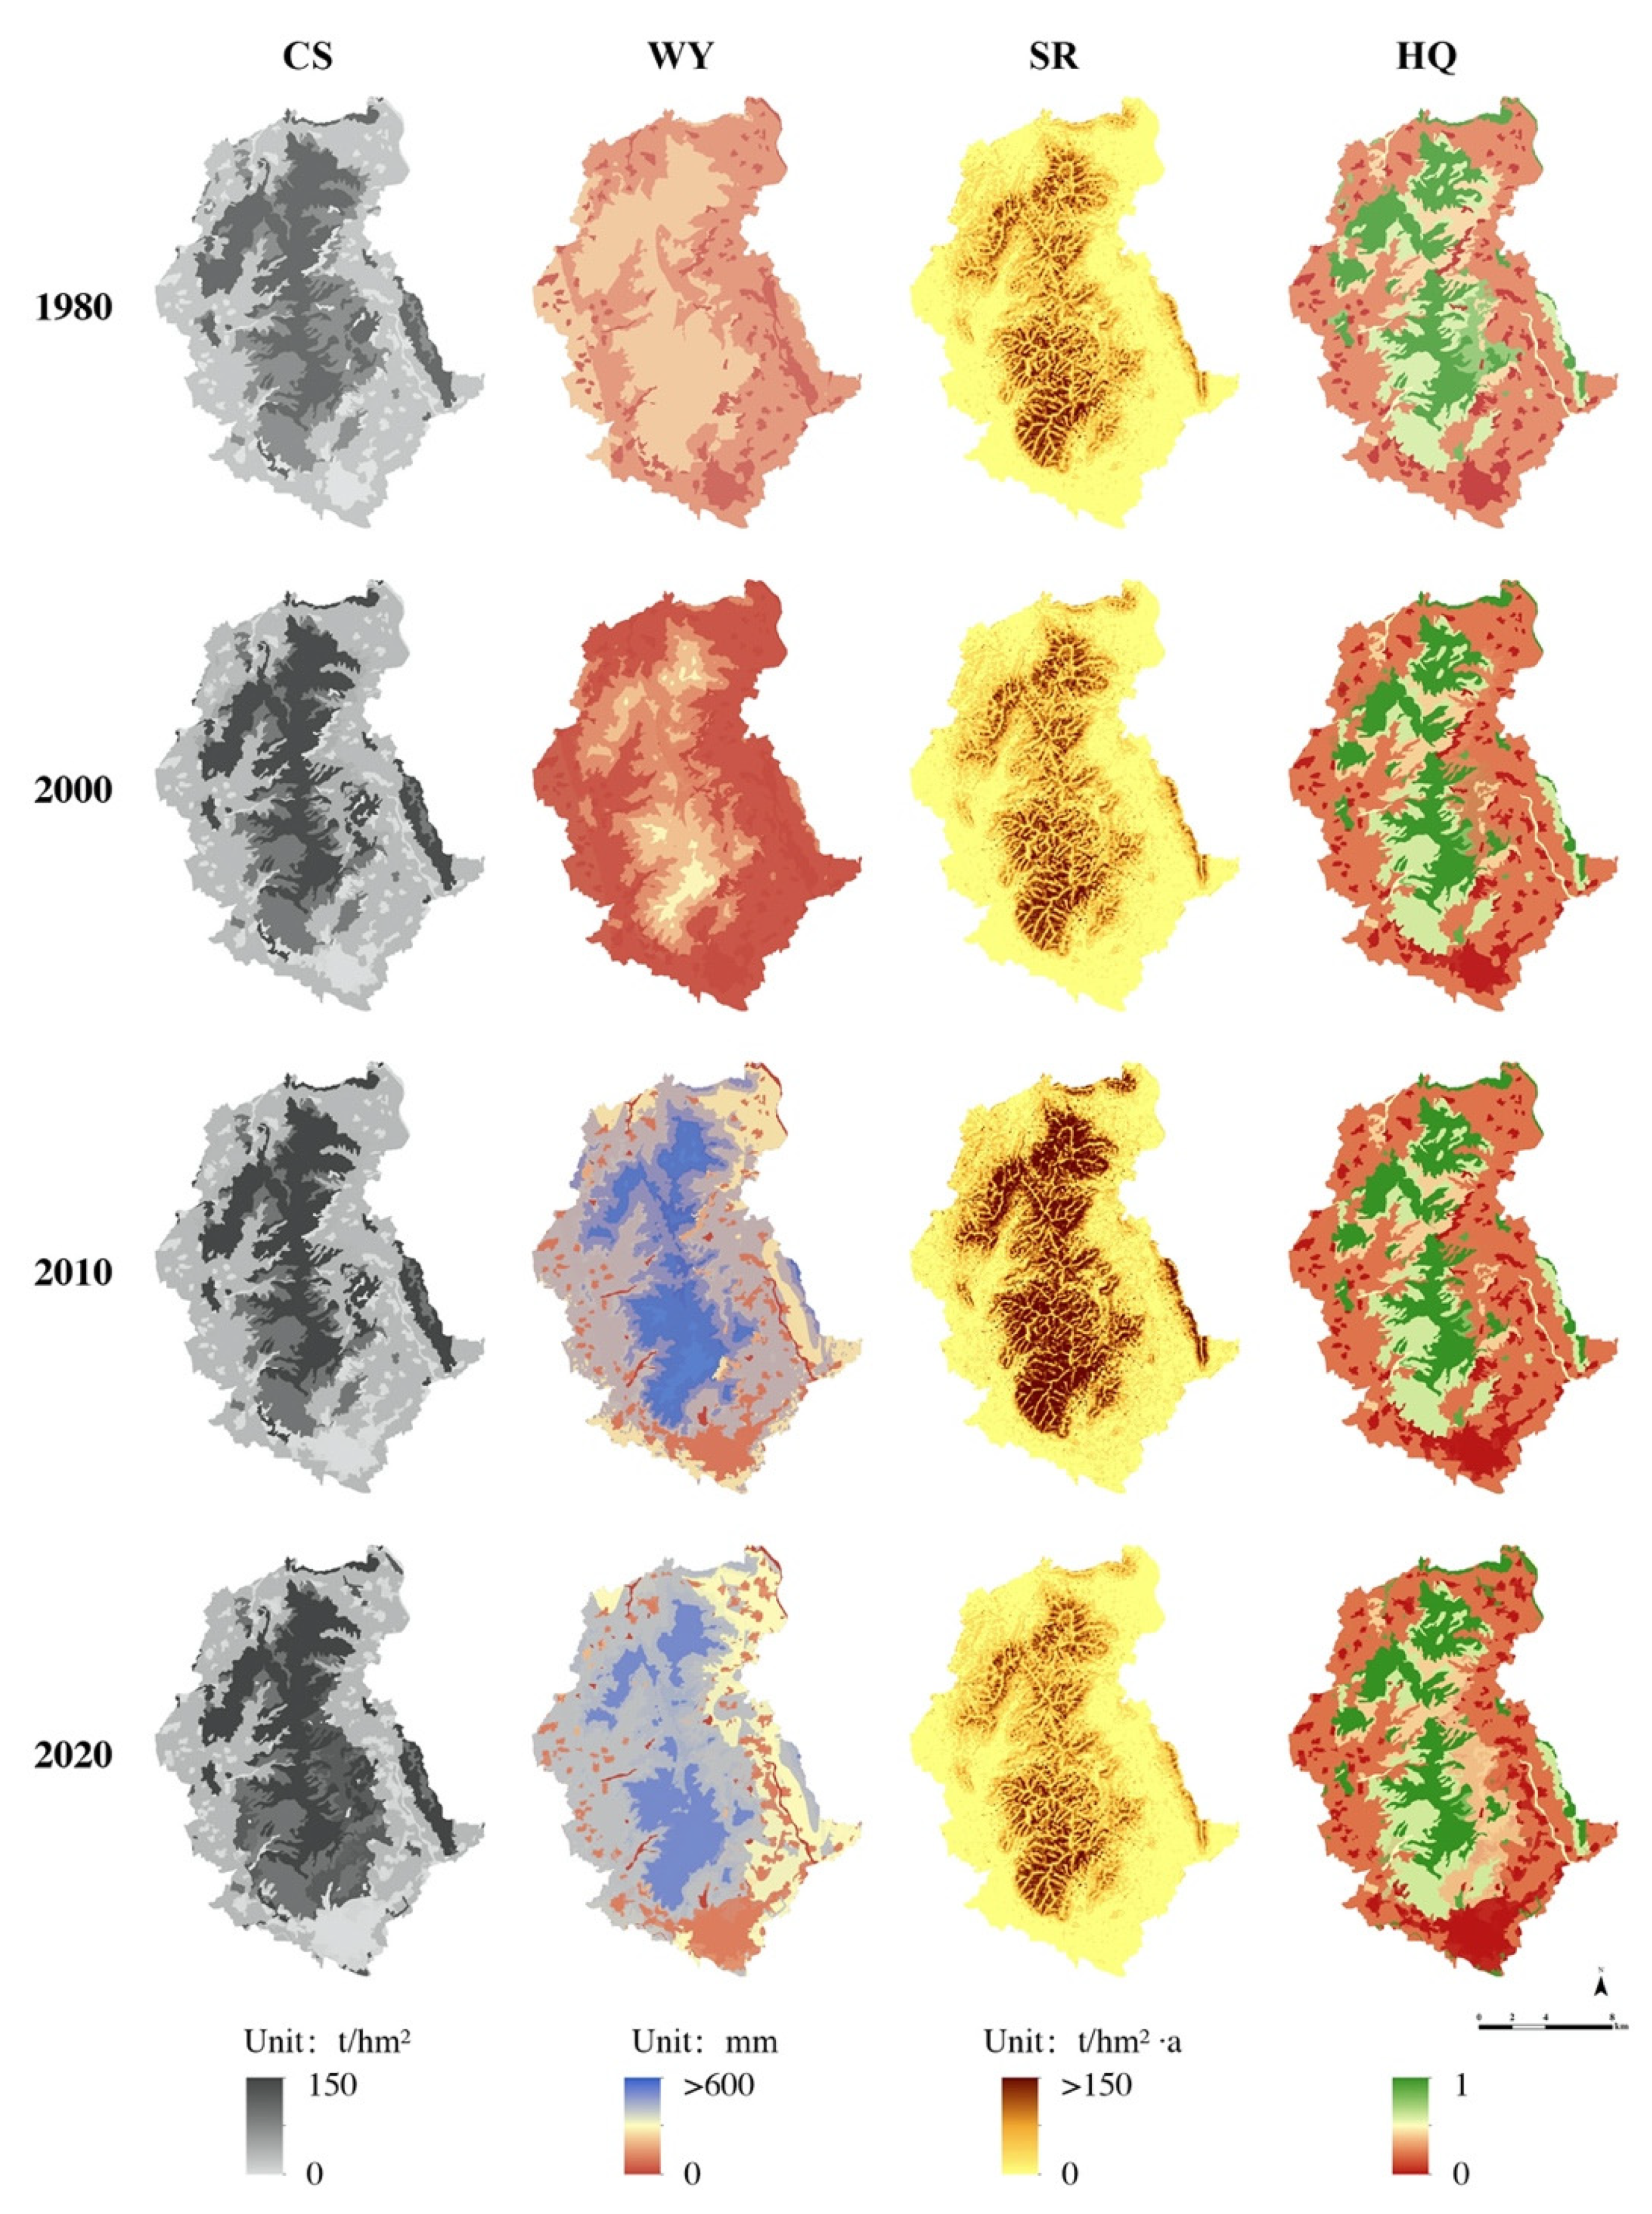
3.1. Spatial and Temporal Differentiation of Ecosystem Service Trade-Offs and Synergies

The carbon storage in most areas of Jieshi Mountain has not fluctuated greatly in the last 40 years, and the changes mainly occurred in the eastern foot of Jieshi Mountain (Figure 2). The carbon density of Jieshi Mountain is higher than that of the plain area. The water yield in Jieshi Mountain is on the rise, and the rising speed from 2000 to 2020 is faster than that from 1980 to 2000. The soil infiltration of different land-cover types and vegetation cover types are the main factors forming the difference in water yield. Affected by topography, the high-value areas of soil retention in the four-time nodes are all located in mountainous areas, and a small portion is located in the eastern forest belt. The high soil retention ability in these areas is mainly due to the important role of soil fixation by vegetation coverage, such as forests and fruit trees. With the expansion of Changli County, habitat degradation appeared in the south of the study area, and the highest habitat quality was still in the high mountain areas of Jieshi Mountain. In 2020, the most significant change occurred in the south of the study area, and the area of Changli County nearly doubled, with the habitat quality index degraded to its lowest.
The area of trade-off area between carbon storage services and soil retention services is larger than the synergistic area, and the number of pixels with a negative correlation coefficient accounts for 65% of the total (Figure 3). The trade-offs mainly appear in the east of Jieshi Mountain, while the synergies mainly appear in Changli County in the south of the study area. The correlation coefficient between carbon storage services and soil retention services is positive and high. The relationship between carbon storage services and water yield services is mainly synergistic, and the number of pixels with a positive correlation coefficient accounts for 76%, indicating that the synergies are more widely distributed. The correlation between water yield service and soil retention service is that the number of collaborative pixels accounts for 84.6% and the number of trade-off pixels accounts for 15.4%. The area of the collaborative relationship between the two services is larger than that of the trade-off. The relationship between habitat quality and water yield is mainly synergistic, which is mainly distributed in Funing District at the eastern foot of Jieshi Mountain and Liangshan Township in Changli County, around Changli County, and other areas, with a small amount distributed in the western foot of Jieshi Mountain. There is a trade-off relationship between habitat quality and water yield from the rural residential area of Xingshuyuan Village to Wufeng Mountain. The relationship between habitat quality and carbon storage service is mainly synergistic, which is mainly distributed in Funing District at the eastern foot of Jieshi Mountain and Liangshan Township of Changli County, around Changli County, and other areas, with a small amount distributed in the western foot of Jieshi Mountain. Trade-off areas are very few and are only sporadically distributed. The relationship between habitat quality and soil retention services has the most trade-offs and is mainly distributed in Funing District at the eastern foot of Jieshi Mountain and Liangshan Township in Changli County, and the synergies between habitat quality and soil retention services are stronger in a few areas around the county.

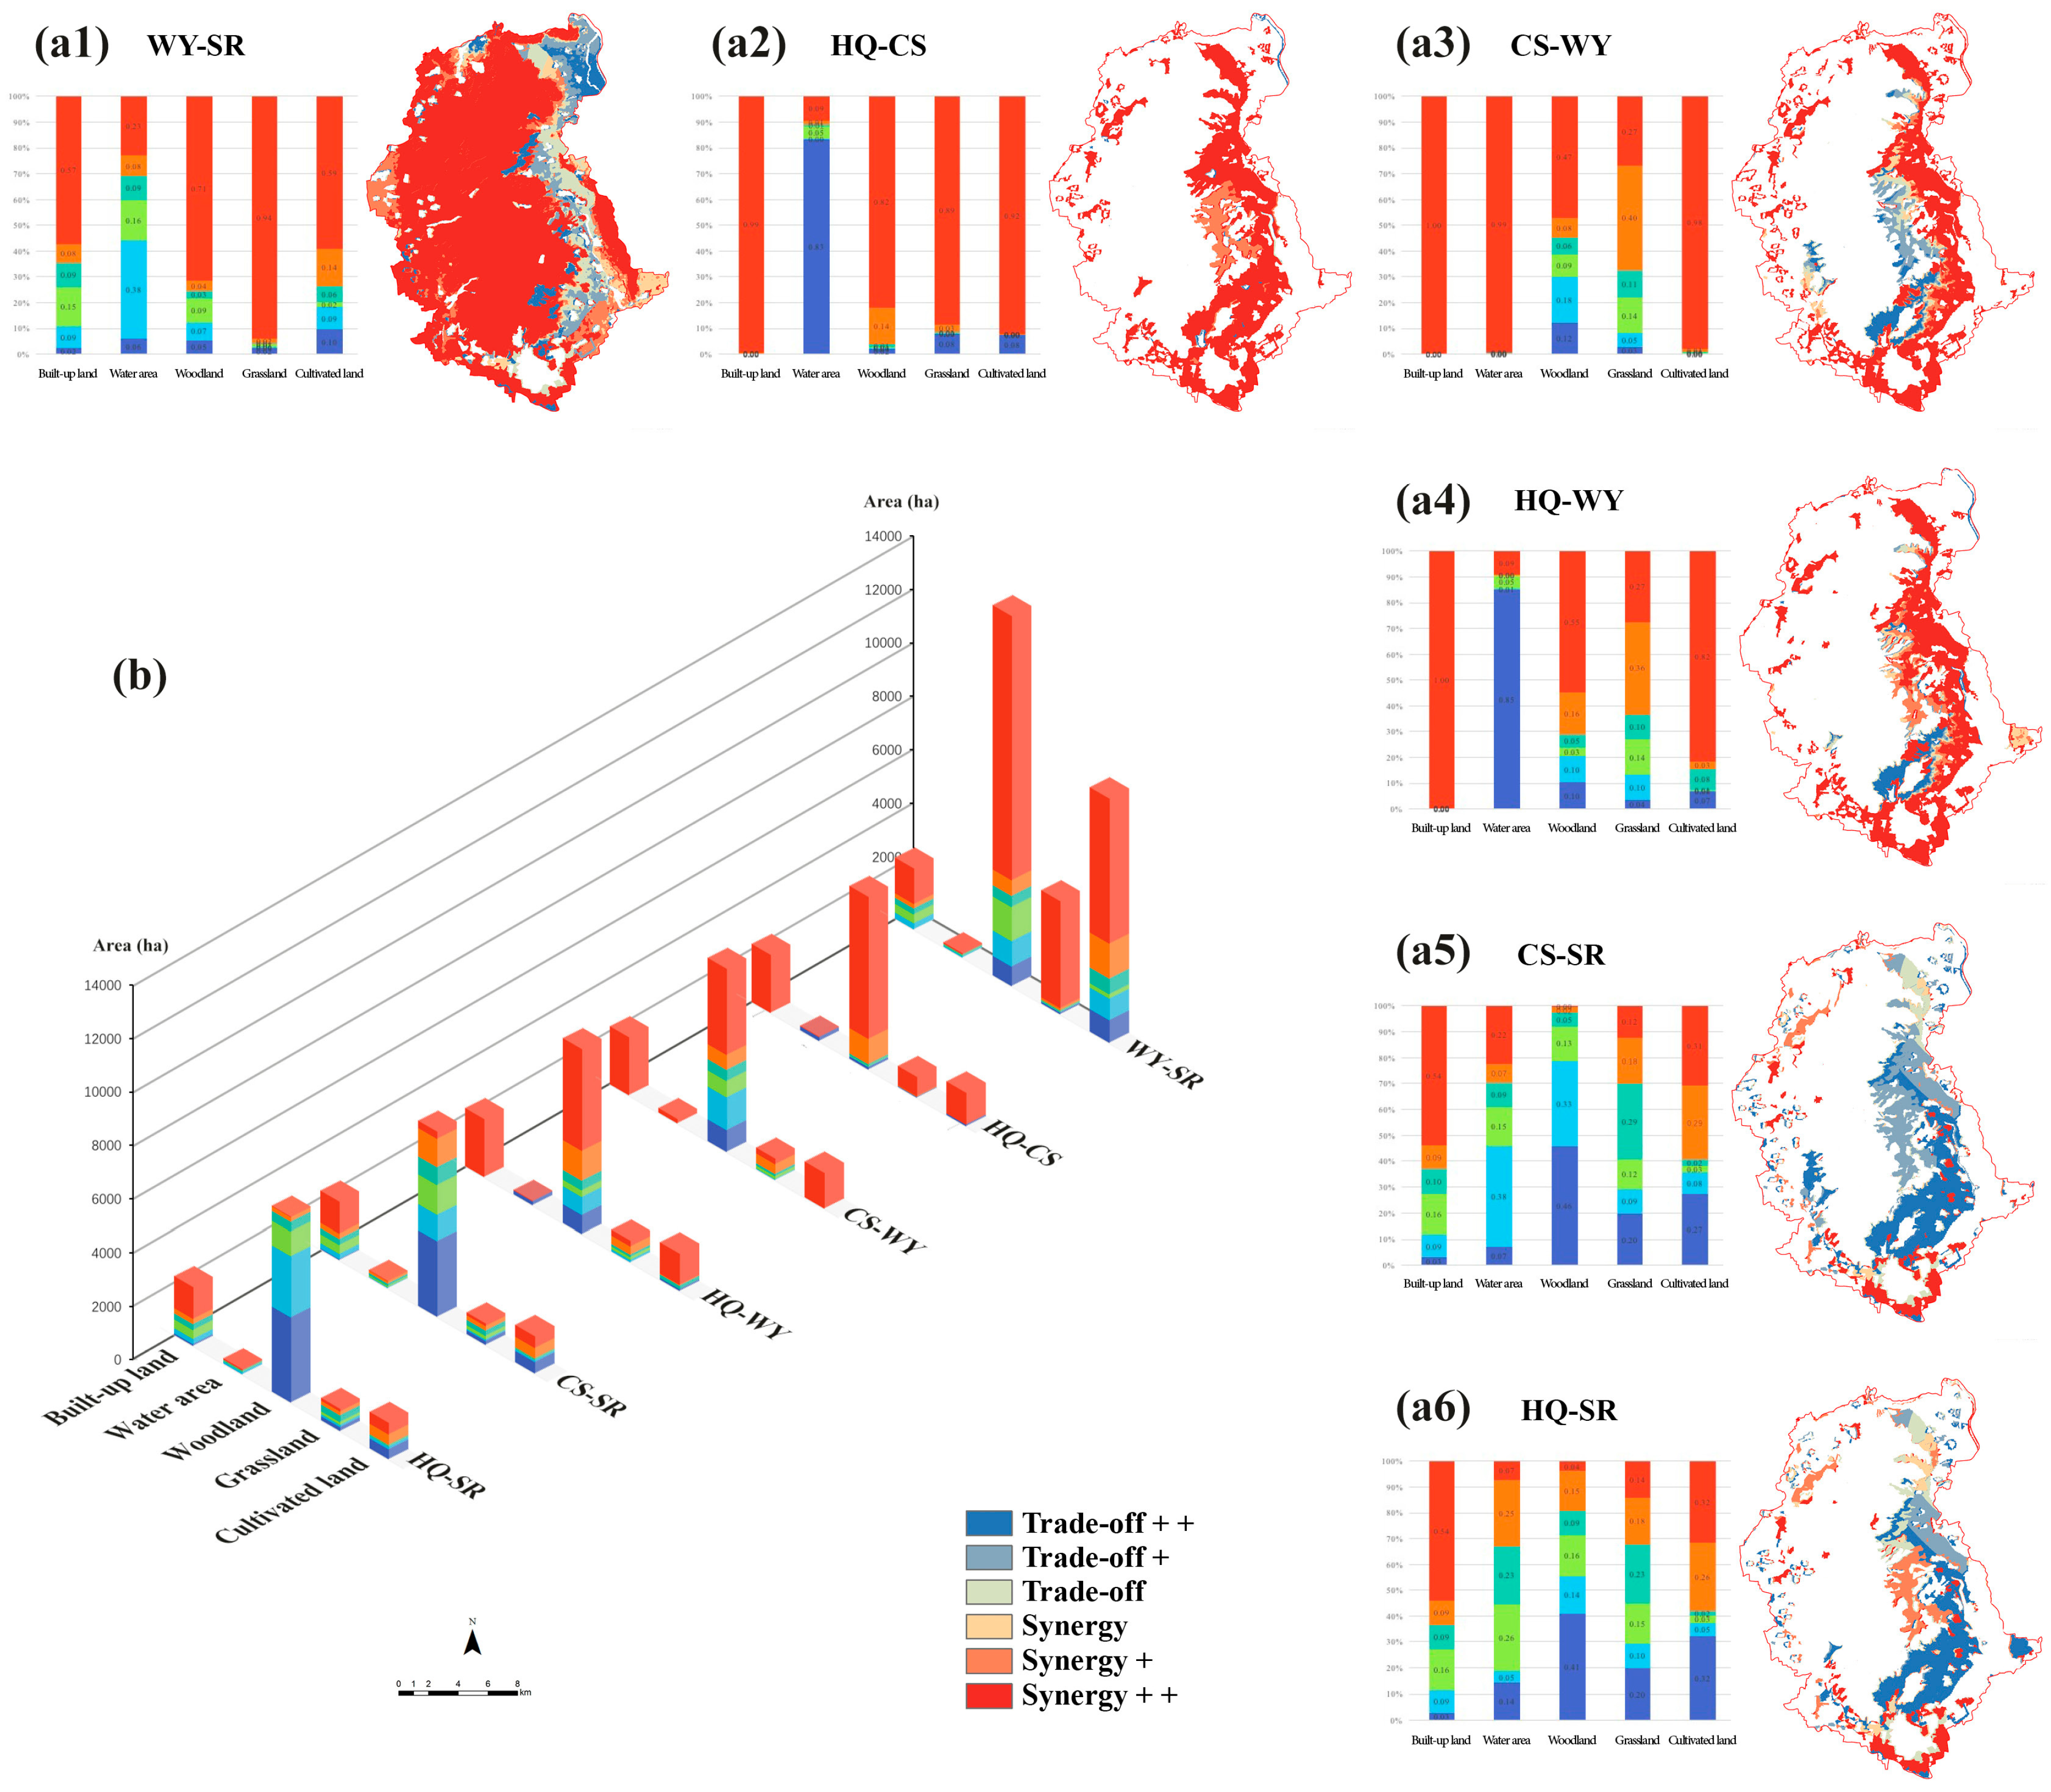
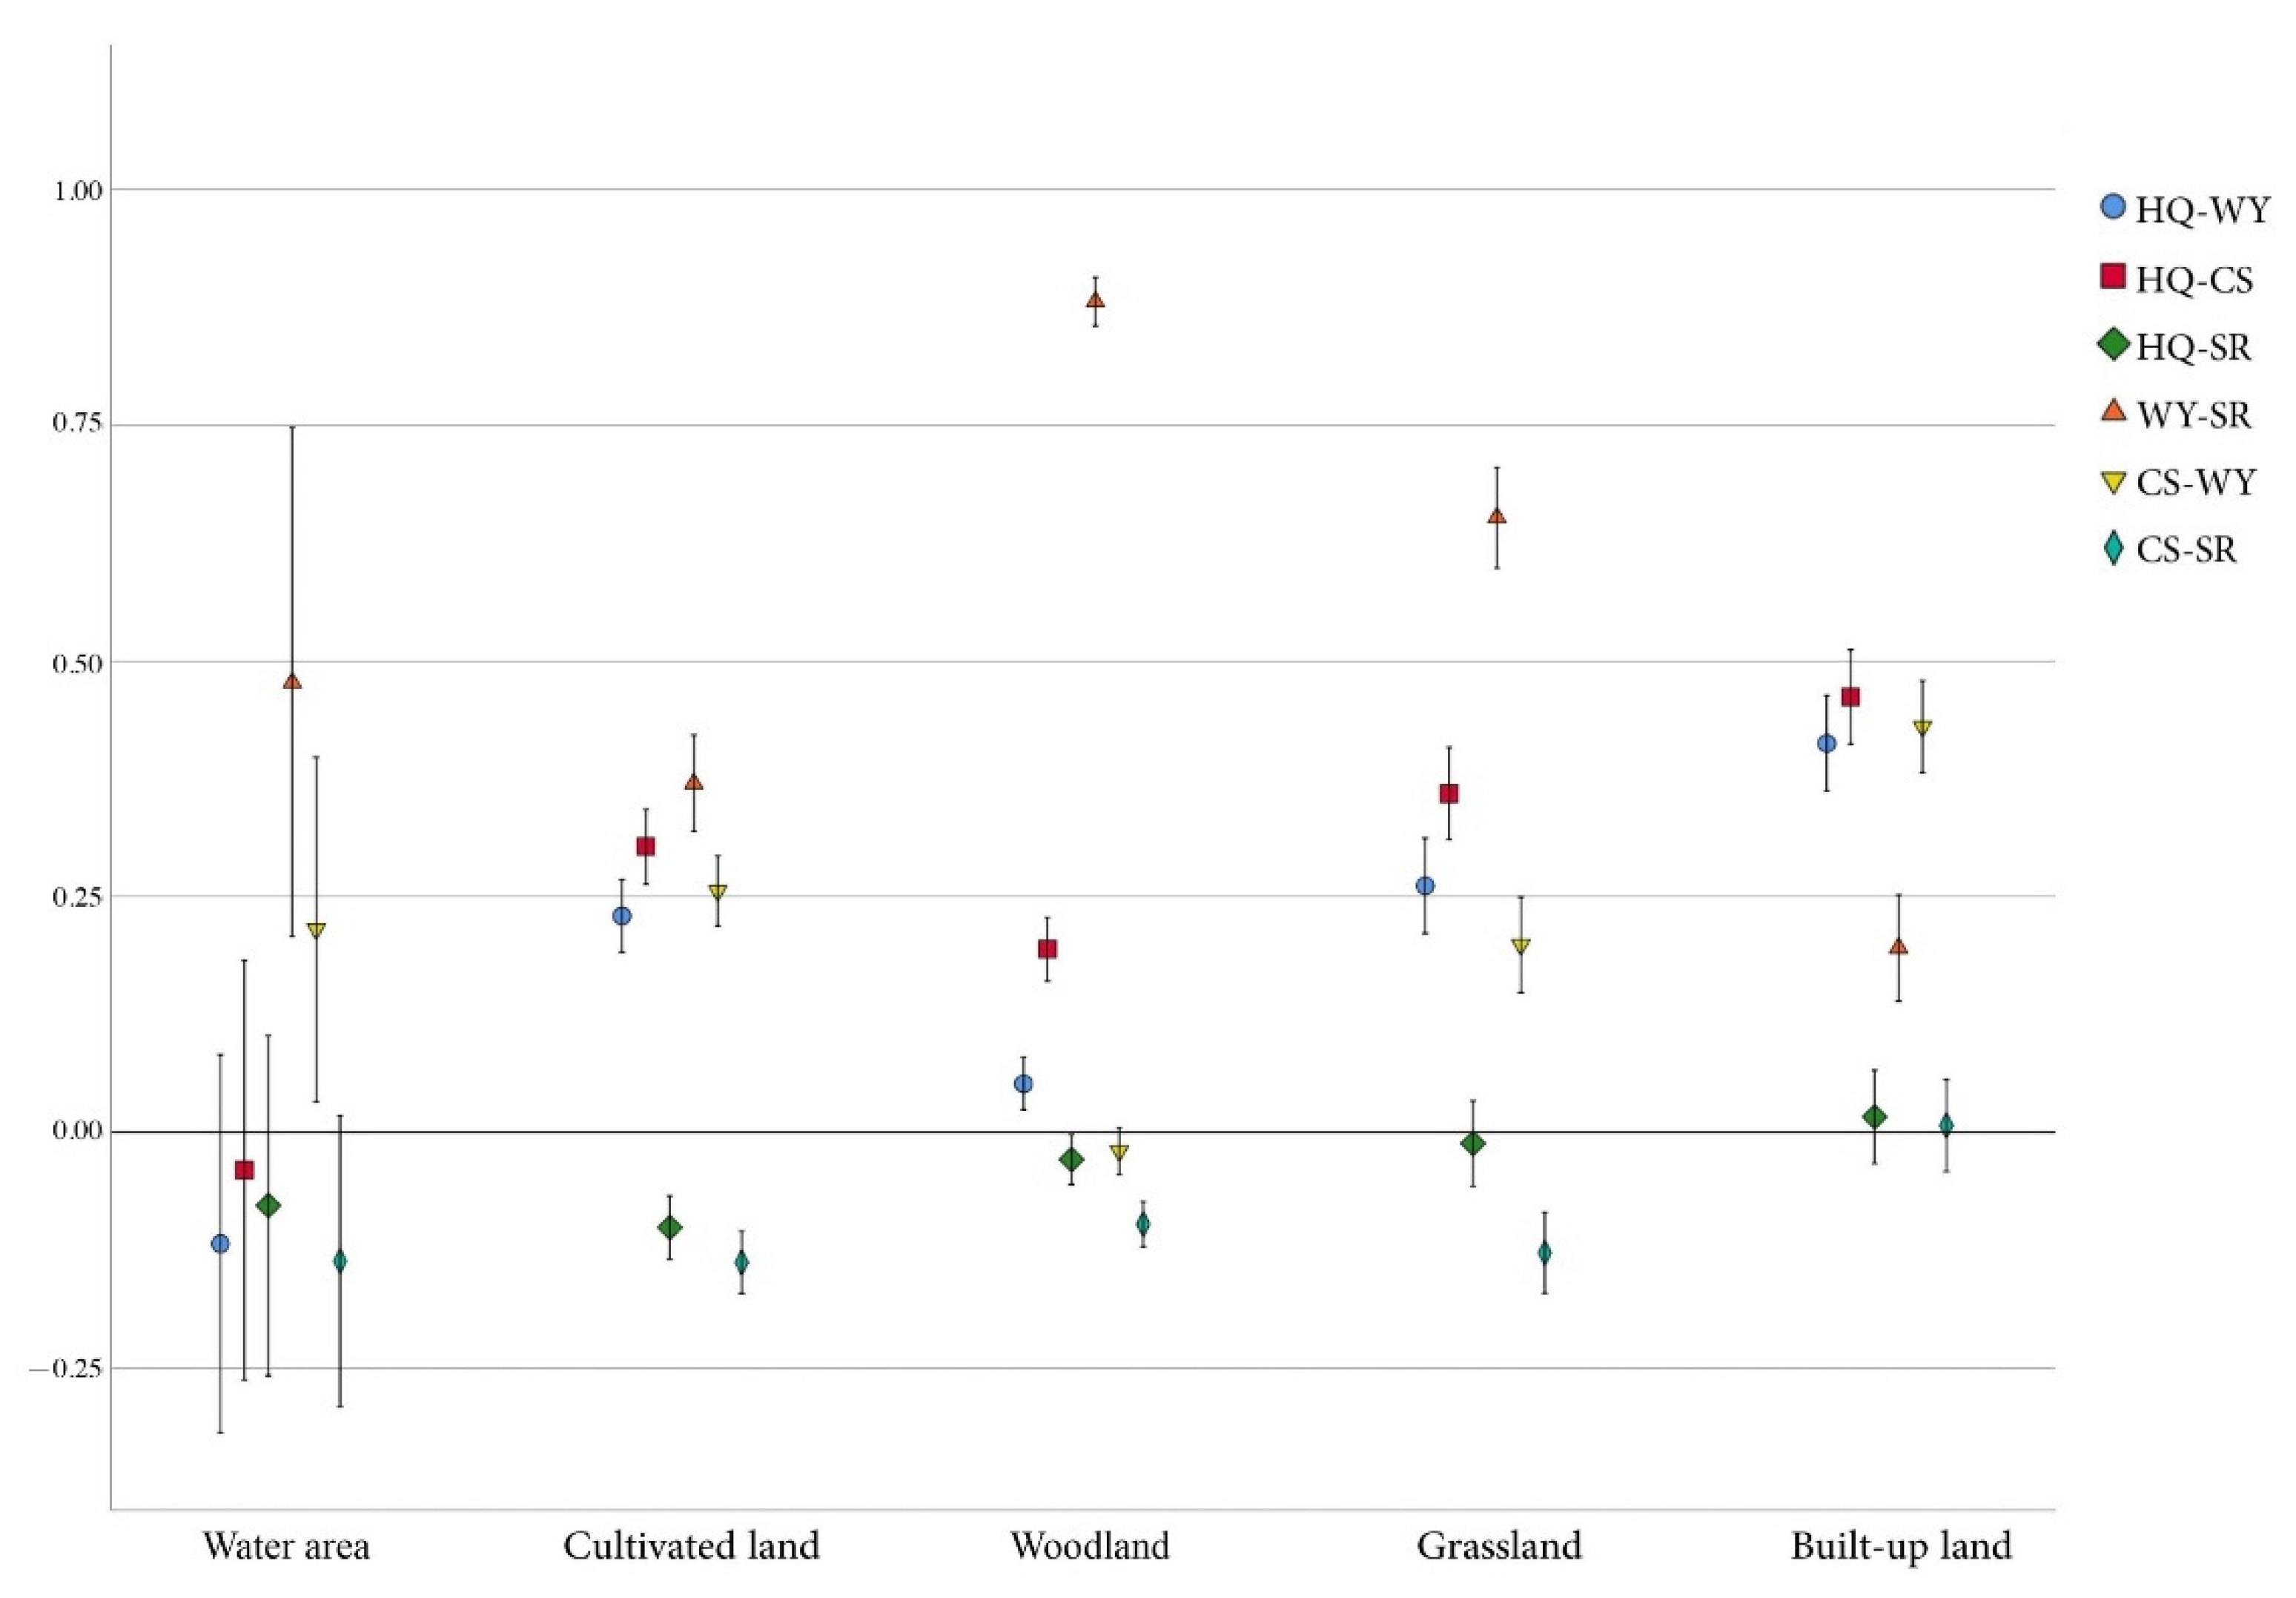
3.2. Trade-Off and Synergy Differences of Ecosystem Services in Different Land-Cover Types

Through quantitative analysis and the spatial distribution calculation of four key ecosystem service trade-offs in the study area, the main relationship between carbon storage and soil retention services is a trade-off, and the main relationship between water yield and soil retention services is synergy. (Figure 4) Carbon storage services and water yield services differ in different land-cover types. Habitat quality has a synergistic relationship with carbon storage and water yield, and a trade-off relationship with soil retention. Built-up land, water area, and cultivated land have the highest synergy in the relationship between carbon storage and water yield services, forest land and grassland have the highest synergy in the relationship between water yield and soil retention, and grassland and other land have a similar synergy in the relationship between carbon storage—water yield services and water yield-soil retention. The trade-off relationship between carbon storage and soil retention, habitat quality, and soil retention services are dominant in all five types of land cover. As one of the mainland-cover types, forest land patches are very important for soil retention and carbon storage services in the Jieshi Mountain area and will continue to maintain a high level of service provision when without a strong interference.

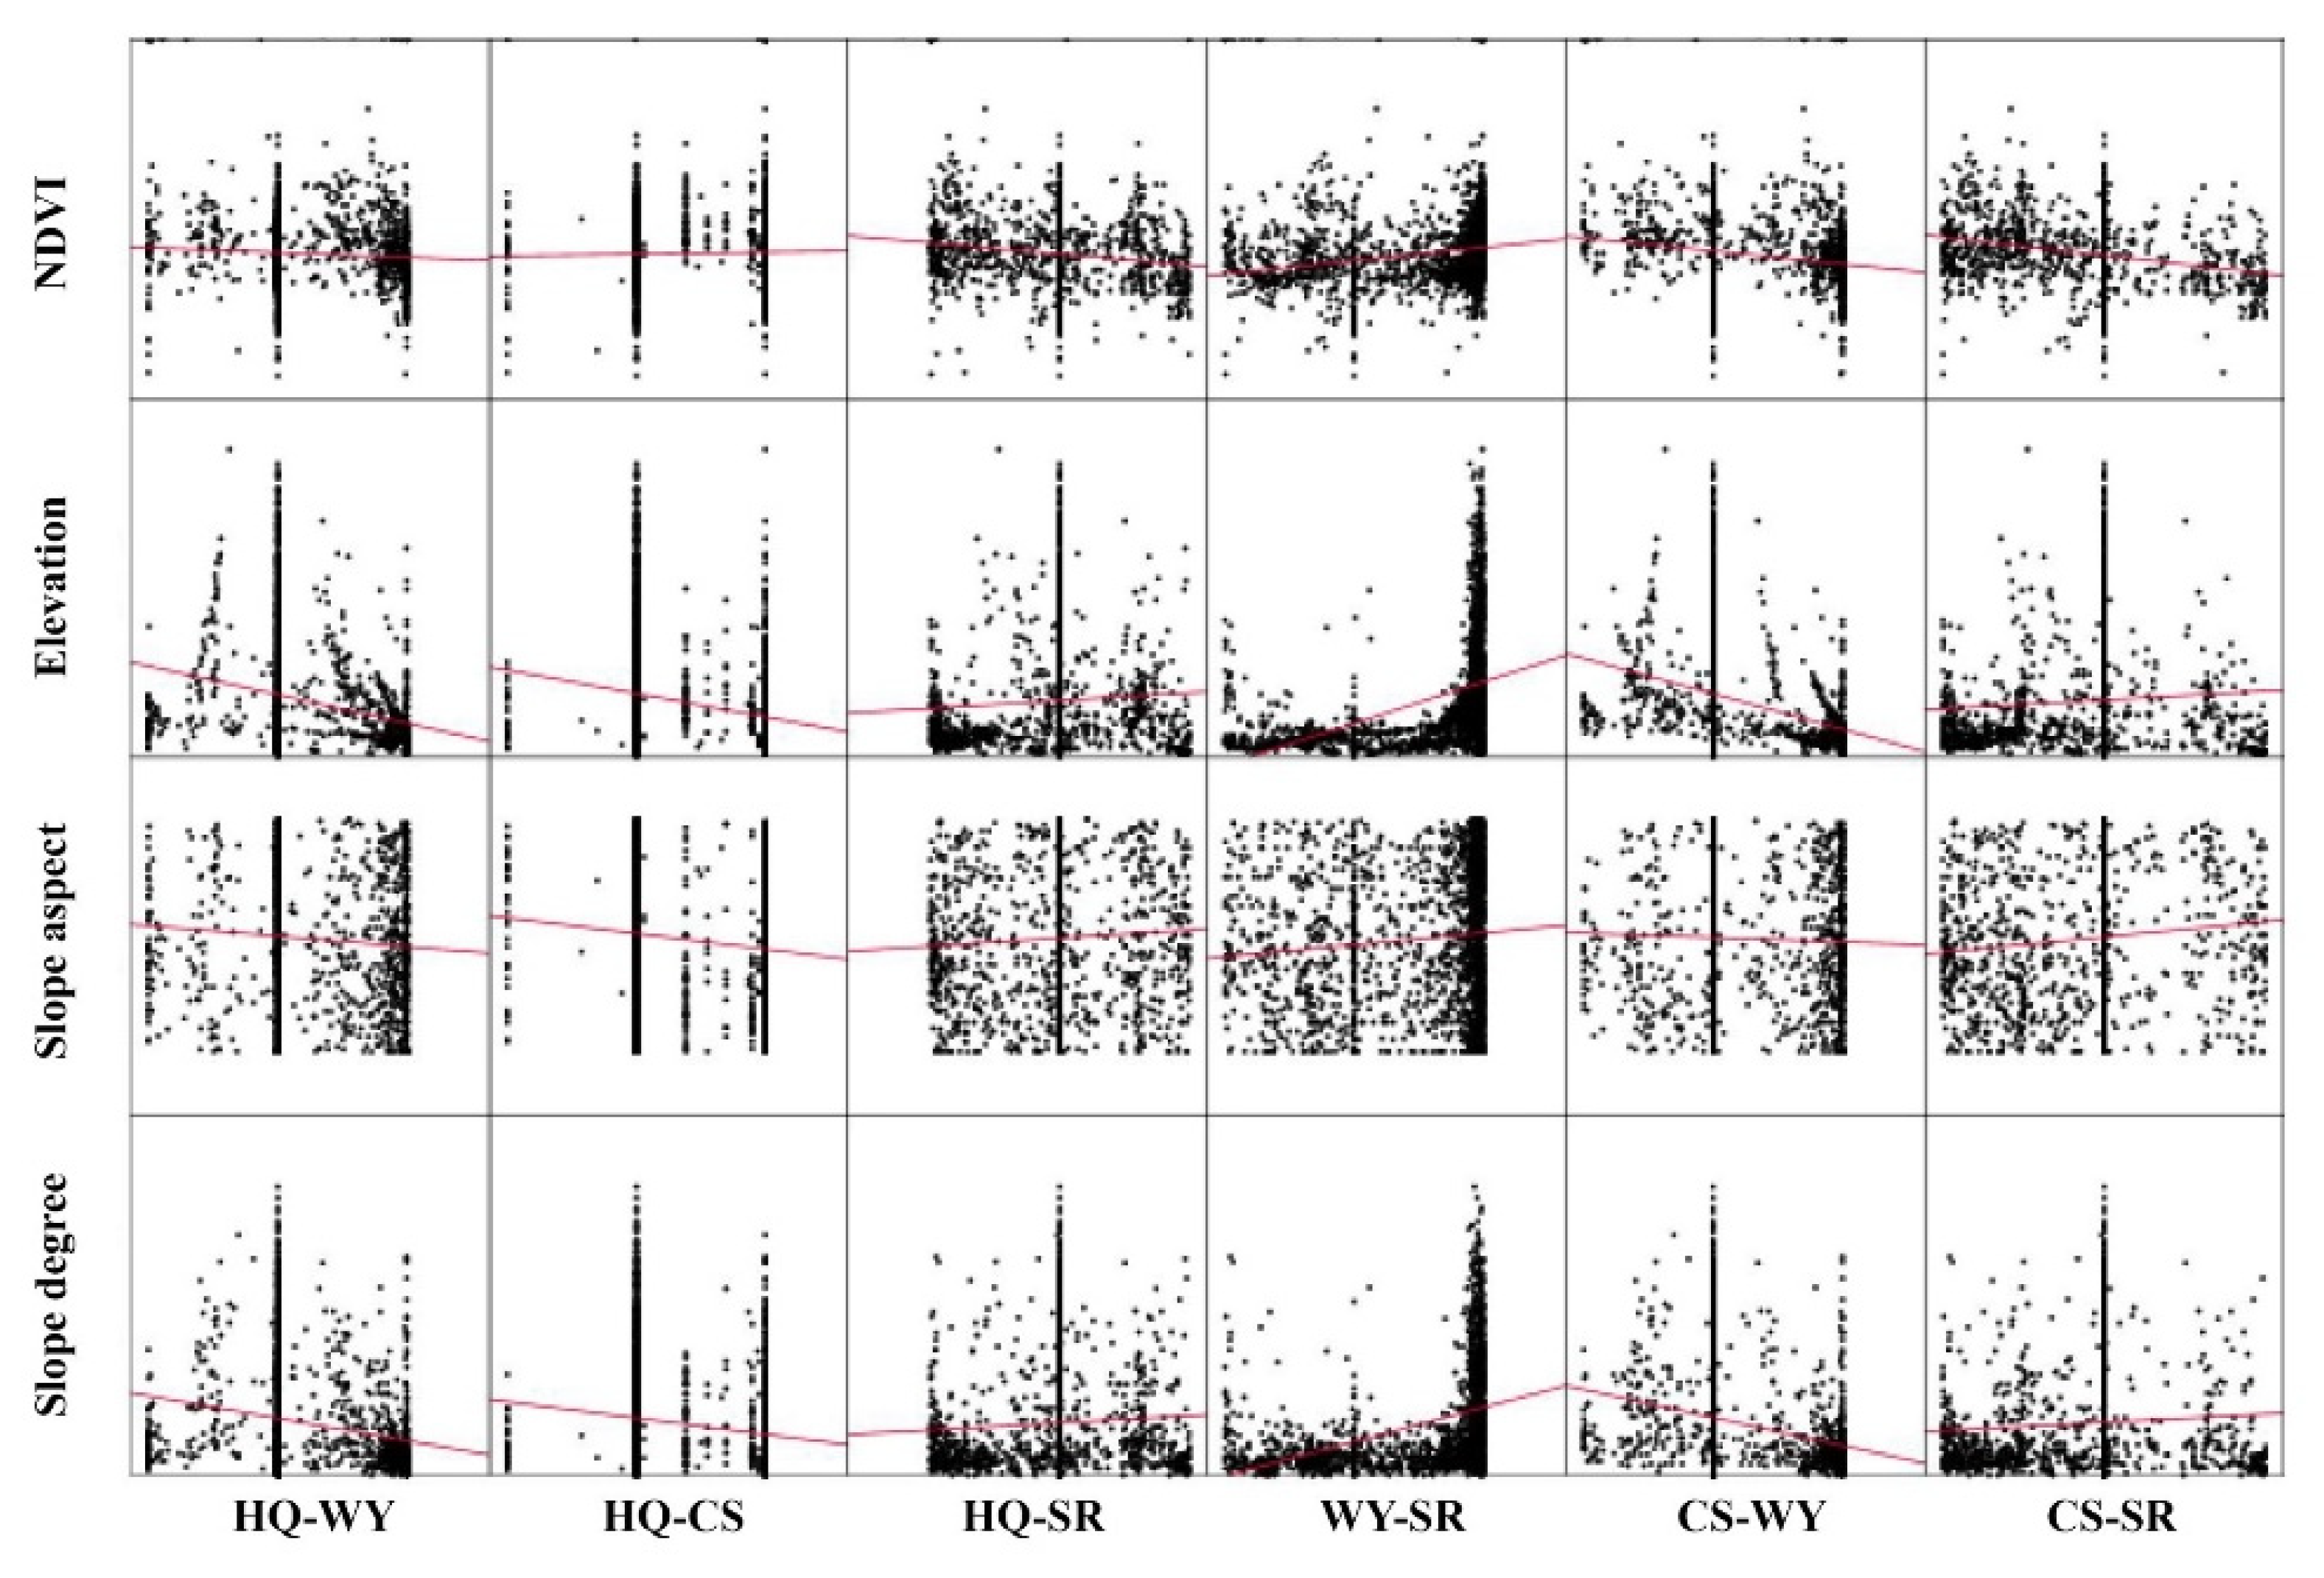
3.3. Correlation between Mountain Environmental Factors and Ecosystem Service Trade-Offs and Synergies

According to the scatter diagram (Figure 5) of the correlation coefficients between four important mountain environmental factors and ecosystem services, pairwise service correlation does not show a ladder effect on mountain altitude, so altitude gradient cannot be the focus of discussion in the collaborative study of ecosystem service trade-off for mountains with similar climatic conditions (low altitude and height difference within 700 m). Although there is no ladder effect, the synergistic degree of habitat quality–water yield and soil retention–water yield decreases with the increase in elevation. The change in NDVI had a significant influence on the trade-offs and synergies of habitat quality–soil retention and carbon storage–soil retention, but the influence was weak. The correlation between two services is evenly dispersed in slope but does not show aggregation in one or more slope aspects. This result may be related to the accuracy of basic data on ecosystem service assessment, and the low-precision data may not be able to accurately respond to some small-scale slope and aspect differences. Habitat quality–water yield and carbon storage–water yield has a strong synergistic relationship in gentle slope mountains and plain areas, while only water yield–soil retention has a high synergistic tendency in steep-slope mountains.

4. Discussion

4.1. Spatial and Temporal Differentiation of Ecosystem Service Trade-Offs and Synergies

From the comprehensive perspective of the main indicators, the changes in soil retention, carbon storage, water yield, and habitat quality in the Jieshi Mountain area from 2000 to 2020 were generally greater than those from 1980 to 2000, and the change rate is visibly accelerated in the 21st century. The spatial pattern of soil retention and carbon storage services basically remained unchanged from 1980 to 2020, and the high-value areas were all located in the Jieshi Mountain area.
In the static reference system, although the relationship between ecosystem services fluctuates in different years, they are all statistically positive, indicating that there is a strong aggregation of ecosystem services at the pixel scale. This aggregation is the strongest between carbon storage and habitat quality and water yield. The driving factors of carbon storage mainly depend on land-cover types, while the driving factors of habitat quality and water yield are relatively complex. The high correlation with carbon storage may mean that land-cover heterogeneity plays a key role between them. At present, whether land types will determine the difference in ecosystem service supply has not yet been determined [43], and we cannot optimize ecosystem services only through land-cover adjustment. Therefore, it is necessary to further clarify the trade-off and synergies ratio of ecosystem services of various land-cover types, to better provide decision support for land management.
The trade-offs and synergies of ecosystem services are a dynamic relationship, and both the trade-off effect and synergy effect (synchronous growth or decline) need to be expressed through the time dimension. Differing from all positive correlations among static ecosystem services, some trade-offs appeared in the spatio-temporal correlation analysis, and the trade-offs between carbon storage–soil retention and habitat quality–soil retention was strong, and the area ratio was relatively high, which indicated that there were complex interactions among these services [44]. The basic data for evaluating each ecosystem service are different. Spatio–temporal correlation analysis is also convenient to extract the influencing factors that weigh the synergistic effect. The trade-offs between carbon storage and soil retention mainly appear in the eastern foot of Jieshi Mountain, and the land cover in this area changed significantly from 1980 to 2020. Although precipitation, an important factor affecting soil retention level, fluctuated over four-time nodes, it was not significantly reflected in the overall trade-off and synergy relationship. A synergistic relationship was found between water yield and other ecosystem services, which confirms that water, as one of the key factors, plays an important role in maintaining other ecosystem services. This finding deviates from the assumption that there is a trade-off between provisioning services and the other three service categories [17], which means that, when evaluating the different geographical features or ecosystems, a specific analysis of service indicators is needed to draw targeted conclusions.

4.2. Trade-Offs and Synergies Differences in Land-Cover

Most residents living in mountainous areas in China interact with their ecological environment for a long time. The land-cover change brought by this interaction reflects the result of human society’s bilateral selection with nature, and the relationship between human beings and nature reaches a dynamic balance in this process. Jieshi Mountain is dominated by woodland, cultivated land, and grassland, which is consistent with the land composition of typical mountainous areas in China [24].
We found that the trade-offs and synergies of ecosystem service are different among different land-cover types in the Jieshi Mountain area. At present, cultivated land accounts for the largest proportion, and the delivery of regulating services will be the key to transforming the trade-offs into synergies among the agricultural landscape [45]. The optimization of ecosystem spatial patterns based on the trade-offs and synergies of ecosystem service in the Jieshi Mountain area can effectively improve the comprehensive benefits of multi-ecosystem service in the region. There is a weak tradeoff between soil retention–habitat quality and soil retention–carbon storage in all land types except built-up land, which means that the maintenance and promotion of soil retention services may affect the supply of other services. Soil is an important basis for biological activities; therefore, stone mountains with a thin soil layer, such as Jieshi Mountain, need to pay special attention to soil retention services and fully consider the trade-off effect between soil retention services and other services, in order to resist the greater impact of land-cover changes on forest vegetation in high-altitude areas [32].
Since the beginning of the 21st century, China’s urbanization process has accelerated, and how to balance the ecological environment and social and economic development has become a point of concern. The discussion of countermeasures mainly focuses on improving land-use efficiency, implementing the supervision of cultivated land expropriation, and improving land use mode [46]. The factors affecting the change in cultivated land involve many aspects, such as population, social economy, agricultural system, natural disasters, and ecological construction [47]. The coupling between cultivated land and social economy is multifunctional [48], and the relationship between ecosystem services of cultivated land and social economy, primary industry, and other factors shows a coordinated development. The urban expansion in the Jieshi Mountain area encroached on a large amount of cultivated land, and the planting area of grapes and other fruits expanded, while the cultivated land area greatly decreased. In addition, rural hollowing and other problems lead to the abandonment of some cultivated land, which is also one of the driving forces for the decline in food supply and service capacity. The conversion of cultivated land to urban construction land in the Jieshi Mountain area can be found to reduce the regional habitat quality and shorten the buffer space between city and mountain forest land, which poses a threat to the ecosystem with the highest habitat quality such as forest land. To reduce the impact of high threat factors such as urban and rural construction land on forest habitat, we suggest making full use of abandoned cultivated land, integrating the scattered hedges, green spaces, and shelterbelts, increasing the patch area of forest land, forming an ecological corridor network system, enhancing the continuity of ecological functions, and building a regional ecological environment quality control system.
The land-cover pattern is the result of the comprehensive action of local natural, social, economic, and other factors, so there must be differences and even conflicts between land use and demand caused by the different interests of stakeholders [49]. As human land use will affect land the ecosystem and, thus, the ecosystem services [9], in the analysis of the trade-off and synergy phenomenon of ecosystem services caused by land-cover changes, the interests of different stakeholders for the land should also receive attention. In addition, in the decision-making regarding ecological restoration, the non-market value of eco-system services obtained by stakeholders is an important part of the cost–benefit analysis and land investment evaluation [50,51].

4.3. Trade-Offs and Synergies of Mountain Ecosystem Service

With the development of human society and the continuous expansion of urban and rural areas, urban and rural areas gradually extend to mountainous areas, and the impact of urban ecological environment problems on mountainous areas becomes more prominent. The mountain ecosystem is characterized by its fragility and sensitivity. On the one hand, compared with plains, the mountain landscape shows more characteristics of dynamic mosaic patches, showing a de facto unbalanced landscape. On the other hand, the narrow range of ecological transition zones between different vertical height zones also causes ecological fragility. When facing natural and human disturbance, the critical ecological transition zone shows a low anti-interference ability, which is more fragile than the stable zone. This fragility is reflected by the fact that soil erosion easily occurs after vegetation destruction. It is very difficult to restore the ecosystem after soil erosion on hillsides with large slopes, especially mountains with a thin soil layer such as Jieshi Mountain.
We found that there are multiple correlations between the mountainous environmental factors in ecological service trade-offs and synergies. Jieshi Mountain is a low-altitude mountain, and there is no distinct elevation gradient difference in the vertical direction. Therefore, in the study of ecosystem services in mountainous areas with similar climatic conditions, a small elevation difference, and altitudes below 700 m, the altitude gradient effect cannot be taken as an important research content; however, for low-altitude near-urban mountainous areas, we should still pay attention to the trade-offs and synergy differences in the ecosystem services formed by the change in altitude, because the land cover in these areas is more vulnerable to the impact of human activities on social development. The trade-off between habitat quality and water yield has no significant correlation with mountain elevation, but the synergy degree does decrease with the increase in elevation, which means that there may be conflicts between biological habitat and water production function in high-altitude areas. The trade-off between habitat quality and soil retention is mostly concentrated in the lower-altitude area, which is less sensitive to soil retention than the high-altitude mountain area, so the improvement in soil retention services in low altitude areas has a less negative impact on other services. This is in line with the basic characteristics of the coexistence of the vertical and horizontal spatial heterogeneity of ecosystem service supply in mountainous areas [25].
The slope aspect is an important topographic factor affecting the microclimate. Affected by environmental factors such as illumination and rainfall, mountain vegetation and soil show certain differences in different slope aspects. Specifically, in ecosystem services, habitat quality–soil retention, carbon storage–soil retention on the southern slope of Jieshi Mountain tend towards a slight trade-off. When carrying out land management and tourism development with mountains as the main resources, it is necessary to fully recognize the unique ecological environment and geographical characteristics of the Jieshi Mountain area, optimize the horizontal and vertical structure of vegetation, adjust the regional climate to conserve soil and water by promoting the material circulation and exchange of plants, soil and atmosphere, and enhance the ability to resist natural disasters.

5. Conclusions

Based on the evaluation of ecosystem services in the Jieshi Mountain area and the comprehensive analysis of the spatial and temporal patterns of trade-offs and synergies, we identify the spatial differentiation of trade-offs and synergies of four key ecosystem services. Through the analysis of land-cover types, it can be seen that built-up land, water areas, and cultivated land have the highest synergy in terms of the relationship between carbon storage and water yield services, and woodland has the highest synergy for the relationship between water yield and soil retention. This means that the ecosystem service conflict ebetween woodland, cultivated land, and built-up land in the Jieshi Mountain area is low. In the utilization and management of land resources, measures such as utilizing abandoned cultivated land, integrating scattered green space, increasing forest land patches, and constructing an ecological network can maintain or promote this synergistic effect, so as to improve the overall performance of ecosystem services. In addition, we try to analyze the key environmental factors in trade-offs and synergies. Although the gradient effect is not remarkable in Jieshi Mountain, a low-altitude mountain, there are different correlations between ecosystem service trade-offs and synergies among mountain environmental factors, with altitude having a higher influence on synergy. The synergy between habitat quality and water yield decreases with the increase in elevation.
Quantifying the trade-off relationship between ecosystem service changes is an important way of comparing different planning and management strategies. Planning and management strategies need to be implemented through specific means, such as land consolidation and environmental element re-planning. Land-cover types and mountain environmental factors are important factors affecting the trade-off and synergy of mountain ecosystem services. The stability and security of the whole ecosystem can be improved and the comprehensive value of ecosystem services can be maximized through the rational transformation and spatial pattern optimization between woodland, cultivated land, and built-up land, as well as topographic consolidation and vegetation maintenance and management.

Author Contributions

G.L.: Methodology, Software, Data curation, Writing—Original draft preparation, Writing—Reviewing and Editing, Visualization. J.C.: Conceptualization, Supervision, Writing—Reviewing and Editing. All authors have read and agreed to the published version of the manuscript.

Funding

This research was funded by Research on the Maintenance Technology of Species Diversity in Rural Ecological Landscape, National Key R&D Program of China (2019–2022), grant number 2019YFD11004032.

Institutional Review Board Statement

Not applicable.

Informed Consent Statement

Not applicable.

Data Availability Statement

Publicly available datasets were analyzed in this study. This data can be found here: http://www.gscloud.cn/ (accessed on 15 March 2021) (LULC, DEM); http://data.cma.cn/ (accessed on 21 January 2021) (precipitation); http://www.fao.org/soils-portal/soil-survey/soil-maps-and-databases/harmonized-world-soil-database-v12/en/ (accessed on 16 December 2020) (soil); https://www.fao.org/statistics/en/ (accessed on 18 December 2020) (plant/crop); https://www.ipcc.ch/report/2019-refinement-to-the-2006-ipcc-guidelines-for-national-greenhouse-gas-inventories/ (accessed on 3 December 2020) (carbon pools).

Conflicts of Interest

The authors declare no conflict of interest.

Appendix A. Satellite Image Selection and Interpretation

Based on the satellite shooting time (from June to September of the growing season), cloud coverage, resolution, and other conditions, the historical images of Landsat TM satellite in 1980, 2000, 2010, and 2020 were selected, covering 118.50 in the west, 119.89 in the East, 40.64 in the north and 39.40 in the south (Table A1). ENVI 5.1 software was used, which respectively carries out orthophoto correction on the multispectral and panchromatic data of satellite images. After automatic registration, the low-resolution multispectral data were fused after orthophoto correction based on the high-resolution panchromatic data to obtain the high-resolution multispectral data. Then, the Quac module of ENVI was used to complete the atmospheric correction process of remote sensing images, and the land cover was cut through the boundary mask of the study area. Referring to the first-class classification standard in the national standard classification of land-cover status (GB/T 21010-2017), the study area was divided into five categories: cultivated land, woodland, grassland, built-up land (including urban, transportation, commercial service, industrial and mining storage land) and water area (Table A2). Using ENVI supervised classification, five regions of interest (ROI) training samples were created for manual sample selection. The separability between samples was greater than 1.8, which belonged to qualified samples. Support vector machine classification (SVM) was selected for classification, and the accuracy of the classification results was verified by the confusion matrix, which was more than 80%. Finally, the classification results were imported into ArcGIS 10.2. Post-editing was carried out and detailed adjustments were completed.
Table A1. Satellite image selection.
YearSatelliteDateResolution (m)Cloudcover (%)Overall Accuracy (%)
1980Landsat319 August 198080081.84
2000Landsat719 June 200030080.69
2010Landsat72 August 2010300.0383.03
2020Landsat820 July 2020300.0581.25
Table A2. Classification of the land-use/land cover (LULC) of Jieshi Mountain.
LULC_IDFirst Class NameSecond Class Name
1Cultivated landPaddy field, dry land
2WoodlandWoodlands, shrubs, open woodlands, other woodlands
3GrasslandHigh coverage grassland, medium coverage grassland, and low coverage grassland
4Water areaRivers and canals, reservoirs, ponds, beaches, and beaches
5Built-up landUrban land, rural residential areas, the construction land

Appendix B. Ecosystem Service Indicators and Mountain Environmental Factors

Table A3. Ecosystem service indicators and mountain environmental factors.
TypeDimensionIndicatorRequired Data
Provisioning ServicesfreshwaterWater yield (WY)LULC; Root Restricting Layer Depth; annual precipitation; plant available water content; annual average reference evapotranspiration; maximum root depth of vegetation coverage; plant evapotranspiration coefficient (Kc)
Regulating ServicesClimate regulationCarbon storage (CS)LULC; carbon pools
Soil formationSoil retention (SR)LULC; Digital Elevation Model (DEM), rainfall erosivity index (R), soil erodibility factor (K), watersheds, cover-management factor (C); support practice factor (P)
Supporting ServicesHabitat supportHabitat quality (HQ)LULC, Threat factors
Mountain environmental factorstopographyElevationDEM
topographySlope degreeDEM
topographySlope aspectDEM
VegetationNDVISatellite Multispectral Image

Appendix C. Accuracy and Availability of Basic Data

Table A4. Accuracy and availability of basic data.
Basic DataProcessed DataApplicationTypeResolutionSource
Satellite imageLULCWY; SR; CS; HQRaster data80 m; 30 mGeospatial data cloud: www.gscloud.cn/ (accessed on 15 March 2021)
PrecipitationPrecipitation; Reference evapotranspiration; rainfall erosivity factor (R) WY; SRDigital data-China Meteorological Data Network: http://data.cma.cn/ (accessed on 21 January 2021
SoilRoot Restricting Layer Depth; Plant available water content; soil erodibility factor (K,)WY; SRRaster data1000 mHWSD (Harmonized World Soil Database): http://www.fao.org/soils-portal/soil-survey/soil-maps-and-databases/harmonized-world-soil-database-v12/en/ (accessed on 16 December 2020)
DEMDEM; watershedsWY; SRRaster data30 mGeospatial data cloud: www.gscloud.cn/ (accessed on 3 January 2021
Plant/cropplant evapotranspiration coefficient (Kc); maximum root depth of vegetation coverageWYDigital data-FAO (Food and Agriculture Organization of the United Nations): https://www.fao.org/statistics/en/ (accessed on 18 December 2020)
Carbon poolsCarbon poolsCSDigital data-IPCC (Intergovernmental Panel on Climate Change): https://www.ipcc.ch/report/2019-refinement-to-the-2006-ipcc-guidelines-for-national-greenhouse-gas-inventories/ (accessed on 3 December 2020)

References

  1. Ecosystems and Human Well-Being: Synthesis. In Millennium Ecosystem Assessment; Island Press: Washington, DC, USA, 2005.
  2. Brauman, K.A.; Daily, G.C.; Duarte, T.K.E.; Mooney, H.A. The nature and value of ecosystem services: An overview highlighting hydrologic services. Annu. Rev. Environ. Resour. 2007, 32, 67–98. [Google Scholar] [CrossRef]
  3. Deblauwe, V.; Barbier, N.; Couteron, P.; Lejeune, O.; Bogaert, J. The global biogeography of semi-arid periodic vegetation patterns. Glob. Ecol. Biogeogr. 2008, 17, 715–723. [Google Scholar] [CrossRef]
  4. Bennett, E.M.; Peterson, G.D.; Gordon, L.J. Understanding relationships among multiple ecosystem services. Ecol. Lett. 2009, 12, 1394–1404. [Google Scholar] [CrossRef] [PubMed]
  5. Li, S.; Zhang, C.; Liu, J.; Zhu, W.; Ma, C.; Wang, J. Research progress in ecosystem service trade-offs and synergies and research topics in geography. Geogr. Res. 2013, 32, 1379–1390. [Google Scholar]
  6. Wu, J. Landscape sustainability science: Ecosystem services and human well-being in changing landscapes. Landsc. Ecol. 2013, 28, 999–1023. [Google Scholar] [CrossRef]
  7. Guerry, A.D.; Polasky, S.; Lubchenco, J.; Chaplin-Kramer, R.; Daily, G.C.; Griffin, R.; Ruckelshaus, M.H.; Bateman, I.J.; Duraiappah, A.; Elmqvist, T.; et al. Natural capital and ecosystem services informing decisions: From promise to practice. Proc. Natl. Acad. Sci. USA 2015, 112, 7348–7355. [Google Scholar] [CrossRef] [Green Version]
  8. Plieninger, T.; Schleyer, C.; Schaich, H.; Ohnesorge, B.; Gerdes, H.; Herndez-Morcillo, M.; Bieling, C. Mainstreaming ecosystem services through reformed european agricultural policies. Conserv. Lett. 2012, 5, 281–288. [Google Scholar] [CrossRef] [Green Version]
  9. Cao, S.A.; Wu, C.F.; Yu, W.J. Evaluation of Land Ecological Service and Its Application in Overall Arrangement of Land Use—A Case Study of Xiaoshan, Hangzhou. J. Soil Water Conserv. 2006, 27, 2161–2171. [Google Scholar]
  10. Raudsepp-Hearne, C.; Peterson, G.D.; Tengö, M.; Bennett, E.M.; Holland, T.; Benessaiah, K.; MacDonald, G.K.; Pfeifer, L. Untangling the environmentalist’s paradox: Why is human well-being increasing as ecosystem services degrade? BioScience 2010, 60, 576–589. [Google Scholar] [CrossRef]
  11. Dale, V.H.; Polasky, S. Measures of the effects of agricultural practices on ecosystem services. Ecol. Econ. 2007, 64, 286–296. [Google Scholar] [CrossRef]
  12. Metzger, M.; Rounsevell, M.D.A.; Acosta-Michlik, L.; Leemans, R.; Schröter, D. The vulnerability of ecosystem services to land use change. Agric. Ecosyst. Environ. 2006, 114, 69–85. [Google Scholar] [CrossRef]
  13. Nelson, E.J.; Daily, G.C. Modelling ecosystem services in terrestrial systems. F1000 Biol. Rep. 2010, 2, 53. [Google Scholar] [CrossRef] [PubMed] [Green Version]
  14. Xiao, Y.; Xie, G.; Chunxia, L.U.; Jie, X.U. Involvement of ecosystem service flows in human wellbeing based on the relationship between supply and demand. Acta Ecol. Sin. 2016, 36, 3096–3102. [Google Scholar]
  15. Brouwer, R.; Tesfaye, A.; Pauw, P. Meta-analysis of institutional-economic factors explaining the environmental performance of payments for watershed services. Environ. Conserv. 2011, 38, 380–392. [Google Scholar] [CrossRef]
  16. Foley, J.A.; DeFries, R.; Asner, G.P.; Barford, C.; Bonan, G.; Carpenter, S.R.; Chapin, F.S.; Coe, M.T.; Daily, G.C.; Gibbs, H.K.; et al. Global consequences of land use. Science 2005, 309, 570–574. [Google Scholar] [CrossRef] [Green Version]
  17. Cardinale, B.J.; Duffy, J.E.; Gonzalez, A.; Hooper, D.U.; Perrings, C.; Venail, P.; Narwani, A.; Mace, G.M.; Tilman, D.; Wardle, D.A.; et al. Biodiversity loss and its impact on humanity. Nature 2012, 486, 59–67. [Google Scholar] [CrossRef]
  18. Howe, C.; Suich, H.; Vira, B.; Mace, G.M. Creating win-wins from trade-offs? Ecosystem services for human well-being: A meta-analysis of ecosystem service trade-offs and synergies in the real world. Glob. Environ. Chang. 2014, 28, 263–275. [Google Scholar] [CrossRef] [Green Version]
  19. Mouchet, M.A.; Lamarque, P.; Martín-López, B.; Crouzat, E.; Gos, P.; Byczek, C.; Lavorel, S. An interdisciplinary methodological guide for quantifying associations between ecosystem services. Glob. Environ. Chang. 2014, 28, 298–308. [Google Scholar] [CrossRef]
  20. Loomis, D.K.; Paterson, S.K. The human dimensions of coastal ecosystem services: Managing for social values. Ecol. Indic. 2014, 44, 6–10. [Google Scholar] [CrossRef]
  21. Malekmohammadi, B.; Jahanishakib, F. Vulnerability assessment of wetland landscape ecosystem services using driver-pressure-state-impact-response (DPSIR) model. Ecol. Indic. 2017, 82, 293–303. [Google Scholar] [CrossRef]
  22. Richards, D.R.; Friess, D.A. Characterizing coastal ecosystem service trade-offs with future urban development in a tropical city. Environ. Manag. 2017, 60, 961–973. [Google Scholar] [CrossRef] [PubMed]
  23. European Environmental Agency. Europe’s Ecological Backbone: Recognising the True Value of Our Mountains; European Environmental Agency: Copenhagen, Denmark, 2010. [Google Scholar]
  24. Dai, E.F.; Wang, Y.H.; Ma, L.; Li, S.C.; Zhang, H.Q.; Xin, L.J.; Wang, Y.K. Land use change and its ecological effects in typical mountainous areas in China. Chin. J. Nat. 2018, 40, 33–40. Available online: https://kns.cnki.net/kcms/detail/detail.aspx?dbcode=CJFD&dbname=CJFDLAST2018&filename=ZRZZ201801007&uniplatform=NZKPT&v=SuXeoM59zvB9oTKanG40088apt1izNkpeCc1N5kUGcs0PkardJnW-iM6NCWTzWJr (accessed on 22 September 2020). (In Chinese).
  25. Becker, A.; Körner, C.; Brun, J.J.; Guisan, A.; Tappeiner, U. Ecological and land use studies along elevational gradients. Mt. Res. Dev. 2007, 27, 58–65. [Google Scholar] [CrossRef] [Green Version]
  26. Zhang, B. Ten major scientific issues concerning the study of China’s north-south transitional zone. Prog. Geogr. 2019, 38, 305–311. (In Chinese) [Google Scholar]
  27. Han, Z.; Yongqi, G.; Libo, Z. Ozone Low and Surface Heating over Large Scale Topography. Clim. Environ. Res. 1998, 3, 18–26. [Google Scholar]
  28. Daugstad, K.; Rønningen, K.; Skar, B. Agriculture as an upholder of cultural heritage? Conceptualizations and value judgements—A Norwegian perspective in international context. J. Rural Stud. 2006, 22, 67–81. [Google Scholar] [CrossRef]
  29. Briner, S.; Elkin, C.; Huber, R. Evaluating the relative impact of climate and economic changes on forest and agricultural ecosystem services in mountain regions. J. Environ. Manag. 2013, 129, 414–422. [Google Scholar] [CrossRef]
  30. Lamarque, P.; Lavorel, S.; Mouchet, M.; Quétier, F. Plant trait-based models identify direct and indirect effects of climate change on bundles of grassland ecosystem services. Proc. Natl. Acad. Sci. USA 2014, 111, 13751–13756. [Google Scholar] [CrossRef] [Green Version]
  31. Schirpke, U.; Tasser, E.; Tappeiner, U. Mapping Ecosystem Services supply in mountain regions: A case study from South Tyrol (Italy). Ann. Bot. 2014, 4, 35–43. [Google Scholar]
  32. Briner, S.; Huber, R.; Bebi, P.; Elkin, C.; Schmatz, D.R.; Grêt-Regamey, A. Trade-offs between ecosystem services in a mountain region. Ecol. Soc. 2013, 18, 35. [Google Scholar] [CrossRef] [Green Version]
  33. Locatelli, B.; Lavorel, S.; Sloan, S.; Tappeiner, U.; Geneletti, D. Characteristic trajectories of ecosystem services in mountains. Front. Ecol. Environ. 2017, 15, 150–159. [Google Scholar] [CrossRef]
  34. Rodríguez-Rodríguez, D.; Bomhard, B. Mapping direct human influence on the world’s mountain areas. Mt. Res. Dev. 2012, 32, 197–202. [Google Scholar] [CrossRef]
  35. Wieser, R. Land Use Change and Mountain Biodiversity. Mt. Res. Dev. 2007, 27, 188–189. [Google Scholar] [CrossRef]
  36. Grêt-Regamey, A.; Brunner, S.H.; Kienast, F. Mountain ecosystem services: Who cares? Mt. Res. Dev. 2012, 32 (Suppl. 1), S23–S34. [Google Scholar] [CrossRef]
  37. Huang, G. Principles of Mountain Urbanism; China Construction Industry Press: Beijing, China, 2006. [Google Scholar]
  38. Changli County Meteorological Bureau. Public Meteorological Service. 2018. Available online: http://www.clxzf.gov.cn/article/20180627/401830179-2018-05445.html (accessed on 6 September 2020).
  39. Kroll, F.; Müller, F.; Haase, D.; Fohrer, N. Rural–urban gradient analysis of ecosystem services supply and demand dynamics. Land Use Policy 2012, 29, 521–535. [Google Scholar] [CrossRef]
  40. Burkhard, B.; Kroll, F.; Müller, F.; Windhorst, W. Landscapes’ capacities to provide ecosystem services-a concept for land-cover based assessments. Landsc. Online 2009, 15, 1–22. [Google Scholar] [CrossRef]
  41. Sharp, R.; Tallis, H.T.; Ricketts, T.; Guerry, A.D.; Wood, S.A.; Chaplin-Kramer, R.; Douglass, J. InVEST+ VERSION+ User’s Guide; The Natural Capital Project: Morges, Switzerland, 2016. [Google Scholar]
  42. Wong, C.P.; Jiang, B.; Kinzig, A.P.; Lee, K.N.; Ouyang, Z. Linking ecosystem characteristics to final ecosystem services for public policy. Ecol. Lett. 2015, 18, 108–118. [Google Scholar] [CrossRef] [Green Version]
  43. Berry, Z.C.; Jones, K.W.; Aguilar, L.R.G.; Congalton, R.G.; Holwerda, F.; Kolka, R.; Looker, N.; Ramirez, S.M.L.; Manson, R.; Mayer, A.; et al. Evaluating ecosystem service trade-offs along a land-use intensification gradient in central Veracruz, Mexico. Ecosyst. Serv. 2020, 45, 101181. [Google Scholar] [CrossRef]
  44. Yu, G.R.; He, N.P.; Wang, Q.F. Carbon Budget and Carbon Sink of Ecosystems in China: Theoretical Basis and Comprehensive Assessment; Science Press: Beijing, China, 2013. [Google Scholar]
  45. Chen, Y. Improving Landscape and Designing PES Programs in County Area Based on Ecosystem Services; China Agricultural University: Beijing, China, 2018. [Google Scholar]
  46. Van Vliet, J.; Magliocca, N.R.; Büchner, B.; Cook, E.; Benayas, J.M.R.; Ellis, E.C.; Heinimann, A.; Keys, E.; Lee, T.M.; Liu, J.; et al. Meta-studies in land use science: Current coverage and prospects. Ambio 2016, 45, 15–28. [Google Scholar] [CrossRef] [Green Version]
  47. Yuan, K.; Wu, Y.; Wu, T. Cultivated land area change and sustainable use countermeasures in Xiangxi Autonomous Prefecture from 1949 to 2003. Physical Geography Professional Committee of Chinese Geographical Society. In Proceedings of the Symposium on “Land Change Science and Ecological Construction”, Xining, China, 1 July 2004; China Physical Geography Professional Committee of the Geographical Society: Chinese Geographical Society. The Commercial Press: Beijing, China, 2004; pp. 529–536. [Google Scholar]
  48. Tian, X. Study of Multifunction Cultivated Land andIts Coupling Mechanism with the Socio-Economic Development in Beijing; China University of Geosciences: Wuhan, China, 2014. [Google Scholar]
  49. Menzel, S.; Teng, J. Ecosystem services as a stakeholder-driven concept for conservation science. Conserv. Biol. 2010, 24, 907–909. [Google Scholar] [CrossRef]
  50. Newton, A.C.; Hodder, K.; Cantarello, E.; Perrella, L.; Birch, J.C.; Robins, J.; Douglas, S.J.; Moody, C.; Cordingley, J. Cost-benefit analysis of ecological networks assessed through spatial analysis of ecosystem services. J. Appl. Ecol. 2012, 49, 571–580. [Google Scholar] [CrossRef]
  51. Kaiser, G.; Burkhard, B.; Römer, H.; Sangkaew, S.; Graterol, R.; Haitook, T.; Sterr, H.; Sakuna-Schwartz, D. Mapping tsunami impacts on land cover and related ecosystem service supply in Phang Nga, Thailand. Nat. Hazards Earth Syst. Sci. 2013, 13, 3095–3111. [Google Scholar] [CrossRef] [Green Version]
Figure 1. Location of Jieshi Mountain, China.
Sustainability 14 04652 g001
Figure 2. Spatial pattern of four individual ecosystem services from 1980 to 2020. Notes: CS: Carbon storage, WY: Water yield, SR: Soil retention, HQ: Habitat quality.
Sustainability 14 04652 g002
Figure 3. Spatial and temporal differentiation of ecosystem service trade-offs and synergies (a1a6): Ratio of tradeoffs and synergies between two ecosystem services in different land-cover types and spatial pattern of tradeoffs and synergies. (b): Area of tradeoffs and synergies between two ecosystem services in different land-cover types.).
Sustainability 14 04652 g003
Figure 4. Distribution of the relationship between two ecosystem services in different land-cover types.
Sustainability 14 04652 g004
Figure 5. Correlation between mountain environmental factors and trade-offs and synergies between two ecosystem services.
Sustainability 14 04652 g005
Publisher’s Note: MDPI stays neutral with regard to jurisdictional claims in published maps and institutional affiliations.

