Article

The Spatio-Temporal Evolution of the Soil Conservation Function of Ecosystems in the North–South Transition Zone in China: A Case Study of the Qinling-Daba Mountains

1
Institute of Mountain Hazards and Environment, Chinese Academy of Sciences, Chengdu 610041, China
2
University of the Chinese Academy of Sciences, Beijing 100049, China
3
Climate Center of Sichuan Province/Heavy Rain and Drought-Flood Disasters in Plateau and Basin Key Laboratory of Sichuan Province, Chengdu 610072, China
*
Author to whom correspondence should be addressed.
Sustainability 2022, 14(10), 5829; https://doi.org/10.3390/su14105829
Submission received: 12 April 2022 / Revised: 4 May 2022 / Accepted: 5 May 2022 / Published: 11 May 2022

Abstract

:
Maintaining and improving the soil conservation function of an ecosystem is of positive significance to the sustainable and stable development of that ecosystem. We used the RUSLE model to evaluate the soil conservation function of the Qinling-Daba Mountains from 1982, 1995, 2005, and 2015 in order to analyze the spatio-temporal evolution characteristics of soil conservation. Our conclusions are as follows: (1) During the study period, the amount of average actual soil erosion in the Qinling-Daba Mountains was 955.39 × 10⁸ t, the amount of actual soil erosion fluctuated greatly from year after year, there were obvious spatial aggregation and temporal and spatial transfer phenomena, and there was serious soil nutrient loss in the east. (2) From 1982 to 2015, soil conservation in the Qinling-Daba Mountains increased by 27.75 × 10⁸ t during fluctuations. The soil conservation was negatively correlated with elevation and slope, and was positively correlated with vegetation coverage. (3) The average soil conservation of forest ecosystems and farmland ecosystems accounts for 78.11% of the total soil conservation, but there are differences in the ways in which to achieve soil conservation function. The order for soil conservation function of different vegetation types is crops > shrub > broad-leaved forest > coniferous forest > grass > meadow > grassland > coniferous and broad-leaved mixed forest > alpine plant > swamp. (4) The average retention of N, P and K elements in soil were 75.57 × 10⁴ t, 25.35 × 10⁴ t and 737.28 × 10⁴ t, respectively. The soil elements had the consistency of spatial difference in spatial distribution and were time scaled. The soil nutrient loss in the eastern region is serious. Shrubs, broadleaf forests and crops have the greatest effect on soil nutrient retention. Alpine plants retain the greatest amount of soil nutrients per unit area. Therefore, the establishment of reasonable soil conservation strategies and scientific vegetation interplanting measures will help to enhance the soil conservation function of the Qinling-Daba Mountains ecosystem and improve the ecosystem production capacity.

1. Introduction

Soil erosion is a global ecological environmental problem facing the world today, and it has become the core content of global ecological environment research [1,2,3]. It causes land degradation, soil fertility loss, and river siltation on a global scale [4,5,6], and has always been the focus of research by scholars at home and abroad [7]. China is one of the countries with the most serious soil erosion in the world [8]. The area affected by soil erosion is about 3.6 × 10⁶ km2, accounting for 37% of the country’s total land area [9], and its land loss rate is 30 times that of natural recharging [10,11]. In 2005, the direct economic loss caused by soil erosion in China amounted to 2876.18 × 108 yuan, equivalent to 1.45% of the national GDP that year [12]. The amount of soil conservation in the ecosystem is the difference between the potential amount of soil erosion in the ecosystem (without taking soil and water conservation measures) and the actual amount of soil erosion (with soil and water conservation measures taken into account) [13]. The amount of soil conservation reflects the strength of the soil conservation function of the ecosystem, and the soil conservation function, as one of the most important service functions of the ecosystem [14,15], plays an important role in maintaining regional ecological security. There are many factors affecting the soil conservation function of the ecosystem, among which vegetation has the most significant impact [16]. Vegetation is of great significance to the conservation of surface soil. Vegetation weakens the scour force of rainfall on the surface, and under the condition of unchanged soil properties, the root system of vegetation dissipates a large amount of the erosive energy of surface runoff [17,18], so as to reduce the effect of runoff on the surface and denudation of soil. In addition, the establishment of appropriate soil and water conservation measures can help to slow down erosion and protect the surface soil [19], thereby improving the soil conservation function of the ecosystem. There are various estimation models for soil erosion [20,21,22,23,24], among which the USLE model and the modified RUSLE model are the most widely used [25,26]. Due to the convenience and strong applicability and comprehensive ability of the RUSLE model itself, it is widely used all over the world. Yang used the RUSLE model to analyze the global soil erosion potential over the past century, both now and in the future [27], while Gallant used the RUSLE model to quantify sheet and gully erosion in Australia [28]. After the introduction of the RUSLE model in China, it has been widely used in various watersheds [13,29], hilly areas prone to erosion [30], and in the ecological and environmental protection planning of administrative divisions [31,32]. However, the current research on the soil conservation function of the ecosystem mostly focuses on the evaluation of its value, which makes it difficult to reflect the temporal and spatial variation characteristics of the soil conservation function of the ecosystem [33,34]. To explore the relationship between the influencing factors [14,35], it can provide opinions and suggestions for improving the soil conservation function of the ecosystem.
As the main body of the Chinese north–south transition zone, the Qinling-Daba Mountains is of great significance in terms of geographical boundaries, the biological environment, and resource endowments [36]. The complex topographic features and changing climate has made the Qinling-Daba Mountains prone to soil erosion, which has a negative impact on its environmental sensitivity, biodiversity, and economic sustainability. The present research focuses on the Qinling-Daba Mountains ecosystem, combining data on vegetation, soil, precipitation, topography, and land use type in order to study the soil conservation function of the Qinling-Daba Mountains ecosystem, and to provide a reference for the development of future soil protection policies for the Qinling-Daba Mountains.

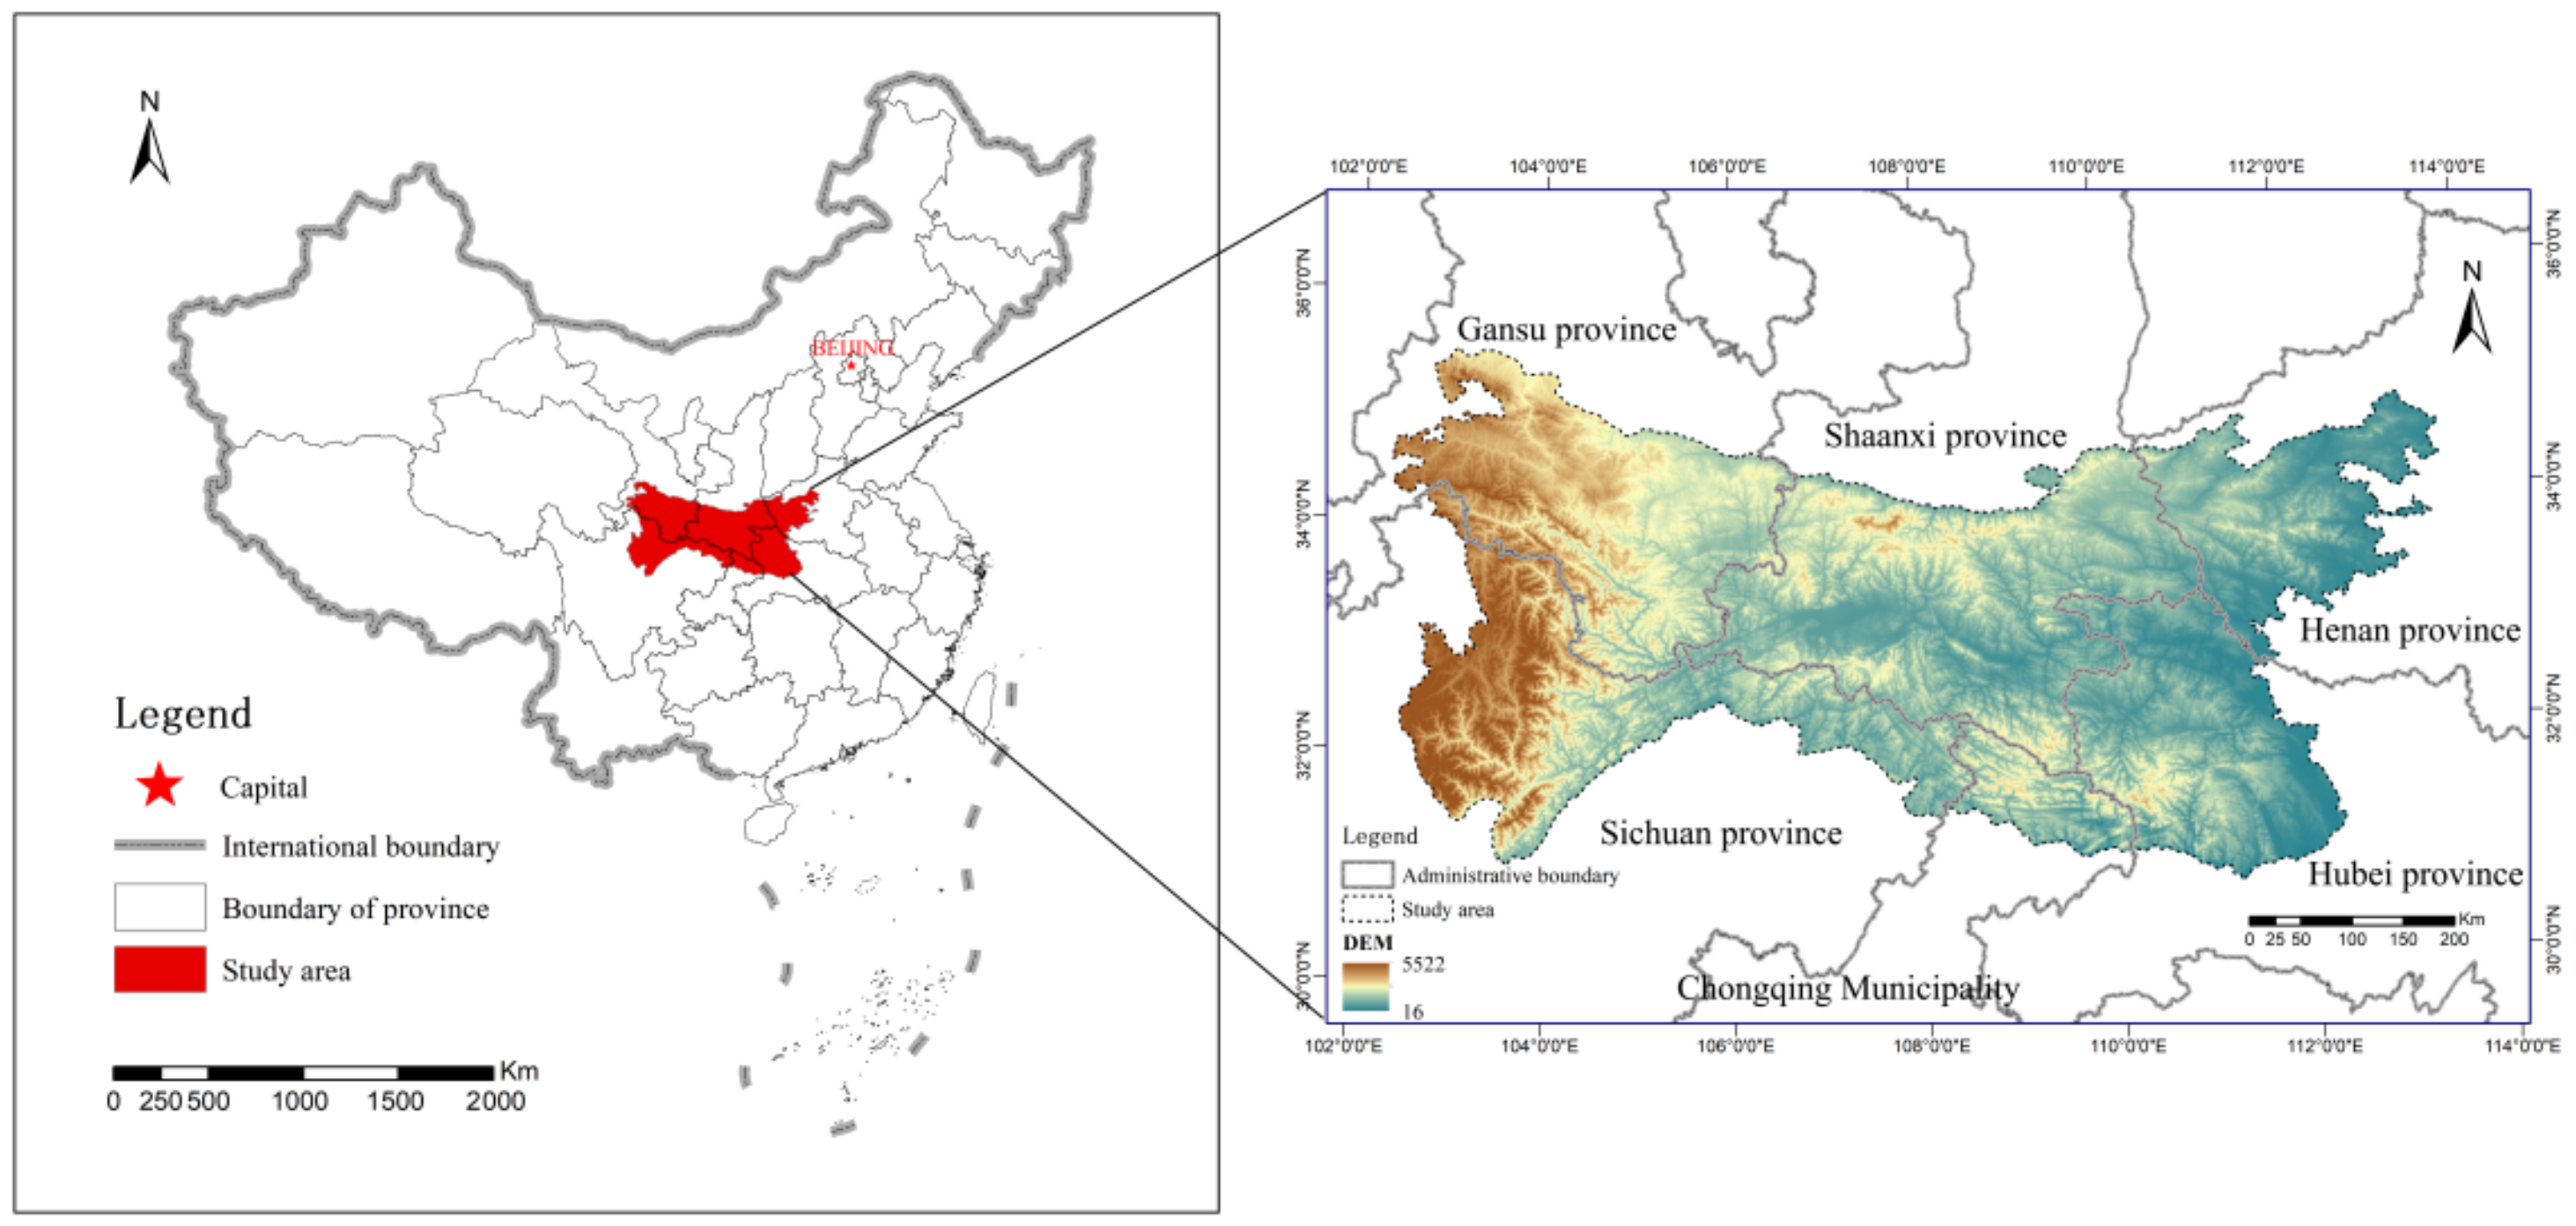
2. Overview of the Study Area

The Qinling-Daba Mountains is the collective name for the Qinling Mountains and the Daba Mountains. The Qinling Mountains lie across the middle of China, starting from the Jialing river in the west to reach the Funiu Mountains in the east, with a total length of about 800 km (Figure 1). The Daba Mountains, also known as Bashan Mountains, start from the Jialing River Valley in the west and ends at the Wudang Mountains in the east. It is a natural barrier between southern Shaanxi and northern Sichuan. The study area involves six provinces and cities in Shaanxi, Henan, Hubei, Chongqing, Sichuan, and Gansu and 30 administrative research units. Its total area is 30.60 × 10⁴ km2, with fertile land, a mild climate, annual rainfall of 700–1000 mm, and an average temperature of 12–15.7 °C. Sunlight hours are about 1440–1840 h. The terrain of the Qinling-Daba Mountains is quite different, with a height difference of 5192 m. The terrain is steep and soil erosion is very common.

3. Data and Methods

3.1. Data Sources

3.1.1. Remote Sensing Data

The remote sensing data included the Normalized Difference Vegetation Index (NDVI) dataset and the Digital elevation model (DEM) dataset. Between them, the DEM dataset uses the SRTM 90 m DEM dataset. The GIMMS NDVI 3 g V1.0 dataset in the third-generation NOAA/AVHR remote sensing data (NDVI 3 g) was selected for the NDVI data, and the spatial and temporal resolutions were 15 d and 5 km, respectively, and the NDVI year dataset was synthesized by the maximum synthesis method [37]. The data time range was 1982, 1995, 2005, and 2015.

3.1.2. Meteorological Data

The precipitation data selects the daily value dataset of China’s surface climate data (V3.0), which contains 824 reference monitoring stations in China, and organizes the daily data into monthly and annual date, using a standardized and reasonable method of meteorological data processing [38] and spatial interpolation of precipitation data using ANUSPLIN software [39]. The spatial resolution is 1 km. The data time range is 1982, 1995, 2005, and 2015.

3.1.3. Soil and Land Use Data

The soil data were selected from the 1:1 million soil dataset provided by Nanjing Soil, Chinese Academy of Sciences in the Harmonized World Soil Database version 1.1 (HWSD). Five indicators, soil sand content (SAND), silt content (SILT), clay content (CLAY), soil bulk density (REF_BULK), and organic carbon content (OC) were selected for soil conservation function evaluation. Phosphorus content (QLHL) and total potassium content (QJHL) were used for soil nutrient conservation analysis. The land use data were obtained from the Chinese Academy of Sciences and the Resource and Environmental Science Data Center, and the 6 land use types included cultivated land, forest land, grassland, water area, construction land, and unused land Class I type with a spatial resolution of 1 km. For data acquisition reasons, 1982 was replaced by 1980 data, so the data time range was 1980, 1995, 2005, and 2015.

3.1.4. Ecosystem and Vegetation Data

The ecosystem data were obtained from the Data Center of Resource and Environment Science, and the Chinese Academy of Sciences, with a spatial resolution of 1 km. It included grassland ecosystems, water bodies and wetland ecosystems (swamps, canals, lakes, reservoirs, glaciers and permanent snow cover, and floodlands), settlement ecosystems (towns, rural settlements, industrial, and mining), and other ecosystems (sand, Gobi, saline-alkali land, and alpine desert). The vegetation data are selected from the “1:1 million China Vegetation Atlas”. In this study, the vegetation is divided into coniferous forest, mixed coniferous and broad-leaved forest, broad-leaved forest, shrub, grassland, grass and meadow, swamp, alpine plants, and crops (10 categories).

3.1.5. Administrative Division Data

Considering that there were several adjustments to names, levels, and the scope of administrative divisions from 1982 to 2015, the data of administrative divisions are based on the situation at the end of 2015. For the convenience of data statistics and analysis, this study made a horizontal comparison between Chongqing and Shennongjia Forest District and the remaining 28 prefecture-level administrative units.

3.2. Revised Universal Soil Loss Equation Model (RUSLE)

Soil conservation (Ac) reflects the strength of the soil conservation function of the ecosystem [33], and the RUSLE model is widely used in the calculation of soil conservation function. The RUSLE model is based on the USLE (Universal Soil Loss Equation) model, and solves the limitations of the USLE model in terms of the scope of application and the runoff effects. The parameter calculation is convenient and simple, the prediction results are more accurate, and the practicability is strong. The RUSLE model is used to estimate the potential soil erosion (Ap) and the actual soil erosion (Ar) in the watershed, and the difference between the two is the ecosystem soil conservation (Ac) [13] (see Equations (1)–(3)).
A r = R K L S C P
A p = R K L S
A c = A p A r
Ar is the amount of actual soil erosion; Ap is the amount of potential soil erosion; Ac is the soil conservation amount of the ecosystem; R is the rainfall erosion factor; K is the soil erosion factor; LS is the terrain factor, where L is the slope length factor and S is the slope factor; C is the surface cover factor; and P is the soil and water conservation factor. Among them, Ap represents the amount of soil erosion that may occur without C and P (C = 1, P = 1), when C = P = 1, Ap = Ar.
While preventing soil erosion and maintaining soil, ecosystems also play the role of reducing soil nutrient loss [13]. This paper mainly considers the loss of N, P and K nutrients in the soil (see Equation (4)).
W N , P , K = i = 1 n A c C N , P , K
WN,P,K are the total amount of nutrients in soil conservation; CN,P,K are the contents of total N, total P, and total K in the soil, respectively.
The RUSLE model has been widely used in the evaluation of soil conservation function. To make it easier to understand, we have explained each factor of RUSLE in Table 1.

3.3. Grading Standard Method

In order to deeply analyze the category characteristics of soil erosion and to further grasp the different degrees of soil erosion, this study uses the “Soil Erosion Classification and Grading Standard SL190-2007” issued by the Ministry of Water Resources of China to classify [47]. This standard is formulated on the basis of a large number of observations and research summaries, and has a high scientific and practical significance. According to this standard, the soil erosion can be divided into 6 grades: slight, mild, moderate, intense, extremely intense, and severe.

4. Results

4.1. Characteristics of Soil Erosion in the Qinling-Daba Mountains and Temporal and Spatial Changes

4.1.1. Quantity and Structural Characteristics of Soil Erosion in the Qinling-Daba Mountains

From (2), the amount of potential soil erosion and actual soil erosion in the Qinling-Daba Mountains can be estimated. The degree of soil erosion is divided into six grades according to the grading standard mentioned in the method. The potential soil erosion situation and the actual soil erosion situation in the Qinling-Daba Mountains can be obtained (see Table 2 and Table 3).
The total potential soil erosion in the Qinling-Daba Mountains in 1982, 1995, 2005, and 2015 were 1076.40 × 108 t, 1382.40 × 108 t, 1936.22 × 108 t, and 1142.18 × 108 t, respectively; and the potential soil erosion moduli were 3517.65 t·hm−2, 4517.65 t·hm−2, 6327.52 t·hm−2, and 3732.61 t·hm−2. Potential soil erosion is particularly affected by precipitation. In 2005, due to the increase in precipitation, the corresponding potential soil erosion also increased significantly. In terms of erosion intensity, the proportion of areas with a strong erosion degree and above fluctuated from 7.12% in 1982 to 7.49% in 2015, showing a slight increase.
From 1982 to 2005, the degree of soil erosion in the Qinling-Daba Mountains deepened, and the proportion of the actual soil erosion level above the intensity level increased by 14.98%, and the total amount of soil erosion increased by 554.56 × 10⁸ t. Compared with 2005, the NDVI increased by 0.13 in 2015, and the changes in land use, such as cultivated land and forest land, also affected artificial water and soil conservation measures, so the actual soil erosion in 2015 decreased by 516.53 × 10⁸ t compared to 2005. In terms of erosion intensity, the proportion of areas with a strong erosion degree and above fluctuated from 13.58% in 1982 to 14.29% in 2015, showing a slight increase.
Compared with the amount of potential soil erosion, the amount of actual soil erosion is not only affected by precipitation, but is also affected by vegetation coverage and artificial soil and water conservation measures. When controlling the amount of precipitation, keeping it unchanged, the actual soil erosion in the Qinling-Daba Mountains decreased by 5.59 × 10⁸ t in 2015 compared with 1982. This shows that the soil conservation function of the ecosystem in the Qinling-Daba Mountains has been improved under human intervention. On the one hand, the improvement of vegetation coverage is conducive to a reduction in soil erosion and enhances the soil conservation function of the ecosystem. On the other hand, the establishment of more soil and water conservation measures has improved the soil and water conservation function of the ecosystem to a certain extent, and this also means that more natural land is transformed into artificial land.

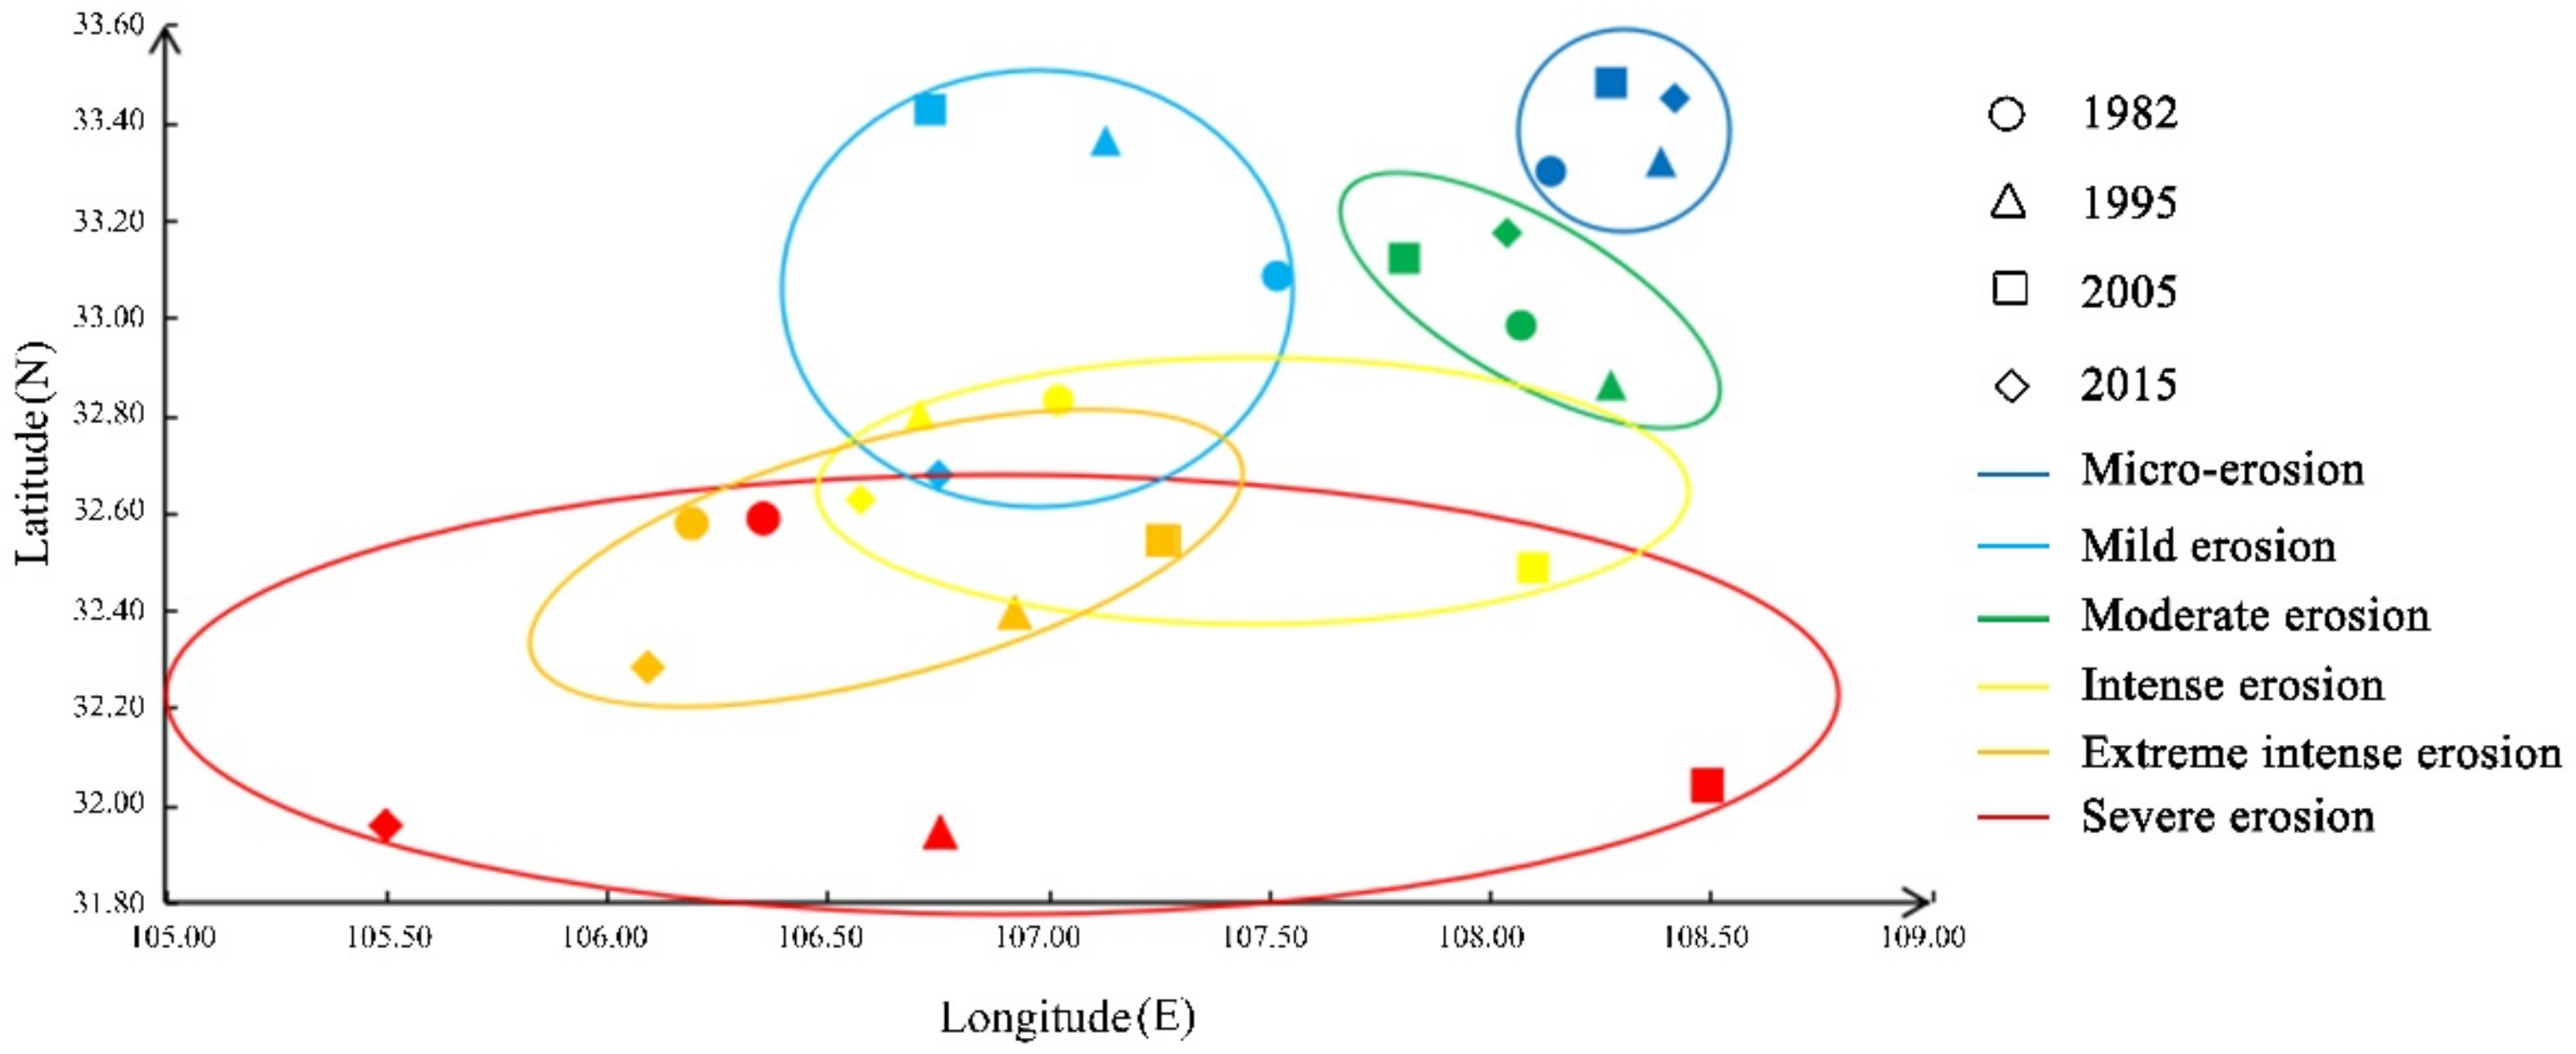
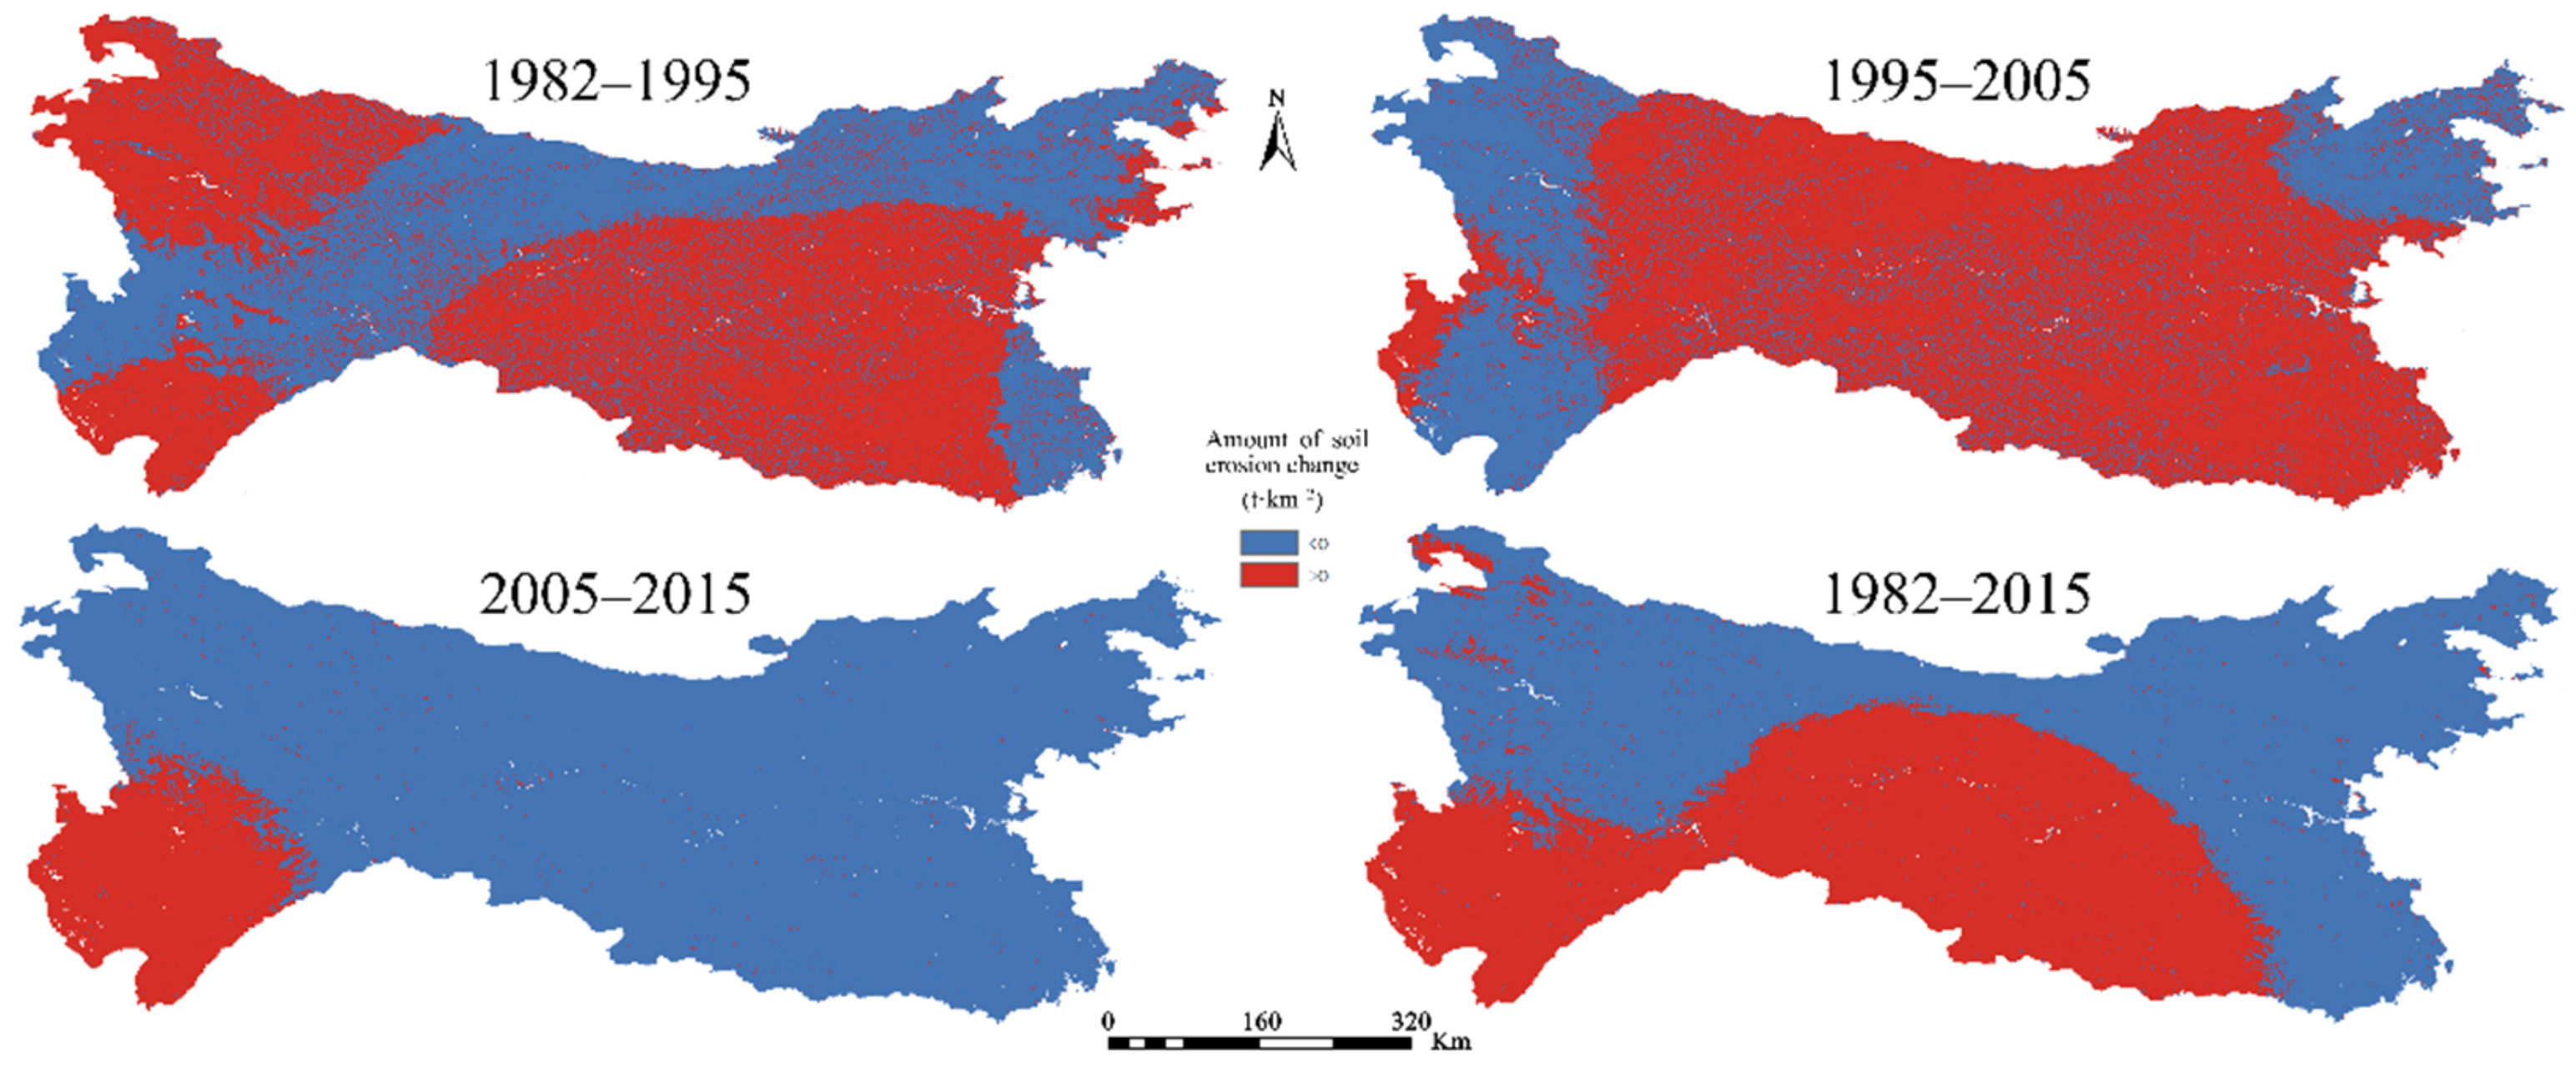
4.1.2. Spatial and Temporal Characteristics of Soil Erosion in the Qinling-Daba Mountains

The estimation of soil erosion characteristics from the perspective of quantity and structure ignores the spatial distribution of the soil erosion degree, and it is more beneficial to formulate water and soil protection measures according to local conditions by combining the time scale to verify the spatial distribution of actual soil erosion degree. As shown in Figure 2, the actual soil erosion in the Qinling-Daba Mountains in 1982, 1995, 2005, and 2015 had an obvious spatial aggregation and spatio-temporal transfer. From the northeast to the southwest, the soil erosion degree in the Qinling-Daba Mountains gradually deepened and the range of oscillation continued. During the study period, the centroid of soil slight erosion had the most significant spatial aggregation. Although the centroid of mild, moderate, strong, and extremely strong soil erosion had obvious spatial migration, the change was not large, while the centroid of severe soil erosion was located in the Qinling-Daba Mountains. The southern foot is in a swinging state, with large inter-annual changes. At the same time, in 1982, the center of gravity of each soil erosion level was relatively concentrated. The moderate and lower levels were concentrated in the northeastern Qinling-Daba Mountains, and the strong and above levels were concentrated in the southwest of the Qinling-Daba Mountains. In other years, the soil erosion levels were relatively concentrated in a discrete state. Therefore, accelerating the implementation of soil and water conservation measures in the southern Qinling-Daba Mountains and strengthening the dynamic observation of factors such as precipitation and vegetation coverage are more conducive to the realization of the soil conservation function of the ecosystem in this region.
In order to more clearly show the spatial characteristics of actual soil erosion changes in the Qinling-Daba Mountains in 1982, 1995, 2005, and 2015, the raster data of actual soil erosion in 1982 and 1995, 1995 and 2005, 2005 and 2015, and 1982 and 2015 were superimposed respectively. In this way, the positive and negative changes in the amount of actual soil erosion between the years can be obtained, as shown in Figure 3. It can be seen that the actual soil erosion in the northeastern, central, and western parts of the Qinling-Daba Mountains showed a downward trend from 1982 to 2015, and the soil conservation function improved significantly, while the southern region generally showed an upward trend, especially in parts of the southwest. Except for the decrease in the actual amount of soil erosion from 1995 to 2005, it experienced an overall increase in other years. At the same time, from the graphs of 1982–1995 and 1982–2015, it can be seen that the actual positive and negative boundary of soil erosion presents a relatively smooth feature, which is similar to the distribution of precipitation, indicating that the spatial variation of precipitation intensity is relatively smooth. This greatly affects the realization of soil conservation function in the Qinling-Daba Mountains. In general, compared with the spatial characteristics presented in Figure 2, the southern Qinling-Daba Mountains is still a key area for reducing soil erosion and improving soil conservation in the future.

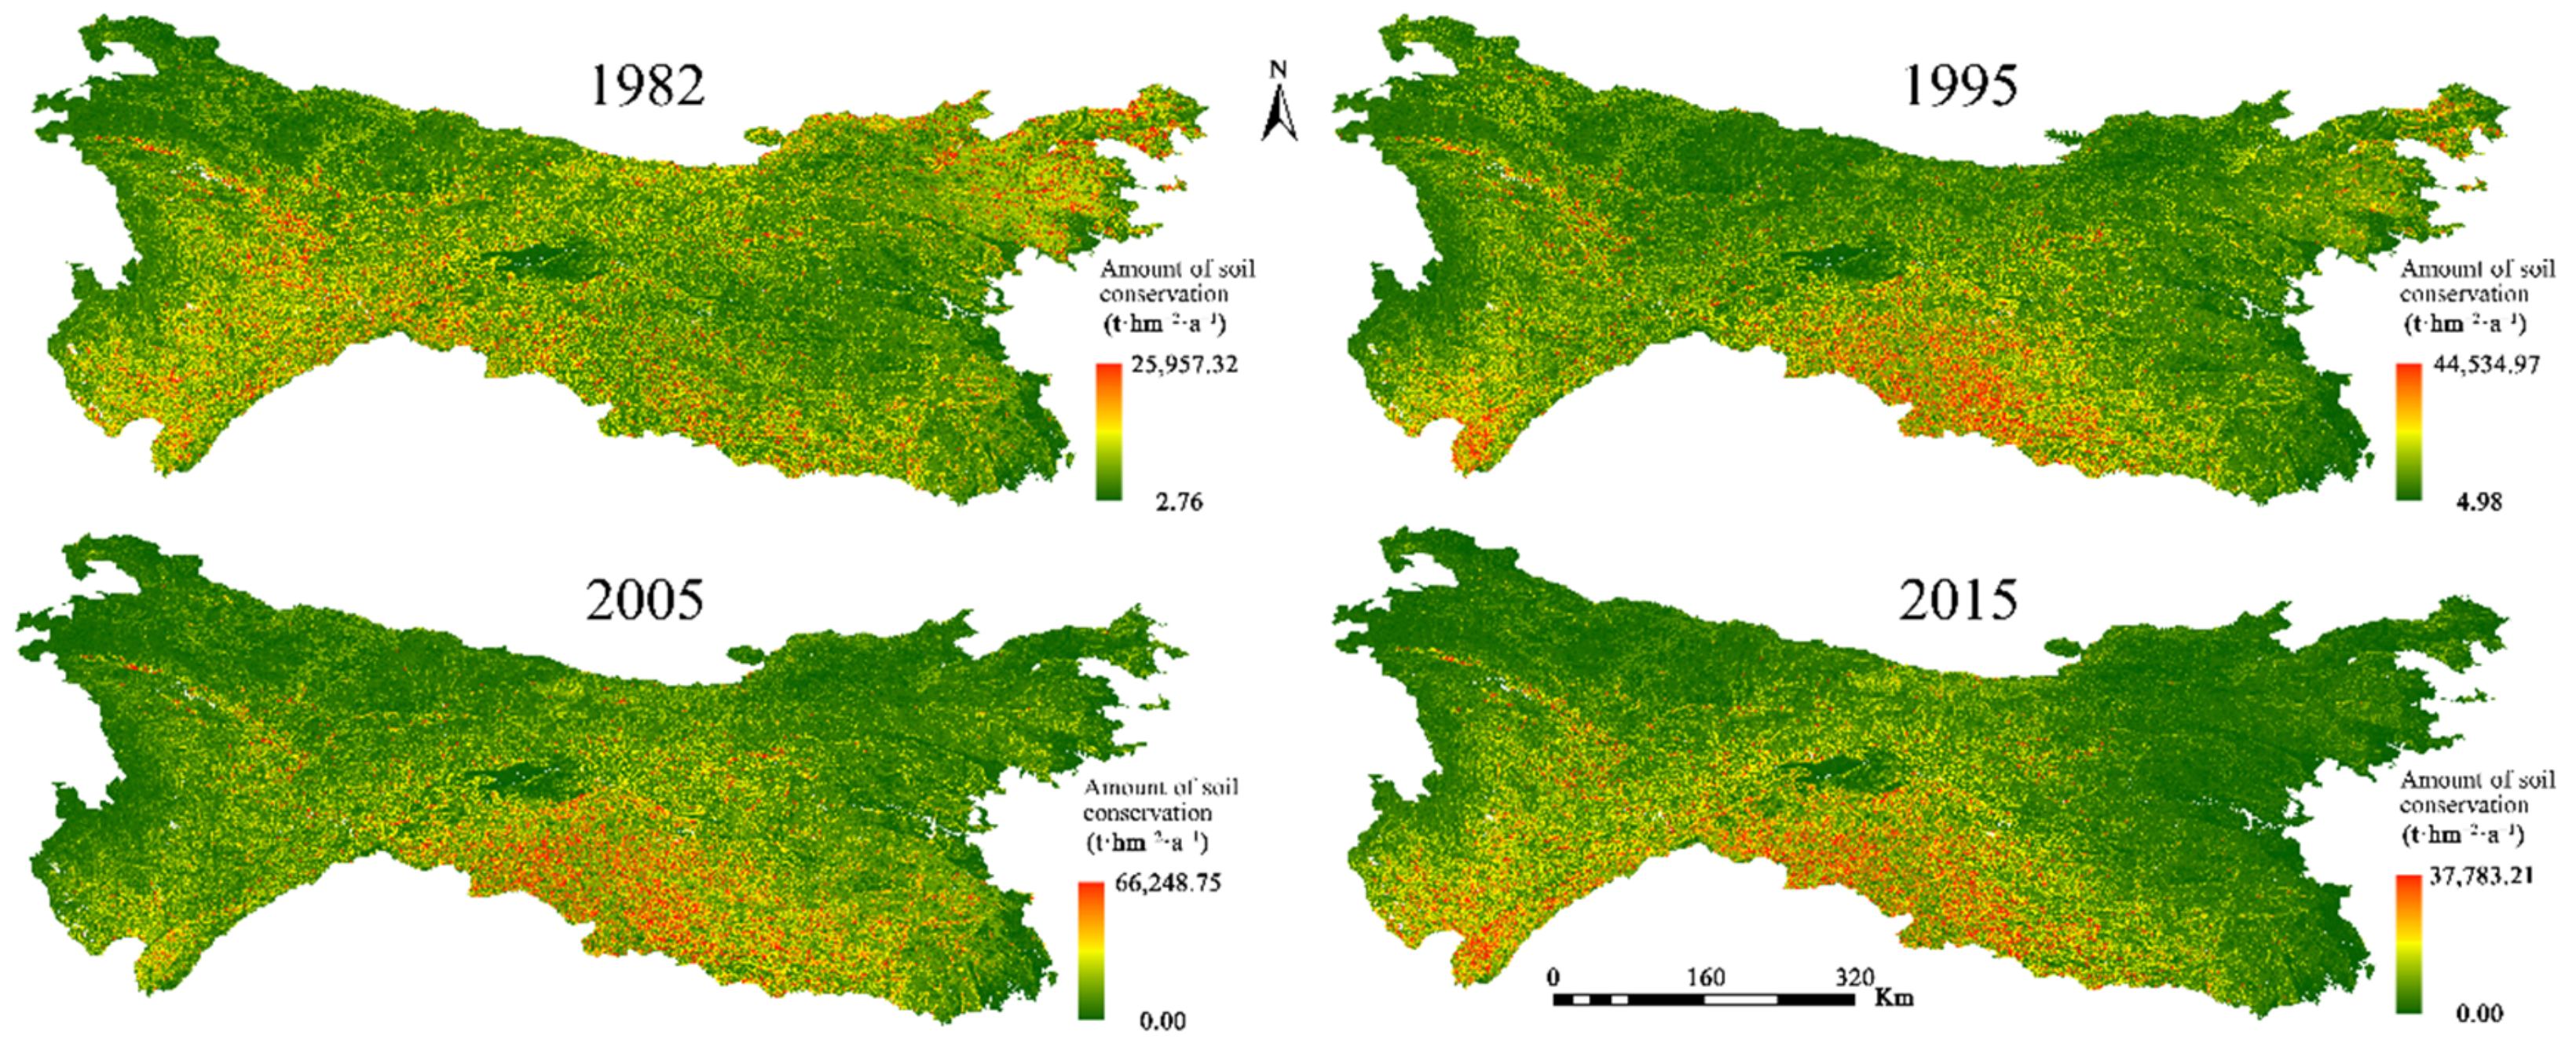
4.2. Soil Conservation and Spatio-Temporal Characteristics in the Qinling-Daba Mountains

According to (3), the amount of soil and water conservation can be calculated in 1982, 1995, 2005, and 2015. Its spatial distribution is shown in Figure 4.
The total soil conservation in the Qinling-Daba Mountains in 1982, 1995, 2005, and 2015 were 321.33 × 10⁸ t, 418.68 × 10⁸ t, 626.59 × 10⁸ t, and 349.08 × 10⁸ t, respectively. Combined with Table 2, due to the surge in precipitation in the study area in 2005, the potential soil erosion in that year was higher than in other years, but under the control of soil and water conservation measures, the soil conservation in 2005 was much higher than in other years. From the spatial distribution of soil conservation, during the study period, the high-value areas of soil conservation in the Qinling-Daba Mountains showed a trend of gathering in the central and southern regions. In 1982, there were two high-value areas of soil conservation in the northeast and southwest of the study area. With the passage of time, the soil conservation capacity in the northeastern Qinling-Daba Mountains gradually decreased, while the soil conservation capacity in the southern part gradually increased.
The main body of soil conservation work is mainly administrative units and the scope of implementation is mainly based on administrative regions. The key areas for soil conservation in Qinling-Daba Mountains can therefore be further shown from the perspective of administrative divisions (see Figure 5). From the proportion of total soil conservation, the amount of soil conservation per unit area in Hanzhong and Ngawa was relatively low. However, the total soil area of these two regions was rather large, and accounted for a vast proportion in the whole study area. In 2015, the soil conservation in Hanzhong and Ngawa was 92.03 × 10⁸ t, accounting for 24.94% of the total soil conservation in the study area; the proportion of the total soil conservation in Jingmen, Linxia, and Xuchang was relatively low, and in 2015 their amount of soil conservation only accounted for 0.16%, 0.21%, and 0.21% of the total, respectively. This is related to its relatively small proportion of land area and its low total yield per unit area. The changes in soil conservation in Chongqing, Ngawa, and Ankang was relatively large. During the study period, the standard deviation of the total proportion ranked in the top 3 across all administrative regions, the maximum change was more than 1 times, and in Chongqing it was 2.82 times. From the perspective of soil conservation per unit area, the soil conservation per unit area of Chongqing, Bazhong, Chengdu, and Dazhou is relatively high, and the soil conservation per unit area of Jingmen, Linxia, Tianshui, and Dingxi is relatively high. In 2015, the soil conservation per unit area in Bazhong reached 3532.08 t·hm−2, which was 15.90 times that of Jingmen, which had the lowest value of soil conservation per unit area. The cumulative maximum soil conservation amount per unit area was Chongqing, reaching 14,592.84 t·hm−2, which is 9.67 times the lowest value in Jingmen, and the difference is quite obvious. In general, the proportion of total soil conservation and the soil conservation per unit area in Chongqing were high, and this should be the enriched area of the soil conservation function in the Qinling-Daba Mountains. The soil conservation per unit area in Hanzhong and Ngawa was low, but the proportion of total soil conservation was relatively high, and therefore large-scale soil conservation measures should be further promoted. Chengdu, Deyang and other places had relatively high soil conservation per unit area, while the proportion of total soil conservation was low, which was on the edge of the soil conservation function of the Qinling-Daba Mountains. Although the land area of Chengdu, Deyang and other places in the study area is relatively small, it should nevertheless continue to maintain the current good soil conservation status.
Different ecosystems affect soil retention capacity through surface cover, material exchange, etc. These details are shown in Table 4. The average strength of soil conservation function in different ecosystems is in the order of forest ecosystem > farmland ecosystem > grassland ecosystem > water body and wetland ecosystem > settlement ecosystem > desert ecosystem > other ecosystems. Among these, the forest ecosystem is lush green with vegetation, and the tree canopy has a great protective effect on the surface soil, which weakens the denudation ability of rainfall. Compared with 1995, the rainfall surged further in 2005 and the soil conservation function of different ecosystems was highlighted. The soil conservation of farmland ecosystems and forest ecosystems increased by 90.79 × 10⁸ t and 95.48 × 10⁸ t respectively. However, it is worth noting that the ways of realizing the soil conservation function of the two ecosystems were quite different. In the farmland ecosystem, the establishment of a large number of soil and water conservation measures improved the soil conservation function, while in the forest ecosystem the high vegetation coverage played that role. Moreover, the vegetation types were relatively superior, which resulted in a strong soil conservation function. After the increase of rainfall, the soil conservation of the settlement ecosystem decreased by 0.30 × 10⁸ t. Therefore, the over-exploitation of land through construction land greatly weakened the soil conservation function of the ecosystem.
On the basis of the above analysis, the distribution of soil conservation function of different vegetation types in the same-level ecosystem was further analyzed. The results are shown in Table 5. The soil conservation function of different vegetation types is in the order of crops > shrub > broad-leaved forest > coniferous forest > grass > meadow > grassland > coniferous and broad-leaved mixed forest > alpine plant > swamp, and the average soil conservation capacity is 128.36 × 10⁸ t, 106.22 × 10⁸ t, 99.97 × 10⁸ t, 52.12 × 10⁸ t, 34.26 × 10⁸ t, 21.59 × 10⁸ t, 1.65 × 10⁸ t, 0.73 × 10⁸ t, 0.56 × 10⁸ t, 0.02 × 10⁸ t. On the whole, the soil conservation function of vegetation in the same ecosystem was quite different. The soil conservation function of coniferous and broad-leaved mixed forest was weaker than that of broad-leaved forest and coniferous forest and the soil conservation function of grassland was weaker than that of grass and meadow. This may be related to the internal vegetation composition. Water bodies, wetland ecosystems and farmland ecosystems had certain differences due to statistical calibers, but from the perspective of vegetation types, they can show more refined soil conservation functional characteristics, and crops with a high soil conservation may be associated with higher potential soil erosion (related [13]).
The relationship between soil conservation and slope, elevation, and vegetation coverage was expressed, and the results are shown in Figure 6. The elevation and slope of the Qinling-Daba Mountains were negatively correlated with the total amount of soil conservation, while the vegetation coverage was positively correlated with the total amount of soil conservation. The total amount of soil conservation showed a trend of “short rise and long fall” with the increase of elevation. Among them, when the elevation of the Qinling-Daba Mountains was between 1000 m and 1500 m, the total amount of soil conservation was the largest. When the elevation was 1500 m, the soil conservation per unit area reached 2115.25 t·hm−2. The elevation of 1500–3500 m may be affected by soil properties and vegetation structure. The area of soil conservation decreased; the total soil conservation on the slope classification was similar to the elevation classification. When the slope was 10°, the total soil conservation reached a peak value of 177.06 × 10⁸ t. As the slope become steeper, the total amount of soil retention decreased gradually, and the soil retention function became weaker. The soil conservation per unit area increased with the increase of the slope, mainly due to its large potential of soil erosion; the relationship between the vegetation coverage and the total soil conservation showed a trend of “long increase and short decrease”. When the vegetation coverage reached 70%, the total amount of soil conservation reached a peak value of 346.57 × 10⁸ t, and the further increase in vegetation coverage caused the total amount of soil conservation to decrease, which may be due to errors in calculation and NDVI is easily saturated in areas with high vegetation coverage, resulting in the vegetation Exponential Compression Phenomenon. After the vegetation coverage reached 30%, the soil conservation per unit area decreased slightly, which was perhaps caused by the differences in vegetation types and its structures. In general, soil conservation decreased with the increase in slope, and increased with the increase in vegetation coverage. Increasing vegetation protection and increasing green areas are beneficial to improve the soil conservation function of the ecosystem.

4.3. Nutrients of Soil Conservation and Spatial Distribution in the Qinling-Daba Mountains

Nutrients of soil conservation is an important part of ecosystem soil conservation. At present, there are few studies on the assessment of soil nutrient conservation in the Qinling-Daba Mountains and the changes over the years are rare. Therefore, this part of the research has a high novelty. Using (4), the retention of N, P, and K elements in Qinling-Daba Mountain soil was estimated, and the results are shown in Figure 7 and Figure 8.
During the study period, the average retentions of N, P, and K elements in the Qinling-Daba Mountains were 75.57 × 10⁴ t, 25.35 × 10⁴ t, and 737.28 × 10⁴ t, respectively (Figure 7). The spatial distribution of the three elements was consistent, but the spatial retentions were different. The spatial distribution peak point for soil N element is clearly located in the southwest of the study area, while the total soil P and total K are clearly distributed in the southwest and south. There were also differences in the distribution of low-value areas of soil elements. The central area had the lowest nutrients for soil conservation, and there were two low-value areas of N in the northeast and north-central areas, while the distribution of K was relatively uniform.
As can be seen from Table 6, the effects of different vegetation types on different nutrients of soil conservation are different. Among them, the retention capacity of soil N, P, and K elements per unit area of different vegetation is in the order of alpine plants > coniferous and broad-leaved mixed forest > meadow > shrub > coniferous forest > grass > grassland > broad-leaved forest > crops > swamp; alpine plants > mixed coniferous and broad-leaved forest > grasses > shrubs > meadows > coniferous forests > grasslands > crops > broad-leaved forests > swamps; alpine plants > grasses > mixed coniferous and broad-leaved forests > shrubs > meadows > crops > coniferous forest > broad-leaved forest > grassland > swamp. Other factors are closely related. Due to the vast area of shrubs and broad-leaved forests in the Qinling-Daba Mountains, some river valleys and basins are relatively important food production areas, and the crop area is also large, and their contribution rates to the nutrients of soil conservation capacity in the study area are all greater than 20%. The contribution rate is more than 70%. From the perspective of forest land, the total amount of nutrients of soil conservation of broad-leaved forest was higher than that of coniferous forest, but the unit retention capacity of the two was equivalent; although the overall nutrients of soil conservation of mixed coniferous and broad-leaved forest were lower, the unit retention capacity was lower in the forest land. The highest was higher by an average of 32.80%. From the perspective of grassland, the total amount of P and K retained by the grass was higher than that of the meadow and grassland, but the total amount of N retained was lower than that of the meadow; grassland, grass, and meadow had little difference in the unit retention capacity of soil nutrients for N and P elements, but in terms of K element, grass was 38.94% higher on an average than grassland and meadow. In general, there are differences in the ability of different vegetations to maintain different soil nutrients. Reasonable interplanting of vegetation will help to maintain soil nutrients, and at the same time will also strengthen the protection level of plants in alpine regions, thereby improving the material production capacity of the ecosystem.
In terms of the overall nutrients of soil conservation in the Qinling-Daba Mountains (see Figure 8), there were big differences between 1982, 1995, 2005, and 2015. The total amount of nutrients of soil conservation were 637.76 × 10⁴ t, 822.22 × 10⁴ t, 759.42 × 10⁴ t, and 689.73 × 10⁴ t, respectively. The spatial distribution characteristics of nutrients of soil conservation in the Qinling-Daba Mountains were significantly different between years. The spatial distribution of soil nutrients in 1982 was relatively uniform, but there were two clusters in the northeast and in the southwest. In 1995, 2005, and 2015, the soil nutrient accumulation area in the northeast gradually shifted to the central and southern parts, and the soil nutrient accumulation in the southwest was the most significant in 1995 and 2015. This result is similar to that of related studies [48]. The loss of soil nutrients in the eastern Qinling-Daba Mountains is not conducive to the future production and life of the region. Therefore, the establishment of suitable soil nutrient conservation measures will have a positive significance for the future development of the region.

5. Discussions

5.1. Reliability of the Calculation Results of the Soil Maintenance Function in the Qinling-Daba Mountains

This paper calculates the number of potential soil erosion, actual soil erosion, soil retention, and soil nutrient retention in the Qinling-Daba Mountains in 1982, 1995, 2005, and 2015. The results were similar to the existing studies. For example, Rao calculated the spatial characteristics of the ecosystem soil conservation function in the Sichuan Province, and found that the average soil retention strength of Bazhong, Dazhou, Guangyuan, and other places were high and constituted the most important soil retention area [49], which was consistent with the results. At the same time, Chen calculated the soil conservation function level of the soil in Shangluo city in the Qinling-Daba Mountains area, and found that the actual number of soil erosion and potential soil erosion in Shangluo around 2010 were 1.21109 t and 3.4107 t [50] respectively, which were similar to the estimated results of this paper, indicating that the results were reliable.

5.2. Factors Affecting the Soil Conservation Function in the Qinling-Daba Mountains

According to the RUSLE model, under the premise of K and LS, the soil conservation function of the ecosystem is mainly affected by precipitation, vegetation, and soil conservation measures. From the results of this paper, precipitation, vegetation, and soil and water conservation measures have an impact on the soil conservation function of the Qinling-Daba Mountains, but from the perspective of the impact degree, it should be precipitation > vegetation > soil and water conservation measures. From the perspective of precipitation, it is obvious that due to the large increase of precipitation in 2005, the proportion of the actual soil erosion in the Qinling-Daba Mountains increased by 14.98%, and the total soil erosion increased by 554.56 × 10⁸ t. At the same time, when the control precipitation remained unchanged, the actual soil erosion in 2015 decreased by 5.59 × 10⁸ t compared with 1982, but in fact, the amount of soil erosion in 2015 increased by 38.03 × 10⁸ t compared with 1982, which demonstrates the intensity of precipitation. From the perspective of vegetation status, the improvement of vegetation coverage means that vegetation can reduce the scour effect of precipitation on soil, and its litter and roots also enhance the amount of soil retention. Although different vegetation types vary in soil conservation ability, this study found that mixing different types of vegetation into different types of ecosystems may have a positive effect on soil conservation function. At the same time, there is also a relationship threshold between vegetation coverage and soil retention quantity, which may cause a decrease in soil retention quantity, which provides some ideas for plantation planting and vegetation restoration. In terms of soil and water conservation measures, the results showed that the amount of potential soil erosion in the Qinling-Daba Mountains in 2005 was the highest in the study period, but the number of soil conservation was also the highest. On the basis of the slight improvement of vegetation coverage, the improvement of soil and water conservation measures caused by land use changes such as forest land and cultivated land is the key factor in the amount of soil conservation.
For the Qinling-Daba Mountains area, the large inter-annual change in precipitation means that it faces difficulty in changing the climatic conditions, which brings great uncertainties and challenges to the soil conservation work. With the gradual increase of extreme precipitation, the role of the Qinling-Daba Mountains as an ecological barrier in the north and south of China has also been negatively affected by [51]. Thus, in addition to strengthening the precipitation monitoring and forecasts in key areas, a reasonable improvement in vegetation coverage across the Qinling-Daba Mountains, improvements in the combination effect between different ecosystems and similar ecosystems, and at the same time attention paid to land consolidation and waste land development, measures for the prevention or reduction of soil erosion area also important to improve soil ability in the future.

5.3. The Particularity of Soil Conservation Function in the Qinling-Daba Mountains Area

Due to its geographical location and landform conditions, the land around the Qinling-Daba Mountains has a certain particularity in soil conservation compared with other mountains in China. First, there are many mountains in the northern and southern regions of China, especially in the northeast and in the southwest, which matches the prevailing wind direction of the monsoon in China. The precipitation law of the windward slope and the leeward slope is more obvious [52]. The Qinling-Daba Mountains is an east–west mountain range in China, and is in the transition zone of humid and semi-humid areas in China. The intensity and distribution rules of precipitation are not very clear, and the difference between the eastern and western regions is also not clear. This shows that soil retention functions in the Qinling-Daba Mountains should not only pay attention to the space change of precipitation intensity, but should also pay attention to the natural environmental differences between the regions. The results of this study also show that Qinling-Daba Mountains soil erosion constitutes both an agglomeration and an expansion trend in terms of the eastern mountain soil nutrient loss, which has increased year by year. Secondly, as the main part of the north–south transition zone in China, its soil conservation function also shows the characteristics of transition. According to Zhu Qing’s study on the Loess Plateau in the north of the Qinling-Daba Mountains, the annual average actual and potential soil erosion moduli of the Yanhe River basin are 31,783 t·km−2a−1 and 624,015 t·km−2a−1 [53], which greatly exceeds the unit area erosion moduli of the Qinling-Daba Mountains. Moreover, the study of some small basins in the south of the Qinling-Daba Mountains shows that the soil erosion moduli are about 500.177–12,521.968 t·km−2a−1 [54], and its numerical range is smaller than that of the Qinling-Daba Mountains. This shows that the amount of soil erosion in the north and south sides is increasing from the south to the north. Combined with the results of this study, the soil erosion degree in the south of the Qinling-Daba Mountains is lower, the soil erosion degree in the north is higher, and the soil erosion degree in the Qinling-Daba Mountains is in the middle level. The soil erosion degree presents transitional characteristics in the Qinling-Daba Mountains. Once the soil conservation function of the Qinling-Daba Mountains is destroyed, the transitional characteristics will be affected, resulting in an increase in the amount of soil erosion in the Qinling-Daba Mountains, affecting the stability of the natural environment. Although there are some differences in soil structure, it also reflects the important role of the Qinling-Daba Mountains as an ecological barrier, that is, increasing the ecological protection measures can limit the boundary line in areas with severe soil erosion.

6. Conclusions

The soil conservation function of the ecosystem is affected by the internal structure of the ecosystem, among which precipitation, topography, soil, and human disturbance are the most significant. Considering the above-mentioned influencing factors, the soil conservation function of the Qinling-Daba Mountains was evaluated and analyzed in the hope of improving the soil conservation capacity of the Qinling-Daba Mountains and to build a strong barrier to maintain the ecological security of the north–south transition zone in China. The conclusions of this research are as follows:
  • The inter-annual variation of soil erosion in Qinling-Daba Mountains is noticeable, and there are obvious spatial and temporal agglomeration characteristics in the northeast and south, and in the northeast–southwest direction. During the study period, soil erosion in the Qinling-Daba Mountains fluctuated greatly throughout the year. Soil erosion in the Qinling-Daba Mountains has a clear spatial aggregation phenomenon and a temporal and spatial transfer phenomenon, and the soil erosion degree gradually deepens from the northeast to the southwest. The centroid of slight soil erosion was significantly concentrated in the northeast, while the centroid of the severe soil erosion area oscillated at the southern foot of the Qinling-Daba Mountains. The area with increased erosion was concentrated in the south of the study area, and the erosion was reduced in the northeast and in the central and western parts of the study area. This conclusion shows the key areas for soil erosion control in the Qinling-Daba Mountains.
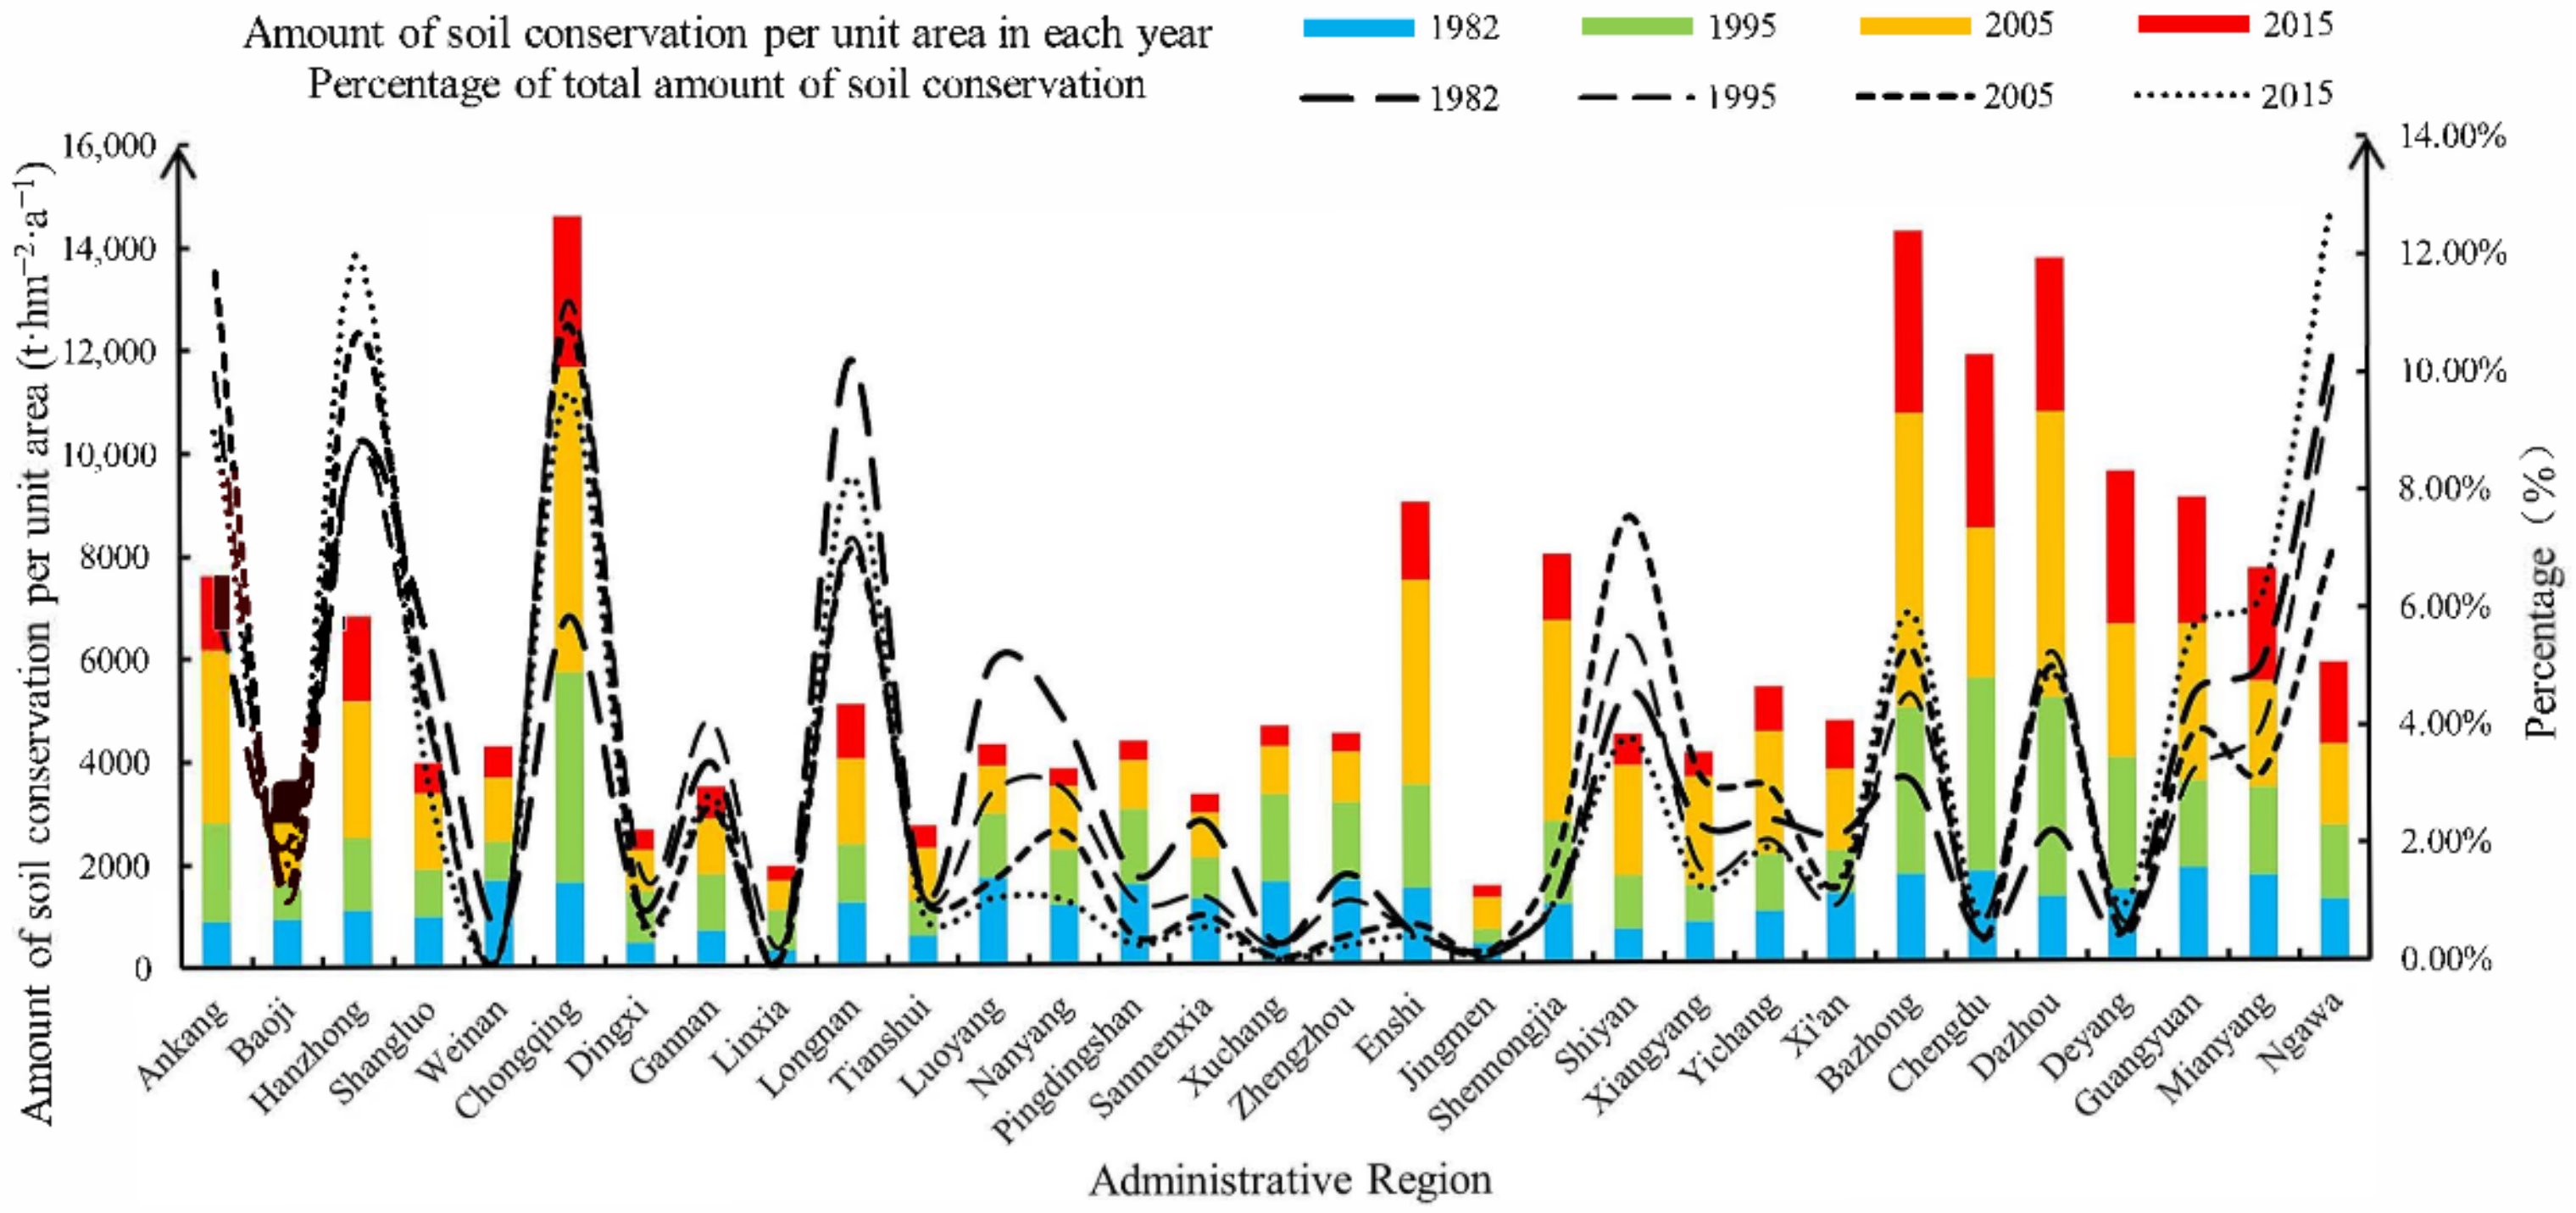
  • The high-value areas of soil conservation in the Qinling-Daba Mountains moved from the northeast and the southwest to the central and southern regions. Hanzhong and Ngawa were the key areas to strengthen soil conservation measures. In 1982, there were two high-value areas of soil conservation in the northeast and southwest of the study area. With the change of time, the soil conservation in the northeast gradually decreased, and the soil conservation in the central and southern parts gradually increased. During the study period, the soil conservation per unit area in Hanzhong and Ngawa was relatively low, and the total soil conservation accounted for a relatively high proportion, which should be the key remediation areas for promoting soil conservation measures in the future. Chongqing is rich in soil conservation functions in the Qinling-Daba Mountains. Chengdu, Deyang and other places belong to the marginal areas of the soil conservation function of the Qinling-Daba Mountains. This conclusion shows the key areas for improving the soil conservation function in the Qinling-Daba Mountains in different periods.
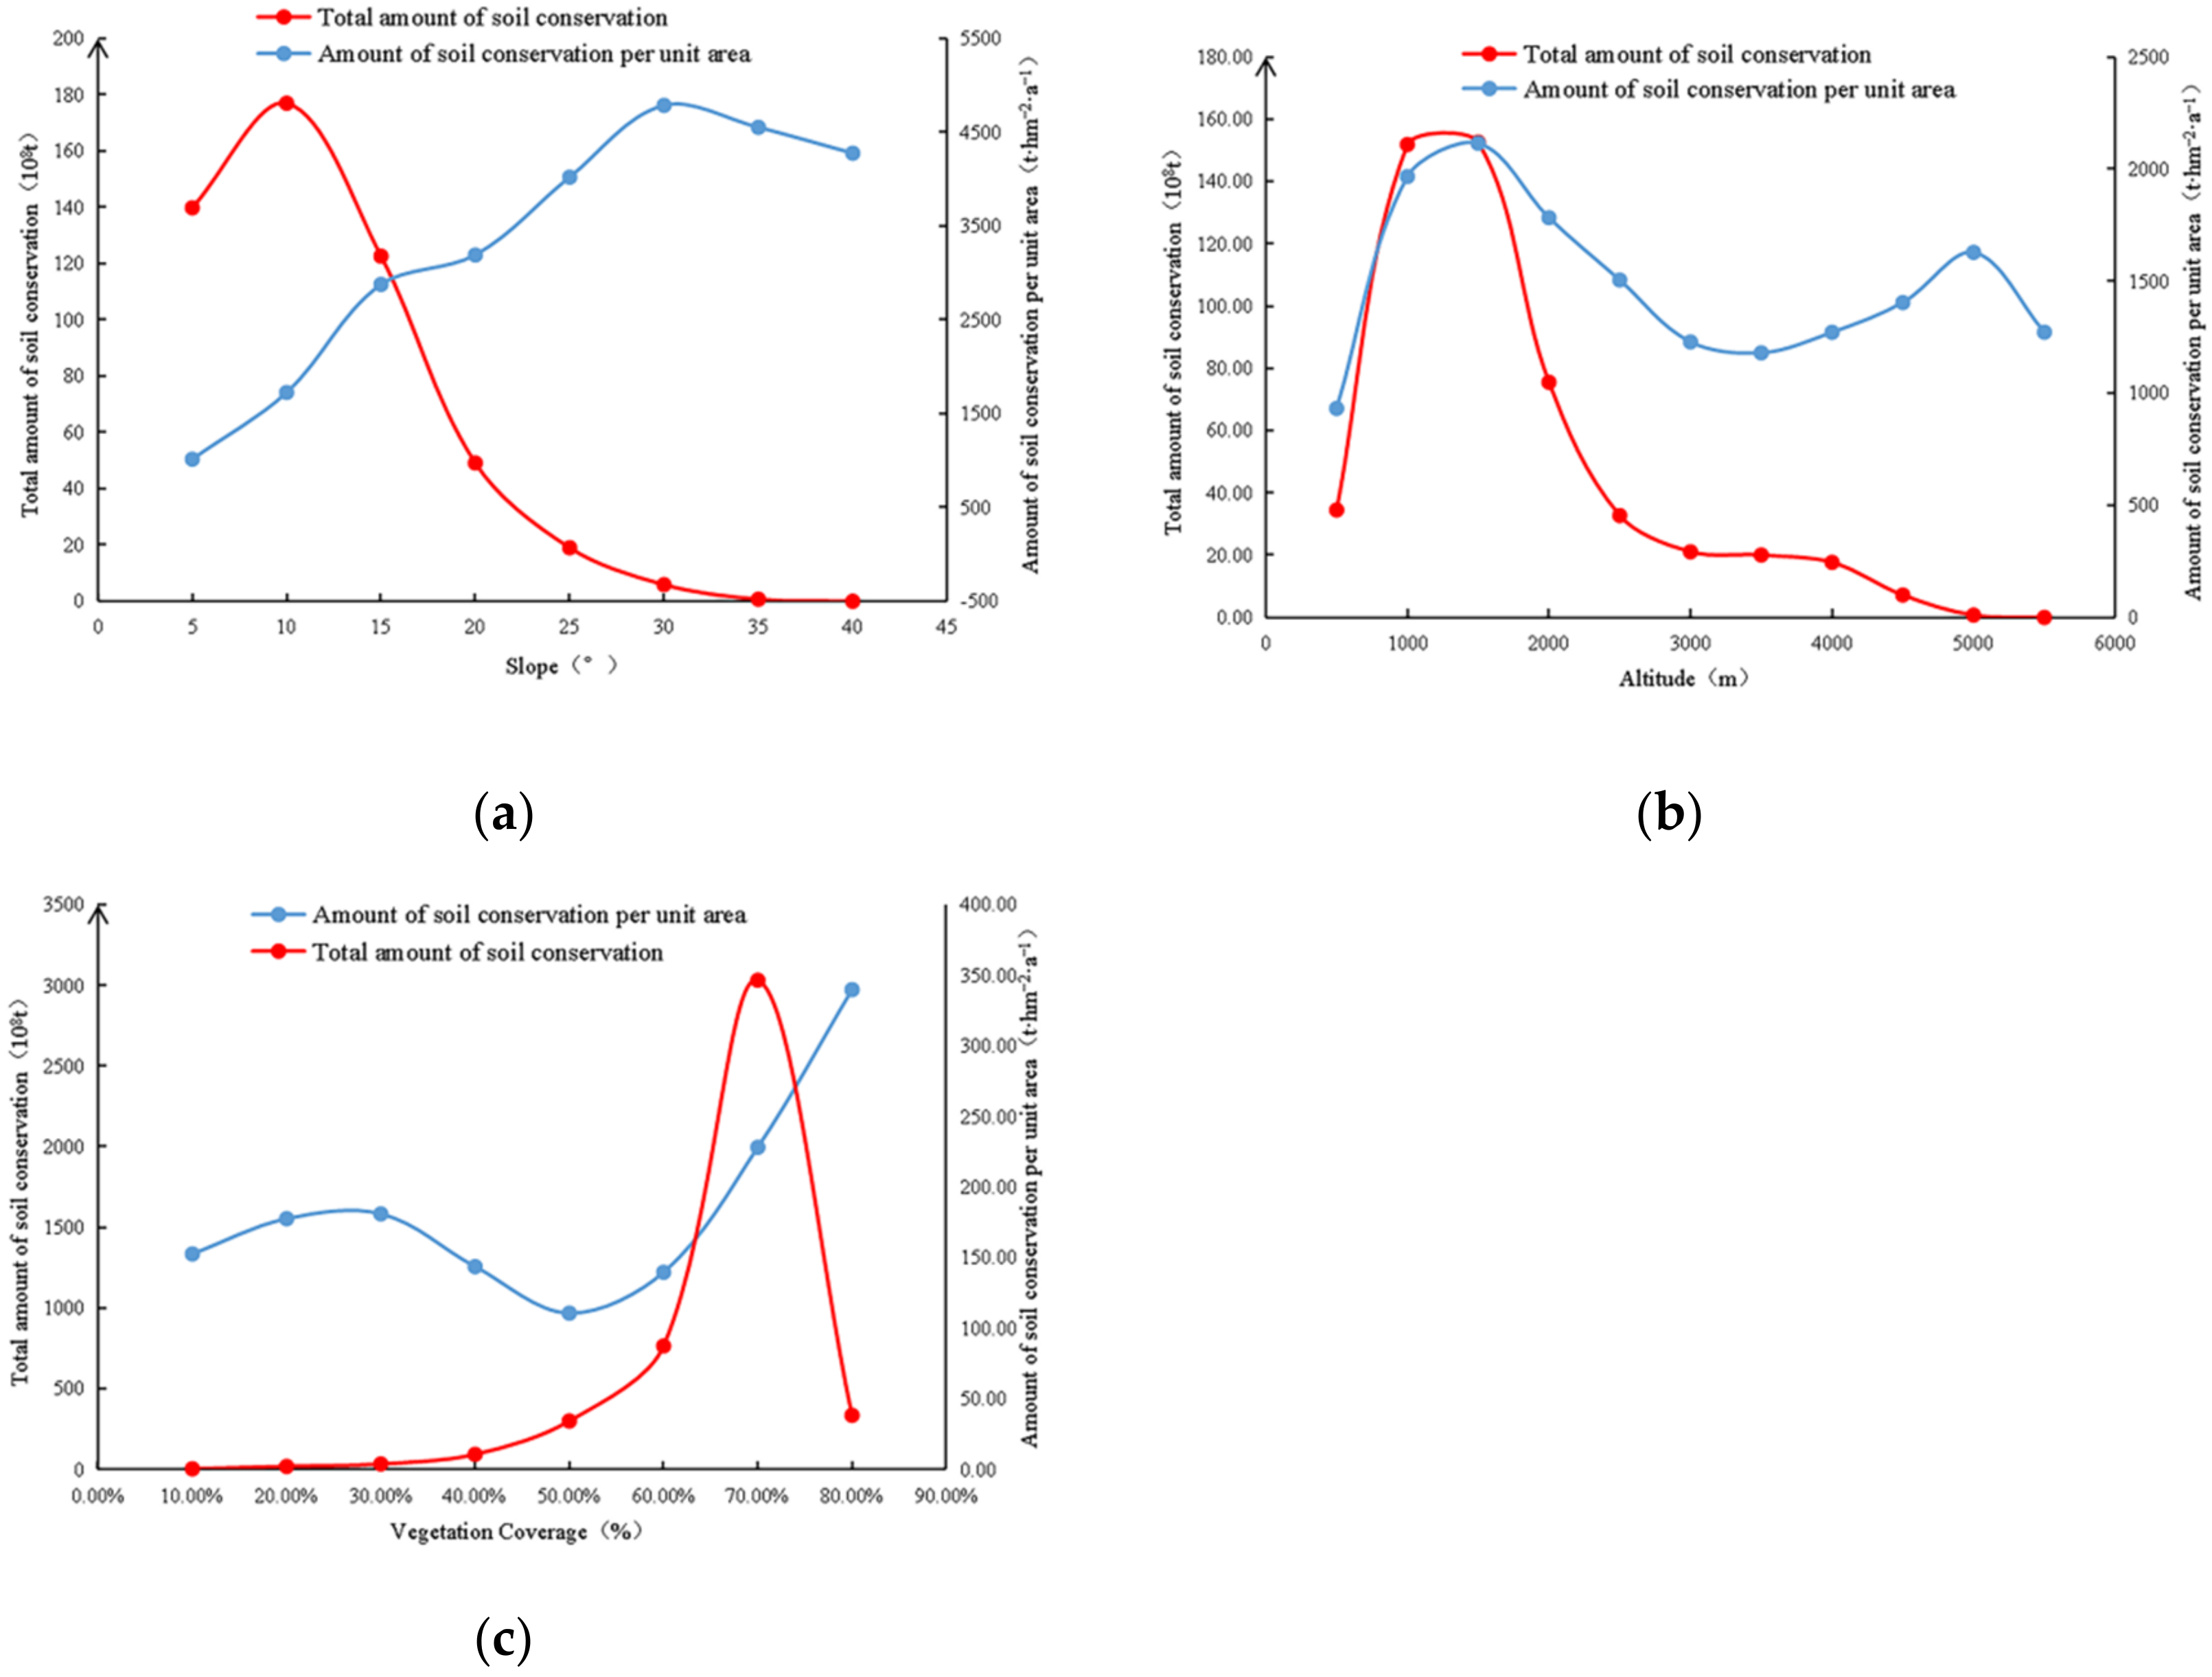
  • The total amount of soil conservation in the Qinling-Daba Mountains was negatively correlated with elevation and slope, and was positively correlated with vegetation coverage. The total amount of soil conservation shows a trend of “short rise and long drop” with the increase of elevation. The total amount of soil conservation was the largest when the elevation was between 1000 m and 1500 m. When the elevation exceeded 3500 m, the amount of soil conservation began to decline. The spatial quantitative relationship between slope and total soil conservation was similar to elevation, and the total soil conservation reached a peak when the slope was 10°, and then gradually decreased as the slope became steeper. The relationship between the vegetation coverage and the total amount of soil conservation showed a trend of “long rise and short drop”. With the increase of vegetation coverage, the total amount of soil conservation was also found to increase. When the vegetation coverage reaches 70%, the total amount of soil conservation reached its peak, and then the total amount of soil conservation perhaps dropped sharply due to calculation errors or vegetation index compression. This conclusion showed the correlation between soil conservation function and some natural environment factors in the Qinling-Daba Mountains, which was helpful to provide a basis for engineering measures.
  • Forest ecosystem and farmland ecosystem have a strong soil conservation capacity in the Qinling-Daba Mountains, but there are differences in the means of its realization; the composition and structure of different vegetation types in the same ecosystem affects soil conservation capacity. The forest ecosystem is mainly affected due to high vegetation coverage and relatively superior vegetation types, resulting in strong soil conservation function, while the farmland ecosystem is mainly affected with the establishment of a large number of soil and water conservation measures. The soil conservation capacity of the settlement ecosystem has weakened its soil conservation function due to the development of construction on the land. The soil conservation functions of different vegetation types are different. The soil conservation functions of mixed coniferous and broad-leaved forests is significantly weaker than that of broad-leaved forests and coniferous forests, and the soil conservation function of grasslands is significantly weaker than that of grasses and meadows. The soil holding capacity varies significantly. This conclusion is helpful to formulate soil conservation and protection measures from the perspective of different ecosystems or the composition of vegetation structures within different ecosystems.
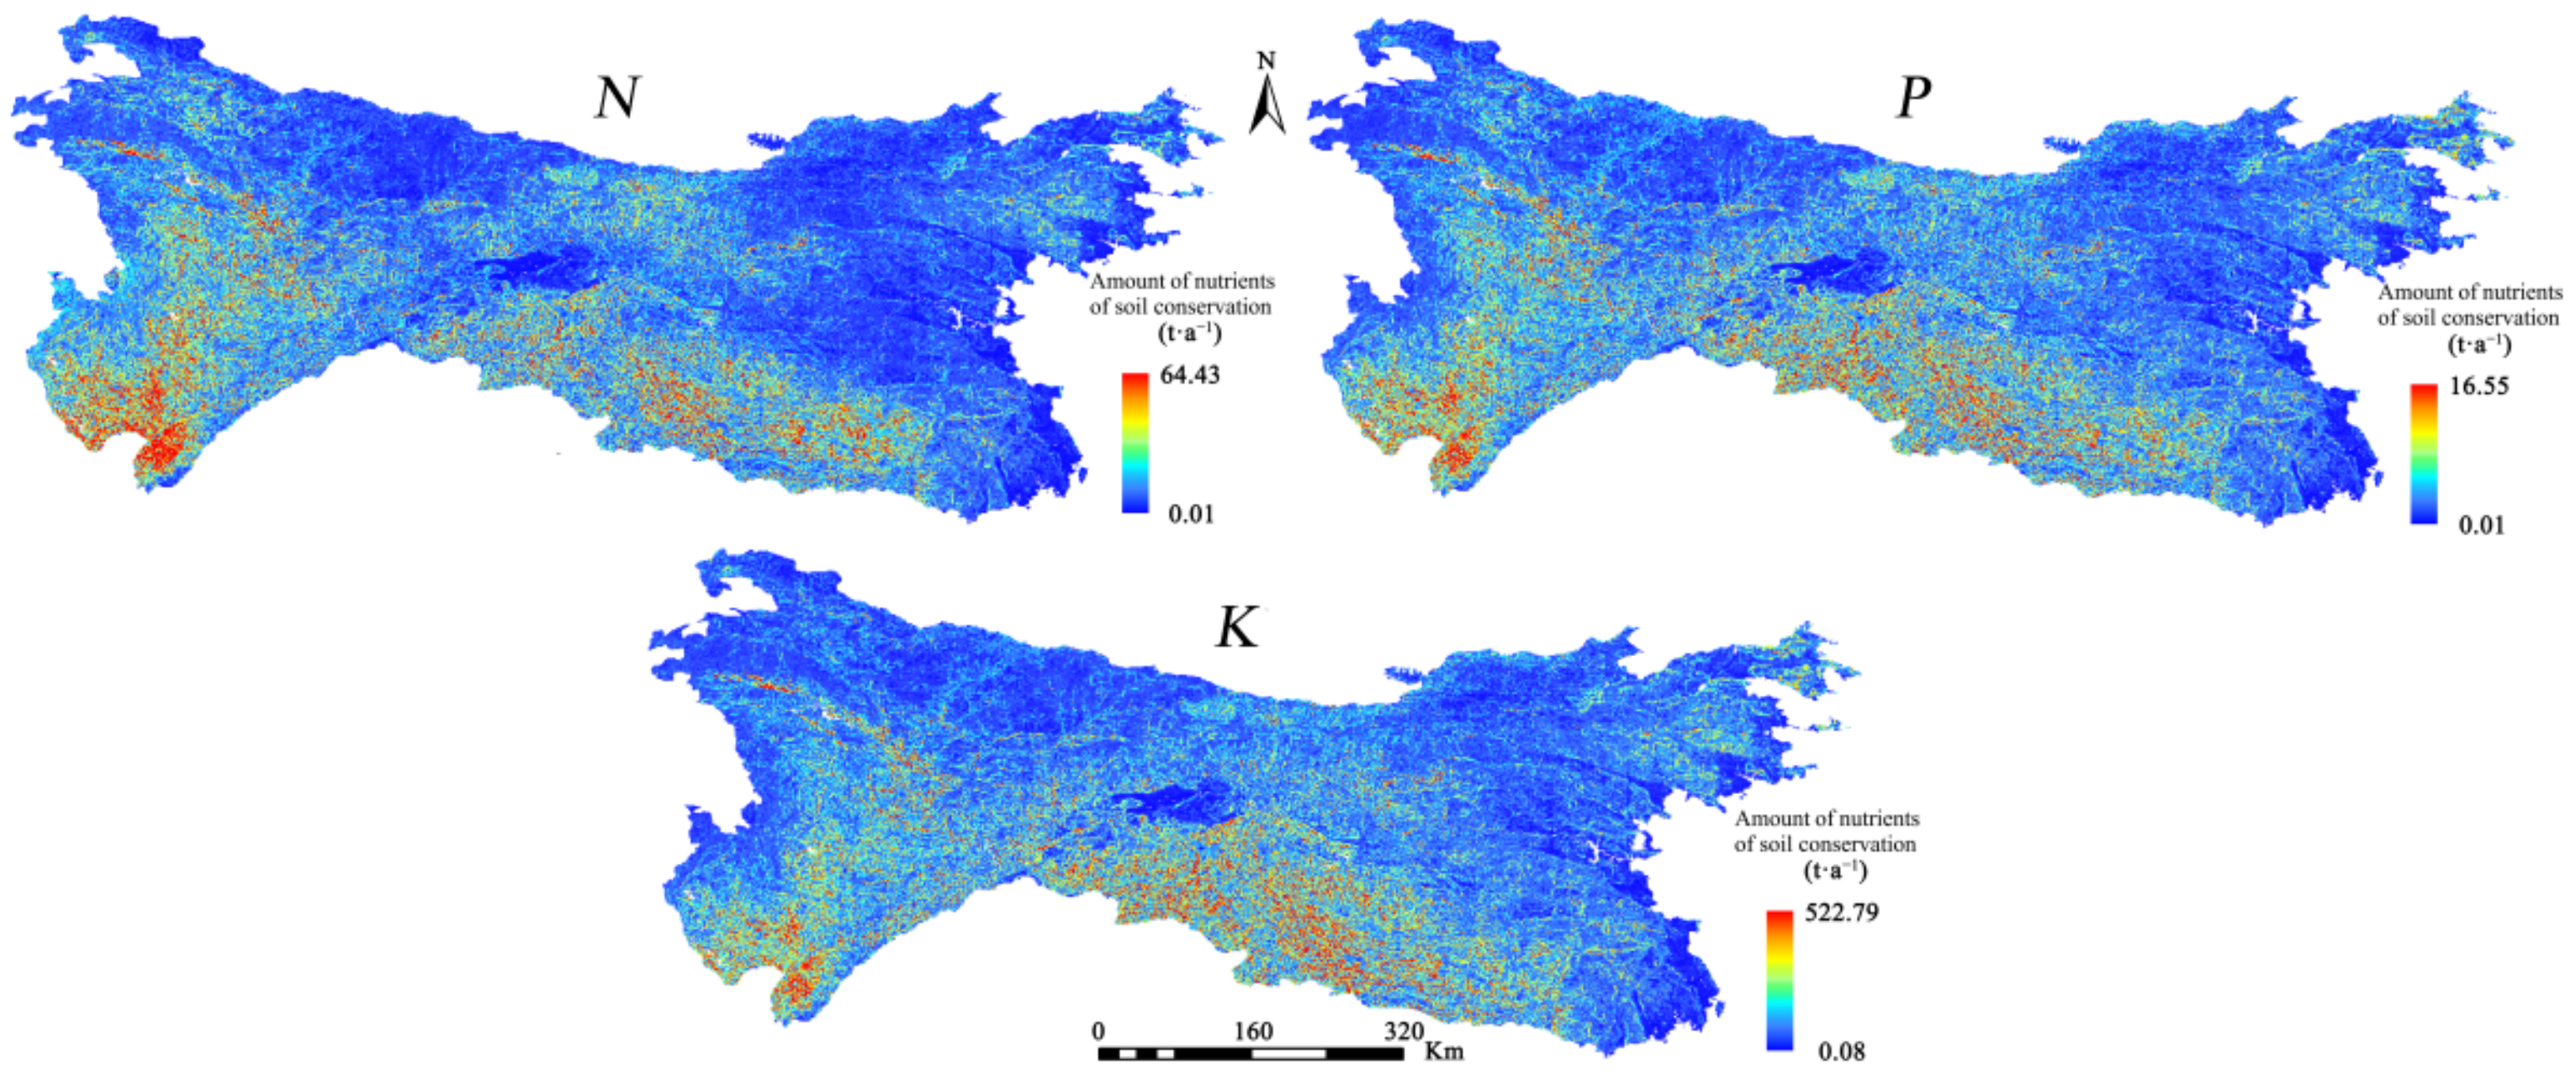
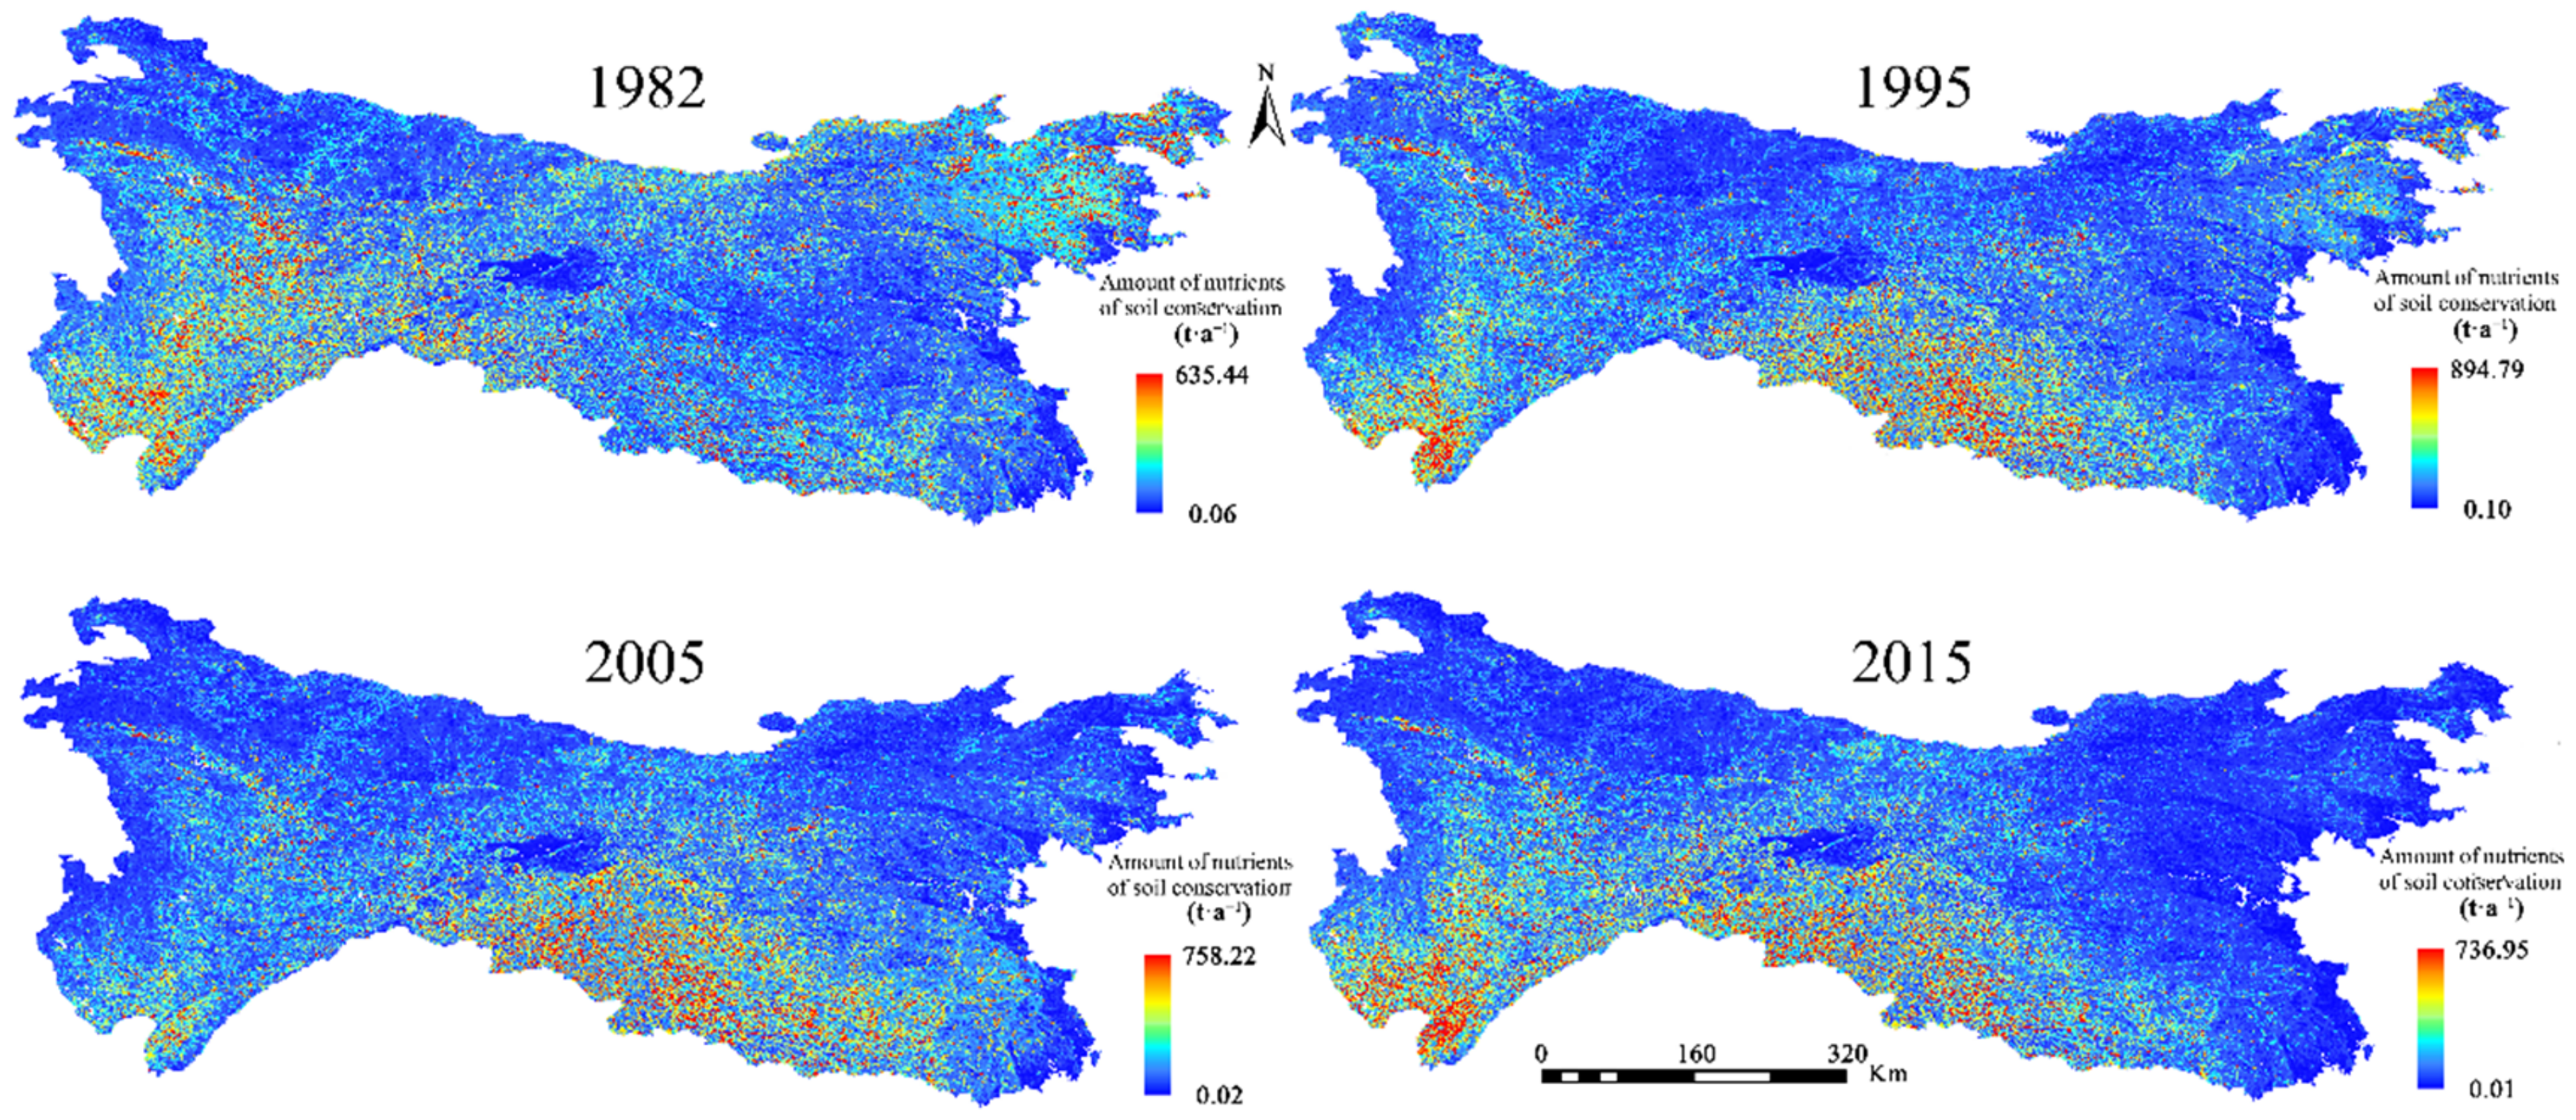
  • The soil nutrients in the Qinling-Daba Mountains are mainly concentrated in the southwest and south of the region, and the nutrient loss is more serious in the eastern region. Alpine plants have the strongest unit nutrients of soil conservation capacity, while shrubs, broad-leaved forests, and crops contribute more to the total nutrients of soil conservation. The spatial distribution of the three elements was consistent. The peak area of soil N was concentrated in the southwest. The soil P and K elements were concentrated in the southwest and southern regions, while the central region was the low value region of nutrients of soil conservation. There are differences in the effect of different vegetation types on nutrients of soil conservation. Alpine plants have the strongest ability to maintain soil N, P, and K elements, but shrubs, broad-leaved forests and crops have a large area. The cumulative contribution rate of nutrient retention capacity exceeded 70%. The analysis of soil nutrients in this conclusion enriches the research content of soil conservation function evaluation, and grasps the nutrient changes caused by soil erosion and conservation from a more microscopic perspective.
At the same time, there are still some deficiencies in this paper. The estimation of average soil conservation can show the strength of the soil conservation function of the Qinling-Daba Mountains ecosystem to a certain extent, which has a certain practical significance. However, the estimation of soil conservation is affected by many factors, and the average index is not enough to reflect the dynamic changes of the soil conservation function of the ecosystem and the correlation with other influencing factors. Future research will measure the soil conservation function of the ecosystem on a long-term scale, will more deeply explore its correlation with many influencing factors, and will strive to propose sustainable strategies to improve the soil conservation function of the ecosystem.
Because the Qinling-Daba Mountains are located on the north–south boundary in China, with abundant precipitation and lush vegetation, the soil erosion is dominated by hydraulic erosion, but soil erosion also includes wind erosion, freeze–thaw erosion, and gravity erosion. A more comprehensive consideration of soil erosion in the area will be undertaken. At the same time, the terrain conditions and surface environment of the Qinling-Daba Mountains are complex, and monitoring data with better accuracy will improve the accuracy of the estimation.

Author Contributions

Conceptualization, Z.L. and Y.L.; methodology, Z.L., Y.L. and Y.W.; software, Z.L. and Y.L.; validation, Z.L. and Y.L.; formal analysis, Z.L., Y.L. and Y.W.; investigation, Z.L. and Y.L.; resources, Z.L., Y.L. and J.L.; data curation, Z.L., Y.L. and J.L.; writing—original draft preparation, Z.L. and Y.L.; writing—review and editing, Z.L., Y.L. and Y.W.; visualization, Z.L.; supervision, Z.L., Y.L. and Y.W.; project administration, Z.L., Y.L. and Y.W. All authors have read and agreed to the published version of the manuscript.

Funding

This research was funded by the Youth Innovation Promotion Association of Chinese Academy of Sciences, grant number 2020370.

Institutional Review Board Statement

The study was conducted according to the guidelines of the Declaration of Helsinki, and approved by Institute of Mountain Hazards and Environment, Chinese Academy of Sciences.

Informed Consent Statement

Informed consent was obtained from all subjects involved in the study.

Data Availability Statement

All other sources of data are cited throughout the paper.

Acknowledgments

We would like to thank the editors and reviewers for their efficiency, constructive advice and appreciation of our paper.

Conflicts of Interest

The authors declare no conflict of interest.

References

  1. Wei, X.; Bin, L.Z. The Effect of Soil Erosion on the Ecosystem. Res. Soil Water Conserv. 2006, 1, 245–247+264. [Google Scholar]
  2. Lal, R. Soil conservation and ecosystem services. Int. Soil Water Conserv. Res. 2014, 2, 36–47. [Google Scholar] [CrossRef] [Green Version]
  3. Trabu Cc Hi, M.; Comin, F.A.; O’Farrell, P.J. Hierarchical priority setting for restoration in a watershed in NE Spain, based on assessments of soil erosion and ecosystem services. Reg. Environ. Chang. 2013, 13, 911–926. [Google Scholar] [CrossRef] [Green Version]
  4. Pimentel, D.; Harvey, C.; Resosudarmo, P.; Sinclair, K.; Kurz, D.; Mcnair, M.; Crist, S.; Shpritz, L.; Fitton, L.; Saffouri, R. Environmental and Economic Costs of Soil Erosion and Conservation Benefits. Science 1995, 267, 1117–1123. [Google Scholar] [CrossRef] [Green Version]
  5. Yao, H.R.; Yang, Z.F.; Cui, B.S. Spatial analysis on soil erosion of Lancang River Watershed in Yunnan Province under the support of GIS. Geogr. Res. 2006, 25, 421–429. [Google Scholar]
  6. Qiao, Y.; Yun, Q. Fast soil erosion investigation and dynamic analysis in the loess plateau of China by using information composite technique. Adv. Space Res. 2002, 29, 85–88. [Google Scholar]
  7. Dotterweich, M. The history of human-induced soil erosion: Geomorphic legacies, early descriptions and research, and the development of soil conservation—A global synopsis. Geomorphology 2013, 201, 1–34. [Google Scholar] [CrossRef]
  8. Xu, F.; Guo, S.; Zhang, Z. The distribution of soil erosion in China at the end of the 20th century. Acta Geogr. Sin. 2003, 58, 137–146. [Google Scholar]
  9. Ni, J.R.; Li, X.X.; Borthwick, A. Soil erosion assessment based on minimum polygons in the Yellow River basin, China. Geomorphology 2008, 93, 233–252. [Google Scholar] [CrossRef]
  10. Pimentel, D. Soil Erosion: A Food and Environmental Threat. Environ. Dev. Sustain. 2006, 8, 119–137. [Google Scholar] [CrossRef]
  11. Pradhan, B.; Chaudhari, A.; Adinarayana, J.; Buchroithner, M.F. Soil erosion assessment and its correlation with landslide events using remote sensing data and GIS: A case study at Penang Island, Malaysia. Environ. Monit. Assess. 2012, 184, 715–727. [Google Scholar] [CrossRef] [PubMed]
  12. Ma, G.; Shi, M.; Li, M. Economical Cost Evaluation of Ecological Environment Degradation in China. China Popul. Resour. Environ. 2009, 19, 162–168. [Google Scholar]
  13. Chen, L.; Xie, G.D.; Sha, P.; Zhang, C.S.; Li, S.M. Ecosystem’s soil conservation function and its spatial distribution in Lancang River Basin, Southwest China. Yingyong Shengtai Xuebao 2012, 23, 2249–2256. [Google Scholar] [PubMed]
  14. Rao, E.; Xiao, Y.; Ouyang, Z.; Zheng, H. Changes in ecosystem service of soil conservation between 2000 and 2010 and its driving factors in southwestern China. Chin. Geogr. Sci. 2016, 26, 165–173. [Google Scholar] [CrossRef] [Green Version]
  15. Sun, W.Y.; Shao, Q.Q.; Liu, J.Y. Assessment of Soil Conservation Function of the Ecosystem Services on the Loess Plateau. J. Nat. Resour. 2014, 29, 365–376. [Google Scholar]
  16. Yu, X.; Lan, W.; Rao, L.; Li, J.; Yang, R. Assessment methods of ecological functions of soil and water conservation measures. Sci. Soil Water Conserv. 2007, 5, 110. [Google Scholar]
  17. Schönbrodt, S.; Saumer, P.; Behrens, T.; Seeber, C.; Scholten, T. Assessing the USLE crop and management factor C for soil erosion modeling in a large mountainous watershed in Central China. J. Earth Sci. 2010, 11, 835–845. [Google Scholar] [CrossRef]
  18. Kinnell, P.I.A. Modelling event soil losses using the QREI30 index within RUSLE2. Hydrol. Processes 2014, 28, 2761–2771. [Google Scholar] [CrossRef]
  19. Weige, Y.; Fe Nli, Z.; Zhanli, W.; Yong, H. Effects of Topography on Spatial Distribution of Soil Erosion and Deposition on Hillslope in the Typical of Black Soil Region. Acta Pedol. Sin. 2016, 53, 572–581. [Google Scholar]
  20. De Roo, A.P.J. The Lisem Project: An Introduction. Hydrol. Processes 1996, 10, 1021–1025. [Google Scholar] [CrossRef]
  21. Laflen, J.M.; Lane, L.J.; Foster, G.R. WEPP: A new generation of erosion prediction technology. J. Soil Water Conserv. 1991, 46, 34–38. [Google Scholar]
  22. Young, R.A.; Onstad, C.A.; Bosch, D.D.; Anderson, W.P. AGNPS: A nonpoint-source pollution model for evaluating agricultural watersheds. J. Soil Water Conserv. 1989, 44, 168–173. [Google Scholar]
  23. Renard, K.G.; Foster, G.R.; Weesies, G.A.; Mccool, D.K.; Yoder, D.C. Predicting soil erosion by water: A guide to conservation planning with the Revised Universal Soil Loss Equation (RUSLE). Agric. Handb. 1996, 703, 23. [Google Scholar]
  24. Morgan, R.; Quinton, J.N.; Smith, R.E.; Govers, G.; Poesen, J.; Auerswald, K.; Chisci, G.; And, D.T.; Styczen, M.E. The European Soil Erosion Model (EUROSEM): A dynamic approach for predicting sediment transport from fields and small catchments. Earth Surf. Processes Landf. 1998, 23, 527–544. [Google Scholar] [CrossRef]
  25. Baskan, O.; Cebel, H.; Akgul, S.; Erpul, G. Conditional simulation of USLE/RUSLE soil erodibility factor by geostatistics in a Mediterranean Catchment, Turkey. Environ. Earth Sci. 2010, 60, 1179–1187. [Google Scholar] [CrossRef]
  26. Tiwari, A.K.; Risse, L.M.; Nearing, M.A. Evaluation of WEPP and its comparison with USLE and RUSLE. Trans. Asae 2000, 43, 1129–1135. [Google Scholar] [CrossRef]
  27. Yang, D.; Kanae, S.; Oki, T.; Koike, T.; Musiake, K. Global potential soil erosion with reference to land use and climate changes. Hydrol. Processes 2003, 17, 2913–2928. [Google Scholar] [CrossRef]
  28. Lu, H.; Gallant, J.; Prosser, I.P.; Moran, C.; Priestley, G. Prediction of Sheet and Rill Erosion over the Australian Continent, Incorporating Monthly Soil Loss Distribution; CSIRO: Canberra, Australia, 2001; pp. 1–27. [Google Scholar]
  29. Wang, H.; Zhao, H. Dynamic Changes of Soil Erosion in the Taohe River Basin Using the RUSLE Model and Google Earth Engine. Water 2020, 12, 1293. [Google Scholar] [CrossRef]
  30. Hao, C.H.E.N.; Oguchi, T.; Pan, W.U. Assessment for soil loss by using a scheme of alterative sub-models based on the RUSLE in a Karst Basin of Southwest China. J. Integr. Agric. 2017, 16, 377–388. [Google Scholar]
  31. Al-Quraishi, A. Soil Erosion Risk Prediction with RS and GIS for the Northwestern Part of Hebei Province, China. J. Appl. Sci. 2003, 3, 659–666. [Google Scholar]
  32. Xie, Y.; Lin, J. RUSLE model based quantitative evaluation on the soil erosion of Wen County of Gansu Province, China. In Proceedings of the International Conference on Geoinformatics, Beijing, China, 18–20 June 2010; pp. 450–455. [Google Scholar]
  33. Han, Y.; Gao, J.; Tuo, X.; Tian, M.; Feng, C. Study on the Assessment of Soil Conservation Service and Its Eco-Economic Value of Ecosystem in Mentougou. Res. Environ. Sci. 2007, 20, 144–147. [Google Scholar]
  34. Chen, L.; Xiong, K.; Chen, Q.; Shu, T.; Wu, J. Response Mechanism of Soil Conservation Function to Rocky Desertification Under Eco-Environmental Harness of Karst Areas. Resour. Environ. Yangtze Basin 2020, 29, 499–510. [Google Scholar]
  35. Wu, D.; Zou, C.; Cao, W.; Liu, L. Analysis of the Ecosystem Soil Conservation Function Based on the Major Function-Oriented Zones across the Yangtze River Economic Belt, China. Sustainability 2018, 10, 3425. [Google Scholar] [CrossRef] [Green Version]
  36. Zhang, B. Ten major scientific issues concerning the study of China’s north-south transitional zone. Prog. Geogr. 2019, 38, 305–311. [Google Scholar]
  37. Yan, D.; Peng, S.; Ding, X.; Yu, Z. NDVI Variations and Its Responses to hydrothermal process in the Naqu River Basin, Qinghai-Tibet Plateau-Alpine Region. E3S Web Conf. 2021, 267, 01024. [Google Scholar] [CrossRef]
  38. Heilongjiang Meteorological Bureau of China. Compilation of 30-Year Conventional Surface Climate Data and Their Statistics; China Meterological Administration: Beijing, China, 2004; Volume QX/T 22-2004, pp. 1–12. [Google Scholar]
  39. Mcvicar, T.R.; Niel, T.; Li, L.T.; Hutchinson, M.F.; Mu, X.M.; Liu, Z.H. Spatially distributing monthly reference evapotranspiration and pan evaporation considering topographic influences. J. Hydrol. 2007, 338, 196–220. [Google Scholar] [CrossRef]
  40. Zhang, X.; Kang, S.; Zhang, L.; Liu, J. Spatial variation of climatology monthly crop reference evapotranspiration and sensitivity coefficients in Shiyang river basin of northwest China. Agric. Water Manag. 2010, 97, 1506–1516. [Google Scholar] [CrossRef]
  41. Shi, D.M.; Chen, Z.F.; Jiang, G.Y.; Jiang, D. Comparative study on estimation methods for soil erodibility K in purple hilly area. Bjing Linye Daxue Xuebao/J. Bjing For. Univ. 2012, 34, 32–38. [Google Scholar]
  42. Desmet, P.J.J.; Govers, G. A GIS procedure for automatically calculating the USLE LS factor on topographically complex landscape units. J. Soil Water Conserv. 1996, 51, 427–433. [Google Scholar]
  43. Wischmeier, W.H.; Smith, D.D. Predicting Rainfall Erosion Losses—A Guide to Conservation Planning; Agriculture Handbook (USA); United States Department of Agriculture: Washington, DC, USA, 1978. [Google Scholar]
  44. Liu, B.Y.; Zhang, K.L.; Jiao, J.Y. Soil erodibility and its use in soil erosion prediction model. J. Nat. Resour. 1999, 14, 345–350. [Google Scholar]
  45. Xu, L.; Xu, X.; Meng, X. Risk assessment of soil erosion in different rainfall scenarios by RUSLE model coupled with Information Diffusion Model: A case study of Bohai Rim, China. Catena 2013, 100, 74–82. [Google Scholar] [CrossRef]
  46. Quansah, C.; Safo, E.Y.; Ampontuah, E.O.; Amankwah, A.S. Soil fertility erosion and the associated cost of NPK removed under different soil and residue management in Ghana. Ghana J. Agric. Sci. 2000, 33, 33–42. [Google Scholar] [CrossRef]
  47. Department of Soil and Water Conservation, Ministry of Water Resources of the People’s Republic of China. Standards for classification and gradtion of soil erosion. In Industry Standard—Water Conservancy; Ministry of Water Resources of the People’s Republic of China: Beijing, China, 2008; Volume SL 190-2007, pp. 11–16. [Google Scholar]
  48. He, W.; Wang, L.; Yang, X.; Gao, P.; Yao, Y.; Li, S.; Tian, Y.; Cui, N. Farmland Soil Fertility in Qinba Area in 30 Years: Variation Characteristics and Fertilization Countermeasures. Chin. Agric. Sci. Bull. 2019, 35, 56–62. [Google Scholar]
  49. Rao, E.; Xiao, Y. Spatial characteristics and effects of soil conservation service in Sichuan Province. Acta Ecol. Sin. 2018, 38, 8741–8749. [Google Scholar]
  50. Chen, S.S. Evaluation of Ecological Service Function of Water Retention and Soil Convervation in Water Source Area for the South-to-North Water Transfer—A Case Study in Shangluo City. Ph.D. Thesis, Northwest University, Xi’an, China, 2016. [Google Scholar]
  51. Shuangshuang, L.I.; Yang, S.; Liu, X. Spatiotemporal variability of extreme precipitation in north and south of the Qinling-Huaihe region and influencing factors during 1960–2013. Prog. Geogr. 2015, 34, 354–363. [Google Scholar]
  52. Junkai, D.U.; Jia, Y.; Xiaoxing, L.I.; Niu, C.; Liu, H.; Qiu, Y. Study on the spatial-temporal distribution pattern of precipitation in the Taihang Mountain region using TRMM data. Adv. Water Sci. 2019, 30, 1–13. [Google Scholar]
  53. Zhu, Q.; Zhou, Z.; Liu, T.; Bai, J. Vegetation restoration and ecosystem soil conservation service value increment in Yanhe Watershed, Loess Plateau. Acta Ecol. Sin. 2021, 41, 2557–2570. [Google Scholar]
  54. Shang, H.; Yin, Z.; Zhang, P. Analysis on Soil Erosion Characteristics of Different Types of Small Watersheds in Centre Sichuan Province. Res. Soil Water Conserv. 2015, 22, 5–8. [Google Scholar]
Figure 1. Location and general situation of the Qinling-Daba Mountains.
Sustainability 14 05829 g001
Figure 2. Mean–Center transfer map of actual soil erosion in the Qinling-Daba Mountains.
Sustainability 14 05829 g002
Figure 3. Interannual variation of actual soil erosion in the Qinling-Daba Mountains.
Sustainability 14 05829 g003
Figure 4. Spatial and temporal distribution of soil conservation (AC) in the Qinling-Daba Mountains.
Sustainability 14 05829 g004
Figure 5. Soil conservation and its changes in different urban areas in the Qinling-Daba Mountains.
Sustainability 14 05829 g005
Figure 6. Soil conservation of different slopes, elevations, and vegetation coverage in the Qinling-Daba Mountains: (a) Relationship between soil erosion and slope; (b) Relationship between soil erosion and elevation; (c) Relationship between soil erosion and vegetation coverage.
Sustainability 14 05829 g006
Figure 7. Spatial distribution of N, P, and K nutrients of soil conservation in the Qinling-Daba Mountains.
Sustainability 14 05829 g007
Figure 8. Spatial distribution of nutrients for soil conservation in the Qinling-Daba Mountains.
Sustainability 14 05829 g008
Table 1. The RUSLE model and its factors, equations, and explanations.
FactorEquationExplanation
Rainfall Erosion Factor (R) R = i = 1 12 1.735 10 1.5 log 10 P i 2 / P 0.8188
i is the different months (i = 1, 2,..., 12); Pi is the monthly average rainfall; P is the annual average rainfall.
The rainfall data are all interpolated by the smooth thin disk spline method, which considers the influence of DEM and DCL (distance from the coastline) on rainfall [40], which can more accurately reflect the actual distribution of rainfall in space.
Soil Erosion Factor (K) K = 0.1317 0.2 + 0.3 exp 0.0256 S A N 1 S I L 100 S I L C L A S I L 0.3 1 0.25 C C + exp 3.72 2.95 C 1 0.7 S N S N + exp 5.51 + 22.9 S N
SAN, SIL, CLA, and C are the sand content (%), silt content (%), clay content (%), and organic carbon content (%), respectively.
The EPIC model is the most widely used [41]. It was used to estimate the soil erosion factor in the study area.
S N = 1 S A N 100
Use this equation to calculate SN.
Terrain Factor (LS) L = λ / 22.1 sin θ / 0.0896 / 3 sin θ 0.8 + 0.56 / 1 + sin θ / 0.0896 / 3 sin θ 0.8 + 0.56 S = 10.8 sin θ + 0.03 θ < 5 16.8 sin θ 0.50 5 θ < 10 21.9 sin θ 0.96 θ 10
λ is the slope length of the unit pixel; θ is the slope of the DEM data, the unit is %.
The calculation method of the slope length factor proposed by Wischmeier and Smith is widely used [42,43], while the CSLE model proposed by Liu Baoyuan [44] combined with the actual situation in China is used for the calculation of the slope factor.
Vegetation Cover Factor (C) f c = N D V I N D V I min N D V I max N D V I min
C = 1 f c = 0 0.6508 0.3436 lg f c 0 < f c 78.3 % 0 f c > 78.3 %
fc is the vegetation coverage; NDVI is the Normalized Difference Vegetation Index; NDVImax and NDVImin are the maximum NDVI and the minimum NDVI obtained by the maximum and the minimum combined method.
The NDVI is often used to represent the surface vegetation coverage [45,46].
Soil and Water Conservation Factor (P)Arable land = 0.3; Woodland = 1; Grassland = 1; Waters = 0;
Construction Land = 0.001; Unused Land = 0
The value range is 0–1, 0 means no soil erosion occurs after effective measures are implemented, 1 means no maintenance measures are taken.
Using a mixed empirical model, assigning P values based on relevant research [45].
Table 2. Potential soil erosion status in the Qinling-Daba Mountains in 1982, 1995, 2005, and 2015.
YearErosion Degree (t·km−2 a−1)Slight Erosion
<1000
Mild
Erosion
1000–2500
Moderate Erosion
2500–5000
Intense
Erosion
5000–8000
Extremely
Intense
Erosion
8000–15,000
Severe
Erosion
>15,000
1982Percentage of Area (%)15.0932.9630.5811.548.451.39
Average Erosion Modulus (t·km−2 a−1)526.84 1819.70 3382.30 6340.19 10,310.82 18,483.20
Amount of Erosion (108 t)24.89 179.00 307.58 222.87 263.96 78.11
1995Percentage of Area (%)13.0625.0634.0713.679.544.60
Average Erosion Modulus (t·km−2 a−1)529.11 1867.34 3521.36 6280.16 10,789.77 21,170.22
Amount of Erosion (108 t)21.50 141.51 354.56 259.71 314.68 290.43
2005Percentage of Area (%)10.4916.8028.9718.4316.588.72
Average Erosion Modulus (t·km−2 a−1)550.09 1849.20 3605.69 6454.99 10,514.14 24,342.50
Amount of Erosion (108 t)17.78 94.78 309.26 357.45 522.20 634.76
2015Percentage of Area (%)21.2132.7323.5710.168.753.57
Average Erosion Modulus (t·km−2 a−1)490.06 1668.80 3550.04 6234.47 10,846.89 20,208.44
Amount of Erosion (106 t)32.08 162.63 249.76 193.34 288.29 216.09
Table 3. Actual Soil Erosion Status in the Qinling-Daba Mountains in 1982, 1995, 2005, and 2015.
YearErosion Degree (t·km−2 a−1)Slight
Erosion
<1000
Mild
Erosion
1000–2500
Moderate Erosion
2500–5000
Intense
Erosion
5000–8000
Extremely Intense Erosion
8000–15,000
Severe
Erosion
>15,000
1982Percentage of Area (%)32.3135.9118.218.694.430.46
Average Erosion Modulus (t·km−2 a−1)415.341737.623468.916289.9810,170.6517,711.61
Amount of Erosion (108 t)41.06190.89193.26167.17137.8024.90
1995Percentage of Area (%)28.6329.7024.178.836.602.06
Average Erosion Modulus (t·km−2 a−1)437.761776.993439.536238.0810,637.3519,991.45
Amount of Erosion (108 t)38.35161.50254.40168.55214.64126.27
2005Percentage of Area (%)23.5323.9623.9615.188.784.60
Average Erosion Modulus (t·km−2 a−1)450.161765.943554.626285.8410,556.8022,156.47
Amount of Erosion (108 t)32.40129.44260.60291.86283.54311.80
2015Percentage of Area (%)37.7531.0216.946.925.951.42
Average Erosion Modulus (t·km−2 a−1)423.471613.4073495.466321.8110,587.219,232.16
Amount of Erosion (106 t)48.91153.14181.15133.86192.7783.28
Table 4. Total soil conservation of different ecosystems in the Qinling-Daba Mountains.
Total Amount of Soil Conservation (108 t)1982199520052015
Farmland Ecosystem126.97160.31251.10131.99
Forest Ecosystem139.95190.71286.19153.56
Grassland Ecosystem69.4688.68128.6780.60
Water and Wetland Ecosystem4.074.016.653.66
Settlement Ecosystem2.263.413.112.23
Other Ecosystems0.200.260.300.43
Table 5. Total soil conservation of different vegetation types in the Qinling-Daba Mountains.
Total Amount of Soil
Conservation (108 t)
1982199520052015
Coniferous Forest40.4250.6272.0145.43
Coniferous and Broad-leaved Mixed Forest0.640.660.940.69
Broad-leaved Forest85.3193.63142.2478.68
Shrub75.52101.70157.2890.39
Grassland1.531.662.151.24
Grass19.3336.6655.8625.18
Meadow16.3320.8727.2621.90
Swamp0.020.010.020.02
Alpine Plant0.460.570.610.60
Crops93.25127.89194.5497.77
Table 6. Nutrients of soil conservation of different vegetation types in the Qinling-Daba Mountains.
Vegetation TypeNPK
Total Amount of Nutrients of Soil Conservation (104 t)Percentage (%)Amount of Nutrients of Soil Conservation per Unit Area (t·a1)Total Amount of Nutrients of Soil Conservation (104 t)Percentage (%)Amount of Nutrients of Soil Conservation per Unit Area (t·a−1)Total Amount of Nutrients of Soil Conservation (104 t)Percentage (%)Amount of Nutrients of Soil Conservation per Unit Area (t·a−1)
Coniferous Forest10.9614.502.973.3513.210.9191.8612.4624.92
Coniferous and Broad-leaved Mixed Forest0.190.254.050.050.201.101.390.1929.66
Broad-leaved Forest17.5123.172.535.7922.850.84165.9822.5124.02
Shrub19.3725.633.156.1124.090.99178.9824.2829.07
Grassland0.340.452.720.110.440.892.870.3923.10
Grass4.355.762.781.646.471.0552.857.1733.73
Meadow5.377.113.461.465.750.9439.705.3825.58
Swamp0.010.012.050.000.010.330.030.008.71
Alpine Plant0.180.245.520.040.171.321.240.1737.73
Crops17.2922.882.176.8026.820.85202.3827.4525.36
Publisher’s Note: MDPI stays neutral with regard to jurisdictional claims in published maps and institutional affiliations.

