Article

How Sustainable Is People’s Travel to Reach Public Transit Stations to Go to Work? A Machine Learning Approach to Reveal Complex Relationships

1
ChengDu Jincheng College, Chengdu 611731, China
2
Centre for Sustainable Urban Planning and Real Estate (SUPRE), Department of Urban and Regional Planning, Faculty of Built Environment, University of Malaya, Kuala Lumpur 50603, Wilayah Persekutuan Kuala Lumpur, Malaysia
3
Department of Civil and Environmental Engineering, Universiti Teknologi Petronas, Seri Iskandar 32610, Perak, Malaysia
4
Faculty of Hospitality, Tourism and Wellness, Universiti Malaysia Kelantan, City Campus, Kota Bharu 16100, Kelantan, Malaysia
5
Department of Civil Engineering, College of Engineering, Prince Sattam Bin Abdulaziz University, Alkharj 16273, Saudi Arabia
6
Building & Construction Technology Department, Bayan College of Science and Technology, Khartoum 210, Sudan
7
Research Centre, Future University in Egypt, New Cairo 11745, Egypt
*
Authors to whom correspondence should be addressed.
Sustainability 2022, 14(7), 3989; https://doi.org/10.3390/su14073989
Submission received: 25 February 2022 / Revised: 24 March 2022 / Accepted: 25 March 2022 / Published: 28 March 2022
(This article belongs to the Collection Urban Street Networks and Sustainable Transportation)

Abstract

:
Several previous studies examined the variables of public-transit-related walking and privately owned vehicles (POVs) to go to work. However, most studies neglect the possible non-linear relationships between these variables and other potential variables. Using the 2017 U.S. National Household Travel Survey, we employ the Bayesian Network algorithm to evaluate the non-linear and interaction impacts of health condition attributes, work trip attributes, work attributes, and individual and household attributes on walking and privately owned vehicles to reach public transit stations to go to work in California. The authors found that the trip time to public transit stations is the most important factor in individuals’ walking decision to reach public transit stations. Additionally, it was found that this factor was mediated by population density. For the POV model, the population density was identified as the most important factor and was mediated by travel time to work. These findings suggest that encouraging individuals to walk to public transit stations to go to work in California may be accomplished by adopting planning practices that support dense urban growth and, as a result, reduce trip times to transit stations.

1. Introduction

A transition away from privately owned vehicles (POVs) toward active transport can have major health advantages [1]. Despite the vast benefits of active transport modes, particularly walking, many individuals still prefer POVs. For example, just 36% of all journeys in the United States were below one mile, and only 27% of such journeys were conducted by walking or biking [2]. According to statistics from the American Community Survey, the percentage of people who walk to work in the United States has declined from 5.6 per cent in 1980 to 2.8 per cent in 2012 [3].
The “park and ride” concept, which promotes the use of POVs to reach public transit (PT) stations and combines the use of private cars and PT stations to reduce the negative consequences of private vehicle use, has been the subject of several studies in the past [4,5,6,7]. Typically, this system is found at rail transportation terminals and transportation hubs, which allow for both rail and public bus access. However, this system may not be available at local bus stops. POVs are feasible options to reach PT stations where the stations are not within walking distance or in low-density areas [8,9]. Although there is hope that this approach will reduce the negative consequences of private vehicle use (e.g., traffic congestion, pollution, and physical inactivity), it is more desirable for planners to minimize the role of POVs in people’s daily travels, particularly those related to work.
PT stations may supplement and extend the variety of active modes significantly [10,11]. Because of this, as well as the fact that POVs are associated with a slew of other well-known issues, there may be room for a modal shift away from POVs toward walking and PT that might reduce the usage of POVs, while also contributing to increased physical activity [12,13,14,15]. Because health conditions, work trip qualities, work attributes, and sociodemographic factors may all impact travel patterns [16,17,18,19,20,21], it is important to know how walking connects to PT travel to work to reap the most advantages.
California has always had a problem with traffic congestion. The cause for this ongoing issue is that the region’s population and POV usage have exceeded the transportation facilities. If California’s transportation system cannot keep pace with the state’s fast urban growth, and if Californians’ priority for POVs continues, the traffic problem will undoubtedly worsen soon. To deal with long-term urban traffic issues, dwellers in crowded regions are encouraged to replace POVs with active transportation options and PT, especially for work-related journeys. When people combine walking with PT, which is a hot topic among planners, the advantages of this replacement may be maximized. Walking is the most cost-effective mode of transportation and the most basic form of physical activity [22,23,24,25]. Walking also needs a low-cost infrastructure. As a result, it makes sense if planners encourage individuals to walk to PT stations over other active forms of transportation.
Many studies have been conducted on the topic of first-mile connection, which addresses how people reach PT stations. Several studies assessed the impact of sociodemographic characteristics on walking to reach PT stations. Factors, such as age [17,18,26,27,28], gender [29,30], vehicle ownership [31,32], income [33,34,35], and education [32,36,37], were significantly correlated with the walking to reach PT stations. Although there are a lot of built environment (BE) factors that impact travel behavior, only a very small number of these factors were included in the first-mile connection studies. These factors included density and distance to PT stations [38,39,40,41,42]. Earlier studies have shown that population density is one of the most significant BE variables, and its impact on travel behavior is stronger than other BE attributes [32,36,43,44]. People in low-density areas are more likely to use POVs than those in medium- and high-density areas [45,46]. Similarly, for individuals who live in low-density regions where the station is too far away to walk to and bus service is not accessible, driving to PT stations may be the sole choice for reaching PT stations [8].
While sociodemographic variables have been well covered in earlier studies, health-related factors and their impact on mode choice have rarely been considered in most PT-related walking investigations [1,47,48]. BMI, self-assessed health, self-reported smoker, and yearly frequency of hospital and primary care visits are characteristics addressed in these studies. To the best of the authors’ knowledge, no study considered the impact of medical conditions in PT-related walking research. Furthermore, most of these studies neglected job-related issues, as well as those associated with work trips. Flexibility in work arrival time, full-time/part-time worker, the possibility of working from home, the distance between home and work location, trip time to work, time spent transferring on the commute to work if PT is taken, and travel time to PT station are some of the aspects that are overlooked [49,50,51]. The existence of such data in the U.S. National Household Travel Survey can give an excellent chance to look at the influence of a medical condition and work-related trips on travel mode selection.
There are non-linear and complex interactions between variables in transportation systems (e.g., the relationship between the built environment and car ownership) that are difficult to study using typical statistical approaches and linear programing methods [52,53,54,55,56,57,58]. Non-linear relationships may be inconsistent, and factors may have threshold correlations with a variable of interest. Because non-linear relationships can help planners to understand the effective influence range of important factors on the target variable, it is interesting to see if this result can be applied to other fields [59]. This supports planners in fine-tuning their strategies [60]. Most PT-related walking studies employed traditional statistical methods (Table 1). However, these methods are unable to reveal complex relationships. In addition, these models have strict linearity assumptions, which limits the ability of these models to be effectively generalized [61,62,63,64,65,66]. Finally, these models are vulnerable to missing and incomplete data. Machine learning (ML) approaches can be used to solve the problems outlined before [67,68,69,70]. The Bayesian Network (BN) model is one of these powerful tools, and it has lately been used successfully in various transport-related research [67,71,72,73,74,75]. A BN model can effectively deal with heterogeneous and under-sampling data, as well as missing, erroneous, or ambiguous data. Because it can effectively alter its network depending on the data provided or entered into it, BN is indeed thought to be excellent for learning changeable behaviors (e.g., mode choice) [76,77,78,79,80,81].
The authors of this research utilize the BN model to explore the major indicators of travel mode to reach PT stations and highlight their non-linear interactions using the 2017 U.S. National Household Travel Survey (2017 NHTS). The following are the questions that this research aims to answer: (1) How important are the health condition, work trip, work, and individual and household attributes to individuals who use walking or POV to reach PT stations to go to work in California? (2) Do the most important variables have associations with walking or POV to reach PT stations to go to work?
This paper contributes to the literature in three major ways. To begin with, it adds to the research of mode choice for reaching PT stations to go to work in California and other regions where traffic congestion is a problem. Furthermore, this study evaluates the relative relevance of several elements in walking to work and gives insight into the policy implementation priorities in California and other places with similar conditions. It also demonstrates that important factors have irregularly complex relationships, corroborating the scant data in the literature and providing recommendations for California planning approaches. Finally, this study demonstrates the significant role of trip time to work and its combined effect with population density in POV usage to reach PT stations to go to work, as well as the significant role of population density and its interaction impacts with trip time to PT stations in walking reach PT stations to go to work, thereby bolstering the case for dense urban development.
The following is a breakdown of how the research is structured. The data, variables, and modeling technique are introduced in Section 2. Section 3 discusses the models’ results and performance, variable importance, relationships with travel mode to reach PT stations in California, and interaction impacts on mode choice to reach PT stations. The final section highlights the most important findings and explains policy implications.

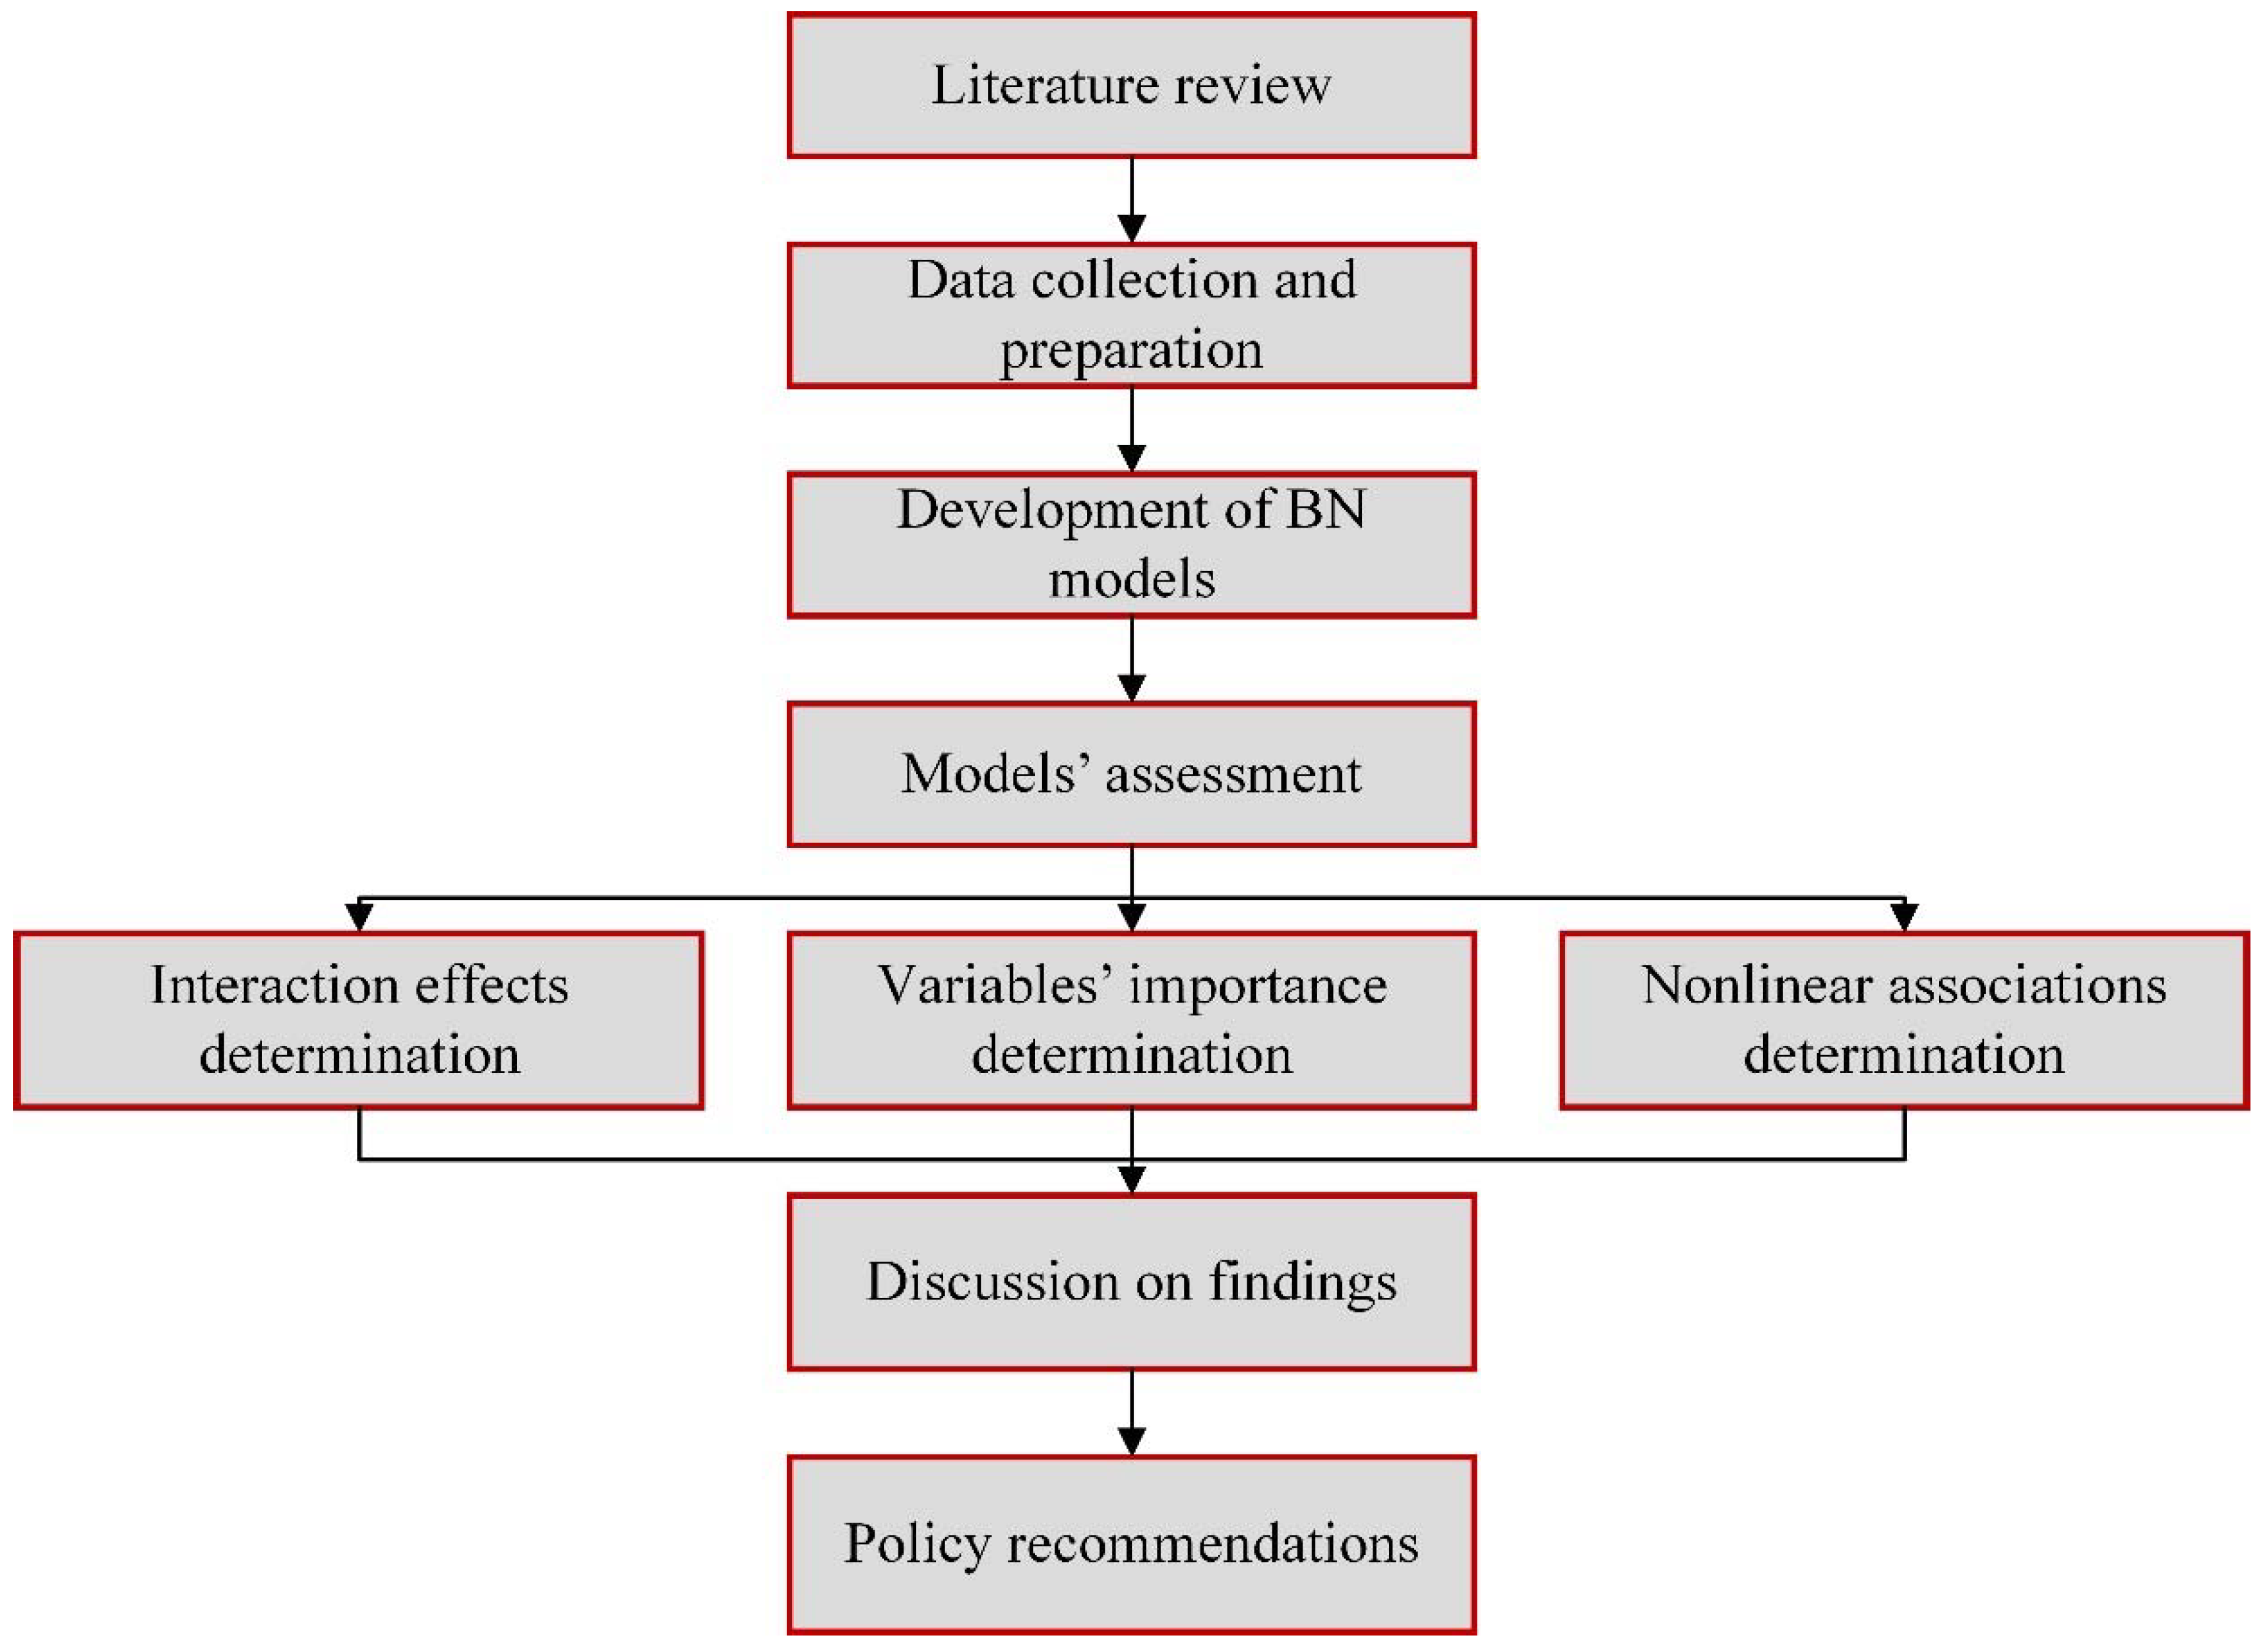
2. Materials and Methods

In this study, two associative and predictive BN models were developed to reveal the complex relationships between various variables and PT-related walking and PT-related POVs in California. As previously mentioned, the 2017 U.S. National Household Travel Survey (2017 NHTS) was employed to conduct this study. These models discover interaction effects of independent factors on the usage of walking and POVs to reach PT stations to go to work and assess the relevance of variables in predicting the choice of walking and POV to reach PT stations to go to work. Figure 1 shows the flowchart of this study.

2.1. Data

This study used data from the 2017 U.S. National Household Travel Survey (2017 NHTS). The NHTS has now become the country’s rich source of information on commuting by U.S. citizens throughout all fifty states. This commute behavior database contains journeys taken in a variety of ways and for a variety of reasons. The data for the NHTS are gathered from a randomly selected sample of U.S. households. The NHTS supplies data about individual and household travel behavior patterns. These patterns are related to sociodemographic and geographic factors that impact travel choices and are used to estimate demand. More information can be found at https://nhts.ornl.gov (accessed on 1 January 2020).
This study looked into how Californians utilize walking and privately owned vehicles (POVs) to reach public transportation to go to work. Thus, the study team mined the whole dataset for relevant data. Public transport in this study refers to public or commuter buses, subways, elevated and light rail, and Amtrak. The following criteria were used to choose the samples: (1) residence in California, (2) the use of public transportation to commute to work, and (3) the use of walking and POVs to reach public transportation to go to work. A total of 796 samples were used to create the final dataset. A total of 19 input variables and 2 target variables were included in the dataset (walk to reach public transit stations and POVs to reach public transit stations). Table 2 lists all of the variables utilized in this investigation.
In the NHTS dataset, several active modes, including bikes and e-scooters, and passive modes, such as ride-sourcing, are not considered to reach PT stations. This can be regarded as a drawback of the NHTS dataset and a limitation of this study. Furthermore, although the literature suggests that the most critical BE factors for examining the first mile connection to PT stations are population density and distance to the PT station, the NHTS only considers population density. As a result, the only BE input in this investigation was population density, whose direct and significant impacts on travel behavior and mode choice for PT have been widely proven.

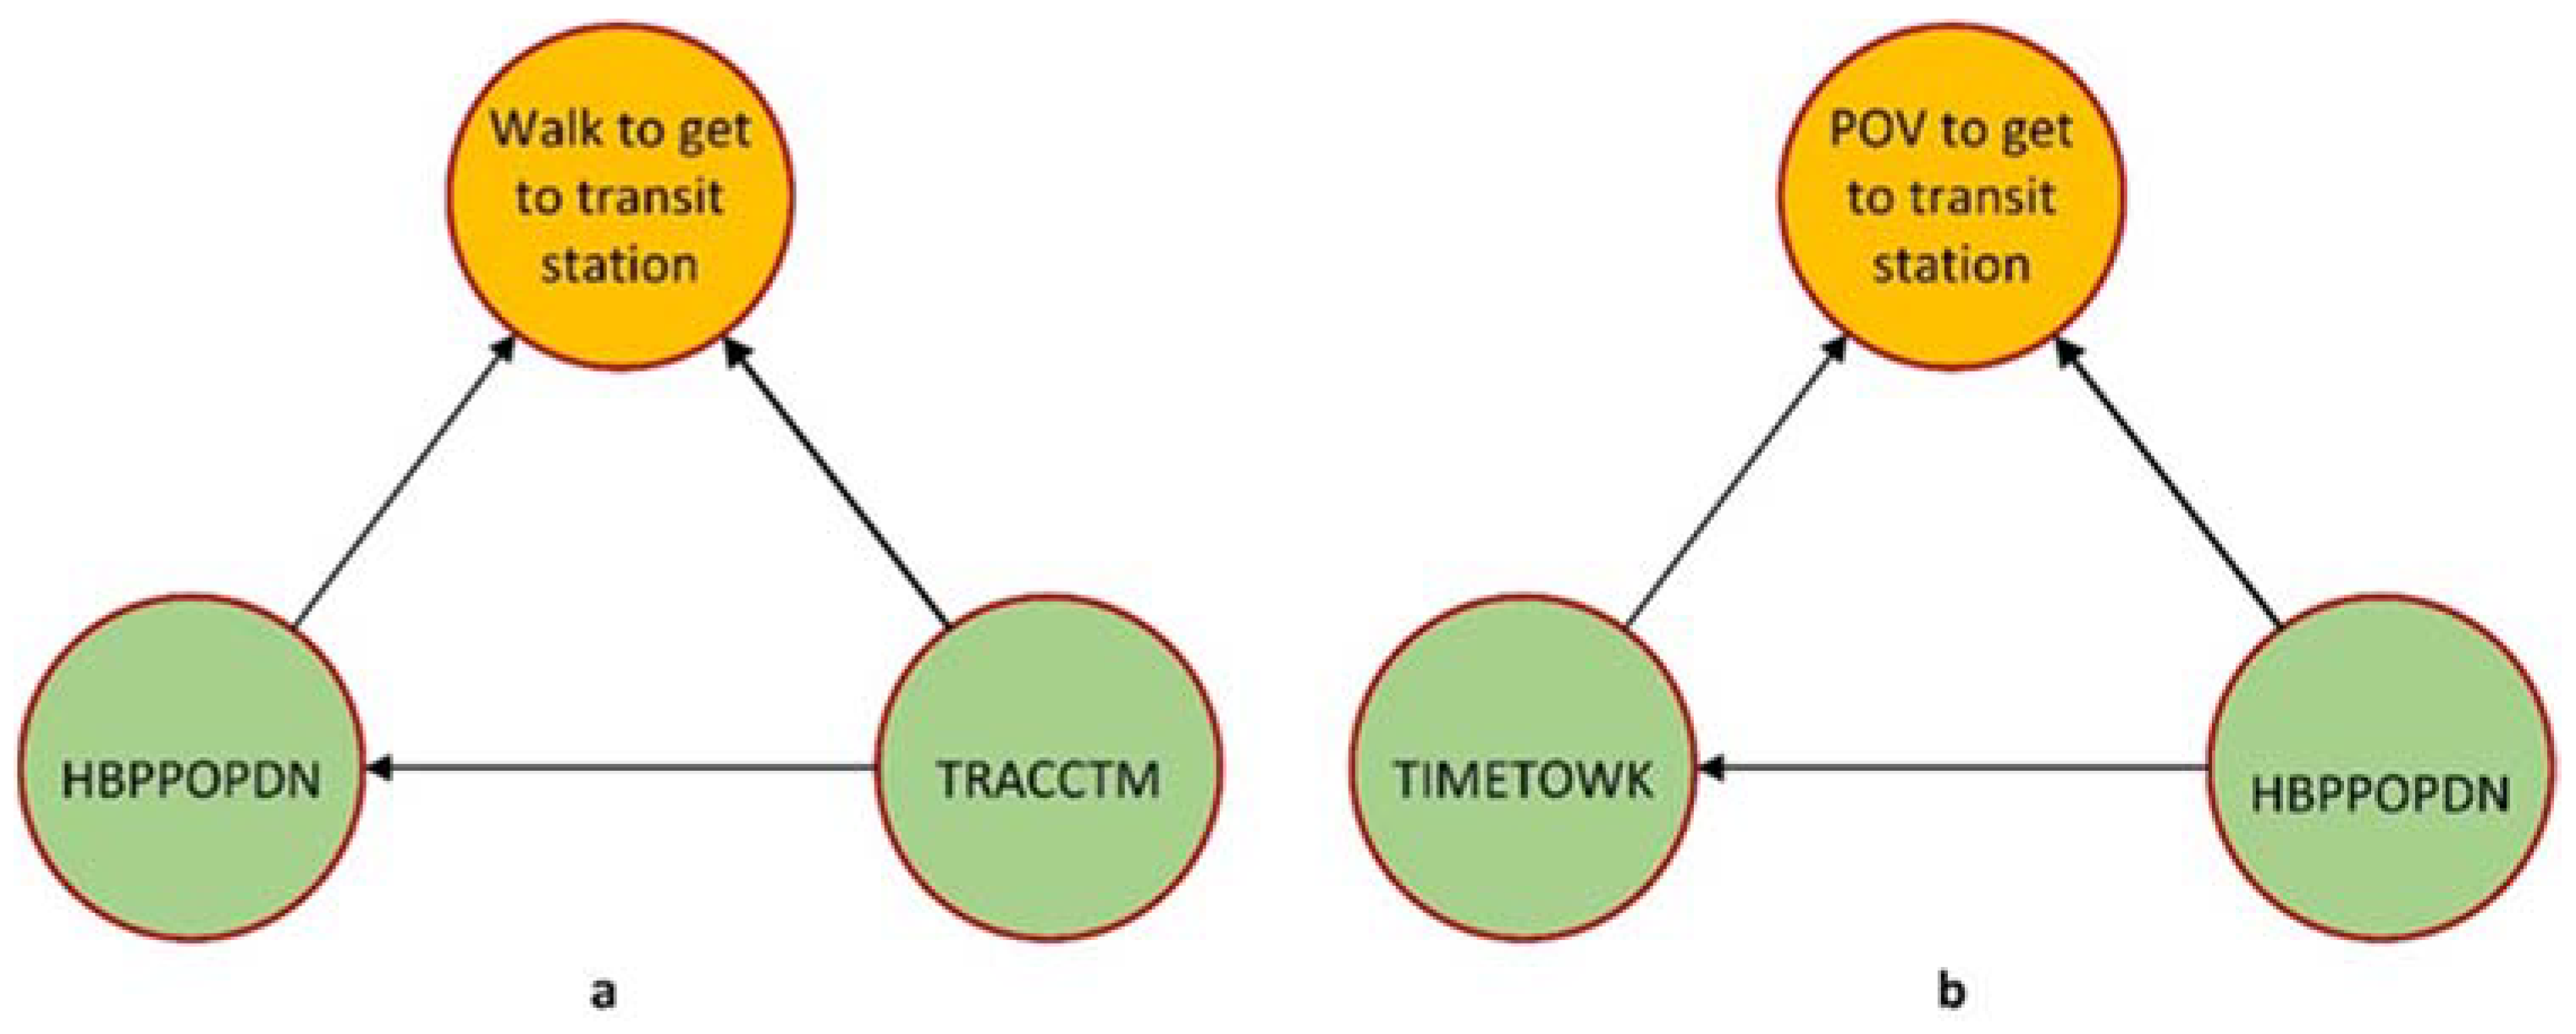
2.2. Bayesian Network (BN) Model

Bayesian Networks (BNs), commonly referred to as belief networks, are probabilistic network models that combine probability and graph theory. The following are the main two methods for acquiring BN structures. The first method is based on expert judgment and uses subjective causal links to construct a BN structure. The second method, known as structural learning, uses certain learning models to detect and guide the edges on a given dataset. By using the latter method, this investigation creates the BN architecture. There are numerous data-driven techniques, including Nave Bayesian Networks (NBN), Augmented Naive Bayesian Networks (ABN), and Tree Augmented Networks (TAN). TAN learning generates qualitative BN-depicting variables’ interacting dependencies, which aids in generating insights into the crucial elements that influence travel mode choice. Friedman et al. [92] have noted that TAN beats naive Bayes, while retaining the calculation efficiency and stability that naive Bayes is known for. Other data-driven configuration algorithms are less effective and reliable than TAN [93]. In this research, the analysis was performed using SPSS Modeller, which is worth noting.
A BN that is a labelled directed acyclic graph (DAG) represents a joint probability distribution over a collection of random inputs Q. Let Q = { B 1 ,   B i ,   D } , where i refers to the number of inputs, the inputs A 1 ,   A i are the variables, and D signifies the class variable (mode to public transit station).
Assume a network structure in which the target variable serves as the root, namely D = , and every variable possesses the target variable as its sole parent, namely B j = { D } for 1 j i . Equation (1) characterizes a BN as a single joint probability distribution across Q.
P ( B 1 ,   B i ,   D ) . j = 1 i P ( B j >| D )
When B j has just one parent for any and all B j apart from one variable-lacking parent, the DAG over { B 1 ,   A i } is a tree. When there is only one j so that π ( j ) = 0 , and therefore there is no series j 1 ,   j s so that π ( j h ) = j h + 1 given j h s and π ( j s ) = i 1 , there is indeed a function π that can describe a tree across B 1 ,   B i . Such a function describes a tree network where B j = { D , B π ( j ) } if π ( i ) > 0 , and B j = { D } if π ( j ) = 0 .
It is an optimization challenge to learn a TAN structure. Chow and Liu [94], who employed conditional mutual information between characteristics, offered a broad technique for solving this problem. The following is a definition of the function:
I M ( B j ,   B h | D ) = b j j , b h j , d j P ( b j j , b h j , d j ) l o g P ( b j j ,   b h j | d j ) P ( b j j | d j ) P ( b h j | d j )
where IM denotes the conditional mutual information, b j j is the jth state of variable B j , b h j is the jth state of variable B h , d j is the jth state of “mode choice to transit station”. The optimization challenge of learning a TAN structure is to develop a tree characterizing function across B 1 ,   B i that maximises the log-likelihood.

3. Results

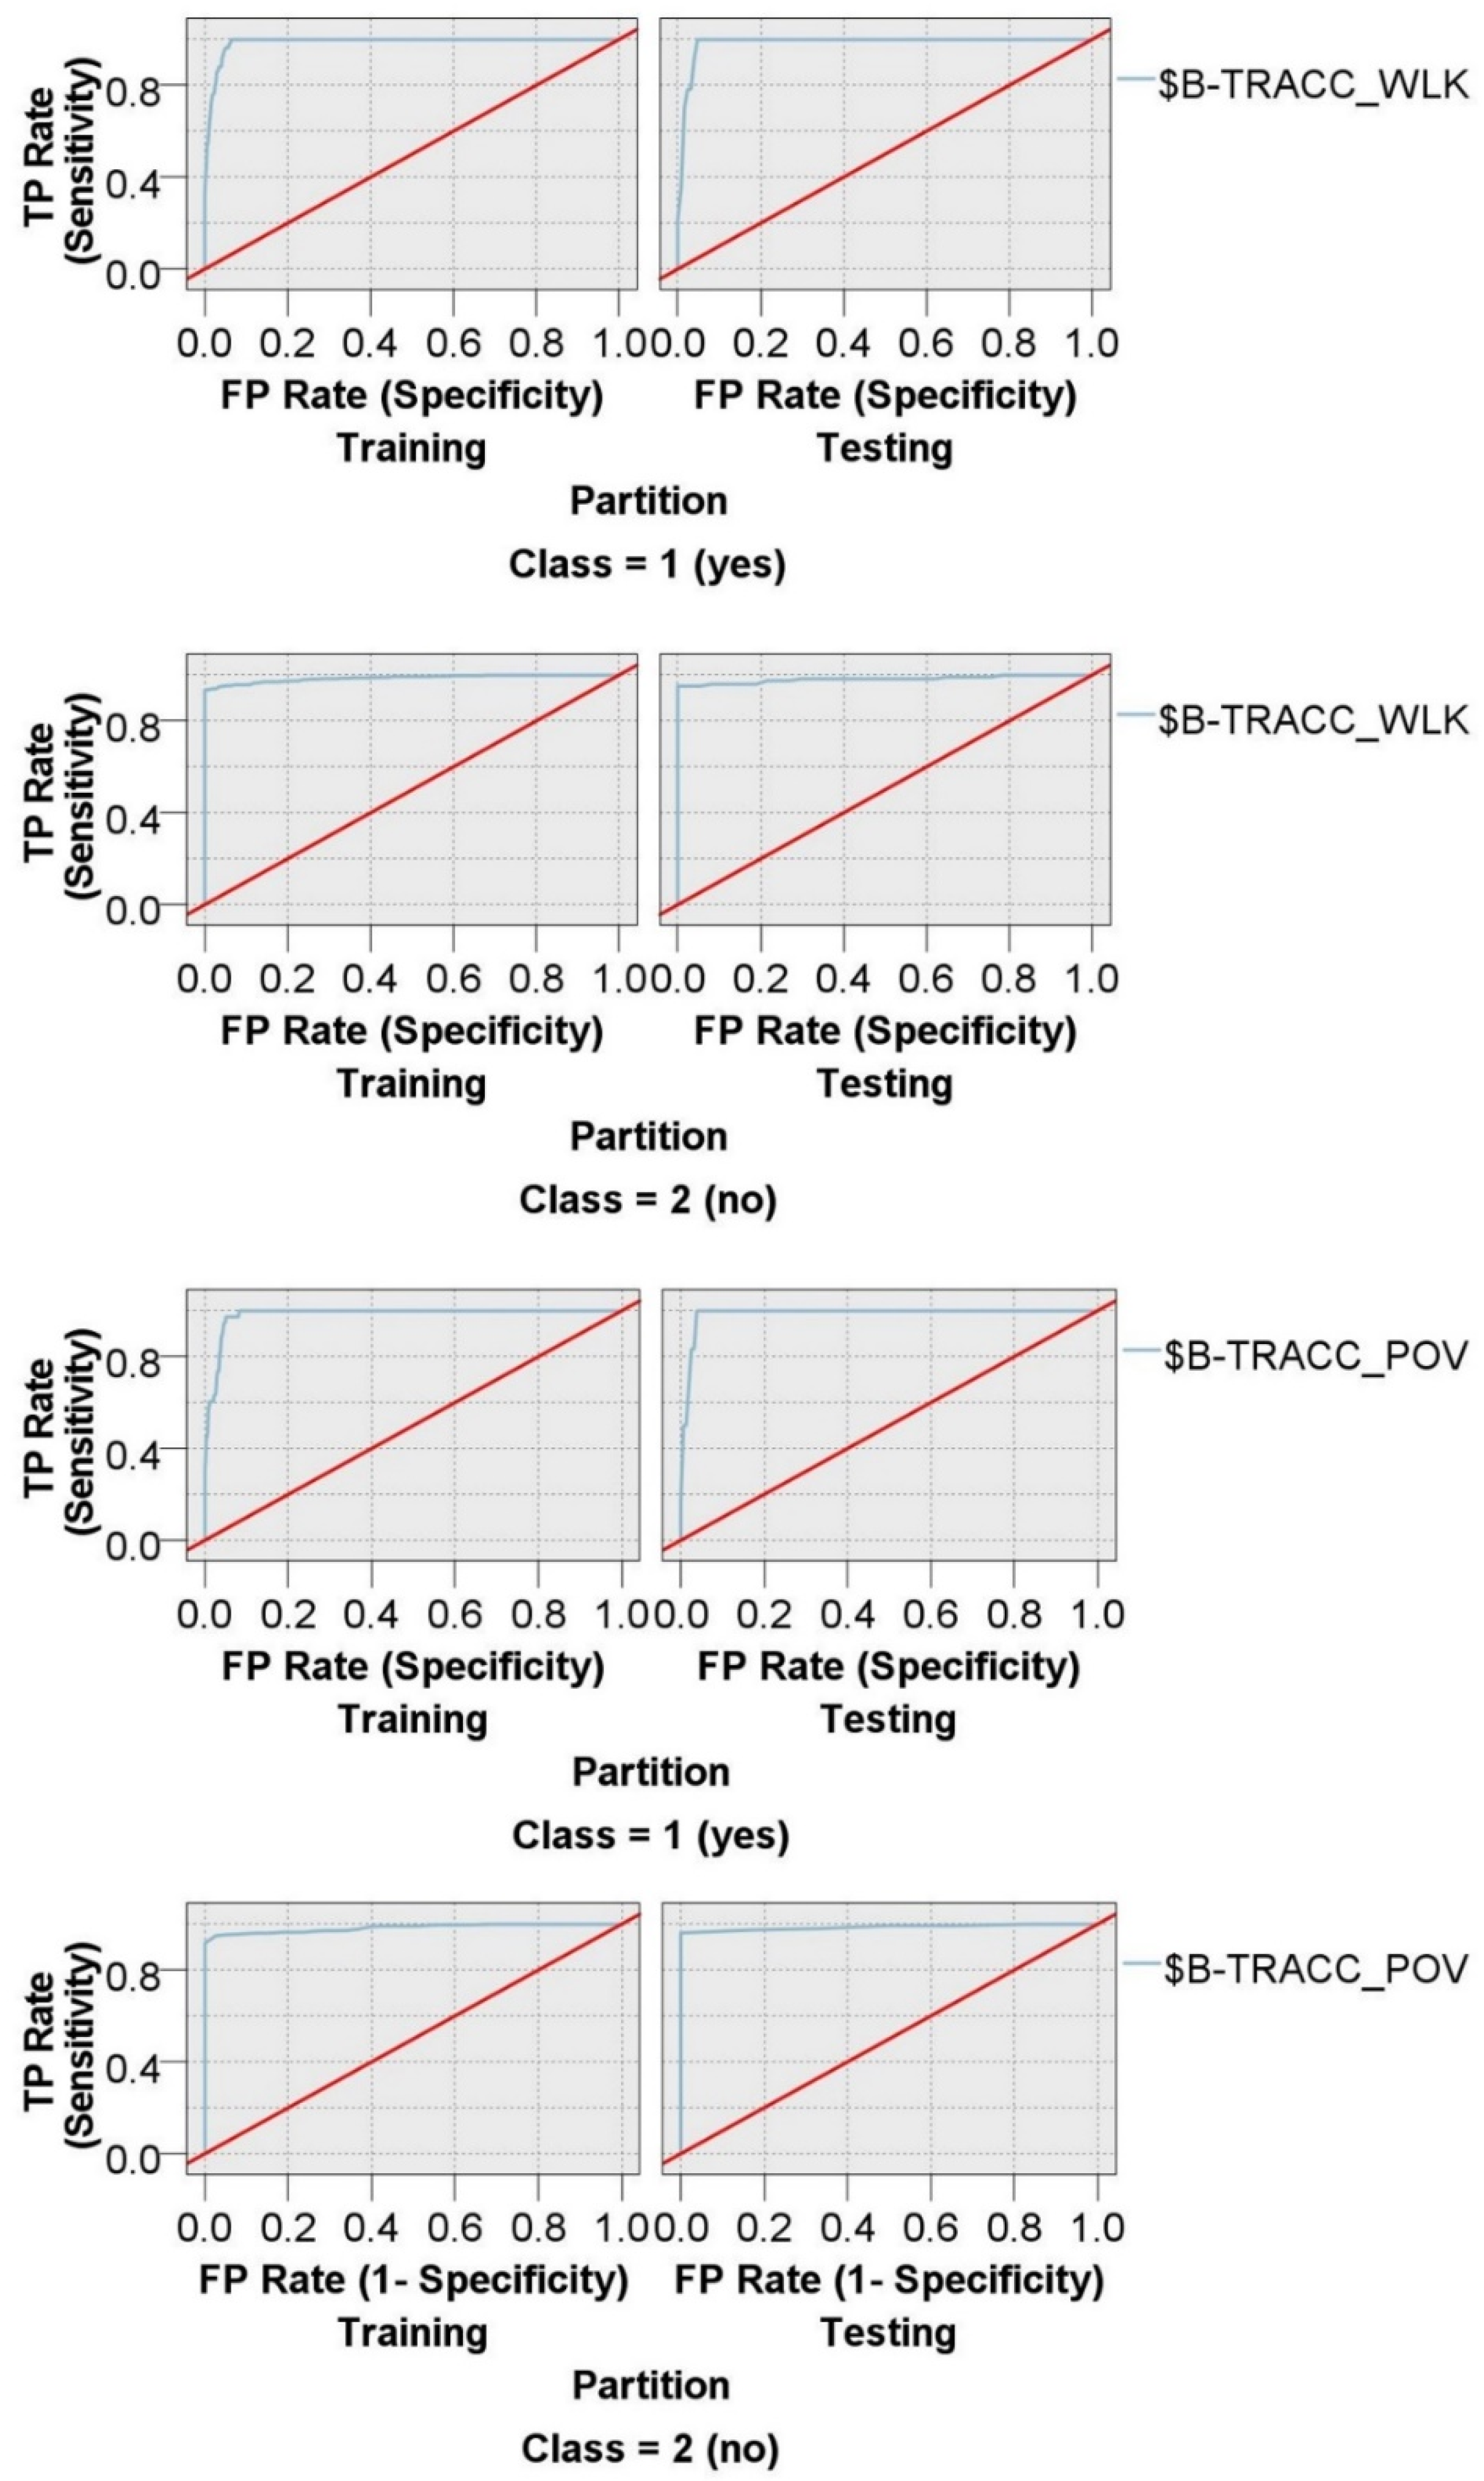
3.1. Models’ Results and Performance

Two Bayesian Network (BN) models were developed in this study to predict the choice of walking and POVs to reach PT stations among Californians. To develop these models, the structure type of the BN models was the TAN algorithm and the parameter learning method was Bayes adjustment. It is worth mentioning that the data were split into train and test partitions with a ratio of 80:20 before the models’ development. The training partition was used to build the models, whereas the test partition was utilized to evaluate the created model using unseen data. The BN models were used to (1) determine the importance of variables in predicting the choice of walking and POVs to reach PT stations, (2) determine relationships with travel mode to reach PT stations in California, and (3) identify the interaction effects of independent variables on the use of walking and POVs to reach PT stations. The structures of the BN models developed in this study are shown in Figure 2.
The performance of the two BN models is shown in Table 3. Both models achieved a high accuracy in both the training and testing phases. In addition, the accuracies of the training and testing phases are almost similar, which implies the stability of both models. The models’ performance also was assessed using receiver operating characteristic (ROC) diagrams (Figure 3). The ROC curve depicts the sensitivity–specificity trade-off. Models with curves nearer to the top-left corner perform much better. A random model is expected to yield diagonal points (sensitivity = specificity) as a reference point. The nearer the curve is to the ROC space’s 45 degree diagonal, the less accurate the test becomes. As can be seen, both models indicated a great performance for both classes (yes and no).

3.2. Variable Importance

Table 4 shows the significance of all independent variables in forecasting travel mode to reach public transit stations. In addition, the cumulative impact of four types of factors is shown in Table 5. For walking, the results showed that work trip attributes (WTA) dominated the prediction of mode choice to reach PT stations in California. For POV, individual and household attributes (IHA) largely influenced the forecast of mode choice to use PT. Especially, the predictive power of all the WTAs was 0.58. The combined contribution of IHA variables was 0.33 for POVs.
In terms of the WTAs’ impact on choosing the walking mode to reach PT stations, the trip time to the transit station (TRACCTM) was the most important variable in predicting walking choice to the PT station. Previous research has found a negative association between distance to transit stations and nonmotorized travel behavior [95,96,97]. As a result, it was expected that the time spent traveling to the transit station would emerge as the most relevant factor in predicting the likelihood of walking to the transit station. Individuals who walk to reach PT stations to go to work may place a different value on their time. People’s gender, income, family responsibilities, and other factors can all contribute to this difference [98]. As a result of these distinctions, different levels of sensitivity to walking time to PT stations may emerge.
In California, the population density (HBPPOPDN) has a 0.12 predictive power for POV usage to reach PT stations. The transport mode to the transit station is heavily influenced by population density [99]. In high-density areas, active transportation modalities are commonly used to reach transit stops. On the other hand, cars are the most prevalent form of transportation to transit stations in low-density areas.

3.3. Relationships with Travel Mode to Reach Public Transit Stations in California

In this section, the non-linear associations of the most important variable of walking and POVs to reach PT stations and the prediction of occurrence of these travel modes are discussed. It is vital to determine these complex relationships since it helps to identify the relevant impact ranges of these factors. According to the results of the BN models, the most important factor for predicting walking adoption to reach PT stations was the trip time to the transit station (TRACCTM), while the population density of participants’ house location (HBPPOPDN) was chosen as the most important predictor of POV adoption to reach PT stations.
Figure 4 displays the relationships mentioned above. When the average time to reach PT stations is around 10 min, Californians are more inclined to walk to the transit stations. If the typical commute duration to PT stations is around 40 min, Californians are less likely to walk to PT stations. This study’s results are consistent with Sun and Yin [100] findings, which revealed that shorter travel times and shorter distances to PT stations might increase the likelihood of walking to them.
If the participants’ dwelling is in a densely populated area (e.g., 7000–30,000 persons per square mile), it is unlikely that they will utilize a POV. In contrast, if the dwelling units are in a low-density region (e.g., 750 persons per square mile), POV is more likely to be used. These findings corroborate those of Nigro, Bertolini and Moccia [99], which found that population density influences the mode of transportation used to access PT stations. Combining the results of the time to the transit station (for the walking model) and population density (for the POV model), when the time to the transit station is less than 10 min or the population density in the household’s home location is 7000–30,000 persons per square mile, walking to reach PT stations could be increased by densifying land use around PT stations.

3.4. Interaction Impacts on Mode Choice to Reach Public Transit Stationsr

The strong negative connections between travel time to transit stations and walking to each PT stations suggest that, if the trip duration to transit stations can be reduced, walking will become more popular. The BN model revealed that another variable, population density (HBPPOPDN), mediates the effect of trip time to reach public transit stations (TRACCTM) on walking to PT stations (Figure 5a). Figure 5a illustrates the combined influence of these two variables on forecasting walking to reach PT stations in California. Walking is more probable when the trip time to the PT stations is less than 10 min. These lower trip times to transit stations occur in high density areas (e.g., 7000–30,000 persons per square mile). This means that the TRACCTM’s negative relationship with the walking level to the transit station is amplified by HBPPOPDN. The influence of trip time to transit stations on walking to PT stations is mediated more by a population density of 17,000 persons per square mile than by other HBPPOPDN values.
The substantial negative correlations between participants’ housing population density and their usage of POVs to reach PT stations show that if people reside in high-density areas with integrated public transportation, they will be discouraged from using POVs. Another variable, trip time to work (TIMETOWK), was found to mediate the impact of population density (HBPPOPDN) on using POVs to reach PT stations in the BN model (Figure 5b). The joint impact of these two variables on predicting POV usage to reach PT stations in California is shown in Figure 4b. In high-density locations, using POVs to reach PT stations is less likely (e.g., 7000–30,000 persons per square mile). When the commute time to work is between 42 and 57 min, lower trips using POVs occur. This suggests that TIMETOWK strengthens the HBPPOPDN’s negative association with POV usage to reach the transport stations. It is worth noticing that a 57 min commute to work has a greater mediation effect than other TIMETOWK values on the effect of population density on not utilizing POVs to reach PT stations.

4. Discussions

The time it takes to walk to PT stops or stations is the most essential factor in people’s choice to walk. Furthermore, it was shown that population density acted as a mediator for this effect. The POV model revealed population density as the most relevant component, which was mediated by the commute time to work. The findings are crucial because they show that planners should concentrate on population density, public transportation, and job locations when contemplating the replacement of POVs with walking to commute to PT stations for work. However, it is critical that the BN’s outcomes are unaffected by the following variables: the health condition attributes, the individual and household attributes, the work trip attributes (excluding the trip time to work and trip time to PT stations), and the work attributes. Previous studies have deemed these factors relevant [17,29,31,32,33,36,47]. However, this research suggests that they may not be necessary to take into consideration. In terms of health condition attributes, a very limited number of studies show that this factor is essential in travel mode choice [1,47,48]. Additionally, this study did not find a substantial effect of these factors on mode choice for PT stations. This may be due to the fact that health conditions may have a greater impact on leisure walking in California than on work-related walking.
As mentioned above, population density emerged as the most important factor of POV usage to reach PT stations and a mediator of the effects of travel time to PT stations on walking to PT stations. This finding reflects the importance of this factor in studying of travel mode choice to PT stations. Several previous studies also stressed the relevance of this factor on travel mode choice [38,39]. Furthermore, according to Nigro, Bertolini and Moccia [99], population density has a significant impact on the mode of transportation to the nearest PT facility.
The density of the population is seen as a crucial component in the success of a PT operation [101]. Population density, particularly for pedestrians, is commonly cited as a factor that encourages more people to use PT. However, research has shown inconsistent outcomes. Higher densities tend to have a more compact land use and closer destinations, which makes walking more possible and beneficial. However, although some research suggests that short-distance walking to reach PT stations is dependent on density, wealth and other societal variables are progressively taking precedence after populational density reaches a certain level [102,103].

5. Conclusions and Recommendations

This study employed a Bayesian Network model to examine the relative importance of health condition, work trip, work, and individual and household attributes in trip mode choice to transit stations to go to work and their complex relationships with travel mode choice to transit stations to go to work in California, using data from 2017 NHTS. It is among the first to investigate how population density in California mediates the effects of time to transit stations on walking to transit stations to go to work and how time to go to work mediates the influences of population density on POV usage to reach PT stations to go to work. The findings provide positive consequences regarding densifying population and land uses around transit stations for walking level growth to reach public transport stations in developed countries’ cities, especially car-oriented ones.
The outcomes indicate that work trip attributes play a dominant role in walking to reach PT stations in California. People that have a short trip time to transit stations to go to work are more likely to walk to PT stations. This variable is the most important predictor in the walking model, contributing to more than 0.40 of the predictive power. With a decrease in the trip time to transit stations in California, the walking level for first-mile connections to reach the workplace is expected to grow faster. The determination of efficacious approaches to accelerate growth is key to sustainable transportation in California.
The factors that affect PT-related walking are similar to those that impact urban walking in general, especially in terms of built environment features [104,105]. The appealing aspects of PT, as well as the PT services offered and the transportation options available to individuals, influence how far someone is willing to walk to reach public transportation.
Land use and transportation strategies can be utilized by planners to change the built environment. The setting wherein PT-related walking takes place is defined by non-modifiable characteristics (e.g., alternative travel alternatives, culture, purpose, physical ability, and the weather). However, urban or transportation planning experts can employ changeable influences (such as density, land use, infrastructure quality, and trip length) to impact the distances people would walk to PT stations to reach the workplace.
Planners should consider promoting high-density development because this has a strong effect on PT-related walking lengths. This development makes the origins and endpoints much closer and increases the transit stations density. These may reduce the distance that individuals must walk to transit stations. Density has also been connected to enhanced walkability, which can attract more walkers by raising the proportion of people who walk to reach transit stations or broadening the catchment area around a transit station.
Typically, people prefer to walk to transit stations through more walkable routes [106]. The higher level of walkability and, in turn, shorter PT-related walking can be achieved through a higher level of street connectivity and lower-level detours [17,18,87,89]. In addition, the tolerable walking travel time of pedestrians to transit stations can be increased if the walkability at the micro-level is improved [107]. Street elements, such as lighting, seating areas, trees, and width of sidewalk, may increase the distances people are willing to walk [22,108,109].
Along with these built-environment solutions, various car-restrictive policies could assist to reduce the use of POVs for general use and reaching transit stations. These regulations can be implemented particularly well in high-density areas, as low-density areas may lack enough PT and walking infrastructures. As a result, the only way to reach transit stations is by using a POV.
This study has a few limitations that deserve comment. First, this study utilized the 2017 NHTS dataset, which does not consider biking, micro-mobility, and ride-sourcing exclusively as modes to reach PT stations. Thus, future studies can apply the BN algorithm considering these modes and using different datasets. Second, the NHTS includes a few variables of the built environment. Hence, it is recommended that future studies develop BN models using more comprehensive datasets. Finally, this study was conducted in a car-oriented setting. Thus, people who use walking to reach public transit stations were underrepresented. Therefore, the outcomes of this study should be transferred cautiously to other cities, especially European ones.

Author Contributions

Conceptualization, M.A. (Mahdi Aghaabbasi), M.A. (Mujahid Ali) and P.T.; methodology, M.A. (Mahdi Aghaabbasi), M.A. (Mujahid Ali) and P.T.; software, M.A. (Mahdi Aghaabbasi) and M.A. (Mujahid Ali); formal analysis, M.A. (Mahdi Aghaabbasi) and M.A. (Mujahid Ali); investigation, M.A. (Mahdi Aghaabbasi) and M.A. (Mujahid Ali); writing—original draft preparation, M.A. (Mahdi Aghaabbasi) and M.A. (Mujahid Ali); funding acquisition, A.J., A.M.M. and A.M. All authors have read and agreed to the published version of the manuscript.

Funding

This research received no external funding.

Institutional Review Board Statement

Not applicable.

Informed Consent Statement

Not applicable.

Acknowledgments

The center of scientific and technological innovation and new economy institute of Chengdu-Chongqing economic zone (No: CYCX202011) and Research center for Sichuan Province into the dual-cycle new development pattern (No: CDNUSXH2021ZC-01).

Conflicts of Interest

The authors declare no conflict of interest.

References

  1. Martin, A.; Panter, J.; Suhrcke, M.; Ogilvie, D. Impact of changes in mode of travel to work on changes in body mass index: Evidence from the British Household Panel Survey. J. Epidemiol. Community Health 2015, 69, 753–761. [Google Scholar] [CrossRef] [PubMed] [Green Version]
  2. Chinnam, R.B.; Murat, A.E. Community-Aware Charging Station Network Design for Electrified Vehicles in Urban Areas: Reducing Congestion, Emissions, Improving Accessibility, and Promoting Walking, Bicycling, and Use of Public Transportation. 2016. Available online: https://rosap.ntl.bts.gov/view/dot/31590 (accessed on 1 January 2022).
  3. McKenzie, B. Modes Less Traveled: Bicycling and Walking to Work in the United States, 2008–2012; US Department of Commerce, Economics and Statistics Administration: Washington, DC, USA, 2014. [Google Scholar]
  4. Macioszek, E.; Kurek, A. The analysis of the factors determining the choice of park and ride facility using a multinomial logit model. Energies 2021, 14, 203. [Google Scholar] [CrossRef]
  5. Henry, E.; Furno, A.; El Faouzi, N.-E.; Rey, D. Locating park-and-ride facilities for resilient on-demand urban mobility. Transp. Res. Part E Logist. Transp. Rev. 2022, 158, 102557. [Google Scholar] [CrossRef]
  6. Kumar, P.; Khani, A. Adaptive park-and-ride choice on time-dependent stochastic multimodal transportation network. Netw. Spat. Econ. 2021, 21, 771–800. [Google Scholar] [CrossRef]
  7. Rezaei, S.; Khojandi, A.; Haque, A.M.; Brakewood, C.; Jin, M.; Cherry, C.R. Park-and-ride facility location optimization: A case study for Nashville, Tennessee. Transp. Res. Interdiscip. Perspect. 2022, 13, 100578. [Google Scholar] [CrossRef]
  8. Switkes, F. Getting There is Half the Problem: Removing Obstacles to Accessing Rail Transit; Massachusetts Institute of Technology: Cambridge, MA, USA, 2003. [Google Scholar]
  9. Kanthavel, R.; Sangeetha, S.; Keerthana, K. Design of smart public transport assist system for metropolitan city Chennai. Int. J. Intell. Netw. 2021, 2, 57–63. [Google Scholar] [CrossRef]
  10. Rietveld, P. Non-motorised modes in transport systems: A multimodal chain perspective for The Netherlands. Transp. Res. Part D Transp. Environ. 2000, 5, 31–36. [Google Scholar] [CrossRef]
  11. Weinstein Agrawal, A.; Schlossberg, M.; Irvin, K. How far, by which route and why? A spatial analysis of pedestrian preference. J. Urban Des. 2008, 13, 81–98. [Google Scholar] [CrossRef]
  12. Tight, M.; Rajé, F.; Timms, P. Car-free urban areas: A radical solution to the last mile problem or a step too far? Built Environ. 2016, 42, 603–616. [Google Scholar] [CrossRef]
  13. Ali, M.; de Azevedo, A.R.G.; Marvila, M.T.; Khan, M.I.; Memon, A.M.; Masood, F.; Almahbashi, N.M.; Shad, M.K.; Khan, M.A.; Fediuk, R.; et al. The Influence of COVID-19-Induced Daily Activities on Health Parameters—A Case Study in Malaysia. Sustainability 2021, 13, 7465. [Google Scholar] [CrossRef]
  14. Ali, M.; Dharmowijoyo, D.B.; Harahap, I.S.; Puri, A.; Tanjung, L.E. Travel behaviour and health: Interaction of Activity-Travel Pattern, Travel Parameter and Physical Intensity. Solid State Technol. 2020, 63, 4026–4039. [Google Scholar]
  15. Zhao, T.-H.; Shi, L.; Chu, Y.-M. Convexity and concavity of the modified Bessel functions of the first kind with respect to Hölder means. Revista de la Real Academia de Ciencias Exactas, Físicas y Naturales. Serie A. Matemáticas 2020, 114, 96. [Google Scholar] [CrossRef]
  16. Næss, P.; Peters, S.; Stefansdottir, H.; Strand, A. Causality, not just correlation: Residential location, transport rationales and travel behavior across metropolitan contexts. J. Transp. Geogr. 2018, 69, 181–195. [Google Scholar] [CrossRef]
  17. Kim, K.W.; Lee, D.W.; Chun, Y.H. A comparative study on the service coverages of subways and buses. KSCE J. Civ. Eng. 2010, 14, 915–922. [Google Scholar] [CrossRef]
  18. El-Geneidy, A.; Grimsrud, M.; Wasfi, R.; Tétreault, P.; Surprenant-Legault, J. New evidence on walking distances to transit stops: Identifying redundancies and gaps using variable service areas. Transportation 2014, 41, 193–210. [Google Scholar] [CrossRef]
  19. Patterson, R.; Webb, E.; Millett, C.; Laverty, A. Physical activity accrued as part of public transport use in England. J. Public Health 2019, 41, 222–230. [Google Scholar] [CrossRef] [PubMed]
  20. Ali, M.; Dharmowijoyo, D.B.E.; de Azevedo, A.R.G.; Fediuk, R.; Ahmad, H.; Salah, B. Time-Use and Spatio-Temporal Variables Influence on Physical Activity Intensity, Physical and Social Health of Travelers. Sustainability 2021, 13, 12226. [Google Scholar] [CrossRef]
  21. Tabatabaee, S.; Aghaabbasi, M.; Mahdiyar, A.; Zainol, R.; Ismail, S. Measurement Quality Appraisal Instrument for Evaluation of Walkability Assessment Tools Based on Walking Needs. Sustainability 2021, 13, 11342. [Google Scholar] [CrossRef]
  22. Aghaabbasi, M.; Moeinaddini, M.; Shah, M.Z.; Asadi-Shekari, Z. A new assessment model to evaluate the microscale sidewalk design factors at the neighbourhood level. J. Transp. Health 2017, 5, 97–112. [Google Scholar] [CrossRef]
  23. Aghaabbasi, M.; Moeinaddini, M.; Zaly Shah, M.; Asadi-Shekari, Z.; Arjomand Kermani, M. Evaluating the capability of walkability audit tools for assessing sidewalks. Sustain. Cities Soc. 2018, 37, 475–484. [Google Scholar] [CrossRef]
  24. Qian, Y.; Aghaabbasi, M.; Ali, M.; Alqurashi, M.; Salah, B.; Zainol, R.; Moeinaddini, M.; Hussein, E.E. Classification of Imbalanced Travel Mode Choice to Work Data Using Adjustable SVM Model. Appl. Sci. 2021, 11, 11916. [Google Scholar] [CrossRef]
  25. Zhao, T.-H.; Shen, Z.-H.; Chu, Y.-M. Sharp power mean bounds for the lemniscate type means. Revista de la Real Academia de Ciencias Exactas, Físicas y Naturales. Serie A. Matemáticas 2021, 115, 175. [Google Scholar] [CrossRef]
  26. Morency, C.; Trépanier, M.; Demers, M. Walking to transit: An unexpected source of physical activity. Transp. Policy 2011, 18, 800–806. [Google Scholar] [CrossRef]
  27. Wasfi, R.A.; Ross, N.A.; El-Geneidy, A.M. Achieving recommended daily physical activity levels through commuting by public transportation: Unpacking individual and contextual influences. Health Place 2013, 23, 18–25. [Google Scholar] [CrossRef]
  28. Zhao, T.-H.; Wang, M.-K.; Zhang, W.; Chu, Y.-M. Quadratic transformation inequalities for Gaussian hypergeometric function. J. Inequal. Appl. 2018, 2018, 251. [Google Scholar] [CrossRef] [Green Version]
  29. García-Palomares, J.C.; Gutiérrez, J.; Cardozo, O.D. Walking accessibility to public transport: An analysis based on microdata and GIS. Environ. Plan. B Plan. Des. 2013, 40, 1087–1102. [Google Scholar] [CrossRef]
  30. Johar, A.; Jain, S.; Garg, P.; Gundaliya, P. A study for commuter walk distance from bus stops to different destination along routes in Delhi. Eur. Transp. 2015, 59, 1–15. [Google Scholar]
  31. Alshalalfah, B.; Shalaby, A.S. Case study: Relationship of walk access distance to transit with service, travel, and personal characteristics. J. Urban Plan. Dev. 2007, 133, 114–118. [Google Scholar] [CrossRef]
  32. Besser, L.M.; Dannenberg, A.L. Walking to public transit: Steps to help meet physical activity recommendations. Am. J. Prev. Med. 2005, 29, 273–280. [Google Scholar] [CrossRef] [Green Version]
  33. He, J.; Zhang, R.; Huang, X.; Xi, G. Walking access distance of metro passengers and relationship with demographic characteristics: A case study of Nanjing metro. Chin. Geogr. Sci. 2018, 28, 612–623. [Google Scholar] [CrossRef] [Green Version]
  34. Durand, C.P.; Gabriel, K.K.P.; Hoelscher, D.M.; Kohl, H.W. Transit use by children and adolescents: An overlooked source of and opportunity for physical activity? J. Phys. Act. Health 2016, 13, 861–866. [Google Scholar] [CrossRef] [PubMed]
  35. Zhao, T.-H.; He, Z.-Y.; Chu, Y.-M. Sharp bounds for the weighted Hölder mean of the zero-balanced generalized complete elliptic integrals. Comput. Methods Funct. Theory 2021, 21, 413–426. [Google Scholar] [CrossRef]
  36. Freeland, A.L.; Banerjee, S.N.; Dannenberg, A.L.; Wendel, A.M. Walking associated with public transit: Moving toward increased physical activity in the United States. Am. J. Public Health 2013, 103, 536–542. [Google Scholar] [CrossRef] [PubMed]
  37. Zhao, T.-H.; Zhou, B.-C.; Wang, M.-K.; Chu, Y.-M. On approximating the quasi-arithmetic mean. J. Inequal. Appl. 2019, 2019, 1–12. [Google Scholar] [CrossRef]
  38. Sun, G.; Zacharias, J.; Ma, B.; Oreskovic, N.M. How do metro stations integrate with walking environments? Results from walking access within three types of built environment in Beijing. Cities 2016, 56, 91–98. [Google Scholar] [CrossRef]
  39. Yu, C.-Y.; Lin, H.-C. Exploring factors regarding transit-related walking and walking duration. J. Phys. Act. Health 2016, 13, 1220–1229. [Google Scholar] [CrossRef]
  40. Zhao, T.-H.; Wang, M.-K.; Chu, Y.-M. Monotonicity and convexity involving generalized elliptic integral of the first kind. Revista de la Real Academia de Ciencias Exactas, Físicas y Naturales. Serie A. Matemáticas 2021, 115, 46. [Google Scholar] [CrossRef]
  41. Kim, T.; Sohn, D.-W.; Choo, S. An analysis of the relationship between pedestrian traffic volumes and built environment around metro stations in Seoul. KSCE J. Civ. Eng. 2017, 21, 1443–1452. [Google Scholar] [CrossRef]
  42. Paydar, M.; Fard, A.K.; Khaghani, M.M. Walking toward metro stations: The contribution of distance, attitudes, and perceived built environment. Sustainability 2020, 12, 10291. [Google Scholar] [CrossRef]
  43. Yu, C.-Y.; Lin, H.-C. Transit-related walking to work in promoting physical activity. J. Phys. Act. Health 2015, 12, 483–489. [Google Scholar] [CrossRef]
  44. Clark, A.F.; Scott, D.M.; Yiannakoulias, N. Examining the relationship between active travel, weather, and the built environment: A multilevel approach using a GPS-enhanced dataset. Transportation 2014, 41, 325–338. [Google Scholar] [CrossRef] [Green Version]
  45. Pan, H.; Wei, P. 11. Effects of rail transit proximity emissions in the suburbs of Shanghai on commuter CO2. In Handbook on Transport and Urban Transformation in China; Edward Elgar Publishing: Northampton, MA, USA, 2020; p. 182. [Google Scholar]
  46. Wei, P.; Pan, H. Research on individual carbon dioxide emissions of commuting in peri-urban area of metropolitan cities—An empirical study in Shanghai. Transp. Res. Procedia 2017, 25, 3459–3478. [Google Scholar] [CrossRef]
  47. Day, K.; Loh, L.; Ruff, R.R.; Rosenblum, R.; Fischer, S.; Lee, K.K. Does bus rapid transit promote walking? An examination of New York City’s select bus service. J. Phys. Act. Health 2014, 11, 1512–1516. [Google Scholar] [CrossRef]
  48. Zhao, T.-H.; Yang, Z.-H.; Chu, Y.-M. Monotonicity properties of a function involving the psi function with applications. J. Inequal. Appl. 2015, 2015, 193. [Google Scholar] [CrossRef] [Green Version]
  49. Sadeghiravesh, M.H.; Khosravi, H.; Abolhasani, A.; Ghodsi, M.; Mosavi, A. Fuzzy Logic Model to Assess Desertification Intensity Based on Vulnerability Indices. Acta Polytech. Hung. 2021, 18, 7–24. [Google Scholar] [CrossRef]
  50. Rafiei-Sardooi, E.; Azareh, A.; Choubin, B.; Mosavi, A.H.; Clague, J.J. Evaluating urban flood risk using hybrid method of TOPSIS and machine learning. Int. J. Disaster Risk Reduct. 2021, 66, 102614. [Google Scholar] [CrossRef]
  51. Pinter, G.; Mosavi, A.; Felde, I. Artificial intelligence for modeling real estate price using call detail records and hybrid machine learning approach. Entropy 2020, 22, 1421. [Google Scholar] [CrossRef]
  52. Holtzclaw, J.; Clear, R.; Dittmar, H.; Goldstein, D.; Haas, P. Location efficiency: Neighborhood and socio-economic characteristics determine auto ownership and use-studies in Chicago, Los Angeles and San Francisco. Transp. Plan. Technol. 2002, 25, 1–27. [Google Scholar] [CrossRef]
  53. Shay, E.; Khattak, A.J. Household travel decision chains: Residential environment, automobile ownership, trips and mode choice. Int. J. Sustain. Transp. 2012, 6, 88–110. [Google Scholar] [CrossRef]
  54. Zhang, W.; Zhao, Y.; Cao, X.J.; Lu, D.; Chai, Y. Nonlinear effect of accessibility on car ownership in Beijing: Pedestrian-scale neighborhood planning. Transp. Res. Part D Transp. Environ. 2020, 86, 102445. [Google Scholar] [CrossRef]
  55. Chen, E.; Ye, Z.; Wu, H. Nonlinear effects of built environment on intermodal transit trips considering spatial heterogeneity. Transp. Research Part D Transp. Environ. 2021, 90, 102677. [Google Scholar] [CrossRef]
  56. Zhao, T.H.; Khan, M.I.; Chu, Y.M. Artificial neural networking (ANN) analysis for heat and entropy generation in flow of non-Newtonian fluid between two rotating disks. Math. Methods Appl. Sci. 2021. [Google Scholar] [CrossRef]
  57. Zandi, P.; Rahmani, M.; Khanian, M.; Mosavi, A. Agricultural risk management using fuzzy TOPSIS analytical hierarchy process (AHP) and failure mode and effects analysis (FMEA). Agriculture 2020, 10, 504. [Google Scholar] [CrossRef]
  58. Tavoosi, J.; Zhang, C.; Mohammadzadeh, A.; Mobayen, S.; Mosavi, A.H. Medical image interpolation using recurrent type-2 fuzzy neural network. Front. Neuroinform. 2021, 15, 667375. [Google Scholar] [CrossRef] [PubMed]
  59. Ma, T.; Aghaabbasi, M.; Ali, M.; Zainol, R.; Jan, A.; Mohamed, A.M.; Mohamed, A. Nonlinear Relationships between Vehicle Ownership and Household Travel Characteristics and Built Environment Attributes in the US Using the XGBT Algorithm. Sustainability 2022, 14, 3395. [Google Scholar] [CrossRef]
  60. Ding, C.; Cao, X.J.; Næss, P. Applying gradient boosting decision trees to examine non-linear effects of the built environment on driving distance in Oslo. Transp. Res. Part A Policy Pract. 2018, 110, 107–117. [Google Scholar] [CrossRef]
  61. Stylianou, K.; Dimitriou, L.; Abdel-Aty, M. Big data and road safety: A comprehensive review. In Mobility Patterns, Big Data and Transport Analytics; Elsevier: Amsterdam, The Netherlands, 2019; pp. 297–343. [Google Scholar]
  62. Mousavi, S.M.; Ghasemi, M.; Dehghan Manshadi, M.; Mosavi, A. Deep learning for wave energy converter modeling using long short-term memory. Mathematics 2021, 9, 871. [Google Scholar] [CrossRef]
  63. Meiabadi, M.S.; Moradi, M.; Karamimoghadam, M.; Ardabili, S.; Bodaghi, M.; Shokri, M.; Mosavi, A.H. Modeling the producibility of 3D printing in polylactic acid using artificial neural networks and fused filament fabrication. Polymers 2021, 13, 3219. [Google Scholar] [CrossRef]
  64. Khosravi, K.; Golkarian, A.; Booij, M.J.; Barzegar, R.; Sun, W.; Yaseen, Z.M.; Mosavi, A. Improving daily stochastic streamflow prediction: Comparison of novel hybrid data-mining algorithms. Hydrol. Sci. J. 2021, 66, 1457–1474. [Google Scholar] [CrossRef]
  65. Ghaemi, A.; Zhian, T.; Pirzadeh, B.; Hashemi Monfared, S.; Mosavi, A. Reliability-based design and implementation of crow search algorithm for longitudinal dispersion coefficient estimation in rivers. Environ. Sci. Pollut. Res. 2021, 28, 35971–35990. [Google Scholar] [CrossRef]
  66. Ebrahimi-Khusfi, Z.; Taghizadeh-Mehrjardi, R.; Roustaei, F.; Ebrahimi-Khusfi, M.; Mosavi, A.H.; Heung, B.; Soleimani-Sardo, M.; Scholten, T. Determining the contribution of environmental factors in controlling dust pollution during cold and warm months of western Iran using different data mining algorithms and game theory. Ecol. Indic. 2021, 132, 108287. [Google Scholar] [CrossRef]
  67. Aghaabbasi, M.; Shekari, Z.A.; Shah, M.Z.; Olakunle, O.; Armaghani, D.J.; Moeinaddini, M. Predicting the use frequency of ride-sourcing by off-campus university students through random forest and Bayesian network techniques. Transp. Res. Part A Policy Pract. 2020, 136, 262–281. [Google Scholar] [CrossRef]
  68. Peng, Y.; Ghahnaviyeh, M.B.; Ahmad, M.N.; Abdollahi, A.; Bagherzadeh, S.A.; Azimy, H.; Mosavi, A.; Karimipour, A. Analysis of the effect of roughness and concentration of Fe3O4/water nanofluid on the boiling heat transfer using the artificial neural network: An experimental and numerical study. Int. J. Therm. Sci. 2021, 163, 106863. [Google Scholar] [CrossRef]
  69. Panahi, F.; Ehteram, M.; Ahmed, A.N.; Huang, Y.F.; Mosavi, A.; El-Shafie, A. Streamflow prediction with large climate indices using several hybrid multilayer perceptrons and copula Bayesian model averaging. Ecol. Indic. 2021, 133, 108285. [Google Scholar] [CrossRef]
  70. Mousavi, S.P.; Atashrouz, S.; Nait Amar, M.; Hemmati-Sarapardeh, A.; Mohaddespour, A.; Mosavi, A. Viscosity of Ionic Liquids: Application of the Eyring’s Theory and a Committee Machine Intelligent System. Molecules 2021, 26, 156. [Google Scholar] [CrossRef] [PubMed]
  71. Chen, Y.; Aghaabbasi, M.; Ali, M.; Anciferov, S.; Sabitov, L.; Chebotarev, S.; Nabiullina, K.; Sychev, E.; Fediuk, R.; Zainol, R. Hybrid Bayesian Network Models to Investigate the Impact of Built Environment Experience before Adulthood on Students’ Tolerable Travel Time to Campus: Towards Sustainable Commute Behavior. Sustainability 2022, 14, 325. [Google Scholar] [CrossRef]
  72. Musarat, M.A.; Alaloul, W.S.; Rabbani, M.B.A.; Ali, M.; Altaf, M.; Fediuk, R.; Vatin, N.; Klyuev, S.; Bukhari, H.; Sadiq, A.; et al. Kabul River Flow Prediction Using Automated ARIMA Forecasting: A Machine Learning Approach. Sustainability 2021, 13, 10720. [Google Scholar] [CrossRef]
  73. Nafees, A.; Amin, M.N.; Khan, K.; Nazir, K.; Ali, M.; Javed, M.F.; Aslam, F.; Musarat, M.A.; Vatin, N.I. Modeling of Mechanical Properties of Silica Fume-Based Green Concrete Using Machine Learning Techniques. Polymers 2022, 14, 30. [Google Scholar] [CrossRef]
  74. Zhao, T.-H.; Wang, M.-K.; Chu, Y.-M. Concavity and bounds involving generalized elliptic integral of the first kind. J. Math. Inequal. 2021, 15, 701–724. [Google Scholar] [CrossRef]
  75. Tavoosi, J.; Suratgar, A.A.; Menhaj, M.B.; Mosavi, A.; Mohammadzadeh, A.; Ranjbar, E. Modeling renewable energy systems by a self-evolving nonlinear consequent part recurrent type-2 fuzzy system for power prediction. Sustainability 2021, 13, 3301. [Google Scholar] [CrossRef]
  76. Tareeq, S.M.; Inamura, T. A sample discarding strategy for rapid adaptation to new situation based on Bayesian behavior learning. In Proceedings of the 2008 IEEE International Conference on Robotics and Biomimetics, Bangkok, Thailand, 22–25 February 2009; pp. 1950–1955. [Google Scholar]
  77. Wu, Q.; Yang, C.; Gao, X.; He, P.; Chen, G. EPAB: Early pattern aware bayesian model for social content popularity prediction. In Proceedings of the 2018 IEEE International Conference on Data Mining (ICDM), Singapore, 17–20 November 2018; pp. 1296–1301. [Google Scholar]
  78. Liu, T.; Zhang, Y.; Chen, J.; Shen, H. Discovery of association rule of learning action based on Bayesian network. In Proceedings of the 2018 9th International Conference on Information Technology in Medicine and Education (ITME), Hangzhou, China, 19–21 October 2018; pp. 466–470. [Google Scholar]
  79. Tao, W.; Aghaabbasi, M.; Ali, M.; Almaliki, A.H.; Zainol, R.; Almaliki, A.A.; Hussein, E.E. An Advanced Machine Learning Approach to Predicting Pedestrian Fatality Caused by Road Crashes: A Step toward Sustainable Pedestrian Safety. Sustainability 2022, 14, 2436. [Google Scholar] [CrossRef]
  80. Zhao, T.-H.; Wang, M.-K.; Chu, Y.-M. A sharp double inequality involving generalized complete elliptic integral of the first kind. AIMS Math. 2020, 5, 4512–4528. [Google Scholar] [CrossRef]
  81. Taghizadeh-Mehrjardi, R.; Emadi, M.; Cherati, A.; Heung, B.; Mosavi, A.; Scholten, T. Bio-inspired hybridization of artificial neural networks: An application for mapping the spatial distribution of soil texture fractions. Remote Sens. 2021, 13, 1025. [Google Scholar] [CrossRef]
  82. Ratanawaraha, A.; Chalermpong, S.; Chullabodhi, C. Walking distance of commuters after modal shift to rail transit in Bangkok. J. East. Asia Soc. Transp. Stud. 2015, 11, 1467–1478. [Google Scholar]
  83. Rodriguez-Gonzalez, M.; Aguero-Valverde, J. Walking distances from home to bus stops in San José, Costa Rica: Real, perceived, and stated-preference distances. Adv. Transp. Stud. 2017, 43, 63–74. [Google Scholar]
  84. Townsend, C.; Zacharias, J. Built environment and pedestrian behavior at rail rapid transit stations in Bangkok. Transportation 2010, 37, 317–330. [Google Scholar] [CrossRef]
  85. Vandebona, U.; Tsukaguchi, H. Impact of urbanization on user expectations related to public transport accessibility. Int. J. Urban Sci. 2013, 17, 199–211. [Google Scholar] [CrossRef]
  86. Voss, C.; Winters, M.; Frazer, A.; McKay, H. School-travel by public transit: Rethinking active transportation. Prev. Med. Rep. 2015, 2, 65–70. [Google Scholar] [CrossRef] [Green Version]
  87. Wang, J.; Cao, X. Exploring built environment correlates of walking distance of transit egress in the Twin Cities. J. Transp. Geogr. 2017, 64, 132–138. [Google Scholar] [CrossRef]
  88. Xi, Y.; Saxe, S.; Miller, E. Accessing the subway in Toronto, Canada: Access mode and catchment areas. Transp. Res. Rec. 2016, 2543, 52–61. [Google Scholar] [CrossRef]
  89. Zacharias, J.; Zhao, Q. Local environmental factors in walking distance at metro stations. Public Transp. 2018, 10, 91–106. [Google Scholar] [CrossRef]
  90. Zhao, J.; Deng, W.; Song, Y.; Zhu, Y. What influences Metro station ridership in China? Insights from Nanjing. Cities 2013, 35, 114–124. [Google Scholar] [CrossRef]
  91. Zuo, T.; Wei, H.; Rohne, A. Determining transit service coverage by non-motorized accessibility to transit: Case study of applying GPS data in Cincinnati metropolitan area. J. Transp. Geogr. 2018, 67, 1–11. [Google Scholar] [CrossRef]
  92. Friedman, N.; Geiger, D.; Goldszmidt, M. Bayesian network classifiers. Mach. Learn. 1997, 29, 131–163. [Google Scholar] [CrossRef] [Green Version]
  93. Murphy, P.M. UCI repository of machine learning databases. 1994. Available online: https://archive.ics.uci.edu/ml/datasets.php (accessed on 1 January 2022).
  94. Chow, C.; Liu, C. Approximating discrete probability distributions with dependence trees. IEEE Trans. Inf. Theory 1968, 14, 462–467. [Google Scholar] [CrossRef] [Green Version]
  95. Cervero, R.; Kockelman, K. Travel demand and the 3Ds: Density, diversity, and design. Transp. Res. Part D: Transp. Environ. 1997, 2, 199–219. [Google Scholar] [CrossRef]
  96. Targa, F.; Clifton, K.J. Built environment and nonmotorized travel: Evidence from Baltimore city using the NHTS. J. Transp. Stat. 2005, 8, 55–70. [Google Scholar]
  97. Schneider, R.J. Local environment characteristics associated with walking and taking transit to shopping districts. J. Transp. Land Use 2015, 8, 125–147. [Google Scholar] [CrossRef] [Green Version]
  98. Chia, J.; Lee, J.; Kamruzzaman, M. Walking to public transit: Exploring variations by socioeconomic status. Int. J. Sustain. Transp. 2016, 10, 805–814. [Google Scholar] [CrossRef] [Green Version]
  99. Nigro, A.; Bertolini, L.; Moccia, F.D. Land use and public transport integration in small cities and towns: Assessment methodology and application. J. Transp. Geogr. 2019, 74, 110–124. [Google Scholar] [CrossRef] [Green Version]
  100. Sun, B.; Yin, C. Impacts of a multi-scale built environment and its corresponding moderating effects on commute duration in China. Urban Stud. 2019, 57, 2115–2130. [Google Scholar] [CrossRef]
  101. Calthorpe, P. The Next American Metropolis: Ecology, Community, and the American Dream; Princeton Architectural Press: New York, NY, USA, 1993. [Google Scholar]
  102. Marquet, O.; Miralles-Guasch, C. The Walkable city and the importance of the proximity environments for Barcelona’s everyday mobility. Cities 2015, 42, 258–266. [Google Scholar] [CrossRef]
  103. Forsyth, A.; Oakes, J.M.; Schmitz, K.H.; Hearst, M. Does residential density increase walking and other physical activity? Urban Stud. 2007, 44, 679–697. [Google Scholar] [CrossRef]
  104. Saelens, B.E.; Handy, S.L. Built environment correlates of walking: A review. Med. Sci. Sports Exerc. 2008, 40, S550. [Google Scholar] [CrossRef] [Green Version]
  105. Van Holle, V.; Deforche, B.; Van Cauwenberg, J.; Goubert, L.; Maes, L.; Van de Weghe, N.; De Bourdeaudhuij, I. Relationship between the physical environment and different domains of physical activity in European adults: A systematic review. BMC Public Health 2012, 12, 1–17. [Google Scholar] [CrossRef] [Green Version]
  106. Jiang, Y.; Zegras, P.C.; Mehndiratta, S. Walk the line: Station context, corridor type and bus rapid transit walk access in Jinan, China. J. Transp. Geogr. 2012, 20, 1–14. [Google Scholar] [CrossRef]
  107. Asadi-Shekari, Z.; Moeinaddini, M.; Aghaabbasi, M.; Cools, M.; Zaly Shah, M. Exploring effective micro-level items for evaluating inclusive walking facilities on urban streets (applied in Johor Bahru, Malaysia). Sustain. Cities Soc. 2019, 49, 101563. [Google Scholar] [CrossRef]
  108. Aghaabbasi, M.; Shah, M.Z.; Zainol, R. Investigating the Use of Active Transportation Modes Among University Employees Through an Advanced Decision Tree Algorithm. Civ. Sustain. Urban Eng. 2021, 1, 26–49. [Google Scholar] [CrossRef]
  109. Aghaabbasi, M.; Moeinaddini, M.; Asadi-Shekari, Z.; Shah, M.Z. The equitable use concept in sidewalk design. Cities 2019, 88, 181–190. [Google Scholar] [CrossRef]
Figure 1. This study’s flowchart.
Sustainability 14 03989 g001
Figure 2. BNs’ structure: associations between the travel modes to reach public transport and their most important variables and mediators as identified by the BN model. (a) BN model for walking to reach public transit station; (b) BN model for POV to reach public transit station.
Sustainability 14 03989 g002
Figure 3. Receiver operating characteristic graphs for the BN models developed in this study.
Sustainability 14 03989 g003
Figure 4. Non-linear relationship between the most important variable in each model and prediction of the travel mode choice to reach public transit stations. (a) Prediction of the walking choice to get to public transit; (b) prediction of the POV choice to get to public transit.
Sustainability 14 03989 g004
Figure 5. Associations between key variables and travel mode choice to reach public transit stations mediated by various variables. (a) The combined influence of population density and trip time to reach public transit stations on forecasting walking to reach PT stations; (b) The combined influence of population density and trip time to work on forecasting usage of POV to reach PT stations.
Sustainability 14 03989 g005
Table 1. Some recent studies on PT-related walking.
StudyLocationSample Size (Unit)Analysis Method
Patterson, Webb, Millett and Laverty [19]USA2448 (passengers)LRM
Ratanawaraha et al. [82]Thailand1020 (travelers)LRM
Rodriguez-Gonzalez and Aguero-Valverde [83]Costa RicaN/APDF and CDF
Sun, Zacharias, Ma and Oreskovic [38]China495 (adults)LRM
Townsend and Zacharias [84]Thailand1489 (travelers)LRM
Vandebona and Tsukaguchi [85]Japan3560 (persons)DE
Voss et al. [86]Canada42 (students)LRM
Wang and Cao [87]USA7077 (travelers)LRM
Wasfi, Ross and El-Geneidy [27]Canada6913 (trips)LRM
Xi et al. [88]Canada21,470 (trips)DE
Yu and Lin [39]USA18,180 (trips)LRM
Zacharias and Zhao [89]China2409 (passengers)LRM
Zhao et al. [90]China1544 (travelers)LRM
Zuo et al. [91]USA1330 (trips)DE
LRM = logistic regression model; PDF = probability density function; CDF = cumulative distribution function; DE = Descriptive analysis.
Table 2. Variables employed in this study.
VariableAcronymCategory/Data Range
Health condition attributes (HCA)
Medical condition results in using bus or subway less frequentlyCONDPUByes (1) and no (2)
Medical condition results in giving up drivingCONDRIVEyes (1) and no (2)
Opinion of healthHEALTHexcellent (1), very good (2), good (3), fair (4), poor (5)
Medical condition, length of timeMEDCOND66 months or less (1), more than 6 months (2), and all life (3)
Built environment characteristics (BEC)
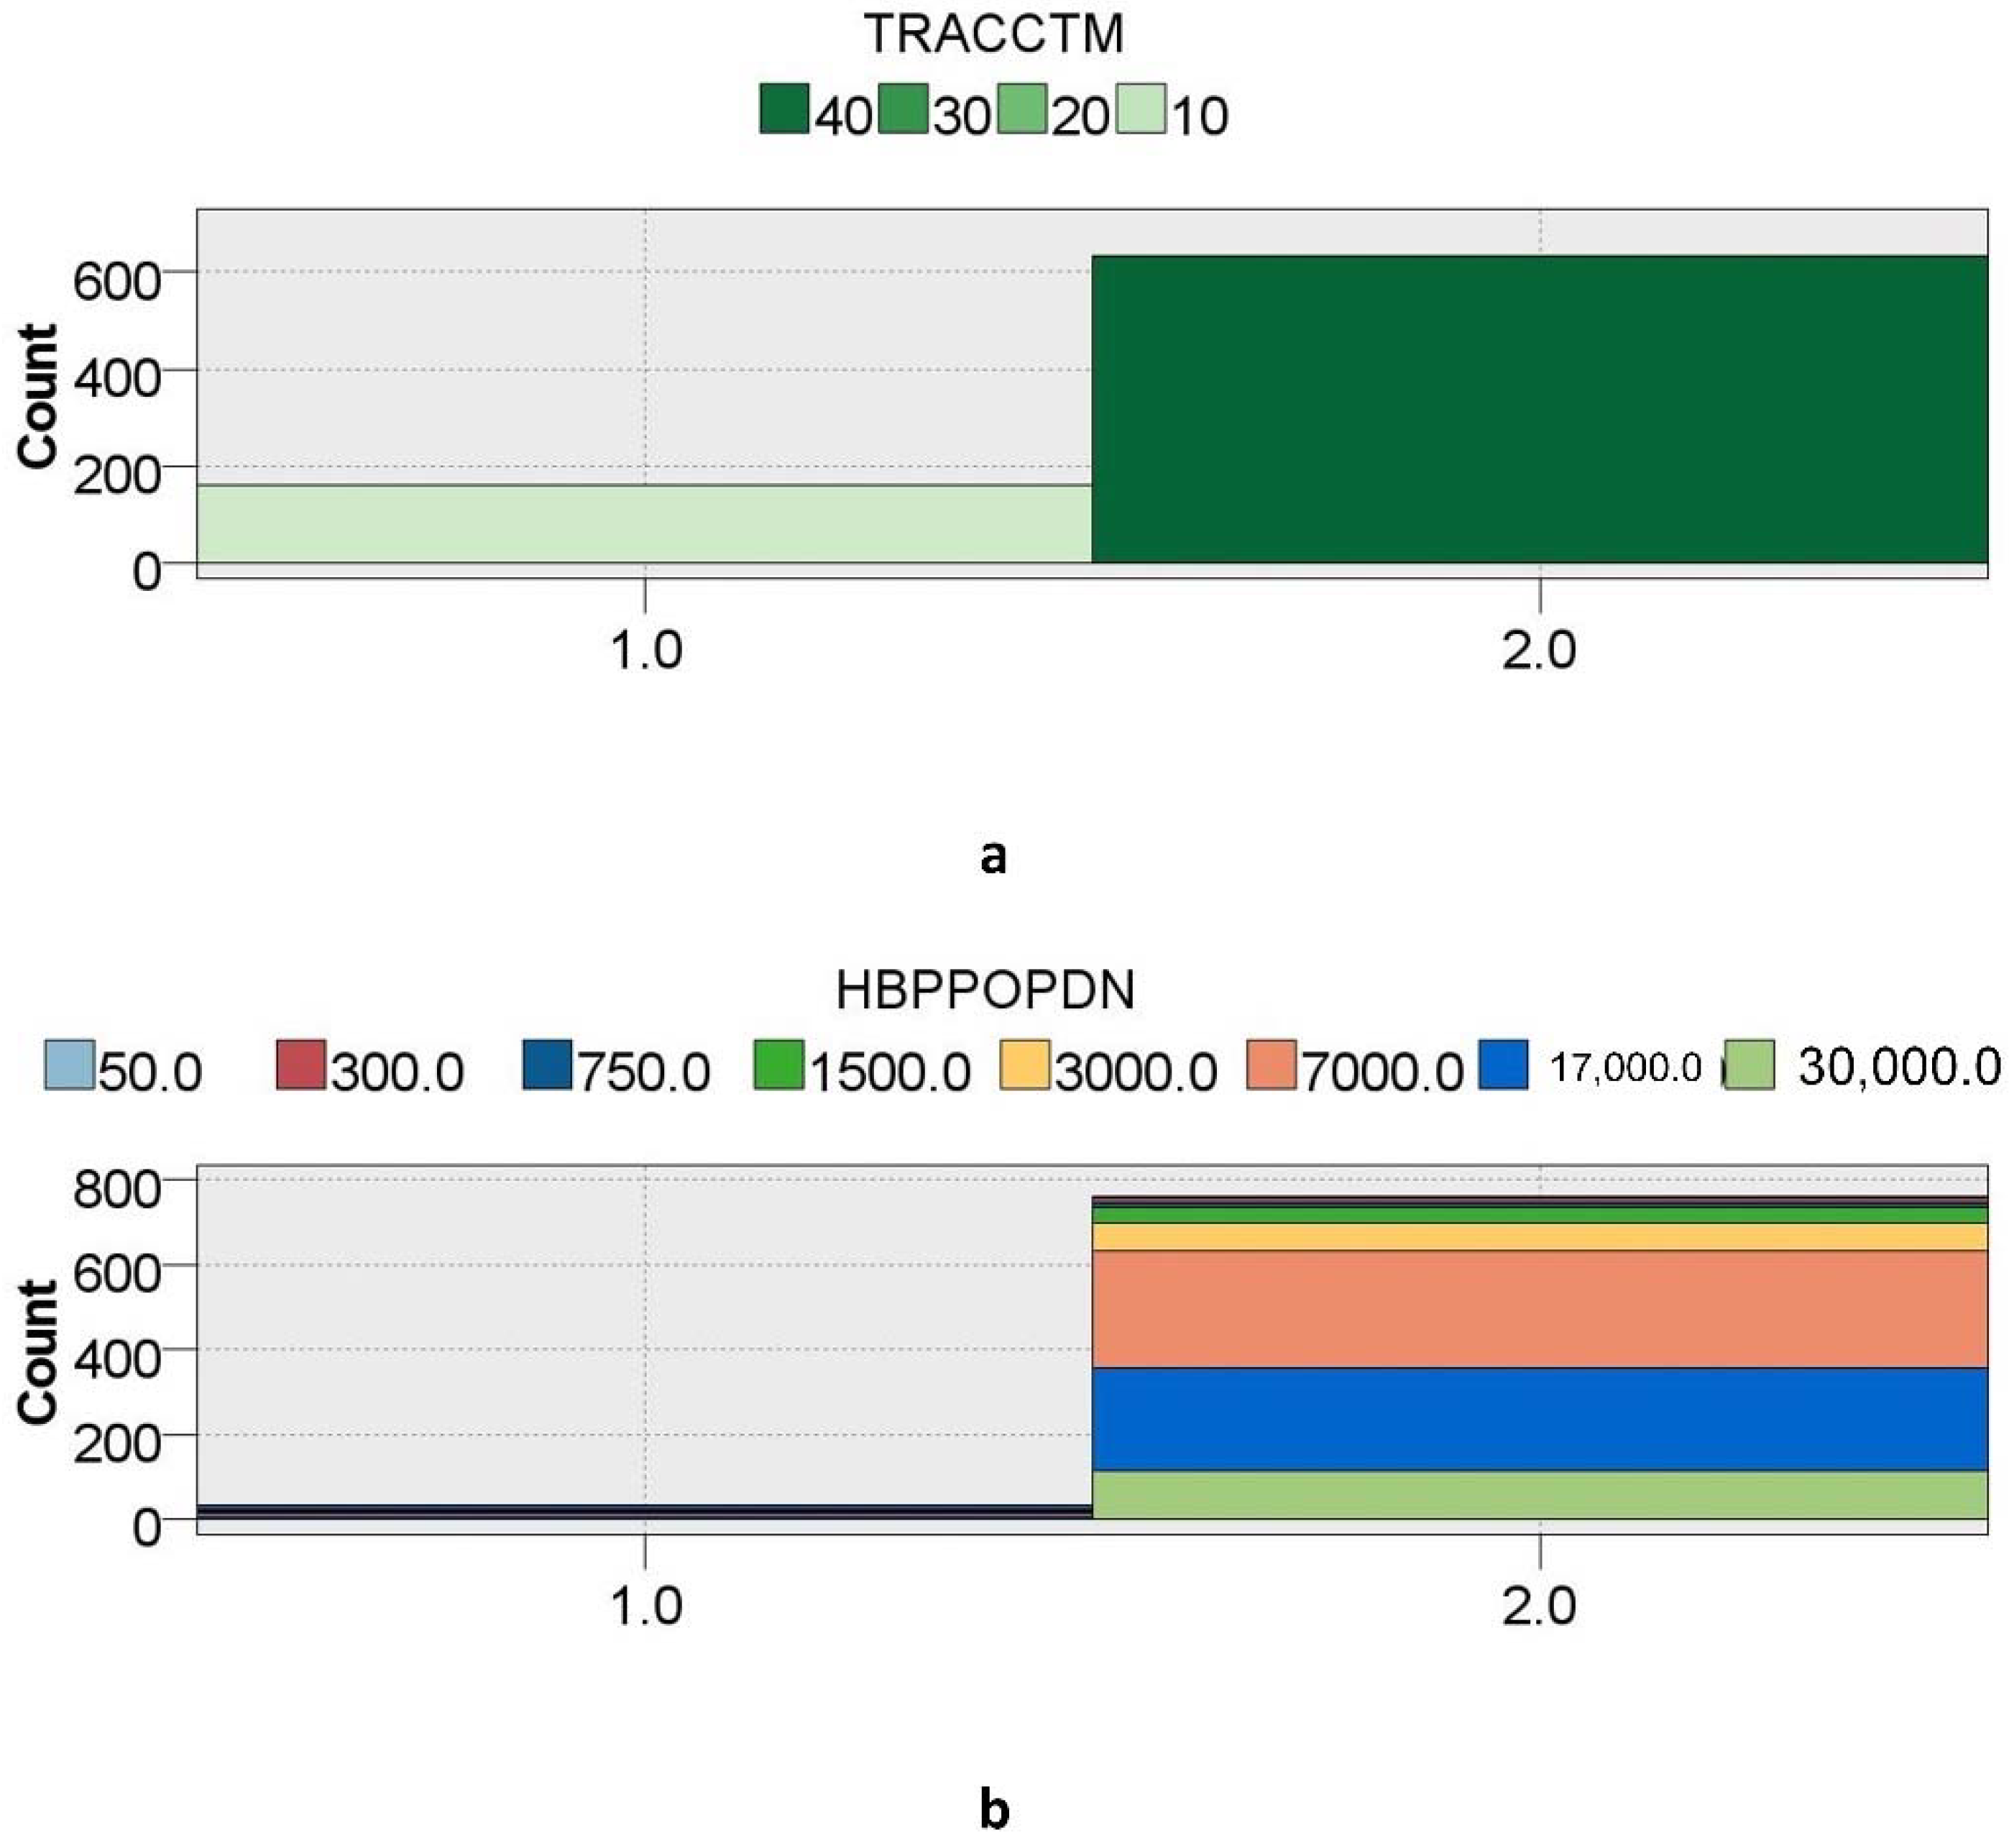
Category of population density (persons per square mile) in the census block group of the household’s home locationHBPPOPDN0–99 (50), 100–499 (300), 500–999 (750), 1000–1999 (1500), 2000–3999 (3000), 4000–9999 (7000), 10,000–24,999 (17,000), and 25,000–999,999 (30,000)
Individual and household attributes (IHA)
Educational attainmentEDUCLess than a high school graduate (1), high school graduate or GED (2), some college or associated degree (3), bachelor’s degree (4), graduate degree or professional degree (5)
Household incomeHHFAMINCless than USD 10,000 (1), 10,000–14,999 (2), 15,000–24,999 (3), 25,000–34,999 (4), 35,000–49,999 (5), 50,000–74,999 (6), 75,000–99,999 (7), 100,000–124,999 (8), 125,000–149,999 (9), 150,000–199,999 (10) and 200,000 or more (11)
AgeAGE16–75
GenderSEXmale (1) and female (2)
Owned vehicle longer than a yearVEHOWNEDyes (1) and no (2)
Number of workers in householdWRKCOUNT1–4
Work attributes (WA)
Flexibility in work arrival timeFLEXTIMEyes (1) and no (2)
Count of days working from home in the last monthWKFMHMXX0–16
Full-time or part-time workerWKFTPTfull time (1) and part time (2)
Option of working from homeWKRMHMyes (1) and no (2)
Work trip attributes (WTA)
Road network distance, in miles, between respondent’s home location and work locationDISTTOWK170–399.07
Minutes spent commuting to workPUBTIME0–50
Trip time to work in minutesTIMETOWK0–170
Trip time to transit station in minutesTRACCTM0–70
Target variable
Walk as mode used to reach public transit stationTRACC_WLKyes (1) and no (2)
POV as mode used to reach public transit stationTRACC_POVyes (1) and no (2)
Table 3. Models’ performance.
ModelTrainTest
Correct (%)Wrong (%)Correct (%)Wrong (%)
TRACC_WALK94.945.0694.485.52
TRACC_POV96.523.4896.933.07
Table 4. Importance of the various types of variables.
Factor TypeVariableWalkPOV
Health condition attributes (HCA)
HCACONDPUB0.030.04
HCACONDRIVE0.020.04
HCAHEALTH0.020.05
HCAMEDCOND60.020.04
Built environment characteristics (BEC)
BECHBPPOPDN0.030.12
Individual and household attributes (IHA)
IHAEDUC0.050.05
IHAHHFAMINC0.070.05
IHAAGE0.050.08
IHASEX0.020.05
IHAVEHOWNED0.020.03
IHAWRKCOUNT0.060.07
Work attributes (WA)
WAFLEXTIME0.020.07
WAWKFMHMXX0.000.00
WAWKFTPT0.000.06
Work trip attributes (WTA)
WTADISTTOWK170.030.03
WTAPUBTIME0.040.03
WTATIMETOWK0.050.09
WTATRACCTM0.420.07
WTAWKRMHM0.040.03
Table 5. Cumulative importance of factors.
Factor TypeCumulative Importance
WalkPOV
Health condition attributes (HCA)0.100.17
Built environment characteristics (BEC)0.030.12
Work trip attributes (WTA)0.580.25
Work attributes (WA)0.020.13
Individual and household attributes (IHA)0.270.33
Sum1.001.00
Publisher’s Note: MDPI stays neutral with regard to jurisdictional claims in published maps and institutional affiliations.

