Article

Developing an Objective Framework to Evaluate Street Functions

by
Abbas Sheikh-Mohammad-Zadeh
*,
Nicolas Saunier
and
E. O. D. Waygood
Civil, Geological and Mining Engineering Department, Polytechnique Montreal, C.P. 6079, succ. Centre-Ville, Montreal, QC H3C 3A7, Canada
*
Author to whom correspondence should be addressed.
Sustainability 2022, 14(12), 7184; https://doi.org/10.3390/su14127184
Submission received: 14 May 2022 / Revised: 5 June 2022 / Accepted: 7 June 2022 / Published: 12 June 2022
(This article belongs to the Collection Urban Street Networks and Sustainable Transportation)

Abstract

:
Urban street networks are a vital part of urban areas and have a remarkable influence over quality of life and the use of sustainable modes. They make up about 80% of public space and shape urban activities and identity. Therefore, it is crucial to design, develop, and maintain streets in such a way as to make the most of this large and important space in a sustainable manner. Streets have three main functions: to provide access to adjoining properties, to allow transit of users on their way from their origin to their destination, and to provide space for social activities. As such, there is a need to develop indicators, methods, and tools to evaluate how streets fulfill their functions. However, most of the previously developed frameworks rely on measuring the physical environment and transportation facilities, which reflect the potential use of streets, as opposed to their actual use. To address this gap, the main objective of this paper is to propose a holistic and objective framework to evaluate streets based on their actual use by all users. The proposed framework is developed based on direct user observation to assess the various street functions (i.e., transit, access, and place) using objective indicators at a microscopic (individual) level. The developed framework and tools build on street use evaluation by diverse disciplines such as transportation engineering, urban planning, and public health. It will help transportation agencies and urban planners to manage streets and public spaces so that they fulfill their expected functions while minimizing the negative impacts.

1. Introduction

An urban area is usually composed of a number of interrelated infrastructures developed to accommodate the basic needs of urban dwellers. Among these various infrastructures, the transportation system plays a unique role because of its effects on developing and structuring the built environment. Urban roads and streets—as the main part of the urban transportation systems—comprise about 80% of public spaces in cities [1,2].
Over the past 100 years or so, the main functions of streets have been considered to be transit and access, while the place function has been gaining consideration for more than a decade [3]. The transit function relates to the ability of streets to provide road users (pedestrians, cyclists, public transit passengers, drivers, etc.) safe and efficient movement on their path from origin to destination with minimum disruption [4]; this function is also known as movement [5,6], mobility, and link [7].
Except for some kinds of movements (e.g., jogging), in which movement is an end in its own right, access is the main goal of transportation (e.g., [8]). So, providing direct access to the adjoining buildings, facilities, and open spaces for all street users, including pedestrians [9], cyclists, emergency services (e.g., fire services and ambulances) and waste collection [3], is another function of streets that typically distinguishes urban streets from other roads and highways [3].
Although accommodating movement along a street might be considered its primary function from a transportation point of view, many streets (or their abutting public spaces) are also destinations in their own rights. This characteristic of streets—known as the place function—is related to their propensity to encourage social activities [3]. It means that people not only use streets to reach their destinations but also do some activities such as shopping, talking with others, resting, trading, eating, observing, strolling, and playing [10]. The place function of streets could be as important as or even more critical than their movement function [3].
The importance of place is underscored by the multidisciplinary efforts to create and manage public spaces to encourage this function, called placemaking. In a review of studies on street design, Hassen and Kaufman [11] examined how it relates to community engagement. Their review found that Aesthetics and Upkeep, Access to Resources/Facilities, Security and Safety, and Walkability were the most common impacts studied. Other relevant topics included Traffic Flow and Calming as well as Placemaking. These impacts are directly related to the three street functions. That review highlighted a number of relevant research needs: the need for a framework to help better understand the impacts of interventions, that a range of methods and measures makes comparison difficult, and the need for metrics to include impacts on all members of society.
There is a natural tension [5] between the three street functions. The trade-off between transit and access functions is well-known and is found as a fundamental theory in many road design manuals. For example, a highway has high transit, but no access; a residential road has low transit and high access [12].
Similar trade-offs between the place and other functions can be found; for example, developing the place function in a street may require implementing traffic calming measures that are likely to affect the transit function. In this regard, Figure 1 illustrates how we can expect some types of roads or urban streets to be located along the three dimensions of the street functions, namely transit, access, and place. This schematic diagram is a hypothetical example, so there is no specific reason for the mentioned street types to follow this pattern exactly (e.g., having equal access and place functions). Yet, how the functions are measured and where various types of streets may be located is largely unknown.
In addition, there is some fundamental confusion between measures about street characteristics, such as the space allocated to each function [1], and measures of the actual use of streets. It is often stated, “build it and they will come”, but it is not always the case, and the impacts of changes need to be measured objectively. To take a typical example, it is not necessarily true that because a street is made more walkable by widening the sidewalk that pedestrian traffic will increase or that more activities will occur in that space because a new square is built. More supporting examples from previous studies in this regard are provided in Section 2.1.
Given the vast spatial extent of streets and their importance for the quality of life in urban areas [13], it is therefore crucial to observe directly how they are used, i.e., how well they perform their functions. Developing indicators, methods, and tools to that end makes it possible to design, develop, and maintain streets in such a way as to make the most of this large space in urban areas where the space is usually limited. In order to achieve this goal, it is necessary to identify trends, predict potential problems, evaluate interventions, and measure progress toward predefined objectives [14].
The main purpose of this paper is to present a comprehensive framework of objective indicators for the holistic and integrated assessment of the functions of streets at the microscopic (individual) level based on their observed use. This paper is organized into four sections. The next (Section 2) will present a literature review on transportation indicators (Section 2.1) and also existing protocols, frameworks, and audit tools for evaluating streets use (Section 2.2); Section 3 will introduce a framework to evaluate the functions of streets (Section 3.1) and elaborate on the methodology for data collection and indicators (Section 3.2). Finally, the conclusion and future works will be discussed in Section 4.

2. Literature Review

2.1. Transportation Indicators

In order to improve transportation systems, it is necessary to evaluate and measure different aspects of them [15,16] using appropriate qualitative or quantitative variables (indicators) to identify trends, evaluate solutions, and appraise progress toward the predetermined objectives [14]. In this regard, the selected (or developed) indicators should be relevant, measurable, sensitive, and interpretable [17]. When measuring the street functions, the indicators can relate to either:
  • the characteristics of the transportation system and the built environment, or
  • the movements and the activities of the street users.
The former are expected to influence the latter, although many changes to those can occur and how (or even whether) those changes affect the different functions of a street is not always known until implemented and studied.
Furthermore, the existing indicators to evaluate the streets can be classified into two broad categories, namely subjective and objective [18]. Subjective indicators are based on questions asked to street users and their answers, while objective indicators are based on the direct observation of street users, transportation facilities, or the built environment.
Subjective indicators usually quantify the self-reported usage (i.e., the frequency of visits) and the perception of people about the available transportation facilities and their shortcomings [18]. These indicators can come through qualitative methods such as interviews and focus groups but can also be quantified through questionnaires to sample larger populations. As people experience things differently, these measures capture personal attitudes, tastes, preferences, and feelings of the respondents. However, they may be biased or affected by various sources of error including social desirability, social approval, and recall bias [19]. As a result of such biases, certain behaviors or uses of the space may not be correctly reported, such as the adherence to speed limits or the frequency of stopping to chat.
On the other hand, objective indicators measure things that are observable such as street users (e.g., their attributes, movement, volume, density, type of activity, etc.), transportation facilities (e.g., sidewalk, cycling path, etc.), and also built environment characteristics (e.g., block size, land use mix, etc.). The objective measures usually rely on systematic observations for the street users (e.g., pneumatic tubes to measure the passage of vehicles) or audit tools for quantifying the features of built environment [18]. Objective indicators about the transportation facilities and built environment features are related to potential use, while the user observations reflect the actual use of streets. User observations can be obtained manually by trained observers with clear guidelines to improve consistency or automatically through sensors. The choice of the data collection method depends on the performance of sensors (with appropriate automated processing) and observers, which, in turn, depends on the task, the type of observations, and the context.
These categories of street function indicators are summarized in Table 1 in terms of what the indicators measure and how they measure. It also includes examples of tools that are used to obtain the data for each category of indicators (the tools are discussed in more details in the next section). These distinctions are important as transport agencies and cities often lack the time and resources to conduct studies of actual use for their facilities and rely instead on their characteristics as a proxy of expected use.
However, a review of the studies in this field showed that the relationships between street characteristics and their actual use are not straightforward. For example, it is questionable whether providing walking or cycling facilities will increase the number of people walking or cycling. The study carried out by Brownson et al. [20] showed that the construction and promotion of walking trails may encourage leisure walking, particularly among women and low-income people. On the other hand, some studies reported that the presence of a large number of walking and cycling facilities does not necessarily lead to a higher share of trips by foot or bike [21]. Other parameters such as people’s perception about their physical environment as well as the social and psychological factors likely influence use [22,23,24].
Although the built environment has been found to influence active travel (e.g., [25]), there is, for instance, no agreement on the effect of street connectivity, aesthetic properties, and block size on walking. While Gómez et al. [26] showed that there is a negative association between street connectivity and walking, Badland et al. [27] identified street connectivity as a factor that has a positive effect on adults walking. Regarding neighborhood aesthetic attributes, some studies [21,28,29] find that aesthetic properties are an effective parameter to encourage people to use streets. Contrary to such findings, Hoehner et al. [30] concluded that this parameter is negatively associated with walking and cycling for transportation. Furthermore, as for block size and density of the built environment, Saelens et al. [31] reported that people living in dense districts with short block length are more likely to walk, while the study conducted in [32] showed that the effect of this factor is “modest to non-existent”, if not negative.
Consequently, it seems that relying solely on the potential factors or on user perception, as done in many studies, cannot yield reliable and uniform results about the use of streets in different contexts. In many cases, transport planners and engineers likely want to know whether the change in street design has the desired outcome, whether that be facilitating the transit function or promoting the place function. Thus, in addition to measuring the potential or subjective factors, it is necessary to observe street users directly employing a set of unbiased, robust, and independent indicators to adjust the results of these measurements.

2.2. Existing Tools for the Assessment of Street Use

In the past decades, there have been many studies about street functions, in particular to identify factors affecting the use of streets. An overview of the conducted studies in this field shows that there is a wide range of variables affecting how people use streets. Wang et al. [33] identified four major categories of factors affecting street use in their literature review:
  • physical environment (i.e., transportation facilities and built environment characteristics)
  • natural environment (e.g., inclement weather, topography, etc.)
  • personal factors (e.g., age, gender, health condition, etc.)
  • social factors (i.e., social cohesion, crime rate, etc.)
In order to evaluate how these factors are related to the street functions, several researchers and institutes have developed various methods and indicators. This section provides a comprehensive review of existing protocols, audit tools and frameworks in terms of their method, target users, and the street functions they cover, as summarized in Table 2.

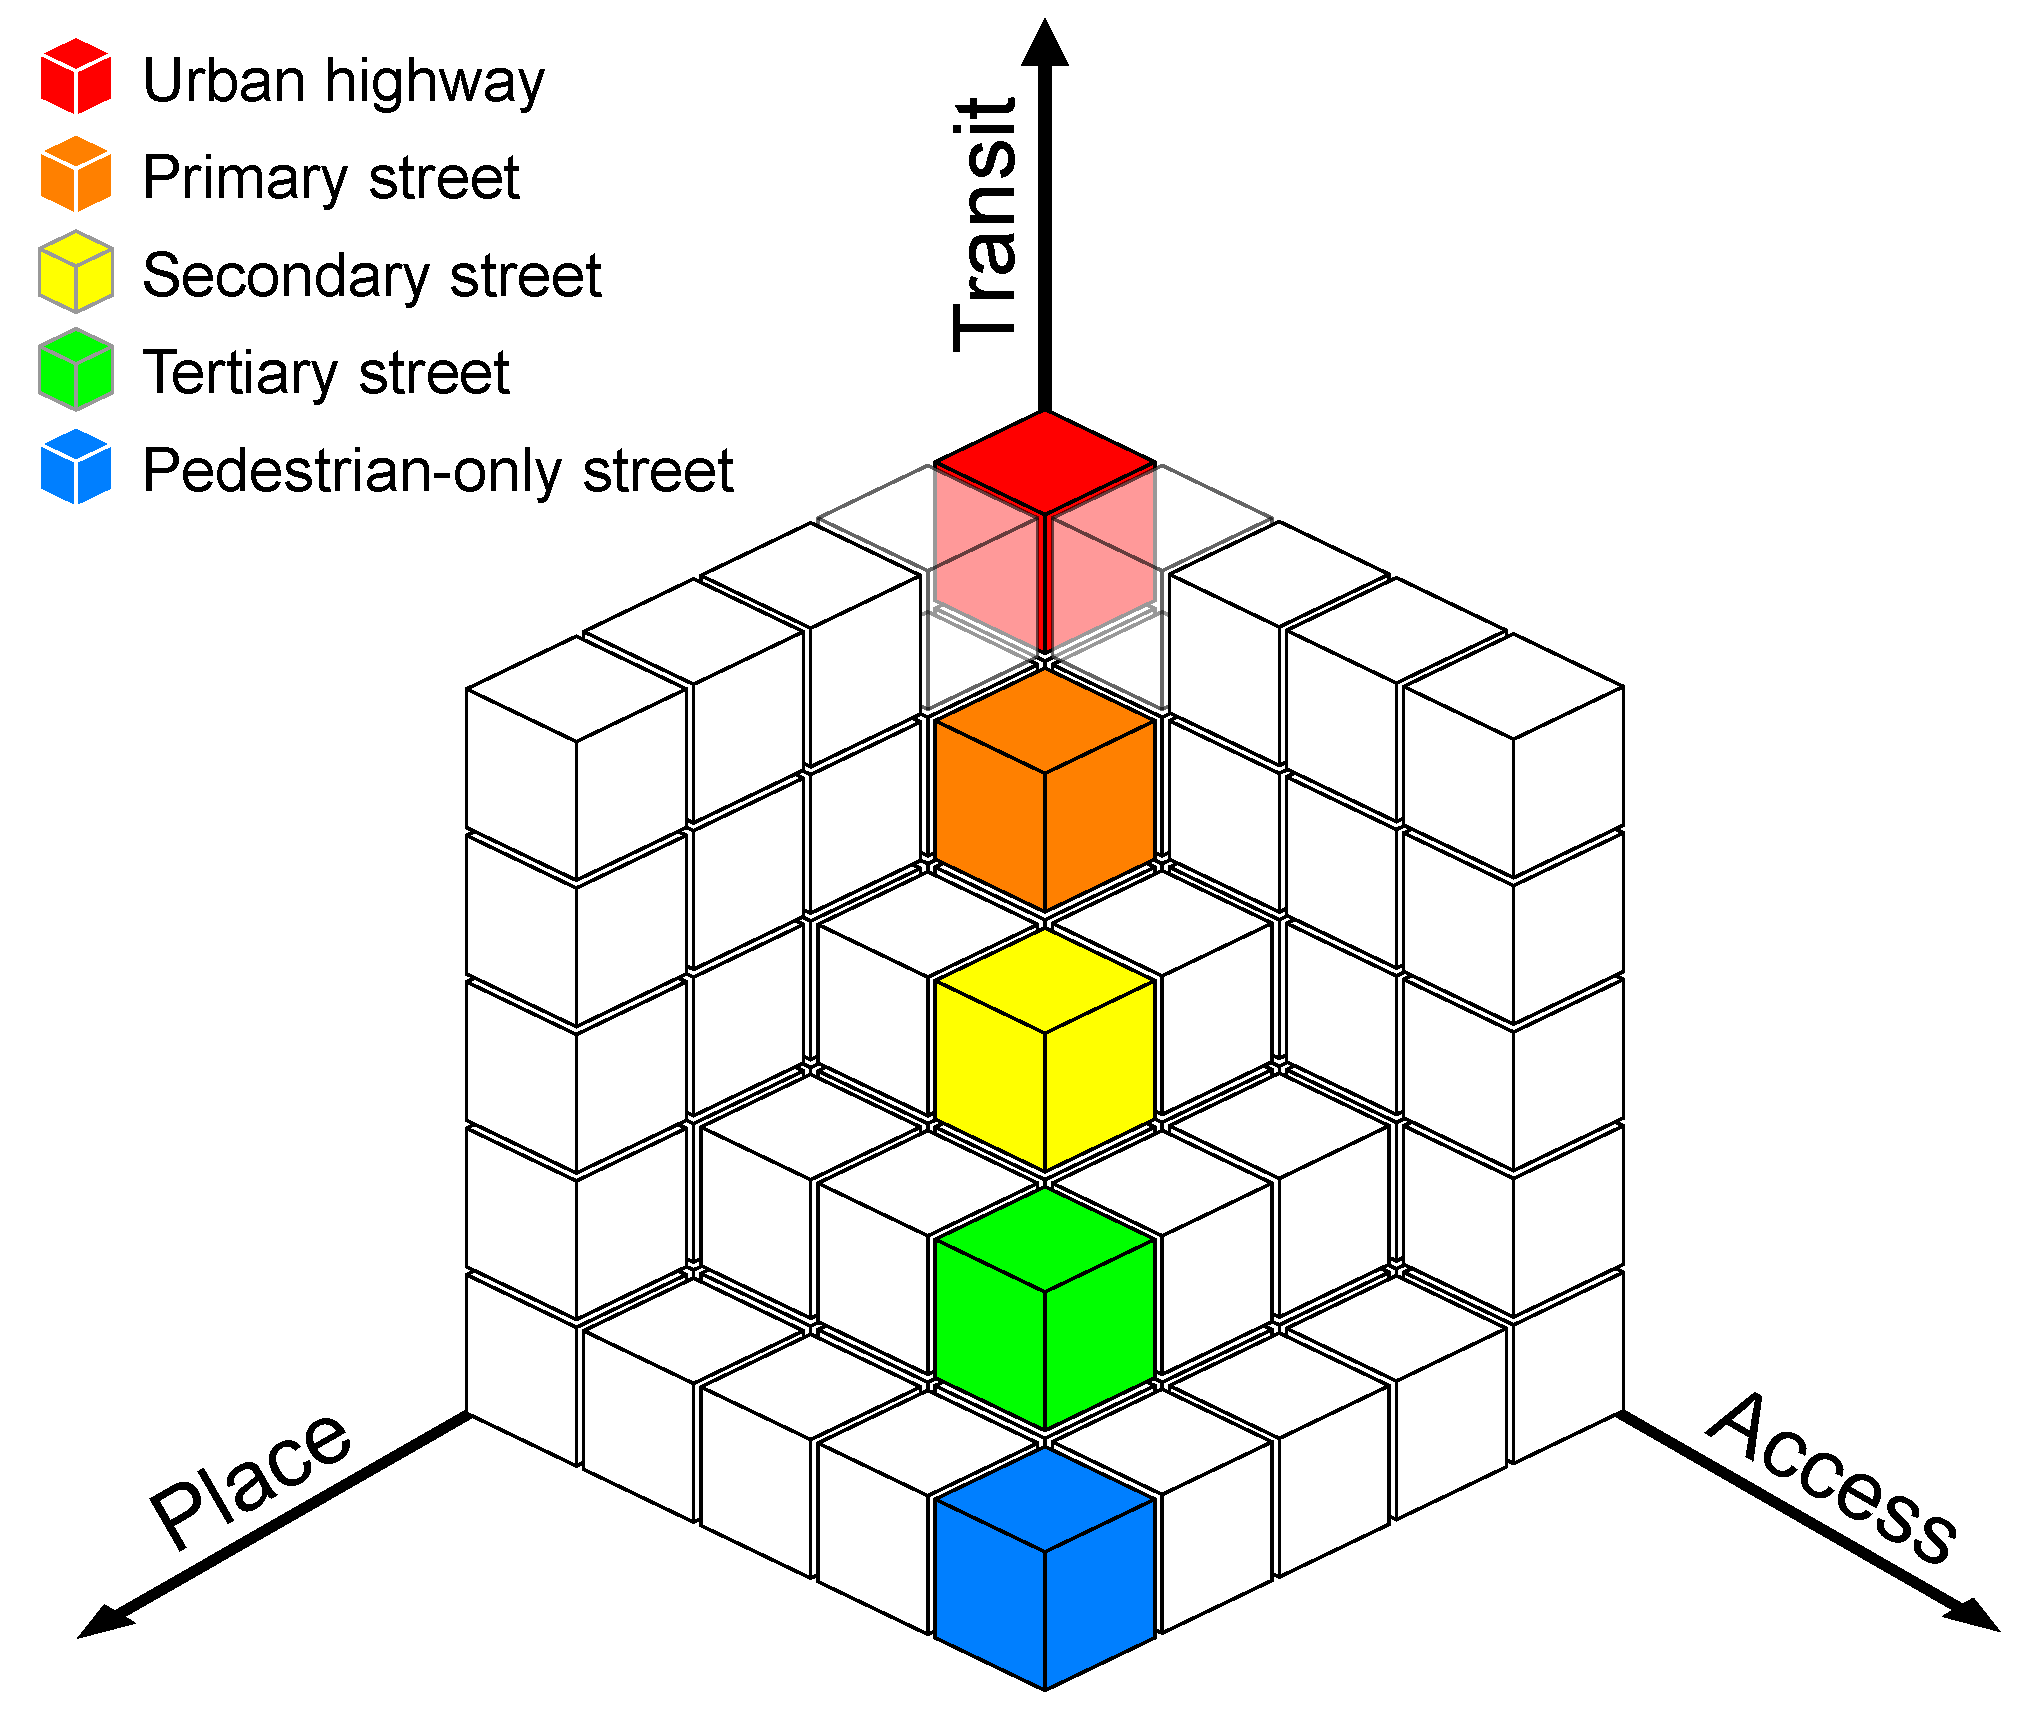
2.2.1. Primary Focus Is Motor Vehicle Traffic

The Traffic Data Computation Method Pocket Guide, developed by Federal Highway Administration [34], is a reference of indicators used to evaluate vehicular traffic and is commonly taught and applied by traffic engineers. This guide provides forty-eight indicators for the operational assessment of roads and streets. Such a guide is a traditional engineering guidebook on measuring the transit of motorized vehicles. It includes indicators such as the 85th centile spot speed, the annual average daily traffic, and headways, which are all motor-vehicle-based measures. Although in common use, it essentially ignores other street functions and other street users such as pedestrians and cyclists. Given the historical focus of traffic engineering on measuring the transit function of streets almost exclusively for motor vehicles, other users and groups of interest have aimed to develop frameworks to better capture other street users and street uses. The remainder of the section will discuss a number of such efforts.

2.2.2. Primary Focus Is Non-Private Motor Vehicle Users

The Global Street Design Guide is a set of baselines for designing urban streets in favor of pedestrians, cyclists, and transit riders [35]. This guide provides a methodology and an indicator framework to evaluate the performance of streets in terms of physical and operational changes, shifts in use and function, and resulting impacts [36]. Although the framework covers all street users, it is a group of microscopic and macroscopic level indicators that makes it difficult to pick suitable indicators at different scales.

2.2.3. Primary Focus Is Non-Motorized

The open Public Life Data Protocol (PLDP) [37] developed by the Gehl Institute is likely one of the most famous standardized tools to measure the social activities in public spaces including streets, parks, plazas, etc. The PLDP has been applied in many studies and projects all around the world. This protocol is a data specification and a set of indicators developed to provide a common format to collect, store, and share the data on public life gathered through manual observation or by using sensors. Eight survey components (i.e., gender, age, mode, groups, posture, activities, objects, and geotag (i.e., spatial coordinates)) are defined in this protocol and can be adopted to study stationary activities or moving people. This protocol provides a survey worksheet to conduct interviews with people who use public spaces. Although the PLDP is a complete framework for counting passing pedestrians and cyclists and their activities (thus, the place function of a street), it is not designed to capture motorized vehicle use (e.g., cars, trucks, etc.), despite the large share of public space allocated to them.
The National Transport Authority [38], as a noncommercial body of the Department of Transport in Ireland, developed the Universal Design Walkability Audit Tool to measure the degree to which streets are friendly for people to do activities such as walking and spending time through socializing, shopping, etc. This audit tool is designed to record the attributes of street users (i.e., age, gender, and ability range), evaluate the condition of sidewalks, and also survey the local facilities and services. Furthermore, this audit tool evaluates the behavior of drivers (e.g., speeding, failing to yield to pedestrians on crosswalk, etc.) and also cyclists and scooters (e.g., cycling or scooting on sidewalk, failing to stop at red lights, etc.). It also identifies safety issues in the streets. Although the audit tool considers vehicle behavior, it does not keep count of motorized vehicles, people’s activities, nor access.
The Federal Highway Administration in the United States provides two Road Safety Audit (RSA) tools for pedestrians [39] and cyclists [40] as a formal safety examination of in-service or future roads and streets. These audit tools evaluate the safety of pedestrians and cyclists in terms of presence/availability of accommodations, design, operation, quality, obstruction, roadside, continuity/connectivity, lighting, visibility, signs, signals, and human factors/behavior.
The Systematic Pedestrian and Cycling Environmental Scan (SPACES) is an audit tool developed to measure built environment features correlated with walking and cycling [41]. This framework does not cover all street users and is thus lacking measures related to motorized vehicles. Furthermore, it just provides some measures to evaluate the physical factors that potentially affect street use and does not assess the (vehicular) transit, access, and place functions.
The National Bicycle and Pedestrian Documentation (NBPD) is a guide to count and survey pedestrians and cyclists in street segments and intersections [42]. The objectives of this guide are to establish a standard survey methodology and also a national database for pedestrians and cyclist data to study the trends and explore the correlation between activities and potential affecting factors. This guide also provides some standard count worksheets and survey forms for pedestrians and cyclists in street segments and intersections.
The American Association of Retired Persons [43] developed a walk audit tool kit to evaluate the walkability of streets in terms of built environment features, driver behavior, street safety, comfort, and appeal. This audit tool provides a worksheet to keep count of pedestrians, cyclists, and skateboarders. However, this audit tool does not keep count of motorized vehicles, activities, nor of access to adjoining buildings; thus, it does not cover the vehicular transit, place, and or access functions.
The Open Streets Initiatives: Measuring Success toolkit [44] is a framework to evaluate the success of pedestrianized (open) streets in terms of participant counts and activities. This framework provides some protocols to count the participants by gender, age, race, and transport mode (i.e., pedestrian, cyclist, skateboarder), as well as to observe how people spend their time in the open streets.
In addition, there is a long list of frameworks developed to assess the walking and cycling environment by evaluating the available facilities and built environment features: Walking and Bicycling Suitability Assessment (WABSA) [45], Active Neighborhood Checklist [46], Microscale Audit of Pedestrian Streetscapes (MAPS) [47], Framework for measuring urban qualities related to walkability [25], Neighborhood Environment Walkability Scale (NEWS) [48], Pedestrian Environmental Data Scan (PEDS) [49], Pedestrian Environment Review System (PERS) [50], Cycling Environment Review System (CERS) [50], Walkability audit tool [51], Walking route audit tool for seniors (WRATS) [52], Walkability Compass [53], Milano Walkability Measurement [54], and Path Environment Audit Tool (PEAT) [55], to name but a few.
Another example audit tool is the “Audit de potentiel piétonnier actif sécuritaire” (PPAS) developed by the public health department of the City of Montreal [56]. It proposes 80 indicators to evaluate the physical characteristics of sidewalks, roadways, and cycling paths and has been applied in several boroughs of Montreal to assess the walkability of streets [57]. Its primary focus is to assess the built environment with respect to its likely support of pedestrians and is not a direct tool to measure street use.
In addition, the “Espace public: méthodes pour observer et écouter les usagers”, is another observation protocol developed by CEREMA in France to study public space users (i.e., pedestrians, cyclists and people using skate, scooter and roller) in terms of their characteristics (i.e., gender and age), location, direction of movement, and activity type [58]. This method also employs questionnaires to collect more data concerning the users’ attitudes, feelings, and perceptions. This framework is designed to evaluate the place function of public spaces (e.g., parks and plazas), so it does not consider motorized vehicles. All of these walkability and bikeability frameworks are developed based on measurement of potential factors affecting street use and by definition only cover pedestrians or cyclists.
A summary of the reviewed frameworks and tools is provided in Table 2 in terms of the types of observations and target street users. The types of observations fall into five main categories as follows:
  • Physical Environment Audit (PEA): indicators used to evaluate the presence or condition of the physical transportation facilities, the characteristics of the built environment and the available services
  • Subjective Assessment/Questionnaire (SAQ): indicators aimed to assess how much street users perceive a street as a suitable environment for walking, chatting, spending time, etc.
  • Street User Count (SUC): indicators based on counting street users by their characteristics including age, gender, disability, etc.
  • Street User Behavior (SUB): indicators applied to evaluate the interaction among street users, e.g., number of drivers who do not yield to pedestrians or stop at the crosswalk [38,43]
  • Street Users Activity (SUA): indicators to assess the place function of streets by observing street users’ activities including jogging, resting, playing, etc.
One can consider the SUC to be related to the transit and access functions, while the SUB and SUA are related to the place function.
The summary of the reviewed frameworks provided in the Table 2 gives a few insights. The first point is that none of the developed protocols and audit tools cover all street functions and street users (i.e., motorized vehicles, pedestrians, and cyclists) in a single framework. Furthermore, the basis of most frameworks in street use assessment is the Physical Environment Audit (PEA), which, as discussed earlier, should not be confused with the actual use of streets. In addition, only a small number of frameworks consider user activities (SUA) in street evaluation. The last point is the reliance on subjective measures instead of direct observations of street users in many frameworks, which can lead to an inaccurate evaluation of streets.
Table 2. Comparison of frameworks in terms of observation, target users, and street functions.
Protocol or Audit Tool NameObservation CategoriesTarget Street UsersStreet Functions
PEA 1SAQ 2SUC 3SUB 4SUA 5PedestrianVehicleCyclistTransitAccessPlace
Public Life Data Protocol (PLDP)
Global Street Design Guide
Systematic Pedestrian and Cycling Environmental Scan (SPACES)
AARP walk audit tool kit
Universal design walkability audit tool
Active neighborhood checklist - Protocol
Microscale Audit of Pedestrian Streetscapes (MAPS)
Framework for measuring urban qualities related to walkability
National Bicycle and Pedestrian Documentation (NBPD)
Neighborhood Environment Walkability Scale (NEWS)
Open Streets Initiatives: Measuring Success
Pedestrian Environmental Data Scan (PEDS)
Pedestrian Environment Review System (PERS)
Cyclist Environment Review System (CERS)
Traffic Data Computation Method Pocket Guide
Walking and Bicycling Suitability Assessment (WABSA)
Walkability audit tool
Walking route audit tool for seniors (WRATS)
Audit de potentiel piétonnier actif sécuritaire (PPAS)
Espace public: méthodes pour observer et écouter les usagers
Pedestrian Road Safety Audit Guidelines and Prompt Lists
Bicycle Road Safety Audit Guidelines and Prompt Lists
Path Environment Audit Tool (PEAT)
1 Physical Environment Audit; 2 Subjective Assessment/Questionnaire; 3 Street User Count; 4 Streer Users Behavior; 5 Streer Users Activity.

3. Framework and Methodology

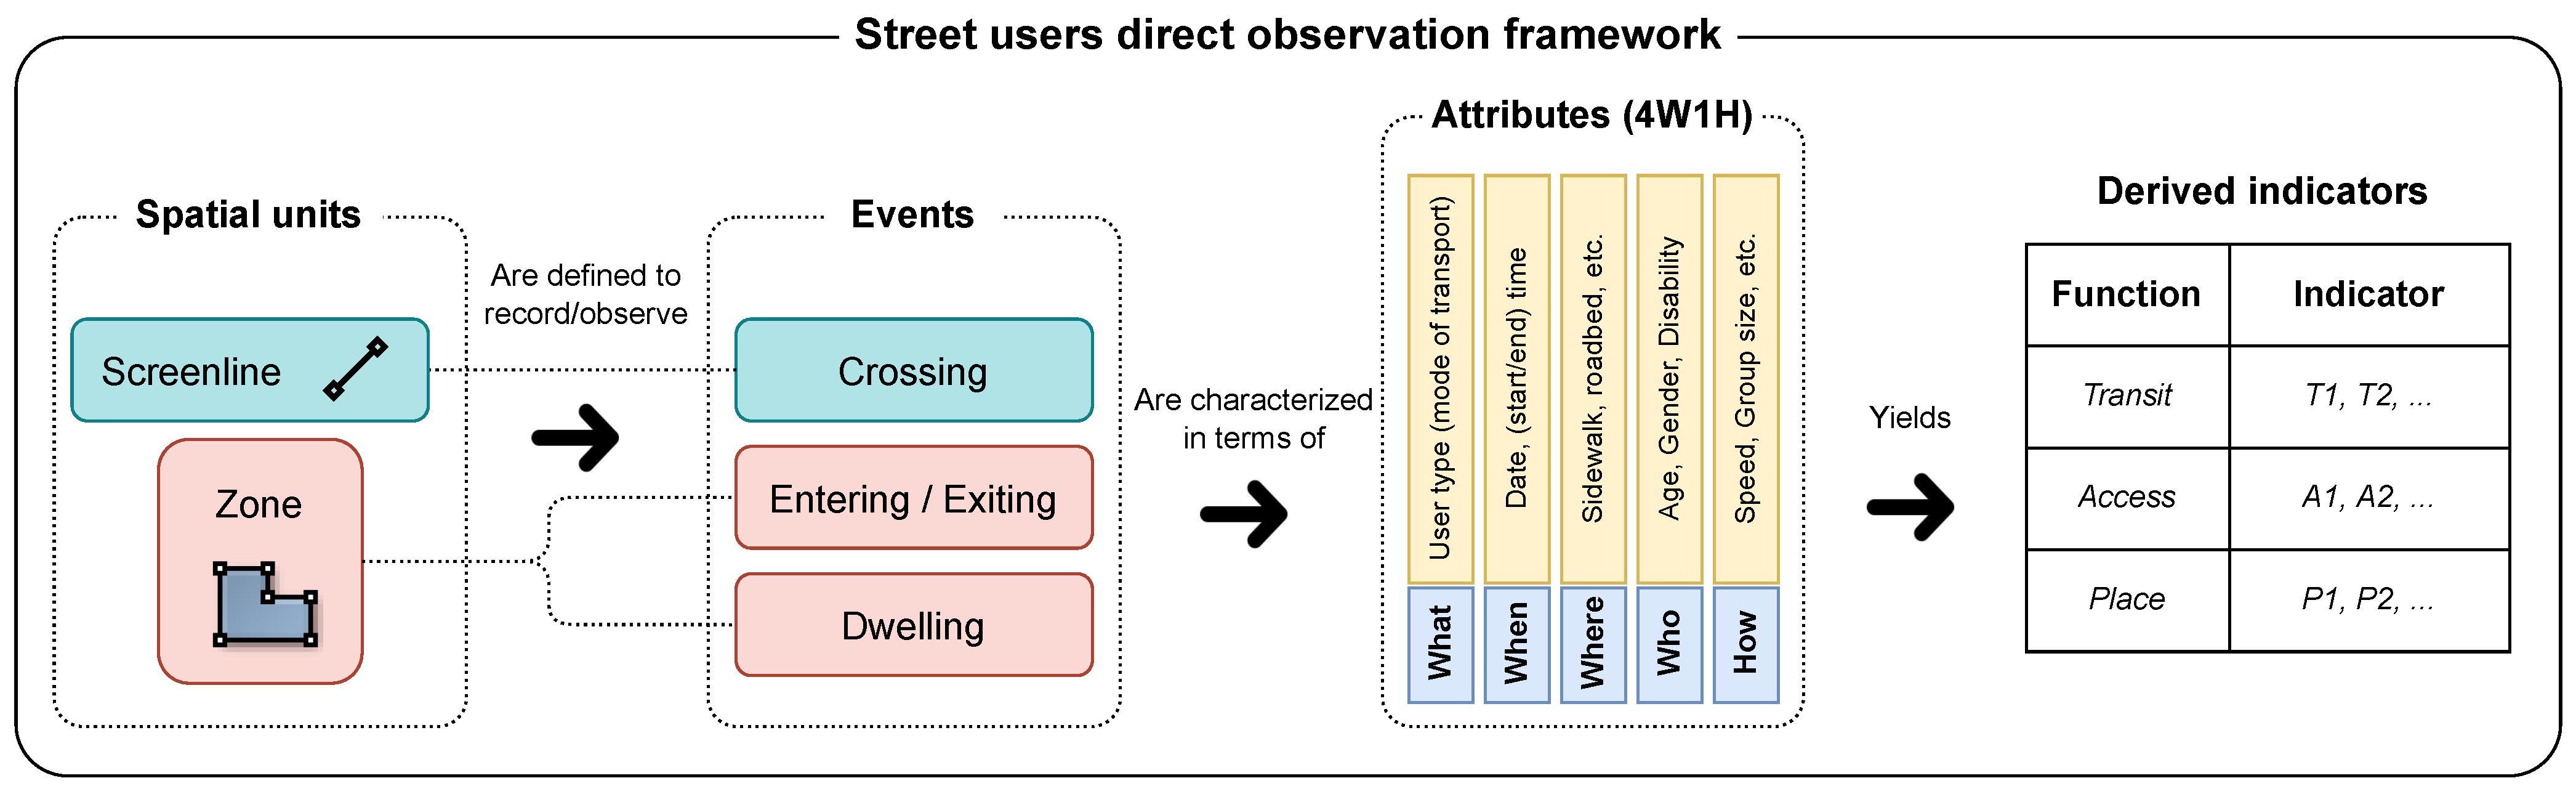
3.1. Proposed Framework

To illustrate the potential complexity of street use, a number of common movements and activities on a hypothetical two-way street are shown using a time–space diagram in Figure 2. In this figure, the spatial features of the hypothetical street (i.e., sidewalks, on-street parking, and a cycling path) are shown on the y-axis and time is represented on the x-axis.
Each sequence of the blocks in the diagram represents the itinerary of a street user and their activities, if any. For example, users numbered 1, 5, and 7 are a pedestrian, a vehicle driver, and a cyclist, respectively; users numbered 3 and 4 are people who came to the street in a car. Furthermore, the related street function (i.e., transit, place, and access) are indicated in this diagram.
The indicator framework proposed in this paper—and illustrated in Figure 3—aims to lay the conceptual foundation and structure the recording of movements, activities, and characteristics of all street users at the individual (microscopic) level to appraise the transit, access, and place functions of streets.
In line with the Public Life Data Protocol (PLDP), two primitive spatial units, namely screenline and zone, are defined to record the user movements and activities. A screenline is a spatial reference to count the users that cross the segment, typically perpendicular to the main direction of movement. For each section of the street (i.e., roadbed, sidewalk, cycling path, bus lane, and so on), a separate screenline can be defined to count passing users by their location. For example, the screenlines associated to the sidewalk and roadbed could be used to count how many cyclists use the sidewalk in comparison with those solely using the roadbed. In order to study events occurring in different parts of a street, an aerial unit, namely zone, is defined in this framework. A zone is a subarea of the study site that is potentially of interest for users and analysts. Zones are aimed to represent public spaces, playgrounds or public squares, adjoining shops or residential buildings, on-street parking lots, bus stops, etc. The primitive spatial units, screenline, and zones can be combined in pairs to define origin–destinations (OD). The choice and creation of screenlines or zones in different parts of a study site depends on the purpose, scale, and the observation method of the study.
Furthermore, three types of events, namely crossing, entering/exiting, and dwelling, are proposed to observe the movement and activity of street users in the proposed spatial units (screenlines and zones). The crossing event denotes crossing a screenline that can be used to count the passing street users considering the direction of movement. Furthermore, crossing the boundary of zones is recorded as an entering/exiting event. In this case, a zone boundary plays the same role as a screenline to count crossings based on the direction. Finally, the stationary events (i.e., sitting, chatting, etc.) are considered dwelling in the zones, if the location of the activity is critical.
Whenever a street user (or a group of users) crosses a predefined screenline or enters (exits from) a given zone, the type and characteristics of that user(s), along with the time, location, and the type of that event are recorded in the form of five basic questions (i.e., what, when, where, who, and how). These five basic questions—known as the 4W1H in information gathering—are listed below, with a typical but nonexhaustive list of attributes to record:
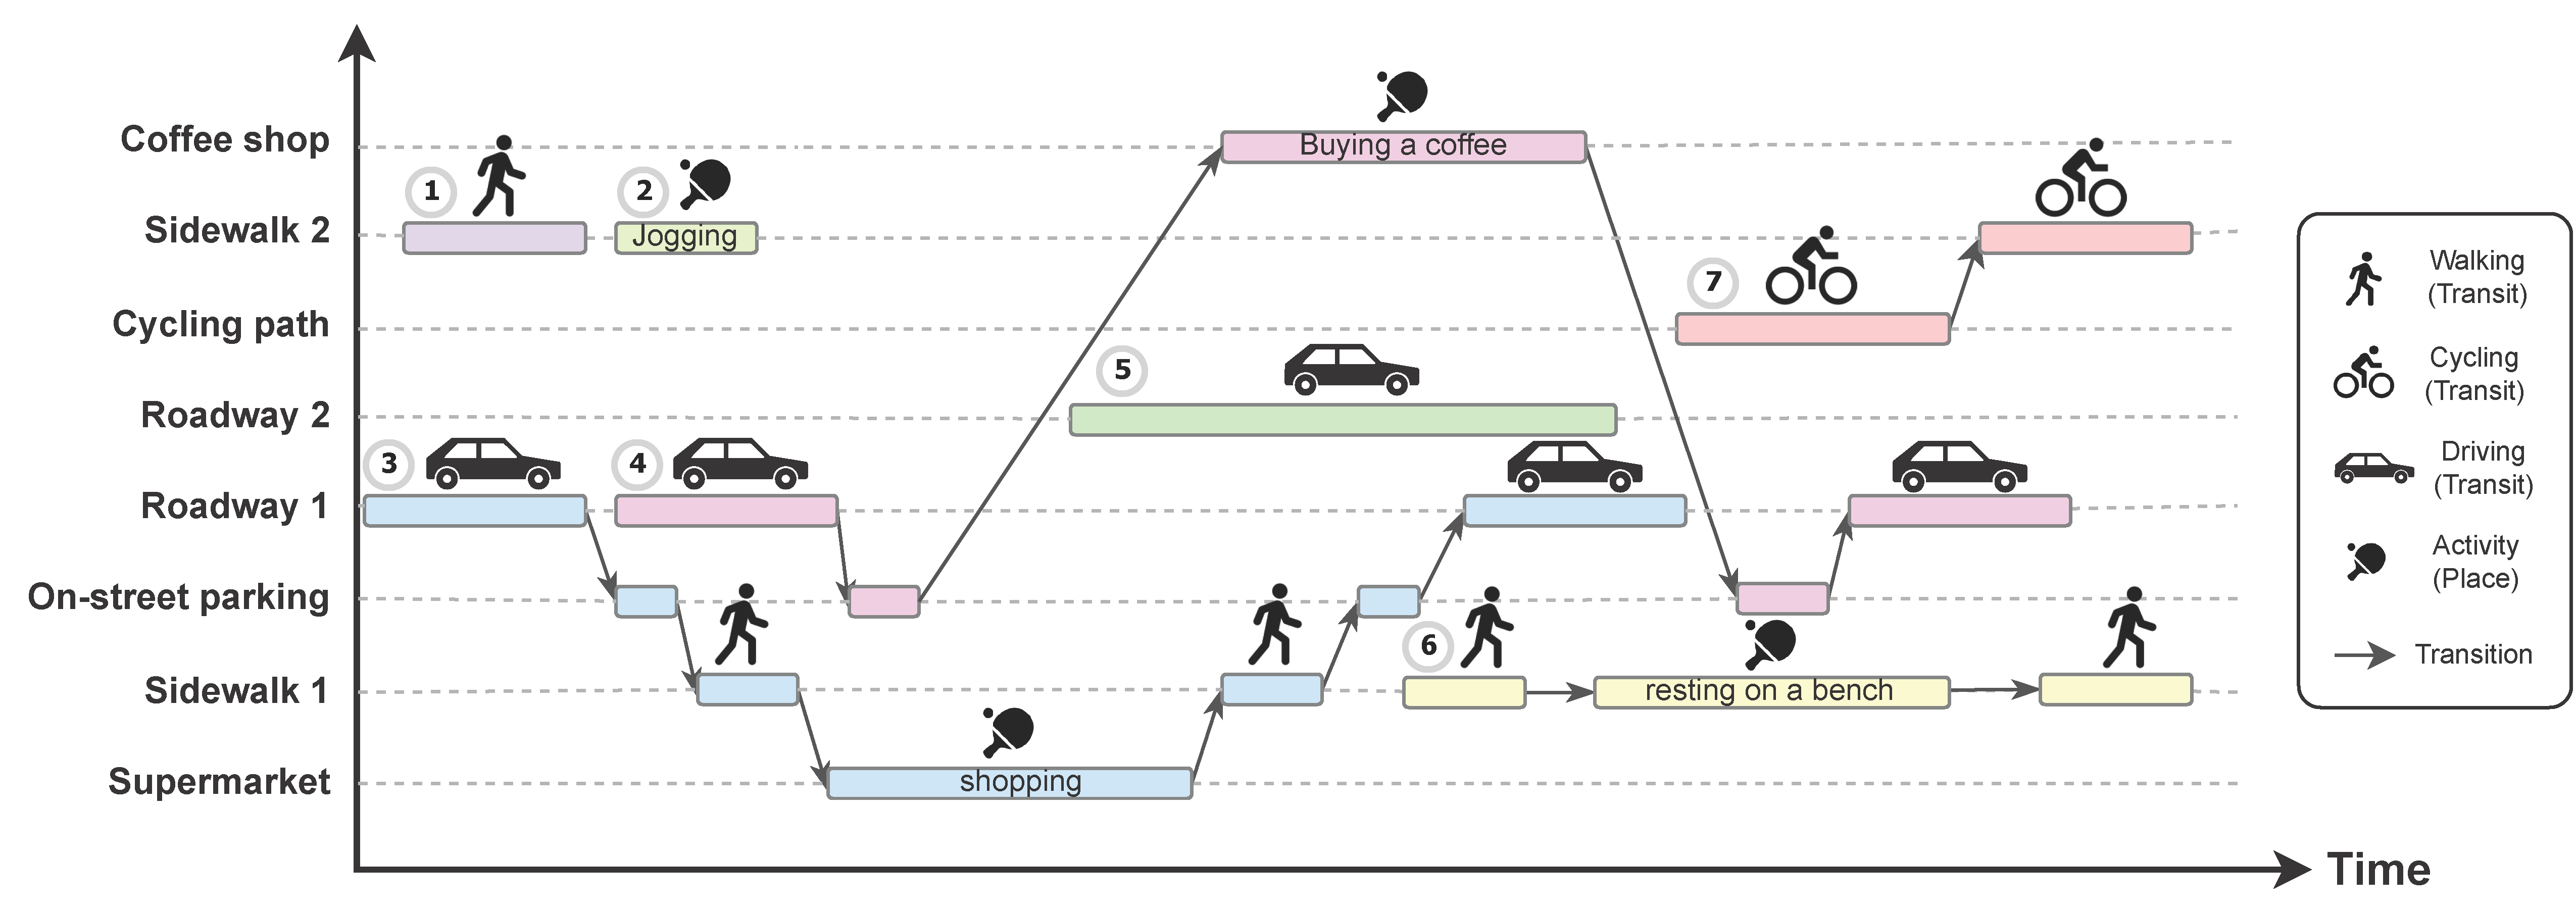
  • What is the observed street user? e.g., pedestrian, car, cyclist, people waiting for bus, jogging, talking, etc.
  • When is the user observed? e.g., date, time, or time span.
  • Where is the user observed? e.g., sidewalk, bus stop, roadbed, adjoining shop, street furniture, etc. that is already determined by the associated screenline or zone
  • Who is the observed user (i.e., the characteristics)? e.g., age, gender, disability, etc.
  • How is the observed user moving? e.g., the speed of movement, the size of the group of people doing the activity, the additional objects (e.g., stroller, bag, food) a pedestrian carries, having a pet, wearing a helmet, etc.
Finally, based on the observed events and their attributes, a set of indicators are derived to assess the three street functions of transit, access, and place. Table 3 shows a generic list of indicators that could be derived to assess the street functions. For each function, the indicators are presented as a physical quantity with the spatial unit at which they are measured. The analysis is done at the microscopic level, such that the quantities are either individual (speed, travel time, delay, duration) or numbers of persons when counting individual events including crossing a screenline, traveling from one zone to another (i.e., origin–destination), being stopped, changing mode, entering a destination, and performing an activity. The quantities can then be aggregated to derive various descriptive statistics such as mean or median speed, travel time, or delay. All indicators in the Table 3 can be segmented by the 4W1H (i.e., what, when, where, who, and how) attributes: for example, the number of people crossing a screenline or doing an activity in a zone can be presented over time, by mode of transportation, gender, group size, or the direction of the movement. To keep the list compact and generic, combinations of segmentation by the attributes and aggregation are not enumerated.

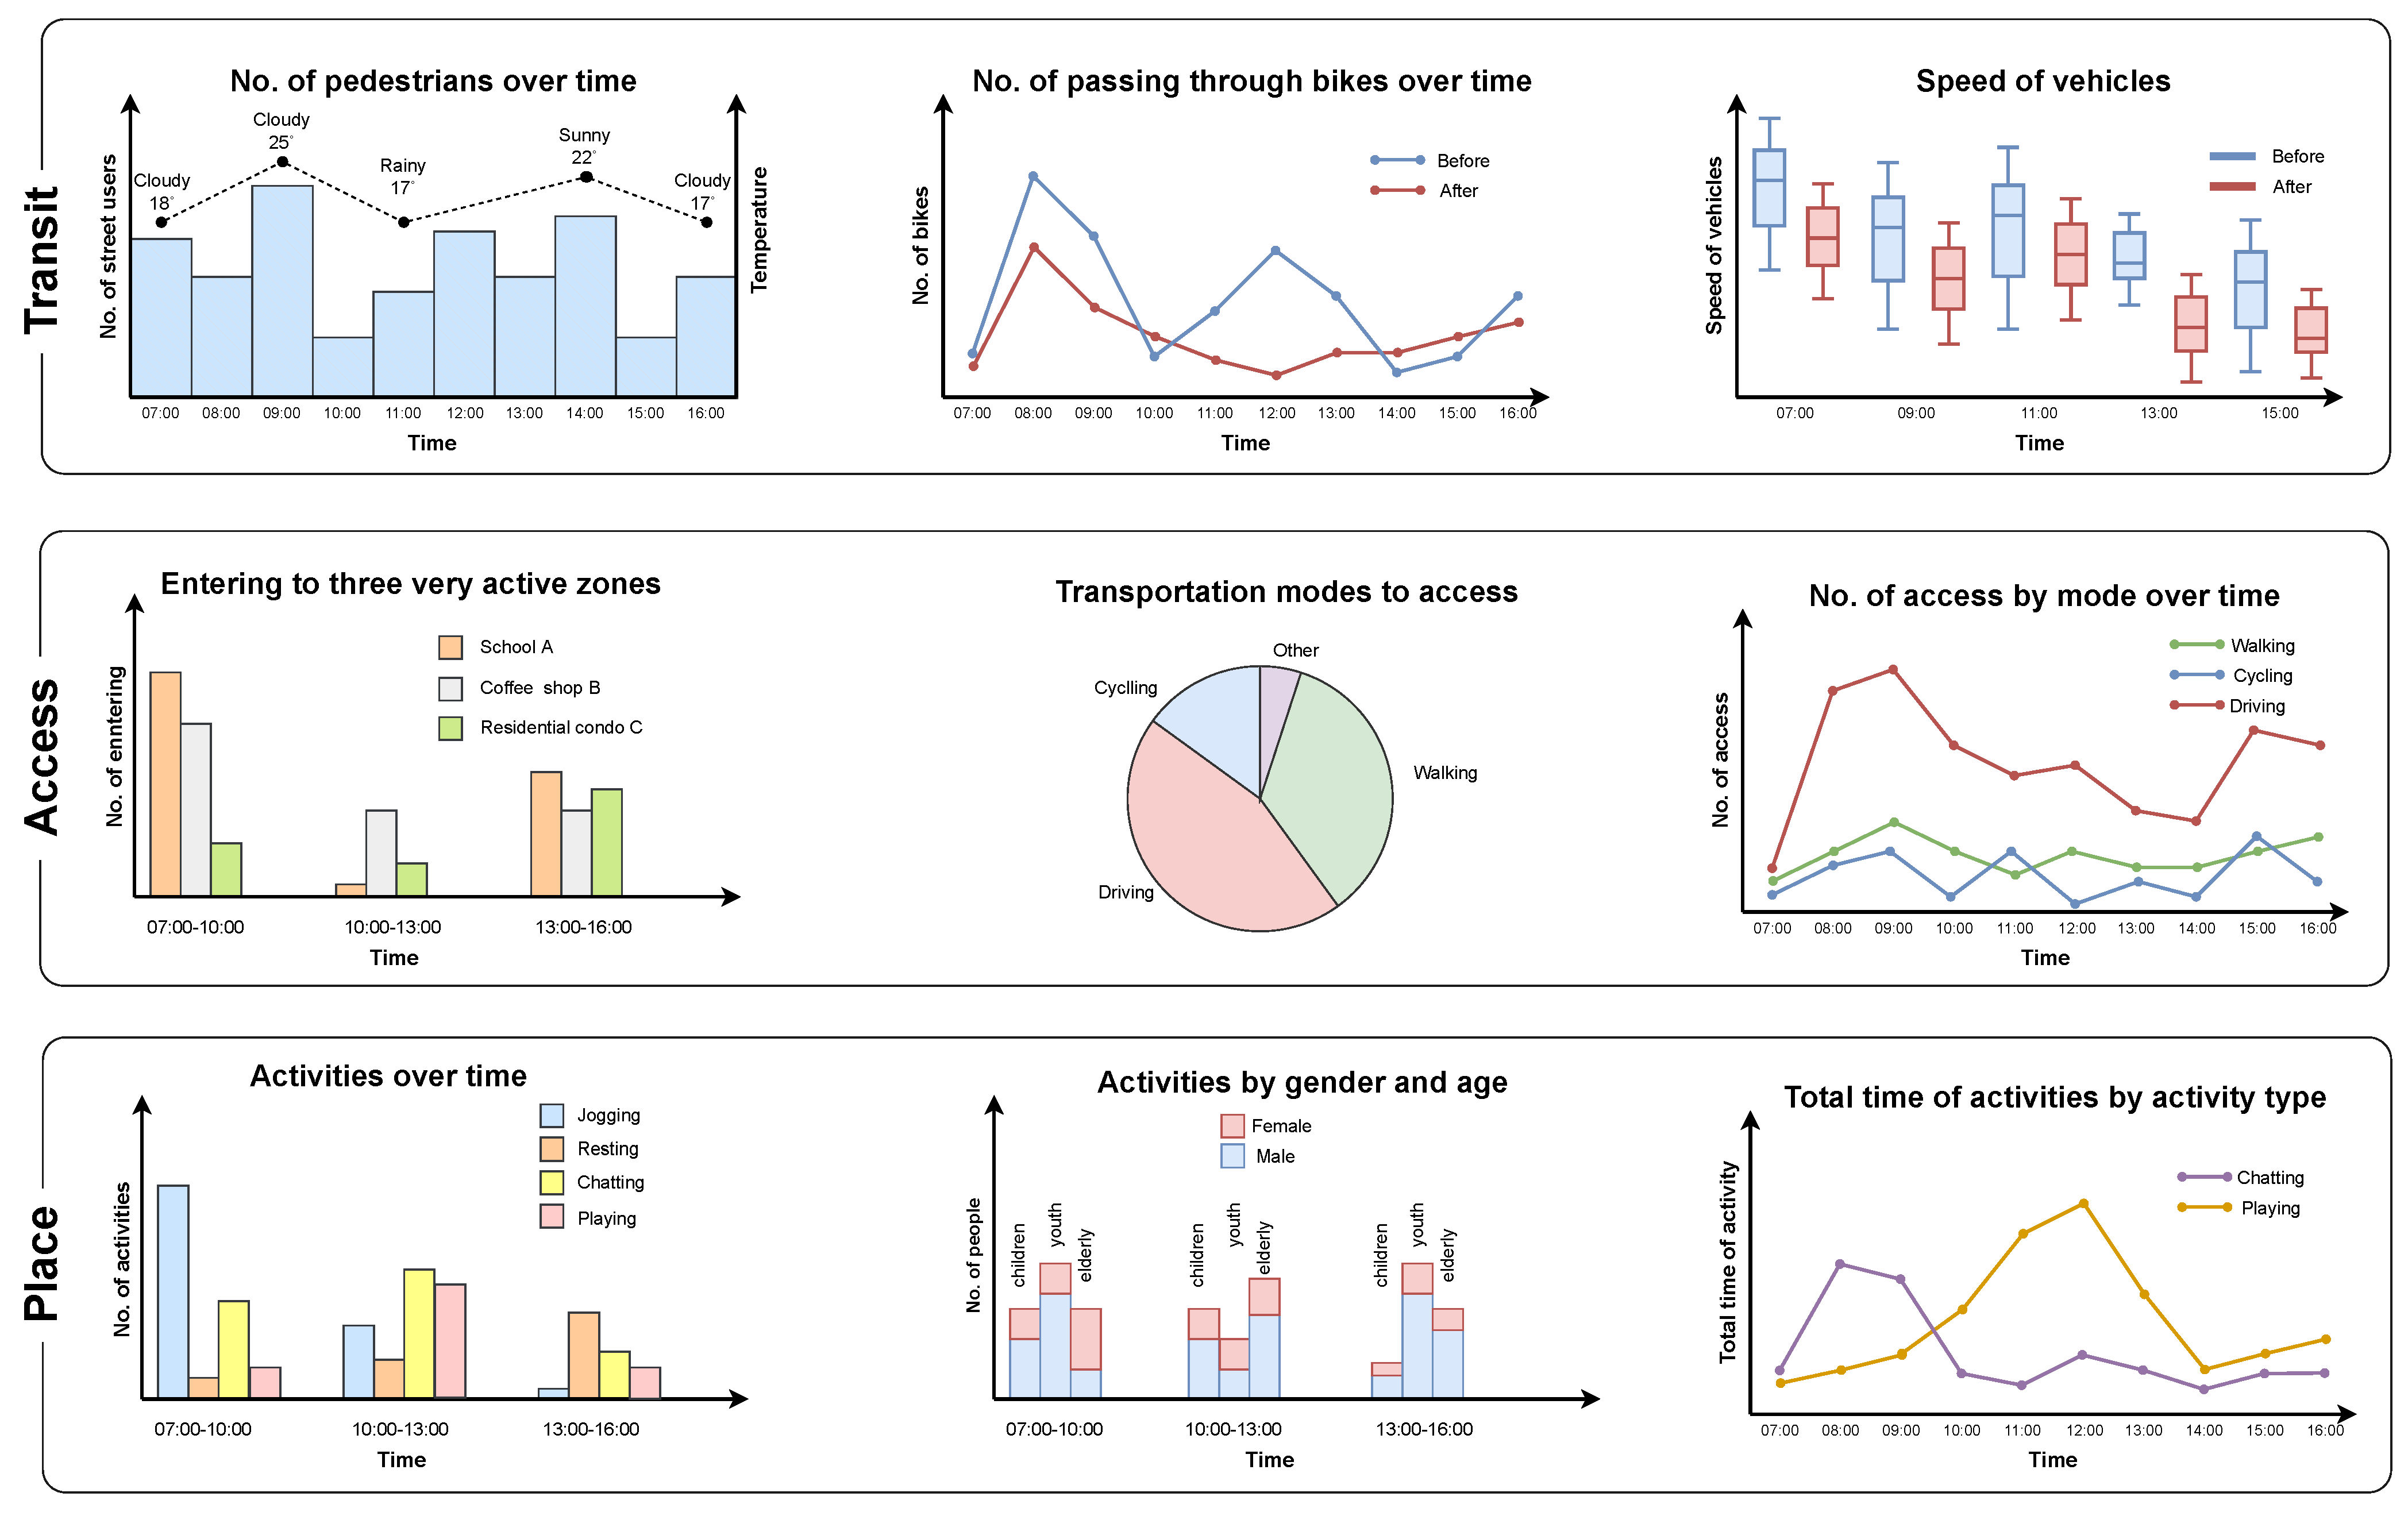
3.2. Methodology for Collecting Data and Deriving Indicators

In order to put the proposed framework into practice, a methodology for gathering the required data, analyzing the collected data, storing the observations, and deriving the indicators is presented in this section. Gathering the required data is the first step in the proposed methodology. There are several methods and technologies to observe the movements of people and vehicles on roads and streets, such as manual roadside observation, pneumatic tubes, inductive loops, video data, radar guns, Wi-Fi or Bluetooth signals, passive infrared, and mobile crowdsourcing (GNSS).
These methods have different characteristics, strengths, and weaknesses. An important distinction is between point observations and spatial observations. Point observations are at one point along a road or across a line in a public space, i.e., a screenline. Spatial observations are done anywhere in a given area (zone). Pneumatic tubes, magnetic sensors, and inductive loops provide point observations, while GNSS sensors, cameras, and LiDARs can provide spatial observations. Since several indicators, in particular all the indicators in the place function, relate to zones, a spatial observation method is needed.
Manual methods, i.e., a trained observer, can observe and record a person’s age, gender, and activities. However, it is not practical for a long period of observation or a large zone. In most manual methods, observations are usually made over a course of 2 h in peak periods aggregated in 10- or 15-min intervals [37,42]. On the other hand, while motion or pressure sensors can record long-term observations, they cannot record characteristics of street users. Although mobile crowdsourcing methods are efficient and spatially accurate methods, they often cover only a small share of the population.
Among these methods, video data analysis has several advantages that make it suitable for our application: video data collection is usually discreet (i.e., hard to detect by the observed users and thus less likely to impact behavior), it is possible to apply it for long data collection periods, and it is possible to take advantages of computer vision methods to automatically detect, track, and classify road users. Some activities can be detected automatically, but research is still ongoing for complex activities [59]. The resulting road user trajectories can be further processed to extract all the indicators listed in Table 3. Last but not least, using video data enables us to review the collected videos in the office and to review, correct, and extract further data manually as needed [60,61]. Indeed, road user monitoring in urban areas is not as straightforward as monitoring highway traffic: the variety and density of road users, the clutter in streets, the different movements of users in intersections, and the camera’s relatively narrow field-of-view are some challenges that make video-based road user monitoring challenging in urban areas [62,63]. Finally, microscopic data collection in public spaces raises fears of surveillance and breaches of user privacy, in particular, but not only, with video data, which have to been carefully handled depending on the context and jurisdiction.
In order to store the extracted information from the collected data, a data model was developed to record the street users’ characteristics, movements, and activities in terms of the proposed spatial units, events, and attributes shown in Figure 3. A data model describes the required entities and their associations, translated into tables, fields, and relationships in a relational database, to standardize data recordings and facilitate sharing and extraction of indicators from the recorded observations. The data model is implemented as a set of classes in the Python language using SQLAlchemy and is available from the repository of open-source Traffic Intelligence (https://trafficintelligence.confins.net, visited on 15 April 2022) project [64]. The developed data model can then be used to record the street user movements and activities along with user characteristics regardless of the observation method, be it manual or automatic.
The last step is to assess the street functions (i.e., transit, access, and place) by deriving the relevant indicators from the observations. The analysis should provide decision makers with a list of relevant indicators and visualizations to help them understand how people use streets. A mock dashboard of indicators organized by function is shown in Figure 4. For example, the temporal pattern of users’ presence on the streets and the comparison of the number of street users (or their speed) before and after an intervention (first row in Figure 4) help to assess the transit function of streets, e.g., by identifying peak hours. Furthermore, the number of entrances to the adjoining zones and the transportation mode that people use to access to the abutting buildings or spaces (second row in Figure 4) are example indicators to evaluate the access function. Finally, the types and duration of the observed activities over time (third row in Figure 4) help to measure to what extent a street is also a place or destination in its own right and what activities happen in which circumstances.

4. Conclusions

In this paper, we presented a new holistic framework of microscopic indicators to measure the three primary functions of urban streets, namely transit, access, and place. This framework is more complete than previous ones as it covers all the street functions and user types. It clarifies the distinction between street and environmental characteristics that affect street use and the actual observation of street use, allowing the study of their relationships. It provides a consistent way of enumerating and linking people, their movements, and their activities across public spaces.
Although this paper advocates that video analysis is suitable to record the data needed to measure the street functions, the proposed framework is also entirely independent from the data collection method. Other spatial data collection methods, including manual observations, are suitable but often have other drawbacks, while point-based data collection methods such as pneumatic tubes cannot provide the necessary data.
The proposed systematic approach will provide transportation decision makers with an integrated framework to assess streets in terms of their functions. The developed framework, augmented by video analysis tools, will provide authorities with a (semi)automatic system that enables them to have an objective estimation of the street functions and open space use in urban areas. This monitoring can establish a surveillance procedure which provides the authorities with information about their street operation. More importantly, it can help them to evaluate new facilities/designs based on their observed performance in terms of movement, access, and place (how the functions are fulfilled and the trade-offs between them). Without such data, it is difficult to know precisely what designs might facilitate changes in use.
Furthermore, developments in other fields such as new measures or different user types can be incorporated as the framework is not intended to be definitive but to help organize and capture a more diverse and holistic view of streets. The framework is generic and must be adjusted depending on the context and objective of the study. For example, in some developing nations, it is likely that specific transport modes (e.g., three-wheeler taxi or rickshaw) would need to be added. The cultural nuances of use (e.g., presence of street vendors in some countries) and certain activities could also be added.
The next step of this research is to apply the proposed framework on case studies to further test it and demonstrate its usefulness.

Author Contributions

Conceptualization, A.S.-M.-Z., N.S. and E.O.D.W.; methodology, A.S.-M.-Z., N.S. and E.O.D.W.; writing—original draft preparation, A.S.-M.-Z., N.S. and E.O.D.W.; writing—review and editing, A.S.-M.-Z., N.S. and E.O.D.W.; supervision, N.S. and E.O.D.W.; funding acquisition, N.S. All authors have read and agreed to the published version of the manuscript.

Funding

This research was funded by NSERC through the Discovery Grant 2017-06115 and Discover Accelerator Supplement 507950. The APC was funded by NSERC.

Institutional Review Board Statement

Not applicable.

Informed Consent Statement

Not applicable.

Data Availability Statement

Data sharing not applicable.

Acknowledgments

All the diagrams in this paper are prepared using Diagrams.net and its provided icons, a free and open-source graph drawing software developed by JGraph Ltd.

Conflicts of Interest

The authors declare no conflict of interest.

References

  1. Lefebvre-Ropars, G.; Morency, C.; Negron-Poblete, P. A needs-gap analysis of street space allocation. J. Transp. Land Use 2021, 14, 151–170. [Google Scholar] [CrossRef]
  2. Hodges, J. Streetscape Guidance; Technical Report; Transport for London: Lodon, UK, 2019.
  3. Department for Transport. Manual for Streets; Thomas Telford Publishing: Lodon, UK, 2007.
  4. Jones, P.; Marshall, S.; Boujenko, N. Creating more people-friendly urban streets through ‘link and place’ street planning and design. IATSS Res. 2008, 32, 14–25. [Google Scholar] [CrossRef]
  5. VicRoads. Movement and Place in Victoria; Department of Transport: Melbourne, UK, 2019.
  6. Karndacharuk, A.; Hassan, A.; Lee, C. Road Transport Management Framework and Principles; Technical Report; Austroads Ltd.: Sydney, Australia, 2017. [Google Scholar]
  7. Jones, P.; Boujenko, N.; Marshall, S. Link & Place—A Guide to Street Planning and Design; Local Transport Today Ltd.: Lodon, UK, 2007. [Google Scholar]
  8. Adhikari, W.R.; Ernst, J. Accessibility: Evaluating People’s to Reach Desired Goods, Services and Activities; TDM Encyclopedia: Victoria, BC, Canada, 2017. [Google Scholar]
  9. Marks, H. NCHRP Report 121: Protection of Highway Utility; Technical Report; National Cooperative Highway Research Program (NCHRP): Washington, DC, USA, 1971. [Google Scholar]
  10. Rodriguez-Valencia, A. Urban Right-of-Way Allocation Problem: Considering All Demands. In Proceedings of the Transportation Research Board 93rd Annual Meeting, Washington, DC, USA, 14–16 January 2014; p. 17. [Google Scholar]
  11. Hassen, N.; Kaufman, P. Examining the role of urban street design in enhancing community engagement: A literature review. Health Health Place 2016, 41, 119–132. [Google Scholar] [CrossRef] [PubMed]
  12. Federal Highway Administration and Federal Transit Administration. 2015 Status of the Nation’s Highways, Bridges, and Transit Conditions & Performance Report to Congress; Government Printing Office: Washington, DC, USA, 2017.
  13. Gehl, J. Cities for people; Island Press: Washington, DC, USA, 2013. [Google Scholar]
  14. Litman, T. Well Measured: Developing Indicators for Sustainable and Livable Transport Planning; Victoria Transport Policy Institute: Victoria, BC, Canada, 2019. [Google Scholar]
  15. Wefering, F.; Rupprecht, S.; Bührmann, S.; Böhler-Baedeker, S. Developing and Implementing a Sustainable Urban Mobility Plan. In Proceedings of the European Platform on Sustainable Urban Mobility Plans, Sopot, Poland, 12–14 June 2014. [Google Scholar]
  16. Sdoukopoulos, A.; Pitsiava-Latinopoulou, M.; Basbas, S.; Papaioannou, P. Measuring progress towards transport sustainability through indicators: Analysis and metrics of the main indicator initiatives. Transp. Res. Part D Transp. Environ. 2019, 67, 316–333. [Google Scholar] [CrossRef]
  17. Gudmundsson, H.; Tennøy, A.; Joumard, R. Criteria and methods for indicator assessment and selection. In Indicators of Environmental Sustainability in Transport; Joumard, R., Gudmundsson, H., Eds.; INRETS: Bron, France, 2010; pp. 103–140. [Google Scholar]
  18. Brownson, R.C.; Hoehner, C.M.; Day, K.; Forsyth, A.; Sallis, J.F. Measuring the Built Environment for Physical Activity. Am. J. Prev. Med. 2009, 36, S99–S123.e12. [Google Scholar] [CrossRef] [Green Version]
  19. Abrams, S. The Unseen History of Our Roads. Road & Track. 16 May 2013. Available online: https://www.roadandtrack.com/car-culture/a4447 (accessed on 8 December 2021).
  20. Brownson, R.C.; Housemann, R.A.; Brown, D.R.; Jackson-Thompson, J.; King, A.C.; Malone, B.R.; Sallis, J.F. Promoting physical activity in rural communities. Am. J. Prev. Med. 2000, 18, 235–241. [Google Scholar] [CrossRef]
  21. Saelens, B.E.; Sallis, J.F.; Black, J.B.; Chen, D. Neighborhood-Based Differences in Physical Activity: An Environment Scale Evaluation. Am. J. Public Health 2003, 93, 1552–1558. [Google Scholar] [CrossRef]
  22. Leslie, E.; Owen, N.; Salmon, J.; Bauman, A.; Sallis, J.F.; Lo, S.K. Insufficiently Active Australian College Students: Perceived Personal, Social, and Environmental Influences. Prev. Med. 1999, 28, 20–27. [Google Scholar] [CrossRef]
  23. Dishman, R.K.; Sallis, J.F. Determinants and interventions for physical activity and exercise. Public Health Rep. 1985, 100, 158–171. [Google Scholar]
  24. Ma, L.; Dill, J. Associations between the objective and perceived built environment and bicycling for transportation. J. Transp. Health 2015, 2, 248–255. [Google Scholar] [CrossRef]
  25. Ewing, R.; Handy, S.; Brownson, R.C.; Clemente, O.; Winston, E. Identifying and measuring urban design qualities related to walkability. J. Phys. Act. Health 2006, 3, S223–S240. [Google Scholar] [CrossRef] [PubMed]
  26. Gómez, L.F.; Parra, D.C.; Buchner, D.; Brownson, R.C.; Sarmiento, O.L.; Pinzón, J.D.; Ardila, M.; Moreno, J.; Serrato, M.; Lobelo, F. Built Environment Attributes and Walking Patterns Among the Elderly Population in Bogotá. Am. J. Prev. Med. 2010, 38, 592–599. [Google Scholar] [CrossRef] [PubMed]
  27. Badland, H.M.; Schofield, G.M.; Garrett, N. Travel behavior and objectively measured urban design variables: Associations for adults traveling to work. Health Place 2008, 14, 85–95. [Google Scholar] [CrossRef] [PubMed]
  28. Rahman, N.A.; Shamsuddin, S.; Ghani, I. What makes people use the street?: Towards a liveable urban environment in Kuala Lumpur city centre. Procedia Soc. Behav. Sci. 2015, 170, 624–632. [Google Scholar] [CrossRef] [Green Version]
  29. Ramirez, L.K.B.; Hoehner, C.M.; Brownson, R.C.; Cook, R.; Orleans, C.T.; Hollander, M.; Barker, D.C.; Bors, P.; Ewing, R.; Killingsworth, R.; et al. Indicators of Activity-Friendly CommunitiesAn Evidence-Based Consensus Process. Am. J. Prev. Med. 2006, 31, 515–524. [Google Scholar]
  30. Hoehner, C.M.; Ramirez, L.K.B.; Elliott, M.B.; Handy, S.L.; Brownson, R.C. Perceived and objective environmental measures and physical activity among urban adults. Am. J. Prev. Med. 2005, 28, 105–116. [Google Scholar] [CrossRef]
  31. Saelens, B.E.; Sallis, J.F.; Frank, L.D. Environmental correlates of walking and cycling: Findings from the transportation, urban design, and planning literatures. Ann. Behav. Med. 2003, 25, 80–91. [Google Scholar] [CrossRef]
  32. Oakes, J.M.; Forsyth, A.; Schmitz, K.H. The effects of neighborhood density and street connectivity on walking behavior: The Twin Cities walking study. Epidemiol. Perspect. Innov. 2007, 4, 16. [Google Scholar] [CrossRef] [Green Version]
  33. Wang, Y.; Chau, C.; Ng, W.; Leung, T. A review on the effects of physical built environment attributes on enhancing walking and cycling activity levels within residential neighborhoods. Cities 2016, 50, 1–15. [Google Scholar] [CrossRef]
  34. Federal Highway Administration. Traffic Data Computation Method Pocket Guide; U.S. Department of Transportation: Washington, DC, USA, 2018.
  35. Global Designing Cities Initiative; National Association of City Transportation Officials. Global Street Design Guide; Island Press: Washington, DC, USA, 2016. [Google Scholar]
  36. Global Designing Cities Initiative; National Association of City Transportation Officials. Measuring and Evaluating Streets. In Global Street Design Guide; Island Press: Washington, DC, USA, 2016; Chapter 4; pp. 43–49. [Google Scholar]
  37. Gehl Institute. The Open Public Life Data Protocol; Gehl Institute: San Francisco, CA, USA, 2017. [Google Scholar]
  38. National Transport Authority. Universal Design Walkability Audit Tool for Roads and Streets; Technical Report; National Transport Authority, Age Friendly Ireland, Green-Schools, and the National Disability Authority: Washington, DC, USA, 2021.
  39. Nabors, D.; Gibbs, M.; Sandt, L.; Rocchi, S.; Wilson, E.; Lipinski, M. Pedestrian Road Safety Audit Guidelines and Prompt Lists; Technical Report; Federal Highway Administration, Office of Safety: Washington, DC, USA, 2007.
  40. Nabors, D.; Goughnour, E.; Thomas, L.; DeSantis, W.; Sawyer, M. Bicycle Road Safety Audit Guidelines and Prompt Lists; Technical Report; Federal Highway Administration, Office of Safety: Washington, DC, USA, 2012.
  41. Pikora, T.J.; Giles-Corti, B.; Knuiman, M.W.; Bull, F.C.; Jamrozik, K.; Donovan, R.J. Neighborhood Environmental Factors Correlated with Walking near Home: Using Spaces. Med. Sci. Sport. Exerc. 2006, 38, 708–714. [Google Scholar] [CrossRef]
  42. Birk, M.; Jones, M.G.; Cheng, A.M. National Bicycle and Pedestrian Documentation Project; Technical Report; Alta Planning + Design and the ITE Pedestrian and Bicycle Council: Oakland, CA, USA, 2006. [Google Scholar]
  43. American Association of Retired Persons. Walk Audit Tool Kit; American Association of Retired Persons: Washington, DC, USA, 2016. [Google Scholar]
  44. Hipp, J.A.; Eyler, A. Open Streets Initiatives: Measuring Success Toolkit; Technical Report, Active Living Research Program; Robert Wood Johnson Foundation: Washington, DC, USA, 2014. [Google Scholar]
  45. Emery, J.; Crump, C.; Bors, P. Reliability and Validity of Two Instruments Designed to Assess the Walking and Bicycling Suitability of Sidewalks and Roads. Am. J. Health Promot. 2003, 18, 38–46. [Google Scholar] [CrossRef] [PubMed]
  46. Hoehner, C.M.; Ivy, A.; Ramirez, L.K.B.; Handy, S.; Brownson, R.C. Active Neighborhood Checklist: A User-Friendly and Reliable Tool for Assessing Activity Friendliness. Am. J. Health Promot. 2007, 21, 534–537. [Google Scholar] [CrossRef] [PubMed]
  47. Millstein, R.A.; Cain, K.L.; Sallis, J.F.; Conway, T.L.; Geremia, C.; Frank, L.D.; Chapman, J.; Van Dyck, D.; Dipzinski, L.R.; Kerr, J.; et al. Development, scoring, and reliability of the Microscale Audit of Pedestrian Streetscapes (MAPS). BMC Public Health 2013, 13, 403. [Google Scholar] [CrossRef] [PubMed] [Green Version]
  48. Rosenberg, D.; Ding, D.; Sallis, J.F.; Kerr, J.; Norman, G.J.; Durant, N.; Harris, S.K.; Saelens, B.E. Neighborhood Environment Walkability Scale for Youth (NEWS-Y): Reliability and relationship with physical activity. Prev. Med. 2009, 49, 213–218. [Google Scholar] [CrossRef] [PubMed]
  49. Clifton, K.J.; Smith, A.D.L.; Rodriguez, D. The development and testing of an audit for the pedestrian environment. Landsc. Urban Plan. 2007, 80, 95–110. [Google Scholar] [CrossRef]
  50. Transport Research Laboratory (TRL); Transport for London (TfL). Street Auditing; Transport Research Laboratory (TRL) and Transport for London (TfL): London, UK, 2009.
  51. Dannenberg, A.L.; Cramer, T.W.; Gibson, C.J. Assessing the walkability of the workplace: A new audit tool. Am. J. Health Promot. 2005, 20, 39–44. [Google Scholar] [CrossRef]
  52. Kerr, J.; Carlson, J.A.; Rosenberg, D.E.; Withers, A. Identifying and promoting safe walking routes in older adults. Health 2012, 4, 720–724. [Google Scholar] [CrossRef] [Green Version]
  53. Zaleckis, K.; Chmielewski, S.; Kamičaitytė, J.; Grazuleviciute-Vileniske, I.; Lipińska, H. Walkability Compass—A Space Syntax Solution for Comparative Studies. Sustainability 2022, 14, 2033. [Google Scholar] [CrossRef]
  54. Rebecchi, A.; Buffoli, M.; Dettori, M.; Appolloni, L.; Azara, A.; Castiglia, P.; D’Alessandro, D.; Capolongo, S. Walkable Environments and Healthy Urban Moves: Urban Context Features Assessment Framework Experienced in Milan. Sustainability 2019, 11, 2778. [Google Scholar] [CrossRef] [Green Version]
  55. Troped, P.J.; Cromley, E.K.; Fragala, M.S.; Melly, S.J.; Hasbrouck, H.H.; Gortmaker, S.L.; Brownson, R.C. Development and Reliability and Validity Testing of an Audit Tool for Trail/Path Characteristics: The Path Environment Audit Tool (PEAT). J. Phys. Act. Health 2006, 3, S158–S175. [Google Scholar] [CrossRef] [Green Version]
  56. Paquin, S. Audit de Potentiel Piétonnier Actif Sécuritaire (PPAS): Guide d’utilisation; Direction de Santé Publique de l’Agence de la Santé et des Services Sociaux de Montréal: Montreal, QC, Canada, 2014. [Google Scholar]
  57. Paquin, S.; Gravel, F.; Forgues, K. Étudier nos Rues du Point de vue des Piétons: Un pas de Plus Pour Améliorer la Qualité de vie et les Déplacements Actifs; Centre Intégré Universitaire de Santé et de Services Sociaux du Centre-Sud: Montreal, QC, Canada, 2018. [Google Scholar]
  58. Corbille, M.A. Espace Public: Méthodes Pour Observer et Écouter les Usagers; Technical Report; Cerema: Bron, France, 2020. [Google Scholar]
  59. Lamghari, S.; Bilodeau, G.A.; Saunier, N. A Grid-based Representation for Human Action Recognition. In Proceedings of the 2020 25th International Conference on Pattern Recognition (ICPR), Milan, Italy, 10–15 January 2021; pp. 10500–10507. [Google Scholar]
  60. Saunier, N.; Sayed, T. A feature-based tracking algorithm for vehicles in intersections. In Proceedings of the 3rd Canadian Conference on Computer and Robot Vision, Quebec, QC, Canada, 7–9 June 2006; p. 59. [Google Scholar]
  61. Laureshyn, A. Application of Automated Video Analysis to Road User Behaviour. Ph.D. Thesis, Lund University, Lund, Sweden, 2010. [Google Scholar]
  62. Buch, N.; Velastin, S.A.; Orwell, J. A Review of Computer Vision Techniques for the Analysis of Urban Traffic. IEEE Trans. Intell. Transp. Syst. 2011, 12, 920–939. [Google Scholar] [CrossRef]
  63. Perreault, H.; Bilodeau, G.A.; Saunier, N.; Gravel, P. Road user detection in videos. arXiv 2019, arXiv:1903.12049. [Google Scholar]
  64. Jackson, S.; Miranda-Moreno, L.F.; St-Aubin, P.; Saunier, N. Flexible, Mobile Video Camera System and Open Source Video Analysis Software for Road Safety and Behavioral Analysis. Transp. Res. Rec. 2013, 2365, 90–98. [Google Scholar] [CrossRef]
Figure 1. Hypothetical functions of different types of streets.
Sustainability 14 07184 g001
Figure 2. Potential movements and activities in a hypothetical street.
Sustainability 14 07184 g002
Figure 3. Illustration of the proposed framework for observing street users directly.
Sustainability 14 07184 g003
Figure 4. Mock dashboard with indicators organized by function in each row.
Sustainability 14 07184 g004
Table 1. Main characteristics of indicators in measuring streets with example tools.
What/HowSubjectiveObjective
Transportation system characteristicsperceived potential usepotential use
 ToolsSAQ 2 BEA 1
 Example for pedestrian transitperceived sidewalk widthactual sidewalk width
User movements and activities(self-)reported useactual use
 ToolsSAQ 2DUO 3
 Example for pedestrian transitreported number of tripsnumber of trips
derived from GNSS 4 traces
1 Built Environment Audit; 2 Subjective Assessment/Questionnaire; 3 Direct User Observation; 4 Global Navigation Satellite Systems.
Table 3. Generic list of indicators related to each street function.
FunctionsPhysical QuantitiesSpatial Units
TransitNumber of personsScreenline
Number of personsOD 1
Instantaneous speed of a personScreenline
Travel time of a personOD
Delay of a personOD
Number of stopped personsZone
Stop duration for a personZone
Number of transport mode changesZone
AccessNumber of persons entering a given destinationScreenline
PlaceNumber of persons doing a given activityZone
Duration of a given activity for a personZone
1 OD: origin-destination.
Publisher’s Note: MDPI stays neutral with regard to jurisdictional claims in published maps and institutional affiliations.

