Article

Analysis of Influencing Factors of Embodied Carbon in China’s Export Trade in the Background of “Carbon Peak” and “Carbon Neutrality”

1
Business School, University of Shanghai for Science and Technology, Shanghai 200093, China
2
Antai College of Economics and Management, Shanghai Jiao Tong University, Shanghai 200030, China
*
Author to whom correspondence should be addressed.
All the authors contributed equally to this work.
Sustainability 2022, 14(6), 3308; https://doi.org/10.3390/su14063308
Submission received: 25 January 2022 / Revised: 3 March 2022 / Accepted: 10 March 2022 / Published: 11 March 2022
(This article belongs to the Collection Air Pollution Control and Sustainable Development)

Abstract

:
Since China’s reform and opening up, especially after its accession to the World Trade Organization, its foreign trade has achieved fruitful results. However, at the same time, the extensive foreign trade growth model with high energy consumption and high pollution has also caused a rapid increase in carbon emissions. There is a large amount of embodied carbon emissions in the export trade. In order to achieve the strategic goals of “Carbon Peak” and “Carbon Neutrality’, and at the same time build a green trading system to achieve coordinated development of trade and the environment, it is of great significance to study embodied carbon emissions and how to decouple them with China’s foreign trade. This paper uses the Logarithmic Mean Divisia Index method to decompose the influencing factors of the embodied carbon in China’s export trade in order to study the impact of three factors: export scale, export structure, and carbon emission intensity. The results show that the change in export scale is the most important factor affecting the embodied carbon of China’s export trade, and the expansion of export scale has caused the growth of trade embodied carbon. Carbon emission intensity is the second influential factor, and the decline in carbon intensity would slow down the growth of trade embodied carbon, while changes in the export structure have the smallest impact on trade embodied carbon. The high carbonization of the overall export structure will cause growth of trade embodied carbon, but the tertiary industry has seen some improvement in the export structure, which could facilitate the decline of trade embodied carbon.

1. Introduction

Since China’s reform and opening up, its foreign trade has achieved tremendous growth. According to statistical yearbook released by the National Bureau of Statistics, in 2001, China’s total foreign trade of goods imports and exports was only $509.65 billion U.S. dollars, while by 2020, this number has increased to $4655.91 billion U.S. dollars, with an increase of 813.55% and a compound annual growth rate of over 11% [1,2]. On the other hand, China’s total foreign trade of service imports and exports has increased from 78.45 billion U.S. dollars in 2001 to $661.72 billion U.S. dollars, with an increase of 743.49% and a compound annual growth rate of 11.26% [1,2]. By 2020, China had become the world’s largest trader, as well as a major trading partner of more than 100 countries [3]. Its total foreign trade has accounted for more than 13% of total global trade, and its growth rate is much higher than that of total global trade [4,5,6]. The growth in foreign trade has played a huge role in stimulating China’s economic development, but the extensive growth model of foreign trade has also caused a huge negative impact on the environment [7,8]. China’s over-reliance on factors such as labor and resources in global trade has resulted in China staying at the low end of the global trade value chain for a long time [9,10,11]. On the one hand, in China’s export structure, resource-intensive and labor-intensive products account for more than 50% of total exports, and this percentage has shown an increasing trend [12,13]. On the other hand, processing trade still occupies a large proportion in China’s export trade, especially in the first few years after joining the WTO, during which the proportion of processing trade was once over 50% [14,15]. The foreign trade growth model discussed above has resulted in China’s large export scale with a low added value of export. In addition, China’s export is heavily dependent on consumption of resources, causing environmental pollution as well as continuous growth of carbon emissions [16].
According to statistics from the Global Carbon Budget Database, China’s total domestic carbon emissions were 3.51 billion tons in 2001, which has increased to 10.67 billion tons by 2020 with an increase of 203.56%. The proportion of China’s carbon emissions in total global carbon emissions has also increased from 13.62% in 2001 to 30.64% in 2020, making China the world’s largest carbon emitter [17]. Excessive carbon emissions will not only have a negative impact on China’s economic development, but will also threaten people’s health and even survival [18]. As carbon is being the main greenhouse gas, the increase of its concentration in the atmosphere has led to global warming, resulting in temperature rise, sea level rise, and various extreme climates, which could cause immeasurable damage to food production, the ecological environment, infrastructure construction, and the safety of people’s lives and property [19,20,21]. According to the fifth assessment report of the Intergovernmental Panel on Climate Change (IPCC), the current impact of human activities on climate change is negative and large, and we cannot let it continue to develop [22]. In response to this severe situation, the United Nations adopted the “United Nations Framework Convention on Climate Change”, with the goal of controlling global temperature changes within a safe range [23]. As a supplement to this framework, the “Kyoto Protocol” adopted in 1997 put forward emission reduction requirements for some countries [24]. Since China’s total carbon emissions were limited at the time, it was not bound by mandatory emission reduction requirements. However, with the continuous growth of carbon emissions, China’s carbon emissions have attracted more and more attention from the international community. In the “Paris Agreement” signed in 2015, China has been designated as one of the main countries for carbon emission reduction, and all countries are required to set emission reduction targets by 2030 by means of “independent contributions” [25]. In this regard, China’s leader Xi Jinping solemnly pledged at the 75th UN General Assembly in 2020 to achieve the peak of carbon emissions by 2030 and achieve carbon neutrality by 2060 [26].
As China being a major trading country and a major carbon emitter, its trade growth has not only driven economic growth, but also continuously increased carbon emissions, resulting in a large amount of embodied carbon in export trade [27]. In order to achieve the strategic goals of “Carbon Peak” and “Carbon Neutrality’, it is of great theoretical and practical importance to study embodied carbon emissions and how to decouple them with China’s foreign trade.

2. Literature Review

When studying the influencing factors of carbon emissions, the academic community often use the structural decomposition analysis method based on the input-output analysis model [28,29,30]. This method is based on the input-output table and fully considers the relationship between sectors. This method decomposes the changes in carbon emissions into the sum of changes caused by different independent variables, and analyzes the contribution of changes in each independent variable to changes in carbon emissions. For example, Ali et al. (2020) designed an emission multiplier product matrix to estimate the carbon emissions generated by British industrial activities and decomposed the factors affecting carbon emissions. They found that technological progress had played a key role in reducing carbon emissions in the UK. The final demand structure achieved through technological progress could help reduce carbon emissions [31]. Araujo et al. (2020) conducted a quantitative study on the influencing factors of carbon emissions of countries that newly joined the EU. The results of structural decomposition showed that their total amount of carbon emissions had increased due to the expansion of the trade scale and changes in their industrial structure [32]. Engo et al. (2021) used the structural decomposition method and decoupling model to analyze the carbon emissions of North African countries. They found that the effects of scale, energy intensity and economic structure are different among those countries [33]. Kim and Tromp (2021) used the multi-region input-output method and the structural decomposition model to calculate the embodied carbon in trade between Brazil and China. The study found that the changes in China’s final demand and export structure are the main factors accounting for the increase of embodied carbon emissions [34].
However, the structural decomposition analysis method has the issue of incomplete decomposition when decomposing variables, that is, there could be some “decomposition residual” [35,36]. In recent researches, the academic circle often handles the decomposition residual by taking the average of the positive and negative extreme values [37,38,39]. However, when researchers adopt different decomposition orders, the results obtained are not always consistent [40,41,42].
In view of this, many scholars have adopted the Logarithmic Mean Divisia Index (LMDI) method of the Divis Decomposition method. For examples, Raza and Lin (2020) applied the LMDI method to study carbon emissions in Pakistan’s transport sector. Their findings suggest that economic growth was the main factor responsible for the increase in carbon emissions from Pakistan’s transport sector during the 1984–2018 period [43]. Pita et al. (2020) used the LMDI-I index method to study the influencing factors of carbon emissions from road transport in Thailand. The results show that the type of fuel and energy efficiency are the main factors affecting carbon emissions in this sector in Thailand. By increasing the proportion of biofuels used and further improving energy efficiency, the carbon emission level in this sector will be significantly reduced [44]. Chontanawat et al. (2020) used the LMDI method to study the carbon emission levels and influencing factors of various industries in Thailand from 2005 to 2017. The results show that the upgrading of industrial structure has reduced carbon emissions, while the increase in energy intensity of some industries has led to their carbon emissions rising [45]. Hasan and Wu (2020) investigated carbon emissions from the power sector in Bangladesh from 1979 to 2018 and used the LMDI method to analyze the industry’s future emissions levels. The research results show that CO2 intensity and power intensity are the main factors leading to the increase of carbon emissions, and the widespread application of renewable energy technologies in the future will be an important policy tool to reduce carbon emissions [46].
This method is very robust. It can deal with zero and negative values very well, and can achieve complete decomposition without residuals so that the decomposition results are more reliable. The following studies demonstrate this advantage: Taka et al. (2020) used Kaya identity and LMDI method to study carbon emissions in Ethiopia’s energy sector. The results they obtained show that economics, population, and fossil fuel were the main contributors to the increase in carbon emissions, while the increase in energy intensity would significantly reduce the increase in carbon emissions [47]. Yasmeen et al. (2020) used the LMDI method to assess Pakistan’s carbon emissions during 1972–2016. Their results also show that economic development is the main factor for the increase in per capita carbon emissions in Pakistan, while improving the energy structure and improving energy efficiency can help reduce per capita carbon emissions [48]. Ozturk et al. (2021) used the Tapio decoupling index and LMDI method to study carbon emissions of three typical representatives of emerging economies, Pakistan, India, and China. The results show that although the energy intensity of the above three countries has reduced carbon emissions, their economic development, population, energy structure, and other factors have increased carbon emissions [49]. Using the LMDI-I model and the Innovative Accounting Approach, Cansino et al. (2021) studied Ecuador’s carbon emissions from 2000–2014. They found that the most important factors affecting Ecuador’s carbon emissions are carbon intensity, population growth and economic development, with the country’s energy and transportation sectors being the most sensitive to increases in carbon emissions [50].
According to this latest trend in the academic circle, we utilized the LMDI method to decompose the changes in the embodied carbon of China’s export trade into the export scale effect, export structure effect, and the carbon intensity effect, in order to analyze the impact of changes in the export scale, export structure, and carbon intensity on the embodied carbon of China’s export trade in depth.
In the following sections of this paper, Section 3 introduces the calculation method of real trade volume and the decomposition model of influencing factors of export trade embodied carbon. Section 4 calculates and discusses the influencing factors of embodied carbon in China’s export trade by three major industries by using the World Input-Output Database (WIOD) (2016 edition). Section 5 provides the conclusions of this paper.

3. Materials and Methods

3.1. Real Trade Volume Calculation

In view of the possibility of double counting in traditional trade statistics, this paper has conducted research based on trade value-added, and converted the trade value-added of each year to comparable prices of 2010. In the accompanying economic and social accounts of the 2016 version of the WIOD database, price indices of value added by sector for each country are available each year. Since the value-added price of each sector in 2010 has been used as the reference price in the account, and the value-added price index of each sector in 2010 is set to be 100, we convert the value-added of each sector in other years into 2010 comparable prices. Similarly, indicators such as trade scale, trade structure and carbon emission intensity are also calculated based on the above converted trade added value. The main steps of real trade volume calculation of this paper are as follows.

3.1.1. Trade Value Added

The trade value-added is divided into export trade value-added and import trade value-added. The former refers to the trade value-added created by domestic production while the latter refers to the trade value-added created by foreign production in imports.
Due to economic globalization, the production of a final product is often not completed within one country, but has undergone production and processing in multiple countries. For example, the primary products are manufactured in one country, and then exported to another country as intermediate products for further processing, and eventually exported to a third country as final products for consumption. The international division of labor is conducive to each country’s comparative advantages and factor endowment advantages to participate in the production of final products, which is of great significance to promoting the economic development of all countries [51]. Developing countries in particular can participate in international trade by virtue of their comparative advantages in resources and labor and benefit from the international trade. Even trade in intermediate products could help developing countries mitigate the distortion of factor markets and optimize the allocation of resources.
However, the rapid growth of intermediate products trade has caused statistical problems. Since traditional trade statistics normally focus on the total value of commodities, and do not consider the trade of intermediate products. Therefore, the multiple flows of intermediate products between countries will cause statistical duplication, thereby “inflating” the trade volume [52,53,54]. Taking mobile phone production as an example, assume that the design and production of core components such as mobile phone chips and integrated circuits are completed in the United States, and then the components are exported to China as intermediate products. Chinese companies would process and assemble the mobile phones, and then the finished products are exported to Japan. In the above-mentioned trade process, the actual trade volume of China is only the added value of mobile phones during processing and assembly, and should not be calculated based on the export value of finished mobile phones according to customs statistics. Therefore, in the context of rapid growth of international trade in intermediate products, the concept of trade value added should be adopted to accurately calculate the real trade volume, trade gains and value flow in order to identify and measure a country’s real trade competitive advantage [55,56,57].

3.1.2. Calculation of Trade Value Added

This paper has adopted the input-output method to measure the trade added value of China’s export. Please refer to Table A1 in Appendix A to find the meaning of variables used in calculation. First, this paper calculates the direct value-added coefficient v i r , which represents the value-added contained in the total output of sector i in country r , that is, the total input of sector i after removing the intermediate input (that is, the initial input) [58]. The calculation method is shown in the following equation:
v i r = I i r X i r   ( r = 1 , 2 , , M , i = 1 , 2 , , N )
Express the above direct value-added coefficient in a matrix form, as shown in the following equation:
v = [ v 1 v M ]
Equation (3) can be obtained by establishing a connection with the Leontief model.
v X = v ( I A ) 1 F
where v X represents the vector obtained by multiplying the corresponding position of vector v and vector X . A is the direct consumption coefficient matrix, and its element A i j r s is the direct consumption coefficient, representing consumption per unit of output in sector j in country s to sector i in country r . In the input-output table, from the perspective of the relationship between the rows, the intermediate output Z plus the final output F equals the total output X , that is, Z + F = X . The intermediate output can be expressed by the total output and the direct consumption coefficient, that is, Z = A X . So we can get A X + F = X . After matrix inversion, we can further get X = ( I A ) 1 F , which is the Leontief model [59,60].
Moreover, v ( I A ) 1 is the complete value-added coefficient, representing the total value added for each unit of final product produced by different sectors in different countries. Here, the final demand matrix F is expressed as a block matrix for illustration, as shown in equation:
F = [ F 11 F 1 M F M 1 F M M ] = [ F 1 F M ]
The final demand matrix F is divided by columns into the demand vector of each economy for the final product produced by different sectors in different countries, where F s is an ( M × N ) × 1 dimensional vector, representing the demand of country s for the final product of different sectors in different countries. By multiplying with the inverse Leontief matrix [61,62], that is, ( I A ) 1 F s , the demand of country s for all products of various sectors in each country can be obtained. By multiplying with the corresponding position of the direct value-added coefficient, that is, v ( I A ) 1 F s , the calculation method of trade value added can be obtained, as shown in this equation:
V = v ( I A ) 1 F
= [ v ( I A ) 1 F 1 v ( I A ) 1 F s v ( I A ) 1 F M ]
where v ( I A ) 1 F s represents the total added value of different sectors in different countries in order to meet the final demand of country s . Based on that, the matrix is further divided by country, and thus Equation (6) can be obtained:
V = [ V 11 V 1 M V r s V M 1 V M M ]
in which V r s is the vector of added value of various sectors in country r in order to meet the final demand of country s . Thus, the export value-added vector of country r can be obtained, as shown in this equation:
E V r = s , s r V r s
in which E V r is an N × 1 dimensional vector, which represents the added value of export trade of various sectors in country r . Similarly, the import value-added vector of country r can be calculated, as shown in this equation:
I V r = s , s r V s r
where I V r is an N × 1 dimensional vector, which represents the import value-added of country r from various foreign sectors.

3.1.3. Data Source and Calculation Process

We used MATLAB (the software of MathWorks, Inc. Natick, MA, USA. Version: r2018b) to perform calculations. The multi-region input-output table needs to be established in order to calculate the trade value added. This paper has established a multi-region input-output table based on the WIOD database. The value-added price indices of various sectors in China are from the supporting economic and social accounts of the 2016 version of the WIOD [63]. The economic and social accounts include data such as the number of employees, compensation of labor and capital, and price indices of 56 sectors in 44 economies during the 2000–2014 period, providing a sound data support for the multi-region input-output table. In the process of trade value added calculation, inflation must be dealt with. Due to the existence of inflation, the same goods or services have different prices in different years, which makes it impossible to directly compare the trade value added of different years. When dealing with inflation, this paper first uses the international input-output tables of current prices to calculate trade value-added, and then uses the value-added price indices of various sectors in the economic and social accounts to obtain the trade value added at comparable prices. In actual calculation, this paper converts the trade value-added obtained in the first step with the 2010 comparable prices. Therefore, unless otherwise specified, the trade value-added data in this paper are the trade value-added calculated based on 2010 comparable prices rather than current prices.

3.2. Decomposition Model of Influencing Factors of Embodied Carbon in Export Trade

This paper has used the factor decomposition method to decompose the embodied carbon in China’s export trade. This method decomposes the change of the target variable into changes of specific influencing factors to study the role of each factor. As mentioned in Section 1 and Section 2 above, this paper has adopted the LMDI method according to the latest trends in the academic circle in order to analyze the influencing factors of embodied carbon in China’s export trade. This method has strong robustness. It can deal with zero and negative values very well, and can achieve complete decomposition without residuals [64,65].
The calculation method of the LMDI model is shown in the following equation:
E C = i E C i = i E V E V i E V E C i E V i = i Q S i I i
The above equation decomposes the total embodied carbon in export trade into the sum of embodied carbon of various sectors, which is further expressed as the sum of the product of export scale, export structure and carbon intensity. In Equation (9), E C ( = i E C i ) is the total embodied carbon in export trade; E C i represents the embodied carbon of sector i ; E V ( = i E V i ) is the total export value-added; E V i represents the export value-added of sector i . Q ( = E V ) represents the total export scale. S i ( = E V i / E V ) is the ratio of the export value added of sector i to the total export value added, representing the structural composition of the total export value added. I i ( = E C i / E V i ) is the ratio of the export trade embodied carbon of sector i to the export value added of sector i , representing the embodied carbon intensity of sector i . This indicator reflects the production technology and energy technology levels of sector i .
Further, this paper has decomposed the changes in the total embodied carbon in export trade from period 0 to t according to the decomposition method shown in this equation:
Δ E C = E C t E C 0 = Δ E C Q + Δ E C S + Δ E C I
In the above equation, Δ E C Q is the export scale effect, representing the changes in embodied carbon in export trade caused by changes in export value added. Δ E C S is the export structure effect, representing the changes in embodied carbon in export trade caused by changes in the export structure. Δ E C I is the carbon intensity effect, implying the changes in embodied carbon in export trade caused by technological changes of various sectors. According to the LMDI model, the equations of the three variables above are as follows:
Δ E C Q = i E C i t E C i 0 ln E C i t ln E C i 0 ln ( Q t Q 0 )
Δ E C S = i E C i t E C i 0 ln E C i t ln E C i 0 ln ( S i t S i 0 )
Δ E C I = i E C i t E C i 0 ln E C i t ln E C i 0 ln ( I i t I i 0 )

4. Results and Discussion

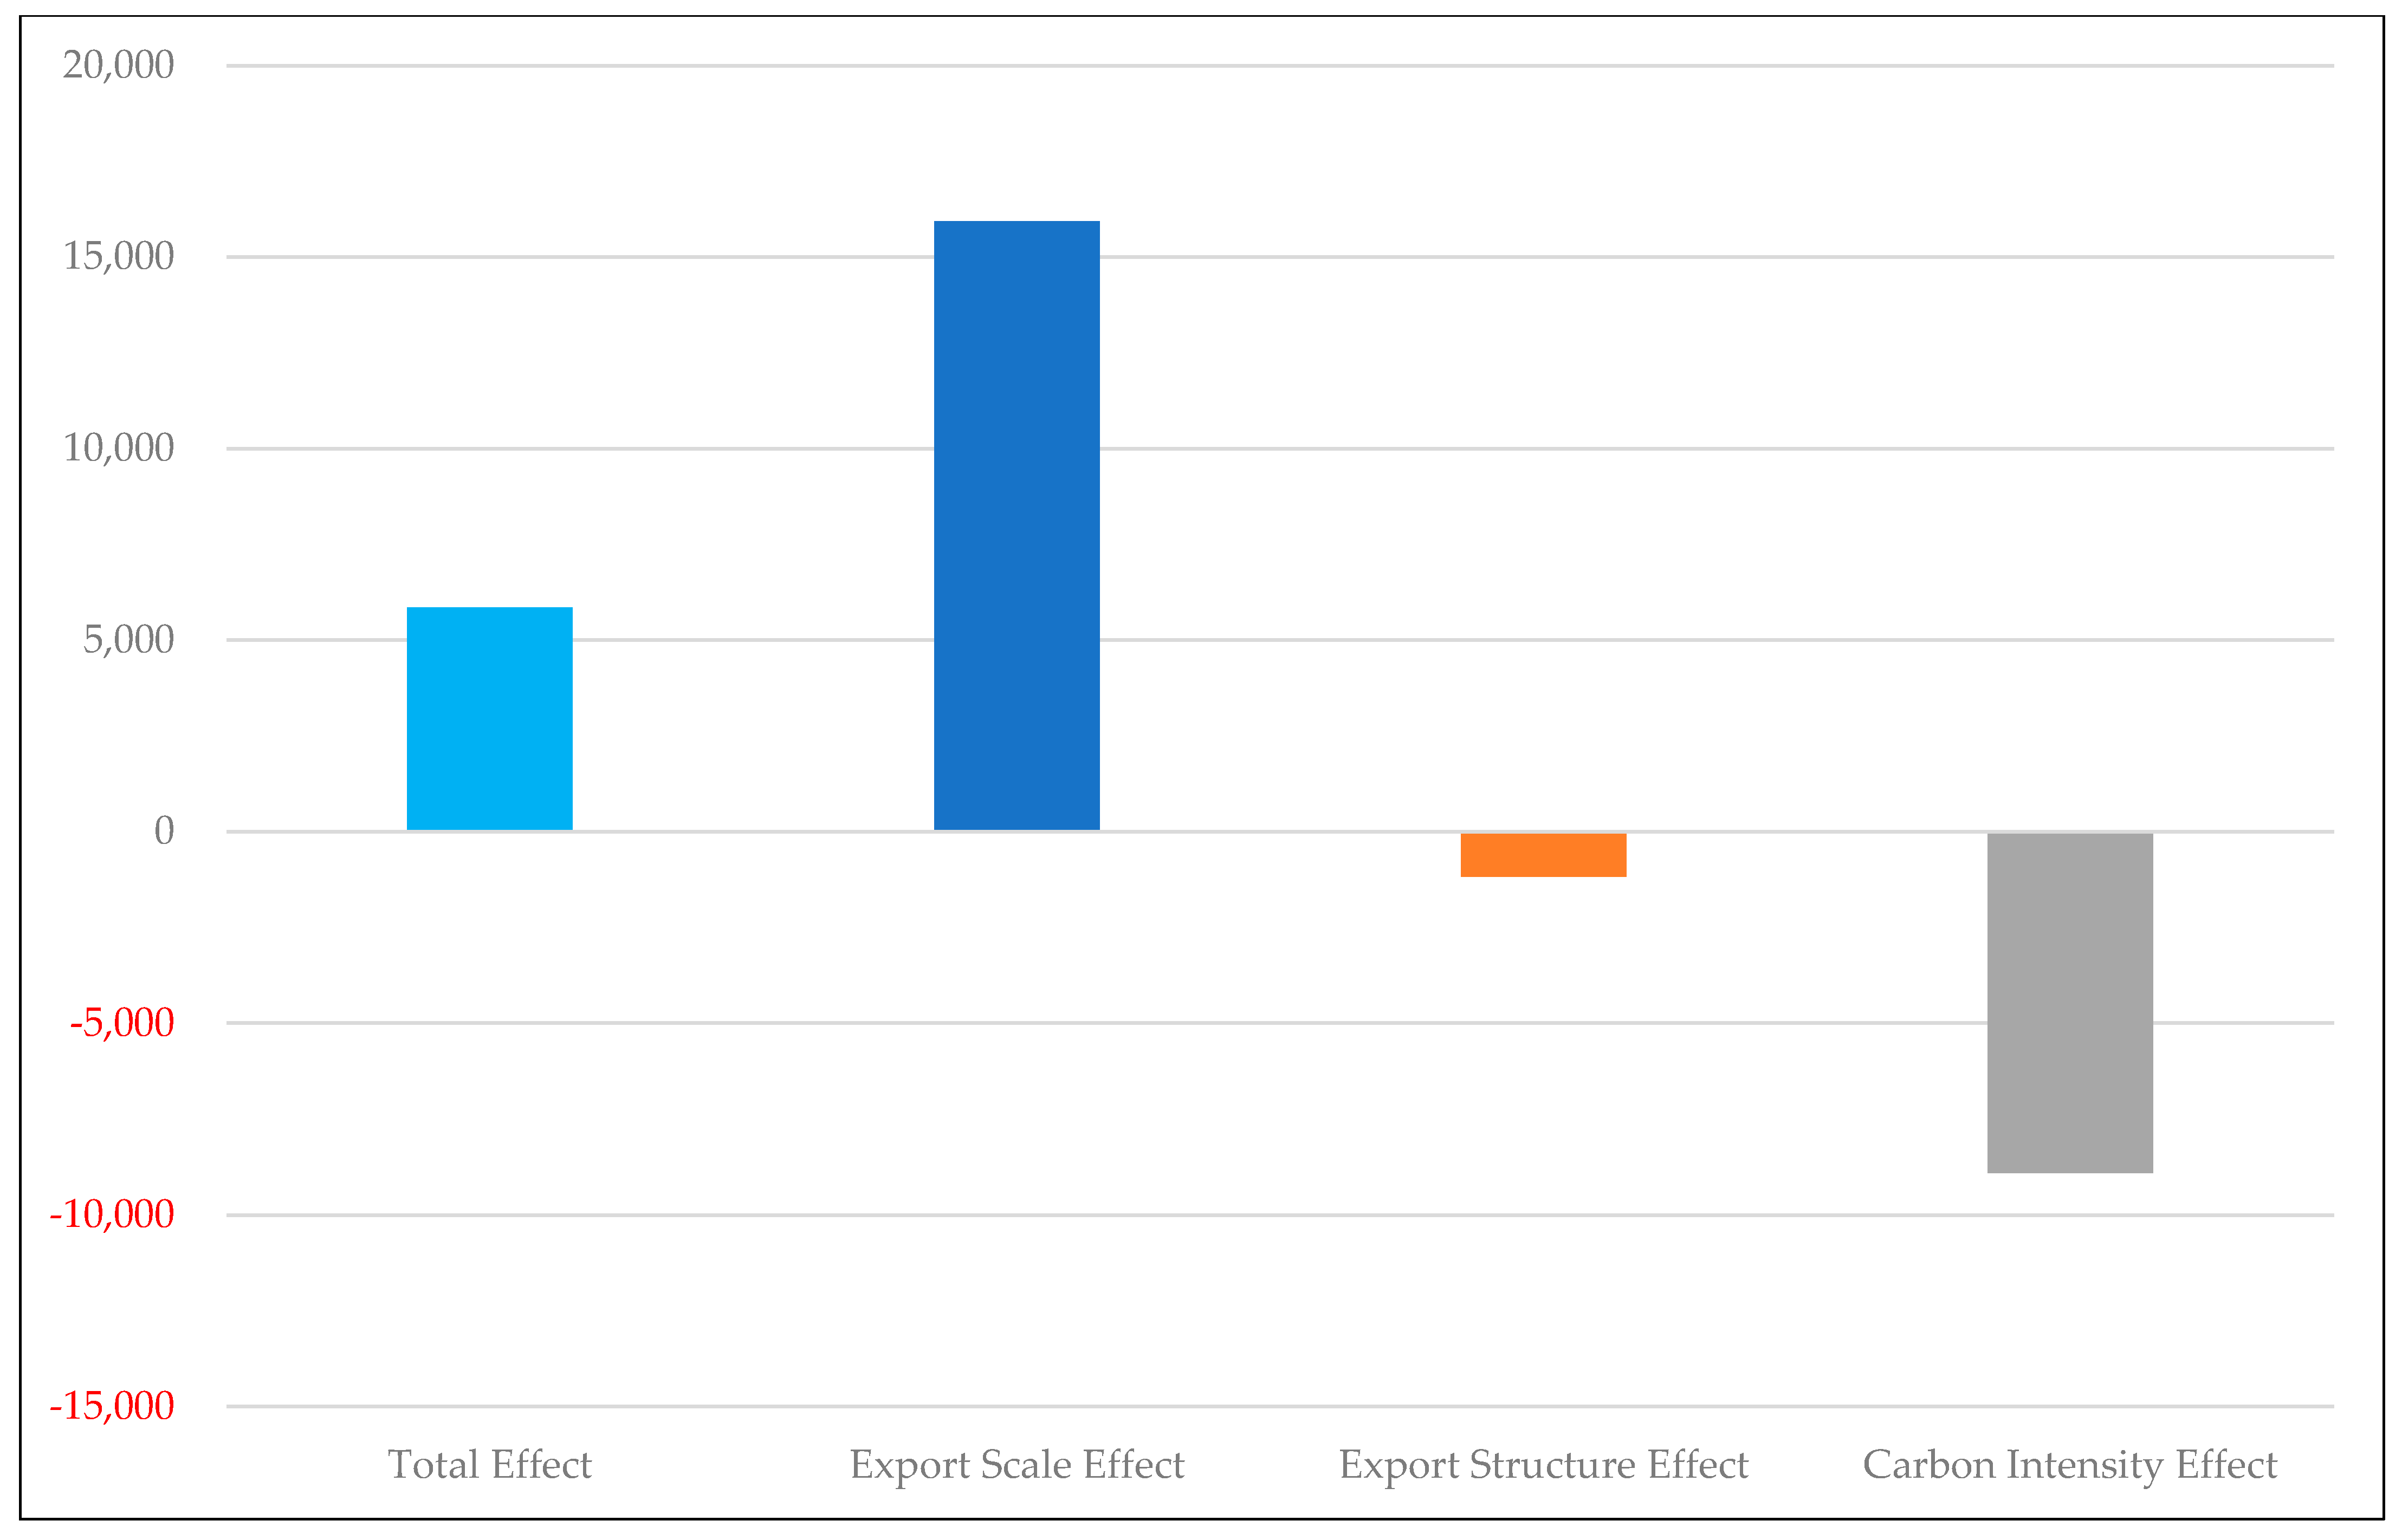
4.1. Analysis of Overall Influencing Factors of Embodied Carbon in China’s Export Trade

Based on the LMDI model and the WIOD data, this paper has decomposed the influencing factors of embodied carbon in China’s export trade. The results obtained are shown in Figure 1:
In the graph above, the bars represent the change in carbon embodied in export trade between two years. In terms of the export scale effect, the change in the embodied carbon in export trade caused by the export scale effect from 2000 to 2001 was 37.18 million tons, and it has been increasing since then. Between 2006 and 2007, the export scale effect reached a local maximum of 405 million tons. From 2008 to 2009, the export scale declined due to the financial crisis, and the export scale effect showed a negative value of −226 million tons during the research period. Between 2009 and 2010, the export scale effect recovered to 403 million tons and then declined, but remained at a level above 90 million tons. Therefore, the changes in the embodied carbon of export trade caused by the export scale effect are generally positive and the value of the export scale effect is relatively large, and only has a negative value in very few cases.
In terms of the export structure effect, the change in the embodied carbon in export trade caused by the export structure effect from 2000 to 2001 was 9.64 million tons, which has increased since then. During the period of 2003–2004, the export structure effect was 180 million tons. After a short period of decline, it rose to 159 million tons during the period of 2006–2007, and then dropped to a negative value. From 2008 to 2009, the export structure effect reached its lowest value of −183 million tons, and rebounded to 118 million tons during the period of 2009–2010. During 2010-2011 and 2011–2012, the export structure effect dropped to a negative value again, but rose to a positive value after that and remained below 100 million tons. Therefore, the export structure effect in the embodied carbon in export trade is generally positive, with negative values appear from time to time. The value of the export structure effect is relatively small compared to the export scale effect. However, from the perspective of reducing the embodied carbon in export trade as well as lowering the environmental cost of international trade, China’s export structure has been deteriorating during most of the research period. Only for a few years has the embodied carbon declined due to the optimization of the export structure.
In terms of the carbon intensity effect, the change in the embodied carbon in export trade caused by the carbon intensity effect from 2000 to 2001 was −26.36 million tons, which showed a downward trend thereafter. From 2006 to 2007, the carbon intensity effect reached its lowest value of −420 million tons, and then rebounded. During the period of 2008–2009, the carbon intensity effect showed a positive value of 75.59 million tons, and then dropped to a negative value, and fluctuated at around −100 million tons. Therefore, the impact of the carbon intensity effect on the embodied carbon in China’s export trade is generally negative, which indicates that during most of the research period, the use of clean energy and technological progress helped reduce the embodied carbon in China’s export trade.
In summary, during the period of 2000–2014, the cumulative change in embodied carbon in export trade caused by the export scale effect was 2.85 billion tons; the cumulative change caused by the export structure effect was 595 million tons; the cumulative change caused by the carbon intensity effect was −1.96 billion tons. The total cumulative change caused by these three types of effects was 1.49 billion tons (as shown in Figure 2).
In Figure 2, the proportions of the export scale effect, the export structure effect, and the carbon intensity effect were 191.56%, 40.03%, and −131.60%, respectively. This indicates that on the one hand, the expansion of the export scale and the deterioration of the export structure caused the embodied carbon in China’s export trade to increase. The deterioration here is from the perspective of carbon emissions. It refers to the increase in the proportion of high energy consuming, high carbon emission, and low value-added sectors in the export structure, while the proportion of clean and high value-added sectors industries declines. The export scale effect was the most important driver of such growth. On the other hand, the use of clean energy and the decline of carbon intensity brought by technological progress helped reduce the embodied carbon in China’s export trade [66].

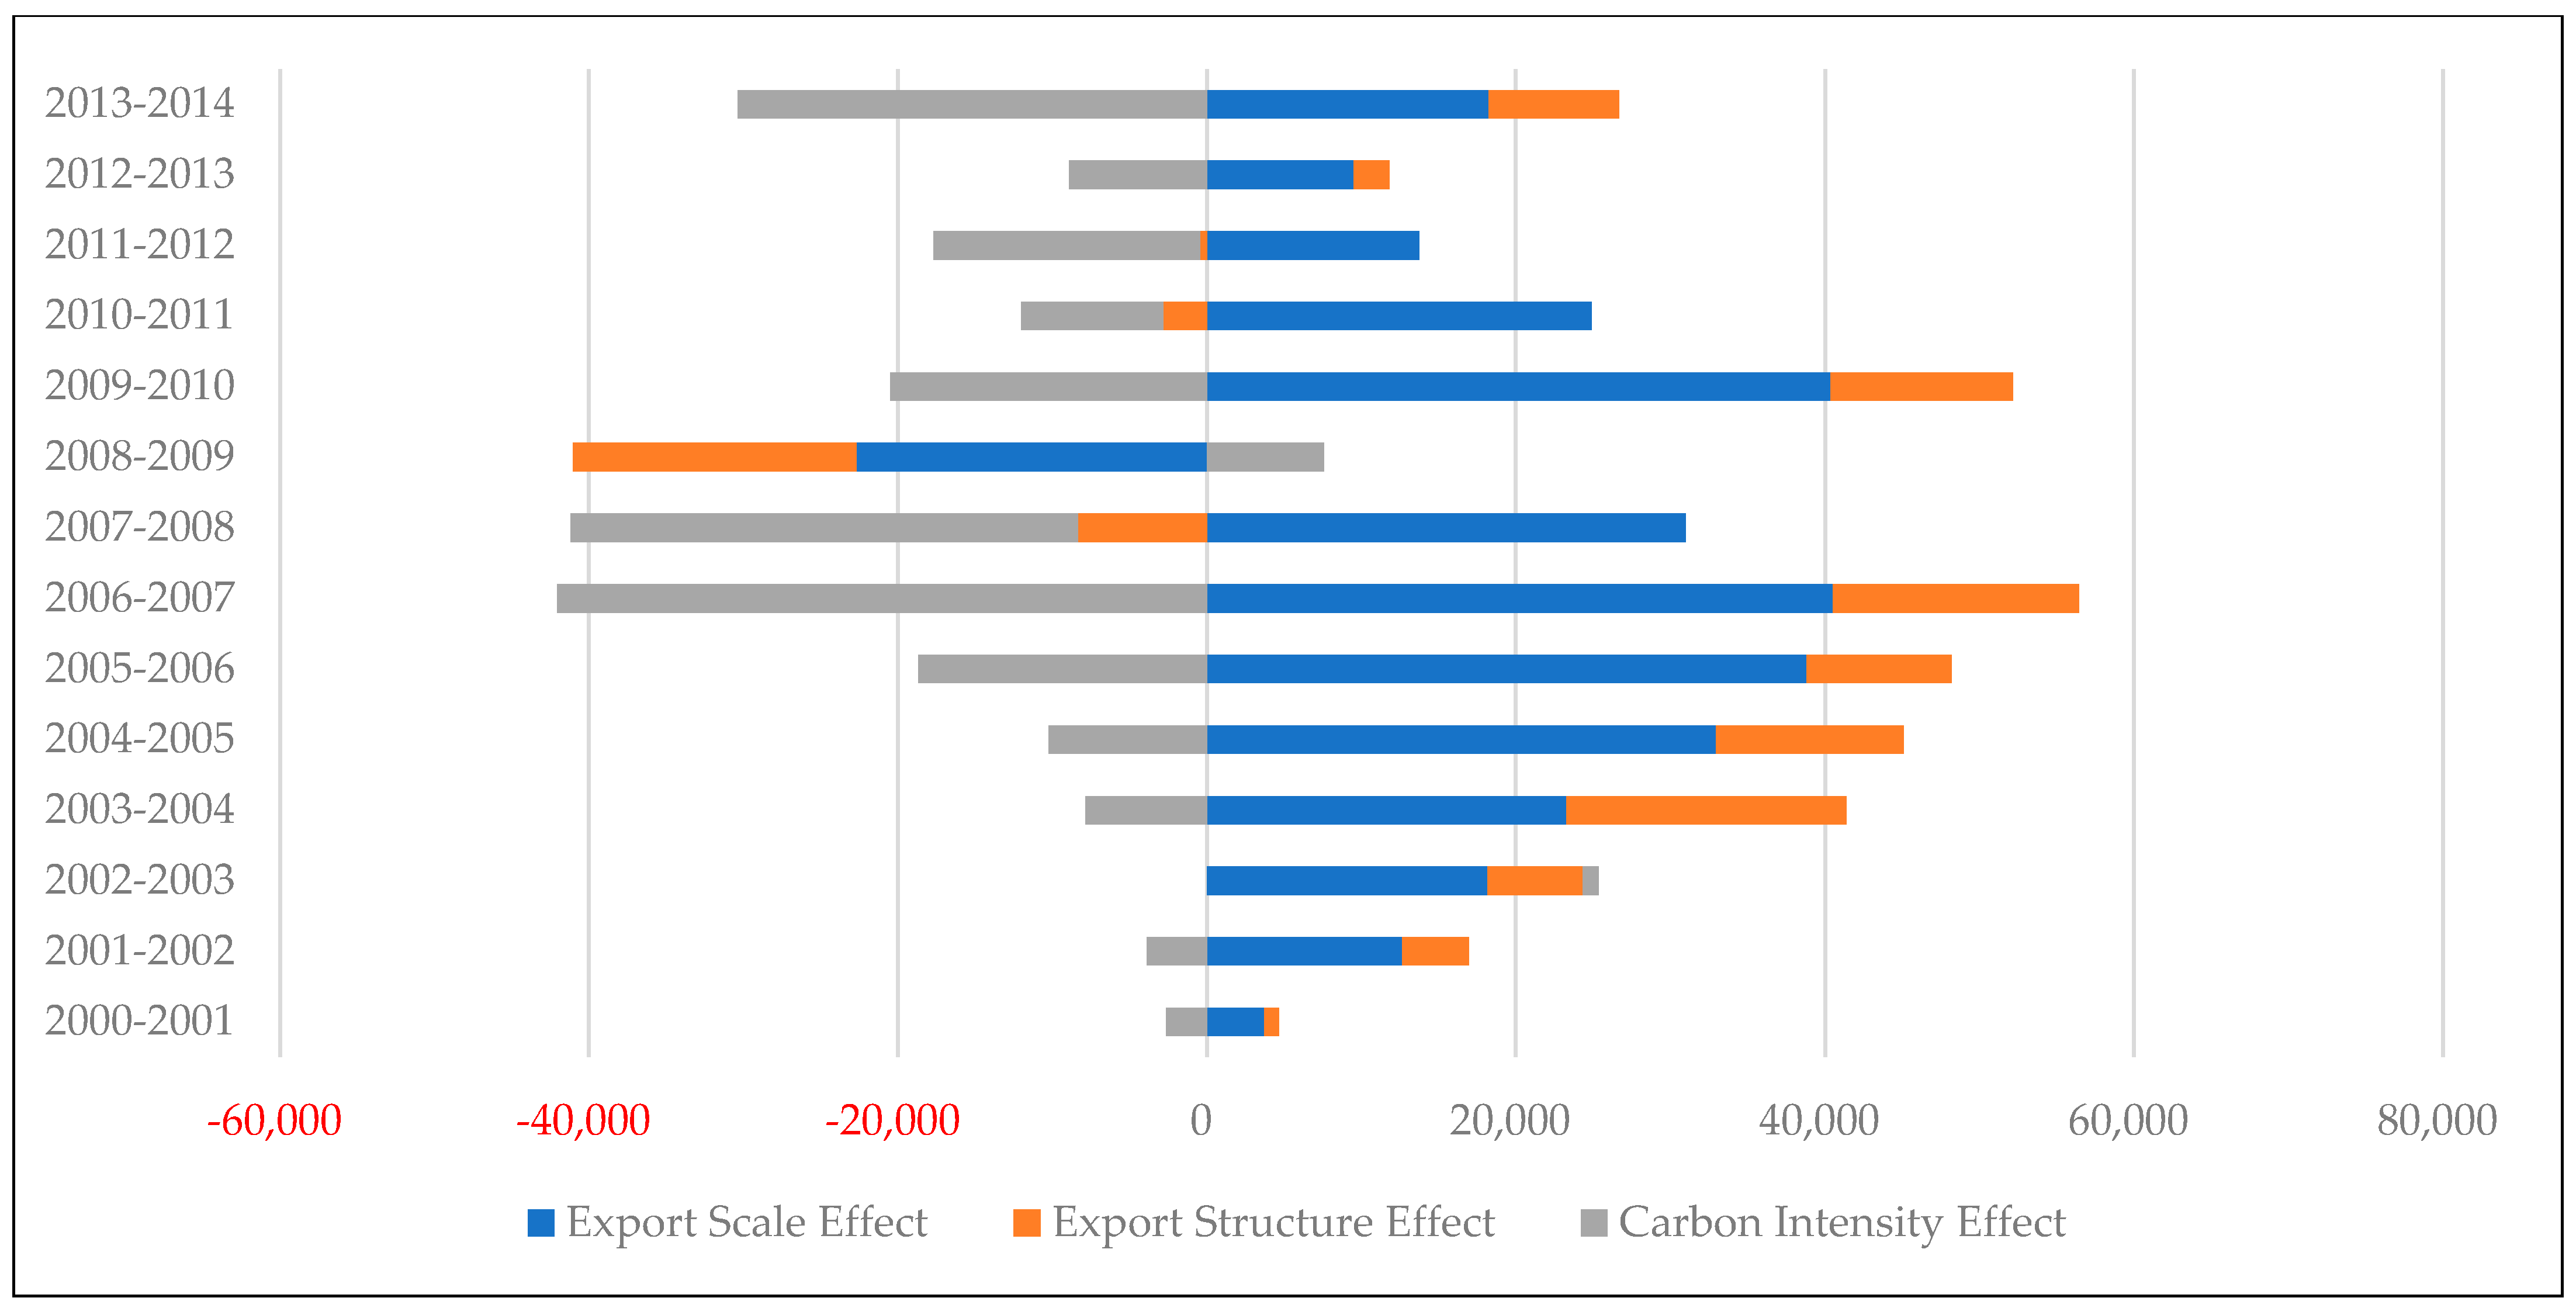
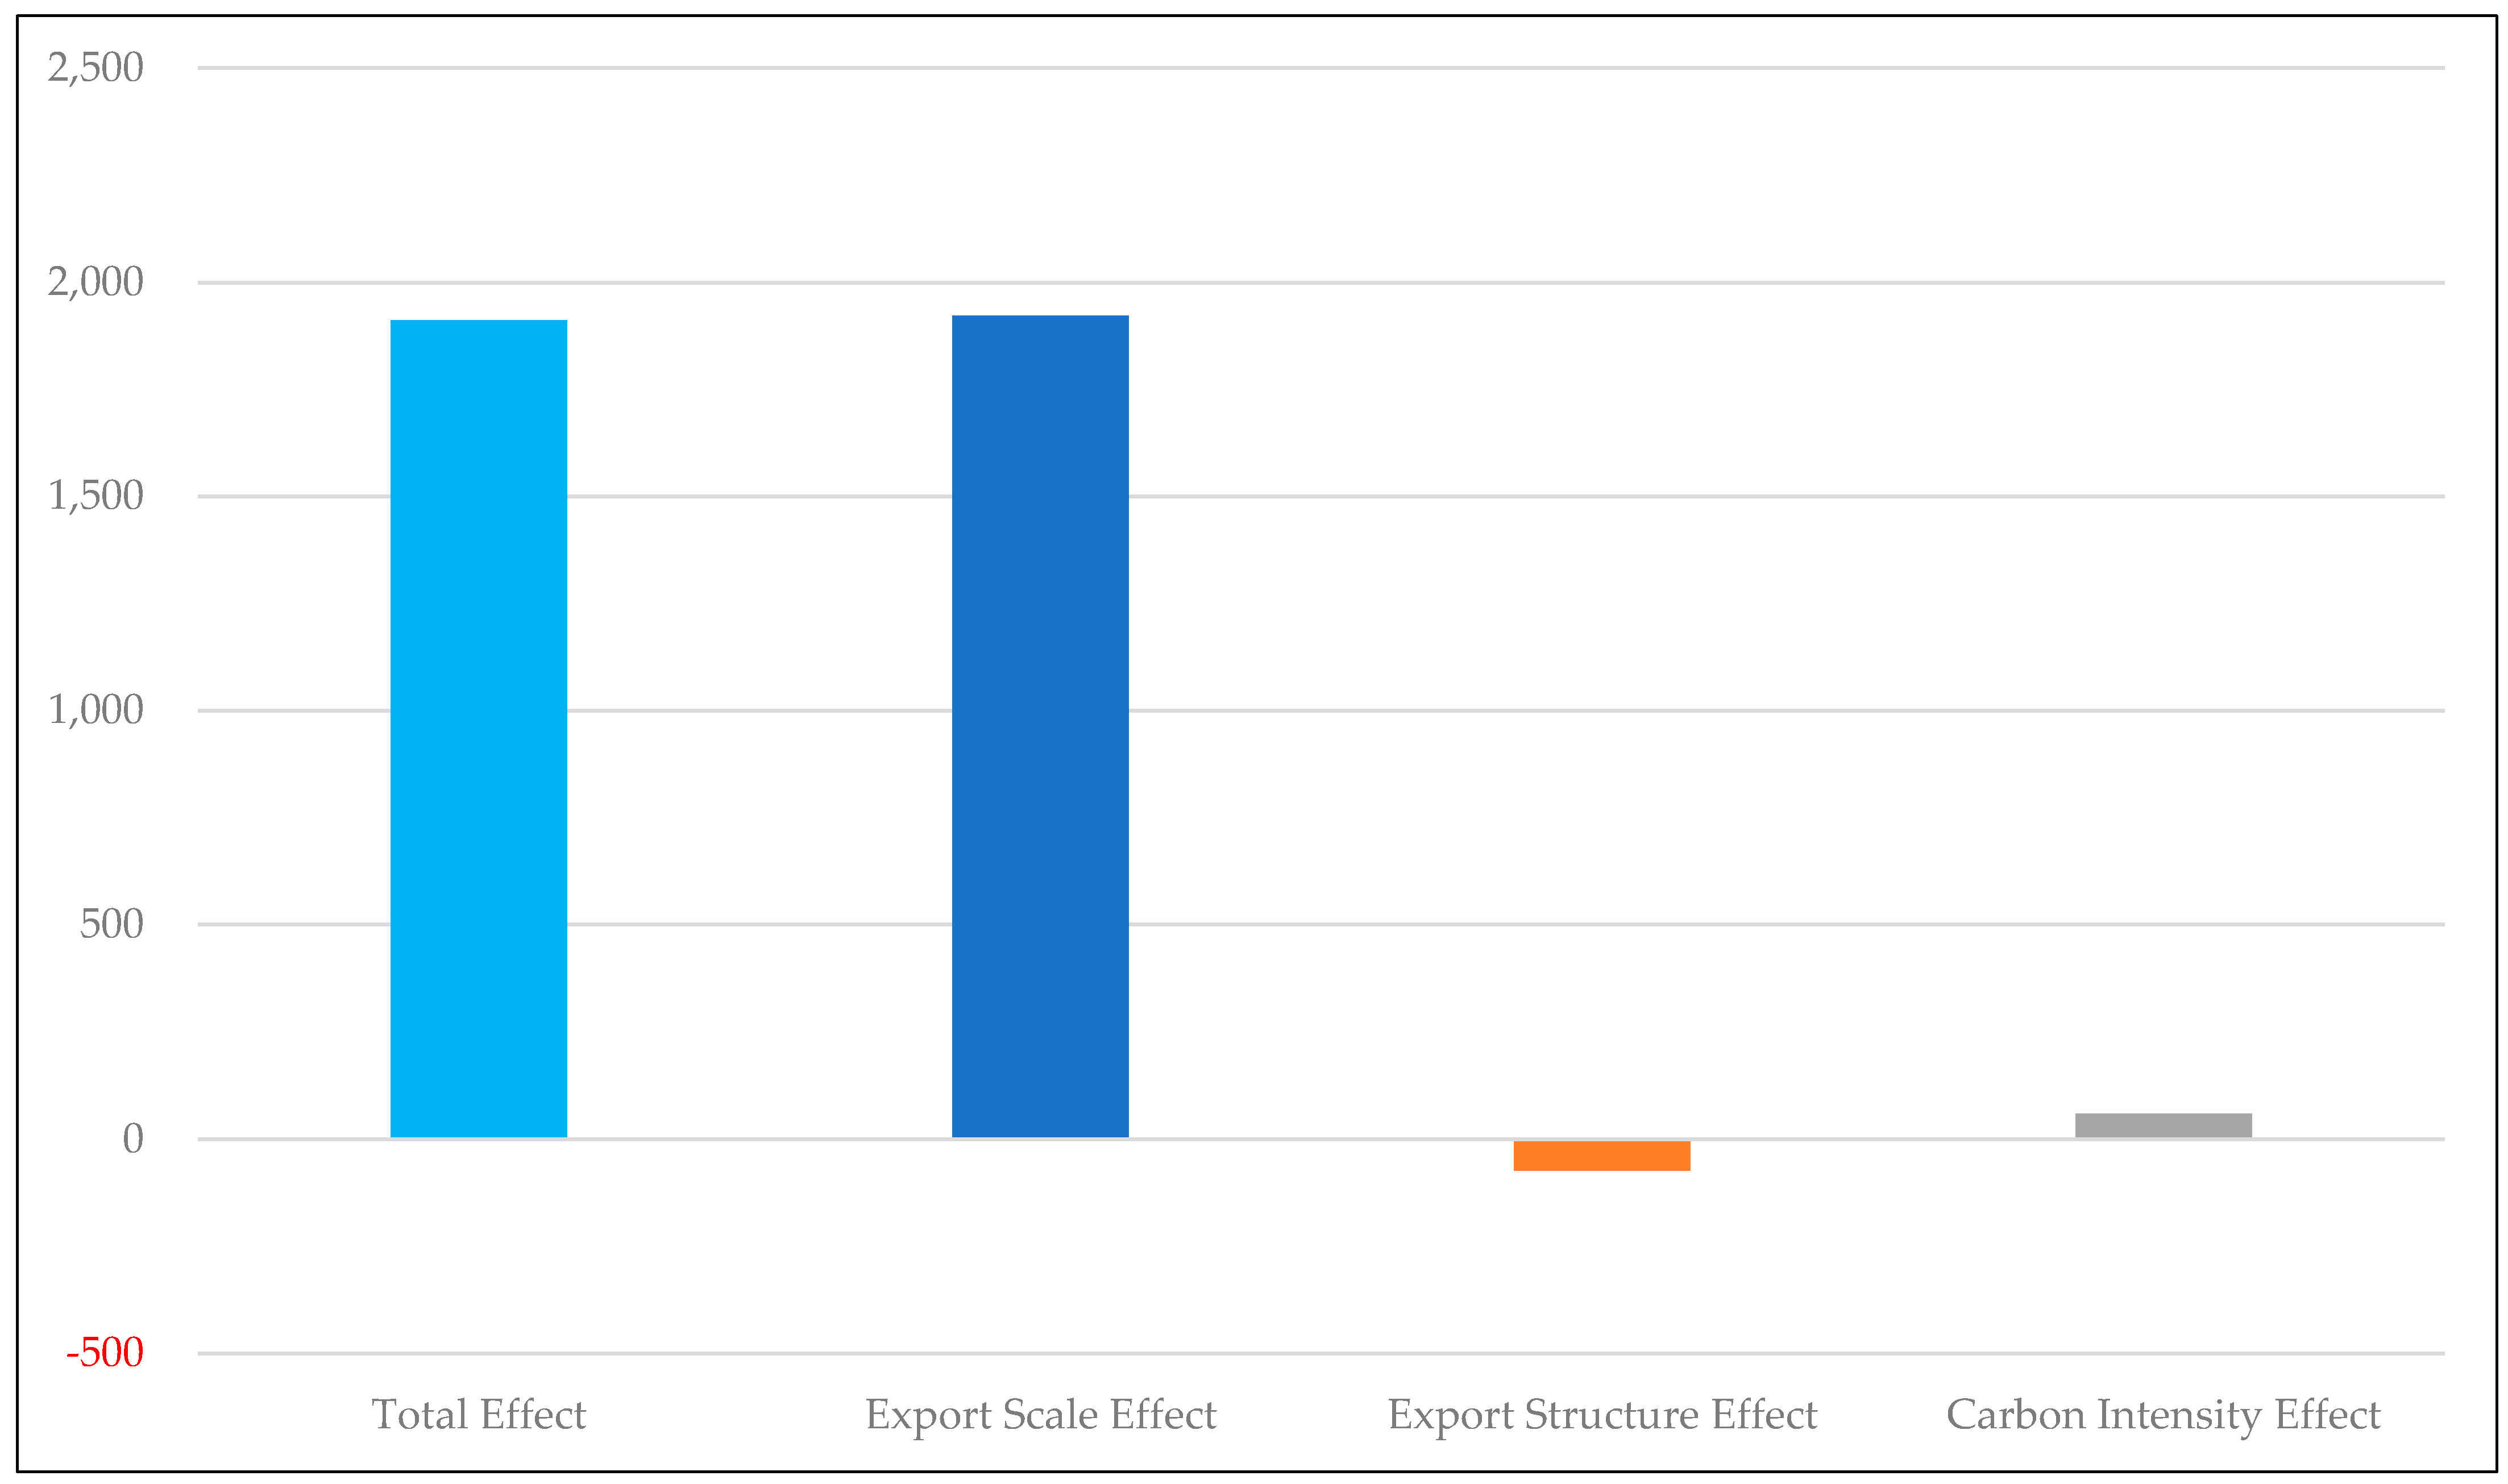
4.2. Analysis of Influencing Factors of Embodied Carbon in the Export Trade of the Primary Industry

Based on the LMDI model and the WIOD data, this paper has decomposed the influencing factors of embodied carbon in the export trade of China’s primary industry. The results obtained are shown in Figure 3:
In terms of the export scale effect of the primary industry, during the period of 2000–2001, the change of the embodied carbon caused by the export scale effect was −375.2 thousand tons, which experienced a gradual increase thereafter. During the period of 2004–2005, the export scale effect increased to a maximum value of 6.00 million tons, but continued to decline thereafter and reached a minimum value of −2.24 million tons during the period of 2008–2009. The export scale effect of the primary industry rebounded to 1.47 million tons between 2009 and 2010, and then fluctuated around 1 million tons. Overall speaking, the changes of the embodied carbon in the export trade of the primary industry caused by the export scale effect are basically positive, with negative values appearing only in a few years. During the research period, the export scale effect has shown large positive values during the early stage, and its absolute value has decreased in the later stage.
In terms of the export structure effect of the primary industry, the changes of the embodied carbon caused by the export structure effect were relatively small, and mostly negative. During the research period, the export structure of China’s primary industry has not experienced major changes, so the changes of embodied carbon caused by the export structure effect were relatively small.
In terms of the carbon intensity effect of the primary industry, during 2000–2001, the change of embodied carbon in the export trade of the primary industry caused by the carbon intensity effect was 142.4 thousand tons, which showed some increase thereafter. Between 2003 and 2004, the change of embodied carbon caused by the carbon intensity effect was 2.48 million tons, which has declined since then. The carbon intensity effect is mostly negative in terms of the embodied carbon in the export trade of the primary industry.
In summary, during the period of 2000–2014, the cumulative change of embodied carbon in the export trade of the primary industry caused by the export scale effect was 19.23 million tons; the cumulative change caused by the export structure effect was −722.3 thousand tons; the cumulative change caused by the carbon intensity effect was 604.7 thousand tons. The total cumulative change caused by these three types of effects was 19.11 million tons (as shown in Figure 4).
In the above Figure 4, the proportions of the export scale effect, the export structure effect, and the carbon intensity effect were 100.62%, −3.78%, and 3.16%, respectively. This indicates that on the one hand, the expansion of the export scale is the most important driver of the embodied carbon in the export trade of the primary industry. The improvement of the export structure has helped reduce the embodied carbon to a certain extent. However, since the export structure of the primary industry has not changed much, the impact of the export structure effect is relatively small. On the other hand, the carbon intensity effect has led to an increase in the embodied carbon in the export trade of the primary industry. This is mainly due to the fact that the production technology of China’s primary industry is not advanced and the emissions from the consumption of non-clean energy would also lead to the growth of embodied carbon in the export trade [67,68].

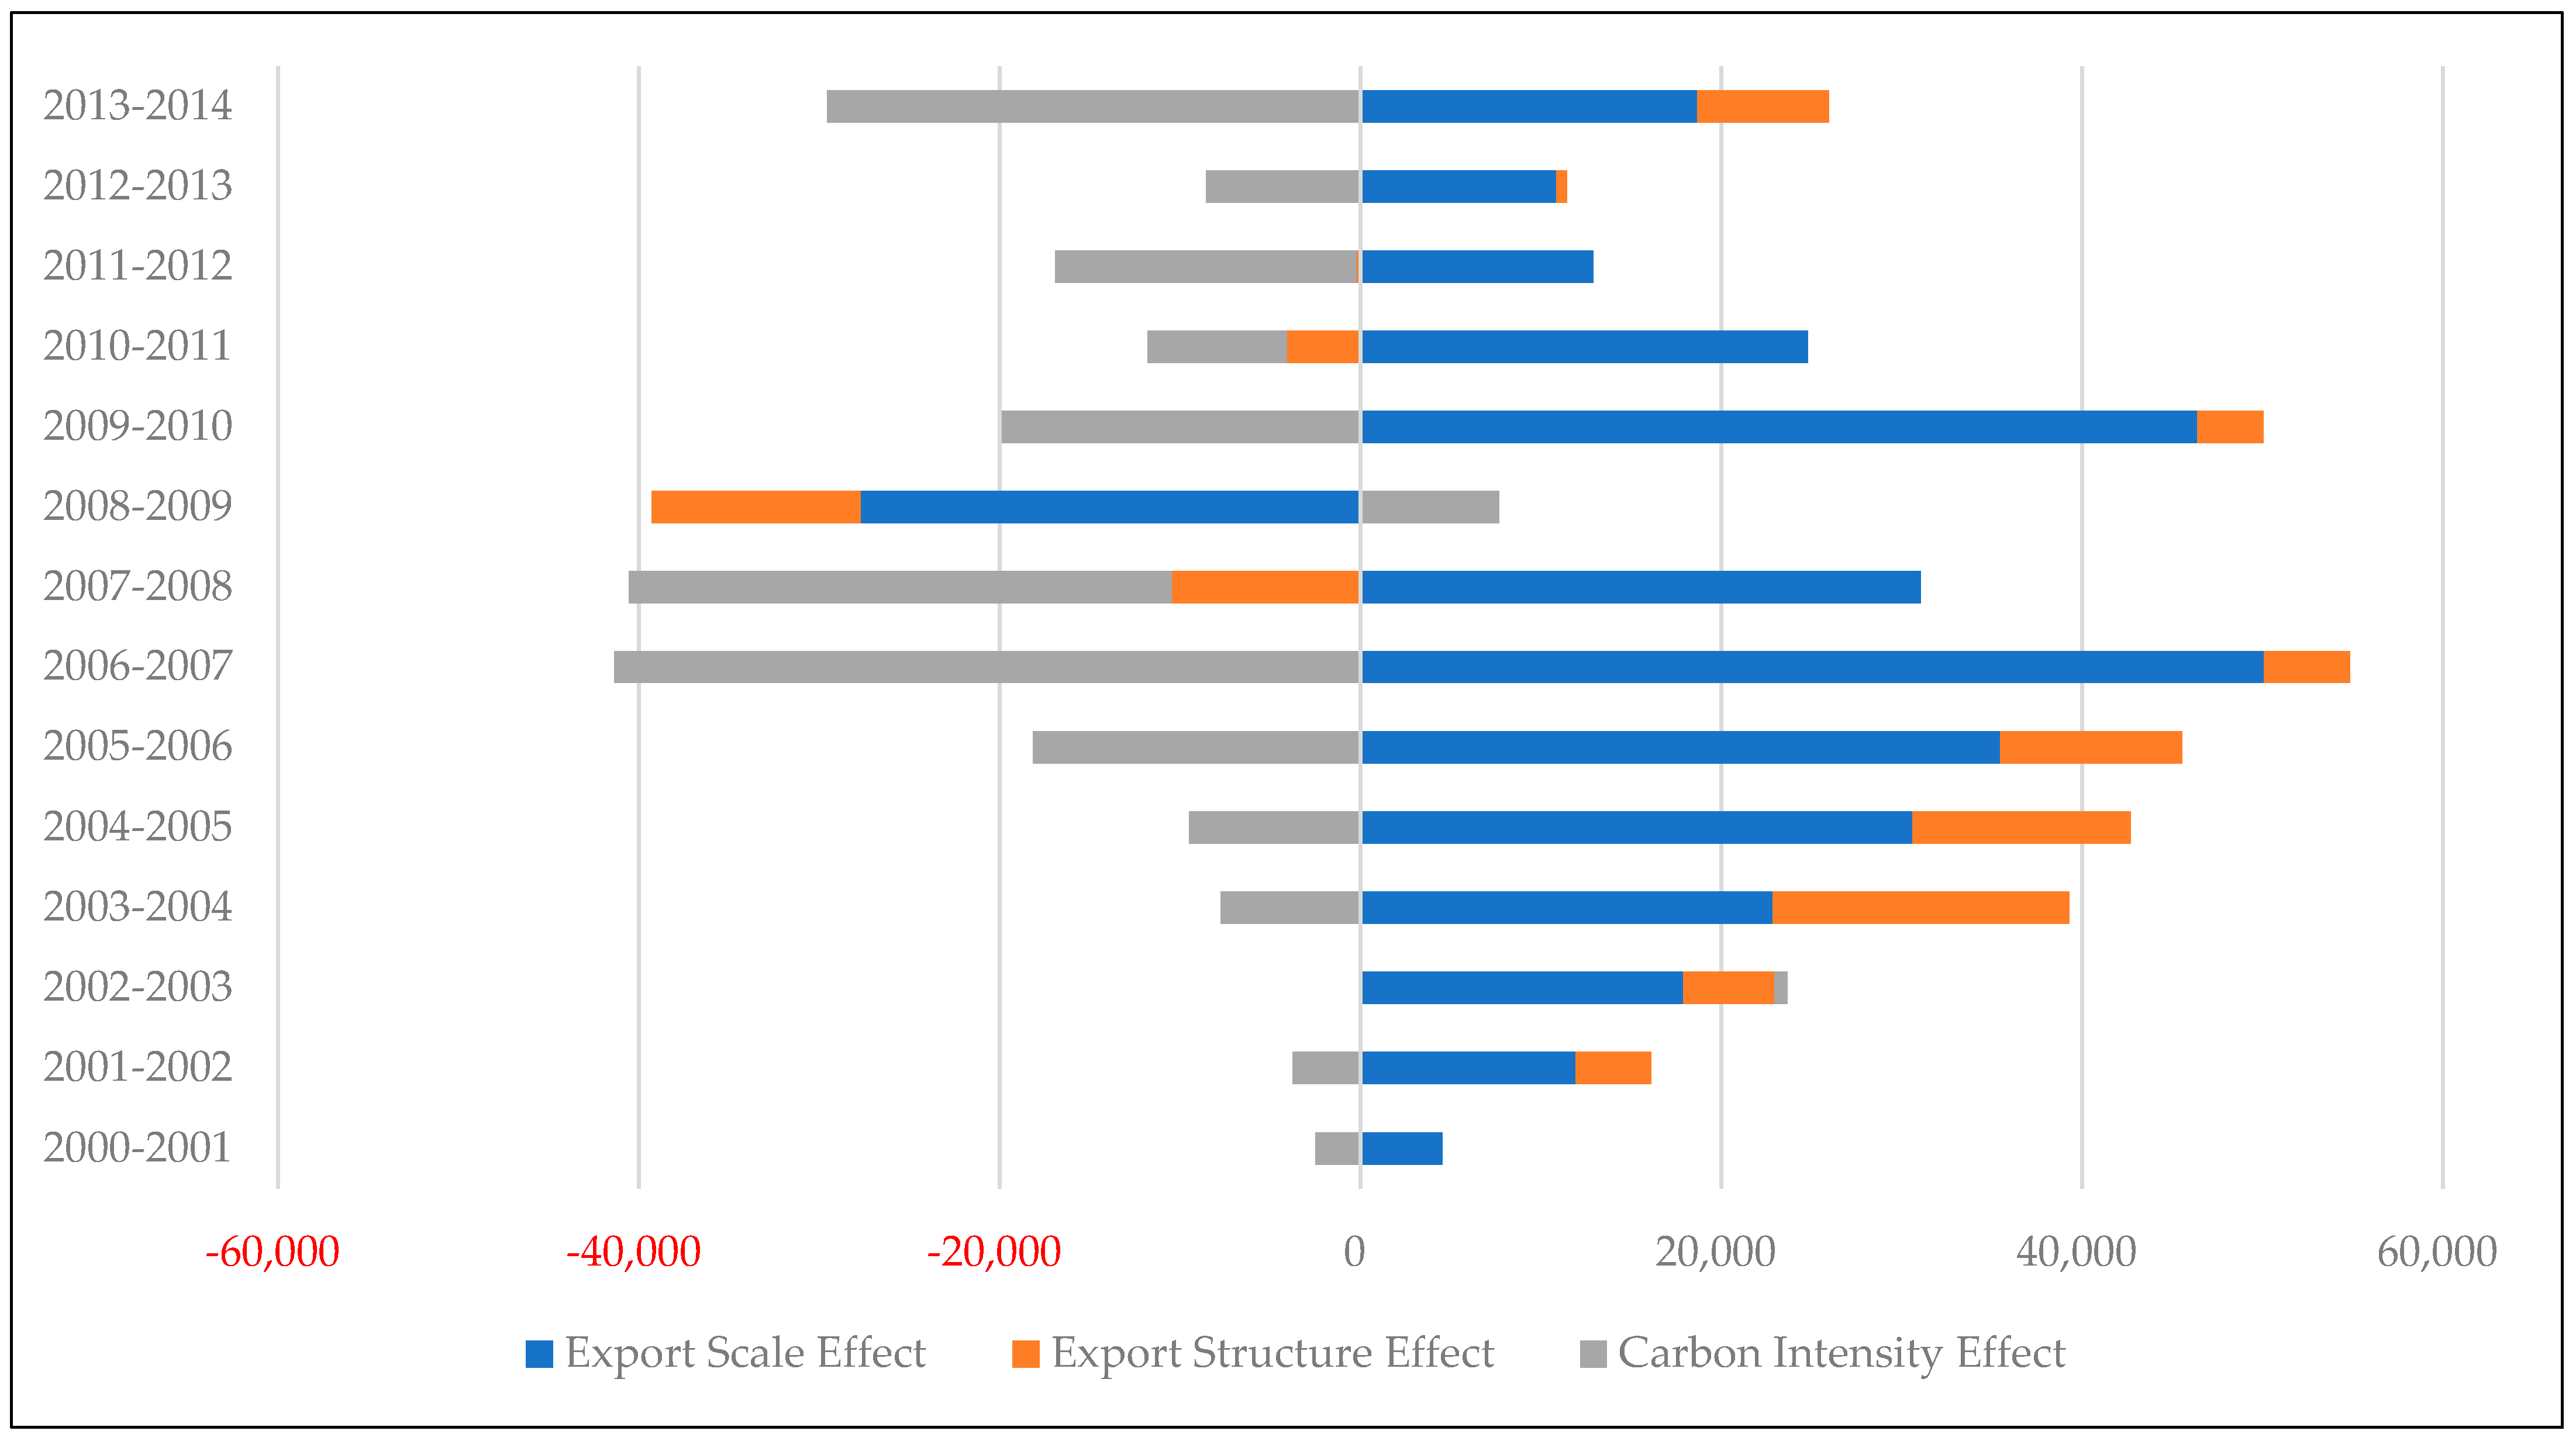
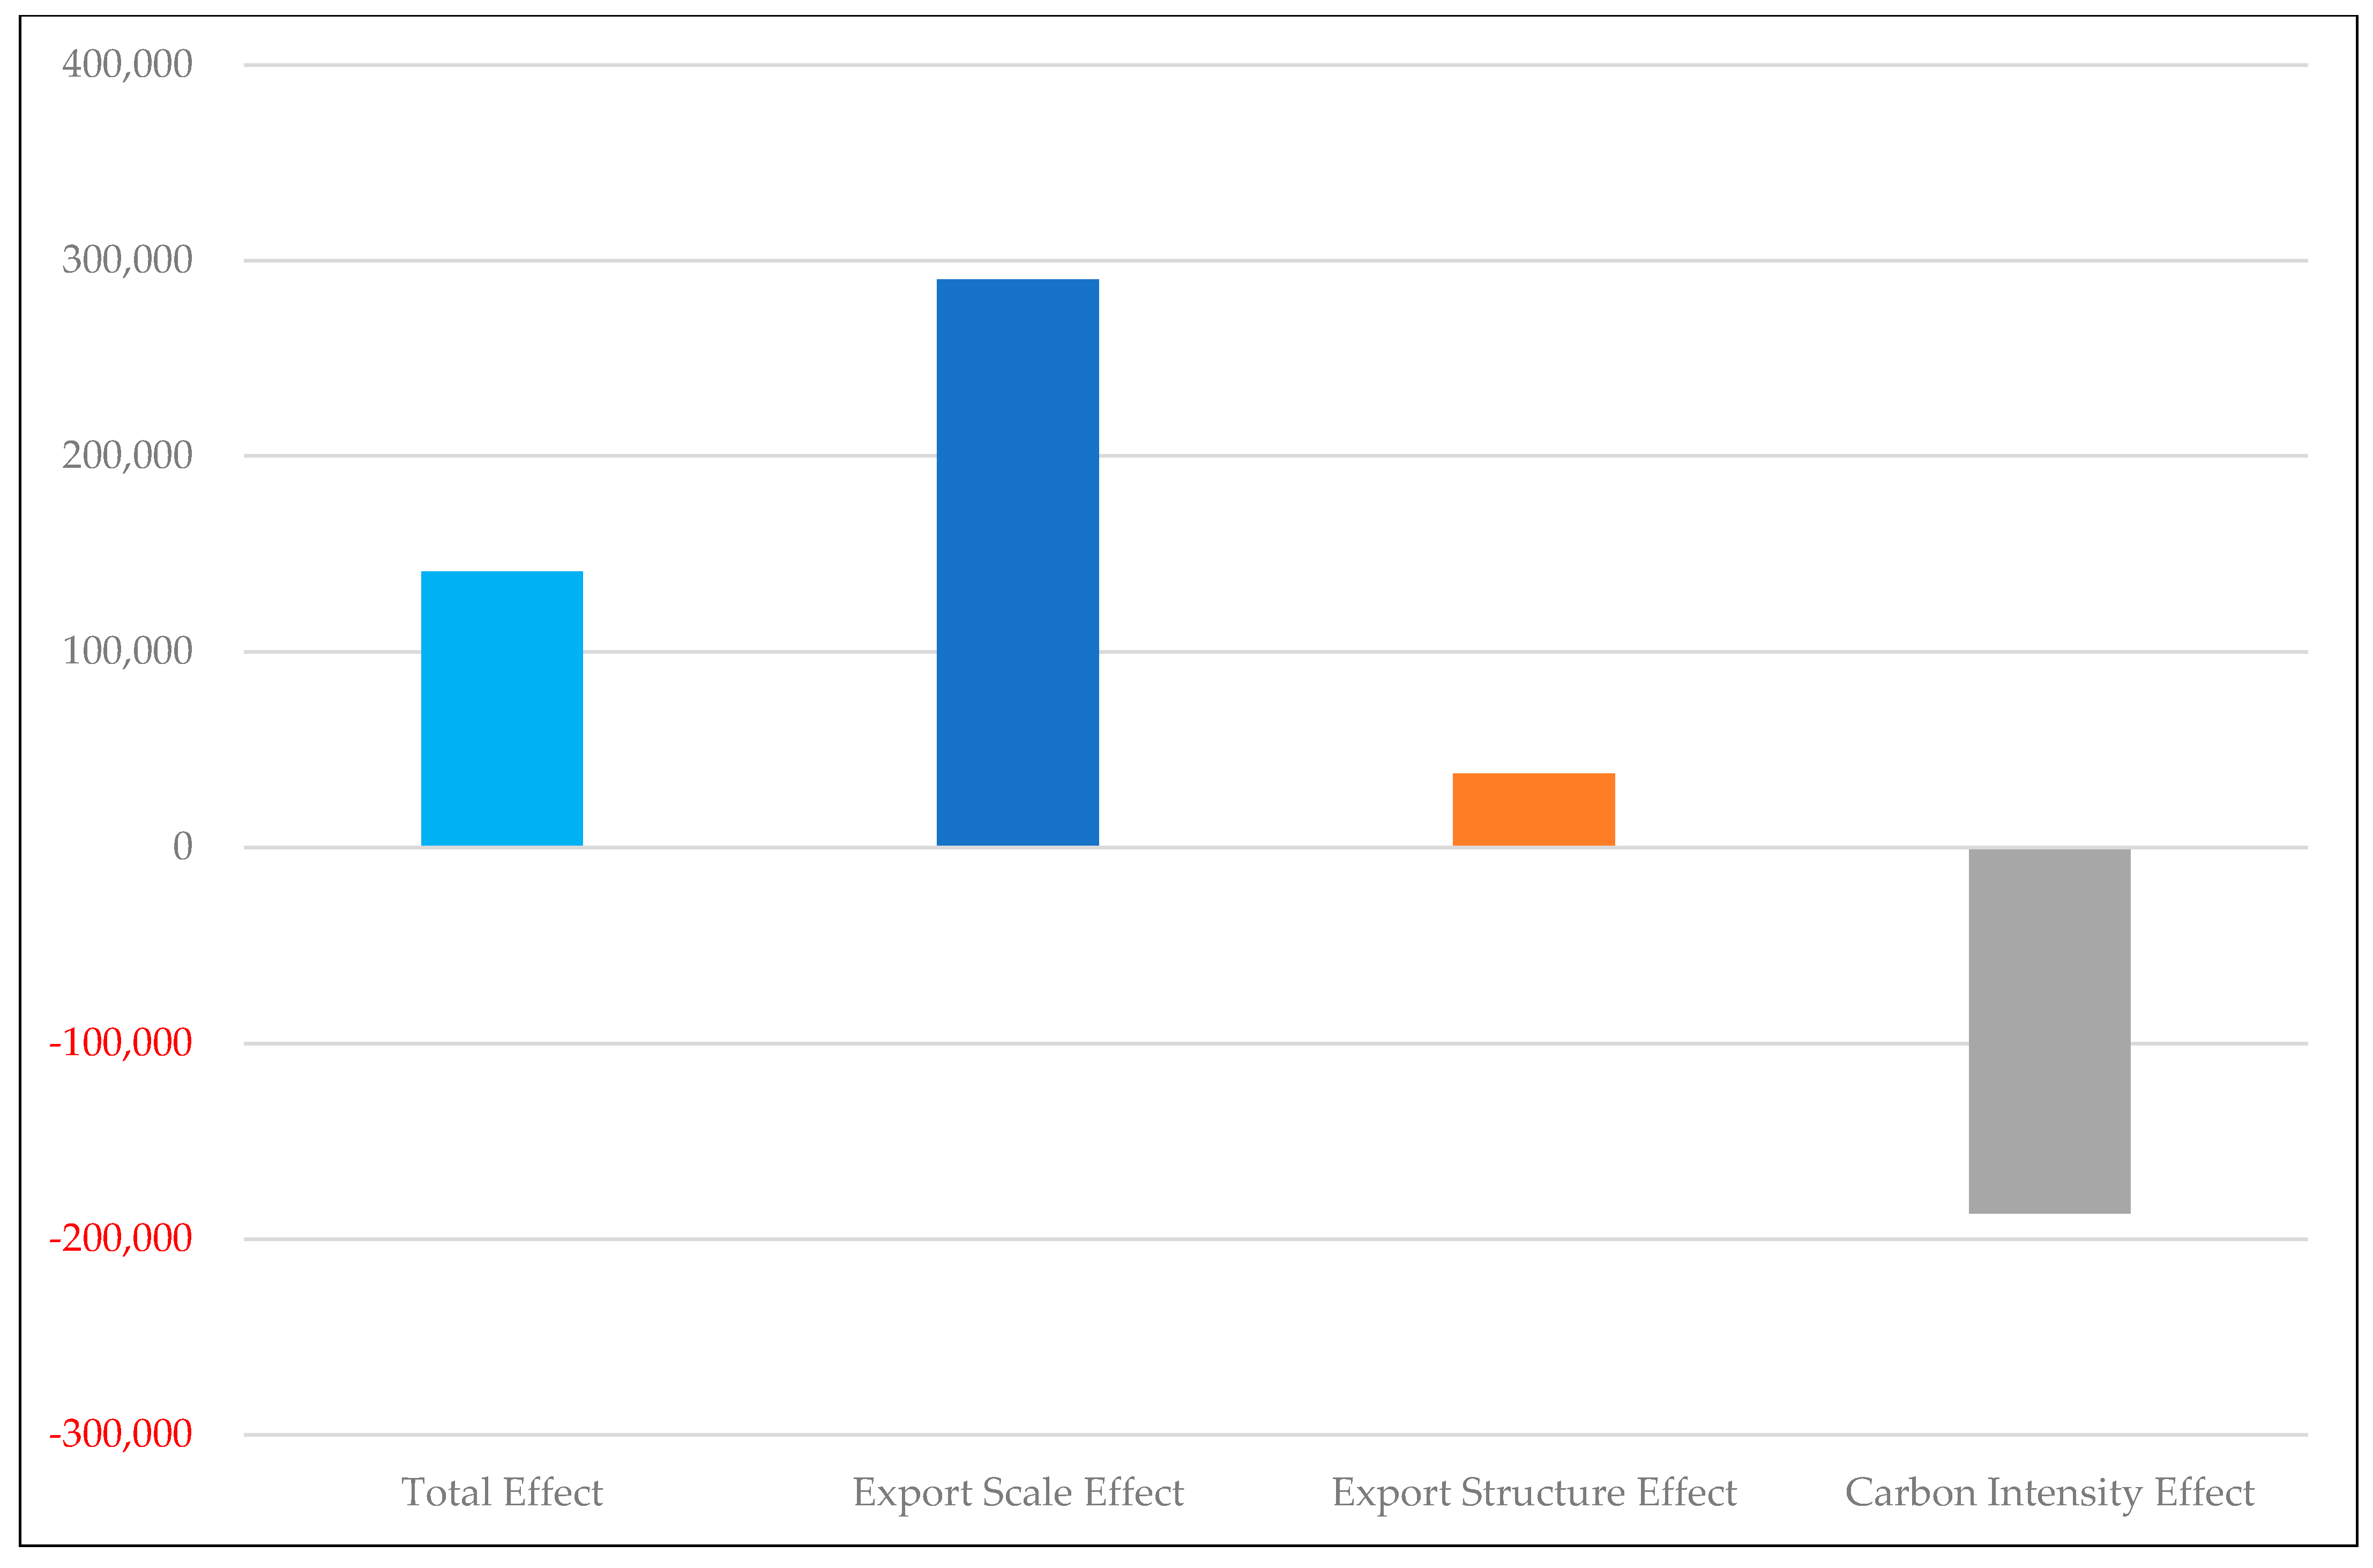
4.3. Analysis of Influencing Factors of Embodied Carbon in the Export Trade of the Secondary Industry

Based on the LMDI model and the WIOD data, this paper has decomposed the influencing factors of embodied carbon in the export trade of China’s secondary industry. The results obtained are shown in Figure 5:
In terms of the export scale effect of the secondary industry, during the period of 2000–2001, the change of the embodied carbon caused by the export scale effect was 45.47 million tons, which continued to increase thereafter. Between 2006 and 2007, the export scale effect reached 500 million tons. The export scale effect only turned negative (−277 million tons) once during the period of 2008–2009. After that, it rebounded to 463 million tons between 2009 and 2010 with a downward trend, and remained above 100 million tons. Overall, the changes of the embodied carbon in the export trade of the secondary industry caused by the export scale effect are basically positive, and the value of the export scale effect is relatively large.
In terms of the export structure effect of the secondary industry, the changes of the embodied carbon caused by the export structure effect first increased, and then decreased, and then rebounded. The export structure effect remained positive during most of the research period, which indicates that the export structure of the secondary industry is deteriorating, thus leading to the growth of the embodied carbon in the export trade of the secondary industry.
In terms of the carbon intensity effect of the secondary industry, the changes of the embodied carbon caused by this effect showed the trend of decline, a short rise, and then decline again. This effect remained negative for most of the research period, which indicates that the use of clean energy and technological progress have reduced the embodied carbon in the export trade of the secondary industry.
In summary, during the period of 2000–2014, the cumulative change of embodied carbon in the export trade of the secondary industry caused by the export scale effect was 2.9 billion tons; the cumulative change caused by the export structure effect was 376 million tons; the cumulative change caused by the carbon intensity effect was −1.87 billion tons. The total cumulative change caused by these three types of effects was 1.41 billion tons (as shown in Figure 6).
In the above Figure, the proportions of the export scale effect, the export structure effect, and the carbon intensity effect were 205.67%, 26.67%, and −132.62%, respectively. This indicates that the export scale effect is the most important driver of embodied carbon increase in the secondary industry. Secondly, the export structure effect has also caused growth of the embodied carbon in the export trade, which indicates that from the perspective of environmental costs, the export structure of China’s secondary industry is deteriorating. Finally, the decrease of the carbon intensity effect has caused a decline of the embodied carbon in the export trade of the secondary industry, with a relatively significant impact.

4.4. Analysis of Influencing Factors of Embodied Carbon in the Export Trade of the Tertiary Industry

Based on the LMDI model and the WIOD data, this paper has decomposed the influencing factors of embodied carbon in the export trade of China’s tertiary industry. The results obtained are shown in Figure 7:
In terms of the export scale effect of the tertiary industry, the change of the embodied carbon in the export trade of the tertiary industry caused by this effect repeated the patterns of increase first and then decrease during the research period. During most of the research period, the export scale effect remained positive, which indicates that the expansion of the export scale has caused the growth of the embodied carbon in the export trade of the tertiary industry. One exception is that during the period of 2008–2009, due to the impact of the financial crisis, the decrease of the export scale led to a decline in the embodied carbon in the export trade of the tertiary industry.
In terms of the export structure effect of the tertiary industry, the changes of the embodied carbon caused by this effect showed large fluctuations during the research period, with no obvious trend that can be identified. Overall speaking, during most of the research period, the export structure effect was negative, which indicates that the improvement of the export structure of the tertiary industry has caused a decline in the embodied carbon of export trade.
In terms of the carbon intensity effect of the tertiary industry, the changes of the embodied carbon in export trade caused by this effect remained negative for most of the research period and their values were relatively large, which indicates that the decrease of the carbon intensity effect has caused a large decline of the embodied carbon in the export trade of the tertiary industry.
In summary, during the period of 2000–2014, the cumulative change of embodied carbon in the export trade of the tertiary industry caused by the export scale effect was 1.59 million tons; the cumulative change caused by the export structure effect was −11.83 million tons; the cumulative change caused by the carbon intensity effect was −89 million tons. The total cumulative change caused by these three types of effects was 58.53 million tons (as shown in Figure 8).
In the Figure above, the proportions of the export scale effect, the export structure effect, and the carbon intensity effect were 272.28%, −20.21%, and −152.06%, respectively. This indicates that the export scale effect is the most important driver of embodied carbon increase in the tertiary industry. Secondly, the cumulative change caused by the export structure effect was negative, indicating that the tertiary industry has experienced export structure optimization during foreign trade, which has led to the decrease of the embodied carbon in export trade. Finally, technological progress and the use of clean energy have led to a decline in the carbon intensity effect, as well as a decline in the embodied carbon of the export trade of the tertiary industry [69,70].

4.5. Possible Strategies to Reduce the Impact

Based on the above analysis results of China’s export trade embodied carbon impact factors, the following strategies may be effective means to reduce the impact:
(1)
Calculate the carbon footprint of the relevant sectors. A carbon footprint is a collection of greenhouse gas emissions caused by an organization, business, product or individual through various production and consumption processes. It describes the carbon emissions impact of an individual’s awareness and behavior on the natural world. In order to reduce the impact of carbon embodied in export trade, China needs to start calculating the carbon footprint of relevant sectors included in export trade [71].
(2)
Promote the development of circular economy. China needs to improve resource conservation and recycling in export trade, and organize export trade into a circular process of “resources-products-renewable resources”, so that all materials and energy can be rationally and lastingly utilized in this continuous cycle to reduce carbon emissions and the impact on the natural environment [72].

5. Conclusions

This paper has adopted the LMDI method to decompose the influencing factors of the embodied carbon in China’s export trade, and studies the changes of the embodied carbon from the perspectives of export scale effect, export structure effect and carbon intensity effect in order to discuss the impact of the export scale, export structure and carbon emission intensity of each sector on the embodied carbon of export trade. The calculation results show that overall speaking, the expansion of the export scale is the most important driver of embodied carbon growth. The cumulative impact of the export scale effect was 2.85 billion tons. The deterioration of the export structure is a secondary factor causing the growth of the embodied carbon in China’s export trade. The cumulative impact of the export structure effect was 595 million tons. Meanwhile, the decline of the carbon intensity was an important factor leading to the decrease of the embodied carbon in China’s export trade. The cumulative impact of the carbon intensity effect was −1.96 billion tons.
In China’s national economy, the primary industry refers to agriculture, forestry, animal husbandry and fishery. The secondary industry refers to mining, manufacturing, electricity, heat, gas and water production and supply, and construction. The tertiary industry is the service industry [73].
In terms of the three industries of the national economy, the continuous expansion of the export scale of the primary industry was the most important driver of its embodied carbon growth. The cumulative impact of the export scale effect in the primary industry was 19.23 million tons. During the research period, the export structure of the primary industry has been improved, resulting in a small decline in the embodied carbon of the export trade of the primary industry. The cumulative impact of the export structure effect in the primary industry (such as agriculture, forestry, etc.) was 722.3 thousand tons. Meanwhile, the increase of the carbon intensity has caused increase of the embodied carbon in the export trade of the primary industry. The cumulative impact of the carbon intensity effect in the primary industry was 604.7 thousand tons.
As for the secondary industry, the continuous expansion of its export scale was also the most important driver of embodied carbon increase. The cumulative impact of the export scale effect in the secondary industry was 2.9 billion tons. The deterioration of the export structure of the secondary industry was the secondary factor of embodied carbon increase in the export trade of the secondary industry. The cumulative impact of the export structure effect in the secondary industry was 376 million tons. However, the decrease of carbon intensity played an important role in the reduction of embodied carbon in the export trade of the secondary industry. The cumulative impact of the carbon intensity effect in the secondary industry was −1.87 billion tons.
As for the tertiary industry, the continuous expansion of its export scale was also the most important driver of embodied carbon increase in the export trade. The cumulative impact of the export scale effect in the tertiary industry was 159 million tons. The optimization of the export structure and the decline of carbon intensity have played an important role in the reduction of the embodied carbon in the export trade of the tertiary industry. The cumulative impacts of the export structure effect and the carbon intensity effect in the tertiary industry during the research period were −11.83 million tons and −89 million tons, respectively.
Since the statistical period of the WIOD database ends in 2014, the data analysis and calculation after 2014 need to be explored in future research to reflect the latest changes in the field of embodied carbon in export trade. This is one limitation of our study.
In addition, with the enrichment of research methods and the continuous updating of research tools, we will further tackle the technical problems of incomplete decomposition in the structural decomposition analysis method in the future research, in order to further improve the existing literature on the analysis of factors affecting the embodied carbon in export trade.

Author Contributions

Conceptualization, W.Y. and H.G.; methodology, H.G.; software, H.G.; validation, W.Y., H.G., and Y.Y.; formal analysis, H.G.; resources, W.Y.; data curation, W.Y.; writing—original draft preparation, H.G.; writing—review and editing, W.Y.; visualization, H.G.; supervision, W.Y.; project administration, Y.Y.; funding acquisition, W.Y. and Y.Y. All authors have read and agreed to the published version of the manuscript.

Funding

Weixin Yang was financially supported by the General Project of Shanghai Philosophy and Social Science Planning (2021BGL014). Yunpeng Yang was financially supported by the Youth Project of Shanghai Philosophy and Social Science Planning (2021EJB006).

Institutional Review Board Statement

Not applicable.

Informed Consent Statement

Not applicable.

Data Availability Statement

The calculation data used in this paper come from the WIOD database, which have been explained in the main text.

Conflicts of Interest

The authors declare no conflict of interest.

Appendix A. The Meaning of Variables Used in Calculation

Table A1. The meaning of variables used in Section 3.
VariableMeaning
M Number of countries
N Number of sectors
I The initial input vector of each sector in every country
I i r Initial   input   in   sector   i   in   country   r
v The vector of direct value added coefficients of each sector in every country
v i r The   direct   value - added   coefficient   in   sector   i   in   country   r
A Direct consumption coefficient matrix
A i j r s Consumption   per   unit   of   output   in   sector   j   in   country   s   to   sector   i   in   country   r
F Final demand matrix
F i r s Demand   of   country   s   for   final   product   of   sector   i   in   country   r
X The   total   output   matrix   obtained   by   multiplying   the   inverse   Leontief   matrix   ( I A ) 1   by   the   final   demand   matrix   F
X i r s The   demand   of   country   s   for   the   total   output   of   sector   i   in   country   r
V Value added trade flow matrix
V i r s The   export   value - added   transferred   from   sector   i   in   country   r   to   country   s through trade
E V r Value - added   export   vector   of   sectors   in   country   r
I V r Value - added   import   vector   of   sectors   in   country   r
E C The total embodied carbon in export trade
E C i The   embodied   carbon   in   export   trade   of   sector   i
E V The total export value-added
E V i The   export   value - added   of   sector   i
Q The total export scale
S i The   ratio   of   the   export   value   added   of   sector   i to the total export value added
I i The   ratio   of   the   export   trade   embodied   carbon   of   sector   i   to   the   export   value   added   of   sector   i
Δ E C Total change of embodied carbon in export trade
Δ E C Q The export scale effect
Δ E C S The export structure effect
Δ E C I The carbon intensity effect

References

  1. National Bureau of Statistics of China. China Statistical Yearbook 2002; China Statistic Press: Beijing, China, 2002; ISBN 9787503738265.
  2. National Bureau of Statistics of China. China Statistical Yearbook 2021; China Statistic Press: Beijing, China, 2021; ISBN 9787503796258.
  3. Gil, J. The Language Comprehensive Competitiveness of Chinese: The Objective Perspective. In The Rise of Chinese as a Global Language: Prospects and Obstacles; Springer International Publishing: Cham, Switzerland, 2021; pp. 51–71. ISBN 978-3-030-76171-4. [Google Scholar]
  4. Yang, C.; Tsou, M. Exports and the demand for skilled labor in China: Do foreign ownership and trade type matter? Econ. Model. 2022, 106, 105692. [Google Scholar] [CrossRef]
  5. Wang, Z.; Sun, Z. From Globalization to Regionalization: The United States, China, and the Post-COVID-19 World Economic Order. J. Chin. Polit. Sci. 2021, 26, 69–87. [Google Scholar] [CrossRef] [PubMed]
  6. Kan, S.; Chen, B.; Han, M.; Hayat, T.; Alsulami, H.; Chen, G. China’s forest land use change in the globalized world economy: Foreign trade and unequal household consumption. Land Use Policy 2021, 103, 105324. [Google Scholar] [CrossRef]
  7. Yang, W.; Li, L. Energy Efficiency, Ownership Structure, and Sustainable Development: Evidence from China. Sustainability 2017, 9, 912. [Google Scholar] [CrossRef] [Green Version]
  8. Li, Y.; Yang, W.; Shen, X.; Yuan, G.; Wang, J. Water Environment Management and Performance Evaluation in Central China: A Research Based on Comprehensive Evaluation System. Water 2019, 11, 2472. [Google Scholar] [CrossRef] [Green Version]
  9. Shi, B.; Wang, X.; Gao, B. Transmission and Diffusion Effect of Sino-US Trade Friction along Global Value Chains. Financ. Res. Lett. 2021, 102057. [Google Scholar] [CrossRef]
  10. Bown, C.P.; Erbahar, A.; Zanardi, M. Global value chains and the removal of trade protection. Eur. Econ. Rev. 2021, 140, 103937. [Google Scholar] [CrossRef]
  11. Cheng, D.; Wang, J.; Xiao, Z. Global value chain and growth convergence: Applied especially to China. Pacific Econ. Rev. 2021, 26, 161–182. [Google Scholar] [CrossRef]
  12. Bhowmik, R.; Zhu, Y.; Gao, K. An analysis of trade cooperation: Central region in China and ASEAN. PLoS ONE 2021, 16, e0261270. [Google Scholar] [CrossRef]
  13. Miao, M.; Liu, H.; Chen, J. Factors affecting fluctuations in China’s aquatic product exports to Japan, the USA, South Korea, Southeast Asia, and the EU. Aquac. Int. 2021, 29, 2507–2533. [Google Scholar] [CrossRef]
  14. Li, Y.; Yang, M.; Zhu, L. FDI, Export Sophistication, and Quality Upgrading: Evidence from China’s WTO Accession. Jpn. World Econ. 2021, 59, 101086. [Google Scholar] [CrossRef]
  15. Kim, M.; Xin, D. Export spillover from foreign direct investment in China during pre- and post-WTO accession. J. Asian Econ. 2021, 75, 101337. [Google Scholar] [CrossRef]
  16. Jiang, B.; Li, Y.; Yang, W. Evaluation and Treatment Analysis of Air Quality Including Particulate Pollutants: A Case Study of Shandong Province, China. Int. J. Environ. Res. Public Health 2020, 17, 9476. [Google Scholar] [CrossRef] [PubMed]
  17. Global Carbon Project. Global Carbon Budget. Available online: https://www.globalcarbonproject.org/carbonbudget/ (accessed on 18 January 2022).
  18. Lu, S.; Zhao, Y.; Chen, Z.; Dou, M.; Zhang, Q.; Yang, W. Association between Atrial Fibrillation Incidence and Temperatures, Wind Scale and Air Quality: An Exploratory Study for Shanghai and Kunming. Sustainability 2021, 13, 5247. [Google Scholar] [CrossRef]
  19. Shen, X.; Yang, W.; Sun, S. Analysis of the impact of China’s hierarchical medical system and online appointment diagnosis system on the sustainable development of public health: A case study of Shanghai. Sustainability 2019, 11, 6564. [Google Scholar] [CrossRef] [Green Version]
  20. Liu, H.; Liu, J.; Yang, W.; Chen, J.; Zhu, M. Analysis and Prediction of Land Use in Beijing-Tianjin-Hebei Region: A Study Based on the Improved Convolutional Neural Network Model. Sustainability 2020, 12, 3002. [Google Scholar] [CrossRef] [Green Version]
  21. Yang, W.; Yang, Y. Research on Air Pollution Control in China: From the Perspective of Quadrilateral Evolutionary Games. Sustainability 2020, 12, 1756. [Google Scholar] [CrossRef] [Green Version]
  22. Intergovernmental Panel on Climate Change. Fifth Assessment Report. Available online: https://www.ipcc.ch/assessment-report/ar5/ (accessed on 18 January 2022).
  23. United Nations Climate Change. What is the United Nations Framework Convention on Climate Change? Available online: https://unfccc.int/process-and-meetings/the-convention/what-is-the-united-nations-framework-convention-on-climate-change (accessed on 18 January 2022).
  24. United Nations Climate Change. Kyoto Protocol—Targets for the First Commitment Period. Available online: https://unfccc.int/process-and-meetings/the-kyoto-protocol/what-is-the-kyoto-protocol/kyoto-protocol-targets-for-the-first-commitment-period (accessed on 18 January 2022).
  25. United Nations Climate Change. The Paris Agreement. Available online: https://unfccc.int/process-and-meetings/the-paris-agreement/the-paris-agreement (accessed on 18 January 2022).
  26. The State Council of the People’s Republic of China. Xi’s Statements at UN Meetings Demonstrate China’s Global Vision, Firm Commitment. Available online: http://english.www.gov.cn/statecouncil/wangyi/202010/02/content_WS5f771a17c6d0f7257693d023.html (accessed on 18 January 2022).
  27. Akbar, U.; Li, Q.; Akmal, M.A.; Shakib, M.; Iqbal, W. Nexus between agro-ecological efficiency and carbon emission transfer: Evidence from China. Environ. Sci. Pollut. Res. 2021, 28, 18995–19007. [Google Scholar] [CrossRef]
  28. Hossain, M.A.; Chen, S.; Khan, A.G. Decomposition study of energy-related CO2 emissions from Bangladesh’s transport sector development. Environ. Sci. Pollut. Res. 2021, 28, 4676–4690. [Google Scholar] [CrossRef]
  29. Malik, A.; Egan, M.; du Plessis, M.; Lenzen, M. Managing sustainability using financial accounting data: The value of input-output analysis. J. Clean. Prod. 2021, 293, 126128. [Google Scholar] [CrossRef]
  30. Hastuti, S.H.; Hartono, D.; Putranti, T.M.; Imansyah, M.H. The drivers of energy-related CO2 emission changes in Indonesia: Structural decomposition analysis. Environ. Sci. Pollut. Res. 2021, 28, 9965–9978. [Google Scholar] [CrossRef] [PubMed]
  31. Ali, Y.; Pretaroli, R.; Sabir, M.; Socci, C.; Severini, F. Structural changes in carbon dioxide (CO2) emissions in the United Kingdom (UK): An emission multiplier product matrix (EMPM) approach. Mitig. Adapt. Strateg. Glob. Chang. 2020, 25, 1545–1564. [Google Scholar] [CrossRef]
  32. Araújo, I.; Jackson, R.; Borges Ferreira Neto, A.; Perobelli, F. European union membership and CO2 emissions: A structural decomposition analysis. Struct. Chang. Econ. Dyn. 2020, 55, 190–203. [Google Scholar] [CrossRef]
  33. Engo, J. Driving forces and decoupling indicators for carbon emissions from the industrial sector in Egypt, Morocco, Algeria, and Tunisia. Environ. Sci. Pollut. Res. Int. 2021, 28, 14329–14342. [Google Scholar] [CrossRef]
  34. Kim, T.; Tromp, N. Carbon emissions embodied in China-Brazil trade: Trends and driving factors. J. Clean. Prod. 2021, 293, 126206. [Google Scholar] [CrossRef]
  35. Vervliet, N.; Debals, O.; Sorber, L.; De Lathauwer, L. Breaking the Curse of Dimensionality Using Decompositions of Incomplete Tensors: Tensor-based scientific computing in big data analysis. IEEE Signal Process. Mag. 2014, 31, 71–79. [Google Scholar] [CrossRef]
  36. Jackson, J.W.; VanderWeele, T.J. Decomposition Analysis to Identify Intervention Targets for Reducing Disparities. Epidemiology 2018, 29, 825–835. [Google Scholar] [CrossRef]
  37. Leal, P.A.; Marques, A.C.; Fuinhas, J.A. Decoupling economic growth from GHG emissions: Decomposition analysis by sectoral factors for Australia. Econ. Anal. Policy 2019, 62, 12–26. [Google Scholar] [CrossRef]
  38. Wang, S.; Zhu, X.; Song, D.; Wen, Z.; Chen, B.; Feng, K. Drivers of CO2 emissions from power generation in China based on modified structural decomposition analysis. J. Clean. Prod. 2019, 220, 1143–1155. [Google Scholar] [CrossRef]
  39. Riener, M.; Kainulainen, J.; Henshaw, J.D.; Orkisz, J.H.; Murray, C.E.; Beuther, H. GAUSSPY+: A fully automated Gaussian decomposition package for emission line spectra. Astron. Astrophys. 2019, 628, A78. [Google Scholar] [CrossRef] [Green Version]
  40. Sun, T.; Hobbie, S.E.; Berg, B.; Zhang, H.; Wang, Q.; Wang, Z.; Hättenschwiler, S. Contrasting dynamics and trait controls in first-order root compared with leaf litter decomposition. Proc. Natl. Acad. Sci. USA 2018, 115, 10392–10397. [Google Scholar] [CrossRef] [PubMed] [Green Version]
  41. Towne, A.; Schmidt, O.T.; Colonius, T. Spectral proper orthogonal decomposition and its relationship to dynamic mode decomposition and resolvent analysis. J. Fluid Mech. 2018, 847, 821–867. [Google Scholar] [CrossRef] [Green Version]
  42. Herviou, L.; Bardarson, J.H.; Regnault, N. Defining a bulk-edge correspondence for non-Hermitian Hamiltonians via singular-value decomposition. Phys. Rev. A 2019, 99, 52118. [Google Scholar] [CrossRef] [Green Version]
  43. Raza, M.Y.; Lin, B. Decoupling and mitigation potential analysis of CO2 emissions from Pakistan’s transport sector. Sci. Total Environ. 2020, 730, 139000. [Google Scholar] [CrossRef] [PubMed]
  44. Pita, P.; Winyuchakrit, P.; Limmeechokchai, B. Analysis of factors affecting energy consumption and CO2 emissions in Thailand’s road passenger transport. Heliyon 2020, 6, e05112. [Google Scholar] [CrossRef] [PubMed]
  45. Chontanawat, J.; Wiboonchutikula, P.; Buddhivanich, A. An LMDI decomposition analysis of carbon emissions in the Thai manufacturing sector. Energy Rep. 2020, 6, 705–710. [Google Scholar] [CrossRef]
  46. Hasan, M.M.; Wu, C. Estimating energy-related CO2 emission growth in Bangladesh: The LMDI decomposition method approach. Energy Strateg. Rev. 2020, 32, 100565. [Google Scholar] [CrossRef]
  47. Taka, G.N.; Huong, T.T.; Shah, I.H.; Park, H.S. Determinants of Energy-Based CO2 Emissions in Ethiopia: A Decomposition Analysis from 1990 to 2017. Sustainability 2020, 12, 4175. [Google Scholar] [CrossRef]
  48. Yasmeen, H.; Wang, Y.; Zameer, H.; Solangi, Y.A. Decomposing factors affecting CO2 emissions in Pakistan: Insights from LMDI decomposition approach. Environ. Sci. Pollut. Res. 2020, 27, 3113–3123. [Google Scholar] [CrossRef]
  49. Ozturk, I.; Majeed, M.T.; Khan, S. Decoupling and decomposition analysis of environmental impact from economic growth: A comparative analysis of Pakistan, India, and China. Environ. Ecol. Stat. 2021, 28, 793–820. [Google Scholar] [CrossRef]
  50. Cansino, J.M.; Sánchez Braza, A.; Espinoza, N. Moving towards a green decoupling between economic development and environmental stress? A new comprehensive approach for Ecuador. Clim. Dev. 2021, 1–19. [Google Scholar] [CrossRef]
  51. Zhang, Y. Basic Theory and Discipline System of World Economy. World Econ. Stud. 2020, 7, 3–16+135. [Google Scholar]
  52. Daudin, G.; Rifflart, C.; Schweisguth, D. Who produces for whom in the world economy? Can. J. Econ. Can. D’économique 2011, 44, 1403–1437. [Google Scholar] [CrossRef] [Green Version]
  53. Balié, J.; Del Prete, D.; Magrini, E.; Montalbano, P.; Nenci, S. Does Trade Policy Impact Food and Agriculture Global Value Chain Participation of Sub-Saharan African Countries? Am. J. Agric. Econ. 2019, 101, 773–789. [Google Scholar] [CrossRef]
  54. Liu, Q.; Zhu, Y.; Yang, W.; Wang, X. Research on the Impact of Environmental Regulation on Green Technology Innovation from the Perspective of Regional Dif-ferences: A Quasi-natural Experiment Based on China’s New Environmental Protection Law. Sustainability 2022, 14, 1714. [Google Scholar] [CrossRef]
  55. Johnson, R.C. Measuring Global Value Chains. Annu. Rev. Econ. 2018, 10, 207–236. [Google Scholar] [CrossRef] [Green Version]
  56. Linsi, L.; Mügge, D.K. Globalization and the growing defects of international economic statistics. Rev. Int. Polit. Econ. 2019, 26, 361–383. [Google Scholar] [CrossRef] [Green Version]
  57. Syverson, C. Macroeconomics and Market Power: Context, Implications, and Open Questions. J. Econ. Perspect. 2019, 33, 23–43. [Google Scholar] [CrossRef] [Green Version]
  58. Koopman, R.; Wang, Z.; Wei, S. Tracing Value-Added and Double Counting in Gross Exports. Am. Econ. Rev. 2014, 104, 459–494. [Google Scholar] [CrossRef] [Green Version]
  59. Leontief, W. Input-Output Economics; Oxford University Press: New York, NY, USA, 1966; ISBN 9780196315690. [Google Scholar]
  60. Leontief, W. Environmental repercussions and the economic structure: An input-output approach. Rev. Econ. Stat. 1970, 52, 262–271. [Google Scholar] [CrossRef]
  61. Montibeler, E.E.; de Oliveira, D.R.; Cordeiro, D.R. Fundamental economic variables: A study from the leontief methodology. EconomiA 2018, 19, 377–394. [Google Scholar] [CrossRef]
  62. Mardones, C.; Silva, D. Evaluation of Non-survey Methods for the Construction of Regional Input–Output Matrices When There is Partial Historical Information. Comput. Econ. 2022, 1–33. [Google Scholar] [CrossRef]
  63. University of Groningen. WIOD 2016 Release. Available online: https://www.rug.nl/ggdc/valuechain/wiod/wiod-2016-release (accessed on 18 January 2022).
  64. Goh, T.; Ang, B.W. Tracking economy-wide energy efficiency using LMDI: Approach and practices. Energy Effic. 2019, 12, 829–847. [Google Scholar] [CrossRef]
  65. Alajmi, R.G. Factors that impact greenhouse gas emissions in Saudi Arabia: Decomposition analysis using LMDI. Energy Policy 2021, 156, 112454. [Google Scholar] [CrossRef]
  66. Yang, Y.; Yang, W.; Chen, H.; Li, Y. China’s energy whistleblowing and energy supervision policy: An evolutionary game perspective. Energy 2020, 213, 118774. [Google Scholar] [CrossRef]
  67. Doytch, N.; Narayan, S. Does transitioning towards renewable energy accelerate economic growth? An analysis of sectoral growth for a dynamic panel of countries. Energy 2021, 235, 121290. [Google Scholar] [CrossRef]
  68. Gao, H.; Yang, W.; Wang, J.; Zheng, X. Analysis of the Effectiveness of Air Pollution Control Policies based on Historical Evaluation and Deep Learning Forecast: A Case Study of Chengdu-Chongqing Region in China. Sustainability 2021, 13, 206. [Google Scholar] [CrossRef]
  69. Wang, S.; Zeng, J.; Liu, X. Examining the multiple impacts of technological progress on CO2 emissions in China: A panel quantile regression approach. Renew. Sustain. Energy Rev. 2019, 103, 140–150. [Google Scholar] [CrossRef]
  70. Khan, A.N.; En, X.; Raza, M.Y.; Khan, N.A.; Ali, A. Sectorial study of technological progress and CO2 emission: Insights from a developing economy. Technol. Forecast. Soc. Change 2020, 151, 119862. [Google Scholar] [CrossRef]
  71. Marrucci, L.; Marchi, M.; Daddi, T. Improving the carbon footprint of food and packaging waste management in a supermarket of the Italian retail sector. Waste Manag. 2020, 105, 594–603. [Google Scholar] [CrossRef]
  72. Marrucci, L.; Daddi, T.; Iraldo, F. The integration of circular economy with sustainable consumption and production tools: Systematic review and future research agenda. J. Clean. Prod. 2019, 240, 118268. [Google Scholar] [CrossRef]
  73. National Bureau of Statistics of China. The Regulation of Three Industries Division. Available online: http://www.stats.gov.cn/tjsj/tjbz/201301/t20130114_8675.html (accessed on 28 February 2022).
Figure 1. The specific effect value of influencing factors of embodied carbon in China’s export trade (unit: 10,000 tons).
Sustainability 14 03308 g001
Figure 2. Cumulative change of embodied carbon in China’s export trade caused by different influencing factors (unit: 10,000 tons).
Sustainability 14 03308 g002
Figure 3. Influencing factors of embodied carbon in the export trade of China’s primary industry (unit: 10,000 tons).
Sustainability 14 03308 g003
Figure 4. Cumulative change of embodied carbon in China’s export trade of the primary industry caused by different Influencing Factors (unit: 10,000 tons).
Sustainability 14 03308 g004
Figure 5. Influencing factors of embodied carbon in the export trade of China’s secondary industry (unit: 10,000 tons).
Sustainability 14 03308 g005
Figure 6. Cumulative change of embodied carbon in China’s export trade of the secondary industry caused by different influencing factors (unit: 10,000 tons).
Sustainability 14 03308 g006
Figure 7. Influencing factors of embodied carbon in the export trade of China’s tertiary industry (unit: 10,000 tons).
Sustainability 14 03308 g007
Figure 8. Cumulative change of embodied carbon in China’s export trade of the tertiary industry caused by different influencing factors (unit: 10,000 tons).
Sustainability 14 03308 g008
Publisher’s Note: MDPI stays neutral with regard to jurisdictional claims in published maps and institutional affiliations.

