
Research on the Influence of Wheelsets on the Visual Imagery of City Bicycles


Abstract
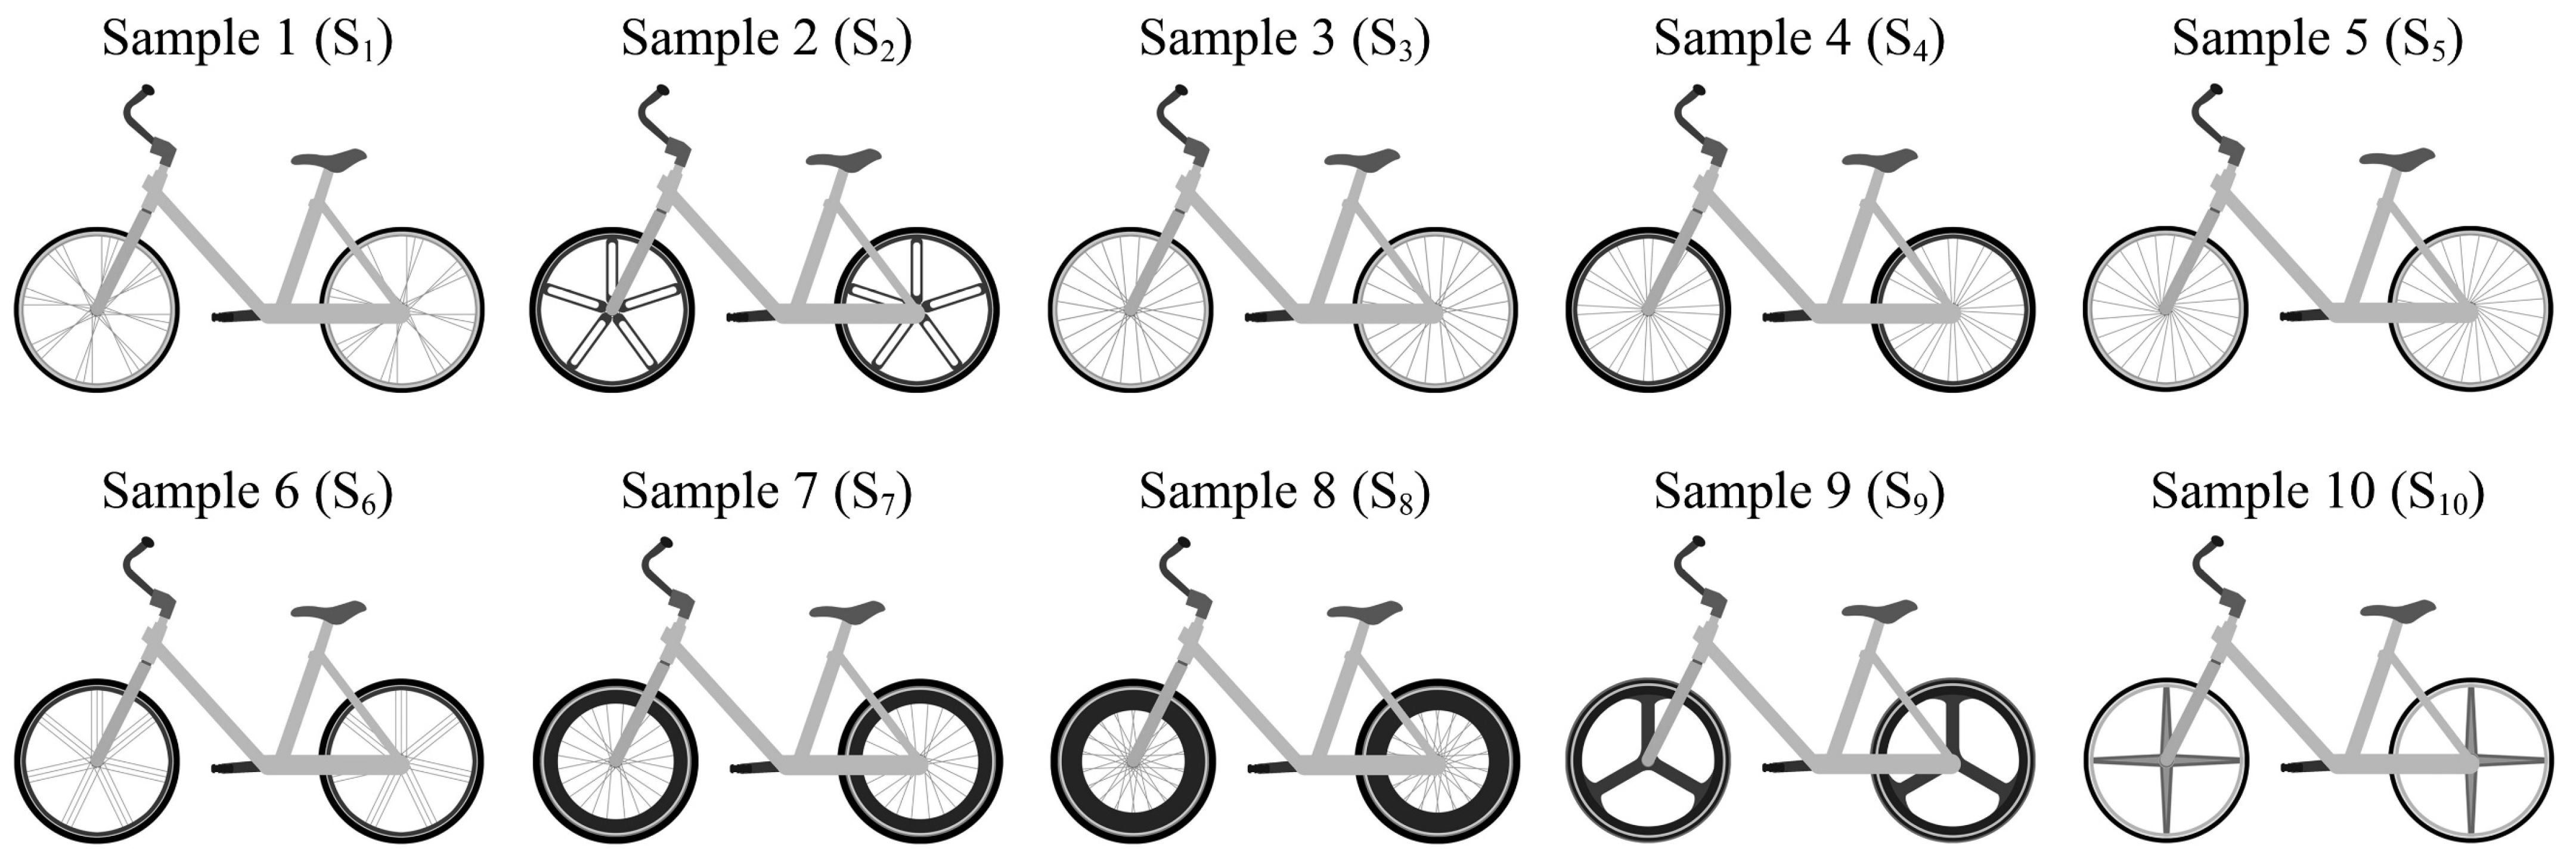
:1. Introduction
2. Materials and Methods
2.1. Research Framework
2.2. Factor Analysis
2.3. Fuzzy Logic
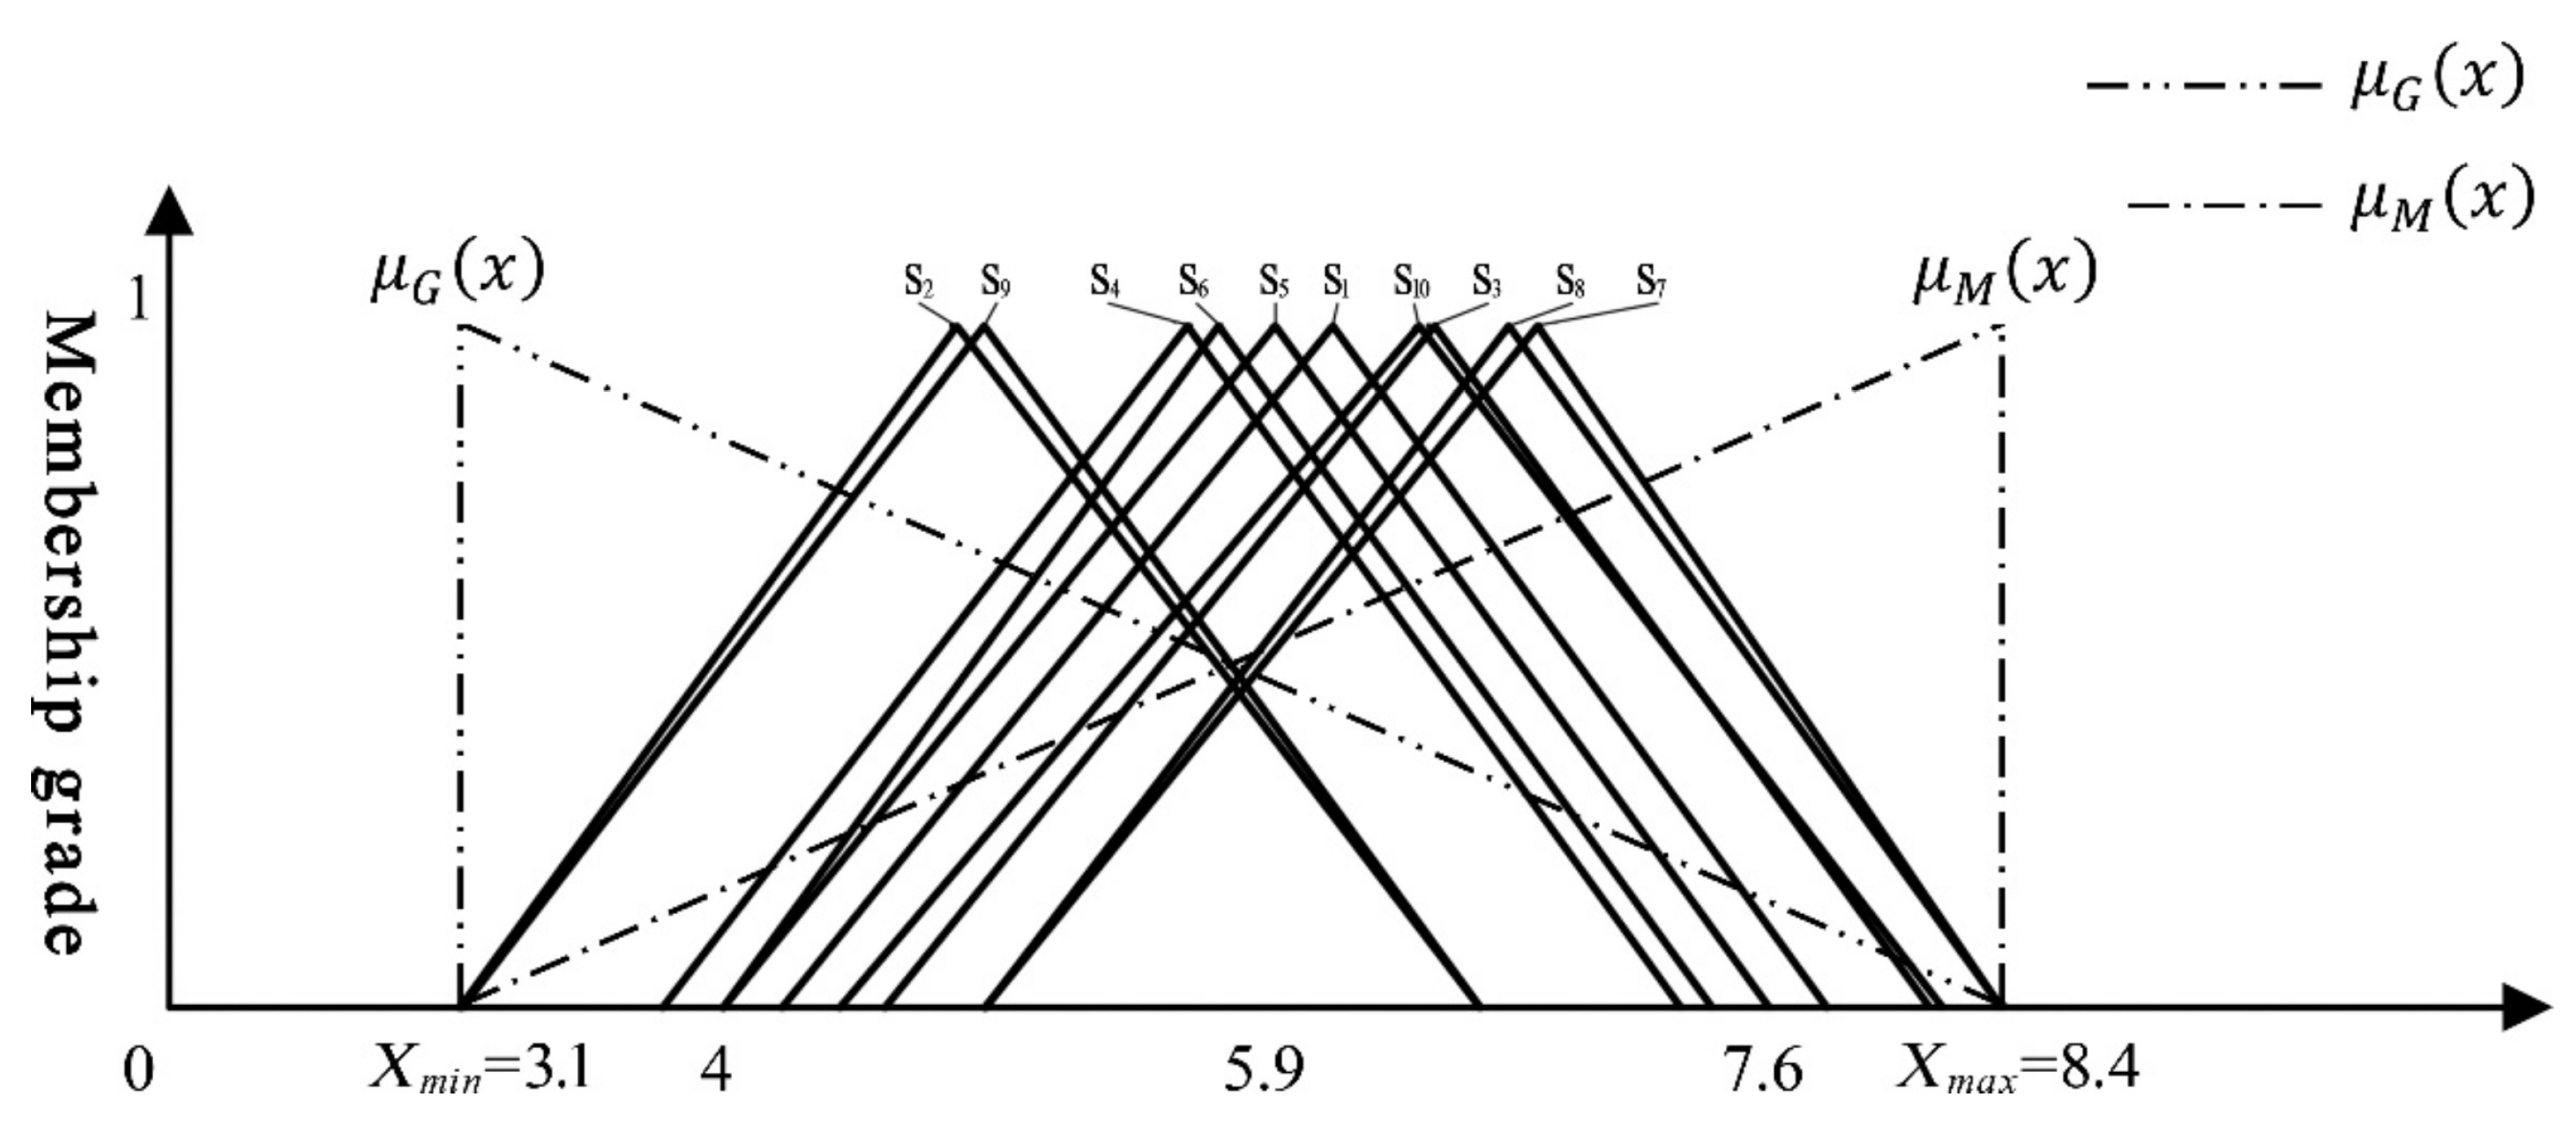
2.4. Total Utility Value in Triangular Fuzzy Numbers
3. Results and Discussion
3.1. The Result of Factor Analysis
3.2. Renaming Results of Factor Analysis
3.3. Evaluation of the Visual Imagery of Wheelsets
4. Conclusions
Author Contributions
Funding
Institutional Review Board Statement
Informed Consent Statement
Data Availability Statement
Conflicts of Interest
References
- Murphy, E.; Usher, J. The role of bicycle-sharing in the city: Analysis of the irish experience. Int. J. Sustain. Transp. 2015, 9, 116–125. [Google Scholar] [CrossRef]
- Shaheen, S.A.; Zhang, H.; Martin, E.; Guzman, S. China’s Hangzhou public bicycle: Understanding early adoption and behavioral response to bikesharing. Transp. Res. Record. 2011, 2247, 33–41. [Google Scholar] [CrossRef] [Green Version]
- Zhu, L.L. Analysis of the current situation of shared bicycle use. Co-Oper. Econ. Sci. 2018, 5, 88–89. [Google Scholar]
- Li, M.L. Research and analysis of shared bicycle market. Money China 2017, 5, 121–123. [Google Scholar]
- Regenwetter, L.; Curry, B.; Ahmed, F. BIKED: A dataset for computational bicycle design with machine learning benchmarks. J. Mech. Des. 2022, 144, 031706. [Google Scholar] [CrossRef]
- Rodrigues, L.; Serra, M.; Liporaci, M.; Rodrigues, R.; Tonello, M. Postural comparison between a conventional bicycle handlebar and an elliptical handlebar. Rev. Bras. Med. Esporte. 2019, 25, 187–190. [Google Scholar] [CrossRef] [Green Version]
- Vansteenkiste, P.; Conradie, P.; Saldien, J.; Roosen, P.; Mey, K.D.; Lenoir, M.; De Clercq, D. To what extent does body height affect the use and satisfaction of electrically-assisted bicycles for postal purpose? Int. J. Ind. Ergon. 2018, 67, 159–170. [Google Scholar] [CrossRef]
- Hsiao, S.W.; Chen, R.Q.; Leng, W.L. Applying riding-posture optimization on bicycle frame design. Appl. Ergon. 2015, 51, 69–79. [Google Scholar] [CrossRef]
- Dieltiens, S.; Jiménez-Pea, C.; Loon, S.V.; D’Hondt, J.; Claeys, K.; Demeester, E. Influence of electrically powered pedal assistance on user-induced cycling loads and muscle activity during cycling. Appl. Sci. 2021, 11, 2032. [Google Scholar] [CrossRef]
- Mcewen, I.; Cooper, D.E.; Warnett, J.; Kourra, N.; Gibbons, G.J. Design & manufacture of a high-performance bicycle crank by additive manufacturing. Appl. Sci. 2018, 8, 1360. [Google Scholar]
- Ismail, A.Y.; Na, G.; Koo, B. Topology and response surface optimization of a bicycle crank arm with multiple load cases. Appl. Sci. 2020, 10, 2201. [Google Scholar] [CrossRef] [Green Version]
- Pan, C.Y.; Lei, L. The analysis of the sharing bicycle boom based on new products development--A case study of mobike sharing bicycle. J. Guang Dong Commun. Polytech. 2017, 16, 43–46. [Google Scholar]
- Hsiao, S.W.; Ko, Y.C. A study on bicycle appearance preference by using FCE and FAHP. Int. J. Ind. Ergon. 2013, 43, 264–273. [Google Scholar] [CrossRef]
- Lin, X.M.; Ho, C.H.; Xia, L.T. Analysis of image and molding of sharing bicycle frame in urban traffic efficiency based on fuzzy theory. Ekoloji 2018, 27, 1161–1166. [Google Scholar]
- Arnheim, R. Visual thinking. Philos. Sci. 1969, 10, 709–740. [Google Scholar]
- Zhang, Y.X. Feeling, Emotion and Other; Shanghai People’s Publishing House: Shanghai, China, 1986. [Google Scholar]
- Peng, M.L. Psycholinguistics; Beijing Normal University Press: Beijing, China, 2000. [Google Scholar]
- Pala, P.; Santini, S.; Bimbo, A.D. Visual image retrieval by elastic deformation of object sketches. In Proceedings of the 1994 IEEE Symposium on Visual Languages, Boulder, CO, USA, 4–7 October 1994; pp. 216–223. [Google Scholar]
- Kline, P. An Easy Guide to Factor Analysis; Routledge: London, UK, 2014. [Google Scholar]
- Brown, T.A.; Cash, T.F.; Mikulka, P.J. Attitudinal body-image assessment: Factor analysis of the body-self relations questionnaire. J. Pers. Assess. 1990, 55, 135–144. [Google Scholar]
- Chen, W.S.; Lee, A.S.; Lin, H.C. Study of visual evaluations for wood flooring applying fuzzy logic. J. Wood Sci. 2014, 60, 327–338. [Google Scholar] [CrossRef]
- Chuen, S.L. Application of Fuzzy Mathematics; Scientific & Technical Publishing Co., Ltd.: Taipei, Taiwan, 2001. [Google Scholar]
- Zadeh, L.A. Information and control. Fuzzy Sets 1965, 8, 338–353. [Google Scholar]
- Zadeh, L.A. The concept of a linguistic variable and its application to approximate reasoning—I. Inf. Sci. 1975, 8, 199–249. [Google Scholar] [CrossRef]
- Lu, P.; Hsiao, S.W.; Wu, F. A product shape design and evaluation model based on morphology preference and macroscopic shape information. Entropy 2021, 23, 639. [Google Scholar] [CrossRef]
- Wang, C.N.; Nguyen, N.A.T.; Dang, T.T.; Lu, C.M. A compromised decision-making approach to third-party logistics selection in sustainable supply chain using fuzzy AHP and fuzzy VIKOR methods. Mathematics 2021, 9, 886. [Google Scholar] [CrossRef]
- Jasiulewicz-Kaczmarek, M.; Antosz, K.; Wyczółkowski, R.; Mazurkiewicz, D.; Sun, B.; Qian, C.; Ren, Y. Application of MICMAC, fuzzy AHP, and fuzzy TOPSIS for evaluation of the maintenance factors affecting sustainable manufacturing. Energies 2021, 14, 1436. [Google Scholar] [CrossRef]
- Dubois, D.; Prade, H. Operations on fuzzy numbers. Int. J. Syst. Sci. 1978, 9, 613–626. [Google Scholar] [CrossRef]
- Hsiao, S.W.; Tsai, H.C. Applying a hybrid approach based on fuzzy neural network and genetic algorithm to product form design. Int. J. Ind. Ergon. 2005, 35, 411–428. [Google Scholar] [CrossRef]
- Wang, H.; Lu, X.; Du, Y.; Zhang, C.; Sadiq, R.; Deng, Y. Fault tree analysis based on TOPSIS and triangular fuzzy number. Int. J. Syst. Assur. Eng. Manag. 2017, 8, 2064–2070. [Google Scholar] [CrossRef]
- Chen, S.H. Ranking fuzzy numbers with maximizing set and minimizing set. Fuzzy Sets Syst. 1985, 17, 113–129. [Google Scholar] [CrossRef]


| Linguistic Variables | Triangular Fuzzy Numbers |
|---|---|
| Very low (VL) | (0, 0, 1) |
| Low (L) | (0, 1, 3) |
| Medium low (ML) | (1, 3, 5) |
| Medium (M) | (3, 5, 7) |
| Medium high (MH) | (5, 7, 9) |
| High (H) | (7, 9, 10) |
| Very high (VH) | (9, 10, 10) |
| Adjectives | Initial | Extraction | Adjectives | Initial | Extraction |
|---|---|---|---|---|---|
| Trimmed | 1.000 | 0.769 | Presentable | 1.000 | 0.800 |
| Regular | 1.000 | 0.728 | Rhythmic | 1.000 | 0.834 |
| Stable | 1.000 | 0.723 | Metrical | 1.000 | 0.821 |
| Interesting | 1.000 | 0.785 | Novel | 1.000 | 0.747 |
| Mechanical | 1.000 | 0.729 | Balanced | 1.000 | 0.799 |
| Ordered | 1.000 | 0.849 | Holistic | 1.000 | 0.605 |
| Individualized | 1.000 | 0.774 | Secure | 1.000 | 0.771 |
| Superior | 1.000 | 0.740 | Symmetrical | 1.000 | 0.689 |
| Component | Initial Eigenvalues | Square Loading Extraction | Transformed Square Loading | ||||||
|---|---|---|---|---|---|---|---|---|---|
| Total | Variance (%) | Accumulative (%) | Total | Variance (%) | Accumulative (%) | Total | Variance (%) | Accumulative (%) | |
| 1 | 4.831 | 30.195 | 30.195 | 4.831 | 30.195 | 30.195 | 2.264 | 14.152 | 14.152 |
| 2 | 2.062 | 12.886 | 43.081 | 2.062 | 12.886 | 43.081 | 2.198 | 13.735 | 27.887 |
| 3 | 1.509 | 9.431 | 52.512 | 1.509 | 9.431 | 52.512 | 2.175 | 13.593 | 41.480 |
| 4 | 1.329 | 8.304 | 60.816 | 1.329 | 8.304 | 60.816 | 1.985 | 12.406 | 53.886 |
| 5 | 1.307 | 8.166 | 68.981 | 1.307 | 8.166 | 68.981 | 1.984 | 12.398 | 66.284 |
| 6 | 1.124 | 7.026 | 76.008 | 1.124 | 7.026 | 76.008 | 1.556 | 9.724 | 76.008 |
| Adjectives | Component | |||||
|---|---|---|---|---|---|---|
| Factor 1 | Factor 2 | Factor 3 | Factor 4 | Factor 5 | Factor 6 | |
| Presentable | 0.794 | −0.022 | 0.088 | 0.013 | 0.388 | 0.100 |
| Secure | 0.789 | 0.290 | 0.171 | −0.114 | −0.011 | 0.151 |
| Superior | 0.675 | 0.194 | 0.345 | 0.317 | 0.005 | −0.163 |
| Balanced | −0.034 | 0.778 | 0.230 | 0.137 | 0.314 | 0.148 |
| Symmetrical | 0.131 | 0.769 | −0.002 | 0.118 | 0.244 | 0.080 |
| Holistic | 0.231 | 0.726 | 0.075 | 0.095 | −0.089 | 0.040 |
| Interesting | 0.076 | 0.069 | 0.818 | 0.184 | 0.240 | −0.114 |
| Individualized | 0.133 | 0.030 | 0.789 | −0.099 | 0.073 | 0.344 |
| Novel | 0.406 | 0.233 | 0.713 | 0.016 | −0.068 | 0.117 |
| Trimmed | −0.023 | 0.356 | 0.131 | 0.790 | −0.013 | −0.003 |
| Regular | −0.135 | 0.065 | −0.110 | 0.753 | 0.269 | 0.233 |
| Stable | 0.446 | −0.022 | 0.110 | 0.700 | 0.047 | 0.136 |
| Metrical | −0.002 | 0.123 | 0.139 | 0.227 | 0.855 | 0.060 |
| Rhythmic | 0.253 | 0.196 | 0.068 | −0.011 | 0.852 | 0.031 |
| Ordered | 0.035 | 0.324 | −0.054 | 0.098 | 0.236 | 0.822 |
| Mechanical | 0.110 | −0.036 | 0.304 | 0.206 | −0.106 | 0.755 |
| Factor | Adjective Groups | Factor Naming | Code |
|---|---|---|---|
| Factor 1 | Presentable; secure; superior | Superior and Presentable | S&P |
| Factor 2 | Balanced; symmetrical; holistic | Holistic and Balanced | H&B |
| Factor 3 | Interesting; individualized; novel | Novel and Individualized | N&I |
| Factor 4 | Trimmed; regular; stable | Trimmed and Stable | T&S |
| Factor 5 | Metrical; rhythmic | Rhythmic and Metrical | R&M |
| Factor 6 | Ordered; mechanical | Mechanical and Ordered | M&O |
| Wheel Species | Superior and Presentable | Holistic and Balanced | Novel and Individualized | Trimmed and Stable | Rhythmic and Metrical | Mechanical and Ordered |
|---|---|---|---|---|---|---|
| S1 | (4.0 5.9 7.6) | (3.9 5.9 7.7) | (3.9 5.8 7.5) | (3.4 5.3 7.1) | (4.5 6.4 8.1) | (4.4 6.3 8.0) |
| S2 | (4.9 6.8 8.4) | (4.9 6.8 8.4) | (4.9 6.8 8.4) | (4.9 6.8 8.4) | (4.8 6.7 8.3) | (4.7 6.6 8.3) |
| S3 | (3.8 5.6 7.3) | (4.5 6.4 8.1) | (4.3 6.1 7.9) | (2.9 4.6 6.4) | (4.0 5.9 7.6) | (4.2 6.1 7.9) |
| S4 | (4.4 6.4 8.2) | (4.9 6.8 8.5) | (4.6 6.6 8.3) | (3.8 5.7 7.5) | (4.5 6.4 8.2) | (4.2 6.2 8.0) |
| S5 | (4.2 6.1 7.8) | (4.5 6.4 8.0) | (4.2 6.1 7.8) | (4.1 6.0 7.8) | (4.7 6.6 8.2) | (4.4 6.3 8.1) |
| S6 | (4.5 6.4 8.1) | (4.7 6.6 8.3) | (4.3 6.3 8.0) | (4.8 6.7 8.3) | (4.6 6.5 8.2) | (4.2 6.1 7.9) |
| S7 | (3.1 4.8 6.6) | (3.2 5.0 6.8) | (4.0 5.9 7.5) | (4.2 6.1 7.8) | (3.4 5.3 7.1) | (3.4 5.2 7.0) |
| S8 | (3.1 4.9 6.6) | (3.5 5.2 6.9) | (3.9 5.7 7.4) | (4.1 5.9 7.5) | (3.4 5.3 7.0) | (3.7 5.5 7.2) |
| S9 | (4.9 6.7 8.4) | (4.7 6.5 8.1) | (5.1 7.0 8.5) | (5.5 7.2 8.5) | (4.9 6.7 8.3) | (4.7 6.5 8.1) |
| S10 | (4.0 5.7 7.4) | (3.6 5.4 7.1) | (3.4 5.1 7.0) | (4.8 6.6 8.0) | (3.9 5.7 7.5) | (3.6 5.4 7.2) |
| Wheel Type | Superior and Presentable | Holistic and Balanced | Novel and Individualized | Trimmed and Stable | Rhythmic and Metrical | Mechanical and Ordered |
|---|---|---|---|---|---|---|
| S1 | 0.4240 | 0.5018 | 0.4729 | 0.4002 | 0.5766 | 0.5617 |
| S2 | 0.6410 * | 0.6268 * | 0.6160 | 0.6419 * | 0.6196 | 0.6065 * |
| S3 | 0.4761 | 0.5722 | 0.5217 | 0.3529 | 0.5020 | 0.5344 |
| S4 | 0.5852 | 0.5591 | 0.5856 | 0.4975 | 0.5788 | 0.5462 |
| S5 | 0.5440 | 0.5700 | 0.5164 | 0.5377 | 0.6045 | 0.5640 |
| S6 | 0.5863 | 0.6004 | 0.5425 | 0.6163 | 0.5916 | 0.5344 |
| S7 | 0.3679 | 0.3803 | 0.4845 | 0.5489 | 0.4158 | 0.4030 |
| S8 | 0.3732 | 0.4071 | 0.4608 | 0.5221 | 0.4124 | 0.4446 |
| S9 | 0.6321 | 0.5875 | 0.6435 * | 0.6279 | 0.6232 * | 0.5929 |
| S10 | 0.5000 | 0.4335 | 0.3821 | 0.6143 | 0.4776 | 0.4328 |
Publisher’s Note: MDPI stays neutral with regard to jurisdictional claims in published maps and institutional affiliations. |
© 2022 by the authors. Licensee MDPI, Basel, Switzerland. This article is an open access article distributed under the terms and conditions of the Creative Commons Attribution (CC BY) license (https://creativecommons.org/licenses/by/4.0/).
Share and Cite
Wu, F.; Lu, P.; Lin, Y.-C. Research on the Influence of Wheelsets on the Visual Imagery of City Bicycles. Sustainability 2022, 14, 2762. https://doi.org/10.3390/su14052762
Wu F, Lu P, Lin Y-C. Research on the Influence of Wheelsets on the Visual Imagery of City Bicycles. Sustainability. 2022; 14(5):2762. https://doi.org/10.3390/su14052762
Chicago/Turabian StyleWu, Fan, Peng Lu, and Yang-Cheng Lin. 2022. "Research on the Influence of Wheelsets on the Visual Imagery of City Bicycles" Sustainability 14, no. 5: 2762. https://doi.org/10.3390/su14052762