1. Introduction
Significant changes in water availability for agricultural purposes due to the effects of climate change have been described by various researchers [
1,
2,
3,
4,
5]. Essential water decrease along with an increase in air temperature are likely to affect salt accumulation in soil [
3,
6,
7], a salinization process with adverse effects on agriculture in the Mediterranean region [
4,
8,
9], posing a real threat to olive cultivation [
10], which flourishes through this area and covers a significant acreage [
11]. Olive trees are salt-tolerant and water-loss-resistant. They have a robust resilience mechanism and can cope with moderate water stress [
12,
13]. The initial salt tolerance of olive trees is high; however, constant expansion of salt in the soil negatively affects plants. With time, plants become very sensitive due to a high concentration of Na
+ ions in the leaves [
14]. Salinization decreases olive fruit weight and oil content while increasing water content in fruits [
15]. Insufficient water supply and topsoil salinization negatively affect plant photosynthetic function [
16]. Several co-factors reduce plant photosynthesis under water stress. The most important are the qualitative and quantitative modifications of photosynthesis pigments, low CO
2 uptake due to stomatal closure and resistance [
17] and low assimilation rates in leaves. The main causes for low photosynthetic rates in leaves include decreased content of photosynthetic metabolites and enzyme activity [
18,
19,
20]. Some additional causes may be the low carboxylation efficiency and inhibition of chloroplast activity at low water potential. Moreover, the damage of the photosynthetic apparatus due to ROS production, including superoxide and hydroxyl radicals, can cause oxidative stress [
18].
Oxidative stress leads to several alterations in enzymatic activity as a response to the defense mechanism [
18,
19,
20]. Changes due to stress conditions have been reported for numerous antioxidative enzymes, such as superoxide dismutase (SOD) [
18,
21], catalase (CAT) [
7,
18,
22], ascorbate peroxidase (APX) [
19,
23] and guaiacol peroxidase (GPX) [
24]. Optical sensing technologies offer great potential in water [
25,
26,
27] and salinity stress detection [
9,
26,
28,
29]. The vegetation index (VI) extraction approach proved its efficiency in various agricultural matters, such as assessment of water status and photosynthetic limitations under water stress [
9,
27], salinity stress effect detection [
9,
28], chlorophyll content estimation [
30], gas exchange and sap flow investigation [
31] and crop disease detection [
30,
32,
33]. Common indices for drought and salinity estimation are the water index (WI) [
27,
31,
34], normalized difference vegetation index (NDVI) [
28,
31,
35] and photochemical reflectance index (PRI) [
27,
31].
In addition, hyperspectral data are also employed in agricultural applications, taking advantage of the high spectral resolution of data across the visible to shortwave infrared spectra, including estimation of biochemical and biophysical properties [
36] and, in particular, discrimination of olive varieties [
37]. Multiple regression methods, such as principal component regression (PCR) and partial least squares regression (PLSR), meet the above-mentioned criteria; therefore, they are widely used by various researchers [
34,
38,
39,
40,
41,
42]. Classification of hyperspectral data via a linear discriminant analysis (LDA) is also an efficient alternative method, in the case of nominal variables [
11,
40].
The overall objective of this study is to investigate the performance of hyperspectral reflectance data in the estimation of the health parameters of olive plants subjected to drought and salinity stresses. The specific objectives are the following:
Evaluating stress tolerance of three olive varieties with major importance based on photosynthetic rate, water content and enzyme activity alterations in response to water deficit and salinity;
Estimating the relationship between the results of VIs, PCR, PLSR and LDA and photosynthesis and enzymes of stressed olive plants, aiming at preparing the development of drone-based field scanning for early detection of crop stresses;
Identifying substantial wavelength ranges with correlation to enzyme activity and create customized vegetation indices for each of the studied antioxidative enzymes to enable high-throughput plant phenotyping.
2. Materials and Methods
2.1. Study Area and Dataset Description
One-year-old, uniform olive trees of the three olive cultivars ‘Mastoidis’, ‘Amfisis’ and ‘Lefkolia Serron’ were grown in the Institute of Olive Tree, Subtropical Crops and Viticulture, located in Chania, Crete, Greece. The plants were own-rooted (not grafted, because this is the dominant type of olive plants used in plant nurseries), about one meter in height, grown outdoors under natural conditions, receiving natural sunlight and exposed to seasonal temperature variations. The plants were grown in 12 L pots containing a loamy-sandy soil/perlite mixture (3:1). Each plant was fertilized weekly in February with 500 mL of 2 g L−1 of 20:20:20 (NPK) fertilizer. Mean values for temperature and relative humidity for the period of the experiment were as follows: March, T = 13.3 °C, RH = 66.9%; April, T = 18.1 °C, RH = 55.2%; May, T = 19.5 °C, RH = 58.8%; June, T = 24.9 °C, RH = 51.2%.
The studied plants received basic nursery care and were then subjected to one of the following treatments: (1) 500 mL of water + 0 mM NaCl (control); (2) 200 mL of water + 0 mM NaCl; (3) 500 mL of water + 50 mM NaCl; (4) 200 mL of water + 50 mM NaCl. The duration of the experimental treatment was three months (22 March–22 June 2016). In treatments with full irrigation, we applied gradient manual watering until drainage. In contrast, in deficit irrigation treatments, the irrigation dose was 40% of that in the full irrigation treatments. We used tensiometers and Buyoucos blocks placed at a 20 cm depth to monitor soil water tension. In water stress treatments, we applied irrigation when the soil water tension reached −1.0 MPa (average value from three pots). The pot top was covered with a plastic membrane when we expected rain, to avoid reception of water aside from irrigation.
2.2. Spectral Data Acquisition
Hyperspectral reflectance data were acquired five times during the experiment using the contact probe of an analytical spectral device (ASD) FieldSpec® 3 spectroradiometer. ASD FieldSpec® 3, produced by Malvern Panalytical, is a general-purpose spectrometer with a spectral range of 350–2500 nm and a rapid data collection time of 0.1 s per spectrum. The spectroradiometer records spectral reflectance with the three built-in sensors, capturing the reflectance in ranges of 350–1000 nm, 1000–1830 nm and 1830–2500 nm (ASD 2010). The contact probe contained its light source in the form of a halogen lamp, which minimized atmospheric interference to the recorded signal. To qualify for the equipment’s stable internal temperature, we turned on the spectroradiometer 45 min before the data collection. A Spectralon panel was employed to calibrate the instrument and convert the measured digital numbers to values of spectral reflectance.
The next step involved the measurement of the dark current signal, a reading collected with the fiber optic shutter closed, which indicated the portion of the signal originating from within the equipment, and we subtracted it from all subsequent measurements. We collected a new dark current signal with every measurement of the white reference (every 10 min) and instrument re-calibration (every 30 min). Data collection was performed by attaching the contact probe to the leaves measured. We used two leaves for each measurement to cover the entire field of view (FOV) of the contact probe.
The dates of data acquisition were the 22 March, 24 April, 23 May, 10 June and 22 June. Measurements were taken by contact probe in outdoor conditions.
2.3. Photosynthetic Measurements
Before each spectral measurement, we measured the net photosynthetic rate using an LI-6400XT Portable Photosynthesis System (LI-COR Biosciences, Lincoln, NE, USA). The measurements were made on fully expanded leaves selected along the median segment of new-growth shoots (four replications per treatment, with one leaf per plant). IRGA was adjusted to a constant leaf temperature of 1 °C above air temperature, to 1200 mol photons m−2 s−1 supplied by the LI 6400 light system and to an ambient CO2 concentration of 380 mol mol−1.
2.4. Water Content Measurements
After the last spectral and photosynthesis measurements, leaves and shoots of each plant were collected and used for water content estimation (four replications per treatment with one group of leaves and one group of shoots per plant). Shoots were cut in 5 cm long pieces while leaves were used intact. We dried plant tissues at 40 °C and we determined the difference between fresh and dry weight. We estimated the percentage of water in tissues on a fresh weight basis.
2.5. Determination of Enzyme Activity
SOD, GPX, APX and CAT activities were determined on four leaves per treatment which were collected at the end of the experimental procedure and immediately frozen at −80 °C. The samples consisted of fully expanded leaves selected along the median segment of new-growth shoots (four replications per treatment, with one leaf per plant). All the steps of the following procedure were carried out at 0 °C on ice. The extraction buffer consisted of 0.1 M potassium phosphate buffer (pH 7.6), containing 1 mM ethylenediaminetetraacetic acid disodium salt, 0.5 mM ascorbate and 1% PVPP (polyvinylpolypyrrolidone). Tissues were homogenized in the extraction buffer (1.5 mL of the extraction buffer per 200 mg of the sample) and then centrifuged at 13,000× g for 30 min. After the centrifugation, the supernatant was collected for the activity assay. For measuring the absorbance of the enzyme extract, a Hitachi U-1100 spectrophotometer was used (Hitachi Ltd., Tokyo, Japan).
Total SOD, GPX, APX and CAT activity was determined as described in [
9]. Enzyme unit normalization was performed using the algorithm described by Koubouris et al. [
21].
2.6. Spectral Data Preprocessing
Before the analyses, the spectral data were processed by applying splice correction, normalization and the 1st Savitzky–Golay derivative extraction. This ensured that errors caused by variance in sensitivity between the instrument’s three sensors were corrected [
43] and spectral signatures were normalized, hence comparable. The first derivative was employed in the analysis, instead of the original reflectance values, since it is often more capable of identifying narrow-band spectral features [
44]. The derivative was applied following the averaging of the reflectance every 10 nm intervals.
2.7. Statistical Analysis
The vegetation indices (VIs) were extracted from the spectra in the datasets from each acquisition date. The VIs included the NDVI (normalized difference vegetation index), found as a normalized ratio between the 780 nm and 710 nm reflectance values [(780 − 710)/(780 + 710)]; the WI (water index), calculated as the ratio between 900 nm and 970 nm (900/970); and the PRI (photochemical reflectance index), expressed by the following formula: (570 − 537)/(570 + 537)—as described in [
9].
The calculated VIs were evaluated using the analysis of variance (ANOVA) by treatment. Additionally, an ANOVA was also performed to identify significant differences in the enzymes, water content and photosynthesis measurements for different treatments (four replications per treatment, with one leaf per plant). A cross-correlation was performed between the VIs calculated from the last spectral data acquisition (22 June) and enzyme, leaf and shoot water content, and photosynthesis measurements. In addition, a correlation between the VIs and the net photosynthetic rate for all five data acquisition datasets was calculated. The Fisher’s least significant difference (LSD) test at p ≤ 0.05 was used to verify the statistical significance of different means.
Multivariate regression methods were used to estimate the relationship of the full spectrum range with the results of other measurements. Principal component regression (PCR) and partial least square regression (PLSR) aimed to estimate the relationship between spectral reflectance of the 22 June and the shoot and leaf water content, enzyme activity and photosynthesis. In addition, a linear discriminant analysis (LDA) was employed to evaluate the differences in spectral reflectance concerning treatments. Due to the limitations of some used variables, selected wavelength ranges with the highest correlation with water and salinity changes were used instead of the full wavelength range.
A custom normalized index for each of four studied enzymes (APX, GPX, CAT and SOD) was created, in order to evaluate the relationship between spectral data and enzyme measurements. The selection of wavelengths for each index was based on the correlation values of every single wavelength with enzyme measurements. Wavelengths with the highest and the lowest correlation values within as narrow a wavelength range as possible, representing rapid correlation change, were selected.
3. Results
3.1. Photosynthesis
The ANOVA analysis of the first photosynthesis measurement, taken on the 22 March before treatment initiation, reported the absence of significant correlations between plants assigned to different groups; therefore, it proved the studied plants’ homogeneity (
Figure 1).
The photosynthesis ANOVA of the second date revealed that ‘Amfisis’ and ‘Lefkolia Serron’ plants exposed to drought had significantly lower net photosynthetic rates than fully irrigated plants. In the case of ‘Mastoidis’, the salt-treated group appeared to have significantly higher photosynthesis than the rest of the groups of the same cultivar.
The data of the 23 May resulted in homogeneity among all treatments of ‘Mastoidis’ and ‘Amfisis’, while, in ‘Lefkolia Serron’, we detected significant differences between control, single stress and the combination of the two stress factors. Additionally, plants of ‘Mastoidis’ showed the same pattern as ‘Lefkolia Serron’ with lower statistical significance (
Figure 1).
During the subsequent data acquisition (10 June), differences among treatments of ‘Mastoidis’ became more apparent, resulting in a significant difference between fully and deficit-irrigated plants. ‘Lefkolia Serron’ showed a significant difference between control and drought-exposed plants. In contrast, ‘Amfisis’, once again, did not show any significant differences in photosynthesis of stressed plants; however, during this measurement, control plants appeared to have significantly higher photosynthesis than the rest of the groups. Additionally, ‘Lefkolia Serron’ control plants had significantly higher values than salt-treated plants.
The last photosynthesis measurements were performed on the 22 June. They showed that stressed plants of ‘Mastoidis’ (under a single stress factor or their combination) appeared to have statistically similar photosynthesis values significantly lower than control plants. The photosynthetic rate of control plants of ‘Amfisis’ seemed to be the highest, followed by drought- and salinity-treated plants. The lowest photosynthetic rate of the ‘Amfisis’ cultivar appeared in plants under the combination of drought and salinity stress. However, these differences among ‘Amfisis’ treatments were reported to be insignificant. Water deficit seemed to harm the photosynthetic rate of ‘Lefkolia Serron’ plants, while water salinity appeared not to have a significant effect.
3.2. Water Content
For the three cultivars, control plants had the highest shoot water content. At the same time, we recorded the lowest values in plants exposed to the combination of drought and salinity.
Leaf water content appeared to be homogeneous in all the cases, except for the combined drought/salinity treatment in ‘Amfisis’ and ‘Lefkolia Serron’ cultivars, which seemed to have significantly lower values than the other three treatment groups (
Figure 2).
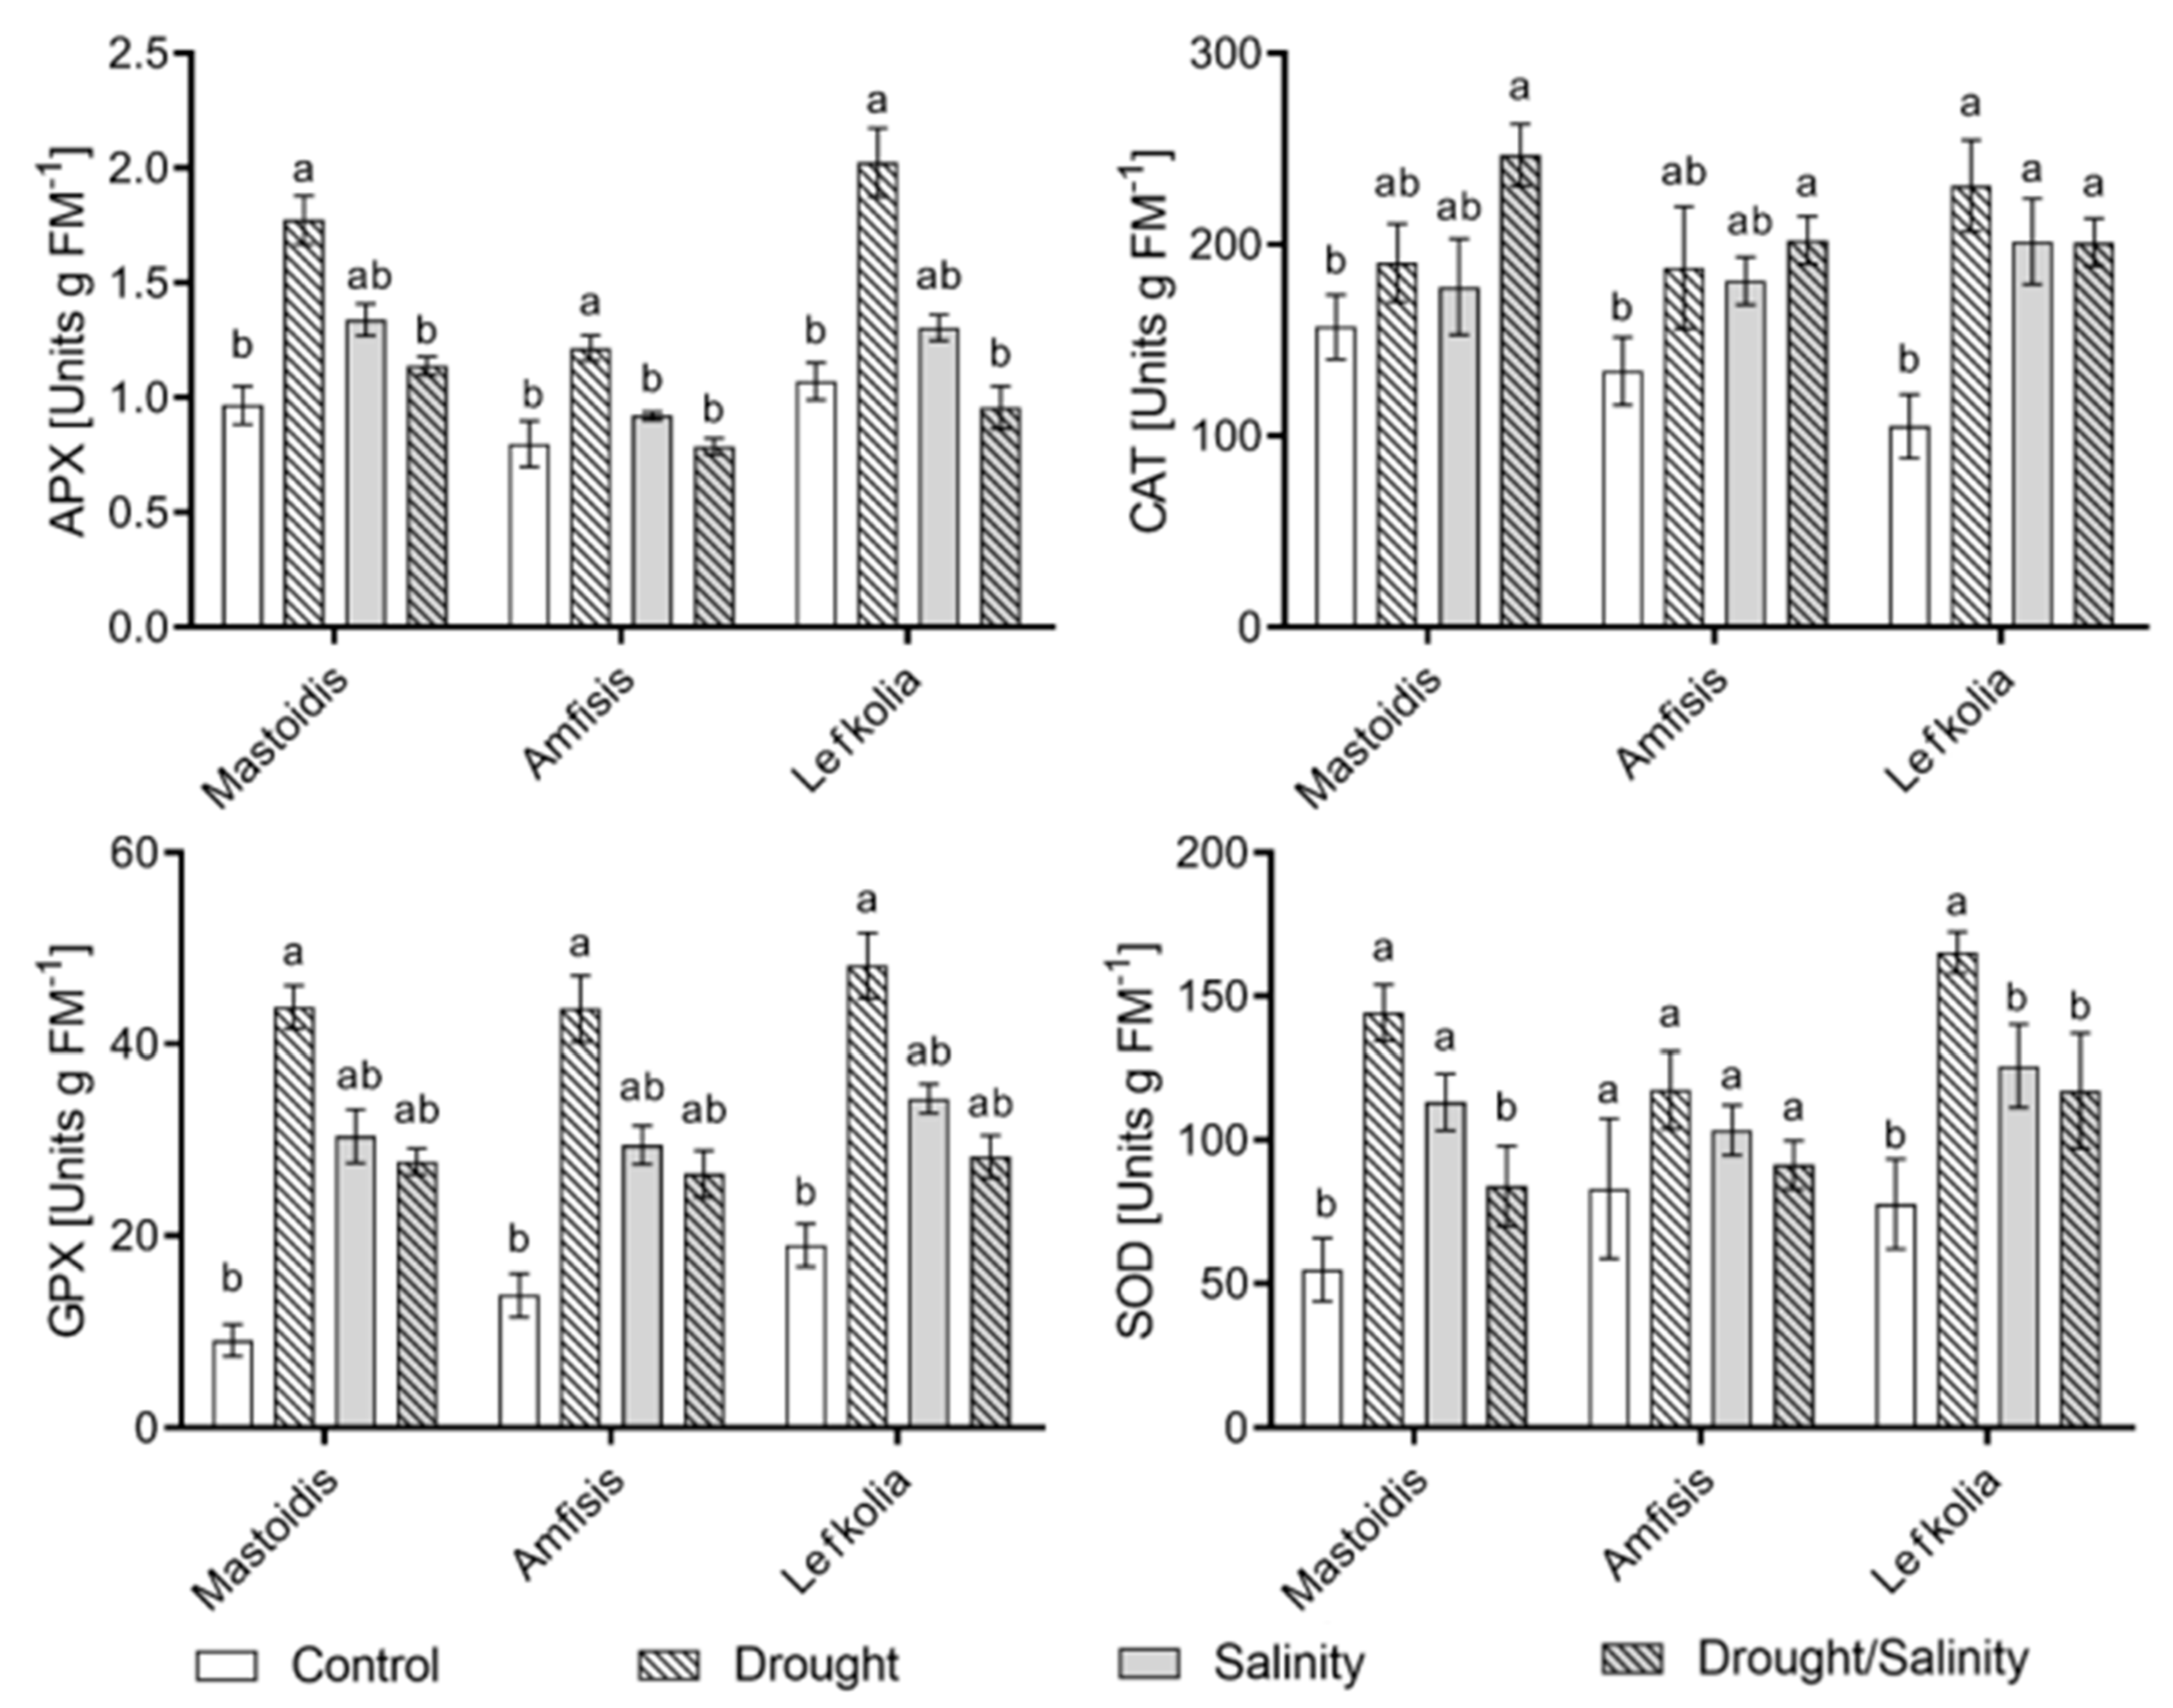
3.3. Enzyme Activity
Enzyme activity, presented in
Figure 3, revealed significant differences among treatments for all the cases except the SOD enzyme in the ‘Amfisis’ cultivar. In ‘Mastoidis’ and ‘Lefkolia Serron’ plants, both stress factors, when applied alone, resulted in higher superoxide dismutase activity, whereas the activation of SOD under the combination of the two stressors was not so prominent.
APX activity appeared to be significantly higher in drought-exposed plants in the majority of the treatments. As in the case of SOD, we also report a down-regulation of APX activity when the two stressors were applied together.
GPX activity appeared to be stimulated mainly by the lack of water in all cultivars, while salinity alone or in combination with drought did not significantly affect the enzyme activity.
Plants under combined salt/drought stress appeared to have significantly higher CAT activity values in all three cultivars.
3.4. Spectral Vegetation Indices
The vegetation indices calculated from the first data acquisition (22 March) for all cultivars were combined in one group by an ANOVA analysis (
Figure 4), confirming that the experimental plants were homogenous before the start of the treatments.
The second spectral reflectance dataset, collected on the 27 April did not indicate any significant differences in the NDVI and WI values either. However, the PRI resulted in a substantial difference between combined salinity/drought and salinity treatments of ‘Mastoidis’ and between salinity and drought treatments of ‘Lefkolia Serron’.
Nevertheless, the ANOVA results for the following dataset (23 May) did not significantly differ in the PRI of different treatments. However, the NDVI of ‘Lefkolia Serron’ appeared to be significantly higher in control plants than in plants exposed to combined salt/water treatment.
The NDVI calculated from the fourth (10 June) and fifth (22 June) dataset appeared to be higher in fully irrigated than in scarcely irrigated plants of ‘Mastoidis’ and ‘Lefkolia Serron’. The NDVI of ‘Amfisis’ resulted in being significantly different for the control treatment during the fourth data collection. However, the last data collection classified differences among treatments as non-significant. We observed a similar situation in the PRI of ‘Amfisis’ and in the WI of ‘Lefkolia Serron’, which resulted in significant differences among treatments on the fourth, but not on the fifth date. However, the WI resulted in a significant difference in ‘Mastoidis’, indicating the difference between control and drought-exposed plants during the last spectral data collection.
3.5. Correlation between Vegetation Indices and Enzyme Activities
The correlation analysis of VIs, enzymes and water content (
Table 1) indicated a significant relationship between the WI and enzymes GPX and SOD. Additionally, GPX appeared to correlate significantly with the NDVI. The VIs seemed to have a significant correlation with each other. Enzymes also appeared to be cross-correlated, with the exception of SOD/CAT. Moreover, shoot water content appeared to be significantly correlated with CAT activity.
A significantly high correlation between photosynthetic activity and the NDVI was observed (
Table 2). The WI and PRI did not result in a strong correlation. However, using all cultivars in combination and increasing the number of samples resulted in higher correlation values than using each cultivar separately.
3.6. PCR and PLSR Analyses of Hyperspectral Data and Photosynthesis
The PSR and PLSR of hyperspectral data against photosynthesis (
Table 3) indicated an increase in r
2 towards the end of the experiment for ‘Mastoidis’ and ‘Lefkolia Serron’. However, the PCR of ‘Amfisis’ resulted in a decrease in r
2. Additionally, the third data acquisition resulted in statistically low regression values for ‘Amfisis’, while the r
2 for ‘Mastoidis’ and ‘Lefkolia Serron’ appeared significantly high.
The multivariate regression of spectral data against enzyme and water content data (
Table 4) resulted in relatively low r
2 in all cases. The PLSR for APX and leaf water content failed to perform due to a limited number of samples.
3.7. Linear Discriminant Analysis of Hyperspectral Datasets
We performed a linear discriminant analysis using selected wavelengths instead of the full wavelengths range due to the limitations of the method. We selected wavelengths from the peaks of correlation between spectra and water/salt application, which appeared to be 560–650 nm and 720–730 nm for water changes and 600–720 nm for salinity changes.
The LDA using the selected wavelength ranges resulted in very high classification accuracies, which increased with stress severity (
Table 5). However, a slight drop in accuracy between the second and third measurement dates was observed for drought and salinity evaluations.
3.8. Correlation between Single Wavelengths and Enzyme Activity Results
Figure 5 presents a correlation curve of spectral reflectance values with enzyme activity results. As can be seen, GPX appeared to have the highest correlation with the spectrum, followed by SOD. In addition, APX seemed to have a high correlation with spectral reflectance in the range between 1200 and 1900 nm, GPX in the range 1400–1850 nm, CAT in the visible part of the spectrum and SOD around 1350 nm.
The correlation of normalized ratios with enzyme activity (
Table 6) appeared to be higher than the correlation of individual wavelengths for APX and CAT. The correlation appeared to be statistically significant for GPX and SOD.
4. Discussion
4.1. Water Content and Photosynthesis
In this study, water content, photosynthesis and antioxidative enzyme activity in olive trees under drought and salinity stress conditions were quantified and spectral reflectance was used to monitor the plants’ functioning.
Several studies have investigated water content and photosynthesis changes in olive trees under the influence of several abiotic stresses [
15,
25,
27,
31,
45,
46]. The results of the current study confirm the findings of previous researchers, indicating that water content and photosynthetic characteristics decrease with irrigation reduction.
Olive physiological parameters are mainly affected by the irrigation water amount. In contrast, the salinity effect was not so prominent even during the last stage of the experimental procedure. Throughout the experimental testing period, most of the parameters examined were worsened as a response to drought both when used as a single stress factor and (mainly) when applied in combination with salinity. This result indicates that the two stressors may have additive (and probably fatal) effects when imposed together.
This pattern agrees with the results obtained by Moula et al. [
45], who reported a decrease in photosynthesis of salinity-exposed plants due to dehydration of plant cells, among other factors.
Earlier studies reported a significant decrease in photosynthetic rates following salinity treatment in ‘Amfisis’ [
47], ‘Çhemlali’ [
45] and ‘Koroneiki’ [
47,
48]. However, our results reveal a rather salt-tolerant character of the three olive cultivars studied, which agrees with previously published findings [
12,
13,
15,
45].
4.2. Enzyme Response to Stress
Inadequate water supply and the consequent interruption of the photosynthetic processes in water- and/or salinity-stressed plants cause the over-reduction of the photosynthetic electron chain and the stimulated production of reactive oxygen species (ROS). These molecules have the potential to cause several harmful events. Plants have a variety of defense mechanisms to ameliorate the harmful effects of ROS which include an integrated enzymatic and non-enzymatic system present in several subcellular compartments. The antioxidant enzyme increase in stressed plants is a significant mechanism to balance the production and removal of ROS [
49]. Ben Abdallah et al. [
50] states that the increase in the H
2O
2 level causes SOD and CAT increase with water availability decrease. SOD is produced in chloroplasts by the photosynthetic electron transport chain [
51]. Therefore, SOD activation indicates immediate activation of chloroplasts in response to stress conditions, which is likely to be displayed before the appearance of physiological stress symptoms [
52]. Bacelar et al. [
53] reported a significant increase in GPX in drought-exposed olive trees. However, SOD activity decreased with water stress increase. Guerfel et al. [
54] detected the dependence of SOD activity on the olive tree genotype, which was confirmed by Koubouris et al. [
21]. In the case of the studied cultivars, SOD increased in drought-treated plants. However, differences in SOD for the ‘Amfisis’ cultivar appeared insignificant. APX level activity increased in scarcely irrigated plants, which supports findings reported in previous studies [
19,
54].
In our study, water stress increased SOD, GPX and APX activity, in the majority of the treatments. In contrast, the activation of the above enzymes in the combined stress treatment was not so prominent. However, the activation of the antioxidant defense under drought does not agree with the decreases in gas exchange characteristics reported in all cultivars. Therefore, we may conclude that the activation of the antioxidant defense system in olive plants under prolonged limited water supply did not improve photosynthetic performance, indicating complex physiological and biochemical processes that are not always capable of alleviating stress.
4.3. Relationship between Plant Health Parameters and Spectral Reflectance
The vegetation indices began to respond to the experimental treatment in less than three months. At the stage of the fourth spectral reflectance data collection (10 June), the NDVI performed better in grouping plants by treatment than the WI and PRI, attributing different classes for separate treatments of all three studied cultivars. However, the NDVI values appeared to be different for different water regimes compared to salt application. At the same time, the WI resulted in differences between the control and salt-treated groups of ‘Lefkolia Serron’ and between the salt-treated and combined salinity/drought treatments of ‘Mastoidis’. These results contradict the study by Marino et al. [
31], which stated that the WI is a better predictor of olive tree water status than the NDVI.
The VIs of ‘Amfisis’ resulted in similar values among treatments for all three indices. Additionally, the photosynthesis values of ‘Amfisis’ measured on the same day appeared to be statistically similar, which leads to an assumption that the ‘Amfisis’ cultivar demonstrated self-regulation of plant functions; therefore, it presented resistance to moderate salinity and water stresses. The most significant differences among treatments in respect to the last spectral reflection dataset were obtained from the NDVI values, supporting statements of previous studies claiming the NDVI to be a good predictor of water [
31,
55,
56,
57] and salinity stress [
28].
Garbulsky et al. [
58] stated that the PRI is an efficient predictor of photosynthesis. In the current study, the correlation between photosynthesis and the PRI was more significant when analyzing all three cultivars together, which might be caused by differences in the PRI and photosynthesis among cultivars. Nevertheless, the NDVI and PRI appeared to significantly correlate with the photosynthetic rate, which agrees with the results reported in earlier studies [
9,
35,
58,
59,
60].
The photosynthesis and spectral data relationship estimated by multivariate regression methods appeared to be strong for most cases, which confirms the high predicting ability of photosynthesis by PCR and PLSR. Previous studies showed that PLSR usually performs slightly better than PCR [
34,
39,
60], which was verified by this study.
The LDA performed using selected wavelengths resulted in high classification accuracy among treatments, with different water regimes being classified more accurately than different salinity levels, except the first measuring date. Moreover, accuracy appeared to increase with stresses intensification, reaching 87.88% by the end of the experimental treatments.
The customized indices, calculated using single-wavelength correlation graphs, resulted in significant correlations with enzyme activity in the cases of GPX and SOD. Therefore, the customized indices appeared to be more efficient than the examined conventional indices, among which the highest correlation was obtained by the WI. However, the WI appeared to be more correlated with SOD than the customized index, resulting in r2 = −0.503 and r2 = 0.413, respectively. Therefore, a 900/970 nm ratio was found to be more suitable in SOD enzyme activity estimation than the suggested 1870/1380 nm ratio.
4.4. Methodological Considerations
In this study, due to the small field of view, only a small leaf sample of the plant was used, which is not optimal when representing the entire canopy. However, due to the young age of the plants and the relatively small number of leaves present, the removal of additional leaves to ensure better representation might have impacted plant growth.
5. Conclusions
This study demonstrates the photosynthesis and antioxidative enzyme activity of drought-exposed and salt-treated olive plants and their correlation with hyperspectral reflectance data. The water content of stress-subjected plants decreased while enzyme activity increased. Predominantly, the studied drought conditions influenced enzymes.
NDVI extraction and multivariate correlation performance indicated the best correlation between photosynthesis and spectral reflectance. The suggested indices, based on the correlation curve between spectral reflectance of single wavelengths and enzyme measurements, resulted in being significantly correlated with APX, GPX and CAT. At the same time, the WI (900/970 nm) appeared to be the most efficient for SOD enzyme activity estimation. In summary, hyperspectral reflectance data analyses seem to detect enzyme activity in olive trees while displaying particular usefulness in photosynthetic rate prediction and early detection of drought and salinity stress in olive trees. This is the first time that the tolerance of three olive varieties of major importance to Greece (which is the third country in olive oil production worldwide) to water deficit, salinity and their combination was determined through the most critical physiological and biochemical indicators, namely, photosynthetic rate and antioxidant enzyme activities, respectively. In addition, this is the first time the correlation of hyperspectral imagery with photosynthetic rate and antioxidant enzyme activities was determined, providing the background for high-throughput plant phenotyping through a drone with a hyperspectral camera. This progress would provide early stress detection in large fields and assist farmers in decision making and optimizing crop management, health and productivity.


 ,
, 


