
The Potential Impact of Climate Extremes on Cotton and Wheat Crops in Southern Punjab, Pakistan


 and
and 
Abstract
:1. Introduction
2. Material and Methods
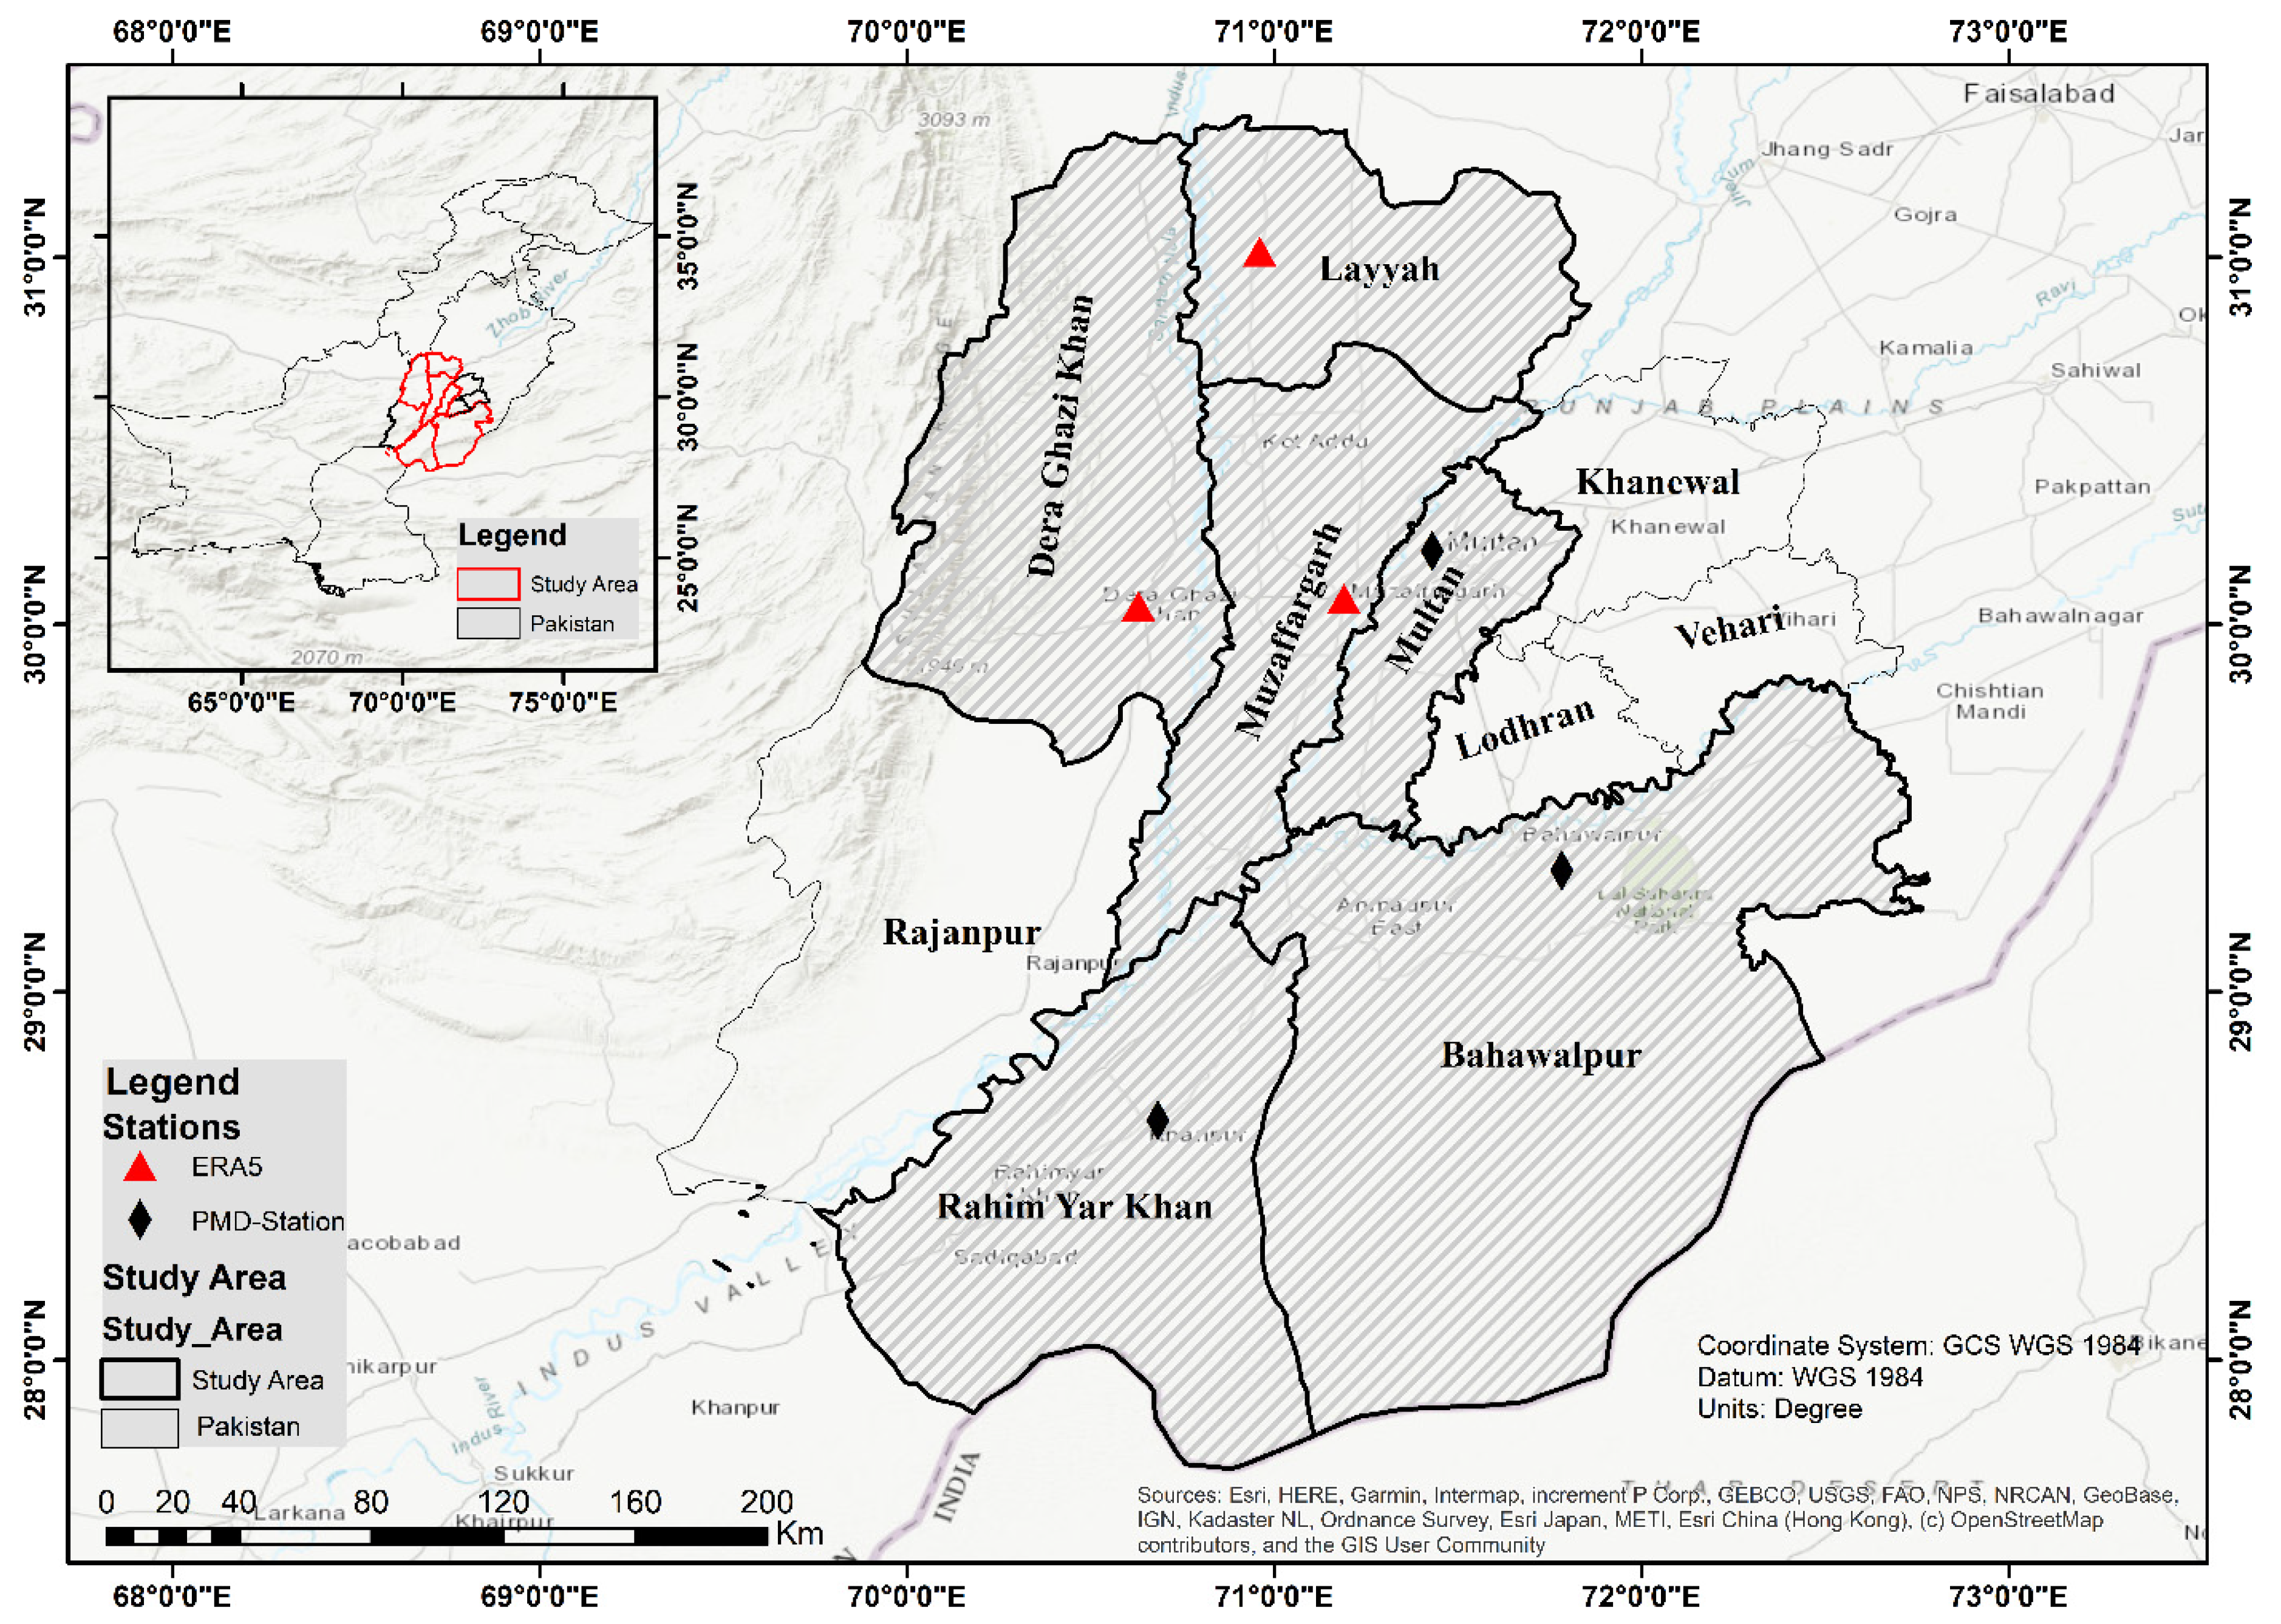
2.1. Study Area
2.2. Datasets
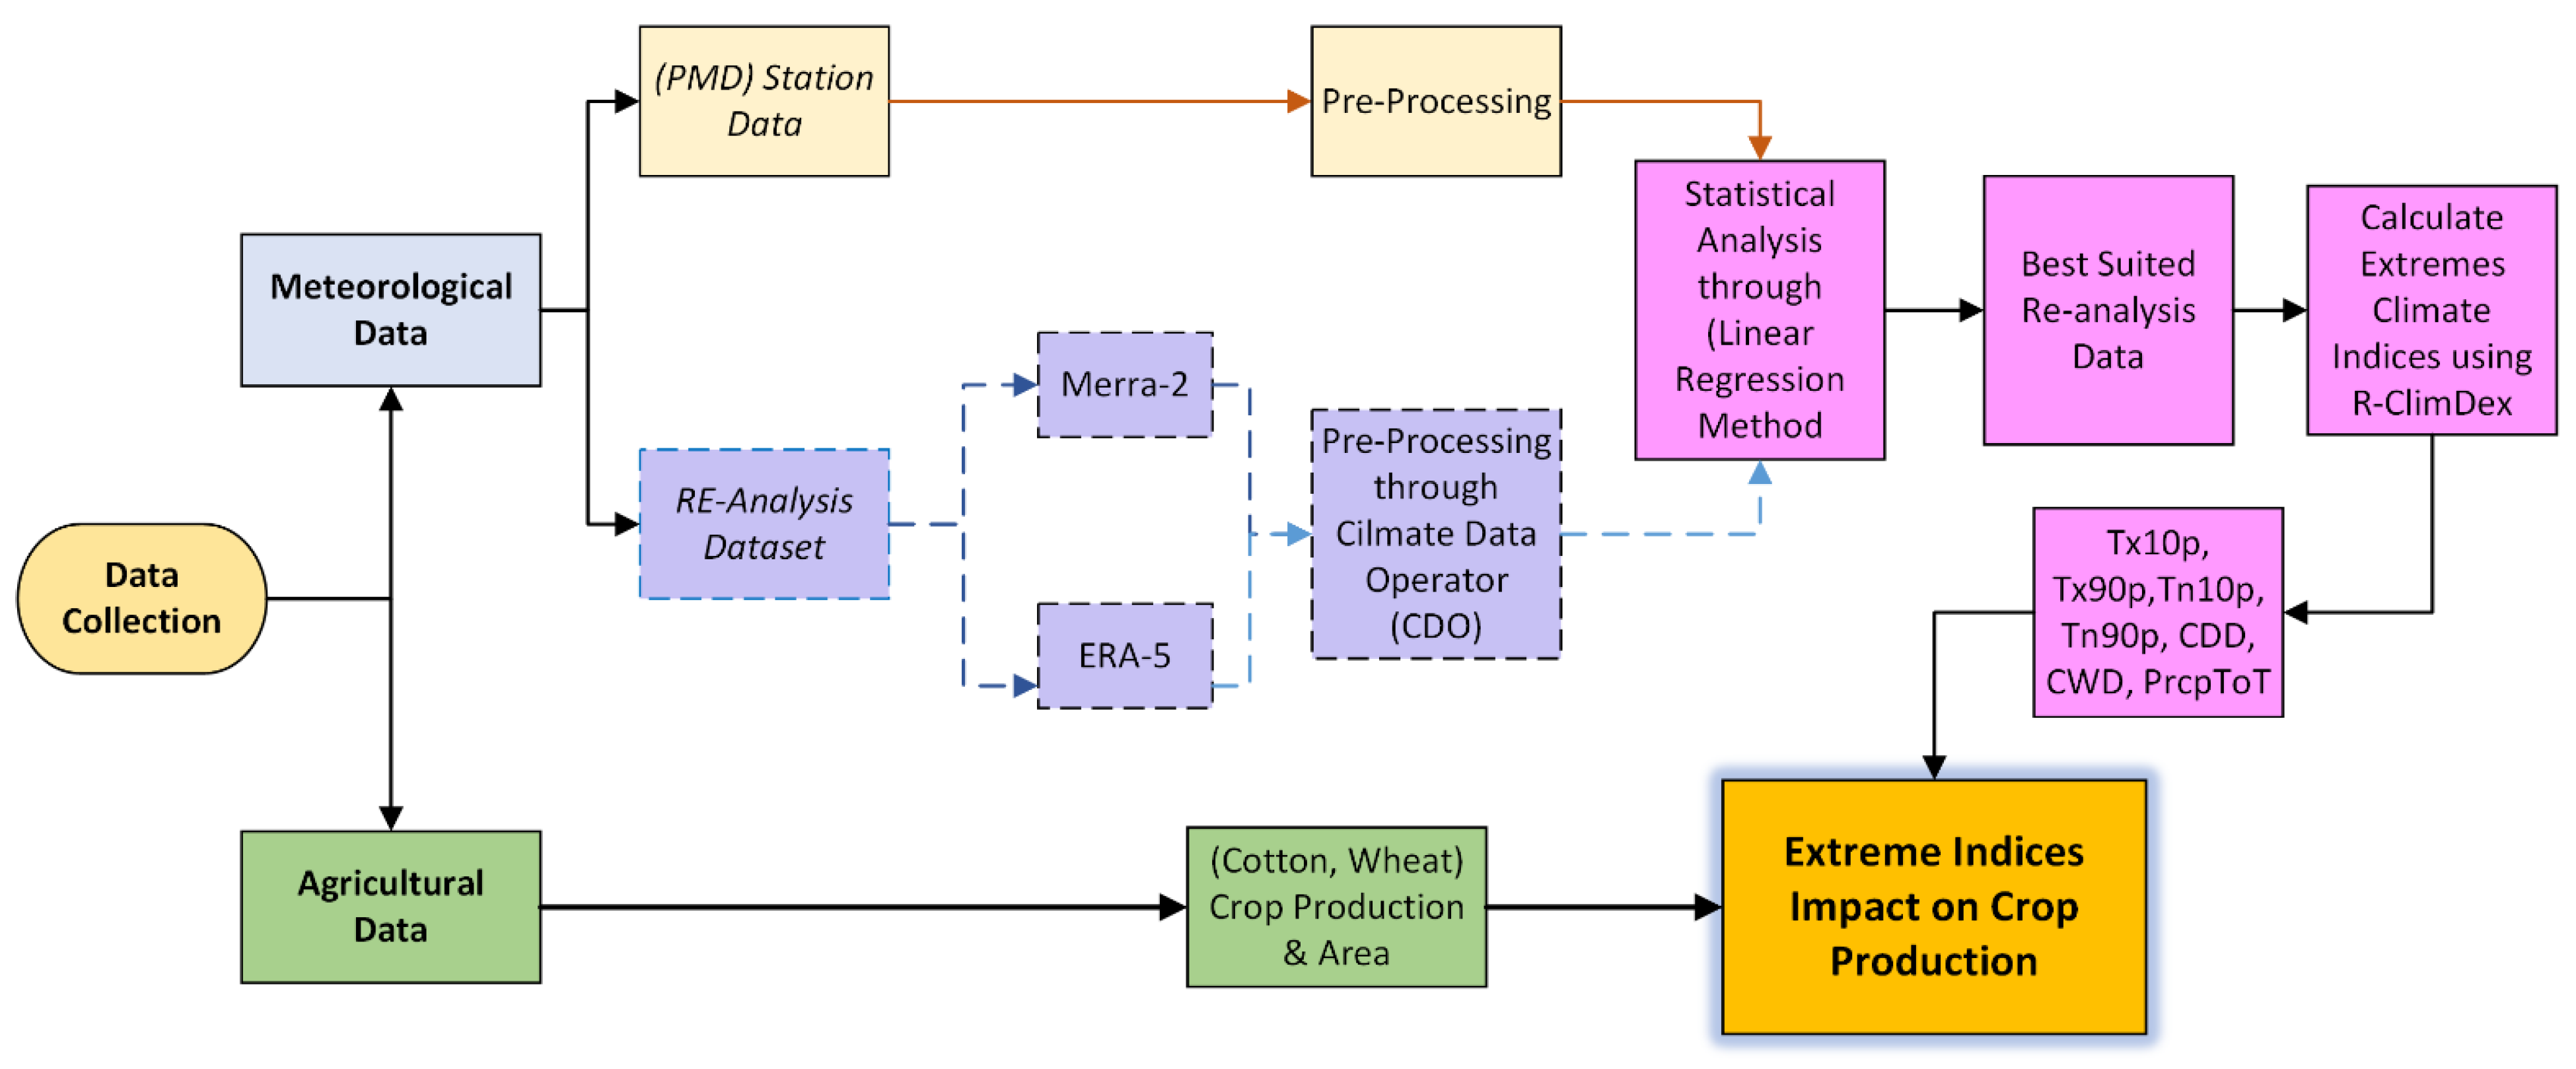
2.3. Methodology
3. Results
3.1. Comparison of Observed and Reanalysis Datasets
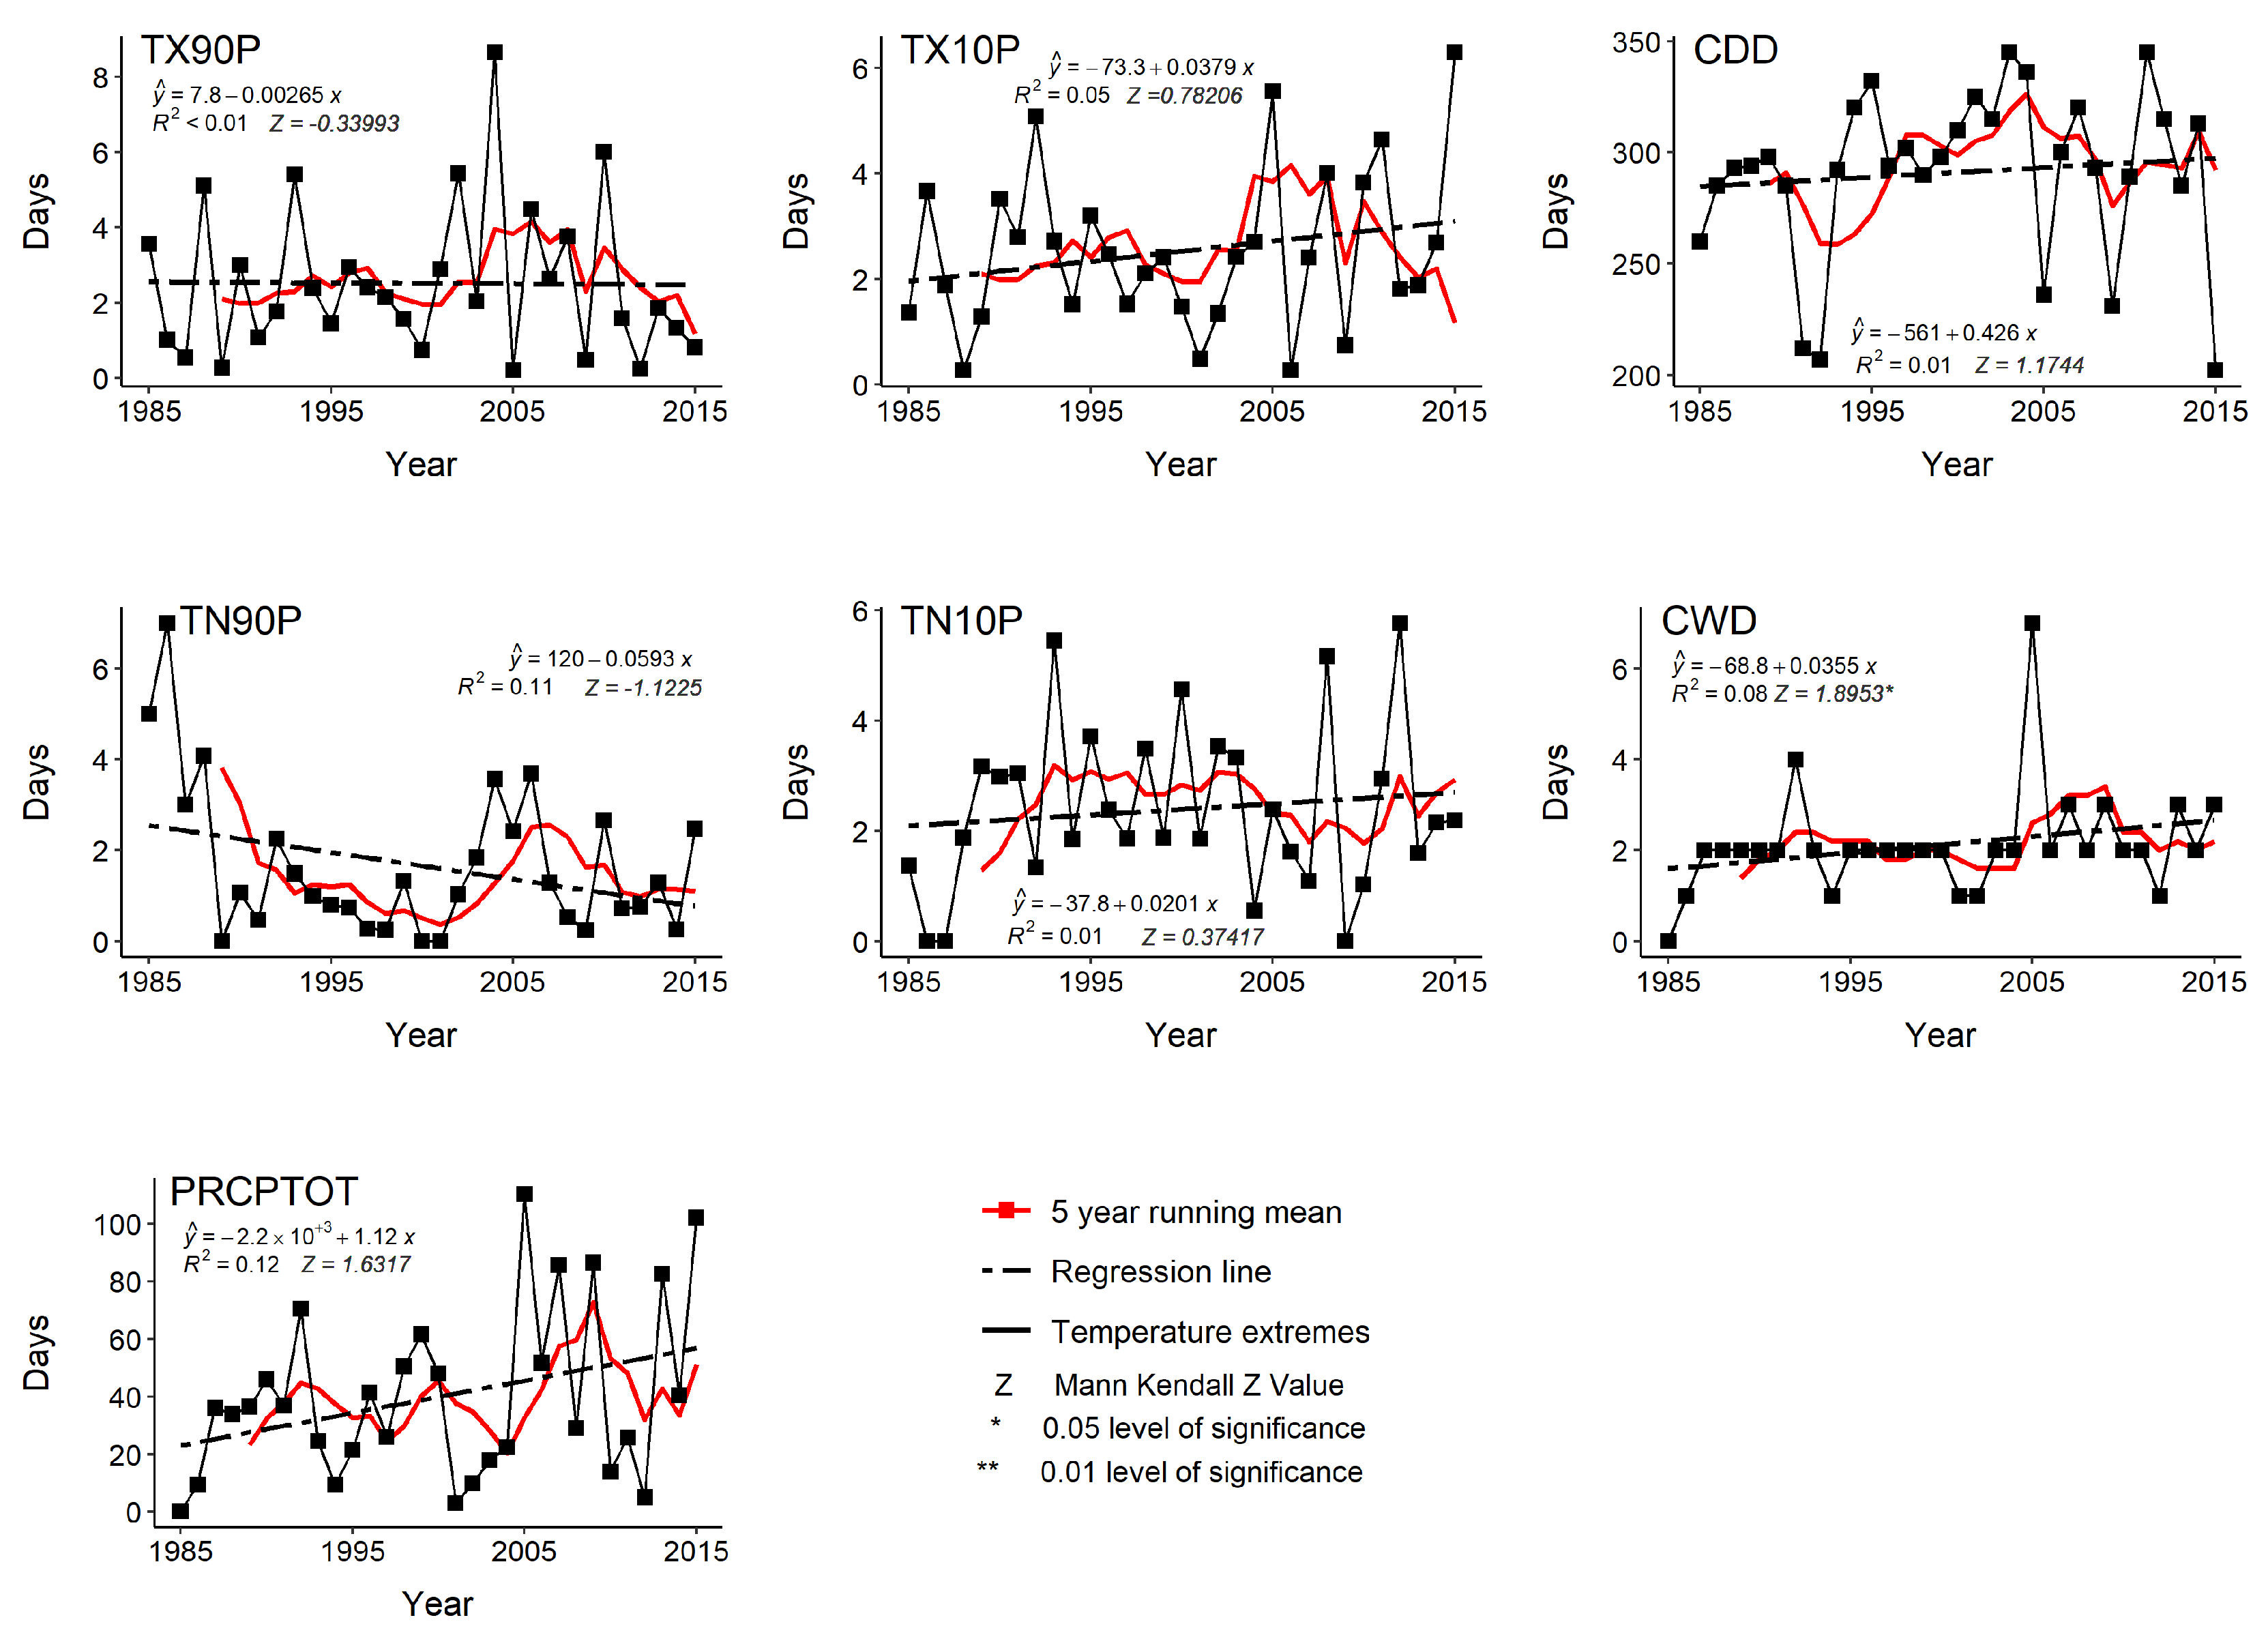
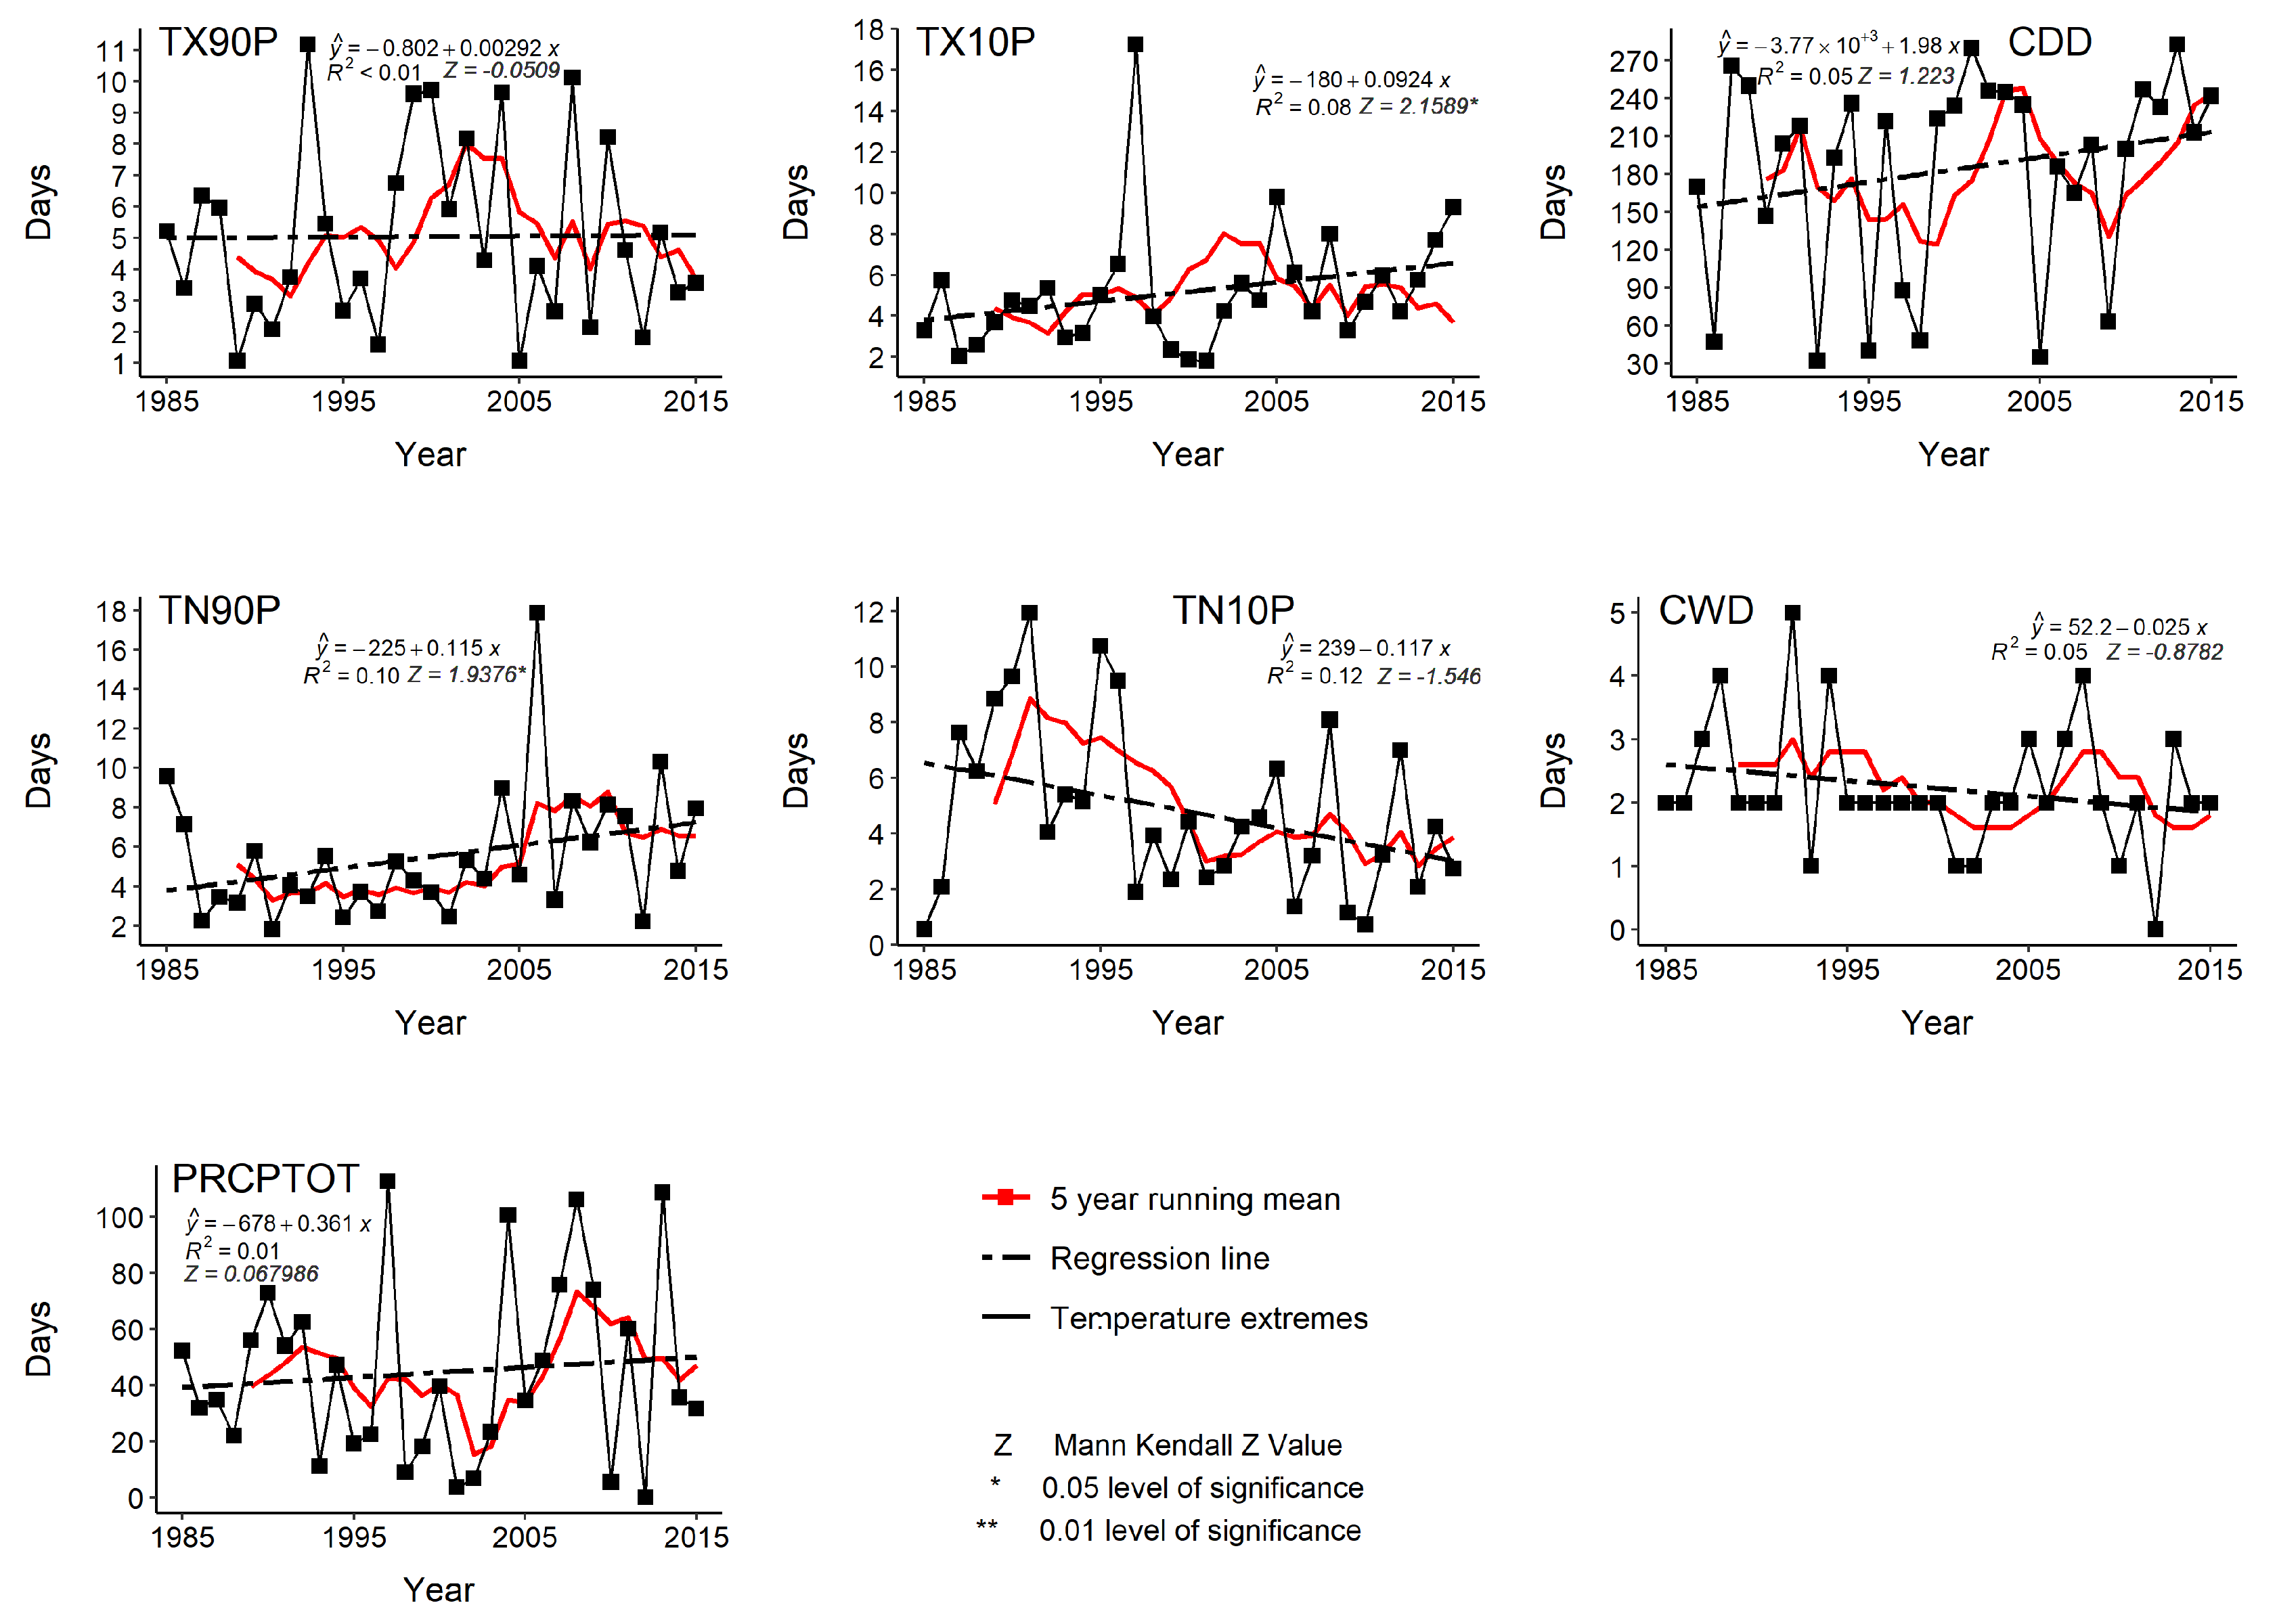
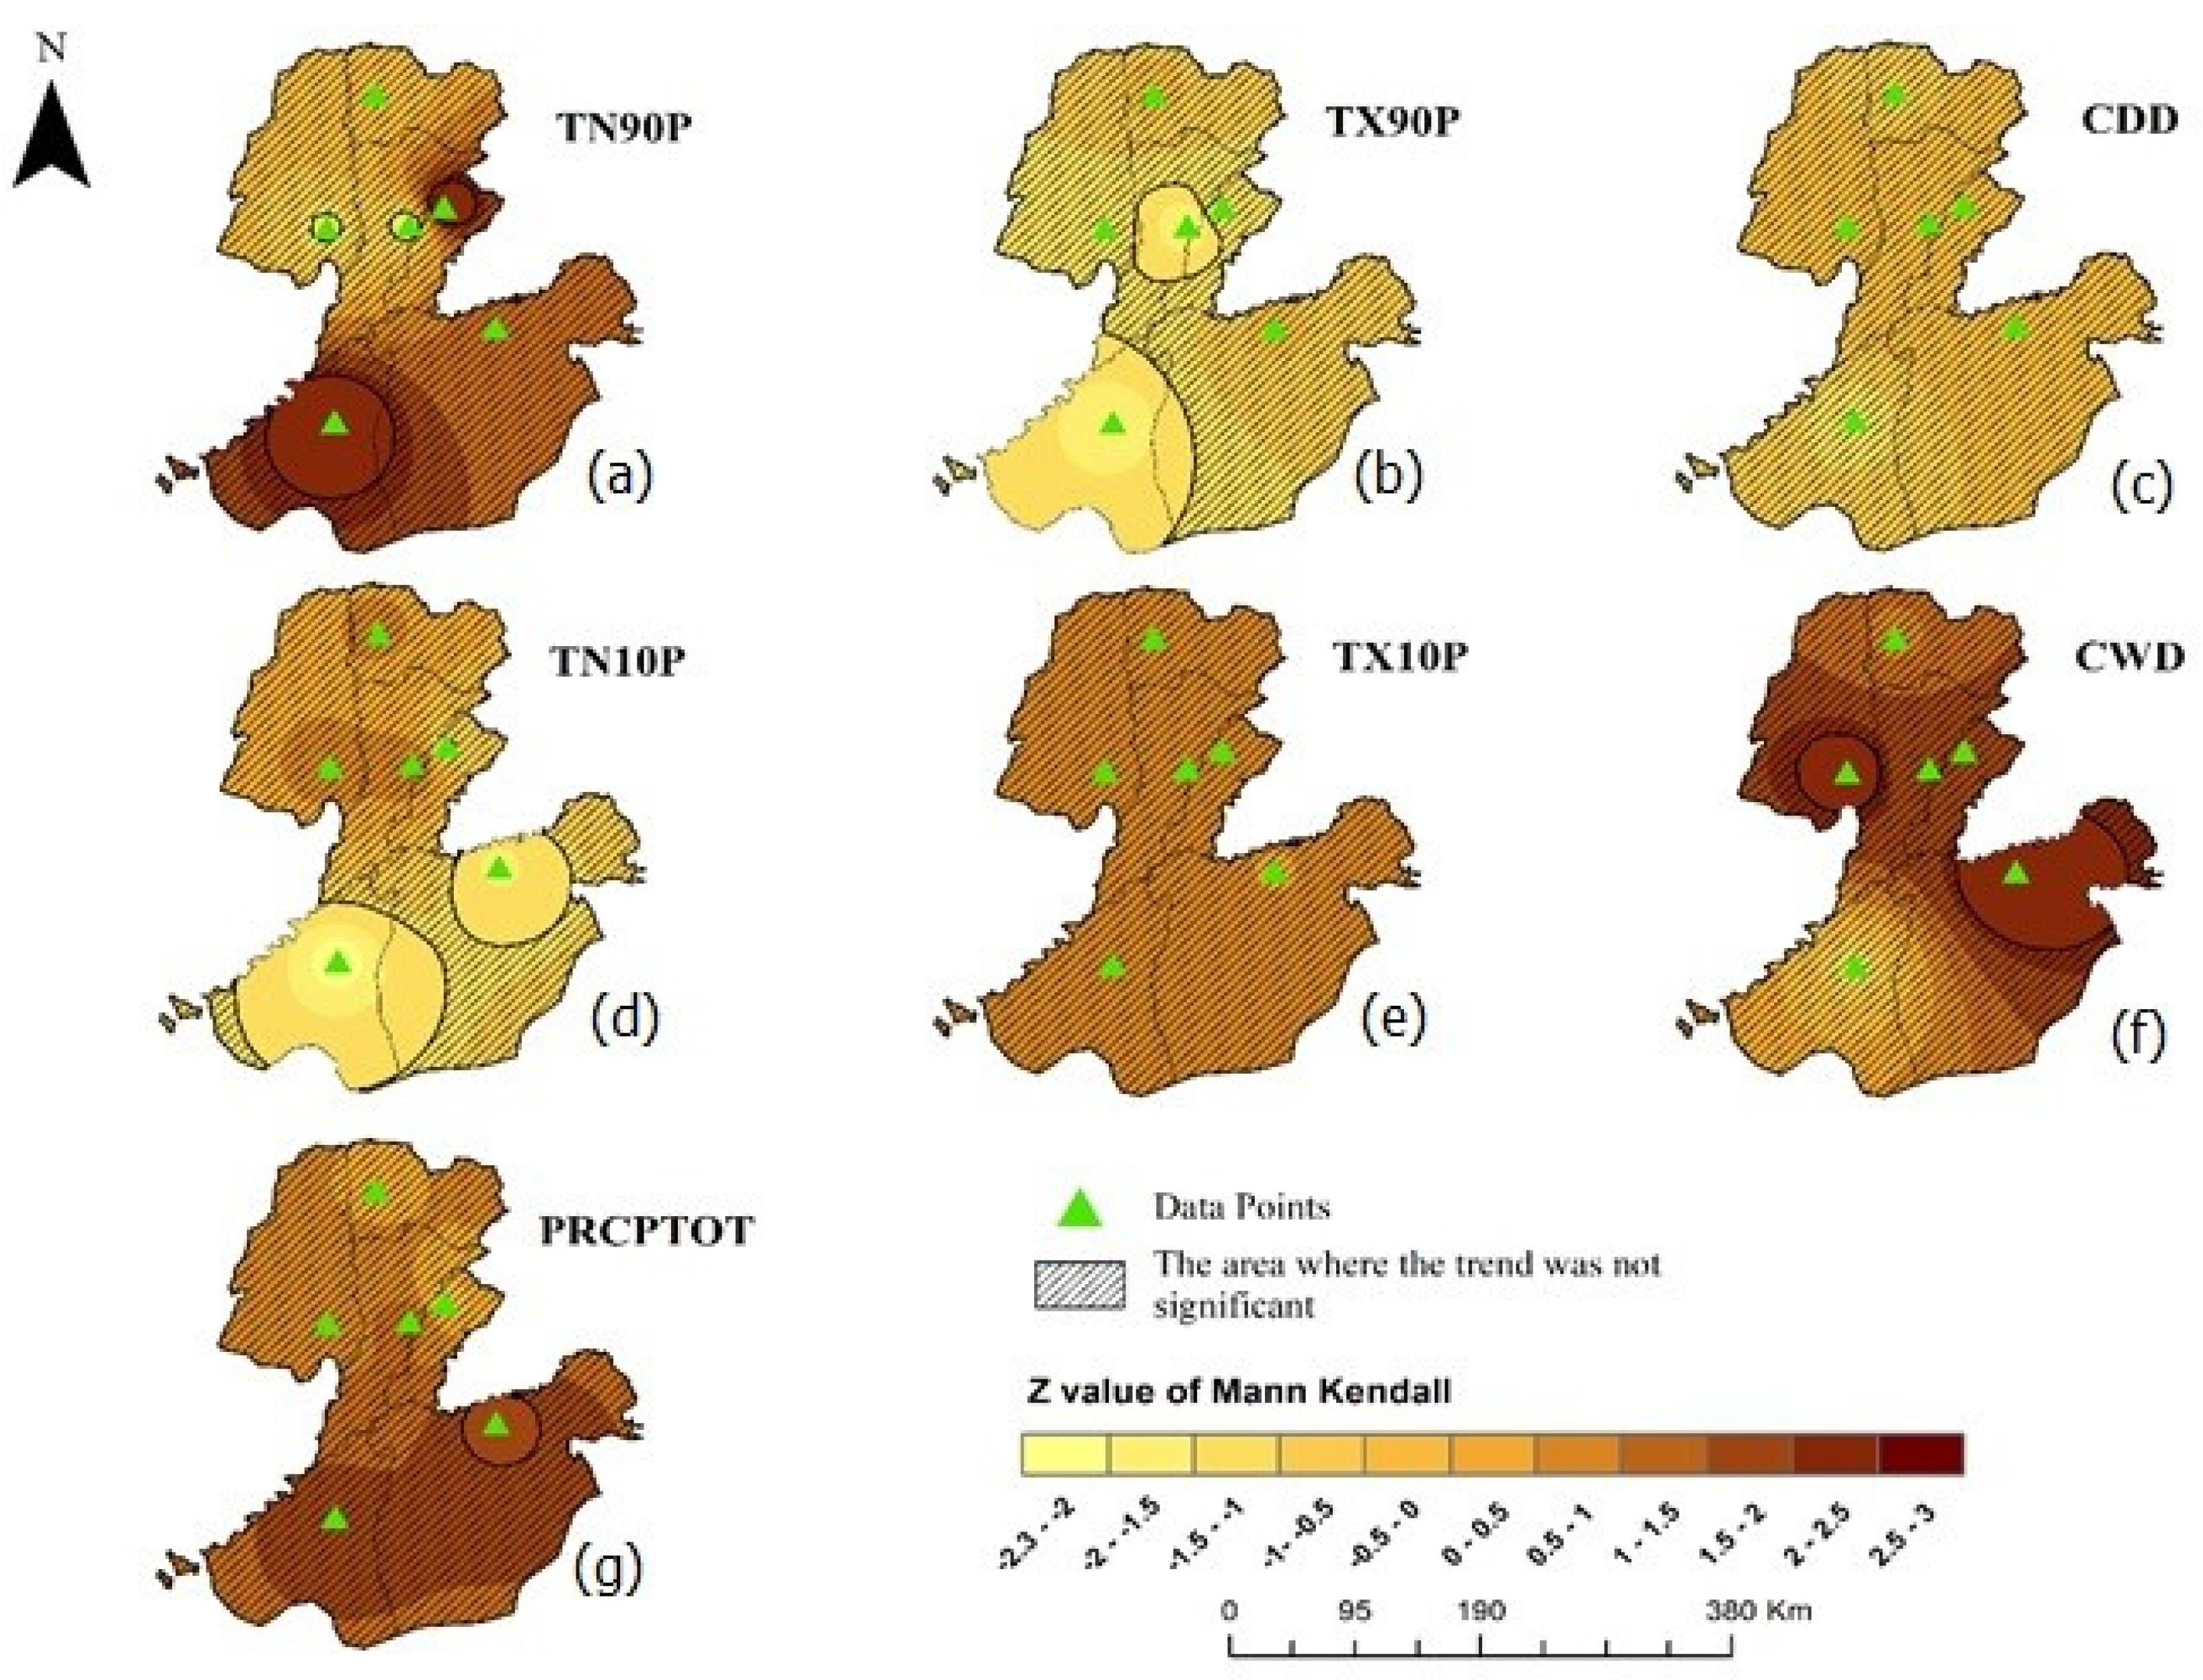
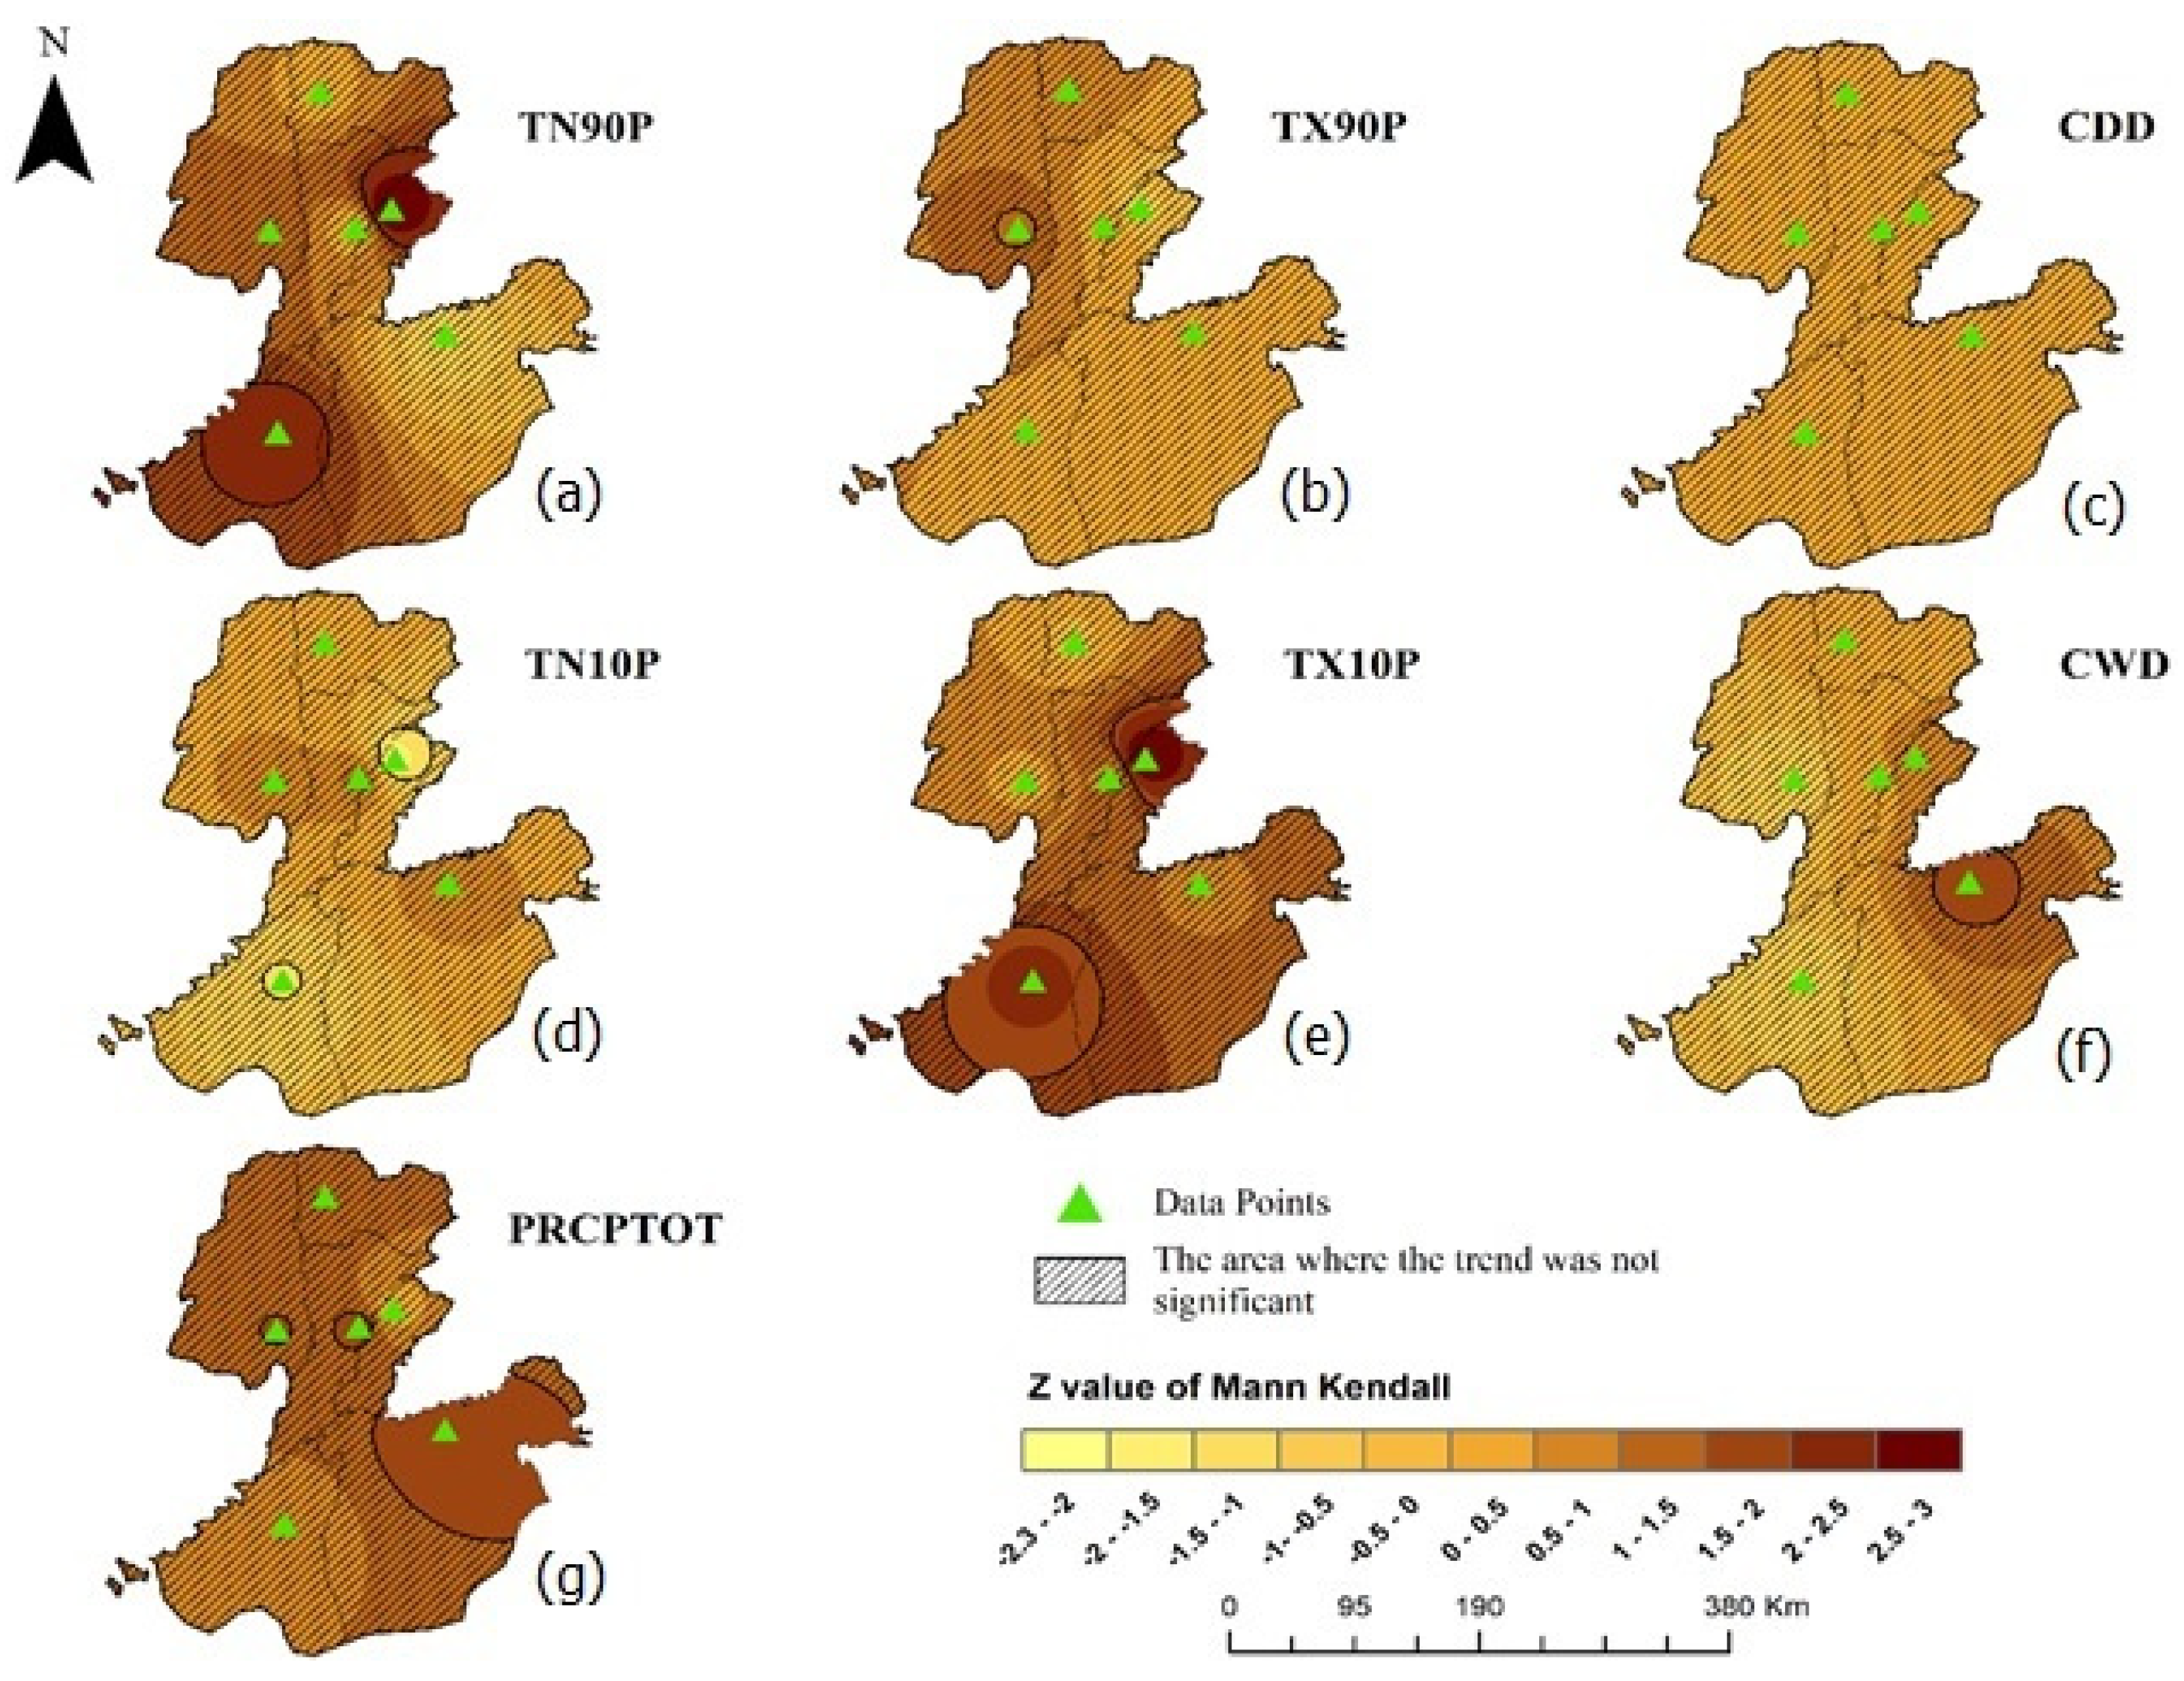
3.2. Temperature- and Precipitation-Related Extreme Climate Indices
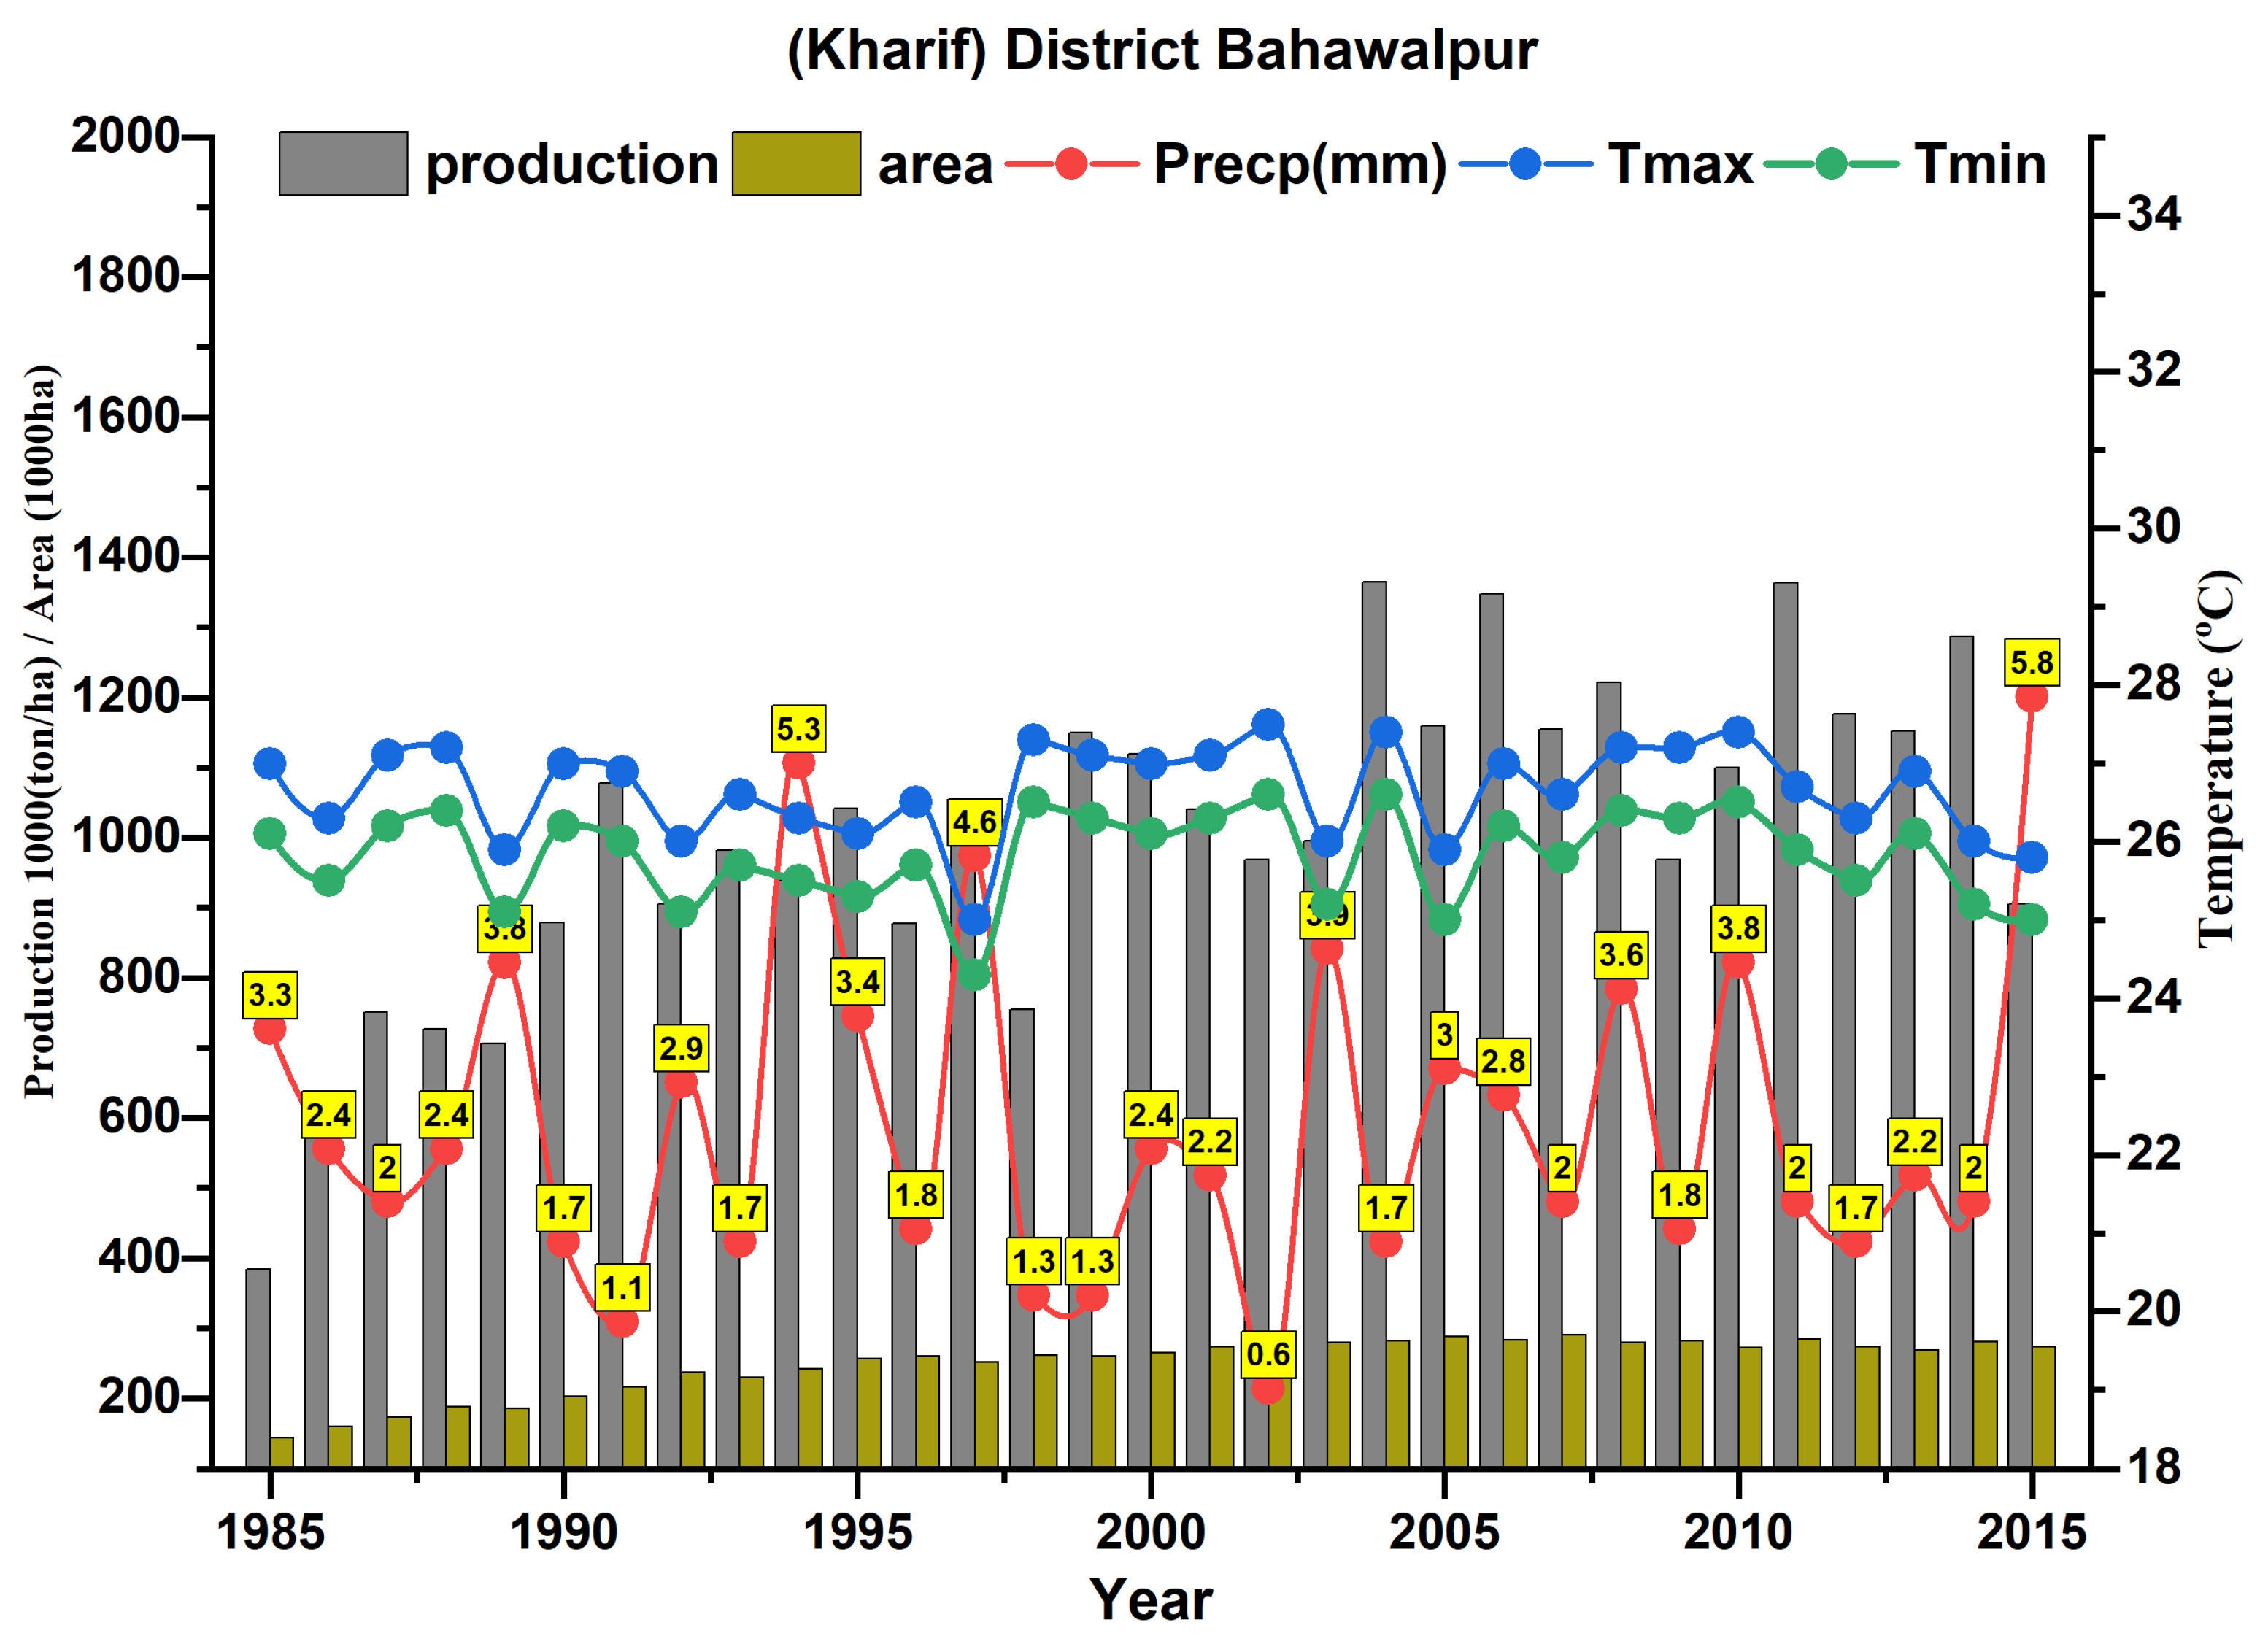
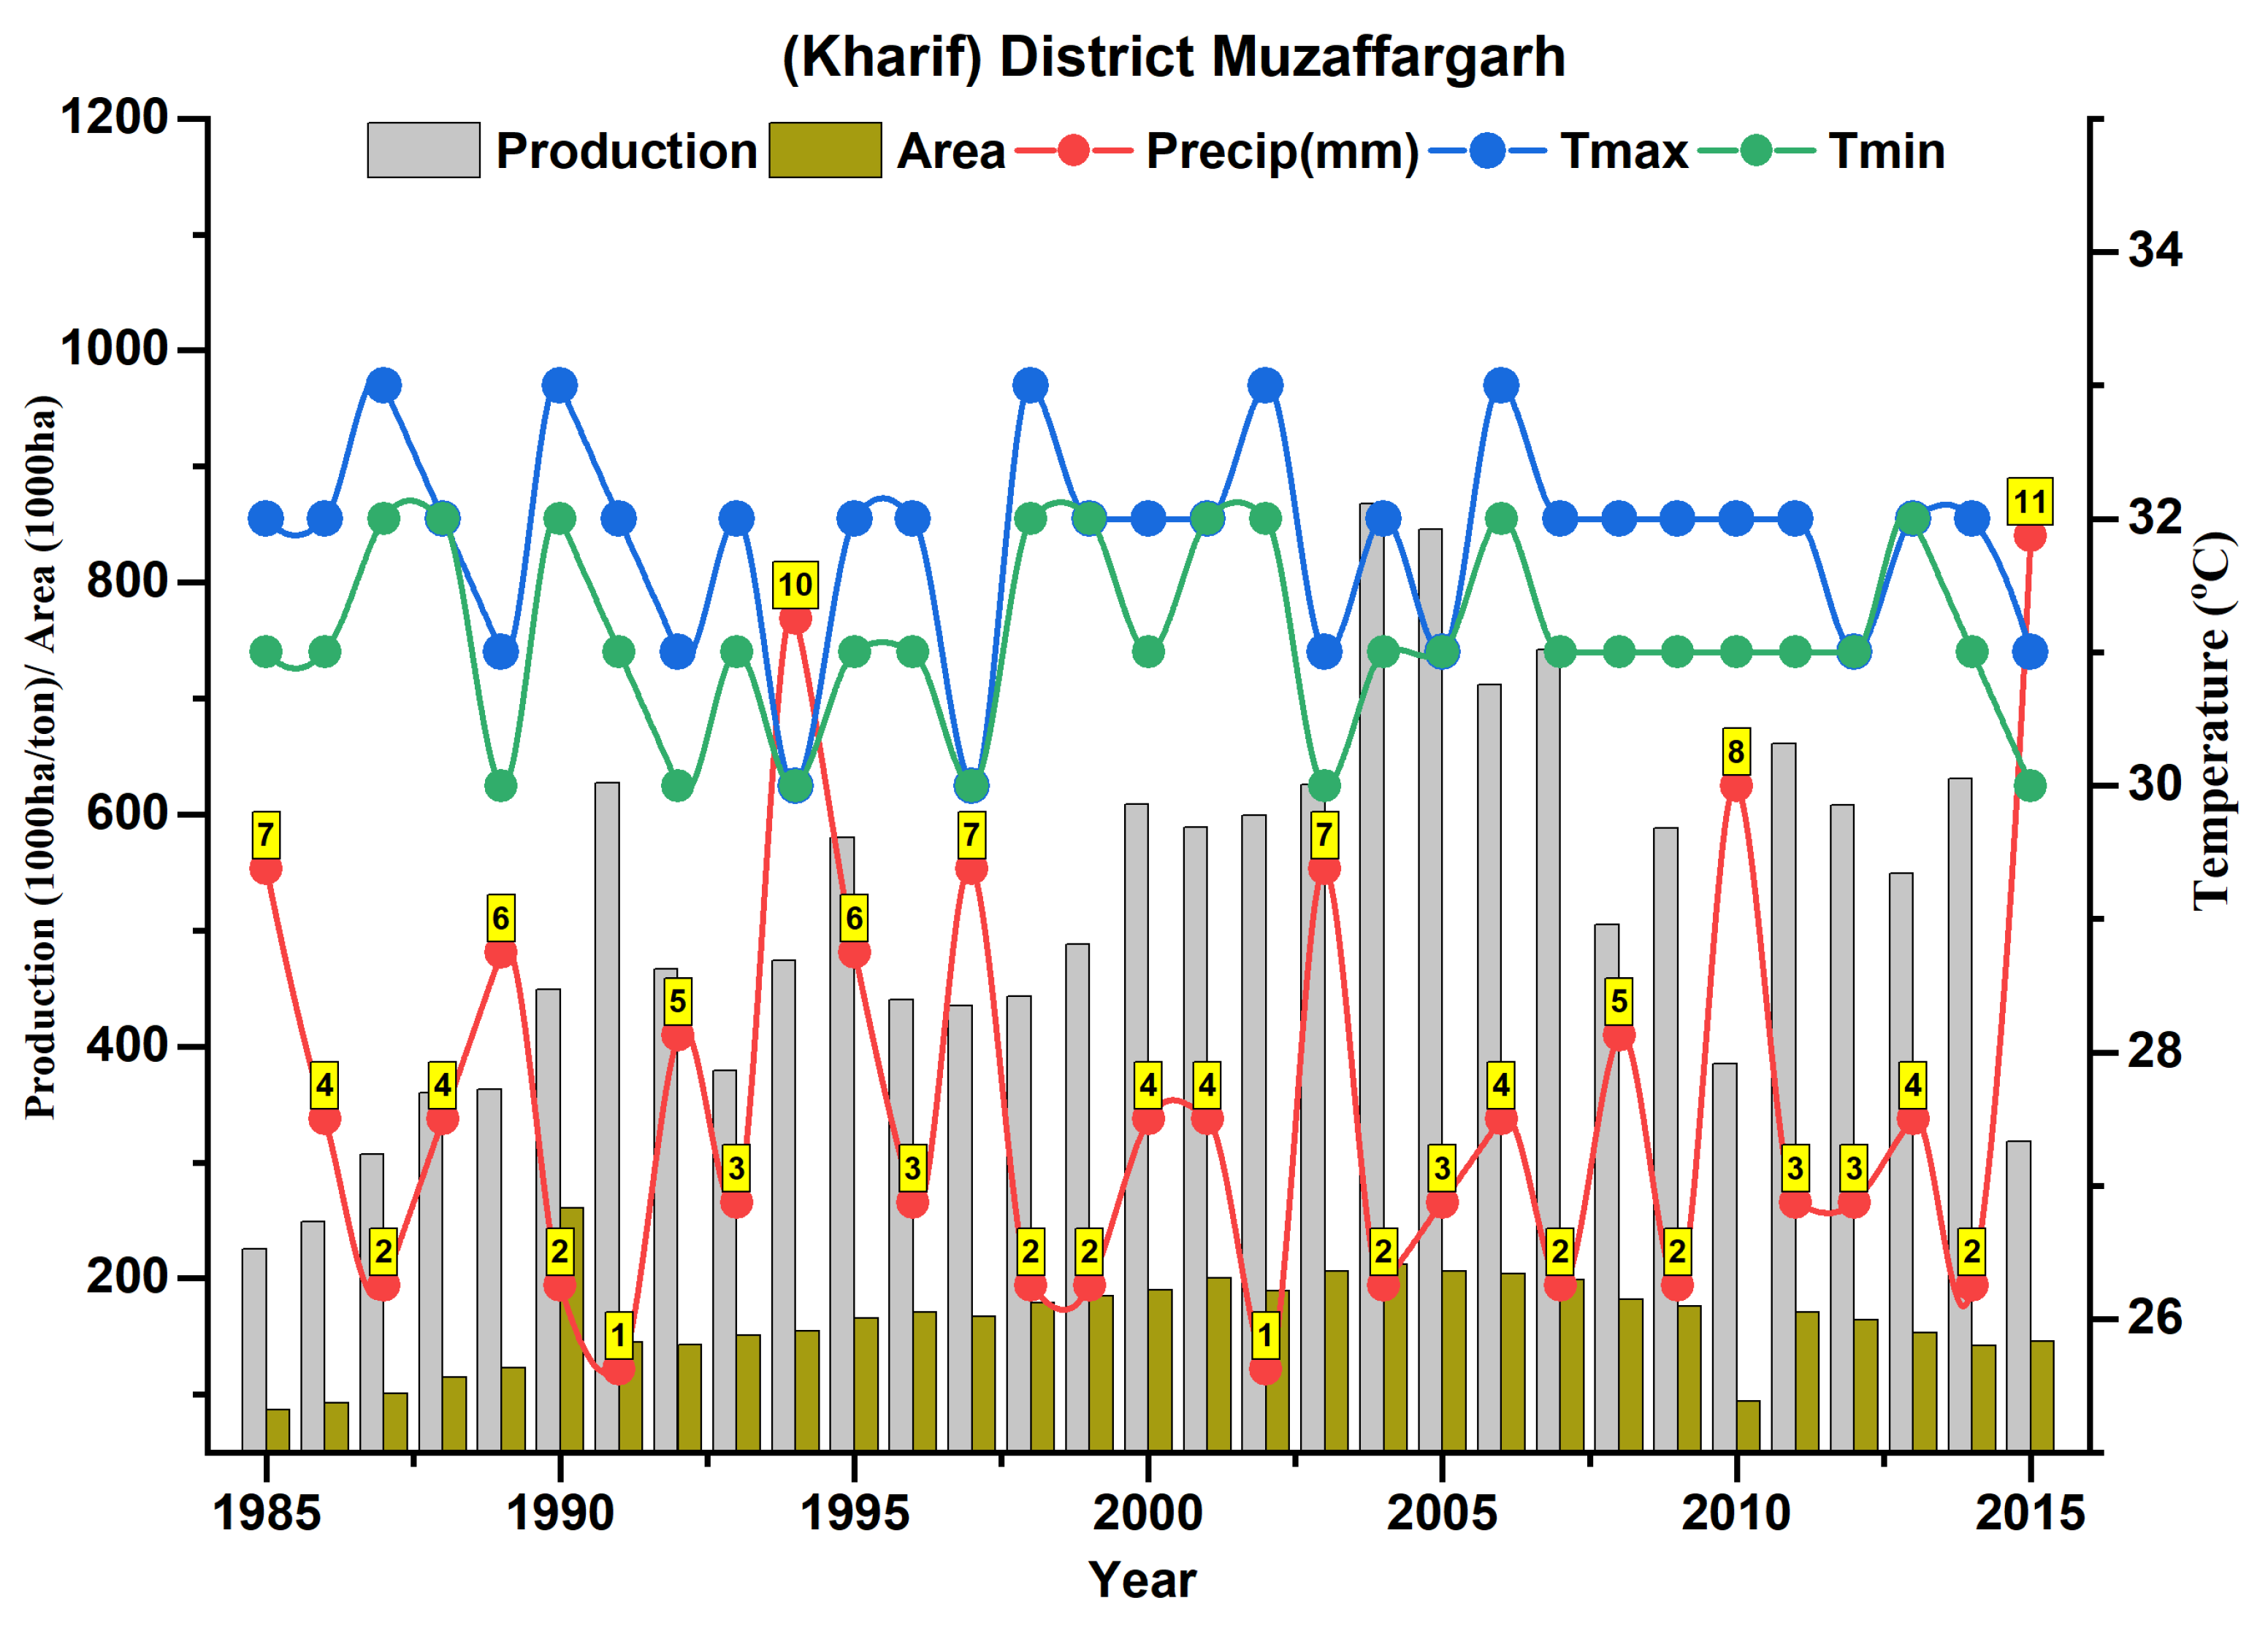
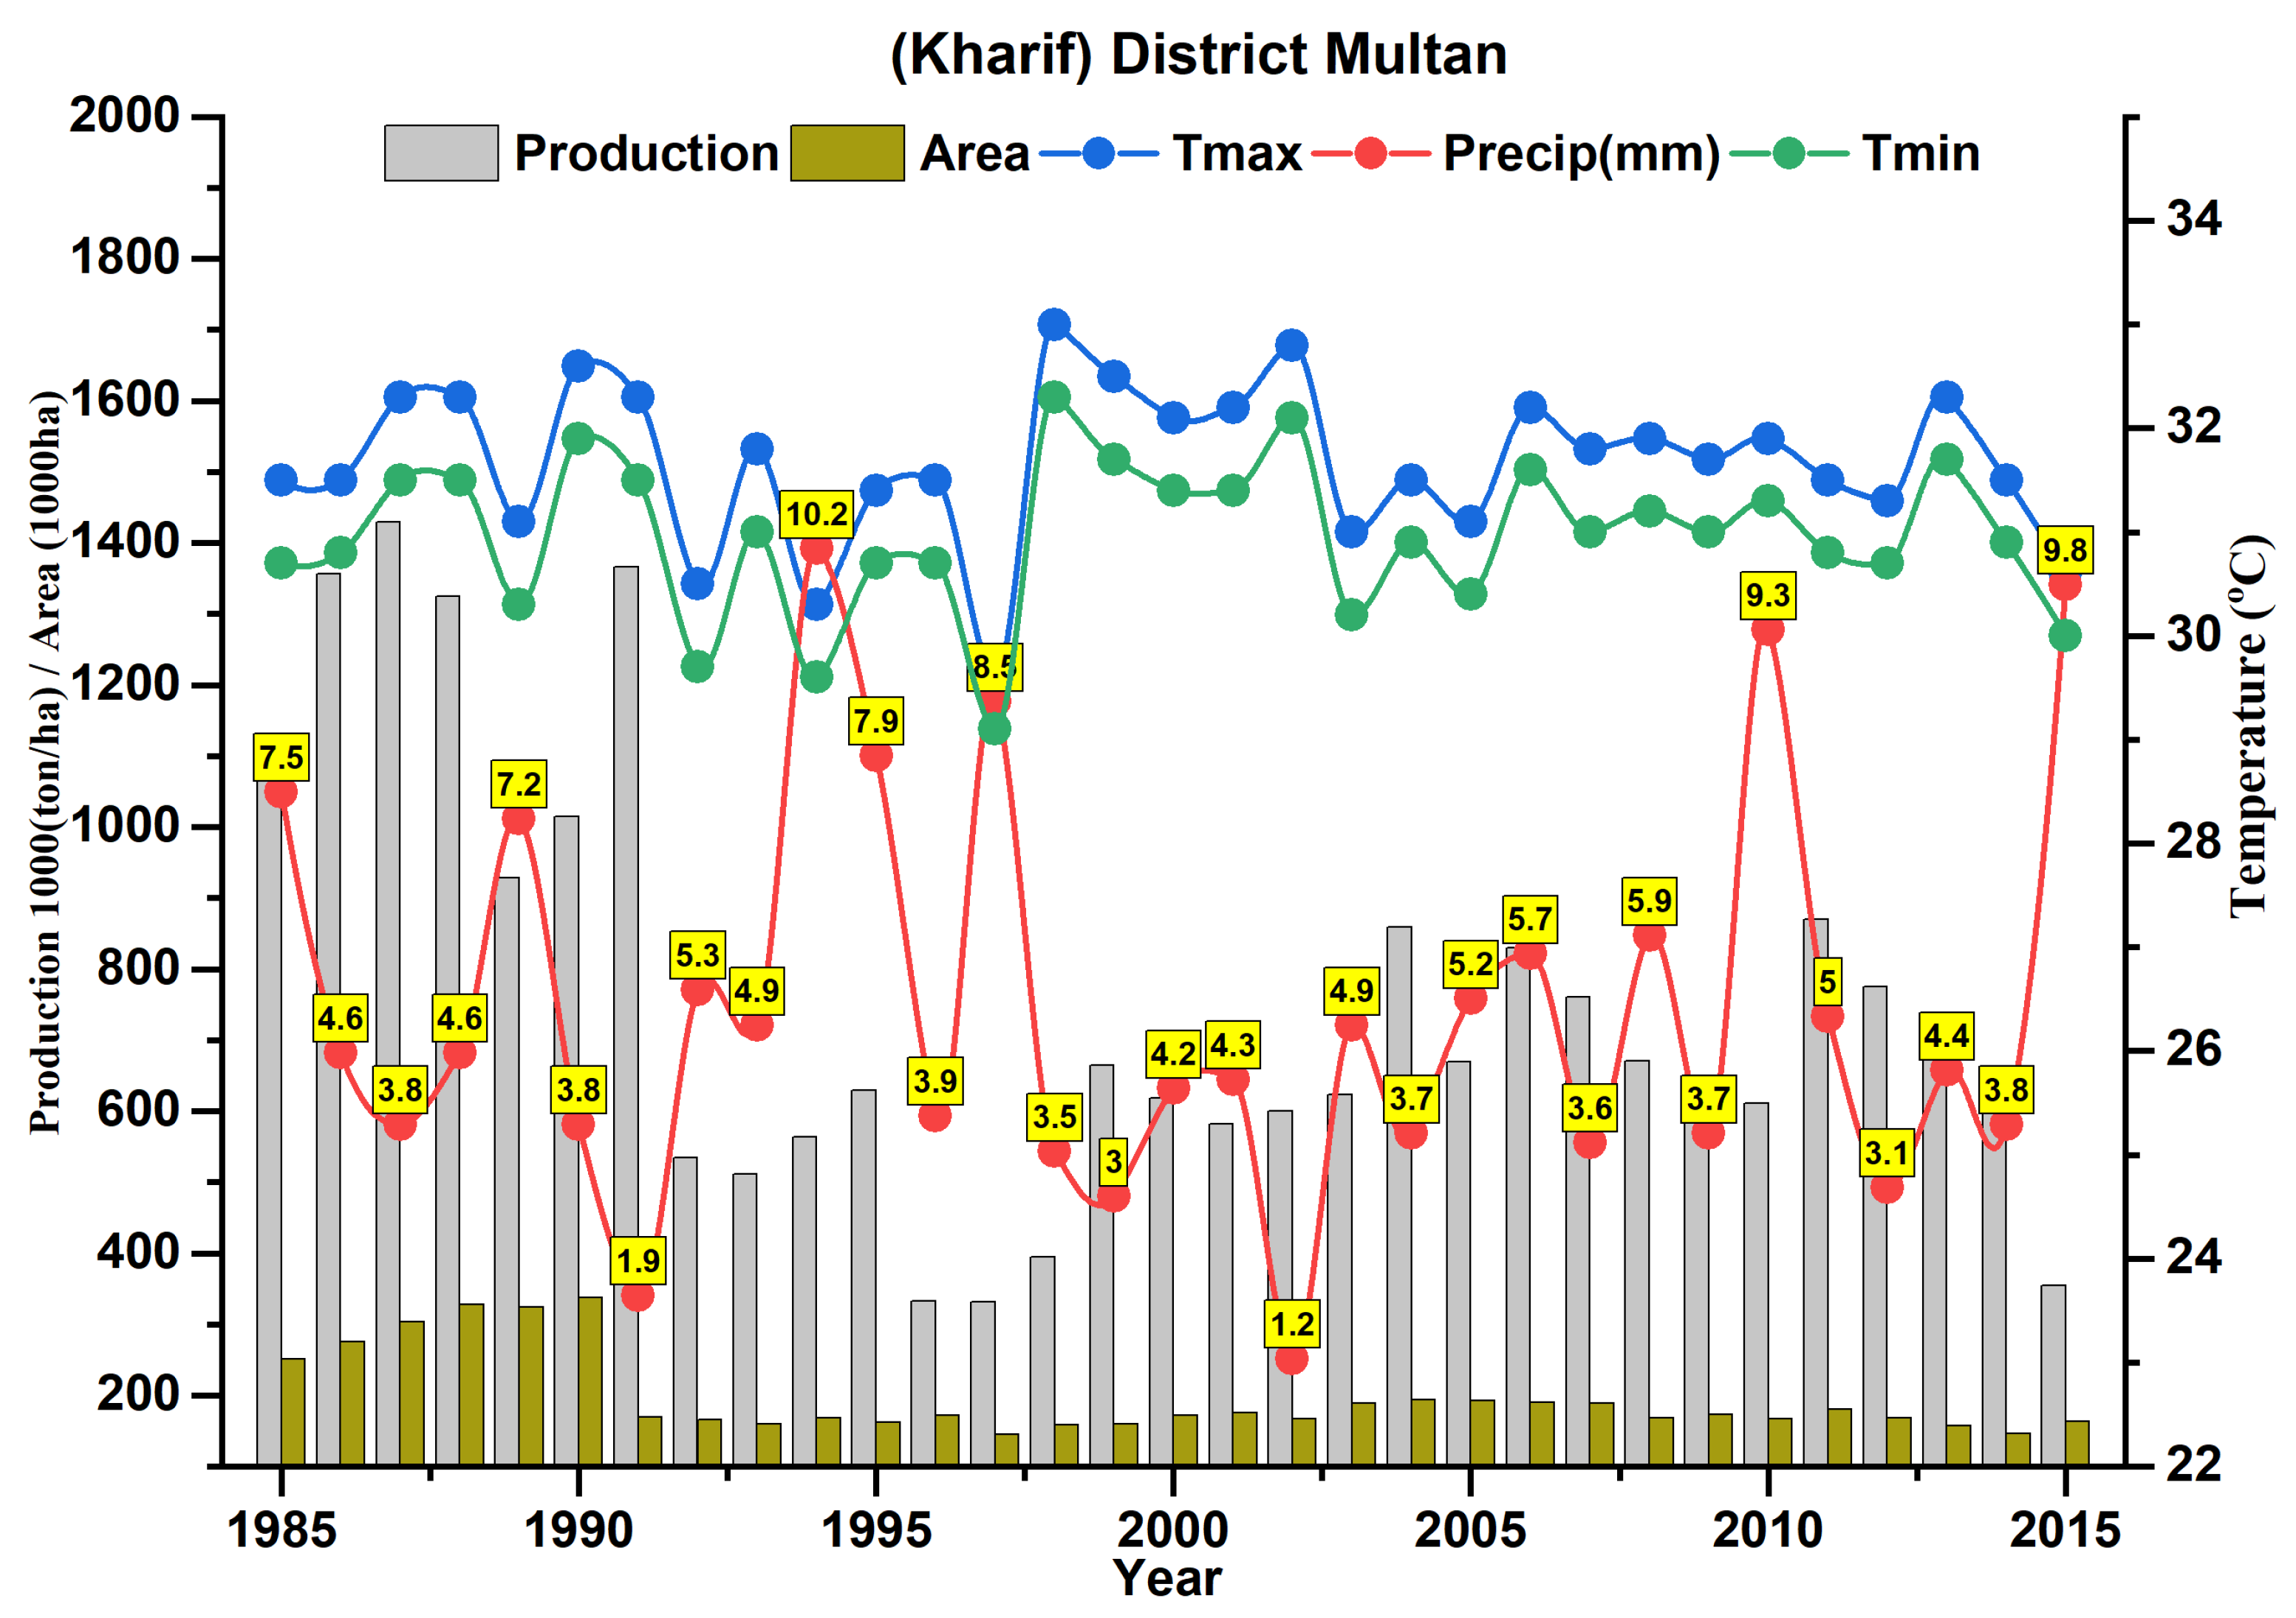
3.3. Seasonal Variations in Temperature, Precipitation and Crop Yield
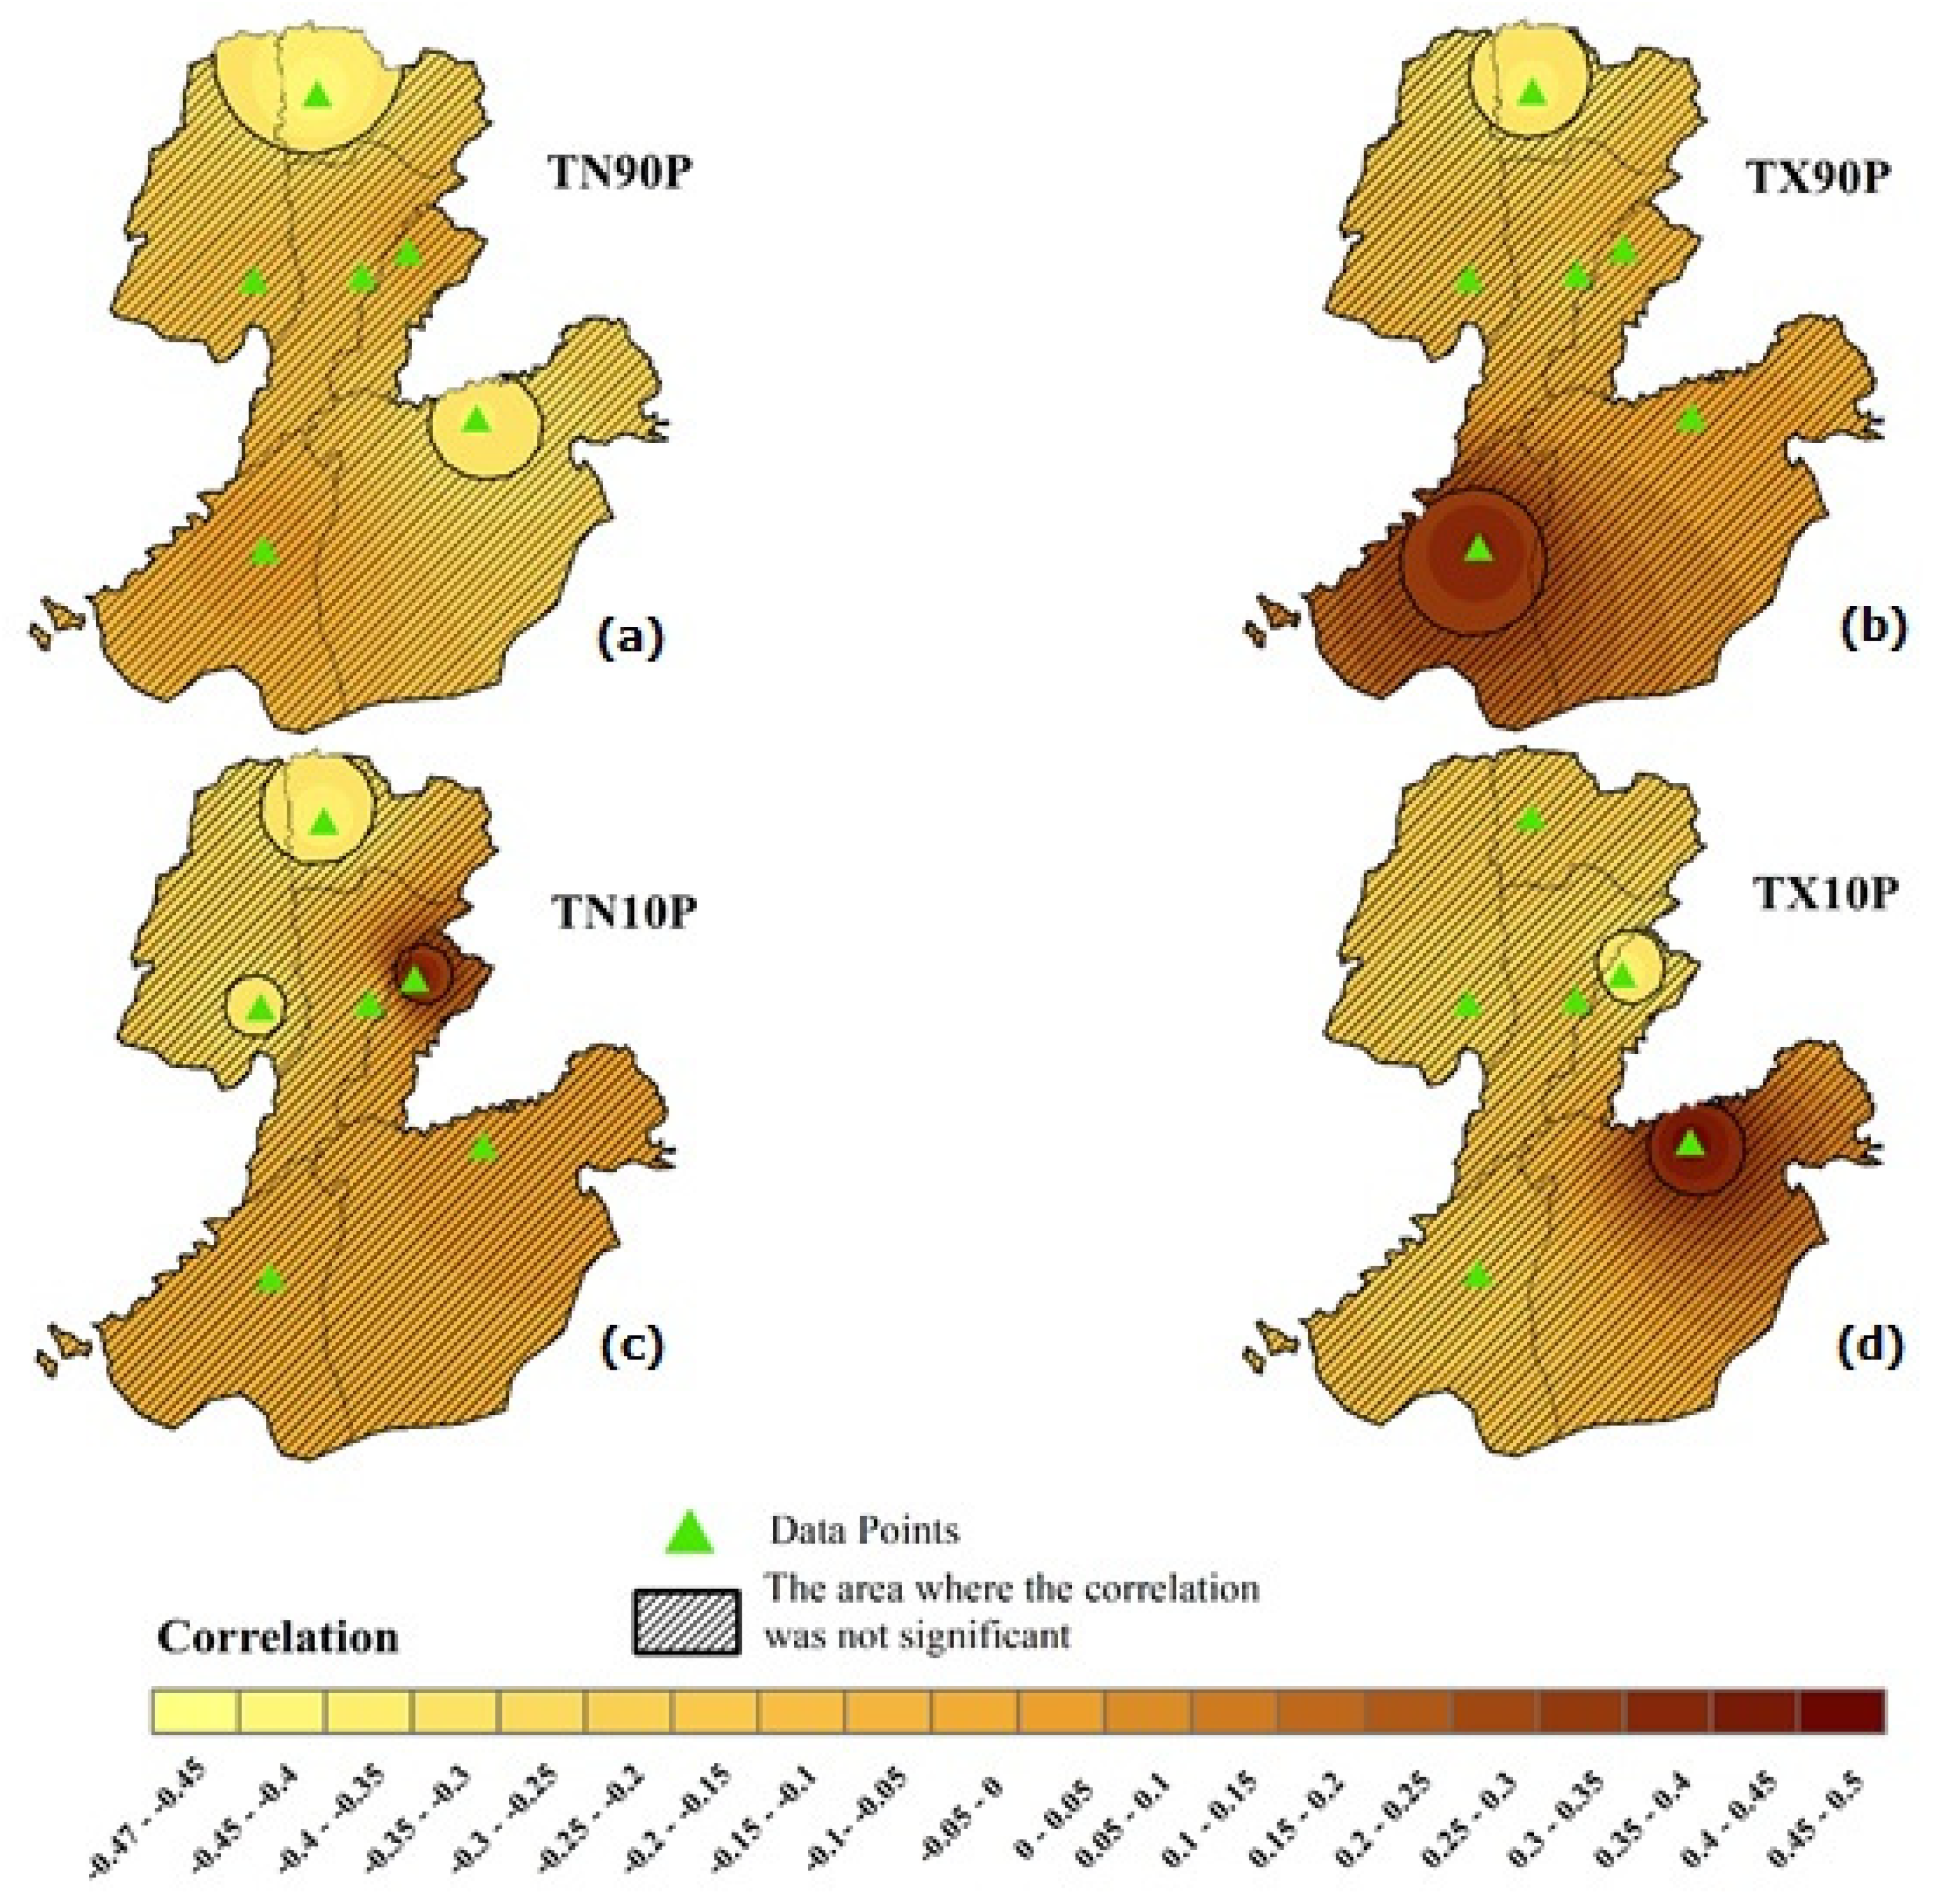
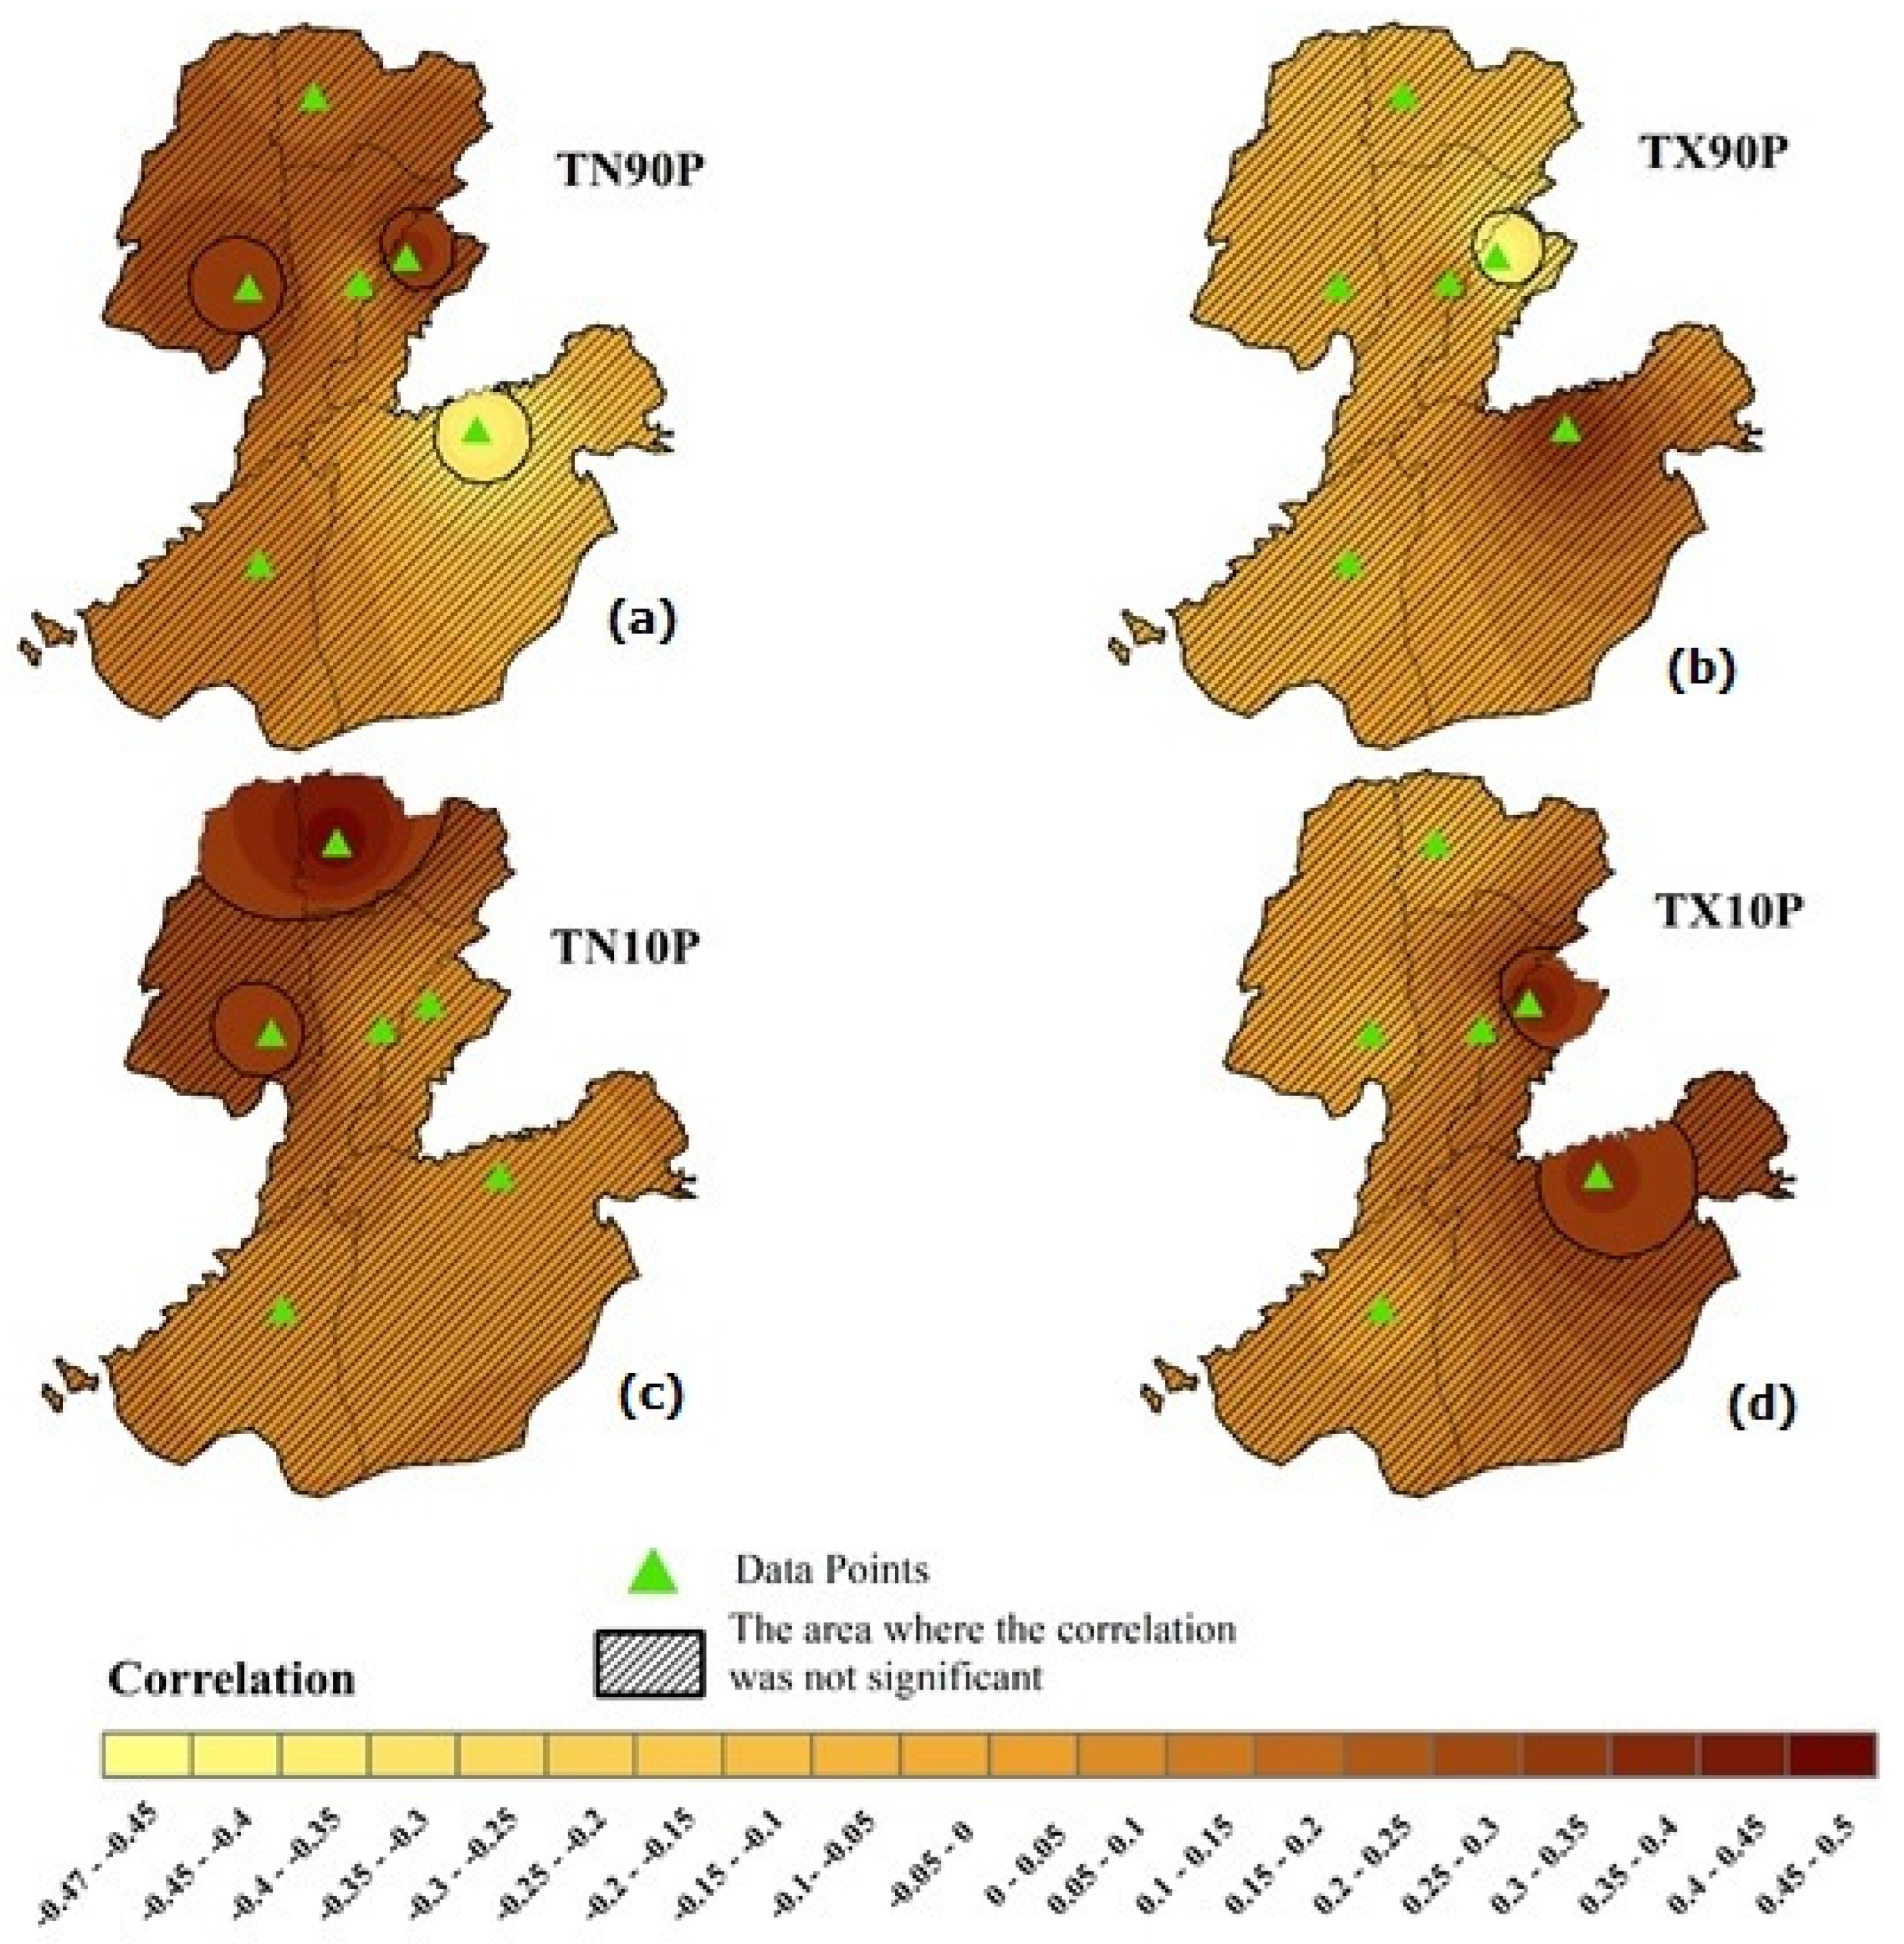
3.4. Impact of Climate Extremes on Crop Yield
3.4.1. Kharif Season
3.4.2. Rabi Season
4. Discussion
Limitations
5. Conclusions
Supplementary Materials
Author Contributions
Funding
Institutional Review Board Statement
Informed Consent Statement
Data Availability Statement
Acknowledgments
Conflicts of Interest
References
- Leng, G.; Huang, M. Crop yield response to climate change varies with crop spatial distribution pattern. Sci. Rep. 2017, 7, 1463. [Google Scholar] [CrossRef] [PubMed]
- Hatfield, J.L.; Boote, K.J.; Kimball, B.A.; Ziska, L.H.; Izaurralde, R.C.; Ort, D.; Thomson, A.M.; Wolfe, D. Climate impacts on agriculture: Implications for crop production. Agron. J. 2011, 103, 351–370. [Google Scholar] [CrossRef] [Green Version]
- Carty, T.; Growing, J. Disruption: Climate Change, Food, and the Fight Against Hunger; Oxfam International: Oxford, UK, 2013; Available online: http://publications/growing-disruption-climate-changefood-and-the-fight-againsthunger-301878 (accessed on 11 December 2021).
- Hossain, M.S.; Arshad, M.; Qian, L.; Kächele, H.; Khan, I.; Islam, D.I.; Mahboob, M.G. Climate change impacts on farmland value in Bangladesh. Ecol. Indic. 2020, 112, 106181. [Google Scholar] [CrossRef]
- Hijioka, Y.; Lin, E.; Pereira, J.J.; Corlett, R.T.; Cui, X.; Insarov, G.E.; Lasco, R.D.; Lindgren, E.; Surjan, A. Asia. In Climate Change 2014: Impacts, Adaptation, and Vulnerability. Part B: Regional Aspects. Contribution of Working Group II to the Fifth Assessment Report of the Intergovernmental Panel on Climate Change 2014; Barros, V.R., Field, C.B., Dokken, D.J., Mastrandrea, M.D., Mach, K.J., Bilir, T.E., Chatterjee, M., Ebi, K.L., Estrada, Y.O., Eds.; Cambridge University Press: Cambridge, UK; New York, NY, USA, 2014; pp. 1327–1370. [Google Scholar]
- Hossain, M.S.; Arshad, M.; Qian, L.; Zhao, M.; Mehmood, Y.; Kächele, H. Economic impact of climate change on crop farming in Bangladesh: An application of Ricardian method. Ecol. Econ. 2019, 164, 106354. [Google Scholar] [CrossRef]
- Hassan, M.; Du, P.; Mahmood, R.; Jia, S.; Iqbal, W. Stream-flow response to projected climate changes in the Northwestern upper Indus basin based on Regional Climate Model (RegCM4.3) simulations. J. Hydrol. Environ. Res. 2019, 27, 32–49. [Google Scholar] [CrossRef]
- Ahmed, M.N.; Schmitz, M. Economic assessment of the impact of climate change on the agriculture of Pakistan. Bus. Econ. Horiz. 2011, 4, 1–12. [Google Scholar] [CrossRef]
- Abid, M.; Scheffran, J.; Schneider, U.A.; Ashfaq., M. Farmers’ perceptions of and adaptation strategies to climate change and their determinants: The case of Punjab province, Pakistan. Earth Syst. Dyn. 2015, 6, 225–243. [Google Scholar] [CrossRef] [Green Version]
- Khan, M.A.; Tahir, A.; Khurshid, N.; Husnain, M.I.U.; Ahmed, M.; Boughanmi, H. Economic effects of climate change-induced loss of agricultural production by 2050: A case study of Pakistan. Sustainability 2020, 12, 1216. [Google Scholar] [CrossRef] [Green Version]
- Janjua, P.Z.; Samad, G.; Khan, N.U. Impact of climate change on wheat production: A case study of Pakistan. Pak. Dev. Rev. 2010, 49, 799–822. [Google Scholar] [CrossRef] [Green Version]
- Kreft, S.; Eckstein, D.; Junghans, L.; Kerestan, C.; Hagen, U. Global Climate Risk Index 2015 Who Suffers Most from Extreme Weather Events? Weather-Related Loss Events in 2013 and 1994 to 2013; Think Tank & Research; Germanwatch e.V.: Bonn, Germany, 2015. [Google Scholar]
- Abid, M.; Ashfaq, M.; Khalid, I.; Ishaq, U. An economic evaluation of impact of soil quality on Bt (Bacillus thuringiensis) cotton productivity. Soil. Environ. 2011, 30, 78–81. [Google Scholar]
- Farooq, M.K.; Kumar, S. An assessment of renewable energy potential for electricity generation in Pakistan. Sustain. Energy Rev. 2013, 20, 240–254. [Google Scholar] [CrossRef]
- Pakistan Bureau of Statistics. Report on Agricultural Census in Pakistan by Agricultural Statistics Directorate in PBS, under Federal Government of Pakistan. Available online: https://www.pbs.gov.pk/content/agriculture-census-wing (accessed on 11 November 2021).
- Rehman, A.; Jingdong, L.; Chandio, A.A.; Hussain, I.; Wagan, S.A.; Memon, Q.U.A. Economic perspectives of cotton crop in Pakistan: A time series analysis (1970–2015) (Part 1). J. Saudi Soc. Agric. Sci. 2019, 18, 49–54. [Google Scholar] [CrossRef]
- Usman, M. Contribution of Agriculture Sector in the GDP Growth Rate of Pakistan. J. Glob. Econ. 2016, 4, 184. [Google Scholar] [CrossRef] [Green Version]
- Zahid, M.; Rasul, G. Changing trends of thermal extremes in Pakistan. Clim. Chang. 2012, 113, 883–896. [Google Scholar] [CrossRef]
- Ikram, F.; Afzaal, M.; Bukhari, S.A.A.; Ahmed, B. Past and Future Trends in Frequency of Heavy Rainfall Events over Pakistan. Pak. J. Meteorol. 2016, 1224, 57–78. [Google Scholar]
- Abbas, F.; Rehman, I.; Adrees, M.; Ibrahim, M.; Saleem, F.; Ali, S.; Rizwan, M.; Salik, M.R. Prevailing trends of climatic extremes across Indus-Delta of Sindh-Pakistan. Theor. Appl. Climatol. 2018, 131, 1101–1117. [Google Scholar] [CrossRef]
- Raza, A.; Ahmad, M. Analysing the Impact of Climate Change on Cotton Productivity in Punjab and Sindh, Pakistan. MPRA Munich Pers. RePEc Arch. 2015, 72867, 821. [Google Scholar] [CrossRef]
- Ahmed, M.; Akram, M.N.; Asim, M.; Aslam, M.; Hassan, F.; Higgins, S.; O’Stöckle, S.; Hoogenboom, G. Calibration and validation of APSIM-Wheat and CERES-Wheat for spring wheat under rainfed conditions: Models evaluation and application. Comput. Electron. Agric. 2016, 123, 384–401. [Google Scholar] [CrossRef]
- Aslam, M. Agricultural Productivity Current Scenario, Constraints and Future Prospects in Pakistan. Sarhad J. Agric. 2016, 32, 289–303. [Google Scholar] [CrossRef]
- Ahmad, S.; Abbas, G.; Ahmed, M.; Fatima, Z.; Anjum, M.A.; Rasl, G.; Khan, M.A.; Hoogenboom, G. Climate warming and management impact on the change of phenology of the rice-wheat cropping system in Punjab, Pakistan. Field Crops Res. 2019, 230, 46–61. [Google Scholar] [CrossRef]
- Akbar, H.; Gheewala, S.H. Effect of climate change on cash crops yield in Pakistan. Arab. J. Geosci. 2020, 13, 390. [Google Scholar] [CrossRef]
- Ullah, I.; Ma, X.; Yin, J.; Asfaw, T.J.; Azam, K.; Syed, S.; Liu, M.; Arshad, M.; Shahzaman, M. Evaluating the meteorological drought characteristics over Pakistan using in situ observations and reanalysis products. Int. J. Climatol. 2021, 41, 4437–4459. [Google Scholar] [CrossRef]
- Powell, J.P.; Reinhard, S. Measuring the effects of extreme weather events on yields. Weather Clim. Extrem. 2015, 12, 69–79. [Google Scholar] [CrossRef] [Green Version]
- PDMA. Disaster Risk Management Plan Punjab. 2008. Available online: https://pdma.punjab.gov.pk/system/files/2.pdf (accessed on 11 November 2021).
- Ramon, J.; Lledó, L.; Torralba, V.; Soret, A.; Doblas-Reyes, F.J. What global reanalysis best represents near-surface winds? Q. J. R. Meteorol. Soc. 2019, 145, 3236–3251. [Google Scholar] [CrossRef] [Green Version]
- Bosilovich, M.G.; Lucchesi, R.; Suarez, M. MERRA-2: File Specification. 2016; Volume 9, p. 73. Available online: http://gmao.gsfc.nasa.gov/pubs/office_notes (accessed on 11 November 2021).
- Zhang, X.; Alexander, L.; Hegerl, G.C.; Jones, P.; Tank, A.K.; Peterson, T.C.; Trewin, B.; Zwiers, F.W. Indices for monitoring changes in extremes based on daily temperature and precipitation data. Rev. Clim. Change 2011, 2, 851–870. [Google Scholar] [CrossRef]
- Zhang, X.; Yang, F. RClimDex (1.0)—User Manual. Climate Research Branch Environment Canada Downsview, Ontario 2004. Available online: https://acmad.net/rcc/procedure/RClimDexUserManual.pdf (accessed on 11 November 2021).
- Alexander, L.V.; Zhang, X.; Peterson, T.C.; Caesar, J.; Gleason, B.; Klein Tank, A.M.G.; Haylock, M.; Collins, D.; Trewin, B.; Rahimzadeh, F.; et al. Global observed changes in daily climate extremes of temperature and precipitation. J. Geophys. Res. 2006, 111, D05109. [Google Scholar] [CrossRef] [Green Version]
- Hyndman, R.J.; Fan, Y. Sample Quantiles in Statistical Packages. Am. Stat. 1996, 50, 361–365. [Google Scholar] [CrossRef]
- Zhang, X.; Hegerl, G.; Zwiers, F.W.; Kenyon, J. Avoiding Inhomogeneity in Percentile-Based Indices of Temperature Extremes. J. Clim. 2005, 18, 1641–1651. [Google Scholar] [CrossRef] [Green Version]
- Mallick, J.; Talukdar, S.; Alsubih, M.; Salam, R.; Ahmed, M.; Ben Kahla, N. Analysing the trend of rainfall in Asir region of Saudi Arabia using the family of Mann-Kendall tests, innovative trend analysis, and detrended fluctuation analysis. Theor. Appl. Climatol. 2021, 143, 823–841. [Google Scholar] [CrossRef]
- Zhong, K.; Zheng, F.; Wu, H.; Qin, C.; Xu, X. Dynamic changes in temperature extremes and their association with atmospheric circulation patterns in the Songhua River Basin, China. Atmos. Res. 2017, 190, 77–88. [Google Scholar] [CrossRef]
- Liu, Z.-N.; Yu, X.-Y.; Jia, L.-F.; Wang, Y.-S.; Song, Y.-C.; Meng, H.-D. The influence of distance weight on the inverse distance weighted method for ore-grade estimation. Sci. Rep. 2021, 11, 2689. [Google Scholar] [CrossRef] [PubMed]
- Urraca, R.; Huld, T.; Gracia-Amillo, A.; Martínez-De-Pisón, F.; Kaspar, F.; Sanz-Garcia, A. Evaluation of global horizontal irradiance estimates from ERA5 and COSMO-REA6 reanalyses using ground and satellite-based data. Sol. Energy 2018, 164, 339–354. [Google Scholar] [CrossRef]
- Liu, Y.; Margulis, S.A. Deriving Bias and Uncertainty in MERRA-2 Snowfall Precipitation Over High Mountain Asia. Front. Earth Sci. 2019, 7, 280. [Google Scholar] [CrossRef] [Green Version]
- Choi, G.; Collins, D.; Ren, G.; Trewin, B.; Baldi, M.; Fukuda, Y.; Afzaal, M.; Pianmana, T.; Gomboluudev, P.; Huong, P.T.T.; et al. Changes in means and extreme events of temperature and precipitation in the Asia-Pacific Network region, 1955-2007. Int. J. Climatol. 2009, 29, 1906–1925. [Google Scholar] [CrossRef]
- Hake, K.; Silvertooth, J. Physiology today: Newsletter of the Cotton Physiology Education Program. Natl. Cotton Counc. 1990, 1, 1–4. Available online: https://www.cotton.org/tech/physiology/cpt/plantphysiology/upload/CPT-July90-REPOP.pdf (accessed on 29 December 2021).
- Klein Tank, A.M.G.; Können, G.P. Trends in Indices of Daily Temperature and Precipitation Extremes in Europe, 1946–1999. J. Clim. 2003, 16, 3665–3680. [Google Scholar] [CrossRef]
- Orlowsky, B.; Seneviratne, S.I. Global changes in extreme events: Regional and seasonal dimension. Clim. Change 2012, 110, 669–696. [Google Scholar] [CrossRef] [Green Version]
- Duan, Y.; Ma, Z.; Yang, Q. Characteristics of consecutive dry days variations in China. Theor. Appl. Climatol. 2017, 130, 701–709. [Google Scholar] [CrossRef] [Green Version]
- Reddy, V.R.; Reddy, K.R.; Baker, D.N. Temperature Effect on Growth and Development of Cotton During the Fruiting Period. Agron. J. 1991, 83, 211–217. [Google Scholar] [CrossRef]
- Vogel, M.M.; Zscheischler, J.; Wartenburger, R.; Dee, D.; Seneviratne, S.I. Concurrent 2018 hot extremes across Northern Hemisphere due to human induced climate change. Earth’s Future 2019, 7, 692–703. [Google Scholar] [CrossRef]
- Wright, D.L.; Matini, X.; Small, I. Cotton Growth and Development; SS-AGR-238; IFAS, Extrension, University of Florida: Gainesville, FL, USA, 2011; Available online: https://edis.ifas.ufl.edu/pdf/AG/AG23500.pdf (accessed on 29 December 2021).
- McClung, C.R.; Davis, S.J. Ambient thermometers in plants: From physiological outputs towards mechanisms of thermal sensing. Curr. Biol. 2010, 20, R1086–R1092. [Google Scholar] [CrossRef] [PubMed] [Green Version]
- Giménez, V.D.; Miralles, D.J.; García, G.A.; Serrago, R.A. Can crop management reduce the negative effects of warm nights on wheat yield? Field Crops Res. 2020, 261, 108010. [Google Scholar] [CrossRef]
- Akter, N.; Rafiqul Islam, M. Heat stress effects and management in wheat. A review. Agron. Sustain. Dev. 2017, 37, 37. [Google Scholar] [CrossRef]
- Hussain, A. The Green Revolution. In The Oxford Companion to Pakistani History; Oxford University Press: Karachi, Pakistan, 2012; pp. 1–5. [Google Scholar]


| SN | Name | Details | Data Source(s) | Spatial Resolution | Spatial Coverage | Temporal Resolution | Temporal Coverage | Reference/Website |
|---|---|---|---|---|---|---|---|---|
| 1 | ERA-5 | European Centre for Medium-Range Weather Forecasts Reanalysis 5 (ERA-5) High Resolution (HRES) | R | 0.25° × 0.25° | Global | Hourly | 1979–NRT4 | https://cds.climate.copernicus.eu/#!/search?text=ERA5&type=dataset (accessed on 15 May 2021) |
| 2 | MERRA- 2 | Modern-Era Retrospective analysis for Research and Applications 2 | G, S, R | ~0.5° | Global | Hourly | 1980–NRT3 | https://disc.gsfc.nasa.gov/datasets (accessed on 15 May 2021) |
| 3 | 3 stations’ data | Pakistan meteorological stations | G | Station base | Daily | 1985–2015 | Pakistan meteorological department | |
| 4 | Agricultural data | Agricultural yield and area | G | 6 districts | Seasonal | 1985–2015 | Bureau of Statistics Punjab |
| No. | Index | Description of Index | Definition | Unit |
|---|---|---|---|---|
| 1 | TN10p | Cool Nights | Percentage of days when TN < 10th percentile | Days |
| 2 | TX10p | Cool Days | Percentage of days when TX < 10th percentile | Days |
| 3 | TN90p | Warm Nights | Percentage of days when TN > 90th percentile | Days |
| 4 | TX90p | Warm Days | Percentage of days when TX > 90th percentile | Days |
| 5 | CDD | Consecutive Dry Days | Maximum number of consecutive days with RR < 1 mm | Days |
| 6 | CWD | Consecutive Wet Days | Maximum number of consecutive days with RR ≥ 1 mm | Days |
| 7 | PRCPTOT | Annual Total Wet-Day Precipitation | Annual total PRCP in wet days (RR ≥ 1 mm) | mm |
| No. | District | Reanalysis Products | Maximum Temperature (R2) | Minimum Temperature (R2) | Precipitation (R2) |
|---|---|---|---|---|---|
| 1 | Bahawalpur | ERA-5 | 0.97 | 0.94 | 0.68 |
| MERRA-2 | 0.96 | 0.93 | 0.24 | ||
| 2 | Multan | ERA-5 | 0.98 | 0.97 | 0.59 |
| MERRA-2 | 0.97 | 0.97 | 0.23 | ||
| 3 | Rahimyar Khan | ERA-5 | 0.96 | 0.95 | 0.47 |
| MERRA-2 | 0.94 | 0.97 | 0.38 |
| No. | Parameter | Season | Threshold Criteria of All Districts | |
|---|---|---|---|---|
| Upper Threshold | Lower Threshold | |||
| 1 | Daily Temperature Maximum | Kharif | ≥30 °C | ≤25 °C |
| Rabi | ≥25 °C | ≤20 °C | ||
| 2 | Daily Temperature Minimum | Kharif | ≥25 °C | ≤20 °C |
| Rabi | ≥20 °C | ≤15 °C | ||
| 3 | Daily Precipitation | Kharif | ≥10 mm | |
| Rabi | ≥10 mm | |||
Publisher’s Note: MDPI stays neutral with regard to jurisdictional claims in published maps and institutional affiliations. |
© 2022 by the authors. Licensee MDPI, Basel, Switzerland. This article is an open access article distributed under the terms and conditions of the Creative Commons Attribution (CC BY) license (https://creativecommons.org/licenses/by/4.0/).
Share and Cite
Ali, M.A.; Hassan, M.; Mehmood, M.; Kazmi, D.H.; Chishtie, F.A.; Shahid, I. The Potential Impact of Climate Extremes on Cotton and Wheat Crops in Southern Punjab, Pakistan. Sustainability 2022, 14, 1609. https://doi.org/10.3390/su14031609
Ali MA, Hassan M, Mehmood M, Kazmi DH, Chishtie FA, Shahid I. The Potential Impact of Climate Extremes on Cotton and Wheat Crops in Southern Punjab, Pakistan. Sustainability. 2022; 14(3):1609. https://doi.org/10.3390/su14031609
Chicago/Turabian StyleAli, Muhammad Asgher, Mujtaba Hassan, Mazhar Mehmood, Dildar Hussain Kazmi, Farrukh Ahmed Chishtie, and Imran Shahid. 2022. "The Potential Impact of Climate Extremes on Cotton and Wheat Crops in Southern Punjab, Pakistan" Sustainability 14, no. 3: 1609. https://doi.org/10.3390/su14031609