1. Introduction
This paper focuses on one of the busiest mixed-traffic environments: school areas. The main reason for this focus is the vulnerability of the traffic users in these areas, who are young children participating in mixed traffic. The main aim of the present paper was to develop a new methodology for the analysis of child safety in school zones using unmanned aerial vehicles (UAV) and image detection technology. Child traffic safety was evaluated using surrogate safety indicators extracted from drone footage. The practical contribution of this work is reflected in the ability of local communities to analyze traffic safety near schools, identify priorities, and implement measures to increase traffic safety.
School children are recognized as one of the groups most at risk of involvement in traffic accidents resulting in death or serious injury [
1]. In the developed world, pedestrian accidents remain one of the greatest causes of injury, disability, and death [
2]. In 2018, the European Transport Safety Council (ETSC) published a report on child deaths on European roads, showing that one-third of all children killed on European roads were pedestrians [
3]. For older child pedestrians, the majority of crashes occur during the daily commute to or from school and leisure activities [
4].
The road safety of school areas is a very topical but sensitive issue. The reasons for this are twofold: school areas contain many vulnerable youngsters and experience chaotic traffic situations. The ETSC pointed out that one reason for this is an increase in the number of parents driving children to school. Due to safety and security concerns, parents use their cars more often, which leads to a greater number of dangerous situations involving pedestrians and motorized vehicles [
3]. This danger creates a self-perpetuating cycle. To break that cycle, proper design is a major factor in ensuring a safe and secure environment for children.
It should also be noted that children have difficulty understanding and predicting the behavior of other road users and to adapt their own behavior accordingly. This is due to their still limited cognitive capacities and skills, as well as perceptual and motor abilities [
4].
To analyze potential conflict situations near school areas, unmanned aerial vehicle (UAV) technology was used as it can cover much larger areas than human observers or static video observations can. This UAV footage is capable of presenting an accurate overview of complex and difficult traffic situations. Because of their airborne position, drones can gather information on driving behaviors together with the actual positions of a variety of participants. To have a full overview of all traffic participants is unique in transportation and traffic research. Multiple traffic participants can be shown in one frame.
Although existing studies provide useful information regarding traffic safety data collection in school zones, they were carried out using other (older) technology and were mainly focused on automobiles. In this study, the trajectories of all traffic participants—including pedestrians and cyclists—were analyzed. However, it is very difficult to trace the movements of these groups with current measuring tools. To capture all traffic participants, drone footage can be considered as a very useful tool. Additionally, in contrast to car-centered research, the emphasis here is placed on active transportation (AT) users, who are statistically highly vulnerable in traffic. By using new technology to detect and analyze this traffic group, we can gain insight into these areas. Consequently, it will be possible to revise infrastructure and take appropriate safety measures.
In the next chapter a summary of recent and appropriate studies is presented focusing on school areas and unmanned aerial vehicle (UAV) technology. In the third section, the structure of the methodology (selection of school areas, UAV collection, data processing, data analysis) used during the research is explained. Subsequently, the results and discussion are presented.
2. Literature Review
2.1. School Areas
Deliberate design and planning of school areas are essential in order to provide a safe environment. However, street connectivity and traffic exposure vary from school to school [
5], and each situation should be afforded the necessary attention. Unfortunately, few studies investigate this field of research. One study which investigated engineering countermeasures to enhance traffic safety in school areas is worth mentioning [
6], while researchers have also provided new insights, with a focus on safe routes to school, and concluded that further research on the safety of young pedestrians is needed [
7]. Information on school-specific traffic situations can be valuable for transportation planners and decision-makers in terms of accident prevention and road engineering.
Connected street networks that provide safe routes to school and an appropriate school location and street design in school areas play key roles in enhancing road safety [
5]. Focus should be placed on the needs of active road users (pedestrians and cyclists), who are the most vulnerable participants. Designing accessible schools with low traffic exposure, sufficient sidewalks, and cycle paths can increase road safety.
In addition to design, the behavior of adolescents and children is also an important factor. The risk-taking behavior of adolescents on roads is demonstrated by a large amount of research [
5,
6,
7,
8]. Understanding the behavior of young people is vital in order to enhance road safety.
The concept of road safety can be distinguished as “perceived safety” and “substantive safety”. Dumbaugh and Frank (2007) [
7] defined the former as the subjective view of the likelihood of being involved in a crash, while the latter is a more objective view of the likelihood of being involved in a crash. Substantive safety can be determined using objective measuring tools, and the data are directly measurable and indisputable. On the other hand, perceived safety depends on the feelings people have when participating in traffic. Most parents are guided by perceived safety and base their decisions about their children’s active travel mode on this perception [
9]. It is the feeling they perceive when asked about road safety. Both approaches are valuable for traffic research. Even when hard data shows that a particular traffic situation is safe, the perception can be the complete opposite.
This study focuses on the area surrounding schools, which is dominated by young pedestrians arriving to and departing from school. The activity of child pedestrians is highest during the periods before and after school hours, which increases the potential risk that these vulnerable road users could be involved in a crash [
10]. Furthermore, this group has a higher injury risk as pedestrians than adults. According to European research, road traffic injuries are the leading cause of death and severe injuries among children aged 0–14 years, accounting for approximately 34% of injury-related deaths annually [
11]. Meyer et al. (2014) [
12] noted that the hazard perception skills of children are lower than those of adults. Children also have difficulty interpreting the distance between themselves and a car [
13]. Moreover, research shows that they are more tempted to act impulsively [
14].
Studies have shown that street crossings are among the most common road accident sites for children (Hamed, 2001 [
15]; Jäger et al., 2015 [
16]; Schwebel et al., 2012 [
17]). This is in line with the surprising conclusion of Poschadel [
18] that visible children crossing the street is one of the most frequent accident situations among children aged 14 years or younger.
2.2. UAV Technology
The collection of data using unmanned aerial vehicles (or the more commonly used term, drones) is relatively new in the research field of transportation sciences. It is a technology that uses remotely piloted unmanned aerial vehicles to gather traffic data.
In most studies, data are collected using one of three methods: manual counting, video observation, or automatic sensor technology. Traditionally, data collection is achieved by using stationary traffic surveillance devices [
19]. Manual counting is a conventional way of collecting data on pedestrians and is usually carried out in uncluttered areas. Sensor technology is well developed and is used for evaluation and planning. The most common method is induction loops to count the number of users, which gives an accurate total number of people or cars passing by but provides no further information. This automatic method is more accurate than manual counting because no human errors can occur. One significant advantage of video observations is the possibility of post-processing analysis, performed with software or by human observers.
Drone technology can be used to obtain data via video observation and is more advanced than stationary traffic surveillance devices. One of the main advantages of drones compared with conventional methods is the extent of the area covered [
20]. The altitude of the video camera provides footage that is impossible to capture with conventional technology and tools (e.g., static cameras, sensors, human observers, etc.) [
21]. Some researchers [
21,
22] claim that the abundance of data collected using this technology makes it a cost-efficient alternative. Implementing drone technology can reduce human effort, and a whole traffic situation can be visualized in a short period of time. Because of the airborne position, this technology does not affect the actual behaviors of traffic participants [
23]. Most conventional measurement and observation tools are at ground level and are visible to traffic participants, which can affect their behavior [
24]. Drone technology can overcome this shortcoming, with little or no impact on people’s behavior. Despite its unique features and advantages, this technology also has some limitations. The flight duration remains an important issue, ranging from 20 to 30 min [
22]. Another key factor is the weather conditions during the flight, which can influence the quality of the footage [
21]. Additionally, technical, safety, privacy, and security issues need to be taken into consideration.
Table 1 shows an overview of the strengths and limitations of drone technology in traffic data collection.
Some researchers have reported on the use of drone data in terms of calibration methodology [
25], analysis of interchange merging areas [
26], and examination of roundabouts [
24]. These studies form a good foundation for the implementation of the technology; however, they were are all car-centered studies, and little research has been devoted to pedestrians as traffic participants.
As outlined in [
21], the volume of current data on pedestrians and cyclists is very limited. One of the main reasons is that collecting reliable pedestrian data is often labor-intensive and time-consuming [
28]. Vehicular tracking is a more mature application [
29]. The majority of research on drone data collection has been focused on vehicle trajectories, traffic evaluation, and driving behavior [
24]. Nevertheless, its unique features make this technology a promising alternative tool for mapping the trajectories of pedestrians and cyclists. It can also be used to detect conflicts between these two groups. Airborne cameras can capture complex traffic situations, including pedestrians and cyclists.
Much research on data acquisition using drones emphasizes the accuracy of the system [
23]. Because of their size, pedestrians and cyclists are more difficult to capture on drone footage. Therefore, an important requirement is a high-resolution camera, which provides accurate footage and, consequently, a greater depth of analysis [
22]. Furthermore, the trajectories of pedestrians and cyclists are less constrained than those of cars [
30]. Because of these groups’ constant changes in orientation and appearance, detecting and tracking them is a difficult task [
31]. Zaki and Sayed (2014) [
28] stated that the “particularities of pedestrians, such as varying appearance, deformation, and occlusion, impose detection and tracking challenges compared with those of vehicles.” Most conventional methods fall short in detecting and tracking this group. The airborne position of the drone can offset these shortcomings.
Drone technology was described in [
32] as one of the most attractive methods for performing difficult tasks and providing more precise traffic parameters than other observation techniques. Nevertheless, data processing remains a difficult procedure, such that it would not be possible to run a full analysis on the data obtained from drones. Use of this technology requires post-data processing, commonly performed with either image detection technologies or human observers [
21]. Previous studies have investigated data processing methods for footage calibration [
25] as well as a procedure to detect cars in drone footage [
23].
Drone footage can be used to detect conflicts (also termed near-collisions) between traffic participants [
21]. Conflict analysis for safety diagnosis is gaining acceptance as a surrogate for collision data [
30] and can contribute to reliable road safety measures [
30] as traffic conflicts occur more often than collisions. Studying these near-collisions could help road designers, traffic planners, and transport researchers to improve road safety.
3. Methodology
In this section, the methodology for determining traffic safety near school areas is presented through several steps: (i) selection of school areas, (ii) UAV data collection, (iii) data processing, (iv) data analysis, and (v) surrogate safety indicators.
3.1. Selection of School Areas
The selection of primary school areas was made based on five main criteria: the presence of traffic flows, field-observed increased vehicle speeds, visibility, the availability of an appropriate landing and take-off location, and the presence of pedestrian crossings. The selection procedure was as follows:
Presence of traffic: Vehicle traffic volume is required in the vicinity of the school. These roads need to be used by traffic participants before, during, and after school hours. Schools in isolated areas with no traffic are not good examples for testing. It is difficult to determine the exact number of vehicles passing by school areas needed for testing, as even one speeding vehicle can be fatal. School areas with adjacent connecting roads and heavy traffic are more desirable.
Field-observed increased vehicle speeds: Although vehicle speeds will be determined from drone footage, direct field observations can determine schools near which drivers achieve higher speed values, making them riskier in terms of safety.
Visibility: Availability of an area with few visual obstructions (e.g., trees covering the road infrastructure). A clear aerial overview of the school area and adjacent roads is crucial for drone research. The most prevalent obstruction objects are trees and tall buildings. In this study, several schools were excluded because of the presence of these obstructions as they hindered the view of the traffic in the surrounding area. Weather conditions are also an essential factor for the visibility of the school area. In a densely built-up area, mutual visibility has an influential role in the occurrence of accidents and should also be considered. In proposing countermeasures to improve traffic safety, acceptable visibility must be ensured.
Landing and take-off position: Availability of an appropriate location near the intended airborne position for landing and take-off (anonymous, open space). The use of drone technology necessitates some practical requirements, like all other data collection methods. In the search for an appropriate research area, a landing and take-off zone is essential. The zone needs to be close to the airborne position of the investigated area because of the limited flight time. The drone needs to be in its aerial position as quickly as possible.
Presence of pedestrian crossings: Availability of an area near the school building with pedestrian crossings. In this research, emphasis was placed on pedestrians’ crossing behavior. Therefore, the presence of pedestrian crossings was a crucial element during the selection procedure.
3.2. UAV Data Collection
An important step in researching road safety in school areas is data collection. Using this new methodology, a school area in Zagreb was investigated. The drone flight was performed during the morning rush hour on Tuesday, 24 November 2020, when busy traffic flows arose around the school building. After analyzing several schools in the city of Zagreb, the primary school Jure Kaštelan was chosen as it fulfilled all of the previously defined criteria. Traffic volume in the morning peak hour on adjacent roads was almost 1000 vehicles/h. Later analyses of drone footage revealed that, on roads adjacent to the school entrance: 28.57% of drivers were speeding (40 km/h is the speed limit); 91.67% were driving above 30 km/h; and 100% were driving above 20 km/h. The criteria of a clear aerial overview of the school area and adjacent roads was met and there were numerous options for landing and take-off areas where the drone pilot could be hidden from traffic users. There were five pedestrian crossings in the surrounding area.
Soon after the date of video recording, schools were closed due to the COVID-19 pandemic and further video recording was not possible. Furthermore, due to the impact of the COVID-19 pandemic and the lack of face-to-face teaching in schools, it was not possible to conduct research in multiple schools. However, this was not the goal of this study, which was to demonstrate through the example of one school how it is possible to evaluate traffic safety in school zones with the proposed methodology based on UAV, video data processing, and surrogate safety indicators. The defined methodology is applicable to any school that meets the previously established criteria.
In contrast to previous drone research, this study aimed to track and investigate all participants, including pedestrians. Before school started, the traffic situation was recorded for 15 min—from 7:45 to 8:00 a.m.—providing a unique general overview of traffic flows. Detailed flight planning began a week before the flight, when it was necessary to request a flight permit from Croatian air control while observing the weather forecast and determining a safe place for the drone to take-off and land. The drone hovered and maintained a constant altitude of 120 m with the camera set at 45° to detect pedestrians and cyclists and capture all road approaches successfully. The flight was conducted using a DJI Mini 2, with a 4K camera and a max battery life of 31 min to provide stable and high-resolution footage.
3.3. Data Processing
Given that video processing of pedestrian movement is still demanding, the collected data were processed using the DataFromSky (DFS) platform [
33]. Instead of manual counting, DFS uses artificial intelligence (AI). During this procedure, the software detects all participants (i.e., cars, pedestrians, and cyclists), calibrates the footage, and connects information to each participant (i.e., their speed, trajectory, acceleration, and location). The higher the resolution of the camera, the better the processed footage and the greater the probability of calculating precise values of traffic parameters.
Figure 1 presents the trajectories of all traffic participants after data processing using DataFromSky software. It can be seen that the majority of pedestrians used pedestrians crossings and minor deviations are visible due to illegal crossings by cyclists and pedestrians.
3.4. Data Analysis
Not many studies have focused on conflicts between AT users and cars. The majority of research addresses the results of car–car conflicts. However, AT users are more vulnerable, and the impact of collisions is more severe. Using drone data, this research gap can be filled. The software used for data analysis provides tools to detect near-crash events and traffic conflicts that statistically occur more frequently than real traffic accidents. This analysis can shed light on the occurrence of such conflicts. Furthermore, it is possible to identify the situation and the exact location.
The DataFromSky Viewer software offers three traffic conflict types: time-to-collision, post-encroachment time, and heavy braking. These all represent some form of dangerous behavior between two traffic participants [
33]. Subsequent analysis took a closer look at the conflicts between car drivers and AT users (pedestrians and cyclists). The obtained database was analyzed using SAS and R statistical tools.
3.5. Surrogate Safety Indicators
In most studies, data from traffic accidents are used to analyze road safety. These data are often detailed, but usually scarce. Moreover, such accident data are insufficient to investigate pedestrian–vehicle interactions because the quantity and quality are too limited.
Automated methods for surrogate safety analysis are experiencing increasing interest in the literature [
32,
33,
34] as they provide insight into the failure mechanisms that can lead to collisions. Surrogate indicators are suitable for evaluating the risk of rear-end collisions as they incorporate both spatial proximity and speed [
35]. Researchers argue that surrogate indicators, on one hand, indicate the possible causality of a collision. On the other hand, they can be considered as proactive tools for assessing safety before an actual accident occurs.
Automated analyses can detect conflicts and accurately calculate various objective conflict indicators, such as time-to-collision (TTC), post-encroachment time (PET), and heavy braking. These indicators can reflect the severity of a traffic conflict objectively and quantitatively [
6]. The DataFromSky Viewer offers these three traffic conflict indicators, which describe dangerous behaviors between two road users [
33]. TTC calculates in how many seconds the vehicles would collide if they continued to move at a constant speed and in a constant direction. Time-to-collision can be calculated with Equation (1) presented below [
36].
where
denotes the speed,
the position, and
the vehicle length [
36]. From Equation (1),
is only valid when the speed of the following vehicle is greater than that of the leading vehicle [
36].
Post-encroachment time is defined as the time between one vehicle leaving and another vehicle entering a collision zone (see
Figure 2). PET is considered a suitable safety indicator for predicting potential collisions at pedestrian crossings [
37]. Post-encroachment time can be calculated by [
38]:
Heavy braking is defined as the detection of rapid deceleration and is used to detect collisions or dangerous situations. Heavy braking can be calculated by:
where
and
are the tangential and normal components of deceleration, and
and
are the unit tangent and unit normal for the position function, respectively [
39].
The scheme of the proposed methodology for evaluating child traffic safety near primary school areas using UAVs is presented in
Figure 3.
4. Results
Based on the three safety indicators extracted from the DataFromSky Viewer program, a detailed analysis of potential conflicts around the primary school was made. The trajectories of passenger cars and AT users were extracted, and conflicts were identified. Near collisions between vehicles and pedestrians in DataFromSky were detected using TTC in case vehicles were moving at a constant speed and in a constant direction at the moment of analysis. A limit for time-to-collision of 2 s from the potential collision was established. PET was defined as the time difference between when a pedestrian leaves the conflict zone and a vehicle enters it. This threshold was set at 1.5 s. Heavy braking was defined as deceleration greater than −2.5 ms
−2. All of the DataFromSky data were collected in a database which was further analyzed using statistical tools. Based on the three safety indicators, and by reviewing the footage, a total of 43 potential conflicts were identified (14 time-to-collision, 6 heavy braking, and 23 post-encroachment time). Based on a literature review and a review of videos, the threshold values of these safety indicators were determined and are described in the following sections. All determined potential conflicts from DataFromSky Viewer were observed and analyzed from drone footage following the time steps and their location on the network. All potential conflicts marked by three surrogate safety indicators were confirmed as risky via video observation.
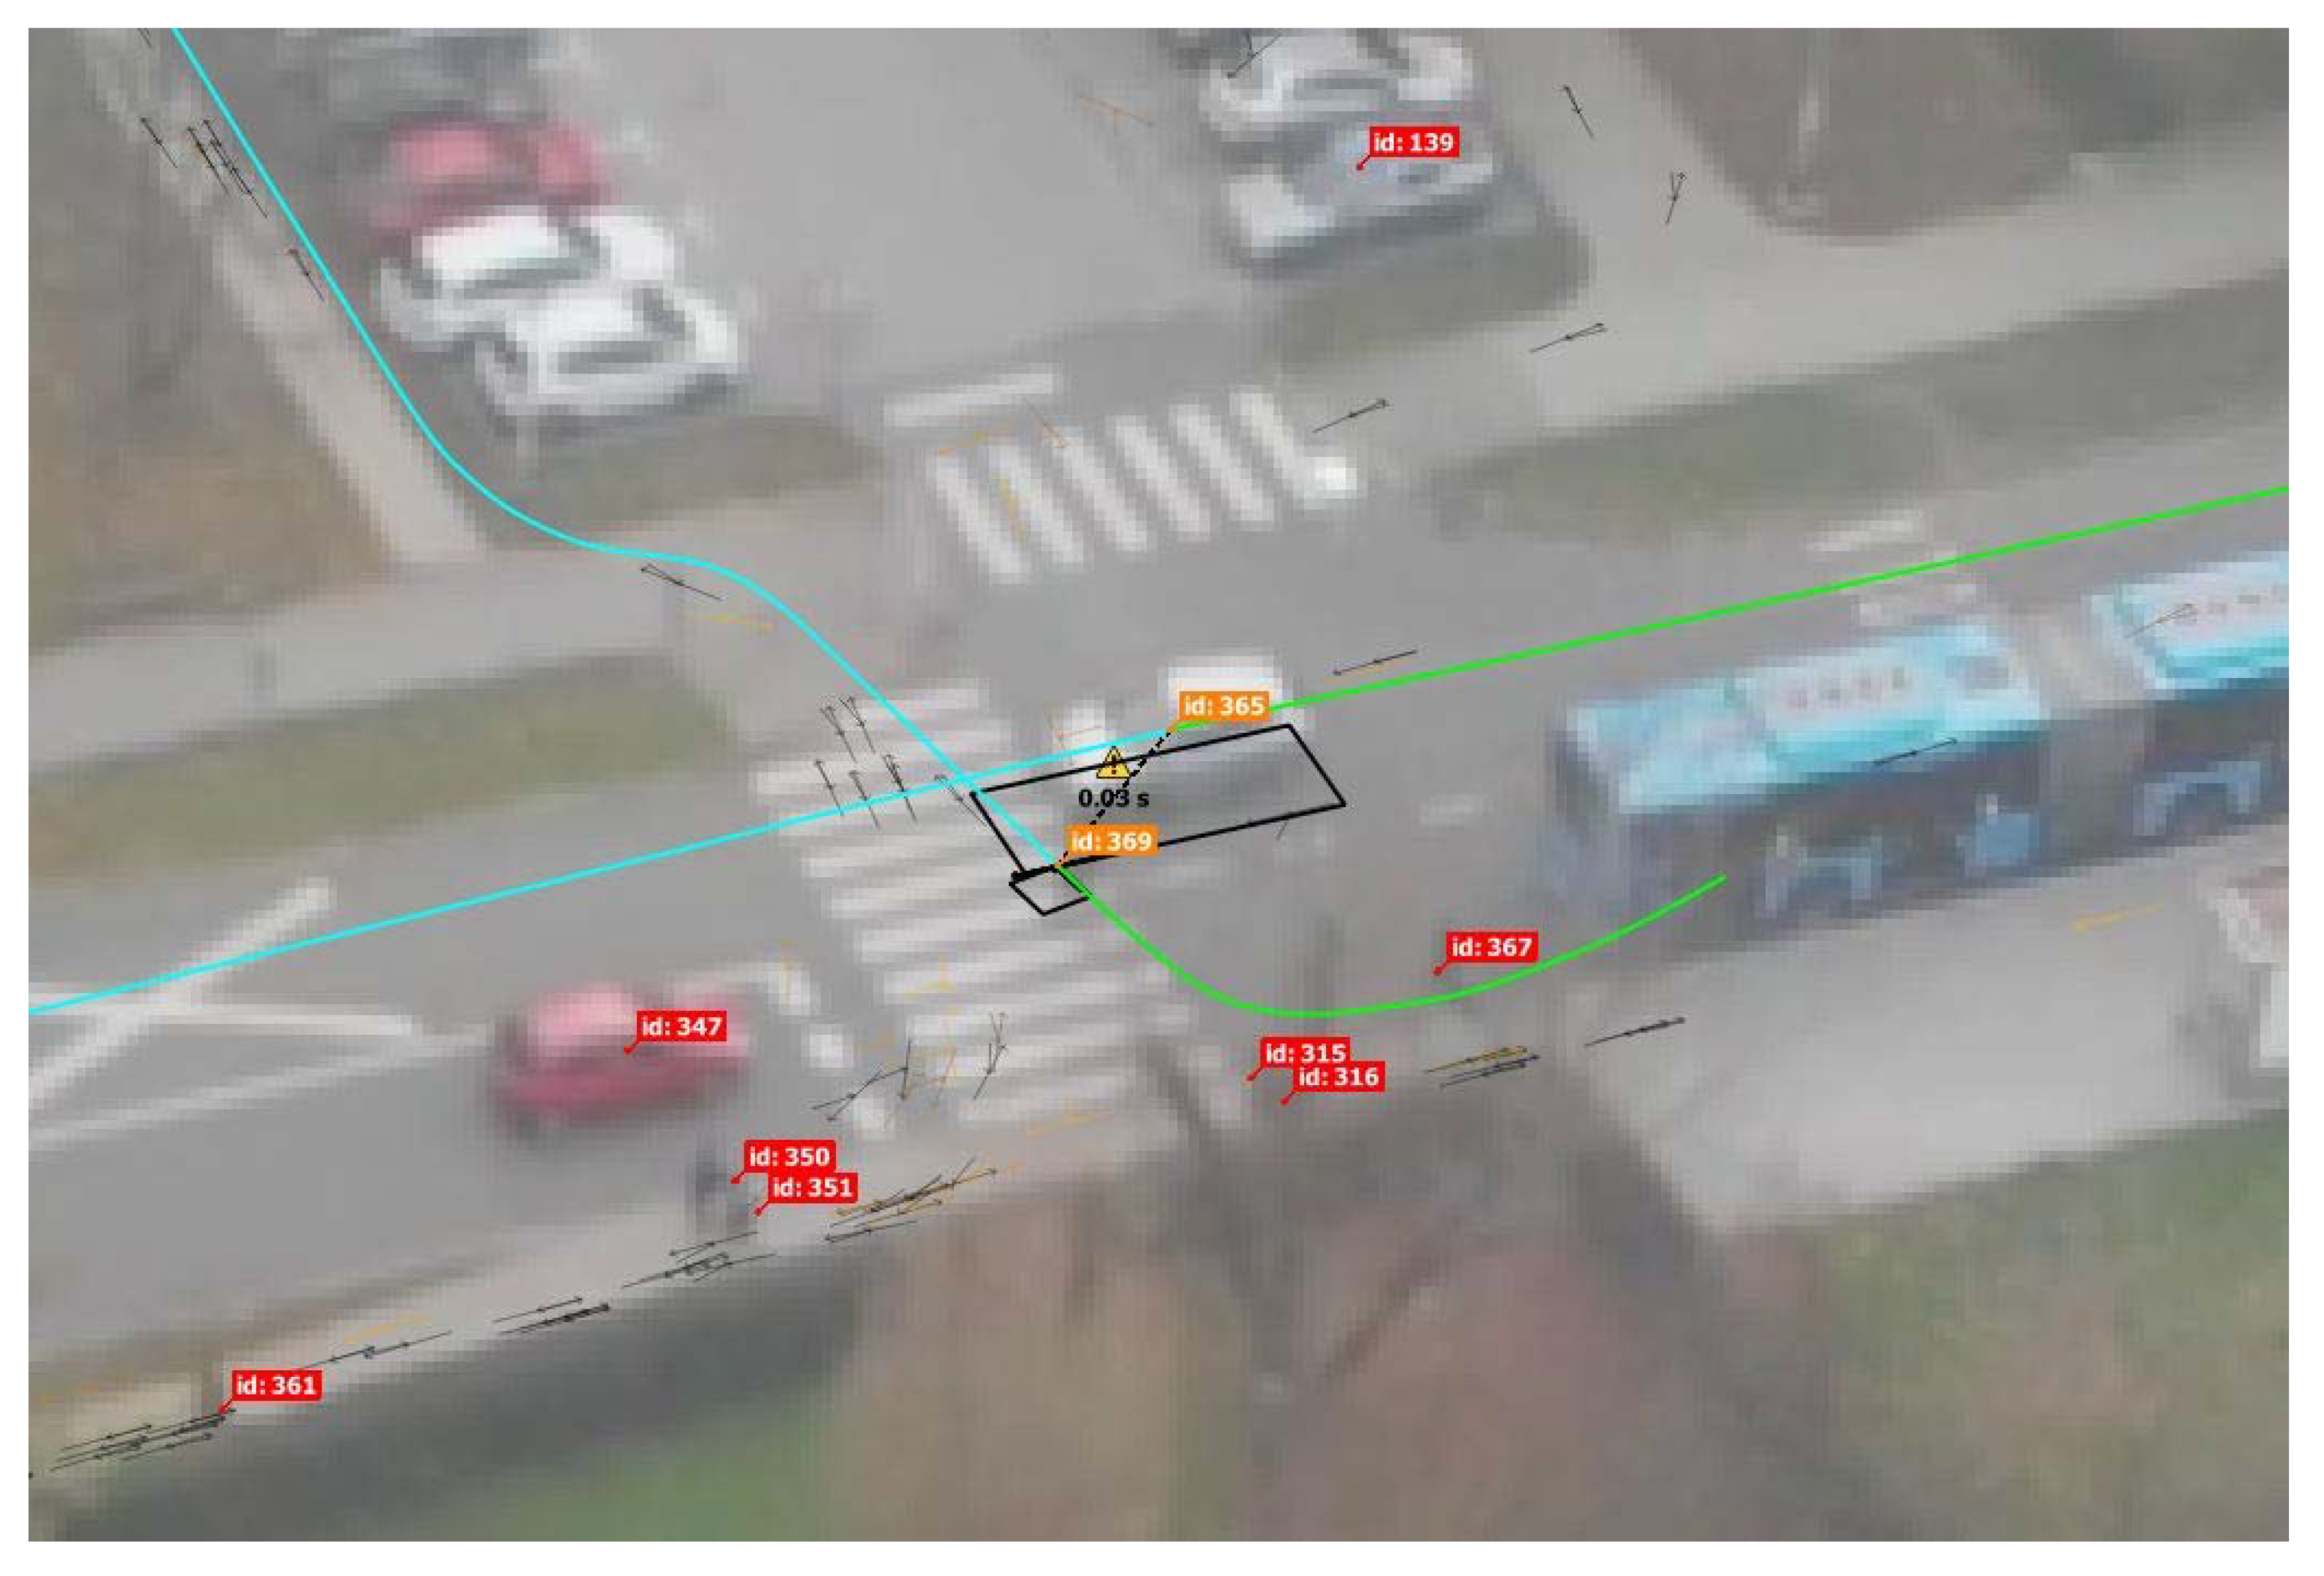
Figure 4 shows the setup of the investigated school area with the locations of all potential conflicts. Almost all potential conflicts were identified as having occurred on pedestrian crossings. This indicates that most AT users respect traffic rules and use appropriate pedestrian crossings. Four potential conflicts occurred outside of pedestrian crossing areas: three time-to-collision and one post-encroachment time. On the far left TTC point (indicated by the number 1), a pedestrian was crossing the road illegally. The TTC point (indicated by 2) denotes a car–bicycle potential conflict, where the car driver parked at a bus station. The TTC conflict point (marked with 3) denotes a pedestrian–bicycle conflict in front of the school entrance and on the pedestrian sidewalk. The pedestrian density was high, and the cyclist passed them at high-speed. The PET conflict on the pavement (marked with 4) was a car–pedestrian conflict, where the pedestrian was crossing a road outside of the pedestrian crossing area.
4.1. Time-to-Collision
Time-to-collision was the most observed safety indicator in the literature. A value of 1500 milliseconds is most often used when analyzing conflicts between vehicles but, based on the slightly slower vehicle and pedestrian speeds and the video review, a value of 2 s (2000 ms) was applied in this study. The lower the TTC value, the higher the probability of an accident. A total of 14 potential conflicts were identified (
Table 2).
Figure 5 shows a statistical analysis of time-to-collision (ms). It can be seen that most values are scattered, and only two potential conflicts had a constant value during TTC progression (ConflictID 13 and 23). Rhombus in boxplots represents mean and horizontal lines represents median. Additionally, if the potential conflict has a greater number of observations (ConflictID 12, 15, and 20) then the risk exposure lasts longer and the situation is even more dangerous. TTC conflicts were widely scattered across the studied area, and the majority were located at pedestrian crossings. One can conclude that cars stop too close to pedestrian crossings, which could lead to potentially severe consequences—especially as many children walk on pedestrian crossings near primary schools.
Table 2 shows the summary statistics (mean, standard deviation, minimum, maximum, median, variance, skewness, and kurtosis) values of individual potential conflicts. The data are scattered, and all potential conflicts have positive skewness and negative kurtosis.
Figure 6 presents an example of one potential time-to-collision conflict point at a pedestrian crossing, as determined by the DataFromSky Viewer.
Figure 7 presents the progression of each time-to-collision conflict over time. If the value of time-to-collision decreases sharply, it can be concluded that the situation was extremely dangerous because the distance between the traffic participants decreased and a vehicle was forced to brake suddenly (ID 10, 11, 12, 14, 15, and 16). On the other hand, if the progression is accompanied by a slight or moderate decrease in the value, it can be concluded that the situation was moderately dangerous (ID 18, 19, 20, 21, 22, and 23). Conflict 13 has a constant and very low value, and as such this situation was classified as very dangerous.
Based on a safety analysis of the time-to-collision indicator, six additional conflicts were classified as very dangerous: ID 10, 11, 12, 14, 15, and 16.
4.2. Post-Enchroachment Time
Small values of PET (ms) indicate a greater probability of a collision occurring. In this study, based on the literature review [
40] and considering potential AT–car conflicts, a threshold value of 1500 ms was identified as appropriate. A total of 23 potential conflicts were identified (
Table 3). The values of 13 potential PET conflicts were smaller than 1000 ms (56.5% of the total), which means that these conflicts were seriously dangerous. From the locations of all post-encroachment time conflicts (
Figure 4), we can conclude that most PET conflicts occur on pedestrian crossings, which indicates that drivers are aggressive and do not wait long enough for pedestrians to leave the crossing. This is a potentially dangerous situation because pedestrians can turn abruptly and return via the same crossing.
4.3. Heavy Braking
Heavy braking (HB) is used as an indication of rapid deceleration and to detect collisions or dangerous situations. Based on the literature review [
41], a threshold value of −2.5 ms
−2 was identified as applicable to the analysis in this study, meaning that values greater than −2.5 ms
−2 were considered heavy braking, and were consequently considered to be potential conflicts. A total of six potential HB conflicts were identified. The progression of longitudinal acceleration is shown in
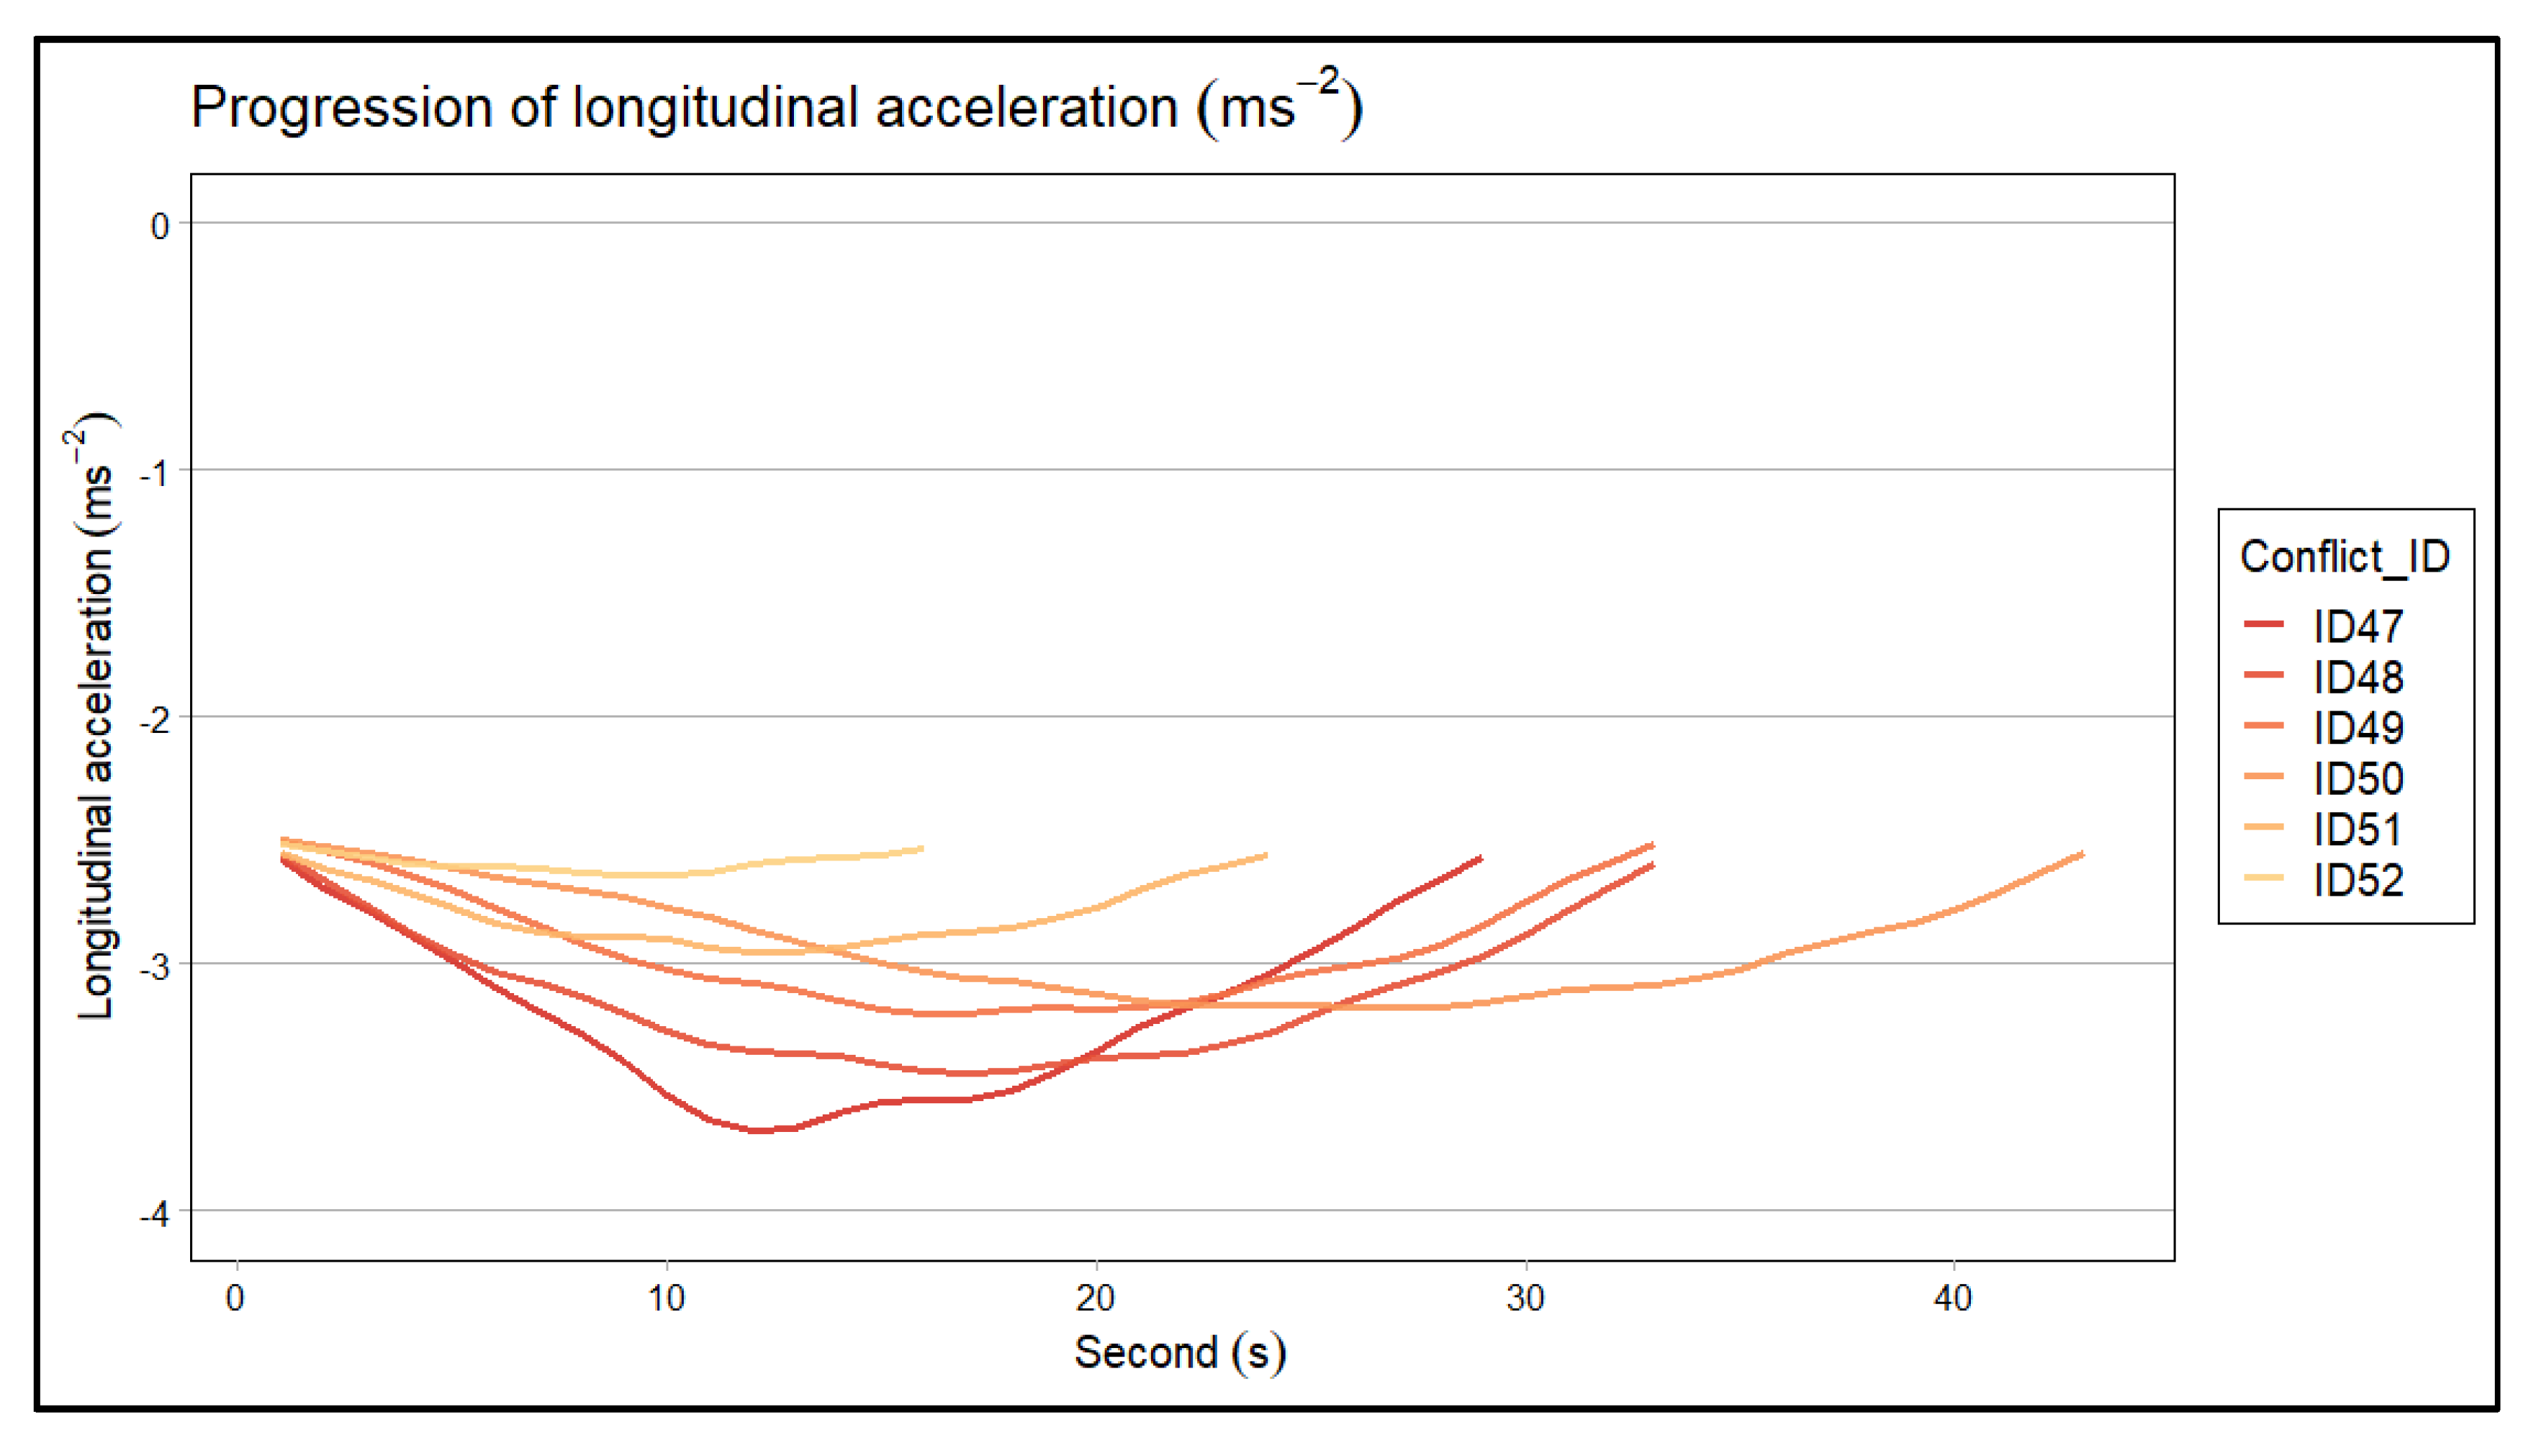
Figure 8. Conflict ID26 had the highest deceleration values. Additionally, a sharp decrease can be seen for ID26—this conflict was classified as the most hazardous in the HB group.
Based on the three safety indicators, a traffic safety analysis of the primary school area was conducted. A total of 43 potential conflicts were identified. Based on the analysis, the locations of all potential conflicts were determined. Most potential conflicts were identified at pedestrian crossings around the primary school. Accordingly, measures to increase traffic safety need to be implemented to increase the safety of the most vulnerable road users, especially children.
5. Discussion
Unlike previous studies which focused on car–car potential conflicts, this study aimed to determine potential conflicts between car and AT users. Safety analysis around the primary school was conducted using three safety indicators: time-to-collision (TTC), post-encroachment time (PET), and heavy braking (HB). A total of 43 potential conflicts were identified (14 TTC, 23 PET, and 6 HB). The most common conflicts (53.49%) were post-encroachment time conflicts, followed by time-to-collision (32.56%), and heavy braking (13.95%). Most potential conflicts were identified at pedestrian crossings, which indicates that most AT users respect traffic rules and use appropriate pedestrian crossings. However, several conflicts were recognized on pavements where road users performed illegal actions. One potential pedestrian–bicycle conflict was determined on a sidewalk. The pedestrian density was high, and the cyclist passed close to them at high speeds. After identifying 43 potential conflicts via surrogate safety analysis, a drone video review was performed to ensure the proposed methodology’s validity and reliability and ensure that all 43 potential conflict points were indeed dangerous in the real traffic situation. This methodology can be applied to strategically assess and increase traffic safety near school areas at the city level and beyond. Based on the determined number of potential conflict points, schools can be prioritized to implement safety measures.
Compared with conventional methods for traffic data collection, one of the main advantages of using UAV in this methodology is the geographic extent of the footage obtained. The altitude of the video camera provides footage that is impossible to capture with conventional technology and tools (e.g., static cameras, sensors, human observers, etc.). Implementing drone technology can reduce human effort, and in a short period of time a whole traffic situation can be visualized. Importantly, compared with other technologies, UAVs do not affect the actual behavior of traffic participants owing to their airborne position.
As a proposal for future research, data should be collected over several days and in several schools to gather as much data as possible on the behavior of all traffic participants. Additionally, data should be collected before the start and after the end of classes to compare the behavior of drivers and pedestrians and the traffic safety situation at these different times of increased activity. With the development of UAVs and the increasing resolution of video cameras, it is possible to capture pedestrian activity with sufficiently high accuracy to determine whether they turned their heads and checked the traffic situation before entering a pedestrian crossing.
6. Conclusions
This study aimed to develop a methodology for evaluating traffic safety near primary school areas using UAV technology and surrogate safety indicators. The methodology included several steps: (i) selection of school areas, (ii) UAV data collection, (iii) data processing, (iv) data analysis, and (v) surrogate safety indicators. So as to not influence driver or AT behavior and collect the trajectories of each road user (passenger cars and AT users), the data were collected using an unmanned aerial vehicle (UAV) and the videos were processed using artificial intelligence and the DataFromSky Viewer computer program. The proposed methodology for determining traffic safety using UAVs and safety indicators is applicable to most primary and secondary schools. Traffic safety near school areas can be determined in a simple, efficient, and reliable manner, and the most vulnerable road users can be protected. After implementing the proposed methodology and evaluating traffic safety, practical measures can be implemented. Several measures can be proposed according to traffic safety studies for each school area to calm traffic or lower speeds near school areas. Measures can be divided into infrastructure and regulation or educational and enforcement activities. Infrastructure and regulation measures include: curb extensions, signalized pedestrian crossings, overpasses and underpasses, speed monitoring displays, chicanes, speed humps, 20 km/h speed zones, textured and colored pavement, raised pedestrian crossings, etc. Educational measures concentrate on the improvement of children’s walking and cycling skills, and discussions in the classroom about safe routes from home to school. Enforcement measures are used to decrease speeding, failing to yield to pedestrians, and illegal U-turns and parking.
In this concrete example of an analyzed school, the number and severity of TTC, PET, and HB could be reduced with all of the suggested measures to reduce speeds near school areas. The installation of signalized pedestrian crossings can additionally reduce PET conflicts. Other measures should include the deployment of cycling paths, Kiss and Go zones (to provide a safe place for parents to drop off and pick up their children), and the installation of traffic poles between traffic lanes to exclude illegal turns in front of school entrances.
Future studies will concentrate on implementing this methodology to evaluate traffic safety near school zones in Croatian cities.
Author Contributions
Conceptualization, L.N. and K.B.; methodology, L.N. and A.R.; software, A.R. and K.B.; validation, L.N.; formal analysis, L.N. and K.B.; investigation, L.N.; resources, A.R.; data curation, A.R. and N.K.; writing—original draft preparation, A.R., L.N., and K.B.; writing—review and editing, A.R., L.N., and K.B.; visualization, K.B. and N.K.; supervision, L.N.; project administration, L.N.; funding acquisition, L.N. All authors have read and agreed to the published version of the manuscript.
Funding
This research was funded by University of Zagreb scientific project: Model of traffic safety evaluation in the school zones using UAV technologies. Project number: 210223.
Institutional Review Board Statement
Not applicable.
Informed Consent Statement
Not applicable.
Data Availability Statement
Data are available from the corresponding author upon request.
Conflicts of Interest
The authors declare no conflict of interest.
References
- Morris, J.; Wang, F.; Lilja, L. School children’s travel patterns: A look back and a way forward. In 24th Australasian Transport Research Forum: Zero Road Toll: A Dream or a Realistic Vision? Tasmanian Dept. of Infrastructure, Energy and Resources: Hobart, Australia, 2001. [Google Scholar]
- Sullman, M.J.M.; Gras, M.E.; Font-Mayolas, S.; Masferrer, L.; Cunill, M.; Planes, M. The pedestrian behaviour of Spanish adolescents. J. Adolesc. 2011, 34, 531–539. [Google Scholar] [CrossRef] [Green Version]
- Adminaite, D.; Jost, G.; Stipdonk, H.; Ward, H.; Calinescu, T. Reducing Child Deaths on European Roads. 2018. Available online: https://etsc.eu/wp-content/uploads/PIN-FLASH_34.pdf (accessed on 1 December 2021).
- Møller, M. Pedestrian Safety, Children. In International Encyclopedia of Transportation; Elsevier: Amsterdam, The Netherlands, 2021; pp. 415–419. [Google Scholar] [CrossRef]
- Giles-Corti, B.; Wood, G.; Pikora, T.; Learnihan, V.; Bulsara, M.; Van Niel, K.; Timperio, A.; McCormack, G.; Villanueva, K. School site and the potential to walk to school: The impact of street connectivity and traffic exposure in school neighborhoods. Health Place 2011, 17, 545–550. [Google Scholar] [CrossRef] [PubMed]
- Rahman, M.H.; Abdel-Aty, M.; Lee, J.; Rahman, M.S. Enhancing traffic safety at school zones by operation and engineering countermeasures: A microscopic simulation approach. Simul. Model. Pract. Theory 2019, 94, 334–348. [Google Scholar] [CrossRef]
- Dumbaugh, E.; Frank, L. Traffic Safety and Safe Routes to Schools. Transp. Res. Rec. J. Transp. Res. Board 2007, 2009, 89–97. [Google Scholar] [CrossRef]
- Elliott, M.A.; Baughan, C.J. Developing a self-report method for investigating adolescent road user behaviour. Transp. Res. Part F Traffic Psychol. Behav. 2004, 7, 373–393. [Google Scholar] [CrossRef]
- Timperio, A.; Ball, K.; Salmon, J.; Roberts, R.; Giles-Corti, B.; Simmons, D.; Baur, L.; Crawford, D. Personal, Family, Social, and Environmental Correlates of Active Commuting to School. Am. J. Prev. Med. 2006, 30, 45–51. [Google Scholar] [CrossRef] [PubMed]
- McArthur, A.; Savolainen, P.T.; Gates, T.J. Spatial Analysis of Child Pedestrian and Bicycle Crashes. Transp. Res. Rec. J. Transp. Res. Board 2014, 2465, 57–63. [Google Scholar] [CrossRef] [Green Version]
- The European Child Safety Alliance. Childhood Road Safety; The European Child Safety Alliance: Amsterdam, The Netherlands, 2007. [Google Scholar]
- Meyer, S.; Sagberg, F.; Torquato, R. Traffic hazard perception among children. Transp. Res. Part F Traffic Psychol. Behav. 2014, 26, 190–198. [Google Scholar] [CrossRef]
- Connelly, M.L.; Conaglen, H.M.; Parsonson, B.S.; Isler, R.B. Child pedestrians’ crossing gap thresholds. Accid. Anal. Prev. 1998, 30, 443–453. [Google Scholar] [CrossRef]
- Briem, V.; Bengtsson, H. Cognition and character traits as determinants of young children’s behaviour in traffic situations. Int. J. Behav. Dev. 2000, 24, 492–505. [Google Scholar] [CrossRef]
- Hamed, M.M. Analysis of pedestrians’ behavior at pedestrian crossings. Saf. Sci. 2001, 38, 63–82. [Google Scholar] [CrossRef]
- Jäger, M.; Nyffeler, T.; Müri, R.; Mosimann, U.P.; Nef, T. Adapting a Driving Simulator to Study Pedestrians’ Street-Crossing Decisions: A Feasibility Study. Assist. Technol. 2015, 27, 1–8. [Google Scholar] [CrossRef]
- Schwebel, D.C.; Davis, A.L.; O’Neal, E.E. Child Pedestrian Injury. Am. J. Lifestyle Med. 2012, 6, 292–302. [Google Scholar] [CrossRef] [Green Version]
- Poschadel, S. Prototypische Kinderunfälle im Innerstädtischen Straßenverkehr; Ruhr University Bochum, University Library: Bochum, Germany, 2006. [Google Scholar]
- Lee, J.; Zhong, Z.; Kim, K.; Dimitrijevic, B.; Du, B.; Gutesa, S. Examining the Applicability of Small Quadcopter Drone for Traffic Surveillance and Roadway Incident Monitoring. In Proceedings of the Transportation Research Board 94th Annual Meeting, Washington, DC, USA, 11–15 January 2015; p. 15. [Google Scholar]
- Ryus, P.; Ferguson, E.; Laustsen, K.M.; Schneider, R.J.; Proulx, F.R.; Hull, T.; Miranda-Moreno, L. Guidebook on Pedestrian and Bicycle Volume Data Collection. Available online: https://www.trb.org/Publications/Blurbs/171973.aspx (accessed on 1 December 2021).
- Kim, D. Pedestrian and Bicycle Volume Data Collection Using Drone Technology. J. Urban Technol. 2020, 27, 45–60. [Google Scholar] [CrossRef]
- Barmpounakis, E.N.; Vlahogianni, E.I.; Golias, J.C.; Babinec, A. How accurate are small drones for measuring microscopic traffic parameters? Transp. Lett. 2019, 11, 332–340. [Google Scholar] [CrossRef]
- Wang, L.; Chen, F.; Yin, H. Detecting and tracking vehicles in traffic by unmanned aerial vehicles. Autom. Constr. 2016, 72, 294–308. [Google Scholar] [CrossRef]
- Khan, M.A.; Ectors, W.; Bellemans, T.; Janssens, D.; Wets, G. Unmanned Aerial Vehicle–Based Traffic Analysis: Methodological Framework for Automated Multivehicle Trajectory Extraction. Transp. Res. Rec. J. Transp. Res. Board 2017, 2626, 25–33. [Google Scholar] [CrossRef]
- Kim, E.-J.; Park, H.-C.; Ham, S.-W.; Kho, S.-Y.; Kim, D.-K. Extracting Vehicle Trajectories Using Unmanned Aerial Vehicles in Congested Traffic Conditions. J. Adv. Transp. 2019, 2019, 9060797. [Google Scholar] [CrossRef]
- Gu, X.; Abdel-Aty, M.; Xiang, Q.; Cai, Q.; Yuan, J. Utilizing UAV video data for in-depth analysis of drivers’ crash risk at interchange merging areas. Accid. Anal. Prev. 2019, 123, 159–169. [Google Scholar] [CrossRef]
- M Khan, M.A.; Ectors, W.; Bellemans, T.; Ruichek, Y.; Yasar, A.-U.-H.; Janssens, D.; Wets, G. Unmanned Aerial Vehicle-based Traffic Analysis: A Case Study to Analyze Traffic Streams at Urban Roundabouts. Procedia Comput. Sci. 2018, 130, 636–643. [Google Scholar] [CrossRef]
- Zaki, M.H.; Sayed, T. Automated Analysis of Pedestrians’ Nonconforming Behavior and Data Collection at an Urban Crossing. Transp. Res. Rec. J. Transp. Res. Board 2014, 2443, 123–133. [Google Scholar] [CrossRef]
- Zaki, M.H.; Sayed, T.; Tageldin, A.; Hussein, M. Application of Computer Vision to Diagnosis of Pedestrian Safety Issues. Transp. Res. Rec. J. Transp. Res. Board 2013, 2393, 75–84. [Google Scholar] [CrossRef]
- Turner, S.; Middleton, D.; Longmire, R.; Brewer, M.; Eurek, R. Testing and Evaluation of Pedestrian Sensors. 2007. Available online: https://rosap.ntl.bts.gov/view/dot/16328 (accessed on 1 December 2021).
- Zangenehpour, S.; Miranda-Moreno, L.F.; Saunier, N. Automated classification based on video data at intersections with heavy pedestrian and bicycle traffic: Methodology and application. Transp. Res. Part C Emerg. Technol. 2015, 56, 161–176. [Google Scholar] [CrossRef]
- Du, Y.; Zhao, C.; Li, F.; Yang, X. An Open Data Platform for Traffic Parameters Measurement via Multirotor Unmanned Aerial Vehicles Video. J. Adv. Transp. 2017, 2017, 8324301. [Google Scholar] [CrossRef]
- DataFromSky. Data from Sky Viewer User Guide; RCE Systems s.r.o.: Brno, Czech Republic, 2019. [Google Scholar]
- Sayed, T.; Zaki, M.H.; Autey, J. Automated safety diagnosis of vehicle–bicycle interactions using computer vision analysis. Saf. Sci. 2013, 59, 163–172. [Google Scholar] [CrossRef]
- Das, S.; Maurya, A.K. Defining Time-to-Collision Thresholds by the Type of Lead Vehicle in Non-Lane-Based Traffic Environments. IEEE Trans. Intell. Transp. Syst. 2020, 21, 4972–4982. [Google Scholar] [CrossRef]
- Nadimi, N.; Ragland, D.R.; Amiri, A.M. An evaluation of time-to-collision as a surrogate safety measure and a proposal of a new method for its application in safety analysis. Transp. Lett. 2020, 12, 491–500. [Google Scholar] [CrossRef]
- Scholl, L.; Elagaty, M.; Ledezma-Navarro, B.; Zamora, E.; Miranda-Moreno, L. A Surrogate Video-Based Safety Methodology for Diagnosis and Evaluation of Low-Cost Pedestrian-Safety Countermeasures: The Case of Cochabamba, Bolivia. Sustainability 2019, 11, 4737. [Google Scholar] [CrossRef] [Green Version]
- De Beaucorps, P.; Streubel, T.; Verroust-Blondet, A.; Nashashibi, F.; Bradai, B.; Resende, P. Decision-making for automated vehicles at intersections adapting human-like behavior. In Proceedings of the 2017 IEEE Intelligent Vehicles Symposium (IV), Los Angeles, CA, USA, 11–14 June 2017; pp. 212–217. [Google Scholar] [CrossRef] [Green Version]
- Dawkins, P. Pauls Online Notes, Section 1-11: Velocity And Acceleration. Lamar University, 29 November 2018. Available online: https://tutorial.math.lamar.edu/Classes/CalcIII/Velocity_Acceleration.aspx (accessed on 23 December 2021).
- Peesapati, L.N.; Hunter, M.P.; Rodgers, M.O. Evaluation of Postencroachment Time as Surrogate for Opposing Left-Turn Crashes. Transp. Res. Rec. J. Transp. Res. Board 2013, 2386, 42–51. [Google Scholar] [CrossRef] [Green Version]
- Desai, J.; Li, H.; Mathew, J.K.; Cheng, Y.-T.; Habib, A.; Bullock, D.M. Correlating Hard-Braking Activity with Crash Occurrences on Interstate Construction Projects in Indiana. J. Big Data Anal. Transp. 2021, 3, 27–41. [Google Scholar] [CrossRef]
| Publisher’s Note: MDPI stays neutral with regard to jurisdictional claims in published maps and institutional affiliations. |
© 2022 by the authors. Licensee MDPI, Basel, Switzerland. This article is an open access article distributed under the terms and conditions of the Creative Commons Attribution (CC BY) license (https://creativecommons.org/licenses/by/4.0/).


