Article

Impact of Mineral and Organic Fertilizer Management on the Performance of Oat-Chickpea Cropping Systems

1
All India Coordinated Research Project on Forage Crops and Utilization, Department of Agronomy, College of Agriculture, Central Agricultural University, Imphal 795004, Manipur, India
2
All India Coordinated Research Project on Rapeseed and Mustard, Department of Agronomy, College of Agriculture, Central Agricultural University, Imphal 795004, Manipur, India
3
All India Coordinated Research Project on Soybean, Department of Agronomy, College of Agriculture, Central Agricultural University, Imphal 795004, Manipur, India
4
All India Coordinated Research Project on Maize, Department of Agronomy, College of Agriculture, Central Agricultural University, Imphal 795004, Manipur, India
5
All India Coordinated Research Project on Rapeseed and Mustard, Department of Genetics and Plant Breeding, College of Agriculture, Central Agricultural University, Imphal 795004, Manipur, India
6
All India Coordinated Research Project on Chickpea, Department of Genetics and Plant Breeding, College of Agriculture, Central Agricultural University, Imphal 795004, Manipur, India
7
All India Coordinated Research Project on Soybean, Department of Entomology, College of Agriculture, Central Agricultural University, Imphal 795004, Manipur, India
8
All India Coordinated Research Project on Soybean, College of Agriculture, Central Agricultural University, Imphal 795004, Manipur, India
9
Department of Agronomy, College of Agriculture, Indira Gandhi Krishi Vishwavidyalaya (IGKV), Krishak Nagar, Raipur 492012, Chhattisgarh, India
*
Author to whom correspondence should be addressed.
Sustainability 2022, 14(22), 15431; https://doi.org/10.3390/su142215431
Submission received: 5 August 2022 / Revised: 10 November 2022 / Accepted: 14 November 2022 / Published: 20 November 2022

Abstract

:
In India, particularly in Manipur, the cultivation of fodder crops is given the least attention as most of the agricultural land is devoted to food crops to meet the food demand of our enormous population. As a result, livestock productivity of the state is suffering. In addition, cultivation of single crops repeatedly over years using inorganic sources of nutrients as inputs for the growth and development of the crops in the same field leads to low production at the cost of soil quality deterioration and environmental issues. Therefore, an experiment was carried out to evaluate the productivity of the oat–chickpea intercropping system to assess the effect of mineral and organic fertilizer management using factorial randomized block design with three replications comprising four levels of the cropping system (CS1-sole oat, CS2-sole chickpea, CS3-intercropping of oat with chickpea in a 3:2 row ratio and CS4-intercropping of oat with chickpea in a 3:3 row ratio) in the main plot and three levels of nutrient management (F1—Full RDF(recommended dose of fertilizer)through inorganic source, F2—50% N of RDF + 50% N through FYM(farm yard manure)and F3—50% N of RDF + 50%N through vermicompost) in the sub plot to study their productivity and economic feasibility. Three years of pooled results revealed that the maximum green fodder yield (50.88 t/ha), dry matter yield (11.84 t/ha) and plant height (120.69 cm) of oat was recorded in CS1, which is among the intercropping systems with the highest green fodder yield (40.11 t/ha) and has a plant height of 115.06 cm; this was recorded in CS3 and the highest dry matter yield (8.44 t/ha) was recorded in CS4. Application of F3 to oats gave the highest green fodder yield, dry matter yield and maximum plant height in all three years of the growing period. The maximum seed yield (1.86 t/ha), harvest index (46.05%), stover yield (2.15 t/ha/ha) and plant height (53.55 cm) of chickpea was obtained in CS2, but among the intercropping system, CS4 was statistically significant at a 5% probability level and was superior in seed yield and stover yield, as compared to the CS3cropping system. The application of F2 showed a higher seed yield and stover yield of chickpea. The green forage equivalent yield (85.37 t/ha), land equivalent ratio (LER) (1.63), gross return ($1902/ha), net returns ($1436/ha) and benefit cost ratio (4.19) were recorded to be the highest in the CS4 cropping system of oat and chickpea. This study concludes that CS4, in combination with the application of F3, can be recommended as it provides a higher green forage equivalent yield, LER and other economic benefits, as compared to other cropping systems and nutrient management practices.

1. Introduction

Livestock productivity, being the backbone of the country (India), provides energy for agricultural operation, animal protein for the rural communities and generates employment opportunity for them [1]. However, livestock productivity in India is far below the world average due to not only priority towards food crops cultivation, but also the poor nutritional quality of forage [2]. Moreover, the continuous cultivation of food crops using inorganic sources of nutrients from the same field encourages soil quality deterioration and environmental issues. Under these circumstances, to increase livestock productivity and to better soil health, cultivation of fodder crops through integrating both organic and inorganic nutrient sources is very required. Oat (Avena sativa L.) is one such fodder crop, grown in winter, with the advantages of being highly nutritious, a bulk amount of fodder as rations for poultry, cattle, sheep and other animals [3] and can be fed in any form—green forage, silage or hay-covering some scarcity periods of the year. Its green forage quantity, as well as quality, is a consequence of its vegetative growth behavior, which is enhanced by the balanced form of nitrogen application [4], especially through integrated nutrient management. Oat is commonly intercropped with legume crops like chickpea, pea, lathyrus, lucern, etc. during the winter season by marginal and sub-marginal farmers in India. Chickpea (Cicer arietinum L.) is a legume crop that is gaining popularity now as an intercrop or succeeding crop as it produces a yield under limited resources and replenishes soil N depletion due to its ability to undergo biological N fixation in roots through symbiosis with Rhizobium leguminoseram. Intercropping, a multi prolonged ‘Intensive cropping’ approach to increase production has the benefit of better utilization of land, erosion reduction, subsistence to farmers during years of changes in the main crop failure, soil fertility and crop productivity enhancement. Cereal-legume based intercropping is always found to be superior to sole cropping and other types of cropping systems due to the additional effect of biological N fixation [5]. The introduction of food-forage intercropping systems with a planting geometry of 3:3 row proportions have a considerable beneficial impact on yield performance, and the inclusion of vermicompost can save 50% of inorganic fertilizers [6]. Growing maize between groundnut rows could produce an additional green fodder yield in the intercropping system without jeopardizing the pod yield of groundnut and could mitigate the fodder scarcity to some extent during the dry season [7]. Numerous studies on cereal/legume intercropping have demonstrated that the amount of N fixed by the legume depends on a variety of factors, including the density, competitiveness, and morphology of the legume [8], as well as the efficiency of the rhizobia symbiosis and the intercropping system [9]. Considering these facts, the present research was designed to confirm the benefits of cereal–legume intercropping and thus to evaluate the best oat–chickpea intercropping system under various mineral and organic fertilizers integrated with nutrient management in Manipur, India.

2. Materials and Methods

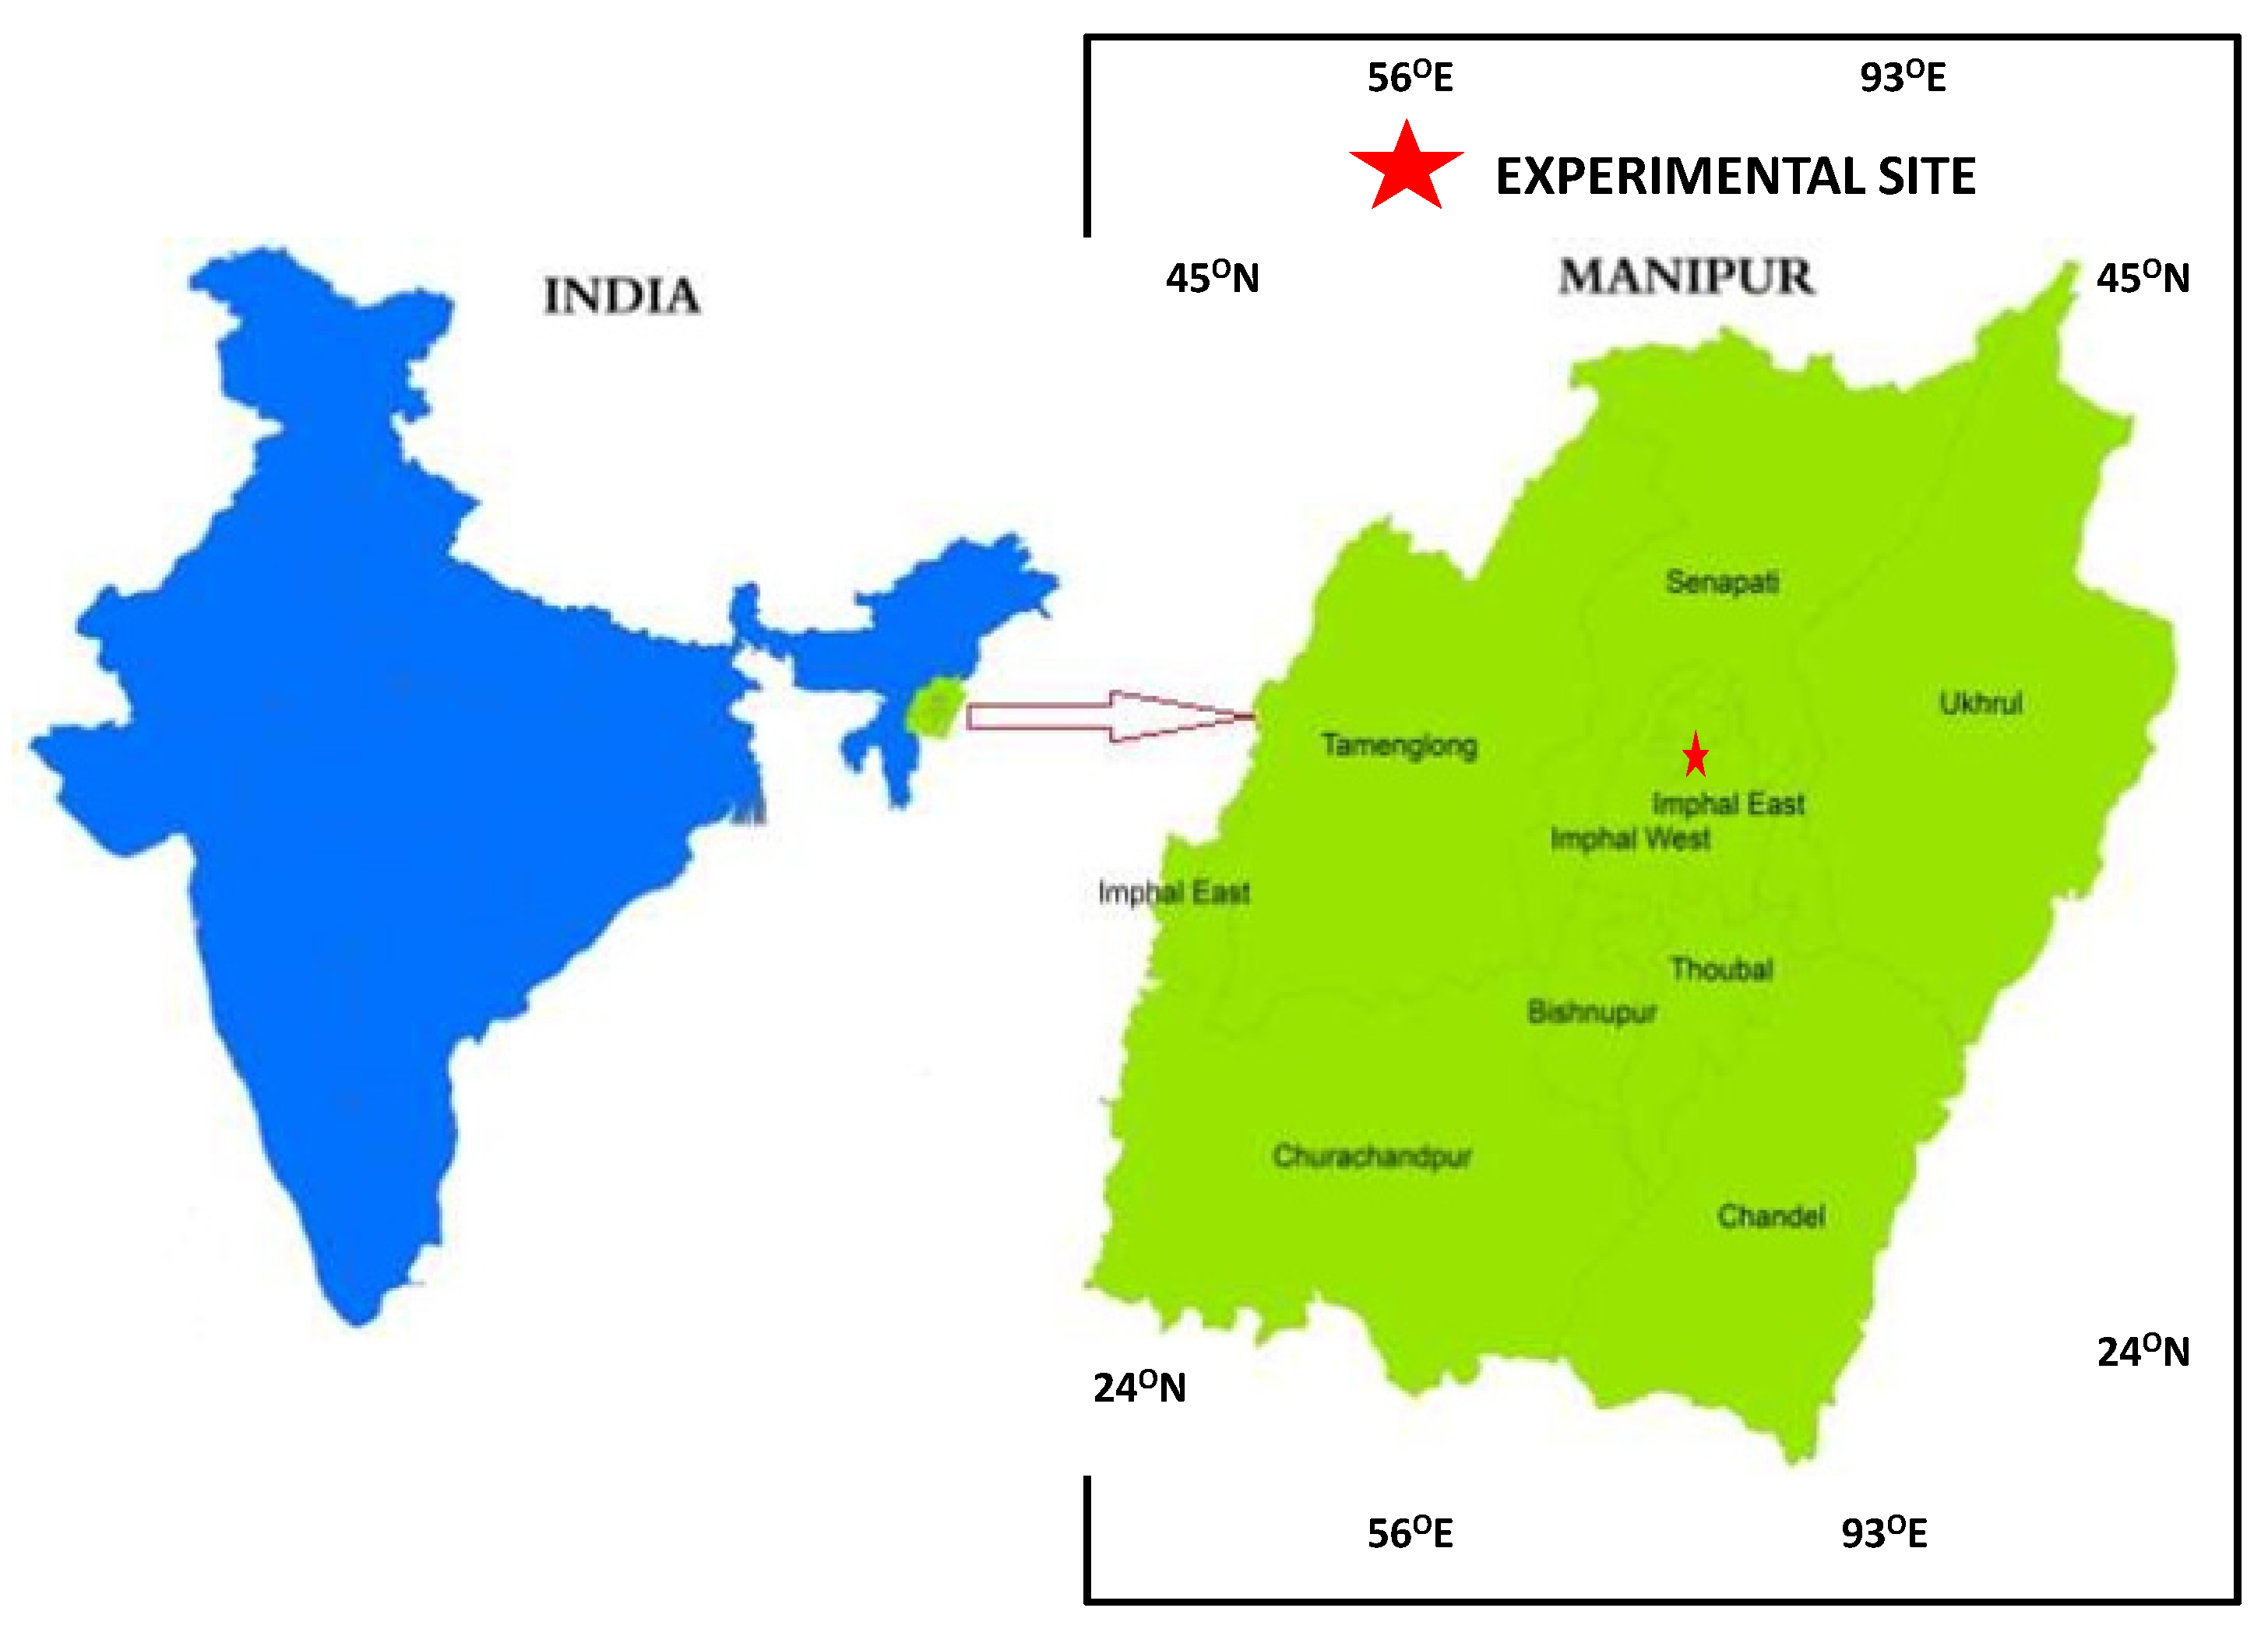
2.1. Sampling Location and Soil Properties

The present investigation was carried out at CAU, Experimental Farm, in Andro, Manipur, India at 24°45′ N latitude, 93°56′ E longitude and an altitude of 790 m above the mean sea level (Figure 1) during the winter season of 2015–2016 to the winter season of 2017–2018. This site falls under the eastern Himalayan region (II) and the sub-tropical zone (NEH-4) of the state of Manipur. The climatic condition of the area is subtropical and the average annual rainfall is 1212 mm. The soil falls under the inceptisols order and is clayed in texture (hyperthermic aerichaplaquept according to U.S. soil taxonomy), acidic in reaction (pH 5.24), medium in available N (287.34 N kg/ha), available phosphorus (16.0 P2O5 kg/ha), available potassium (218.0 K2O kg/ha) and organic carbon (1.4%).

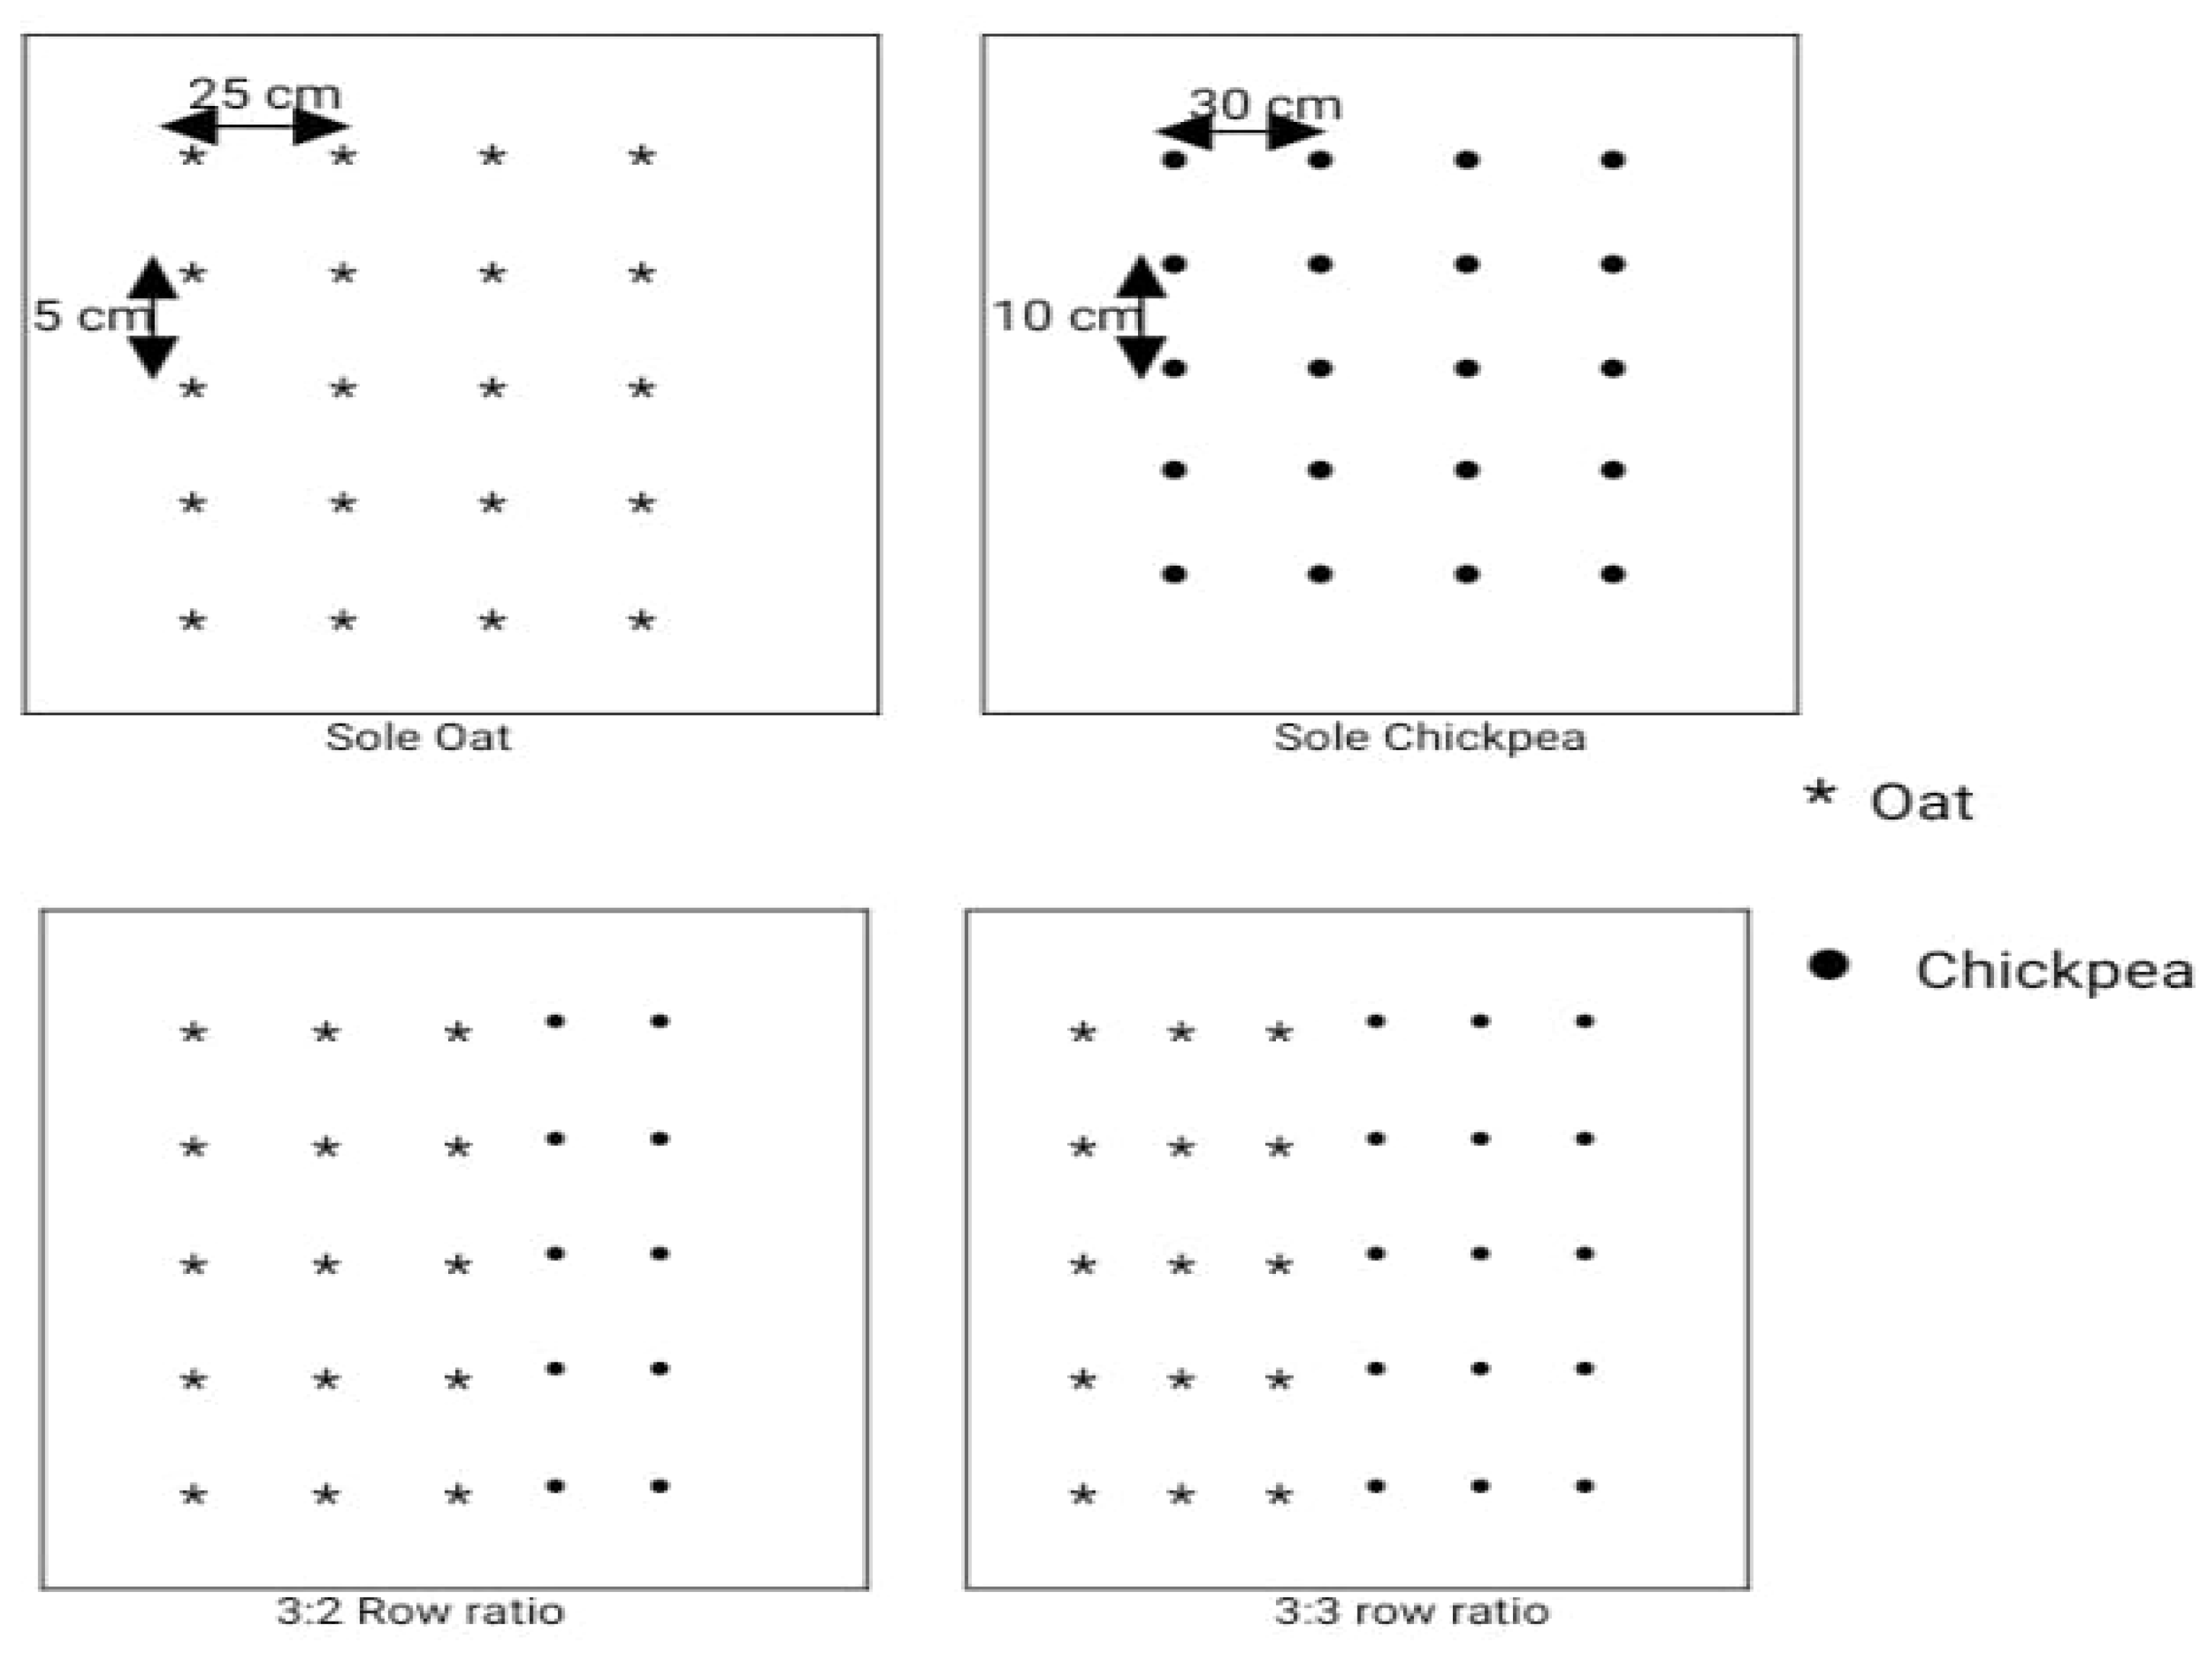
2.2. Fertilizer Treatment and Agriculture Management

The experiment was laid out in factorial randomized block design (FRBD) with three replications comprised of four levels of the cropping system (CS1-sole oat, CS2-sole chickpea, CS3-intercropping of oat with chickpea in 3:2 row ratio and CS4-intercropping of oat with chickpea in a 3:3 row ratio) in the main plot (Figure 2) and 3 levels of nutrient management (F1—Full RDF through inorganic source, F2—50% N of RDF + 50% N through FYM and F3—50% N of RDF + 50% N through vermicompost) in the sub plot. The recommended doses of fertilizers (RDF) were 60 kg N/ha, 40 kg P2O5/ha and 40 kg K2O/ha. N, P2O5 and K2O were applied through urea, single super phosphate and muriate of potash, respectively. The variety used in the experiment was JHO-822 for oat and JG-14 for chickpea. The seeds were treated with rhizobium and phosphate solubilizing bacteria (PSB) culture in all the treatments. The plant height of the representative samples was measured with the help of a meter scale from the ground level to the tip of the plant. The green fodder harvested from the net plot was weighed and then converted into tonne per hectare (t/ha) to obtain the green fodder yield. Simultaneously, a random sample of 500 g was taken from each net plot, chopped well and then dried in the sun and oven dried at 65–70 °C until a constant weight was obtained. On the basis of these samples, the green fodder yields were converted into dry fodder yields and were expressed as t/ha [7].

2.3. Soil Sampling

Representative soil samples were collected randomly prior to the commencement of the experiment from several places at the experimental site at a depth of 0–15 cm with the help of soil auger and the collected samples were composited. The samples were dried properly in shade. After grinding, the soil samples were allowed to pass through a 2 mm sieve and stored for the chemical analysis of the soil [10].

2.4. Physical Soil Analysis

The soil texture (clay soil) was determined by the international pipette method [11] after treating the soil with hydrogen peroxide.

2.5. Soil Chemical Analysis

The pH of the experimental soil was determined with the digital pH meter using a soil water suspension of 1:2.5, as described by Jackson [12]. The oxidizable organic carbon was determined using the wet-oxidation method [13]. The available N content of the soil samples was determined using the alkaline potassium permanganate method, as described by Subbiah and Asija [14]. The available phosphorus content of soil was determined by following Bray and Kurtz’ method and the available potassium was extracted from soil using neutral N ammonium acetate at 1:5 soil; the extract ratio and the concentration of potassium present in the extract was determined using aflame photometer, as described by Jackson [12].

2.6. Green Forage Equivalent Yield

The yield of the individual crop was converted into the equivalent yield (t/ha) on the basis of the prevailing market price of the crop [15]. It was calculated by the following formula:
Oat   equivalent   yield = yield   of   oat   +   yield   of   chickpea   ×   price   of   chickpea price   of   oat

2.7. Land Equivalent Ratio (LER)

LER was calculated as per the method given by Willey and Osiru [16]. It was calculated as follows:
LER = LER (oat) + LER (Chickpea)
LER   ( Oat ) = Yield   of   oat   under   intercropping Yield   of   oat   under   sole   cropping
LER   ( Chickpea ) = Yield   of   chickpea   under   intercropping Yield   of   chickpea   under   sole   cropping
LER > 1 indicates yield advantage
LER = 1 indicates no gain or no loss
LER < 1 indicates yield loss

2.8. Economic Analysis

The treatment wise gross monetary returns were worked out by considering the prevailing market prices of the produce during the year of experimentation. The net return was calculated by subtracting the cost of the cultivation from the gross return of the respective treatment. This is expressed as the net returns in $/ha and the benefit cost ratio of each treatment was worked out by dividing the gross return by the cost of cultivation of the respective treatments.

2.9. Statistical Analysis

All the data pertaining to the present investigation were computed for statistical analysis using Fischer’s method of analysis of variance (ANOVA) and interpreted as outlined by Gomez and Gomez [17]. The interpretation of data was, however, based on 5% probability levels. Critical difference values were calculated wherever the ‘F’ test was found to be significant, and the treatment means were compared following critical differences (CD), as suggested by Gomez and Gomez [17] for significance ata5% probability level.

3. Results and Discussion

3.1. Effect of Cropping System and Nutrient Management on Productivity of Oat

The pooled results (Table 1) of three years of study revealed that the green fodder yield and dry matter yield differed significantly at a 5% probability level with cropping systems. The highest green fodder (50.88 t/ha) and dry matter yield (11.84 t/ha) was recorded in CS1; among the intercropping systems, CS3 produced higher green fodder and dry matter yield than CS4 in all the three years. This might be due to a higher plant population, which has a 60% oat population in the CS3 cropping system and a 50% population in the CS4 cropping system. This might be due to the additional benefits of more biological N fixation by chickpea as compared to sole oat, where no biological N fixation occurred. The result was in agreement with the research outcomes of Tuna and Orak [18] and Kokten and Tansi [19]. Three years of pooled results show that the highest plant height of oat was recorded in CS1 over the intercropping system, which might be due to less nutrient competition and no shading effects by chickpea. Among the intercropping systems, the plant height was found to be higher inCS3. However, there was no significant effect of different levels of cropping system on the plant height of oat. These findings are similar to those obtained by Chongloi and Sharma [6].
Different levels of nutrient management also significantly influence the green fodder yield and dry matter yield of oat. The pooled results (Table 1) from three years of study showed that the highest green forage yield (44.84 t/ha) and dry matter yield (10.38 t/ha) was obtained from F3. The increase in green fodder yield may be due to the positive effect of vermicompost addition as organics, which thereby improve the selected biological and chemical properties of the soil [20] and improve microbial growth present in the earthworm cast of vermicompost, thus enabling better nutrient cycling and promoting plant growth [21]. Similar results have been reported by Kumar et al. [22]. However, different levels of nutrient management exhibited no significant effect on plant height. However, the highest plant height (117.25 cm) was observed when F3 was applied.

3.2. Effect of Cropping System and Nutrient Management on Productivity of Chickpea

Pooled experimental results from three years (Table 2) showed that the seed yield of chickpea (1.86 t/ha), harvest index (44.94%), stover yield (2.15 t/ha), and plant height (53.55 cm) was recorded to be superior in CS2, as compared to other intercropping systems. This might be due to a greater plant population undergoing bacterial N fixation, less competition for sunlight, moisture and nutrients in CS2. Kakon et al. [23], in regards tomaize-pea, Ayub and Shoiab [24], in regards tosorghum and guar, and Naik et al. [25], in regards tomaize legume intercropping systems, noticed similar observations. The lower seed yield, harvest index, stover yield and plant height in CS3 and CS4 cropping systems might be due to the adverse effects of a higher plant population after the addition of 100 percent of CS2 population; these two cropping systems have 60 and 50 percent of the CS1 population, respectively. The seed yield and stover yield were significantly affected by the intercropping system and the harvest index and plant height were not affected by the intercropping system. Among the intercropping systems, the highest seed yield (1.60 t/ha), stover yield (1.97 t/ha) and plant height (52.48 cm) was observed in CS4 and the maximum harvest index (44.22%) was recorded in CS3. The intercropping system of CS4 had more space, air, sunlight and more biological N fixation as compared to the CS3 intercropping system, which could inflect better plant height, stover yield and consequently seed yield than the intercropping system of CS3 [26]. Among the intercropping systems, the CS4 cropping system outperformed CS3 in terms of yield attributes and the yield of chickpea. In both the intercropping systems, although the cereal crop oat obtained benefits from chickpea, there was no beneficial effect of oat on chickpea crop performance. This resulted in a reduced yield of chickpea under the intercrop system.
However, different levels of nutrient management at a 5% probability level significantly influenced the harvest index and stover yield of chickpea and the seed yield and plant height were not significantly affected by different levels of nutrient management. However, the pooled results of three years (Table 2) revealed that the highest seed yield (1.62 t/ha) and stover yield (2.04 t/ha) of chickpea was recorded with the application of F3. The plants under this combination developed healthy roots and enabled plants to absorb relatively more moisture and nutrients from lower strata, which sustain and increase the crop productivity due to the beneficial effects of decomposed organic matter that was derived in connection with physicochemical properties of the soil [27]. This might also be because of the adequate supply of nutrients throughout the growth period and due to the slow release of primary and secondary nutrients, which increases the green forage yield and dry forage yield. Similar findings were reported by Wailare and Kesarwani [28] and Pandey [29]. The lowest seed yield was recorded in F1 and the lowest stover yield was observed in F3. The above results are similar to the findings obtained by Dixit and Khatik [30], who reported that an significant increase in straw yield was obtained due to the incorporation of 50% RDF along with 10t FYM over the sole application of either 100% RDF or 10t FYM. The highest harvest index (46.44%) was observed in F3 and differed significantly by organic and inorganic fertilizer application. The reasons may be owing to the use of vermicompost, which is a rich source of major nutrients and also contains micronutrients, which are readily available for the development of plant [6]. The results regarding plant height, as presented in Table 2, showed a nonsignificant effect of integrated nutrient management, however the maximum plant height (53.62 cm) was recorded in F1. This result was found to be contrary to Chongloi and Sharma [6] and Zada et al. [31] findings, who reported that a significant increased in plant height was obtained with the incorporation of organic manures (vermicompost and FYM) and inorganic fertilizers.

3.3. Effect of Cropping System and Nutrient Management on Green Forage Equivalent Yield of Oat and Chickpea

The pooled results of three years, as represented in Table 3, depicted a significant effect of the green forage yield with the cropping system. The highest green forage equivalent yield (85.34 t/ha) was obtained in the intercropping system of CS4.This might be due to advantages in biological N fixation by the legume crop on oat [32]. In the intercropping system of CS4, oat had the additional benefit of more biological N fixation by chickpea, as compared to the CS3 intercropping system, where biological N fixation was comparatively less. The green forage equivalent yield was the lowest (50.88 t/ha) in CS1due to the absence of legume crop chickpea to undergo biological N fixation. The result was in agreement with the research outcomes obtained by Biswas et al. [32] in oat-lathyrus intercropping and Chongloi and Sharma [6] in the oat–pea intercropping. The findings are also in close conformity with the findings obtained by Sharma et al. [33].
However, the green forage equivalent was not significantly affected by different nutrient management systems. However, the three years of pooled results revealed that the highest green forage equivalent yield (683.47 t/ha) was recorded in F3. The reasons might be due to the integration of vermicompost with inorganic fertilizers, which gave quick responses over other organic nutrient source. Vermicompost increases the chemical fertilizer use efficiency and therefore might be owing to the adequate and continuous supply of nutrients at different stages due to sufficient amount of nutrients by easy mineralization in comparison to FYM at a constant level that resulted in higher plant growth. Similar findings were also reported by Biswas et al. [34], Chongloi and Sharma [6] and Godara et al. [35].

3.4. Effect of Cropping System and Nutrient Management on Land Equivalent Ratio of Oat and Chickpea

The pooled results of three years of experiment (Table 3) showed that intercropping combination and different levels of nutrient management had no significant effect on the land equivalent ratio. However, among the different intercropping systems, CS4 fetched the highest LER (1.63), followed by CS3(1.51). This indicates that the area planted to the sole crop would need to be 6.3% and 5.1% greater than the area planted to the intercrop CS4 and CS3 cropping system to produce the same yield, respectively. The reason might be due to a higher plant population of chickpea intheCS4 intercropping system undergoing more biological N fixation. This directly reflected on the better yield of both the crops compared to other CS3 intercropping systems, CS2 and CS1.A better chickpea yield was due to less shading effect and better utilization of available resources, which also contributed to a greater land equivalent ratio (LER) in CS4. These results are in close conformity with those obtained by Dariush et al. [36] and Sharma et al. [37]. Similar results were also reported by Patel et al. [38] and Pierre et al. [39] in maize-cluster bean and maize–soybean intercropping systems, respectively. However, application of F1 and F2 were not statistically different, but were found to have higher LER values as compared to the application ofF3.

3.5. Economics

The three years of pooled results (Table 4) showed that gross returns, net returns and the cost benefit ratio were significantly affected by different cropping systems. The CS4intercropping system was recorded to have a significantly higher gross return ($1902/ha), net return ($1436/ha), and a benefit cost ratio (4.19) relative to the rest of the cropping systems. Sharma et al.[33] also found a similar type of result in pearl millet and cluster bean intercropping system. Whereas, different levels of nutrient management also exhibited significant effect on gross and net returns as well as benefit cost ratio. The highest gross returns ($1525/ha) and the highest net returns ($1062/ha) was obtained in F3 and F2, respectively. The reason might be due to the overall better production of forage yield that leads to higher net returns. However, the maximum benefit cost ratio (3.69) was noticed where F1was applied and the minimum benefit cost ratio was recorded in F3. This might be due to the cheaper cost of chemical fertilizers as compared to the cost of FYM and Vermicompost since the benefit cost ratio depends on the gross income and total cost of production per plots. These findings are in corroboration with those reported by Meena [40] and in close conformity with Shivranet al. [41].

4. Conclusions

This study confirms that the cereal–legume intercropping system positively influences crop performance. Based on the results, it can be concluded that the 3:3 intercropping system of oat–chickpea (CS4) using 50% inorganic N and 50% N from vermicompost (F3) has performed the best, and it can therefore be recommended to achieve higher green forage and seed yield of oat and chickpea.

Author Contributions

Conceptualization, R.J.K.; Methodology, R.J.K. and K.M.; Formal analysis, R.J.K.; Investigation, R.J.K.; Data curation, D.S., T.S.D., S.D.S., P.S., S.Y., N.K. and L.S.D.; Writing – original draft, R.J.K.; Writing – review & editing, D.S., T.S.D., S.D.S., P.S., S.Y., N.K., L.S.D. and K.M. All authors have read and agreed to the published version of the manuscript.

Funding

This research was funded by All India Coordinated Research Projects on forage crops, IGFRI, Jhansi (ICAR).

Institutional Review Board Statement

Not applicable.

Informed Consent Statement

Not applicable.

Data Availability Statement

Non-digital data supporting this study are curated at Central Agricultural University (CAU), Manipur, India.

Acknowledgments

The authors are grateful to All India Coordinated Research Projects (AICRP) on Forage crops and Utilization, IGFRI, Jhansi (ICAR) for their financial and technical supports during the period of research work.

Conflicts of Interest

The authors declare no conflict of interest.

References

  1. Raj, M.P.; Vyakaranahal, B.S. Effect of integrated nutrient and micronutrients treatment on plant growth parameters in oat cultivar (Avena sativa L.). Int. J. Plant Sci. 2014, 9, 397–400. [Google Scholar]
  2. Roy, D. Reap more biomass through diversity in forestry. Intensive Agric. 1993, XXXI, 23–26. [Google Scholar]
  3. Verma, C.; Thanki, J.D.; Sing, D.; Chaudhari, S.N. Effect of nitrogen, bio-fertilizer and farm yard manure on yield and nutrient uptake in oat (Avenasativa L.). Bioscan 2016, 11, 499–501. [Google Scholar]
  4. Singh, S.D.; Dubey, S.N. Soil properties and yield of fodder oat (Avena sativa L.) as influenced by sources of nutrient and cutting management. Forage Res. 2007, 33, 101–103. [Google Scholar]
  5. Alvey, S.; Yang, C.-H.; Buerkert, A.; Crowley, D.E. Cereal/legume rotation effects on rhizosphere bacterial community structure in West African soils. Biol. Fertil. Soils 2003, 37, 73–82. [Google Scholar] [CrossRef]
  6. Chongloi, K.L.; Sharma, K.K. Productivity of food-forage intercropping system as influenced by integrated nutrient management. Forage Res. 2019, 45, 206–211. [Google Scholar]
  7. Ghosh, P. Growth, yield, competition and economics of groundnut/cereal fodder intercropping systems in the semi-arid tropics of India. Field Crop. Res. 2004, 88, 227–237. [Google Scholar] [CrossRef]
  8. Ofori, F.; Stern, W.R. Cereal-legume intercropping systems. Adv. Agron. 1987, 41, 41–90. [Google Scholar]
  9. Rerkasem, K.; Rerkasem, B. Yields and nitrogen nutrition of intercropped maize (Zea mays L.) and rice bean (Vignaumbellate (Thumb.) Ohwi and Onashi). Plant Soil 1988, 108, 151–162. [Google Scholar] [CrossRef]
  10. Tan, K.H. Soil Sampling, Preparation and Analysis; CRC Press: Boca Raton, FL, USA, 1995. [Google Scholar]
  11. Piper, C.S. Soil and Plant Analysis, 4th ed.; University of Acelicide: Acelicide, Austrilia, 1996; pp. 135–200. [Google Scholar]
  12. Jackson, M.L. Soil Chemical Analysis; Asia Publication House: Bombay, India, 1973; pp. 165–167. [Google Scholar]
  13. Walkley, A.J.; Black, T.A. Estimation of soil organic carbon by chronic titration method. Soil Sci. 1934, 37, 29–38. [Google Scholar] [CrossRef]
  14. Subbiah, B.V.; Asija, G.L. A rapid procedure for the estimation of available nitrogen in soil. Curr. Sci. 1956, 25, 259–260. [Google Scholar]
  15. Anjaneyulu, Y.; Rao, R.P.; Swamy, R.Y. In vitro antimicrobial-activity studies on the mixed ligand complexes of Hg(II) with 8-hydroxyquinoline and salicylic acids. Proceed. Indian Acad. Sci. —Chem. Sci. 1982, 91, 157–163. [Google Scholar] [CrossRef]
  16. Willey, R.W.; Osiru, D.S.O. Studies on mixtures of maize and beans (Phasrolus vulgaris) with particular reference to plant population. J. Agric. Sci. Camb. 1972, 79, 519–529. [Google Scholar] [CrossRef]
  17. Gomez, K.A.; Gomez, A.A. Statistical Procedure for Agricultural Research, 2nd ed.; John Wiley and Sons: New York, NY, USA, 1984; p. 680. [Google Scholar]
  18. Tuna, C.; Orak, A. The role of intercropping on yield potential of common vetch (Vicia sativa L.)/oat (Avena sativa L.) cultivated in pure stand and mixtures. J. Agric. Biol. Sci. 2007, 2, 14–19. [Google Scholar]
  19. Kokten, K.; Tansi, V. Possibilities of growing chuckling mixtures with different cereals species under Cukurova conditions. In Proceedings of the Turkey 3rd Field Crops Congress, Adana, Turkey, 15–18 November 1999; pp. 75–79. [Google Scholar]
  20. Arancon, N.; Edwards, C.; Bierman, P. Influences of vermicomposts on field strawberries: Part 2. Effects on soil microbiological and chemical properties. Bioresour. Technol. 2006, 97, 831–840. [Google Scholar] [CrossRef] [PubMed]
  21. Tomati, U.; Grappelli, A.; Galli, E. The presence of growth regulators in earthworm-worked wastes. In On Earthworms, Proceeding of The International Symposium on Earthworms, Selected Symposia and Monographs, UnioneZoologicaItaliana, Bologna-Carpi, Italy, 31 March–4 April 1985; BonviciniPaglioi, A.M., Omodeo, P., Eds.; Mucchi: Modena, Italy, 1987; Volume 2, pp. 423–436. [Google Scholar]
  22. Kumar, P.; Singh, A.; Singh, A.K. Effect of bio-fertilizers, farmyard manure and nitrogen levels on growth yield and uptake of nutrients in wheat. Ann. PI Soil Res. 2010, 12, 92–94. [Google Scholar]
  23. Kakon, S.S.; Saha, R.R.; Ahmed, F.; Jahan, M.A.H.S. Maize pea intercropping as influenced by planting system and row arrangement. J. Bangladesh Agric. Univ. 2007, 5, 37–41. [Google Scholar]
  24. Ayub, M.; Shoaib, M. Studies on fodder yield and quality of sorghum grown alone and in mixture with guara under different planting techniques. Pak. J. Agric. Sci. 2009, 46, 25–29. [Google Scholar]
  25. Naik, M.; Sumathi, V.; Kadiri, L. Response of optimum nitrogen rate in maize with legume intercropping system. SAARC J. Agric. 2017, 15, 139–148. [Google Scholar] [CrossRef] [Green Version]
  26. Biswas, S.; Jana, K.; Khan, R.; Agrawal, R.K.; Puste, A.M. Periodic Dry Matter Accumulation and Crop Growth Rate of Oat and Lathyrus as Influenced by Integrated Nutrient Management in Intercropping Systems. Int. J. Curr. Microbiol. Appl. Sci. 2019, 8, 2675–2686. [Google Scholar] [CrossRef]
  27. Yadav, H.M.S.; Singh, A. Effect of Integrated nutrient management on yield and quality of oat crop (Avena sativa L.). Ann. Plant Soil Res. 2018, 20, S24–S26. [Google Scholar]
  28. Wailare, A.T.; Kesarwani, A. Effect of Integrated Nutrient Management on Growth and Yield Parameters of Maize (Zea mays L.) As well as Soil Physico-chemical Properties. Biomed. J. Sci. Tech. Res. 2017, 1, 294–299. [Google Scholar]
  29. Pandey, M. Effect of integrated nutrient management on yield, quality and uptakeof nutrients in oat (Avena sativa) in alluvial soil. Ann. Plant Soil Res. 2018, 20, 1–6. [Google Scholar]
  30. Dikshit, P.R.; Khatik, S.K. Influence of organic manures in combination with chemical fertilizers on production, quality and economic feasibility of soybean in typic haplustert of Jabalpur. Legume Res.-Int. J. 2002, 25, 53–56. [Google Scholar]
  31. Zada, K.; Shah, P.; Arif, M. Management of organic farming: Effectiveness of farm yard manure (FYM) and nitrogen for maize productivity. Sarhad J. Agric. 2000, 16, 461–465. [Google Scholar]
  32. Biswas, S.; Jana, K.; Agrawal, R.K.; Puste, A.M. Effect of integrated nutrient management on green forage, dry matter and crude protein yield of oat in oat-Lathyrus intercropping system. J. Crop Weed 2020, 16, 233–238. [Google Scholar] [CrossRef]
  33. Sharma, R.P.; Raman, K.R.; Singh, A.K. Fodder productivity and economics of pearlmillet (Pennisetum typhoides) with legumes intercropping under various row proportions. Indian J. Agron. 2009, 54, 301–305. [Google Scholar]
  34. Biswas, S.; Jana, K.; Agrawal, R.K.; Puste, A.M. Effect of integrated nutrient management on growth attributing characters of crops under various oat-lathyrus intercropping system. Pharma Innov. J. 2019, 8, 368–373. [Google Scholar]
  35. Godara, A.S.; Gupta, U.S.; Singh, R.A. Effect of integrated nutrient management on herbage, dry fodder yield and quality of oat (Avena sativa L.). Forage Res. 2012, 38, 59–61. [Google Scholar]
  36. Dariush, M.; Ahad, M.; Meysam, O. Assessing the land equivalent ratio (LER) of two corn [Zea mays L.] varieties intercropping at various nitrogen levels in Karaj, Iran. J. Cent. Eur. Agric. 2006, 7, 359–364. [Google Scholar]
  37. Sharma, R.P.; Singh, A.K.; Poddar, B.K.; Raman, K.R. Forage production potential and economics of maize (Zea mays) with legumes intercropping under various row proportions. Indian J. Agron. 2008, 53, 121–124. [Google Scholar]
  38. Patel, J.R.; Rajagopal, S. Production potential of forage maize (Zea mays) with legumes under intercropping system. Indian J. Agron. 2001, 46, 211–215. [Google Scholar]
  39. Pierre, H.M.; Kinama, J.M.; Olubayo, F.M.; Wanderi, S.W.; Muthomi, J.W.; Nzuve, F.M. Effect of intercropping maize and promiscuous Soybean on growth and yield. J. Exp. Agric. Int. 2017, 18, 1–21. [Google Scholar] [CrossRef] [Green Version]
  40. Meena, L.R. Productivity and economics of ber (Ziziphus mauritiana) based hortipasture system as influenced by integrated nutrient management under rainfed condition of Rajasthan. Forage Res. 2015, 41, 176–182. [Google Scholar]
  41. Shivran, A.C.; Jat, N.L.; Singh, D.; Rajput, S.S.; Mittal, G.K. Effect of integrated nutrient management on productivity and economics of fenugreek (Trigonella foenum-graecum). Legum. Res.-Int. J. 2016, 39, 279–283. [Google Scholar] [CrossRef]
Figure 1. Location of the study area.
Sustainability 14 15431 g001
Figure 2. Planting pattern in the intercropping system.
Sustainability 14 15431 g002
Table 1. Effect of the cropping system and nutrient management on the productivity of oat.
TreatmentOat
Green Fodder Yield (t/ha)Dry Matter Yield (t/ha)Plant Height (cm)
2015–20162016–20172017–2018Pooled2015–20162016–20172017–2018Pooled2015–20162016–20172017–2018Pooled
A. Intercropping system
Sole Oat (CS1)53.3553.1749.2850.8816.1712.108.3711.84125.81118.81117.45120.69
Sole Chickpea (CS2)------------
Oat + Chickpea in 3:2 row ratio (CS3)39.3539.9941.2940.118.958.457.108.14122.59110.55112.04115.06
Oat + Chickpea in 3:3 row ratio (CS4)37.9338.9338.7538.1610.328.826.538.44117.44109.30113.41113.38
SEm±0.680.480.660.480.220.270.290.093.651.692.151.82
CD at 5%2.671.882.591.900.851.071.140.67NS6.64NSNS
B. Nutrient management
Full RDF through inorganic source-N, P2O5& K2O @ 60: 40:40 kg/ha. (F1)41.4442.2340.5541.8110.318.786.788.72119.85112.96115.67116.16
50% N of RDF + 50% N through FYM (F2)43.7644.1241.4342.4911.799.767.049.32122.78110.00114.41115.73
50% N of RDF + 50% N through Vermicompost (F3)45.4245.7447.3444.8413.3310.838.1810.38123.22115.70112.81117.25
SEm±0.680.600.650.320.220.440.230.171.982.262.331.04
CD at 5%2.101.842.010.990.681.360.690.51NSNSNSNS
RDF: Recommended dose of fertilizer; FYM: Farm yard manure; NS: Non significant; SEm: Standard error mean; CD: Critical difference; The data were computed for statistical analysis by using Fischer’s method of analysis of variance (ANOVA) and interpreted as outlined by Gomez and Gomez [17]. The level of significance use in ‘F’ and ‘T’ tests had a0.05 probability. Wherever the ‘F’ ratio was found to be non-significant, the critical difference wasnot mentioned, but was indicated as ‘NS’. The interpretation of data was however based on 5% probability levels by Duncan’s multiple-range test.
Table 2. Effect of the cropping system and nutrient management on the productivity of chickpea.
TreatmentChickpea
Seed Yield (t/ha)Harvest Index (%)Stover Yield (t/ha)Plant Height (cm)
2015–20162016–20172017–2018Pooled2015–20162016–20172017–2018Pooled2015–20162016–20172017–2018Pooled2015–20162016–20172017–2018Pooled
A. Intercropping system
Sole Oat (CS1)----------------
Sole Chickpea (CS2)1.751.981.861.8646.2247.4444.4946.052.082.062.312.1554.1151.9354.6353.55
Oat + Chickpeain 3:2 row ratio (CS3)1.301.361.241.3044.6245.8942.1944.221.621.571.711.6457.1149.6349.6352.12
Oat + Chickpeain 3:3 row ratio (CS4)1.571.691.541.6044.3944.8941.4243.521.971.752.201.9753.0053.1551.3052.48
SEm±0.050.040.080.041.430.563.681.810.070.060.190.092.151.092.591.58
CD at 5%0.200.16NS0.15NSNSNSNS0.260.24NS0.36NSNSNSNS
B. Nutrient management
Full RDF through inorganic source-N, P2O5& K2O @ 60: 40:40 kg/ha. (F1)1.481.611.491.5344.7745.6942.4844.541.831.812.021.8856.2252.1852.4453.62
50% N of RDF + 50% N through FYM (F2)1.521.681.551.6241.7143.4840.4642.812.141.772.312.0455.3350.8251.6752.60
50% N of RDF + 50% N through Vermicompost (F3)1.621.741.601.6148.7549.0545.6046.441.701.801.901.8452.6751.7151.4451.94
SEm±0.040.070.050.041.350.421.460.590.070.060.070.031.841.491.180.76
CD at 5%NSNSNSNS4.171.29NS1.830.23NS0.210.09NSNSNSNS
RDF: Recommended dose of fertilizer; FYM: Farmyard manure; NS: Non significant; SEm: Standard error mean; CD: Critical difference; the data were computed for statistical analysis using Fischer’s method of analysis of variance (ANOVA) and interpreted as outlined by Gomez and Gomez [17]. The level of significance use in ‘F’ and ‘T’ tests was 0.05 probability. Wherever the ‘F’ ratio was found to be non-significant, the critical difference has not been mentioned, but was indicated as ‘NS’. The interpretation of data was, however, based on 5% probability levels by Duncan’s multiple-range test.
Table 3. Effect of cropping system and nutrient management on the performance of oat–chickpea.
TreatmentGreen Forage Equivalent Yield (t/ha)LER of Intercropping System
2015–20162016–20172017–2018Pooled2015–20162016–20172017–2018Pooled
A. Intercropping system
Sole Oat (CS1)53.3553.1749.2850.881111
Sole Chickpea (CS2)51.5258.4354.7754.911111
Oat + Chickpeain 3:2 row ratio (CS3)77.6180.2376.5078.011.531.501.511.51
Oat + Chickpeain 3:3 row ratio (CS4)84.1488.7884.3485.371.631.631.621.63
SEm±0.821.071.890.870.020.040.050.03
CD at 5%2.823.696.533.010.12NSNSNS
B. Nutrient management
Full RDF through inorganic source-N, P2O5& K2O @ 60: 40:40 kg/ha (F1)63.7367.3264.3365.631.551.661.541.58
50% N of RDF + 50% N through FYM (F2)66.3970.2865.9967.911.631.551.561.58
50% N of RDF + 50% N through vermicompost (F3)69.8572.8568.3368.351.561.501.611.56
SEm±0.931.481.240.800.040.030.050.02
CD at 5%2.78NSNSNS0.110.11NSNS
LER: Land equivalent ratio; RDF: Recommended dose of fertilizer; FYM: Farmyard manure; NS: Non significant; SEm: Standard error mean; CD: Critical difference; the data were computed for statistical analysis using Fischer’s method of analysis of variance (ANOVA) and interpreted as outlined by Gomez and Gomez [17]. The level of significance use in the ‘F’ and ‘T’ tests was 0.05 probability. Wherever the ‘F’ ratio was found to benon-significant, the critical difference has not been mentioned, but indicated as ‘NS’. The interpretation of data was, however, based on 5% probability levels using Duncan’s multiple-range test.
Table 4. Effect of cropping system and nutrient management of oat–chickpea on gross return, net return, and benefit cost ratio.
TreatmentGross Return ($/ha)Net Return ($/ha)Benefit Cost Ratio
2015–20162016–20172017–2018Pooled2015–20162016–20172017–2018Pooled2015–20162016–20172017–2018Pooled
A. Intercropping System
Sole Oat (CS1)100410019279585315284554852.162.152.012.07
Sole Chickpea (CS2)129314661374137883510089179202.863.263.053.07
Oat + Chickpea in 3:2 row ratio (CS3)170117261693171712331295122612493.723.843.673.74
Oat + Chickpeain 3:3 row ratio (CS4)187419831869190214081518140414364.114.374.104.19
SEm±23264821232648210.050.050.110.05
CD at 5%7891165737891165730.170.180.370.17
B. Nutrient management
Full RDF through inorganic source-N, P2O5& K2O @ 60: 40:40 kg/ha. (F1)140414911397144210141100100610513.603.823.583.69
50% N of RDF + 50% N through FYM (F2)146015561447149910231119100910623.343.563.313.43
50% N of RDF + 50% N through Vermicompost (F3)153916131554152597010449859562.712.842.732.68
SEm±22382819223828190.050.080.070.04
CD at 5%66NS8558NSNSNS580.140.240.200.13
RDF: Recommended dose of fertilizer; FYM: Farm yard manure; NS: Non significant; SEm: Standard error mean; CD: Critical difference; the data were computed for statistical analysis using Fischer’s method of analysis of variance (ANOVA) and interpreted as outlined by Gomez and Gomez [17]. The level of significance use in ‘F’ and ‘T’ tests was 0.05 probability. Wherever the ‘F’ ratio was found to be non-significant, the critical difference has not been mentioned, but was indicated as ‘NS’. The interpretation of data was, however, based on 5% probability levels usingDuncan’s multiple-range test.
Publisher’s Note: MDPI stays neutral with regard to jurisdictional claims in published maps and institutional affiliations.

