Article

Genome-Wide In Silico Identification, Structural Analysis, Promoter Analysis, and Expression Profiling of PHT Gene Family in Sugarcane Root under Salinity Stress

by
Naveenarani Murugan
,
Vignesh Palanisamy
,
Mahadevaiah Channappa
,
Valarmathi Ramanathan
,
Manimekalai Ramaswamy
,
Hemaprabha Govindakurup
and
Appunu Chinnaswamy
*
Division of Crop Improvement, Indian Council of Agricultural Research-Sugarcane Breeding Institute, Coimbatore 641007, Tamil Nadu, India
*
Author to whom correspondence should be addressed.
Sustainability 2022, 14(23), 15893; https://doi.org/10.3390/su142315893
Submission received: 11 August 2022 / Revised: 5 October 2022 / Accepted: 8 October 2022 / Published: 29 November 2022

Abstract

:
The phosphate transporter (PHT) family of proteins plays an imperative role in regulating phosphorus (P) acquisition as well as in translocation from the soil into cells and organs. Phosphorus is an essential macronutrient required for plant life that is not readily available to crops, and resources are diminishing rapidly because of the huge needs of global agriculture. In this study, 23 ShPHT genes were identified in the sugarcane (Saccharum spp.) genome through a comprehensive genome-wide in silico analysis. Phylogeny, gene structure, and conserved motif analysis of PHT genes in sugarcane (ShPHTs) indicated five subfamilies (PHT1-4 and PHO1 subfamily). Gene ontology (GO) analysis revealed that the ShPHT genes were largely involved in phosphate ion transport, phosphate starvation, stimulus response, stress response, and symporter activity. Gene expression analysis under salinity stress confirmed strong induction of PHT genes in wild genotype sugarcane (IND99-907). PHT1-1, PHT1-2, and PHT1-3 members were notably up-regulated in roots under salt stress. The upstream region of PHT genes contained PHR1-binding sites (P1BS), MYB-type, and WRKY- type binding elements. Overall, the present study paves the way for a deeper understanding of the evolution of sugarcane PHT genes and their role in salinity and Pi stress tolerance in sugarcane.

1. Introduction

Phosphorus (P) is the second major macronutrient involved in molecular regulations such as photosynthesis, energy metabolism, signal transduction, and enzymatic regulation, and plays a crucial role in plant growth and development. In soil, phosphate is present in two forms, namely, organic (20–80%) and inorganic (<5%). Although it is rich in the environment, its level of distribution and availability as a soluble form in the soil is much less. Therefore, the application of P fertilizers has increased globally from 4.6 million tons in 1961 to 50 million tons in recent years [1,2]. Frequent applications and excess use of P fertilizer have led to the depletion of non-renewable rock phosphate as well as other environmental concerns. Predominantly, plants can utilize only the inorganic phosphate from the soil as a phosphate source, which is readily absorbed by plant roots through phosphate (Pi) transporters and transported via various strategies to enhance Pi uptake from P-limited soils by remodeling the root morphology, secreting organic acids and phosphatases, and inducing the high-affinity Pi transporters [3]. Pi uptake in roots mainly depends on soil characteristics, which are highly influenced by abiotic stresses, organic compounds, and concentration of metals such as Fe, Al, and Ca [4]. The phosphate transporter (PHT) transporter gene family in plants plays an important role in Pi acquisition and translocation in plants; their expression varies depending on their high affinity or low affinity for phosphate.
PHT genes are categorized into six groups, namely, PHT1, PHT2, PHT3, PHT4, PHT5, and PHO1, based on evolutionary relationships, protein sequences, structures, and functions [5,6]. In recent years, with increased efforts around whole-genome sequencing, all the members of the PHT gene family have been reported in a variety of species [7]. Members of the Pi transporter family are mostly expressed in roots, and others in shoots, leaves, and flowers [8]. PHT1, the high-affinity Pi transporters, mainly expressed in the plasma membrane of root cells, play a vital role in both Pi uptake from the soil and translocation [7]. The Pi transporter subfamilies, namely, PHT2/PHT4, PHT3, and PHT4, localize between the cytoplasm and plastids, mitochondria, and Golgi membranes for energy metabolism, respectively. The PHT5 family plays a crucial role in vacuolar mediating Pi storage and adaptation [9]. PHO1 has been reported in both Pi transport from root to shoot and Pi-deficiency response signal transduction cascade [10].
Abiotic stresses, such as drought, salinity, extreme high and low temperatures, and heavy metals have a devastating impact on plant growth and development, and result in a worldwide reduction in crop productivity. Salinity has been considered the most serious abiotic stress factor in plants, leading to severe dehydration and inorganic solute imbalance in major crop species, ultimately leading to limited growth and yield. Drought and salinity have a strong impact on plant nutrient relations as well. It has been reported that drought stress often diminishes N and P concentrations in plant tissues [11]. Due to salinity, the phosphate ions in the soil tend to form an insoluble phosphate that limits P availability, absorption, and transport from the soil by root to shoot. Therefore, combined exposure to salinity stress and Pi starvation is deleterious for plant growth [12]. During abiotic and biotic stresses, plants tend to regulate the expression of a particular gene to adapt to the adverse effects, and the expression of the specific gene is controlled by the upstream cis-acting elements, which are key links in plant stress responses. Previous reports have shown that the majority of Pi transporters contain putative cis-acting regulatory elements in their promoters associated with plant stress and defense signaling [13].
Sugarcane (Saccharum spp. hybrid) is cultivated worldwide in tropical and subtropical regions as a major source of sugar and a viable source of biomass for ethanol production. At present, various stress factors restrict yields to up to 50% in major crops. In sugarcane, salinity is one of the major abiotic stresses that adversely affects the growth rate at various developmental stages [14,15]. On the other hand, due to phosphate-deficient soils, the use of P fertilizer in sugarcane plantations has increased year over year to improve crop growth and development, leaving a large P footprint. Therefore, it is important to develop salt-tolerant plants that facilitate or even boost the availability and absorption of soil phosphorus more efficiently under these conditions [16]. In this study, the sugarcane PHT gene family members are investigated using various bioinformatics tools. The molecular characteristics, phylogenetic relationships, gene structures, conserved domains, evolutionary relationships, and cis-elements are systematically studied. To date, while studies have been conducted in different plants, many structural aspects and ligand-binding aspects of the PHT protein families remain unknown. Hence, this study aims at homology modeling of PHT proteins, post-translational modifications, and functional roles of PHT genes through expression profiles between salt-tolerant and salt-sensitive sugarcane varieties. In addition, this study provides insights for future research on ShPHT genes associated with growth, development, and stress tolerance in sugarcane.

2. Materials and Methods

2.1. Data Retrieval and Identification of Sugarcane PHT Genes

The sequences of PHT genes of Arabidopsis thaliana (TAIR10), Zea mays (Zm-B73-REFERENCE-NAM-5.0), and Sorghum bicolor (v3.1.12) were retrieved from the Ensembl Plants database (http://plants.ensembl.org/, (accessed on 12 May2022)) and the Sugarcane genome of Saccharum spp. hybrid (Sh) cultivar R570 was retrieved from Sugarcane Genome Hub (https://sugarcane-genome.cirad.fr/, (accessed on 12 May 2022)). To find the potential orthologous genes encoding PHTs in Sugarcane, the protein sequences of A. thaliana, Z. mays, and S. bicolor were used as queries in BLAST with E-10 as the threshold. The protein, gene, CDS, and gff3 annotation files were downloaded for further analysis. Transcripts encoding less than 90% similarity and duplicated transcripts were removed to generate the final dataset. The identified sugarcane PHT proteins were designated using the species abbreviation, the gene family name, and their members, for example, ShPHT1-1.

2.2. Sequence Analysis of PHT Proteins from Sugarcane

The physiochemical characteristics, including molecular weights (MW), theoretical isoelectric point (pIs), instability index, grand average of hydropathicity (GRAVY), and protein lengths (aa) of the candidate ShPHT protein sequences, were acquired using the ExPASy—ProtParam tool (http://web.expasy.org/protparam/, (accessed on 17 May 2022)) [17]. TMHMM server v.2.0 (http://www.cbs.dtu.dk/services/TMHMM/, (accessed on 17 May 2022)) [18] was used to predict the transmembrane domains (TMD). Potential phosphorylation sites were identified using NetPhos 3.1 server (http://www.cbs.dtu.dk/services/NetPhos/, (accessed on 19 May 2022)) [19] with a potential value > 0.5, and NetNGlyc 1.0 server (http://www.cbs.dtu.dk/services/NetNGlyc/, (accessed on 19 May 2022)) [20] was used to predict the N-glycosylation sites in the amino acid sequence of phosphate transporter proteins. The subcellular localization of ShPHTs were predicted using the WoLFPSORT tool (http://www.genscript.com/wolf-psort.html, (accessed on 26 May 2022)) [21].

2.3. Phylogenetic Analysis of PHT Genes

To explore the phylogenetic relationship of PHT genes between Saccharum spp. hybrid, A. thaliana, Z. mays, and S. bicolor, a multiple sequence alignment was performed for the candidate phosphate transporter proteins using CLC Genomics Workbench with default parameters (Qiagen, Hilden, Germany). The results were used to construct a phylogenetic tree by the Neighbor Joining (NJ) method with pair-wise deletion, Poisson correction, and 1000 bootstrap replicate parameters, then visualized using MEGA-X software [22].

2.4. Gene Structure Analysis and Identification of Conserved Motifs

The intron/exon organization was established by aligning the genomic sequences with the CDS sequences. Gene Structure Display Server 2.0 (GSDS 2.0, http://gsds.cbi.pku.edu.cn/, (accessed on 20 May 2022)) [23] was used to generate a schematic diagram of the exon–intron organization of ShPHT genes. To verify the presence of conserved motifs, the protein sequences were submitted to the NCBI conserved domain database (http://www.ncbi.nlm.nih.gov/Structure/cdd/wrpsb.cgi, (accessed on 17 May 2022)) [24], SMART (http://smart.embl-heidelberg.de/, (accessed on 25 May 2022)) [25], and Pfam server (http://pfam.xfam.org/, (accessed on 25 May 2022)) [26], and the results were visualized using TBtools (https://github.com/CJ-Chen/TBtools, (accessed on 28 May 2022)) [27]. To understand the occurrence of motif diversity and conservation, the protein sequences of ShPHTs were analyzed using MEME Suite version 5.3.3 (https://meme-suite.org/meme/, (accessed on 23 May 2022)) using the default parameters and with the maximum number set to 20 [28]. The MEME results were then visualized using TBtools software.

2.5. Prediction of Structure, Protein Pocket Sites, and Protein Modeling

The protein secondary structures of the ShPHTs were predicted using the SOPMA online server [29]. As the crystal structures of most of the PHT proteins are not available in the Protein Data Bank (PDB), homology-based structural modelling of ShPHT proteins was predicted using the Phyre2 web server [30]. The CASTp (Computed Atlas of Surface Topography of proteins) tool (http://sts.bioe.uic.edu/castp/calculation.html, (accessed on 31 May 2022)) was used to predict the active site pockets and topology of the ShPHT proteins [31]. Model quality was checked by Ramachandran plot analysis in VADAR (Volume, Area, Dihedral Angle Reporter) server [32].

2.6. GO and KEGG Analysis

Gene ontology (GO) analysis was carried out using the PANNZER2 web server (http://ekhidna2.biocenter.helsinki.fi/sanspanz, (accessed on 20 May 2022)). ShPHT genes were analyzed for their GO functions [33]. KEGG analysis using the BlastKOALA (KEGG Orthology and Links Annotation) web server (https://www.kegg.jp/blastkoala, (accessed on 20 May 2022)) [34] was employed to characterize the individual functions of the genes.

2.7. Chromosomal Organization and Ka/Ks Calculation

The chromosomal localization information of ShPHT genes was analyzed using the MapGene2chromosome web v2.1 (MG2C) database (http://mg2c.iask.in/mg2c_v2.1/, (accessed on 28 May 2022)) according to their position information, available on the Sugarcane Genome Hub (https://sugarcane-genome.cirad.fr/, (accessed on 20 May 2022)). The non-synonymous substitution rate (Ka), synonymous substitution rate (Ks), and Ka/Ks values were calculated using the PAL2NAL program with default settings [35]. We calculated the divergence time of ShPHT genes with the formula T = Ks/ (2 × 6.1 × 10−9) × 10−6 Mya [36].

2.8. Expression Study of PHT Genes in Sugarcane

The RNA-Seq dataset generated earlier by our group was used for the expression profiling of PHT gene families under salinity stress in sugarcane species. The salinity stress dataset is available in the NCBI database under BioProject accession number PRJNA716503 [37]. In the present study, expression analysis of PHT genes was performed between stress and control root samples of E. arundinaceus, a wild relative of sugarcane (IND 99-907), and the salinity-sensitive genotype Co 97010. De novo assemblies for IND 99-907 and Co 97010 were generated separately, and unigenes were clustered using CD-HIT with a word size of 8 and a percent similarity threshold of 99 percent. The expression values (FPKM) were obtained by mapping the cleaned reads against the individual assemblies containing unigenes using the RSEM tool. RNA isolation and cDNA synthesis were carried out as previously described [37]. IDT was used to create the primers. The internal control was the Glyceraldehyde 3-phosphate dehydrogenase (GAPDH) gene. For quantitative real-time PCR (qRT-PCR) analysis, a StepOne real-time PCR system (Applied Biosystems, Burlington, ON, Canada) was used with the following temperature profile: 10 min of denaturation at 95 °C, followed by 40 cycles 15 s of denaturation at 95 °C, 1 min of annealing, and extension at 60 °C in a final volume of 25 µL reaction. The relative expression of PHT genes in IND 99-907 and Co 97010 was determined using 2−∆∆Ct method [38]. Three biological and technical replicates were employed for expression analysis. The heatmap for the expression data was generated using TBtools.

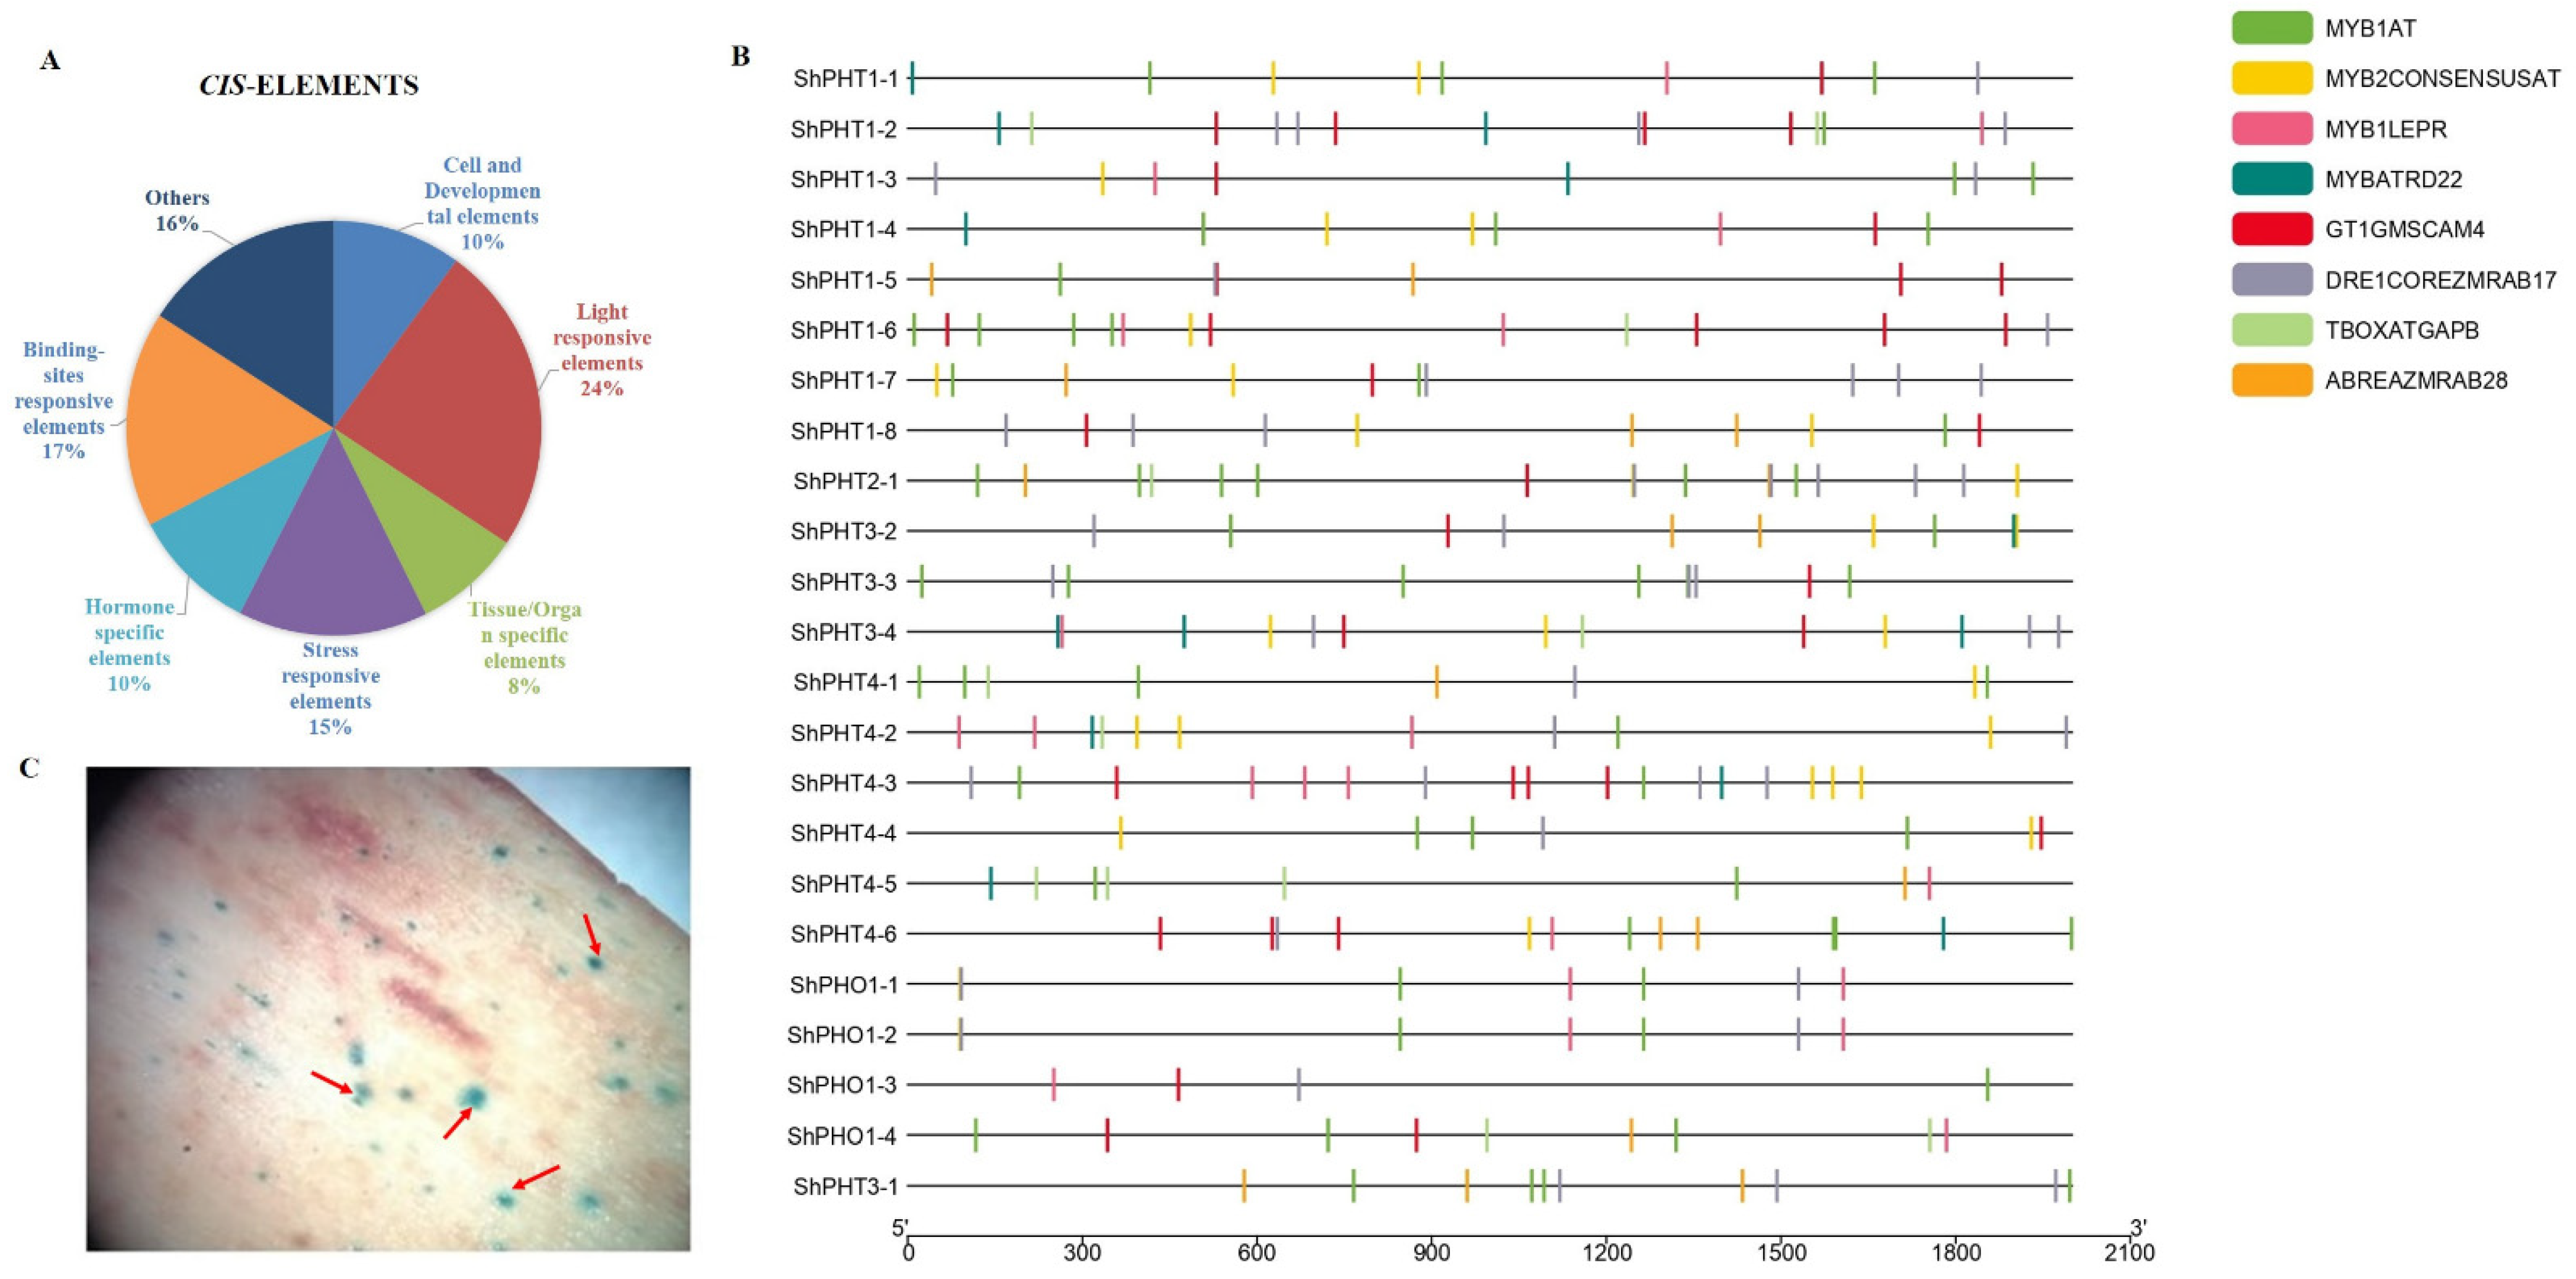
2.9. Prediction of Putative cis-Regulatory Elements and Transient Expression Analysis of EaPHT1:2 Promoter

To predict the cis-regulatory elements of ShPHT genes, we obtained the region 2000 bp upstream from the transcription start site (TSSs) of the genome using the faidx option from the tool samtools. The PLACE database (http://www.dna.affrc.go.jp/htdocs/PLACE/, (accessed on 2 June 2022)) was used to predict the cis-elements in the promoter region [39]. The 5′ regulatory promoter region of the EaPHT1-2 gene was isolated using the RAGE technique (data not included), and transient expression analysis was carried out as described in [40].

3. Results

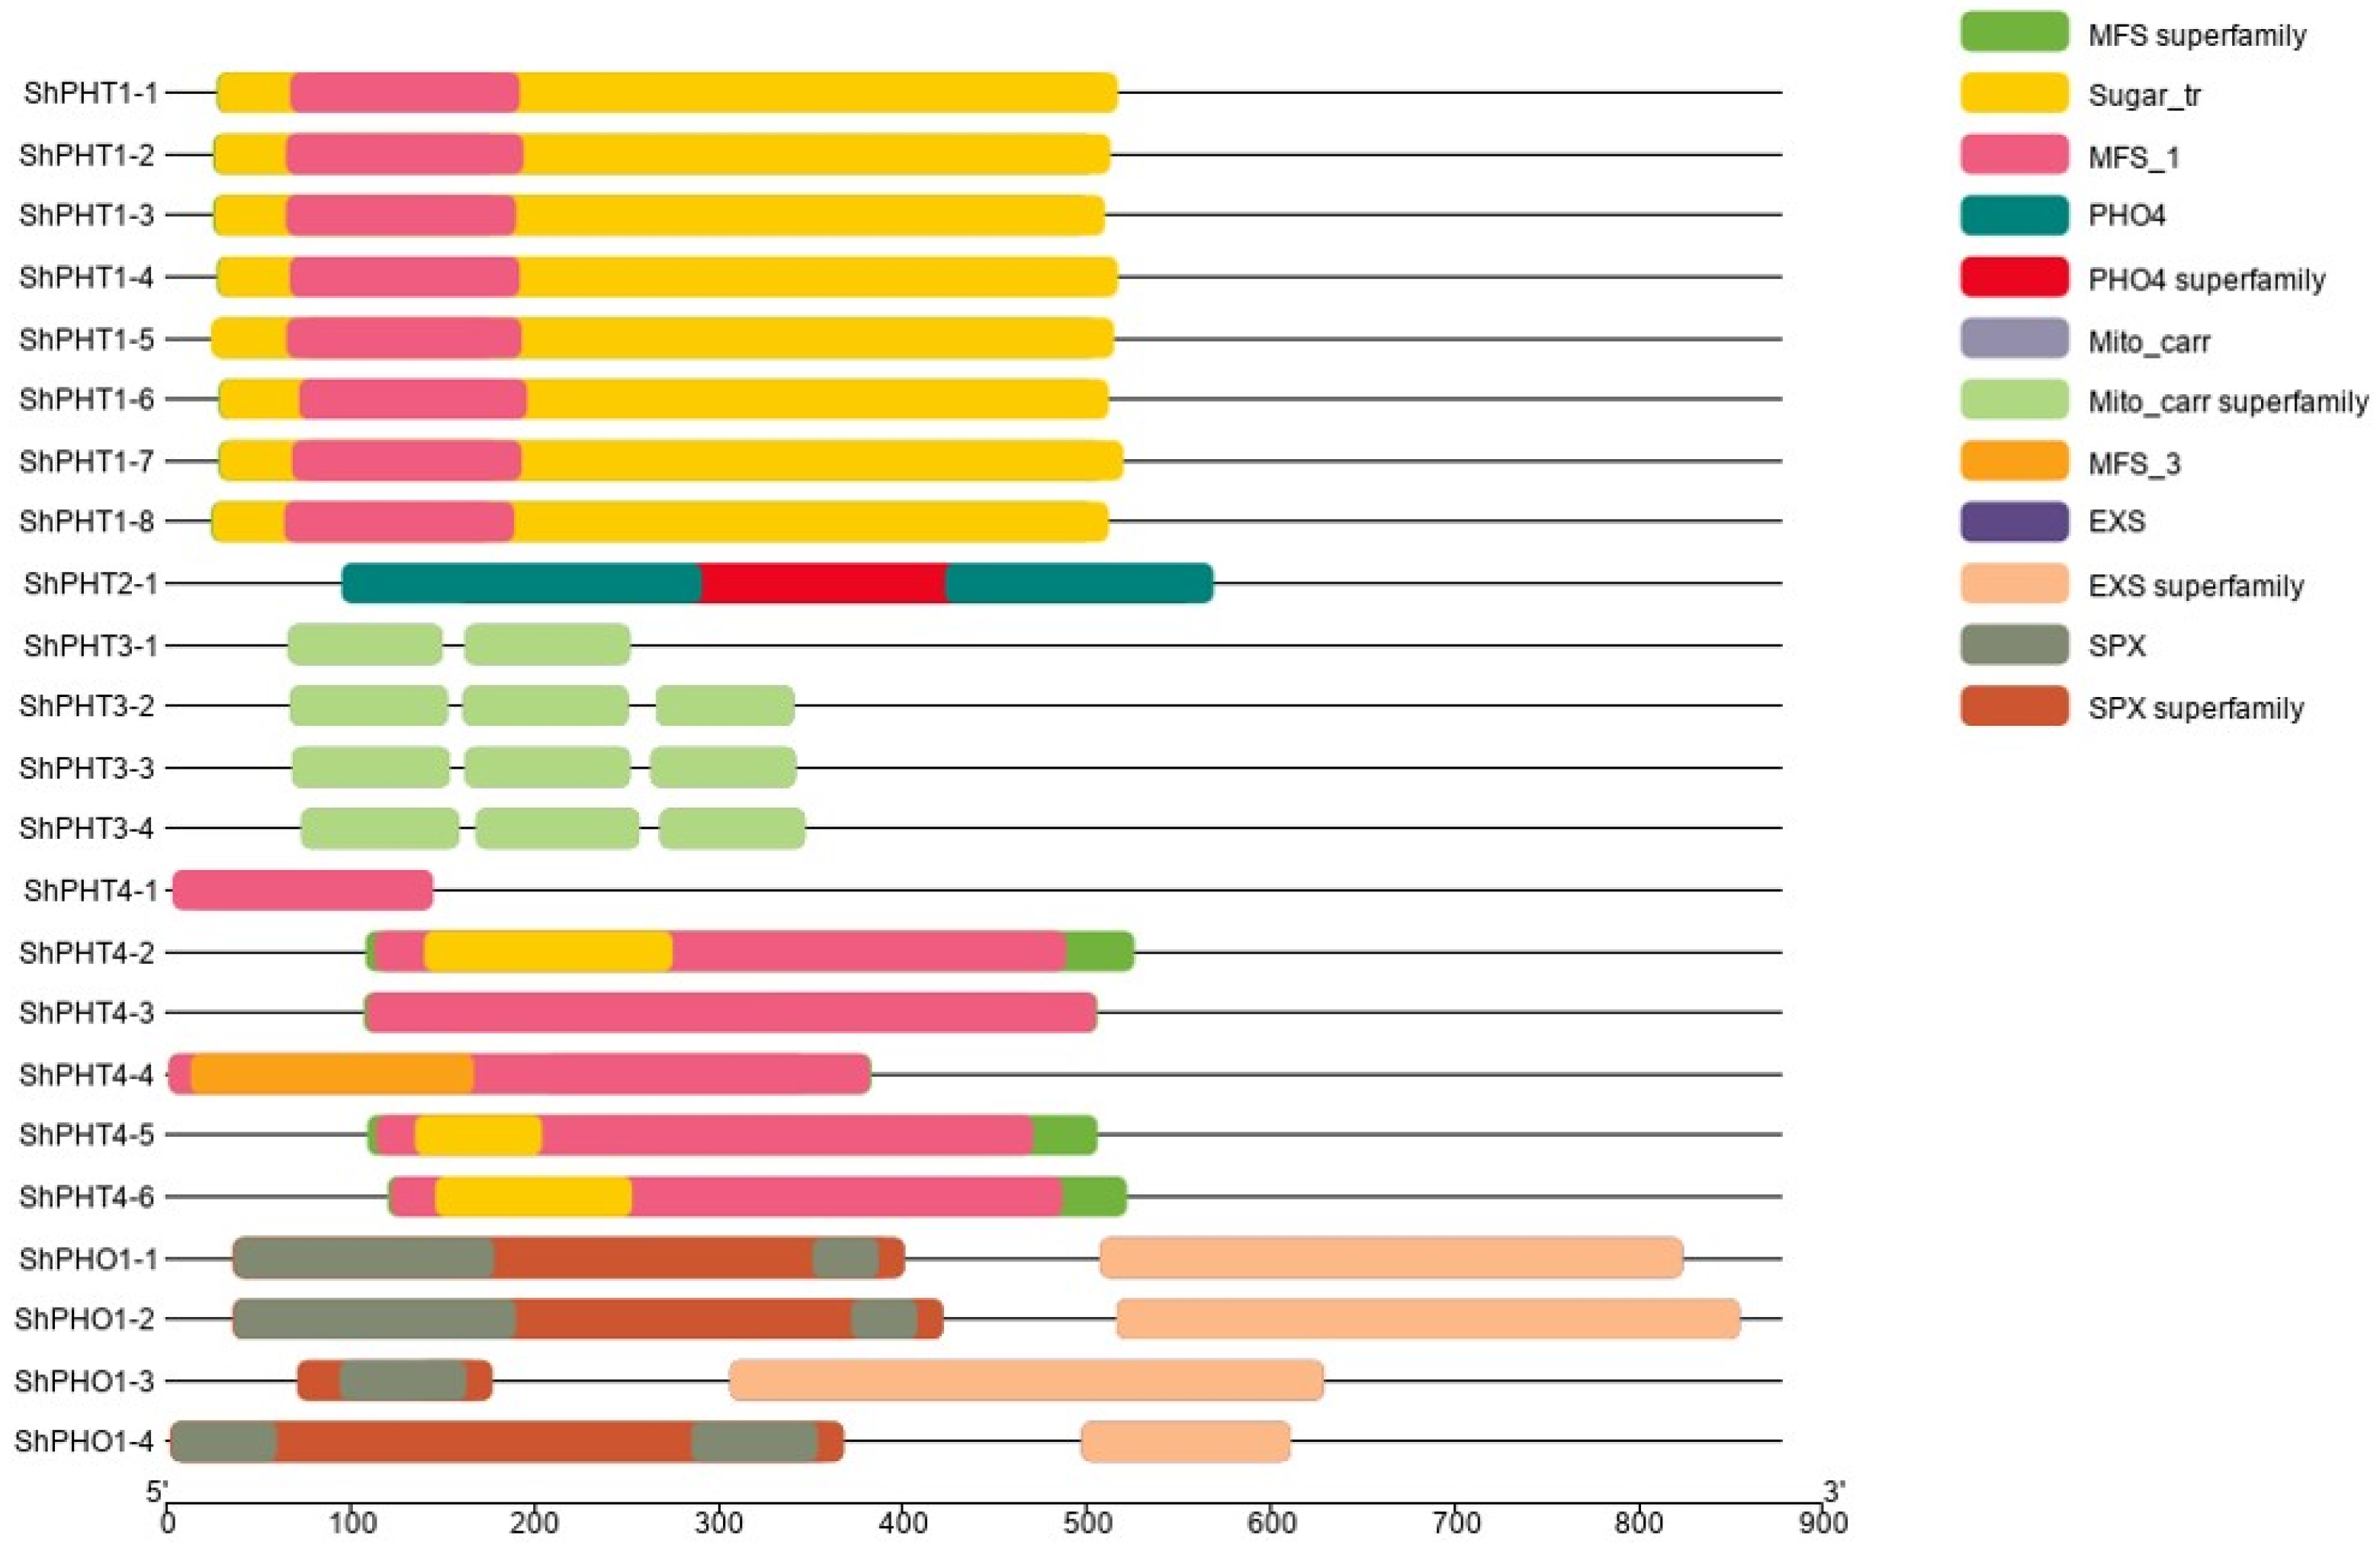
3.1. Identification and Characterization of PHT Genes in Sugarcane

A total of 23 putative PHT genes were identified in the sugarcane genome (Saccharum spp. hybrid (Sh) cultivar R570) (Table 1) using keyword search and BLASTP search against the PHT gene families of the Arabidopsis thaliana (TAIR10), Zea mays (Zm-B73-REFERENCE-NAM-5.0), and Sorghum bicolor (v3.1.12) genomes as a background database. Based on conserved domain analysis, the highly conserved domains of PHT proteins were MFS_1 (Major Facilitator Superfamily), the sugar transport domain in PHT1, the PHO4 (PHOSPHATE4) domain in PHT2, the mito_carr domains in PHT3, MFS_1, and MFS_3, the sugar_tr domains in PHT4, and the EXS superfamily, SPX, and SPX superfamily domains in PHO (Figure 1). Physio-chemical and biochemical analyses of the ShPHT proteins were characterized using ProtParam, and the results are presented in Table 1. We found that the Saccharum spp. hybrid has mostly positively charged amino acids in ShPHT proteins ranging from 216 to 877 aa, with an estimated molecular weight of 23.926 to 99.766 kDa. The instability index of ShPHT proteins varied from 23.1 to 48.94, while their aliphatic index ranged from 84.38 to 107.9. Furthermore, the ShPHT proteins’ GRAVY ranged from −0.137 to 0.707, and their pI (theoretical isoelectric point) ranged from 7.13 to 10.04, showing that most proteins are alkaline, with one protein ShPHT4-2 being slightly acidic (6.76).

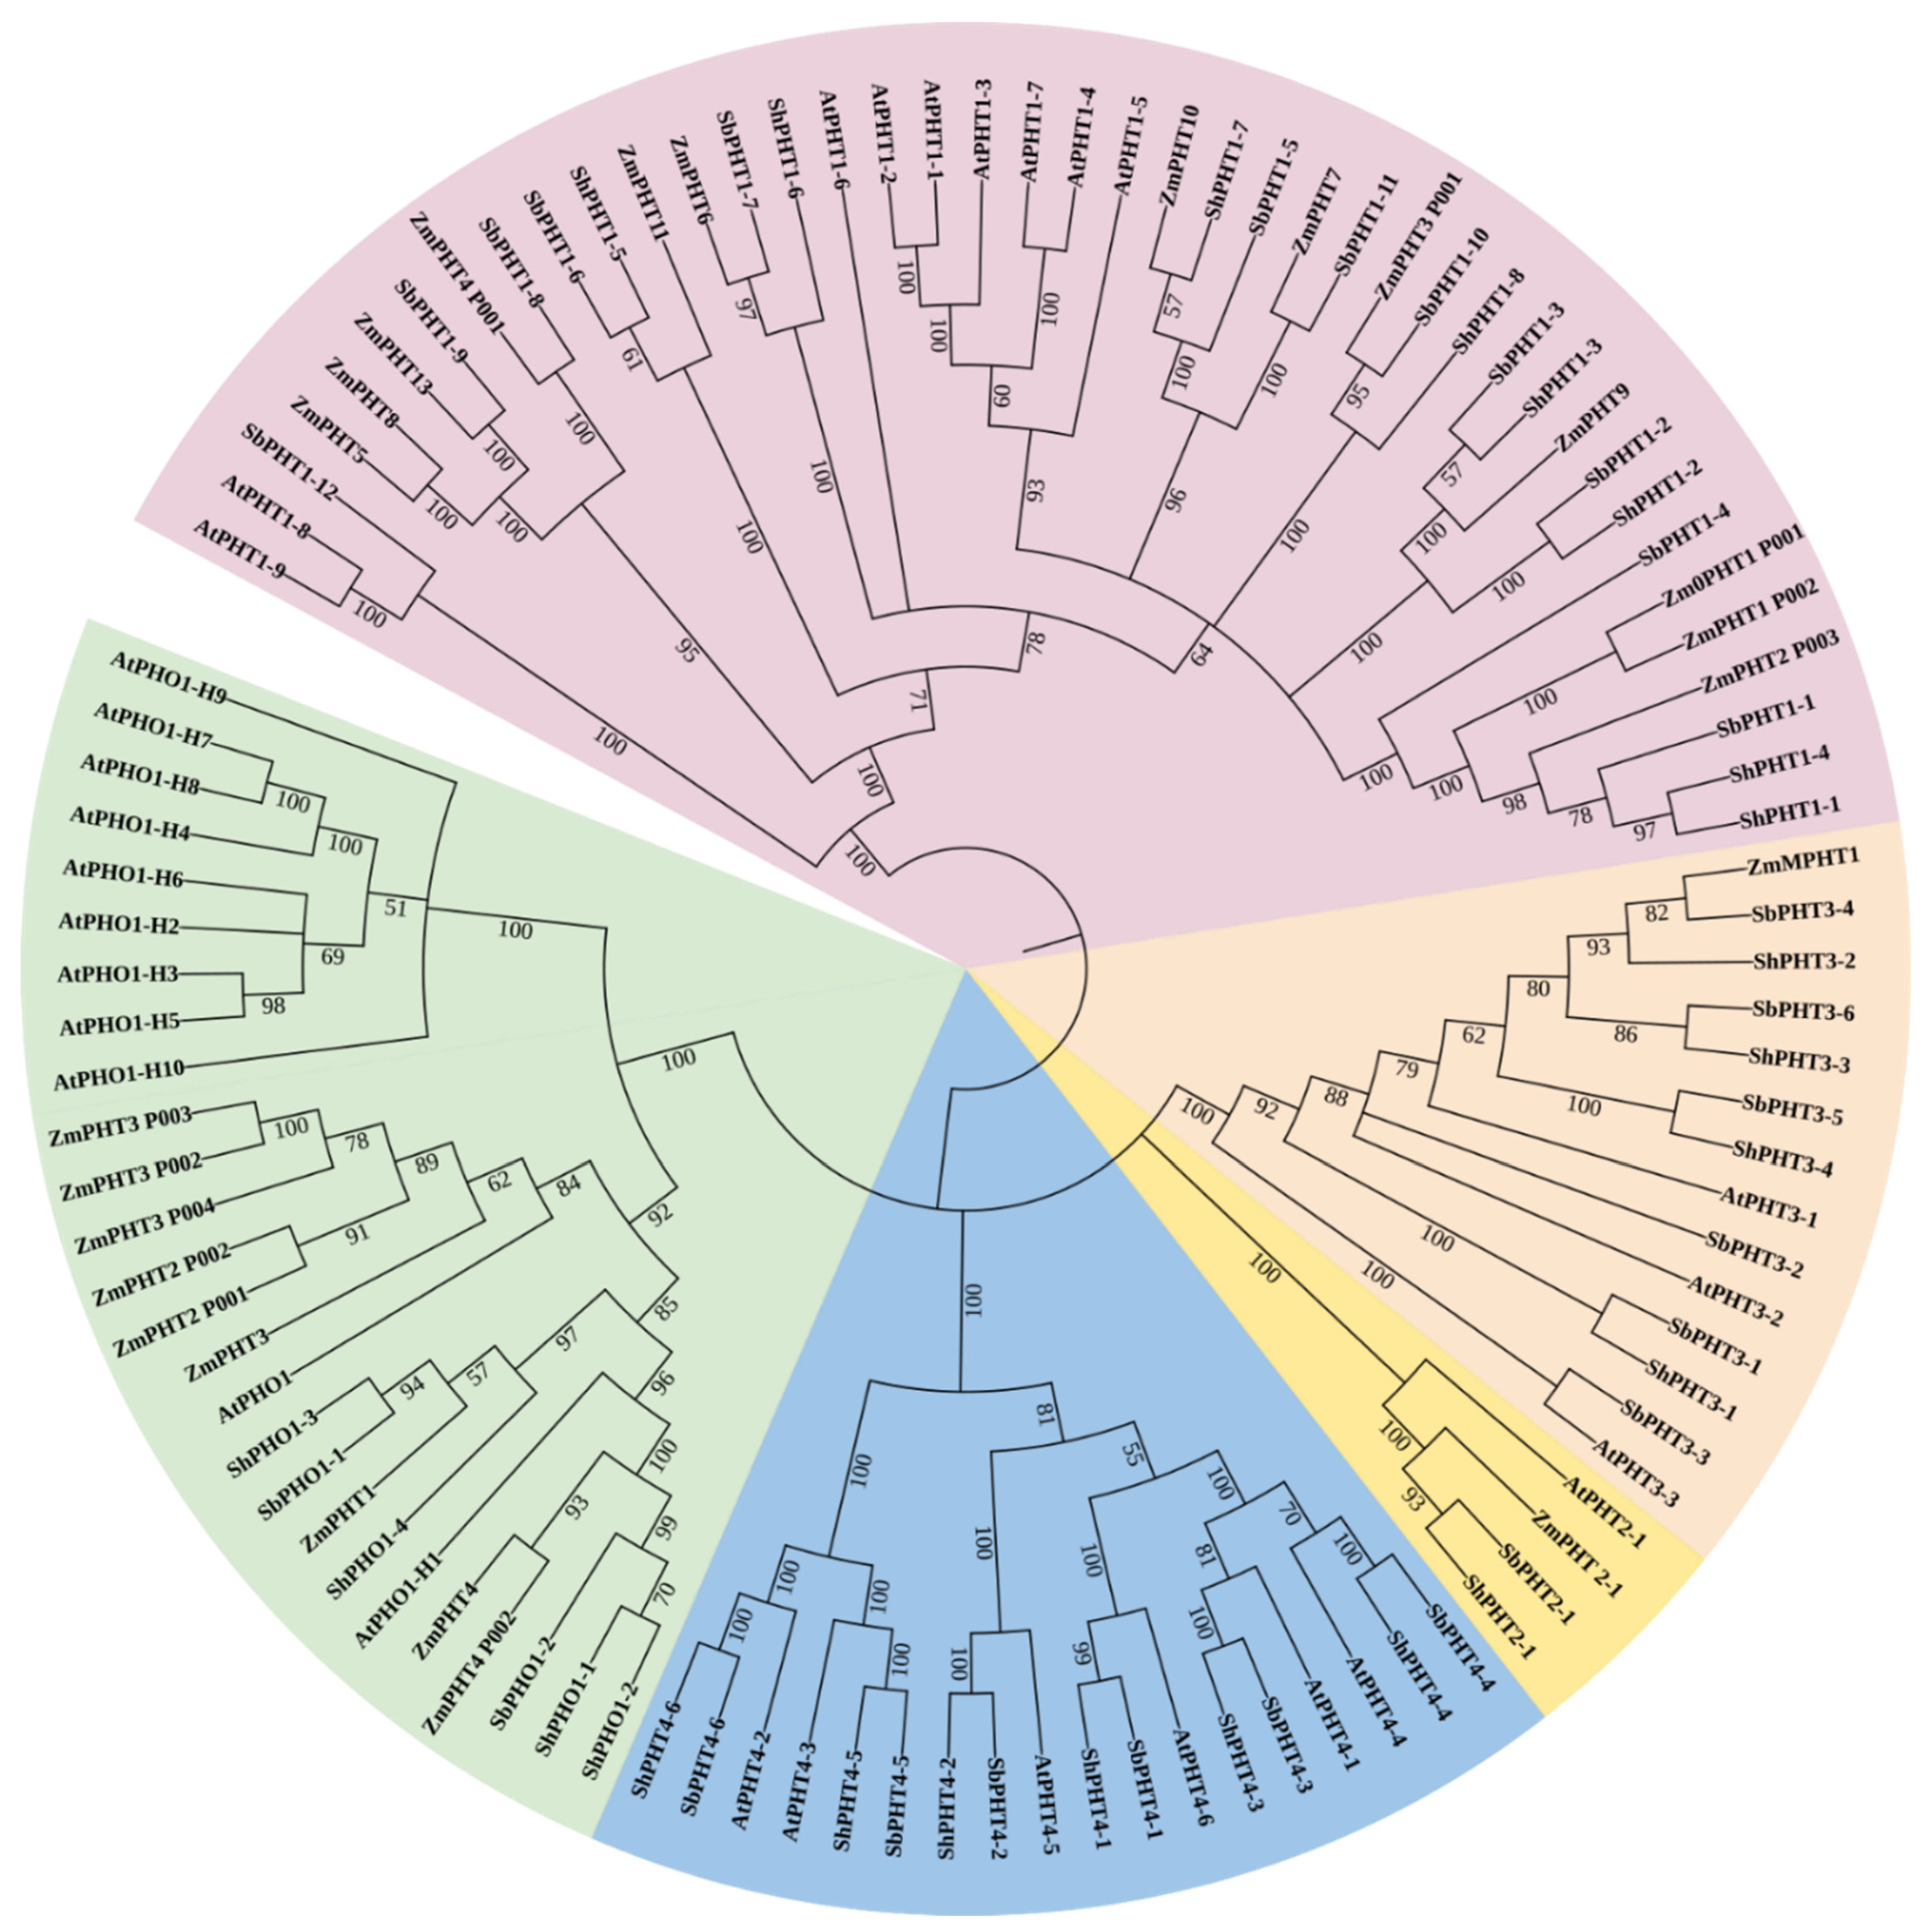
3.2. Phylogenetic Analysis

To understand the evolutionary relationship of PHT family genes, the amino acid sequences of 18 A. thaliana, 24 Z. mays, 27 S. bicolor, and 23 Saccharum spp. hybrid members were used to construct an unrooted neighbor-joining (NJ) tree. Through phylogenetic analysis, we discovered that the PHT gene family is divided into five clades (Figure 2). Clade I contains the most members, with 42 PHT proteins, 13 ZmPHT, 12 SbPHT, 9 AtPHT, and 8 ShPHT (ShPHT1-1 to ShPHT1-8) members. Clade II contains 13 genes. All genes in the PHT4 subfamily occupied Clade IV. Clades I and II both had 100% bootstrap support, and their members are highly conserved. Clades III, IV, and V consist of members of PHT3, PHT2, and PHO1. It is interesting to note that the proteins of PHT1 are closely related among monocot species rather than A. thaliana, suggesting that they diverged from a common ancestor.

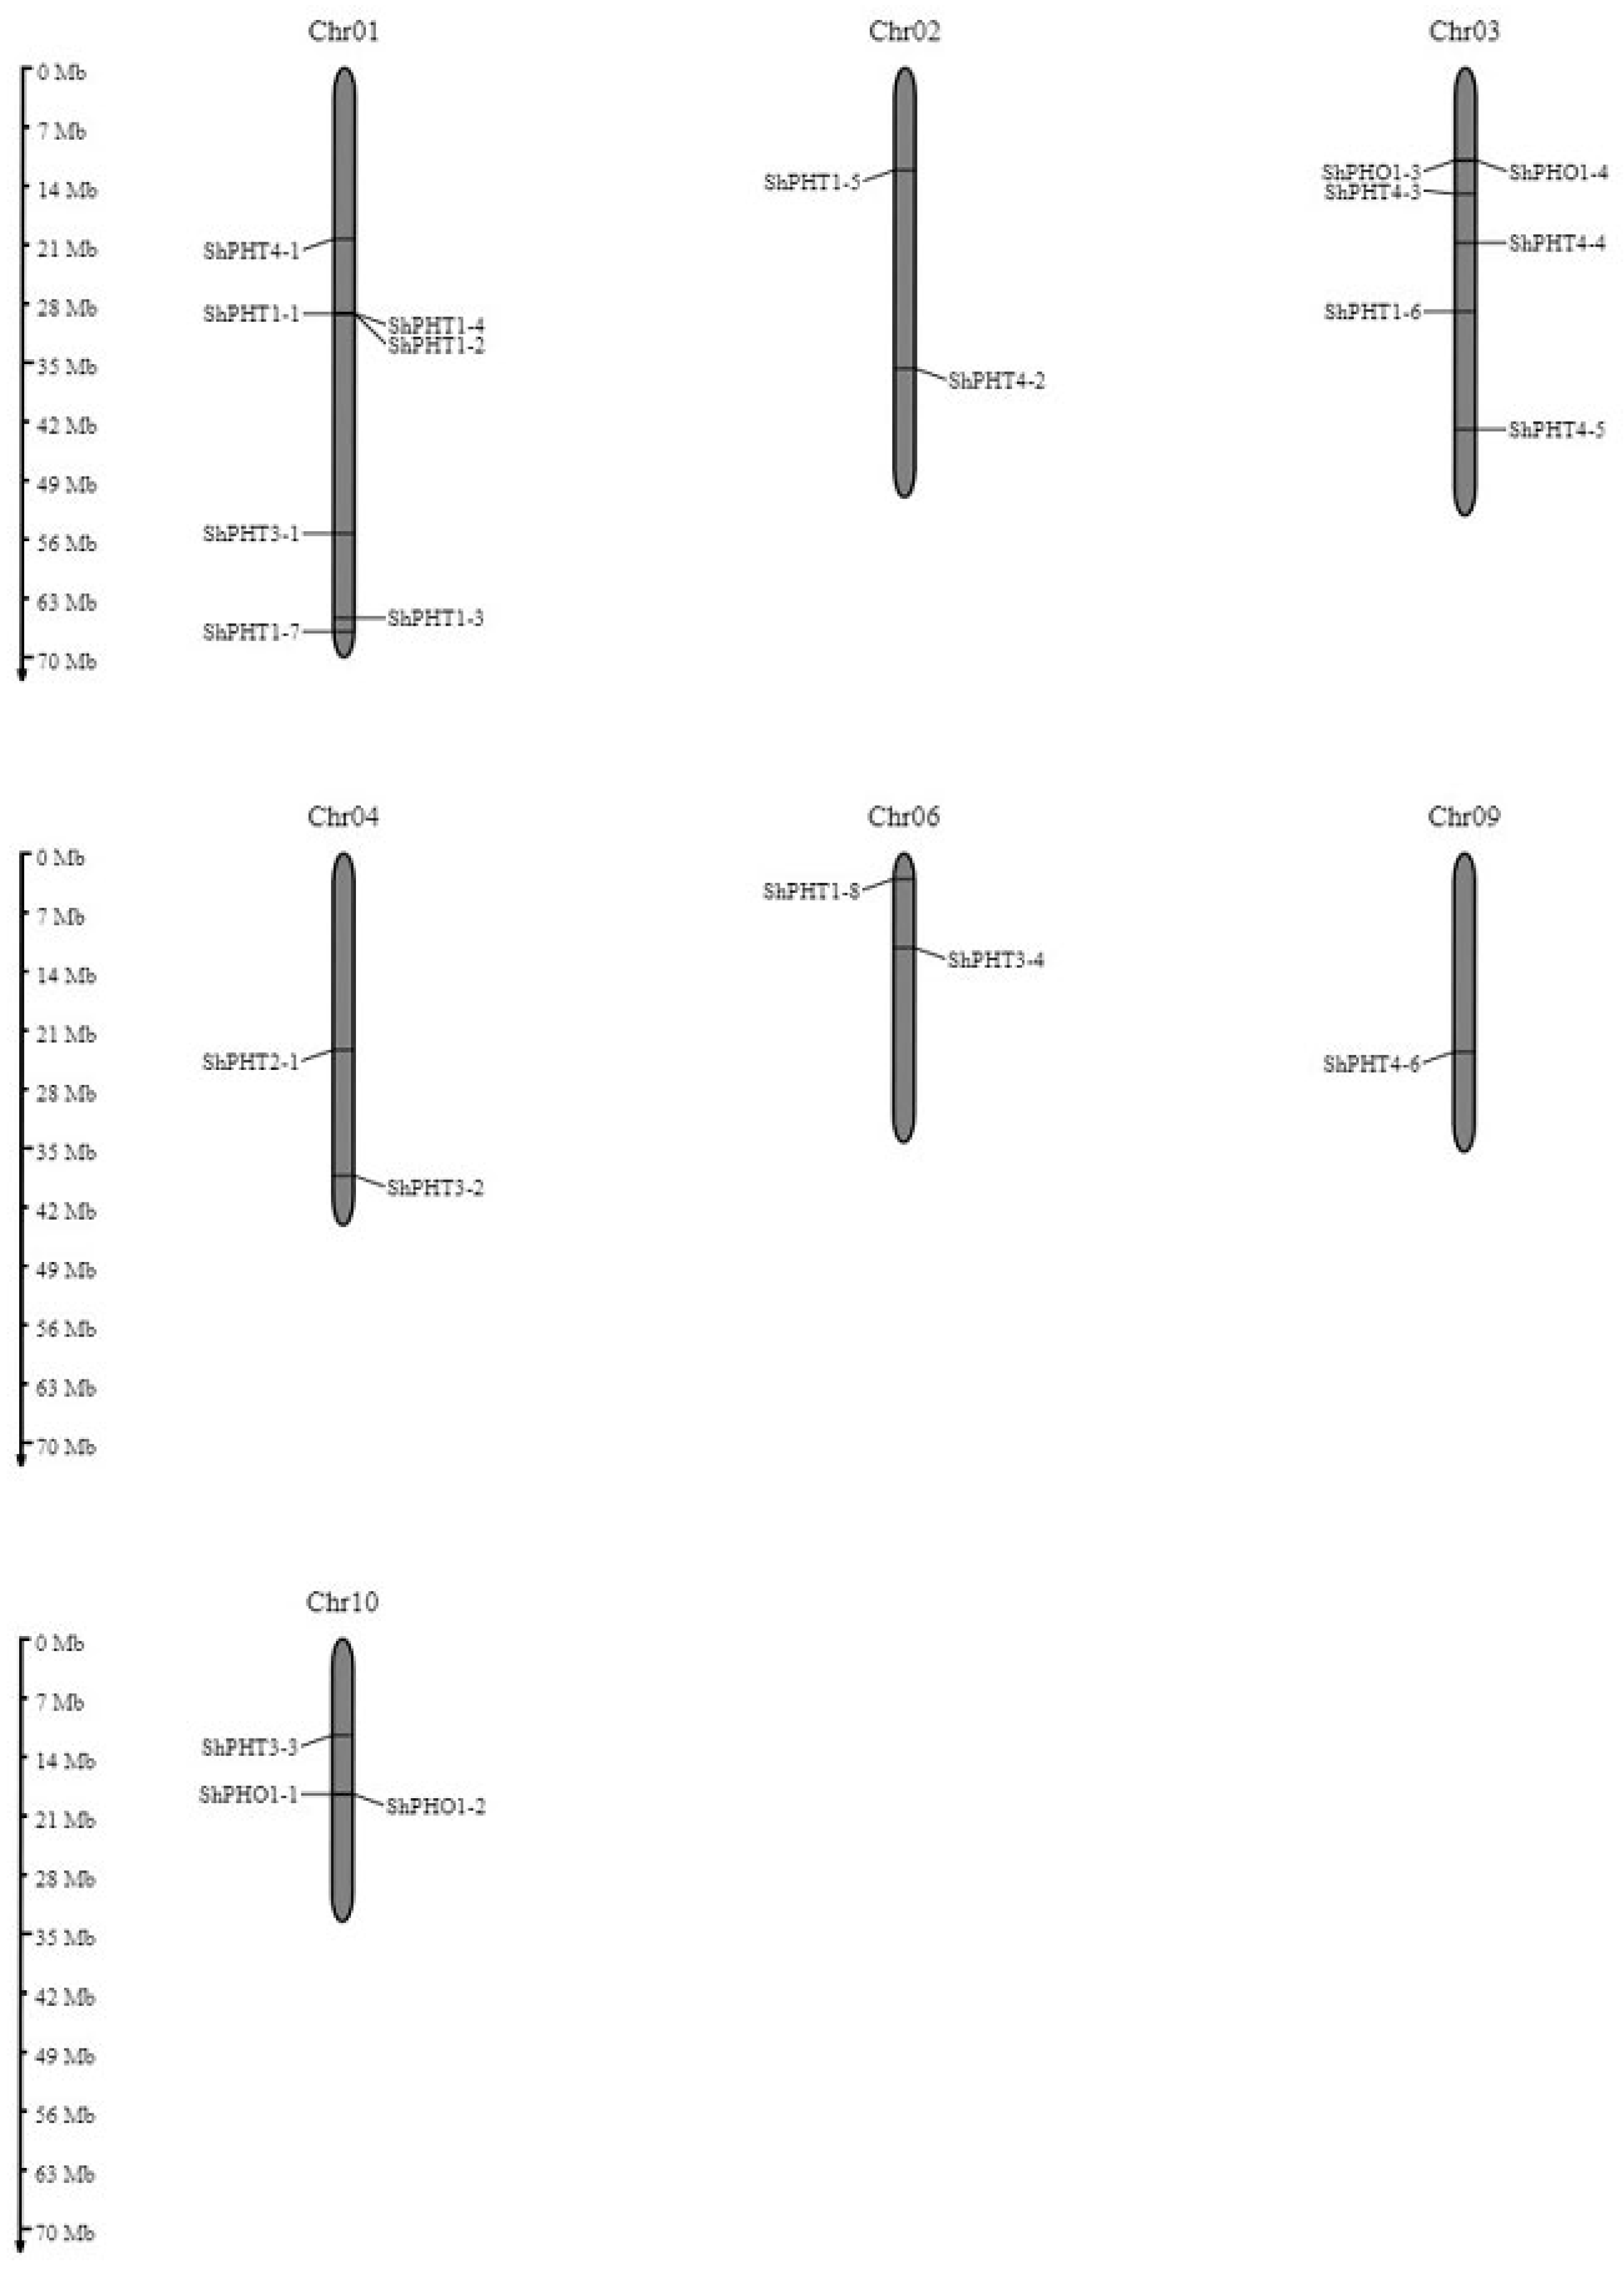
3.3. Chromosomal Localization and Duplication of ShPHT Genes

The chromosome locations of 23 ShPHT genes were mapped on their corresponding chromosomes using the MapGene2chromosome webserver (Figure 3). The results showed that the maximum number of ShPHT genes are localized on chromosome 1 (seven genes) and chromosome 3 (six genes). Out of the seven genes on chromosome 1, five belong to the PHT1 subfamily. To investigate the evolution process among the ShPHT genes, we computed the evolutionary rates and selective pressure utilizing the Ka (non-synonymous), Ks (synonymous), and Ka/Ks (non-synonymous/synonymous) ratio (ω). A total of seven pairs of duplicated gene clusters (Table 2) were identified and were linked on chromosome 1 (ShPHT1-1/ShPHT1-4; ShPHT1-2/ShPHT1-3), chromosome 3 (ShPHO1-3/ShPHO1-4; ShPHT4-3/ShPHT4-4), and chromosome 10 (ShPHO1-1/ShPHO1-2). The Ka/Ks ratios of the gene pairs ranged between 0.037 and 0.3651 and were <0.5, showing that their development is strongly influenced by purifying selection. The estimated divergence time between the duplication of the gene pairs showed that ShPHT in Saccharum spp. hybrid cultivar R570 occurred approximately between 1.1 Mya and 6.53 Mya (million years ago), with an average age of 1.13 Mya (Table 2).

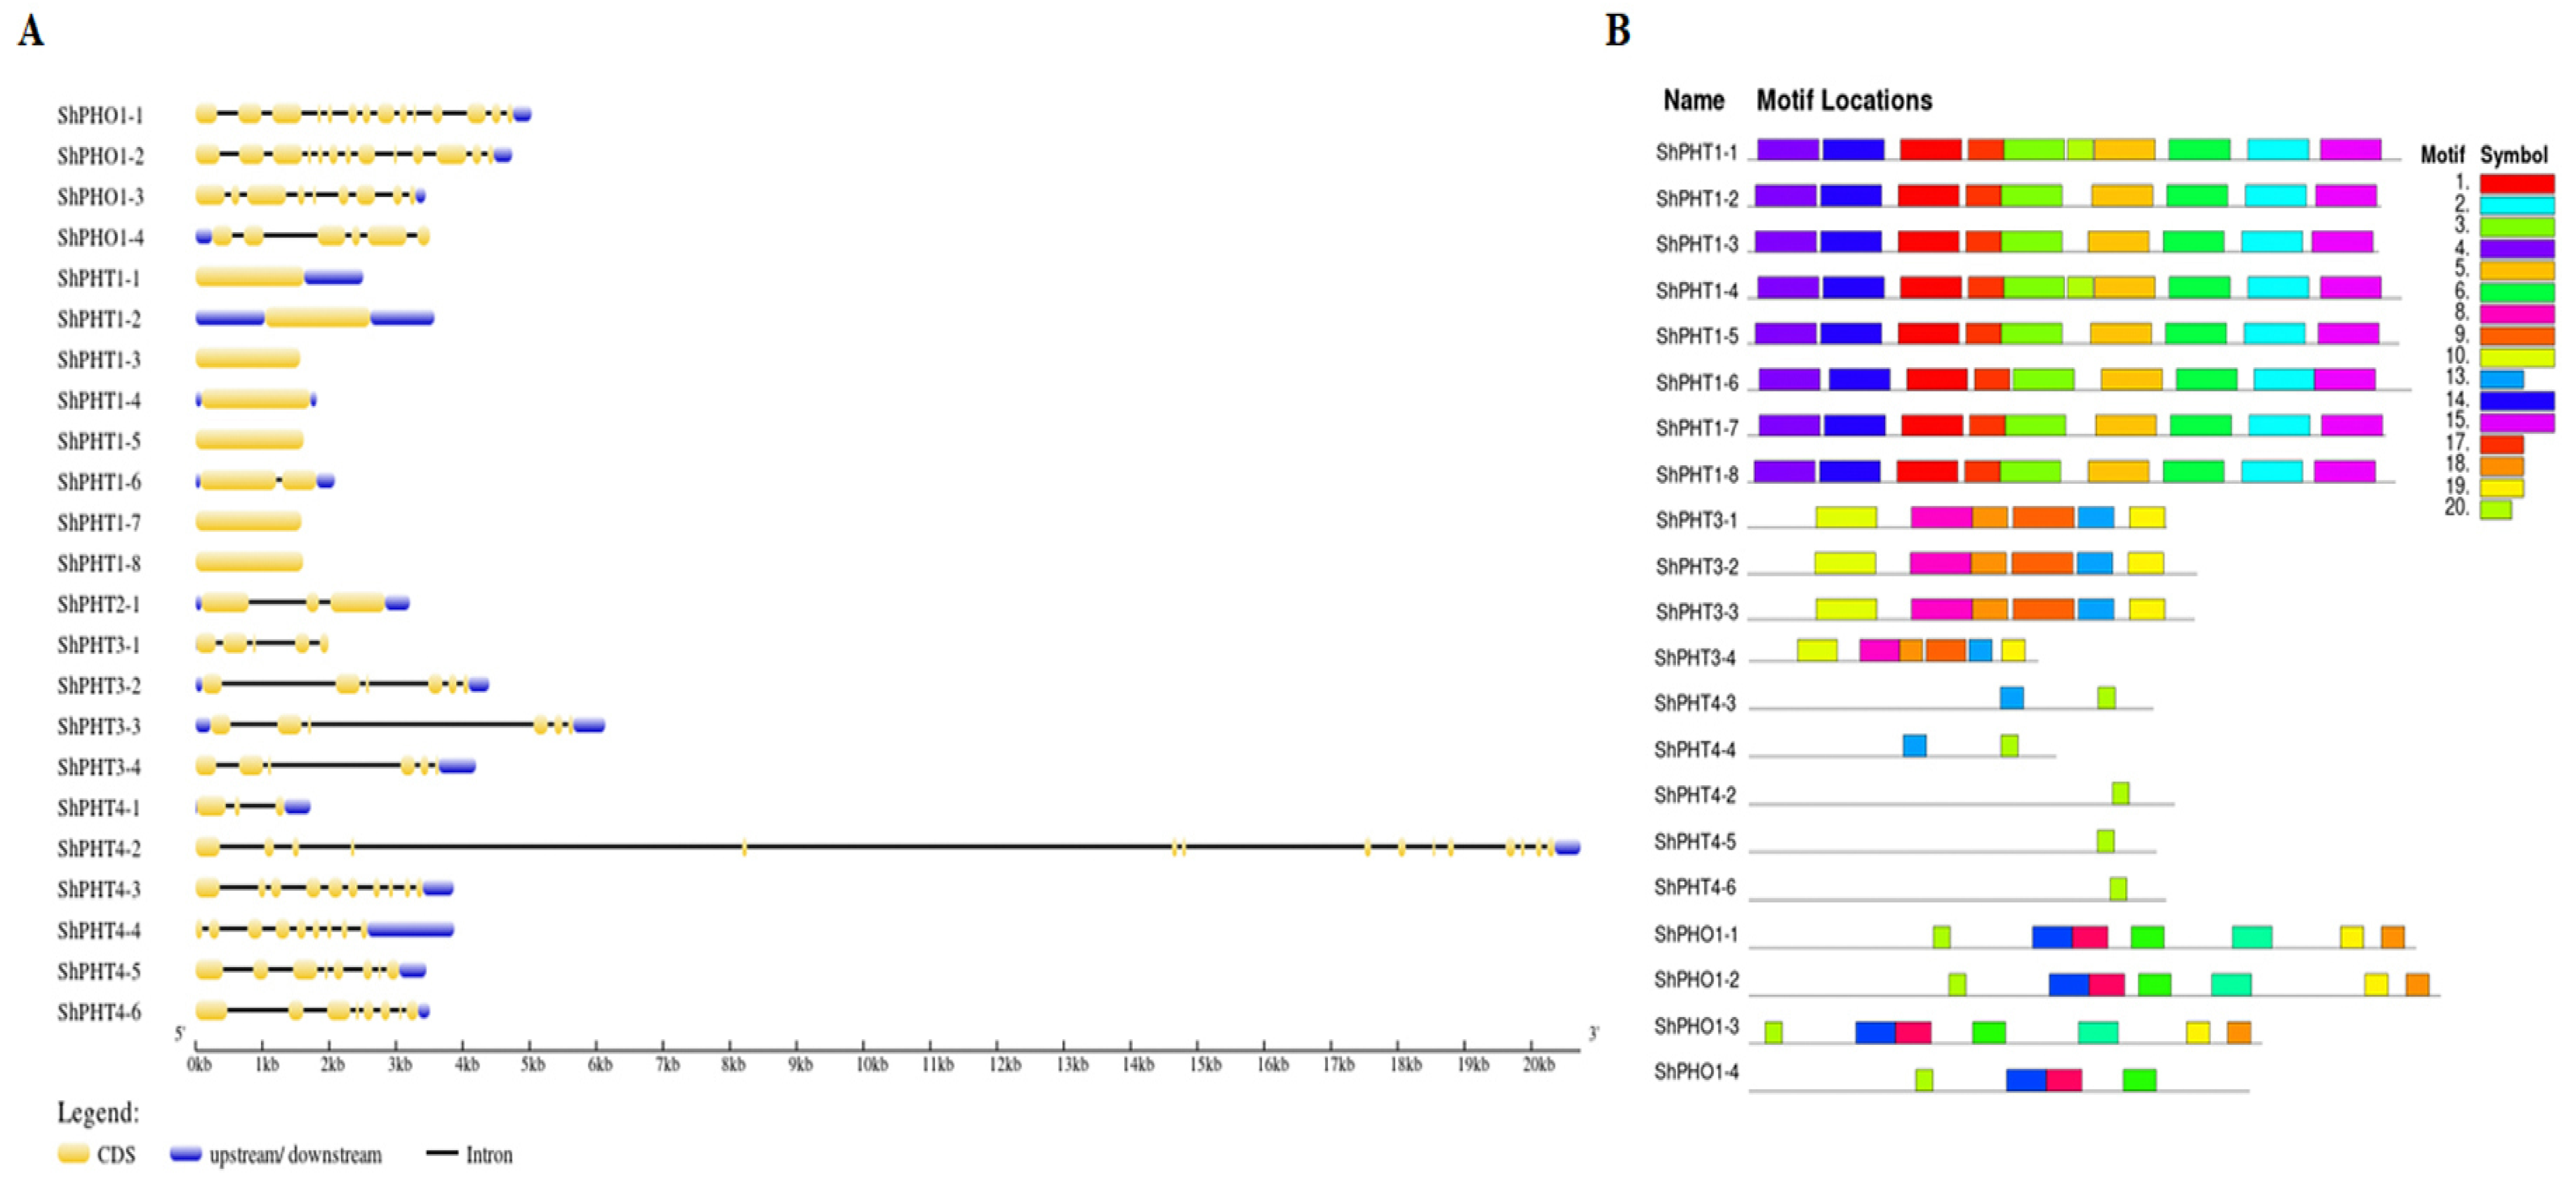
3.4. Gene Structure and Conserved Motif Analysis

To acquire insights into the structural evolution of the ShPHT gene family, exon/intron structure was derived based on their coding and genomic regions (Figure 4A). The results revealed that the number of exons in the ShPHT gene varied substantially from 1 to 14 exons. Excluding ShPHT1-6, seven genes in ShPHT1 contain one exon, whereas one gene, ShPHO1-1, has 14 exons. In particular, the ShPHO1 and ShPHT4 subfamily genes contain more introns. This finding indicates a high degree of divergence among the ShPHT genes. To reveal the conserved motifs of ShPHT genes more comprehensively, the MEME web server was utilized to estimate the pattern of conserved motifs. The results showed that 20 putative conserved motifs were identified in the ShPHT proteins (Figure 4B), and the conserved motifs ranged from 21 to 50 amino acids in length (Table S1). Each ShPHT protein had between one and ten conserved motifs; however, two genes ShPHT2-1 and ShPHT4-1 were not identified as containing any motifs. The vast majority of members of ShPHT1-1, ShPHT1-2, ShPHT1-4, ShPHT1-5, ShPHT1-6, ShPHT1-7, and ShPHT1-8 contained mostly motif 10. However, ShPHT4-2, ShPHT4-5, and ShPHT4-6 contained only one conserved motif 20. ShPHT4-3 and ShPHT4-4 contained two conserved motifs 19 and 20. Motif 13 and motif 20 were commonly distributed in most of the members of the ShPHT3, ShPHT4, and ShPHO1 families, resulting in the motifs being conserved domain sequences.

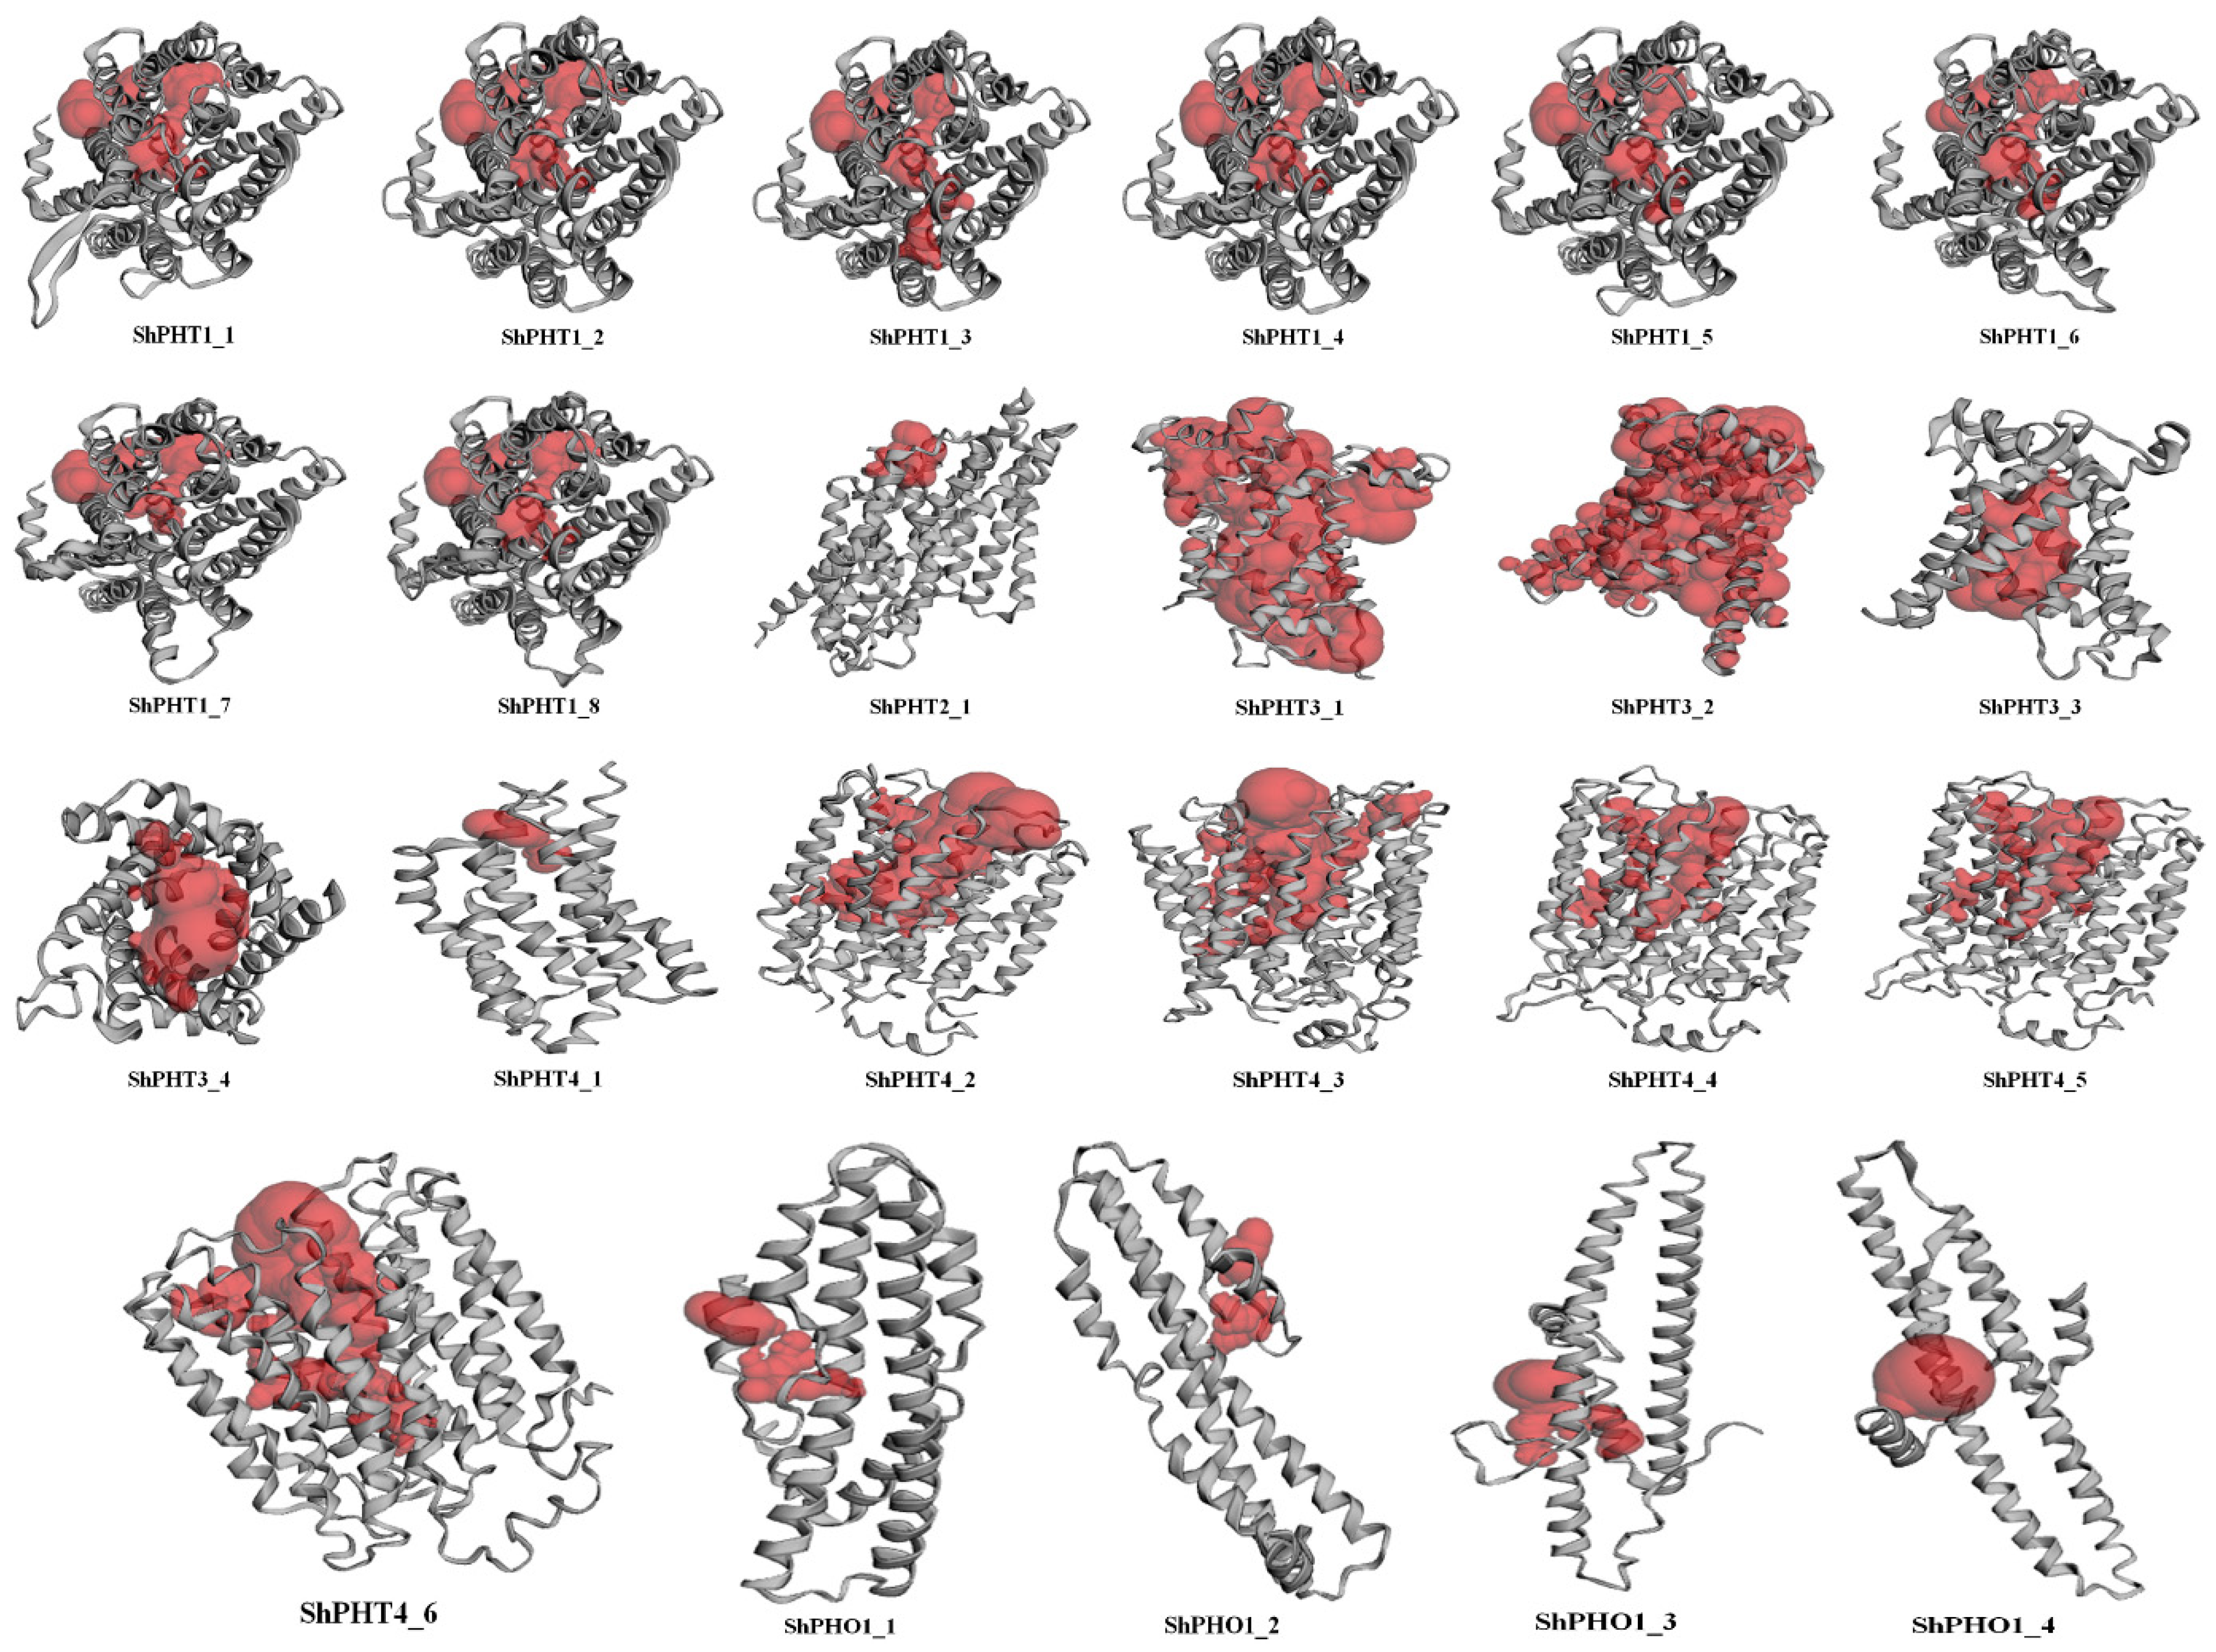
3.5. Structure and Protein Pocket Sites Prediction

The secondary structure prediction showed that the main components of ShPHTs are the alpha helix (46.93%) and the random coil (15.54%). The presence of extended strand ranges from 8.82 to 20.37%, followed by beta-turn ranging from 2.72 to 7.75% (Table S2). The ShPHT proteins’ three-dimensional structures were generated using the Phyre2 web server. For structural prediction, models with high confidence and identity percentage were chosen. All of the 3D protein models were built with 99.8 to 100 percent confidence, and the residue coverage ranged from 72 to 98 percent. The molecular binding pockets vital for protein interaction were detected using the CASTp 3.0 server. The active catalytic sites involved in ligand binding are highlighted as red in the ShPHT structures (Figure 5). The amino acid residues arginine (ARG), alanine (ALA), leucine (LEU), serine (SER), valine (VAL), glycine (GLY), phenylalanine (PHE), glycine (GLY), threonine (THR), isoleucine (ILE), and cysteine (CYS) were the more functionally substantial residues localized in this region. The quality of the projected 3D models was assessed using the VADAR server and Ramachandran Plot analysis, which demonstrated that the residues in the core, favored, and generous regions surpassed 95%, indicating the quality and reliability of the protein structure.

3.6. Post-Translational Modifications, Transmembrane Domains (TMD), and Subcellular Localization of ShPHT Proteins

The post-translational modification analysis of ShPHT proteins was carried out in terms of phosphorylation and glycosylation. ShPHT proteins have 19 to 72 sites for potential phosphorylation modifications (Figure S2). Most of the phosphorylation events were predicted to be related to serine (554), followed by threonine (330) and then by tyrosine (100). The proteins ShPHO1-2 and ShPHO1-1 showed a maximum of 72 and 71 potential phosphorylation sites. In ShPHT4-1 and ShPHT3-1 protein, 19 and 23 sites were predicted, whereas in other proteins phosphorylation events ranged from 28 to 66 sites (Table S3). In addition, the N-linked glycosylation pattern on ShPHT proteins was analyzed; the results predicted a total of 41 N-glycosylation sites (Figure S2). Among these N-glycosylation sites, seven amino acid residues were NSTT, four residues were NSSD, and three residues were NVSA, two (NSTV, NLTE, NNST, NSTG, NYTF, NSSS, NKTK) and one (NITR, NLTQ, NLTL, NQTG, NSTV, NKTK), respectively. Except for ShPHT2-1, ShPHT3 members, ShPHT4-1, and ShPHT4-6, all other ShPHTs showed at least one N-glycosylation site. The proteins ShPHO1-1 and ShPHO1-2 were predicted to have five glycosylation sites, while one glycosylation site each was predicted in ShPHT1-5, ShPHT4-3, and ShPHT4-4 (Table S3). Transmembrane domains in ShPHTs were predicted, and ranged from 0 to 13. ShPHT2-1 had the most TMDs, while the members of the ShPHT3 genes had no potential TMDs. Meanwhile, the ShPHT1 proteins showed that most TMDs with 11 or 12 transmembrane domains; ShPHT4 and ShPHO1 had 5-11 and 4-6 TMDs, respectively (Table 1). Subcellular location analysis showed that most ShPHT1, ShPHO1-3, and ShPHO1-4 are localized in the plasma membrane, while the ShPHT2-1 and ShPHT3-4 proteins are localized in the chloroplast and ShPHT4-5 is localized in the chloroplast/mitochondria (Figure S1).

3.7. GO and KEGG Analysis

To predict the function of ShPHT proteins, gene ontology (GO) annotation analysis was performed. A total of seventeen distinct functional groups were identified: nine ShPHT proteins are associated with biological processes (BF), five are involved in molecular functions (MF), and three are involved in cellular components (CC) (Table S4). In the MF processes, “inorganic phosphate transmembrane transporter activity and symporter activity” (GO: 005315 and GO: 0015293) are highly enriched GO terms. Similarly, among BP and CC, transmembrane transport (GO: 0055085), response to stimulus (GO: 0050896), and integral component of membrane (GO: 0016021) are the top GO terms. Additionally, in the KEGG analysis, most of the target genes were categorized into signaling and cellular process related to phosphate transport (Table S5).

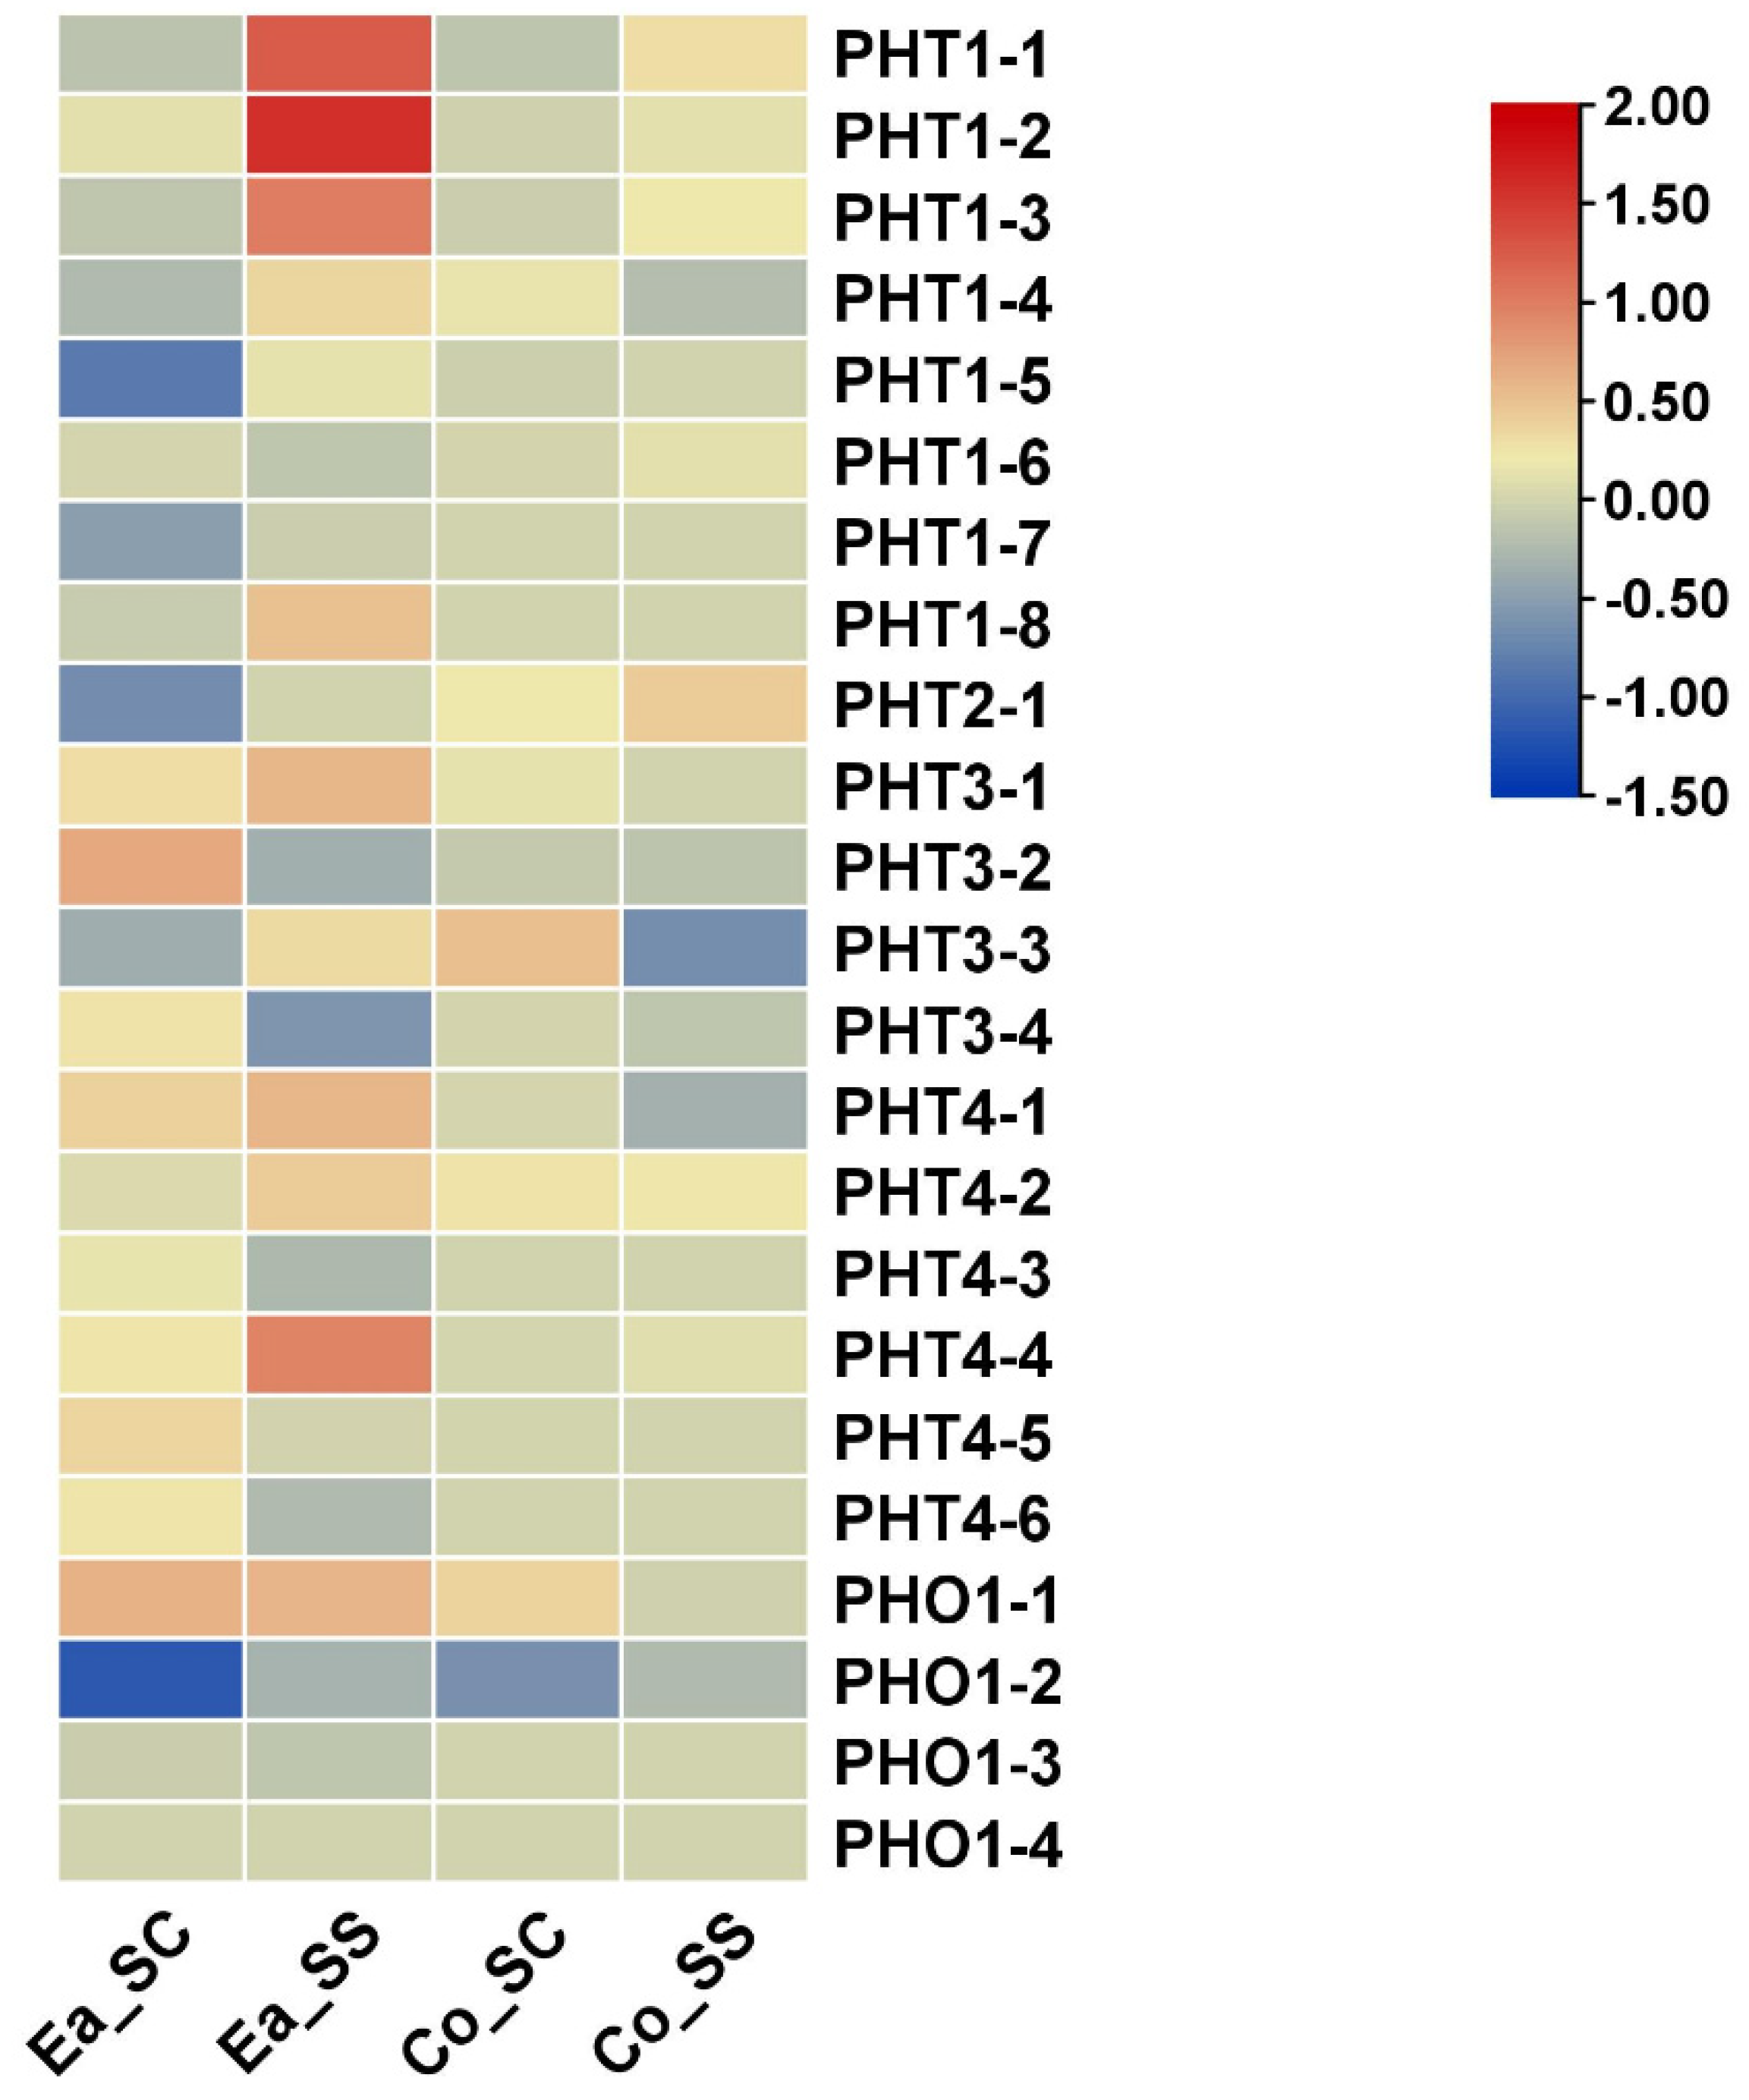
3.8. Expression Analysis of PHT Genes under Salinity Stress

To investigate the putative physiological roles of ShPHT genes, we compared the expression between a salinity-tolerant wild genotype and a salinity-sensitive commercial sugarcane variety. A total of 23 PHT genes were investigated for their relative expression levels using qRT-PCR. In the salinity-sensitive genotype, only ShPHT1-4 and ShPHT2-1 showed relatively higher expression; ShPHT1-1, ShPHT1-2, ShPHT1-3 genes were slightly upregulated and other genes showed either stable or slightly decreased expression. The ShPHT1-1, ShPHT1-2, and ShPHT1-3 genes were predominantly expressed in both genotypes, though their expression was dramatically induced under salt stress (Figure 6; Table S6)). Furthermore, in the wild genotype all seven ShPHT1 subfamily members exhibited differential expression, while ShPHT1-6 had no significant change under salinity treatment. In the ShPHO1 subfamily, ShPHO1-2, and ShPHO1-3 were upregulated in the wild genotype in comparison to the sensitive cultivar. These findings show that these upregulated genes may be involved in modulating sugarcane stress responses to salinity.

3.9. Putative cis-Regulatory Element Analysis

To further investigate the transcriptional mechanism of ShPHTs, the cis-acting regulating elements situated 2000 bp upstream from the transcription start site (TSS) of 23 ShPHT genes were analyzed. The results showed 147 types of 11490 cis-acting elements (Table S7). Several cis-acting regulatory elements related to cell and developmental elements, light-responsive elements, stress-responsive elements, hormone-responsive elements, and tissue/organ-specific elements were discovered in the promoter region (Figure 7A). We mainly characterized these into three categories. First, for the cis-elements related to P response (P1BS—PHR1-binding sites), the P1BS element was present in the all promoter regions of ShPHTs. ShPHT1-7 had 18 P1BS, while another gene in the ShPHT1 family ranged from 3 to 10 and other genes such as PHT2, PHT3, PHT4, and PHO had 2 to 9 of the P1BS elements. Elements related to abiotic stress were predicted in six categories, of which the ABRE (ABA-responsive element), MYB (drought responsive), DRE (dehydration-responsive), and GT-1 (salt-induced) components are relatively large (Figure 7B). Cis-elements related to tissue-specific expression are associated with, leaf expression (DOFCOREZM and GT1CONSENSUS), root expression (ACGTROOT1, OSE1ROOTNODULE, OSE2ROOTNODULE, LEAFYATAG, RAV1AAT, and RHERPATEXPA7), flower expression (AGAMOUSATCONSENSUS, AGL2ATCONSENSUS, CARGATCONSENSUS, and CARGATCONSENSUS), pollen expression (QELEMENTZMZM13 and PSREGIONZMZM13), and seed expression (PROXBBNNAPA, RYREPEAT4, RYREPEATLEGUMINBOX, SEF4MOTIFGM7S, CAATBOX1, and SPHZMC1). The presence of the majority of these cis-acting regulatory elements in ShPHT gene promoter demonstrates their importance in the regulation of the PHT gene family in phosphate transport, distribution, and tissue-specific expression under biotic/abiotic stress conditions (Table S7). Transient expression analysis using a GUS assay of EaPHT1; 2-GUS in sugarcane leaf bits (Figure 7C) provided rapid analysis of promoter efficiencies in expression of downstream Pi-responsive genes.

4. Discussion

Phosphate is an essential nutrient involved in plant growth and metabolism. In plants, PHT genes accomplish Pi uptake and translocation. To date, members of the PHT protein family have been reported in many plant species, including barley, rice, soybean, tomato, foxtail millet, maize, poplar, potato, wheat, apple, sorghum, rapeseed, camelina, duckweed, capsicum, salt cress, and tea [7,8,9,41,42,43,44,45,46,47,48,49,50,51,52,53,54,55]. However, a detailed study of the sugarcane PHT gene family has not yet been reported. Sugarcane is an important commercial crop grown worldwide for sugar and ethanol production. Environmental stresses are the major limitation on crop productivity, and result in significant yield losses. In addition, sugarcane production is influenced by various unfavorable abiotic factors, namely, temperature, salt stress, nutritional deficits, and drought, which directly affect plant growth and culminate in shoot and root growth reduction [15]. The combination of salt and P deficiency is recognized to be most detrimental to plant health. One of the key ways to increase salt tolerance and production is to manage mineral nutrients in order to reduce salt-induced nutritional problems in plants. Less P availability, increased P fertilizer cost, and worse plant P usage efficiency all justify the need to investigate the phosphate transporter gene family in sugarcane [12].
Recent advances in sugarcane genome sequencing have made it possible to conduct a wide-ranging in silico analysis of the sugarcane ShPHT gene family in reference to A. thaliana, Z. mays, and S. bicolor genomes. In the present study, the sugarcane Saccharum spp. hybrid R570 genome was analyzed to identify the genes encoding PHTs. A total of 23 ShPHT genes were identified in the Saccharum spp. hybrid genome, including eight PHT1, one PHT2, four PHT3, six PHT4, and four PHO1 genes. Consistent with previous reports, the number of PHTs in sugarcane was less than that in the rice, poplar, apple, and sorghum genomes [8,42,46,49]. The phylogenetic relationship revealed that the prevalence of individuals in different subfamilies is quite similar in sugarcane, sorghum, and Z. mays (Figure 2). It has been proposed that proteins with greater homology within a class/subfamily may have comparable activities. To identify the sequence features of the putative PHT genes, the conserved domains of the PHT proteins were predicted using NCBI’s conserved domain database. Consistent with previous studies, the conserved domains found in all the proteins were confirmed as typical phosphate transporter proteins (Figure 1).
PHT1 proteins are the largest and most widely studied subfamily of plant Pi transporters. Our comparative analysis of PHT1 proteins in sugarcane revealed eight ShPHT1 subfamilies, with a conserved core motif element GGDYPLSATIxSE, twelve transmembrane (TM) domains, and predicted localization on the plasma membrane, similar to the PHT1 transporters identified from other plant species [56]. Conversely, the smallest subfamily, PHT2, is a low affinity chloroplast Pi transporter mostly reported with one PHT2 gene in many species, such as Arabidopsis, capsicum, duckweed, maize, potato, rice, wheat, Sorghum, and salt cress [57]; in very few species is it reported in more than one gene (two in poplar, tea and apple, three in Camelina and lupin, and two to four in Brassica genomes; in Camellia sinensis, no PHT2 subfamily was reported) [55]. The transmembrane domains of a protein play a crucial role in transporting various substances across the biological membranes. In sugarcane, the PHTs contain 0 to 13 transmembrane domains, similar to other crops. The PHT2 gene showed thirteen TMDs located in the chloroplast, similar to Arabidopsis, Sorghum, and Z. mays. The four PHT3s and six ShPHT4s from sugarcane are mostly related to Sorghum and A. thaliana. The ShPHT3s are located on the mitochondria, and ShPHT4s are localized mainly in chloroplast and plasma membrane. In plants, the PHO1 subfamily is another important Pi-transporter that is essential for long-distance Pi transport from roots to shoots. In Arabidopsis, eleven PHO1 genes (PHO1 with ten homologous genes) were reported to be localized on endomembrane; comparatively, in sugarcane fewer genes (four PHO1 genes) are predicted to be located on the plasma membrane [5].
The crystal structure of the plant PHT family is not yet present in the Protein Data Bank. In 2018, Kumar et al. [22] predicted the wheat PHT1 subfamily protein 3D structures with homology modelling, and recently the 3D structures of duckweed PHT proteins (PHT1 to PHT5 subfamilies) have been predicted [52]. The prediction of proteins’ 3D structure and ligand-binding sites can provide valuable information about protein function. Based on our results, arginine, alanine, leucine, serine, valine, phenylalanine, glycine, threonine, isoleucine, and cysteine were frequently found in the pocket sites of all the candidate PHT proteins, revealing their function and interaction during various environmental stimuli. GO and KEGG annotations of the PHT gene family describe contour features such as phosphate ion transport, symporter activity, inorganic anion transmembrane transport, response to stimulus, and cellular response to phosphate starvation, and further reveal the ShPHT genes encoding inorganic phosphate transporter activity functions.
PHT1 genes have been studied in numerous plants and found to have a dominant expression in the root, indicating that these genes may play a role in Pi capture and absorption. Intriguingly, the maize PHT1 subfamily genes ZmPHT1:1, ZmPHT1:3, ZmPHT1:4, ZmPHT1:8, and ZmPHT1:9 were mostly expressed in the roots [9]. In Sorghum (SbPHT1:2 and SbPHT1:11) and Arabidopsis (AtPHT1.1 and AtPHT1.4), only two genes were highly expressed in roots [8,58]. In our study, in the salinity-tolerant E. arundinaceus wild genotype (IND 99-907) the genes PHT 1-1, PHT 1-2, and PHT 1-3 were upregulated more than in the sugarcane salinity-sensitive genotype Co 97010. PHT1-2 and PHT1-3 showed higher expression in roots, demonstrating that they play a substantial role in Pi uptake from the soil and redistribution under salinity stress. The PHT2 subfamily that co-transports H+/Pi into chloroplasts might have low-affinity Pi transporters and is expressed preferentially in the shoots, especially in rosette leaves [57]. Expression of the PHT3, PHT4, and PHT5 subfamilies was widely reported in various tissues [49]. In sugarcane, the PHT4-4, PHO1-1, and PHO1-2 genes are upregulated, while other genes remain the same or have decreased expression in roots. Gene expression is highly regulated by the cis-element present in the promoter region of the gene. The cis-elements in ShPHT promoters indicate that most of the genes contain multiple cis-acting elements related to stress, hormonal, and light-responsive cis-elements (Table S7). The cis-acting elements related to the responsiveness of abiotic/biotic stresses such as MYB and MYC are highly distributed in the upstream region of sugarcane PHT genes. Earlier reports have demonstrated the involvement of the MYB-type [59], WRKY-type [60,61], and bHLH-type [62] transcription factors in regulation of PHT genes. The phosphate starvation response (PHR) and PHR1-like (PHL) protein family belongs to the MYB transcription factors, and positively regulates PHT gene expression by binding to P1BS [63]. In addition, the light-responsive cis-elements play an important role in regulating the PHR1 protein under Pi starvation [64]. In accordance with this, our study found that the P1BS element was present in all the ShPHT gene promoters, and the number of PIBS sites ranged from 3 to 18. In vitro transient expression of the EaPHT1-2 promoter confirmed its activity, providing an indication that PHT genes and promoters have high potential to regulate the cellular processes associated with salt stress resistance.

5. Conclusions

The current work is the first to provide a comprehensive analysis of the sugarcane PHT gene family in terms of evolutionary connections, gene structures, conserved motifs, cis-acting elements, and their ontology and expression patterns. The study identified 23 ShPHTs genes, which were classified into five groups (ShPHT1 to ShPHT4 and ShPHO1) based on their phylogenetic relationships. The gene structure and conserved domains of each PHTs subfamily were extremely similar to that of their orthologues in Sorghum. Expression analysis of sugarcane root-specific PHT genes, namely, ShPHT1-1, ShPHT1-2, and ShPHT1-3, shows higher expression in the wild genotype IND 99-907 (salinity-tolerant) compared to the commercial variety Co 97010 (salinity-sensitive) under salt stress conditions. Analysis of cis-acting elements of ShPHT promoters showed the differential distribution of multiple abiotic stress elements; specifically, P1BS in the promoter region and the transient expression of GUS driven by the EaPHT1-2 promoter in sugarcane revealed potential promoter activity. The insights provided by this study can help to decipher the genetic information of the PHT genes and their potential use in the generation of improved sugarcane varieties adapted to Pi starvation and other salinity stresses for sustainable production. Nevertheless, additional investigation is required to confirm the purposeful role of PHT gene promoters under abiotic and Pi-induced stress and their response with respect to other stress conditions.

Supplementary Materials

The following supporting information can be downloaded at: https://www.mdpi.com/article/10.3390/su142315893/s1, Figure S1: Prediction of subcellular localization of ShPHT proteins. The x-axis represents the names of the ShPHT proteins and the y-axis represents the percentage of localization. Abbreviations: Plas—Plasma membrane; cyto: cytosol; Extra–extracellular; Pero–peroxisome; Chlo—Chloroplast; E.R.—Endoplasmic reticulum; Vacu—Vacuole; Cyto_plas- cytosol and plasma membrane; Mito—Mitochondria; cyto_nucl: cytosol and nucleus; Nucl—Nucleus; Figure S2: Prediction of posttranslational phosphorylation and glycosylation modification of ShPHT proteins; Figure S3: Transmembrane domains (TMDs) prediction of 23 ShPHT proteins by TMHMM (transmembrane prediction using Hidden Markov Models) server; Table S1: The structural features of motif 1–20; Table S2: Secondary structure of amino acid sequences in ShPHT by SOPMA; Table S3: Phosphorylation and glycosylation sites in ShPHT proteins; Table S4: Functional annotation of ShPHT proteins based on PANNZER2 output; Table S5: KEGG analysis of PHT proteins assigned by the BlastKOALA tool; Table S6: The RNA-Seq data of the PHT genes; Table S7: The cis-elements in promoter sequences of Phosphate transporter genes in Sugarcane.

Author Contributions

Conceptualization, N.M. and A.C.; Formal analysis, N.M. and V.P.; Investigation, N.M.; Methodology, V.P. and M.C.; Supervision, A.C.; Validation, N.M.; Writing—original draft, N.M.; Writing—review and editing, M.C., V.R., M.R., H.G. and A.C. All authors have read and agreed to the published version of the manuscript.

Funding

This research received no external funding.

Institutional Review Board Statement

Not applicable.

Informed Consent Statement

Not applicable.

Data Availability Statement

The data used in this study are available in the NCBI database under BioProject accession number PRJNA716503.

Acknowledgments

We wish to thank all the reviewers and editors for their careful reading and helpful comments on this manuscript. We gratefully acknowledge Indian Council of Agricultural Research (ICAR)-Sugarcane Breeding Institute (SBI) for supporting the current research. The authors also thank Anilkumar C, Scientist, NRRI, Cuttack for his help in editing the manuscript.

Conflicts of Interest

The authors declare that there is no conflict of interest regarding the publication of this paper.

References

  1. Ali, W.; Nadeem, M.; Ashiq, W.; Zaeem, M.; Gilani, S.S.M.; Rajabi-Khamseh, S.; Pham, T.H.; Kavanagh, V.; Thomas, R.; Cheema, M. The Effects of Organic and Inorganic Phosphorus Amendments on the Biochemical Attributes and Active Microbial Population of Agriculture Podzols Following Silage Corn Cultivation in Boreal Climate. Sci. Rep. 2019, 9, 17297. [Google Scholar] [CrossRef] [Green Version]
  2. Bindraban, P.S.; Dimkpa, C.O.; Pandey, R. Exploring Phosphorus Fertilizers and Fertilization Strategies for Improved Human and Environmental Health. Biol. Fertil. Soils 2020, 56, 299–317. [Google Scholar] [CrossRef] [Green Version]
  3. Zhang, Z.; Liao, H.; Lucas, W.J. Molecular Mechanisms Underlying Phosphate Sensing, Signaling, and Adaptation in Plants. J. Integr. Plant Biol. 2014, 56, 192–220. [Google Scholar] [CrossRef]
  4. Bechtaoui, N.; Rabiu, M.K.; Raklami, A.; Oufdou, K.; Hafidi, M.; Jemo, M. Phosphate-Dependent Regulation of Growth and Stresses Management in Plants. Front. Plant Sci. 2021, 12, 679916. [Google Scholar] [CrossRef]
  5. Młodzińska, E.; Zboińska, M. Phosphate Uptake and Allocation—A Closer Look at Arabidopsis thaliana L. and Oryza Sativa L. Front. Plant Sci. 2016, 7, 1198. [Google Scholar] [CrossRef] [Green Version]
  6. Hamburger, D.; Rezzonico, E.; MacDonald-Comber Petétot, J.; Somerville, C.; Poirier, Y. Identification and Characterization of the Arabidopsis PHO1 Gene Involved in Phosphate Loading to the Xylem. Plant Cell 2002, 14, 889–902. [Google Scholar] [CrossRef] [Green Version]
  7. Lhamo, D.; Shao, Q.; Tang, R.; Luan, S. Genome-Wide Analysis of the Five Phosphate Transporter Families in Camelina sativa and Their Expressions in Response to Low-P. Int. J. Mol. Sci. 2020, 21, 8365. [Google Scholar] [CrossRef]
  8. Wang, J.; Yang, Y.; Liao, L.; Xu, J.; Liang, X.; Liu, W. Genome-Wide Identification and Functional Characterization of the Phosphate Transporter Gene Family in Sorghum. Biomolecules 2019, 9, 670. [Google Scholar] [CrossRef] [Green Version]
  9. Liu, F.; Xu, Y.; Jiang, H.; Jiang, C.; Du, Y.; Gong, C.; Wang, W.; Zhu, S.; Han, G.; Cheng, B. Systematic Identification, Evolution and Expression Analysis of the Zea mays PHT1 Gene Family Reveals Several New Members Involved in Root Colonization by Arbuscular Mycorrhizal Fungi. Int. J. Mol. Sci. 2016, 17, 930. [Google Scholar] [CrossRef] [Green Version]
  10. Hasanzadeh, S.; Faraji, S.; Abdullah; Heidari, P. Phosphate Transporter Genes: Genome-Wide Identification and Characterization in Camelina sativa. bioRxiv 2021. [Google Scholar] [CrossRef]
  11. He, M.; He, C.-Q.; Ding, N.-Z. Abiotic Stresses: General Defenses of Land Plants and Chances for Engineering Multistress Tolerance. Front. Plant Sci. 2018, 9, 1771. [Google Scholar] [CrossRef] [Green Version]
  12. Dey, G.; Banerjee, P.; Sharma, R.K.; Maity, J.P.; Etesami, H.; Shaw, A.K.; Huang, Y.-H.; Huang, H.-B.; Chen, C.-Y. Management of Phosphorus in Salinity-Stressed Agriculture for Sustainable Crop Production by Salt-Tolerant Phosphate-Solubilizing Bacteria—A Review. Agronomy 2021, 11, 1552. [Google Scholar] [CrossRef]
  13. Baek, D.; Chun, H.J.; Yun, D.-J.; Kim, M.C. Cross-Talk between Phosphate Starvation and Other Environmental Stress Signaling Pathways in Plants. Mol. Cells 2017, 40, 697–705. [Google Scholar] [CrossRef] [Green Version]
  14. Formann, S.; Hahn, A.; Janke, L.; Stinner, W.; Sträuber, H.; Logroño, W.; Nikolausz, M. Beyond Sugar and Ethanol Production: Value Generation Opportunities Through Sugarcane Residues. Front. Energy Res. 2020, 8, 579577. [Google Scholar] [CrossRef]
  15. Ma, Y.; Dias, M.C.; Freitas, H. Drought and Salinity Stress Responses and Microbe-Induced Tolerance in Plants. Front. Plant Sci. 2020, 11, 591911. [Google Scholar] [CrossRef]
  16. Soltangheisi, A.; Withers, P.J.A.; Pavinato, P.S.; Cherubin, M.R.; Rossetto, R.; Do Carmo, J.B.; da Rocha, G.C.; Martinelli, L.A. Improving Phosphorus Sustainability of Sugarcane Production in Brazil. GCB Bioenergy 2019, 11, 1444–1455. [Google Scholar] [CrossRef]
  17. Gasteiger, E.; Hoogland, C.; Gattiker, A.; Duvaud, S.; Wilkins, M.R.; Appel, R.D.; Bairoch, A. Protein Identification and Analysis Tools on the ExPASy Server. In The Proteomics Protocols Handbook; Walker, J.M., Ed.; Springer Protocols Handbooks; Humana Press: Totowa, NJ, USA, 2005; pp. 571–607. ISBN 978-1-59259-890-8. [Google Scholar]
  18. Sonnhammer, E.L.L. A Hidden Markov Model for Predicting Transmembrane Helices in Protein Sequences. Proc. Int. Conf. Intell. Syst. Mol. Biol. 1998, 6, 175–182. [Google Scholar]
  19. Blom, N.; Sicheritz-Pontén, T.; Gupta, R.; Gammeltoft, S.; Brunak, S. Prediction of Post-Translational Glycosylation and Phosphorylation of Proteins from the Amino Acid Sequence. Proteomics 2004, 4, 1633–1649. [Google Scholar] [CrossRef]
  20. Gupta, R.; Brunak, S. Prediction of Glycosylation across the Human Proteome and the Correlation to Protein Function. Pac. Symp. Biocomput. 2002, 7, 310–322. [Google Scholar]
  21. Horton, P.; Park, K.-J.; Obayashi, T.; Fujita, N.; Harada, H.; Adams-Collier, C.J.; Nakai, K. WoLF PSORT: Protein Localization Predictor. Nucleic Acids Res. 2007, 35, W585–W587. [Google Scholar] [CrossRef] [Green Version]
  22. Kumar, S.; Stecher, G.; Li, M.; Knyaz, C.; Tamura, K. MEGA X: Molecular Evolutionary Genetics Analysis across Computing Platforms. Mol. Biol. Evol. 2018, 35, 1547–1549. [Google Scholar] [CrossRef]
  23. Hu, B.; Jin, J.; Guo, A.-Y.; Zhang, H.; Luo, J.; Gao, G. GSDS 2.0: An Upgraded Gene Feature Visualization Server. Bioinformatics 2015, 31, 1296–1297. [Google Scholar] [CrossRef]
  24. Marchler-Bauer, A.; Derbyshire, M.K.; Gonzales, N.R.; Lu, S.; Chitsaz, F.; Geer, L.Y.; Geer, R.C.; He, J.; Gwadz, M.; Hurwitz, D.I.; et al. CDD: NCBI’s Conserved Domain Database. Nucleic Acids Res. 2015, 43, D222–D226. [Google Scholar] [CrossRef] [Green Version]
  25. Letunic, I.; Khedkar, S.; Bork, P. SMART: Recent Updates, New Developments and Status in 2020. Nucleic Acids Res. 2021, 49, D458–D460. [Google Scholar] [CrossRef]
  26. Finn, R.D.; Bateman, A.; Clements, J.; Coggill, P.; Eberhardt, R.Y.; Eddy, S.R.; Heger, A.; Hetherington, K.; Holm, L.; Mistry, J.; et al. Pfam: The Protein Families Database. Nucleic Acids Res. 2014, 42, D222–D230. [Google Scholar] [CrossRef] [Green Version]
  27. Chen, C.; Chen, H.; Zhang, Y.; Thomas, H.R.; Frank, M.H.; He, Y.; Xia, R. TBtools—An Integrative Toolkit Developed for Interactive Analyses of Big Biological Data. Mol. Plant 2020, 13, 1194–1202. [Google Scholar] [CrossRef]
  28. Bailey, T.L.; Boden, M.; Buske, F.A.; Frith, M.; Grant, C.E.; Clementi, L.; Ren, J.; Li, W.W.; Noble, W.S. MEME Suite: Tools for Motif Discovery and Searching. Nucleic Acids Res. 2009, 37, W202–W208. [Google Scholar] [CrossRef]
  29. Geourjon, C.; Deléage, G. SOPMA: Significant Improvements in Protein Secondary Structure Prediction by Consensus Prediction from Multiple Alignments. Bioinformatics 1995, 11, 681–684. [Google Scholar] [CrossRef]
  30. Kelley, L.A.; Mezulis, S.; Yates, C.M.; Wass, M.N.; Sternberg, M.J.E. The Phyre2 Web Portal for Protein Modeling, Prediction and Analysis. Nat. Protoc. 2015, 10, 845–858. [Google Scholar] [CrossRef] [Green Version]
  31. Dundas, J.; Ouyang, Z.; Tseng, J.; Binkowski, A.; Turpaz, Y.; Liang, J. CASTp: Computed Atlas of Surface Topography of Proteins with Structural and Topographical Mapping of Functionally Annotated Residues. Nucleic Acids Res. 2006, 34, W116–W118. [Google Scholar] [CrossRef] [Green Version]
  32. Willard, L.; Ranjan, A.; Zhang, H.; Monzavi, H.; Boyko, R.F.; Sykes, B.D.; Wishart, D.S. VADAR: A Web Server for Quantitative Evaluation of Protein Structure Quality. Nucleic Acids Res. 2003, 31, 3316–3319. [Google Scholar] [CrossRef] [Green Version]
  33. Törönen, P.; Medlar, A.; Holm, L. PANNZER2: A Rapid Functional Annotation Web Server. Nucleic Acids Res. 2018, 46, W84–W88. [Google Scholar] [CrossRef] [Green Version]
  34. Kanehisa, M.; Sato, Y.; Morishima, K. BlastKOALA and GhostKOALA: KEGG Tools for Functional Characterization of Genome and Metagenome Sequences. J. Mol. Biol. 2016, 428, 726–731. [Google Scholar] [CrossRef] [Green Version]
  35. Suyama, M.; Torrents, D.; Bork, P. PAL2NAL: Robust Conversion of Protein Sequence Alignments into the Corresponding Codon Alignments. Nucleic Acids Res. 2006, 34, W609–W612. [Google Scholar] [CrossRef] [Green Version]
  36. Lynch, M.; Conery, J.S. The Evolutionary Fate and Consequences of Duplicate Genes. Science 2000, 290, 1151–1155. [Google Scholar] [CrossRef] [Green Version]
  37. Vignesh, P.; Mahadevaiah, C.; Parimalan, R.; Valarmathi, R.; Dharshini, S.; Nisha, S.; Suresha, G.S.; Swathi, S.; Mahadeva Swamy, H.K.; Sreenivasa, V.; et al. Comparative de Novo Transcriptome Analysis Identifies Salinity Stress Responsive Genes and Metabolic Pathways in Sugarcane and Its Wild Relative Erianthus Arundinaceus [Retzius] Jeswiet. Sci. Rep. 2021, 11, 24514. [Google Scholar] [CrossRef]
  38. Livak, K.J.; Schmittgen, T.D. Analysis of Relative Gene Expression Data Using Real-Time Quantitative PCR and the 2(-Delta Delta C(T)) Method. Methods 2001, 25, 402–408. [Google Scholar] [CrossRef]
  39. Higo, K.; Ugawa, Y.; Iwamoto, M.; Korenaga, T. Plant Cis-Acting Regulatory DNA Elements (PLACE) Database: 1999. Nucleic Acids Res. 1999, 27, 297–300. [Google Scholar] [CrossRef] [Green Version]
  40. Philip, A.; Syamaladevi, D.P.; Chakravarthi, M.; Gopinath, K.; Subramonian, N. 5′ Regulatory Region of Ubiquitin 2 Gene from Porteresia Coarctata Makes Efficient Promoters for Transgene Expression in Monocots and Dicots. Plant Cell Rep. 2013, 32, 1199–1210. [Google Scholar] [CrossRef]
  41. Rae, A.L.; Cybinski, D.H.; Jarmey, J.M.; Smith, F.W. Characterization of Two Phosphate Transporters from Barley; Evidence for Diverse Function and Kinetic Properties among Members of the Pht1 Family. Plant Mol. Biol. 2003, 53, 27–36. [Google Scholar] [CrossRef]
  42. Liu, F.; Chang, X.-J.; Ye, Y.; Xie, W.-B.; Wu, P.; Lian, X.-M. Comprehensive Sequence and Whole-Life-Cycle Expression Profile Analysis of the Phosphate Transporter Gene Family in Rice. Mol. Plant 2011, 4, 1105–1122. [Google Scholar] [CrossRef] [PubMed] [Green Version]
  43. Fan, C.; Wang, X.; Hu, R.; Wang, Y.; Xiao, C.; Jiang, Y.; Zhang, X.; Zheng, C.; Fu, Y.-F. The Pattern of Phosphate Transporter 1 Genes Evolutionary Divergence in Glycine MaxL. BMC Plant Biol 2013, 13, 48. [Google Scholar] [CrossRef] [PubMed]
  44. Chen, A.; Chen, X.; Wang, H.; Liao, D.; Gu, M.; Qu, H.; Sun, S.; Xu, G. Genome-Wide Investigation and Expression Analysis Suggest Diverse Roles and Genetic Redundancy of Pht1 Family Genes in Response to Pi Deficiency in Tomato. BMC Plant Biol. 2014, 14, 61. [Google Scholar] [CrossRef] [PubMed] [Green Version]
  45. Ceasar, S.A.; Hodge, A.; Baker, A.; Baldwin, S.A. Phosphate Concentration and Arbuscular Mycorrhizal Colonisation Influence the Growth, Yield and Expression of Twelve PHT1 Family Phosphate Transporters in Foxtail Millet (Setaria Italica). PLoS ONE 2014, 9, e108459. [Google Scholar] [CrossRef] [PubMed] [Green Version]
  46. Zhang, C.; Meng, S.; Li, M.; Zhao, Z. Genomic Identification and Expression Analysis of the Phosphate Transporter Gene Family in Poplar. Front. Plant Sci. 2016, 7, 1398. [Google Scholar] [CrossRef] [Green Version]
  47. Liu, B.; Zhao, S.; Wu, X.; Wang, X.; Nan, Y.; Wang, D.; Chen, Q. Identification and Characterization of Phosphate Transporter Genes in Potato. J. Biotechnol. 2017, 264, 17–28. [Google Scholar] [CrossRef]
  48. Teng, W.; Zhao, Y.-Y.; Zhao, X.-Q.; He, X.; Ma, W.-Y.; Deng, Y.; Chen, X.-P.; Tong, Y.-P. Genome-Wide Identification, Characterization, and Expression Analysis of PHT1 Phosphate Transporters in Wheat. Front. Plant Sci. 2017, 8, 543. [Google Scholar] [CrossRef] [Green Version]
  49. Sun, T.; Li, M.; Shao, Y.; Yu, L.; Ma, F. Comprehensive Genomic Identification and Expression Analysis of the Phosphate Transporter (PHT) Gene Family in Apple. Front. Plant Sci. 2017, 8, 426. [Google Scholar] [CrossRef] [Green Version]
  50. Li, Y.; Wang, X.; Zhang, H.; Wang, S.; Ye, X.; Shi, L.; Xu, F.; Ding, G. Molecular Identification of the Phosphate Transporter Family 1 (PHT1) Genes and Their Expression Profiles in Response to Phosphorus Deprivation and Other Abiotic Stresses in Brassica napus. PLoS ONE 2019, 14, e0220374. [Google Scholar] [CrossRef] [Green Version]
  51. Yang, J.; Zhou, J.; Zhou, H.-J.; Wang, M.-M.; Liu, M.-M.; Ke, Y.-Z.; Li, P.-F.; Li, J.-N.; Du, H. Global Survey and Expressions of the Phosphate Transporter Gene Families in Brassica napus and Their Roles in Phosphorus Response. Int. J. Mol. Sci. 2020, 21, 1752. [Google Scholar] [CrossRef] [Green Version]
  52. Zhao, X.; Li, G.; Sun, Z.; Chen, Y.; Guo, W.; Li, Y.; Chen, Y.; Yang, J.; Hou, H. Identification, Structure Analysis, and Transcript Profiling of Phosphate Transporters under Pi Deficiency in Duckweeds. Int. J. Biol. Macromol. 2021, 188, 595–608. [Google Scholar] [CrossRef] [PubMed]
  53. Ahmad, I.; Rawoof, A.; Islam, K.; Momo, J.; Ramchiary, N. Identification and Expression Analysis of Phosphate Transporter Genes and Metabolites in Response to Phosphate Stress in Capsicum annuum. Environ. Exp. Bot. 2021, 190, 104597. [Google Scholar] [CrossRef]
  54. Lv, S.; Wang, D.; Jiang, P.; Jia, W.; Li, Y. Variation of PHT Families Adapts Salt Cress to Phosphate Limitation under Salinity. Plant Cell Environ. 2021, 44, 1549–1564. [Google Scholar] [CrossRef]
  55. Cao, D.; Liu, Y.; Linlong, M.; Liu, Z.; Li, J.; Beibei, W.; Zhang, X.; Yin, P.; Jin, X.; Huang, J. Genome-Wide Identification and Characterization of Phosphate Transporter Gene Family Members in Tea Plants (Camellia sinensis L. O. Kuntze) under Different Selenite Levels. Plant Physiol. Biochem. 2021, 166, 668–676. [Google Scholar] [CrossRef] [PubMed]
  56. Walder, F.; Brulé, D.; Koegel, S.; Wiemken, A.; Boller, T.; Courty, P.-E. Plant Phosphorus Acquisition in a Common Mycorrhizal Network: Regulation of Phosphate Transporter Genes of the Pht1 Family in Sorghum and Flax. New Phytol. 2015, 205, 1632–1645. [Google Scholar] [CrossRef] [PubMed]
  57. Versaw, W.K.; Harrison, M.J. A Chloroplast Phosphate Transporter, PHT2;1, Influences Allocation of Phosphate within the Plant and Phosphate-Starvation Responses. Plant Cell 2002, 14, 1751–1766. [Google Scholar] [CrossRef] [Green Version]
  58. Mudge, S.R.; Rae, A.L.; Diatloff, E.; Smith, F.W. Expression Analysis Suggests Novel Roles for Members of the Pht1 Family of Phosphate Transporters in Arabidopsis. Plant J. 2002, 31, 341–353. [Google Scholar] [CrossRef] [PubMed]
  59. Rubio, V.; Linhares, F.; Solano, R.; Martín, A.C.; Iglesias, J.; Leyva, A.; Paz-Ares, J. A Conserved MYB Transcription Factor Involved in Phosphate Starvation Signaling Both in Vascular Plants and in Unicellular Algae. Genes Dev. 2001, 15, 2122–2133. [Google Scholar] [CrossRef] [Green Version]
  60. Su, T.; Xu, Q.; Zhang, F.-C.; Chen, Y.; Li, L.-Q.; Wu, W.-H.; Chen, Y.-F. WRKY42 Modulates Phosphate Homeostasis through Regulating Phosphate Translocation and Acquisition in Arabidopsis. Plant Physiol. 2015, 167, 1579–1591. [Google Scholar] [CrossRef] [Green Version]
  61. Li, C.; Li, K.; Liu, X.; Ruan, H.; Zheng, M.; Yu, Z.; Gai, J.; Yang, S. Transcription Factor GmWRKY46 Enhanced Phosphate Starvation Tolerance and Root Development in Transgenic Plants. Front. Plant Sci. 2021, 12, 700651. [Google Scholar] [CrossRef]
  62. Yang, T.; Hao, L.; Yao, S.; Zhao, Y.; Lu, W.; Xiao, K. TabHLH1, a BHLH-Type Transcription Factor Gene in Wheat, Improves Plant Tolerance to Pi and N Deprivation via Regulation of Nutrient Transporter Gene Transcription and ROS Homeostasis. Plant Physiol. Biochem. 2016, 104, 99–113. [Google Scholar] [CrossRef] [PubMed]
  63. Araceli, O.-A.; Alfredo, C.-R.; Javier, M.-M.; Luis, H.-E. A Phosphate Starvation-Driven Bidirectional Promoter as a Potential Tool for Crop Improvement and in Vitro Plant Biotechnology. Plant Biotechnol. J. 2017, 15, 558–567. [Google Scholar] [CrossRef] [PubMed]
  64. Liu, Y.; Xie, Y.; Wang, H.; Ma, X.; Yao, W.; Wang, H. Light and Ethylene Coordinately Regulate the Phosphate Starvation Response through Transcriptional Regulation of Phosphate Starvation Response1. Plant Cell 2017, 29, 2269–2284. [Google Scholar] [CrossRef] [PubMed]
Figure 1. Conserved domains in ShPHT proteins were identified using the NCBI-CD database. The domains are represented by different colors. Schematic representation of the conserved domains integrated employing TBtools.
Sustainability 14 15893 g001
Figure 2. Phylogenetic analysis of PHT proteins between Saccharum spp. hybrid, Sorghum bicolor, Zea mays, and Arabidopsis thaliana. An unrooted phylogenetic tree was constructed by MEGA X using the neighbour-joining method with 1000 bootstrap replicates. Five clades were identified, and are represented here as Clade I—Violet, Clade II—Yellow, Clade III—Orange, Clade IV—Blue, and Clade V—Green.
Sustainability 14 15893 g002
Figure 3. The distribution of ShPHT genes on the Saccharum spp. hybrid R570 genome chromosome scaffolds. MG2C v.2 (http://mg2c.iask.in/mg2c_v2.0/, (accessed on 28 May 2022)) was used to visualize the gene locations on chromosomes.
Sustainability 14 15893 g003
Figure 4. Schematic representation of the intron–exon structure and conserved motif analysis of PHT genes in Sugarcane. (A) The intron–exon structure of the ShPHT genes was displayed using an online GSDS tool. Yellow boxes represent exons (CDS), black lines represent introns, and light blue boxes represent 5′ and 3′ untranslated regions. (B) The distribution of putative conserved motifs of PHT proteins was mined in the MEME program. Twenty motifs are indicated by different colored boxes and the regular motif sequences are shown in Table S1. The MEME Motif pattern was visualized using TBtools.
Sustainability 14 15893 g004
Figure 5. The predicted 3D structures and pocket binding sites of the ShPHT proteins. The putative 3D structures of ShPHT proteins were generated by the Phyre2 server, and the active catalytic binding sites were illustrated as red regions using the CASTp server 3.0.
Sustainability 14 15893 g005
Figure 6. Heat map of PHT genes responding to salinity stress in sugarcane root based on the analysis of qRT_PCR expression of wild genotype E. arundinaceus IND99-907 (salinity tolerant) and Saccharum hybrid Co97010 (salinity sensitive) cultivars. Ea_SS represents the E. arundinaceus salinity stress, Ea_SS represents the E. arundinaceus salinity control, Sh_SS represents the Saccharum hybrid salinity-sensitive stress variety, and Sh_SC represents the Saccharum hybrid salinity-sensitive control variety. Red indicates high expression and green indicates low expression.
Sustainability 14 15893 g006
Figure 7. Analysis of the ShPHT promoter regions. (A) Distribution of cis-regulatory elements into promoter regions of ShPHT genes (2 kb upstream from the CDS region). Classification of identified regulatory elements based on function, such as cell, developmental, light, tissue/organ, stress, hormone, binding domain, and others. (B). Distribution of different types of stress-related cis-regulatory elements. (C). Transient expression analysis of EaPHT1; 2 promoter. Red arrows indicate the GUS Expression identified on sugarcane leaf pieces.
Sustainability 14 15893 g007
Table 1. List of the identified PHT genes and their characteristics in the Saccharum spp. hybrid genome.
Gene NameGene IDGenomic Position (bp)StrandCDS (bp)Protein Length (A.A)Protein Molecular Weight (kDa)Theoretical pINumber of Negatively Amino AcidNumber of Positively Amino AcidInstability IndexAliphatic IndexGRAVYTrans
Membrane Domain
ShPHT1-1Sh_251L03_g000070Sh01:30199785–30202295+162654158.8147.63404130.2688.820.34911
ShPHT1-2Sh_251L03_g000050Sh01:30228262–30231839-157552457.0877.13373731.8490.970.36811
ShPHT1-3Sh_236J19_g000050Sh01:67384705–67386273-156952257.2248.92364327.0194.620.40911
ShPHT1-4Sh_229B19_p000040Sh01: 67384705–67386273-157852557.5128.7384328.6793.330.38511
ShPHT1-5Sh_216E19_g000030Sh02:12496129–12497748-162053958.898.66475236.7189.980.29412
ShPHT1-6Sh_247G22_g000050Sh03:29909878–29911962-165655160.2858.6444833.293.90.33612
ShPHT1-7Sh_222J11_g000100Sh01:69058018–69059604+158752856.6988.1333538.6389.150.39611
ShPHT1-8Sh_222A01_g000030Sh06:3102321–3103931-161153658.818.3404334.9484.380.28912
ShPHT2-1Sh_232L11_g000050Sh04:24145076–24148283+171957259.2519.42243632.21106.540.70713
ShPHT3-1Sh_252F06_g000020Sh01:57191013–57193003-104434737.768.94263523.192.850.2830
ShPHT3-2Sh_208E04_contig-2_g000020Sh04:39635010–39639407-111937239.1359.23243538.388.230.2590
ShPHT3-3Sh_234H01_g000060Sh10:11858441–11864575+111337039.1139.22233444.0586.380.2680
ShPHT3-4Sh_247B01_g000110Sh06:11674421–11678619+110436738.4129.39203437.8184.990.2920
ShPHT4-1Sh_227B04_g000030Sh01:21002885–21004607+65121623.9269.73122239.26105.60.4625
ShPHT4-2Sh_241M07_g000080Sh02:36755180–36775918-162354057.7556.76383744.48102.940.3779
ShPHT4-3Sh_227N18_g000090Sh03:15436854–15440720+154251355.3838.42313445.0597.310.3469
ShPHT4-4Sh_227D07_g000010Sh03:21537139–21541012-117339042.3929.27172548.94107.90.5669
ShPHT4-5Sh_220N05_g000170Sh03:44310739–44314195-155451755.81410.04193842.72100.430.47510
ShPHT4-6Sh_217I09_g000040Sh09:24432214–24435720+159052955.449.65193537.4497.20.61511
ShPHO1-1Sh_244C06_g000040Sh10:19140506–19145537-254184696.5348.65909941.6189.78−0.1376
ShPHO1-2Sh_226O09_contig-2_g000020Sh10:19140506–19145537-263487799.7668.449410142.7887.5−0.1625
ShPHO1-3Sh_254O18_g000050Sh03:11344984–11348425-195665173.39.1546941.9692.44−0.0565
ShPHO1-4Sh_253H03_g000040Sh03:11346722–11350230-190863570.2138.82657442.6785.64−0.1544
Table 2. Duplicated gene pairs and the Ka/Ks values predicted in ShPHT genes.
Gene NameOrthologsKaKsKa/KsDivergence Time (Mya)
ShPHT1-1ShPHT1-40.00270.05520.04914.50 × 1012
ShPHT1-2ShPHT1-30.08641.48530.05821.22 × 1014
ShPHT3-2ShPHT3-30.08750.79680.10986.53 × 1013
ShPHT4-3ShPHT4-40.10882.93940.0372.41 × 1014
ShPHT4-5ShPHT4-60.48464.19840.11543.44 × 1014
ShPHO1-1ShPHO1-20.00290.01540.19041.26 × 1012
ShPHO1-3ShPHO1-40.04890.1340.36511.10 × 1013
Publisher’s Note: MDPI stays neutral with regard to jurisdictional claims in published maps and institutional affiliations.

