Article

The Hydrochemistry, Ionic Source, and Chemical Weathering of a Tributary in the Three Gorges Reservoir

1
Chongqing Branch Institute, Changjiang River Scientific Research Institute, Chongqing 400026, China
2
Soil and Water Conservation Department, Changjiang River Scientific Research Institute, Wuhan 430000, China
3
College of Architecture and Urban Planning, Chongqing Jiaotong University, Chongqing 400074, China
4
Chongqing Key Laboratory of Karst Environment, School of Geographical Sciences, Southwest University, Chongqing 400715, China
*
Author to whom correspondence should be addressed.
Sustainability 2022, 14(22), 15376; https://doi.org/10.3390/su142215376
Submission received: 21 October 2022 / Revised: 11 November 2022 / Accepted: 15 November 2022 / Published: 18 November 2022

Abstract

:
Riverine dissolved matter reflects geochemical genesis information, which is vital to understand and manage the water environment in a basin. The Ganjing River located in the hinterland of the Three Gorges Reservoir was systematically investigated to analyze the composition and spatial variation of riverine ions, probe the source and influencing factors, and assess the chemical weathering rates and CO2 consumption. The results showed that the total dissolved solid value (473.31 ± 154.87 mg/L) with the type of “HCO3–Ca2+” was higher than that of the global rivers’ average. The hydrochemical parameters were relatively stable in the lower reservoir area of the Ganjing River, which was largely influenced by the backwater of Three Gorges Reservoir. The carbonate weathering source contributed 69.63% of TDS (Total dissolved solids), which generally dominated the hydrochemical characteristics. The contribution rates of atmospheric rainfall were relatively low and stable in the basin, with an average of 4.01 ± 1.28%. The average contribution rate of anthropogenic activities was 12.05% in the basin and even up to 27.80% in the lower reservoir area of the Ganjing River, which illustrated that the impoundment of Three Gorges Reservoir had brought great challenges to the water environment in the reservoir bay. The empirical power functions were tentatively proposed to eliminate the dilution effect caused by runoff discharge on the basis of previous studies. Accordingly, the rock weathering rate was calculated as 23.54 t/km2 in the Ganjing River Basin, which consumed atmospheric CO2 with a flux of 6.88 × 10⁵ mol/y/km2. These results highlight the geochemical information of tributaries in the hinterland of the Three Gorges Reservoir, have significant implications for understanding the impact of impoundment, and provide data support for the integrated management of water resources in the Ganjing River Basin.

1. Introduction

River material transport and its ecological environment effects are directly related to the evolution of estuarine and coastal marine ecosystems [1,2]. Furthermore, through analyzing riverine ionic composition and sources, the information about the geomorphic evolution, hydrological process, bioecological process, and human activities in a basin can be obtained [3,4,5,6,7]. Since 1970, researchers have conducted extensive studies on the chemical characteristics and their controlling factors in major global rivers. Most results showed that the riverine ionic composition mainly came from rock weathering, and the contribution of evaporate dissolution, atmospheric rainfall and human activities should also not be neglected [6,8,9,10,11]. In addition, the chemical weathering process can absorb atmospheric CO2 and convert it into HCO3, which is usually transported into oceans via rivers and deposited in the form of carbonates. The above process is also an important global carbon cycle, which has a vital impact on climate change on a geological time scale [12,13].
At present, the global environment is facing huge risks and challenges [14], and human activities are widely affecting the surface environment. According to the latest statistics of the International Commission on Large Dams, there are 58,000 dams with a height of more than 15 m or a reservoir capacity of more than 3 × 10⁸ m3 in the world (http://www.icold-cigb.org (accessed on 1 October 2022)). The impoundment of global reservoirs has destroyed connectivity and hydrological conditions, hindered the migration of biogenic elements along the river network, and affected the ecological environment in downstream areas [2,15,16,17]. The Three Gorges Reservoir (TGR) is located in Chongqing and Hubei in southwest China, regulates 56% of the Yangtze River, and plays a very important strategic role in promoting the economic exchanges between Eastern and Western regions of China [18]. Since the full impoundment in 2010, TGR and its tributaries have suffered from hydrological process changing, water level rising, and flow velocity slowing down [19,20,21]. According to the investigation, about 38 tributaries have displayed eutrophication and experienced water blooms in varying degrees. The water quality in the tributary estuary is faced with a more serious situation compared with that in the TGR [22]. However, the impacts of impoundment on water quality of TGR tributaries remain poorly understood.
Located in the hinterland of TGR, the Ganjing River is a vital tributary to support the economic and social development in Zhongxian County. About 8 km of backwater area is formed due to the impoundment of TGR, which affects the water quality and hydrology in the Ganjing River Basin. In fact, the water deterioration, eutrophication, and algal blooms are seriously restricting the ecological security of the basin. However, the spatial characteristics of hydrochemistry and its controlling factors remains unclear. According to the Fourteenth Five Year Plan for Ecological Environment Protection in Chongqing, an ecological regulation dam will be built in the Ganjing River, which largely brings unknown impacts. Before that, it is necessary to fully understand the water environment. Based on an investigation carried out in the whole basin, this study aims to (1) investigate the ionic concentrations and spatial variation, (2) study the ionic source and its influencing factors, and (3) assess the chemical weathering rates and CO2 consumption in the basin, which are significant to grasp the evolution process of the water environment in a large-scale reservoir ecosystem and provide theoretical support for ecological regulation dam construction.

2. Study Area and Methods
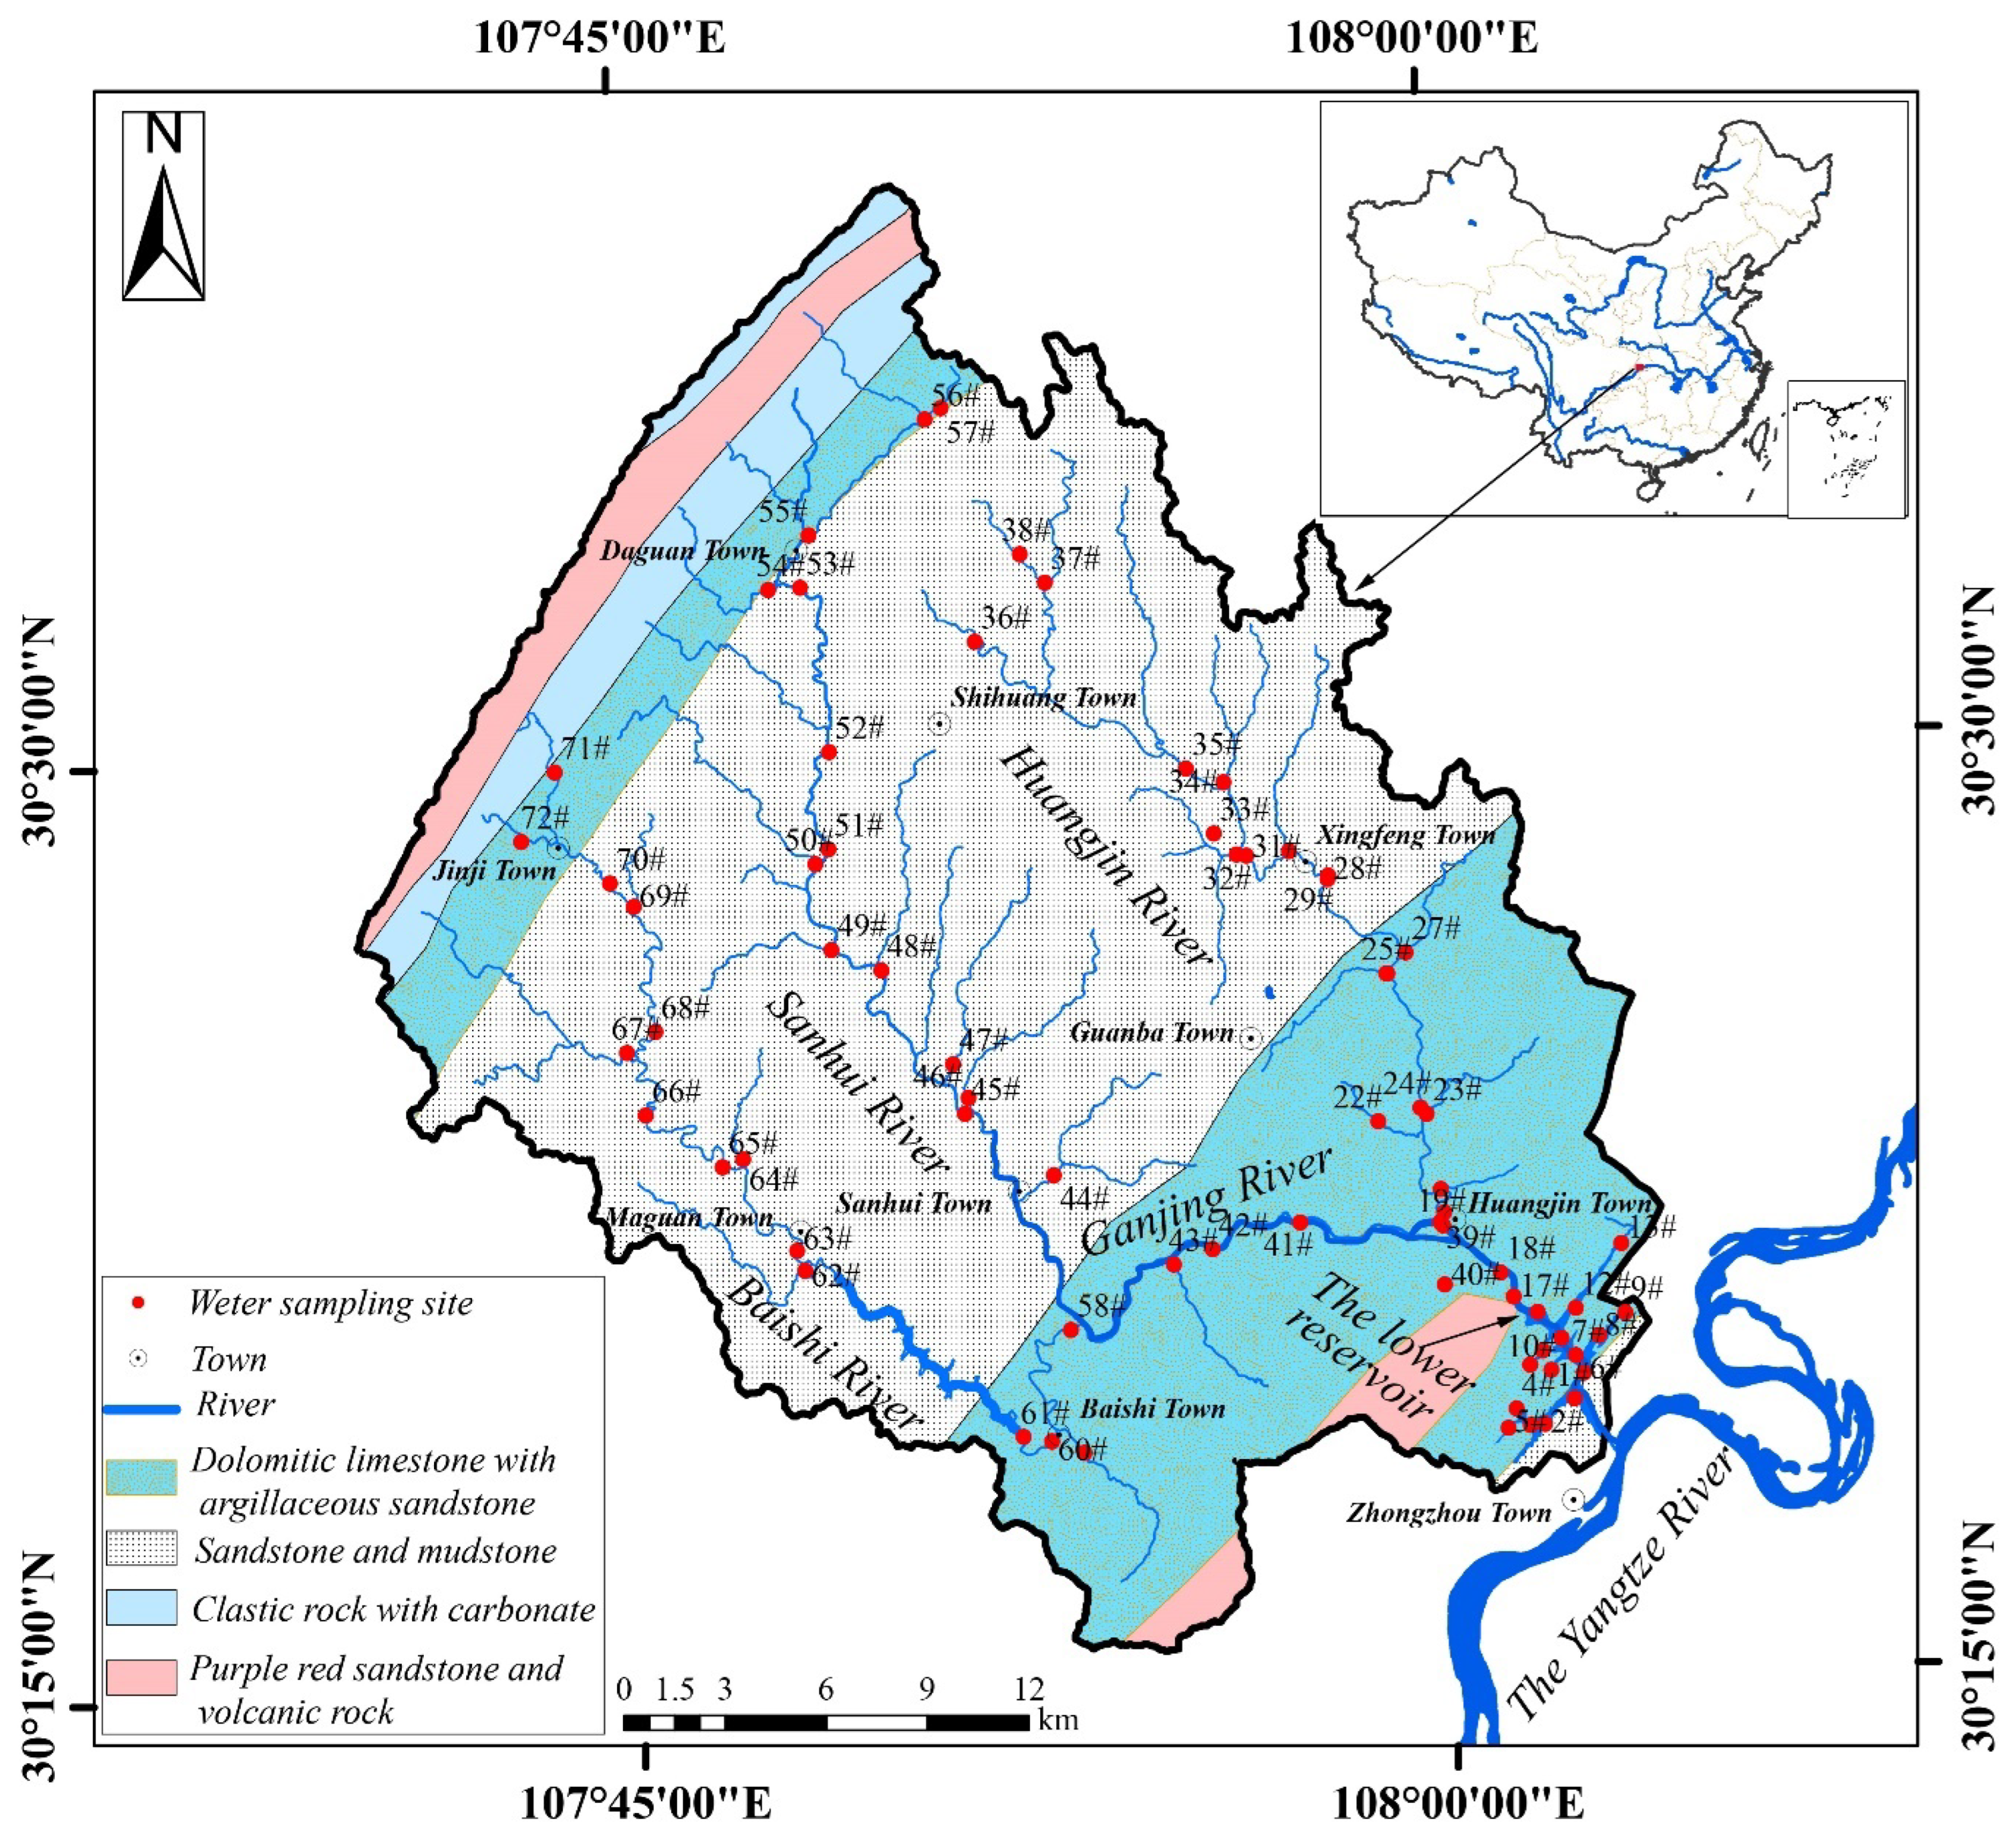
2.1. Study Area

The Ganjing River is located at the north of the Yangtze River, with the range of 107°40′01″~108°04′00″ E and 30°15′29″~30°39′06″ N. The basin is composed of three tributaries, the Baishi River, Sanhui River, and Huangjin River, with a whole area of 910 km2 (Figure 1). Due to the construction and impoundment of TGR, the backwater zone is formed along the lower reach of the Ganjing River, which is farthest from the estuary of the Huangjin River. The subtropical humid monsoon climate predominates, with an average annual temperature of 18.1 °C and annual precipitation of 1200 mm. The average annual discharge is 4.82 × 10⁸ m3, 70% of which happens in the flood season (from May to September). The river flows through the parallel ridge valley area on the eastern edge of the Sichuan Basin, with an elevation of 700~1000 m in the low mountains and hills. The Middle Triassic (T2) of the Mesozoic strata, including argillaceous limestone, dolomitic limestone, shale, and mudstone, to the upper Jurassic Suining Formation (J3s) and Penglaizhen Formation (J3p) sandstone and mudstone are exposed in the basin. Several towns with large populations, such as Shihuang, Jinji, Sanhui, Baishi, Jinjin, and Zhongzhou, are successively located along the river. The agricultural cultivation area accounts for more than 60% of the total area, where grain crops (rice, wheat, soybean, and potato) and economic crops (citrus, Chinese herbal medicine, and sericulture) are widely planted in the basin.

2.2. Sampling

The water environment was systematically monitored from 24–29 December 2020 along the main tributaries of the Ganjing River. At the same time, 72 samples were collected, of which 19 (1#~19#) samples were distributed in the lower reservoir area of the Ganjing River, 19 samples (20#~38#) in the Huangjin River, 19 samples (39#~57#) in the Sanhui River, and 15 samples (58#~72#) in the Baishi River. The water temperature (Temp), pH, dissolved oxygen (DO), conductivity (Cond), total dissolved solid (TDS), oxidation–reduction potential (ORP), and resistivity (RES) were measured by AP-7000, Aquaread Co., England, in situ, with the accuracy of ±0.1 °C, ±0.01, 0.01 mg/L, ±1 µS/cm, ±0.1 mg/L, 0.1 mv, and ±0.01, respectively. The sampling apparatus was washed three times with the river water in situ before water samples were collected. The water samples were collected at about 1 m below the water surface and sealed well for preservation.

2.3. Methodology

The water samples were filtered through Whatman GF/F filters (pore size 0.45 μm), and then the filtrate was divided into two portions. One was used for measuring major cations and dissolved silicon (DSi), and the other for analyzing major anions. The remaining samples were used to titrate the total alkalinity. The filtered sample was placed in a refrigerator at 5 °C for testing, and all experiments were completed in one week. K+, Na+, Ca2+, Mg2+, and DSi were analyzed by an ICP-OES plasma spectrometer (ICAP 7000 plus). Cl, NO3, and SO42− were tested by Dionex ICS-600 ion chromatography. The test accuracy was above 0.5%. Total alkalinity was titrated by a Metrohm 848 Titrino plus automatic potentiometric titrator (produced by HACH, Loveland, CO, USA). The calculation was conducted through the Gran graphic method, and the average value of three calculations was selected. When pH values in the water ranged from 6 to 10, the carbonic acid system in the water was dominated by HCO3.

3. Results

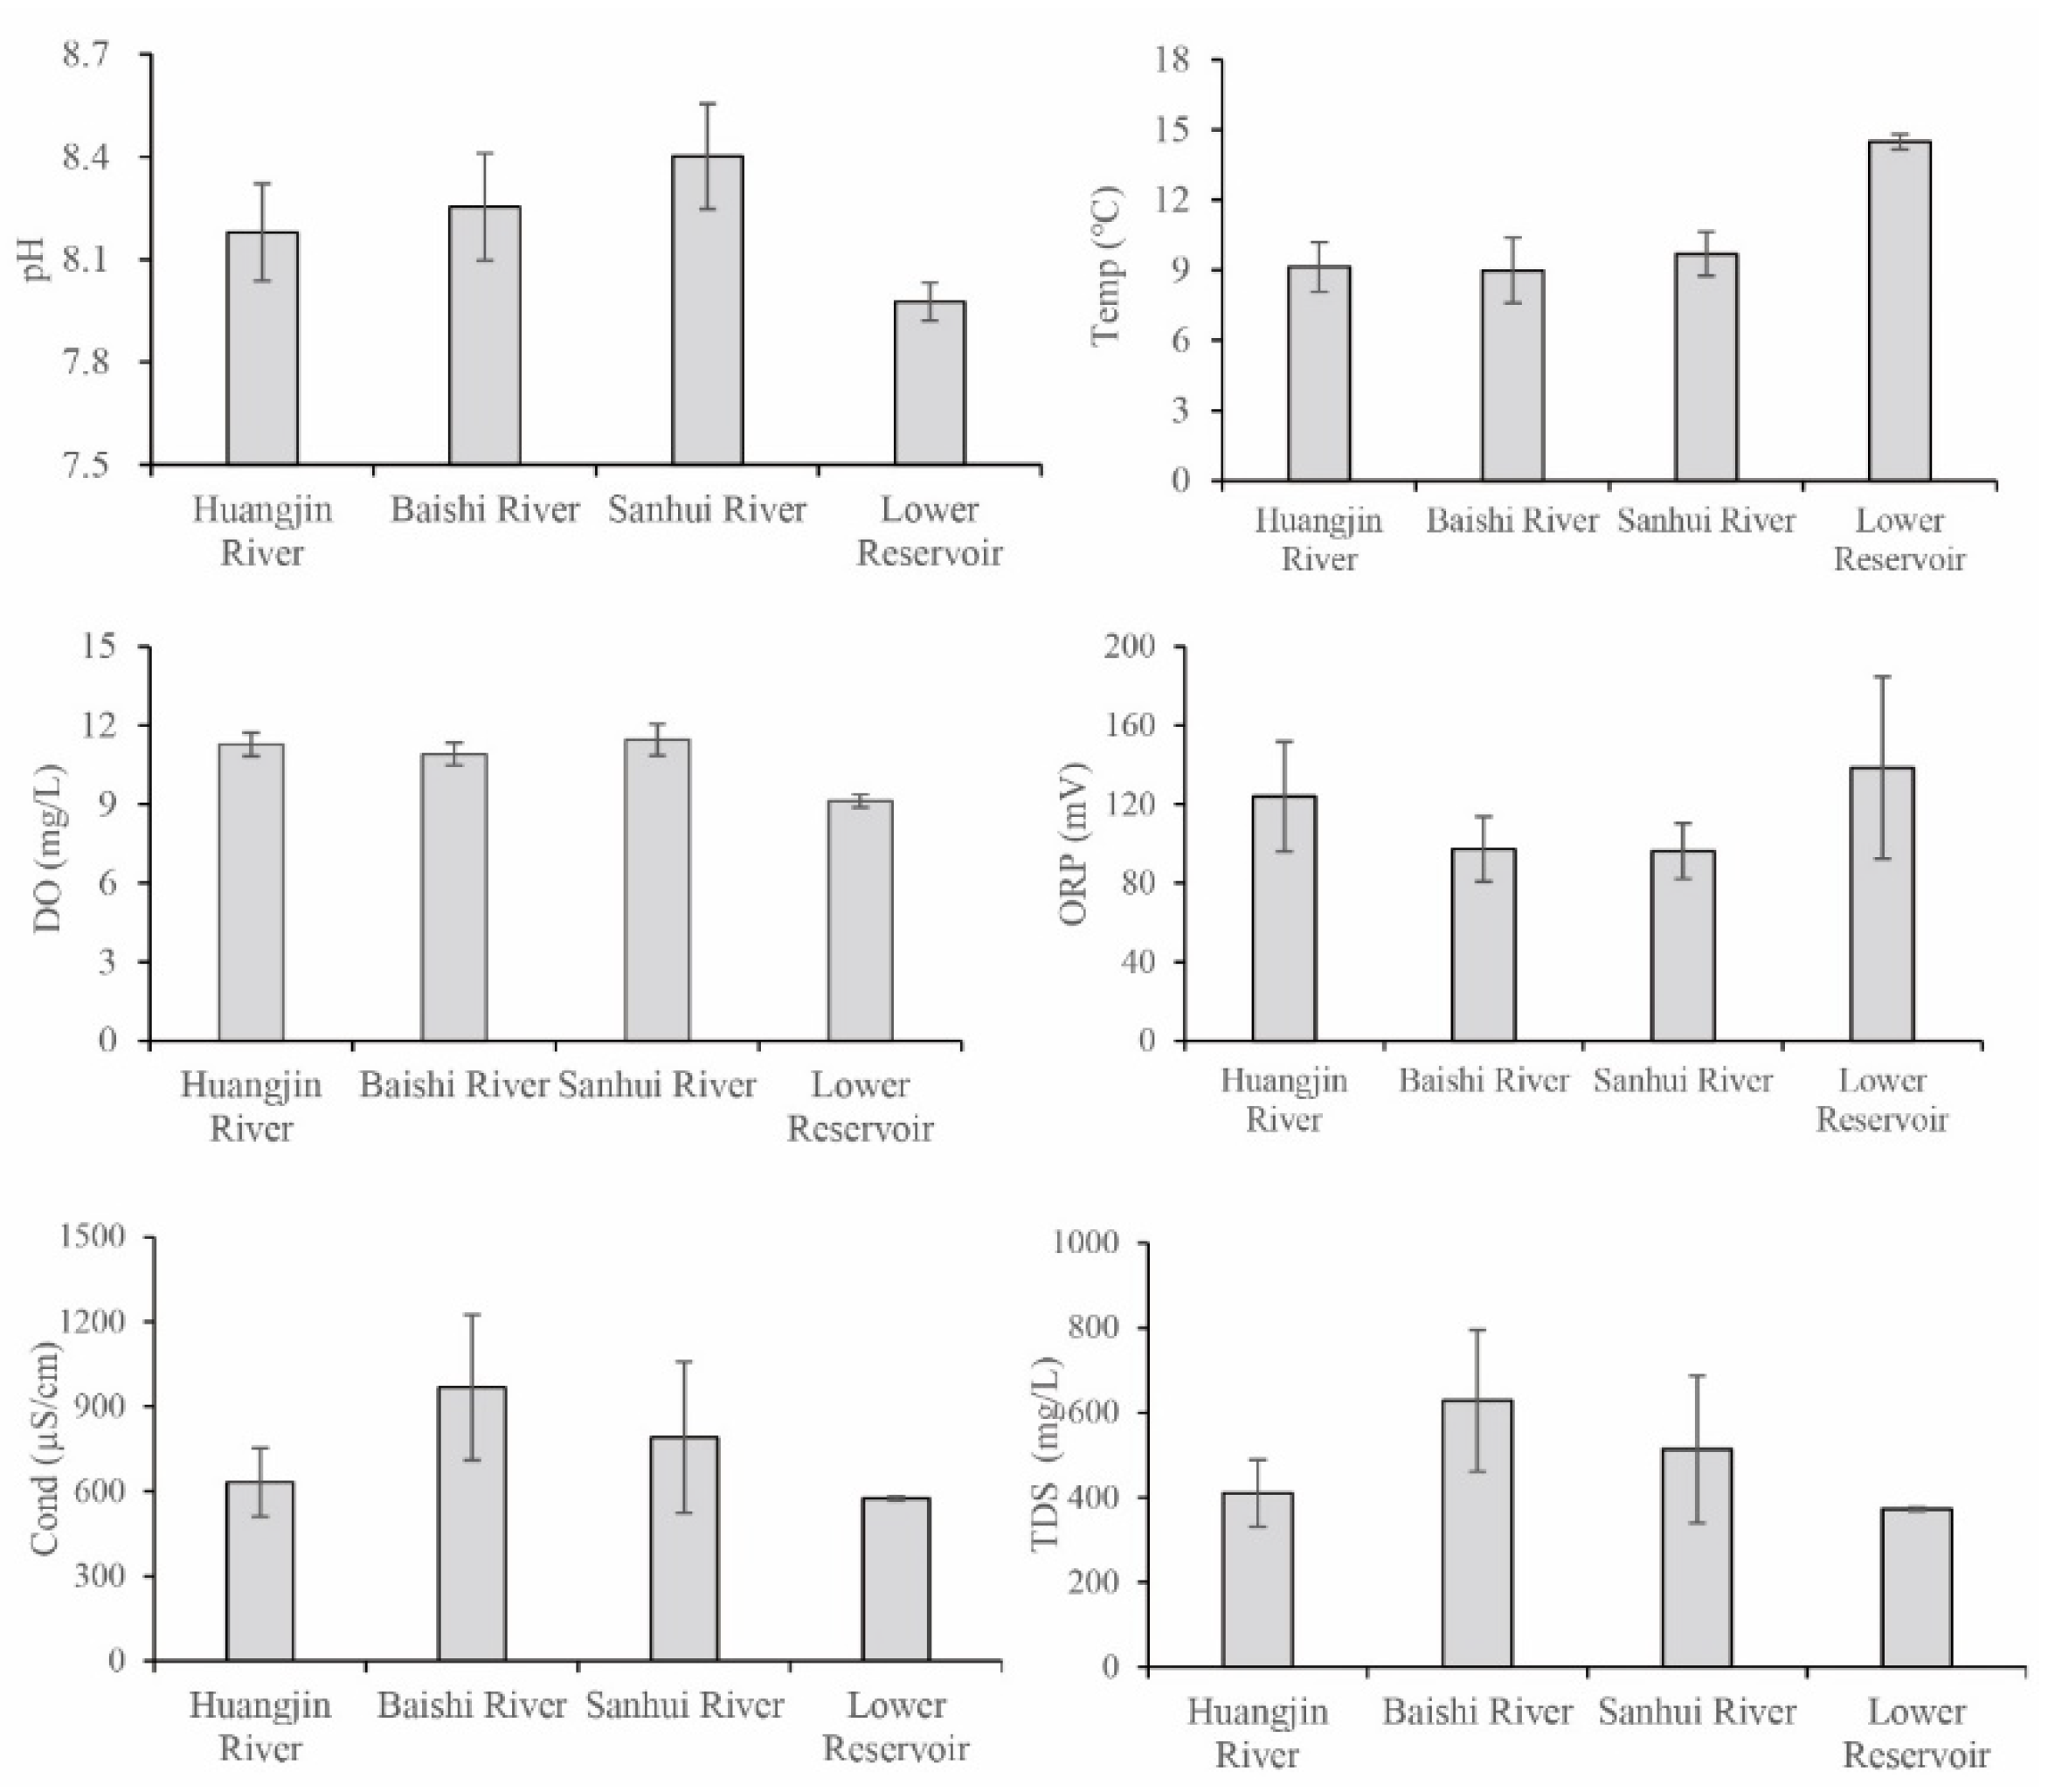
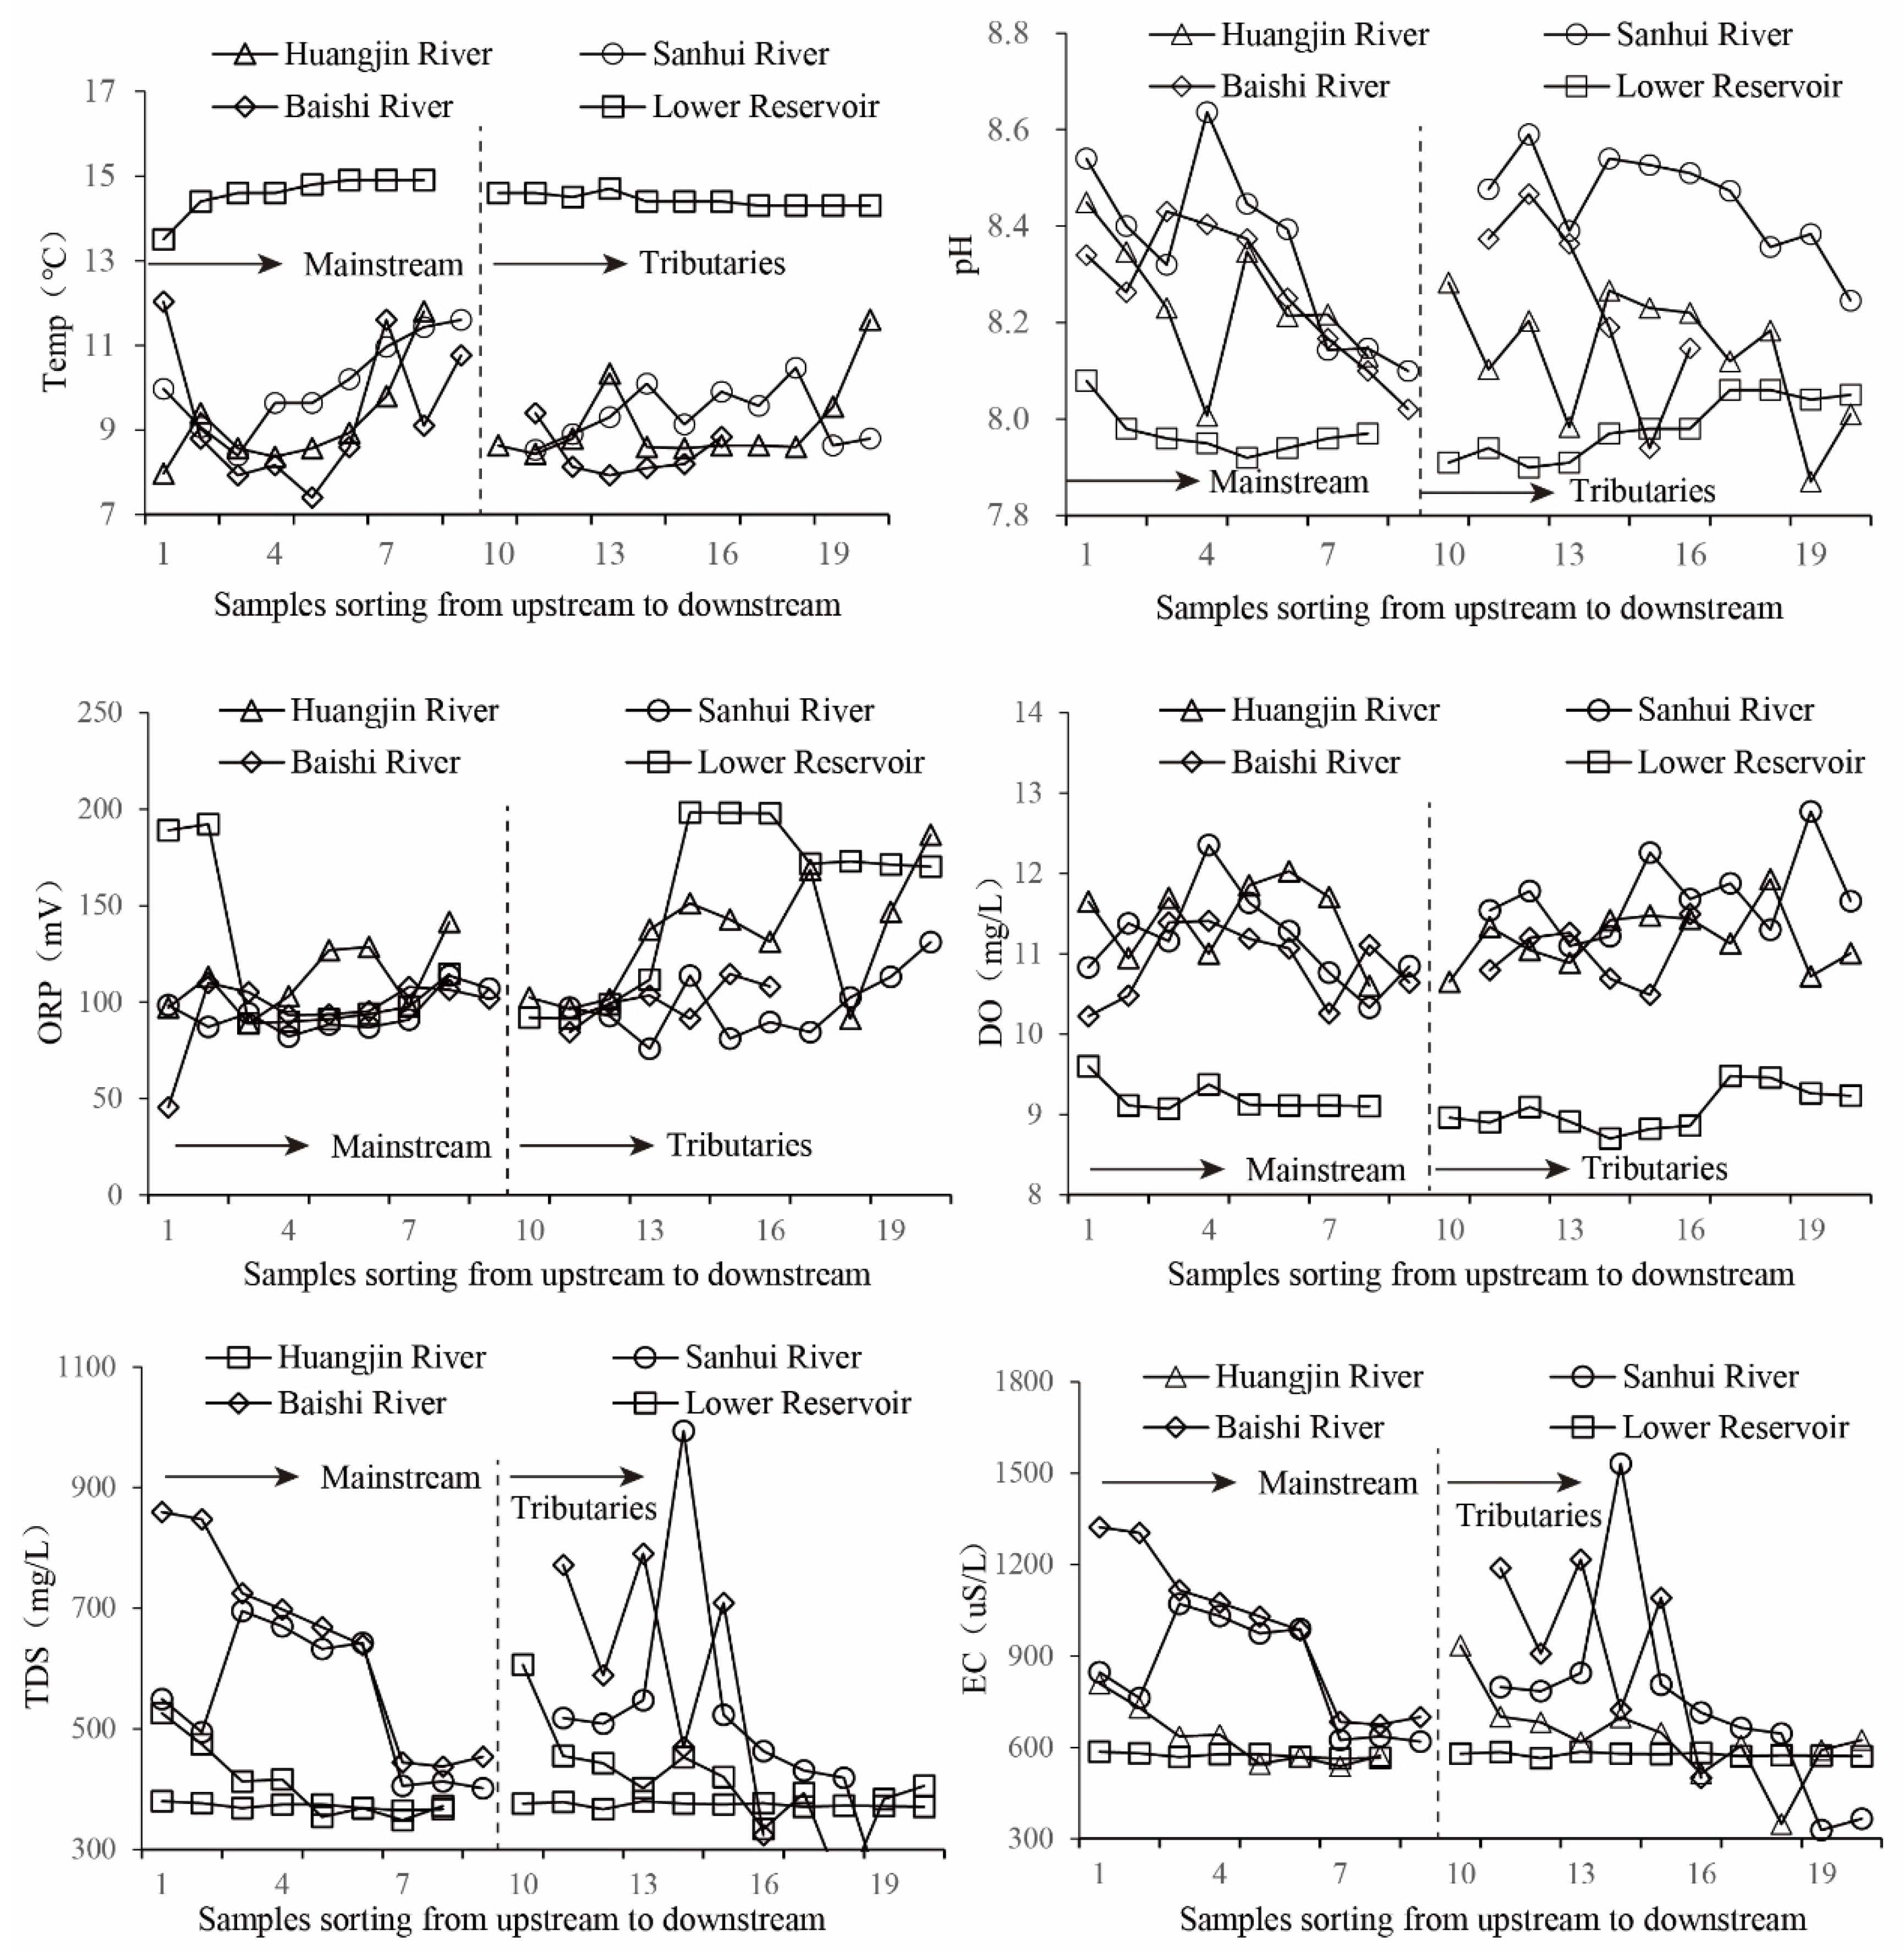
3.1. Physical and Chemical Parameters

During the sampling period, the pH value ranged from 7.87 to 8.64, showing moderately alkalescent. The TDS value fluctuated from 213.00 to 994.33 mg/L, with an average of 473.31 ± 154.87 mg/L, which was higher than the global rivers’ average [11]. It was also higher than that in the Xijiang River Basin, where carbonate rock was widely distributed (150.60~212.70 mg/L) [23], and about twice the TDS of the Yangtze River (231~261 mg/L), Wujiang River (273 mg/L), and Jialing River (269 mg/L) in Chongqing [6]. The above phenomenon was likely due to the sampling period in December with little rainfall when the dissolved solute was relatively enriched in the river. The riverine DO, Cond, and ORP values were 8.7~12.77 mg/L, 328.67~1530.33 µS/cm, and 45.47~198.20 MV in the basin, respectively. The riverine hydrochemical parameters showed obvious spatial distribution characteristics. Specifically, the average of pH, DO, Cond, and TDS in the downstream of the Ganjing River were lower than those in the Huangjin River, Sanhui River, and Baishi River (Figure 2). Meanwhile, the spatial variation of riverine temperature and ORP was reversed. In addition, the standard deviations of water temperature, pH, DO, Cond, and TDS in the lower reservoir area of the Ganjing River were smaller than those in other river sections. The above analysis results illustrated that hydrochemical parameters were relatively stable in the lower reservoir area owing to the backwater caused by TGR.

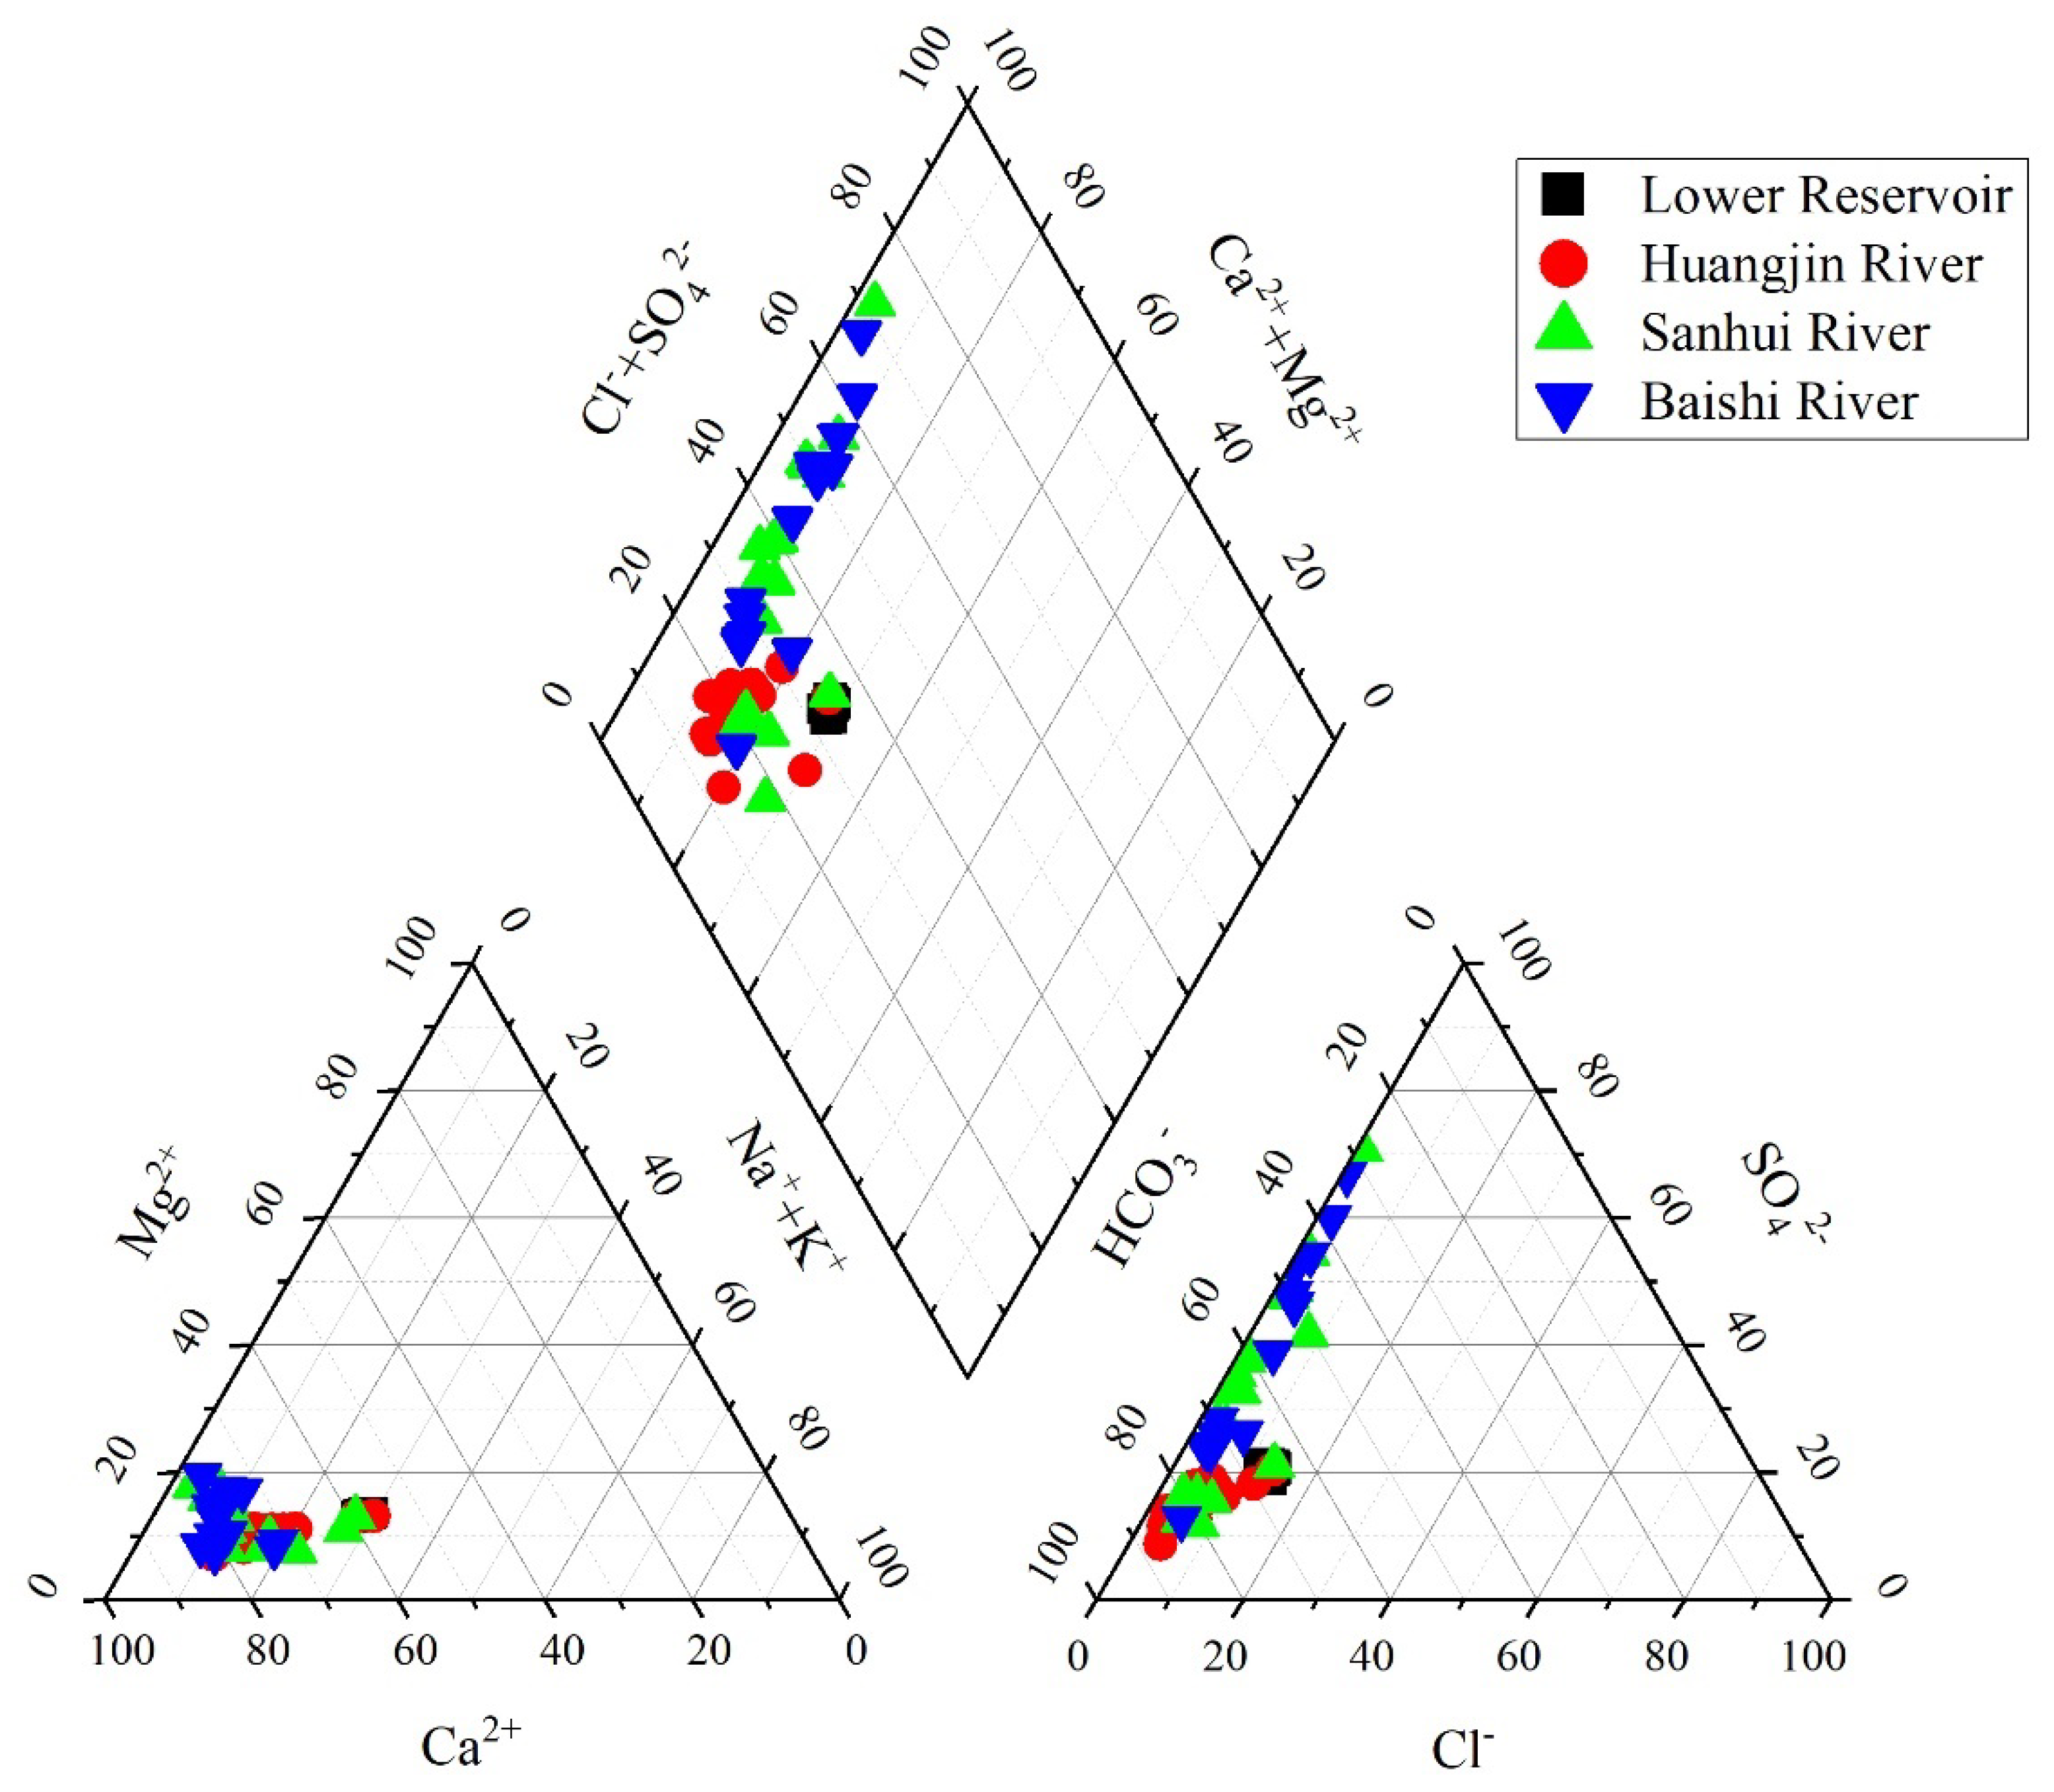
3.2. The Analysis of Riverine Main Ions

The average concentrations of K+, Na+, Ca2+, and Mg2+ were 61.15 ± 25.51 µmol/L, 599.44 ± 245.14 µmol/L, 1830.37 ± 783.49 µmol/L, and 545.66 ± 312.49 µmol/L, respectively. Ca2+ was the main component in the cations, accounting for 43.83~74.53% (Figure 3). The HCO3 ranged from 1542.87 to 5542.16 μmol/L and accounted for 70.48% of anions. Concentrations of Cl, NO3, and SO42− were from 97.53 to 743.68 μmol/L, 15.77 to 464.01 μmol/L, and 164.43 to 4943.44 μmol/L, respectively. The concentrations of Ca2+ and HCO3 in the lower reservoir area were lower than those in other river sections, which was likely related to supersaturated deposition of calcium carbonate caused by HCO3 absorption of aquatic organisms or CO2 release because of reduced hydraulic conditions. Compared with the main tributaries in the Yangtze River Basin, the ion composition in the Ganjing River was similar to that of the Wujiang River, Jialing River, and Minjiang River Basin [6].
The main cationic charges (TZ+ = K+ + Na+ + Ca2+ + Mg2+) and the anionic charges (TZ = Cl + NO3 + SO42− + PO43− + HCO3) ranged from 2323.06 to 13,414.87 ueql/L and 2214.05 to 13,146.80 ueql/L, with the average of positive and negative charges 5412.59 ± 2019.10 ueql/L and 5335.50 ± 2018.89 ueql/L, respectively. The inorganic charge balance indexes were mostly within ±10%, revealing that the water was less affected by anthropogenic pollution. The ionic charges had significant spatial variation, with the average in the Baishi River, Sanhui River, Huangjin River, and the lower reservoir area of the Ganjing River being 7130.20 ueql/L, 5988.30 ueql/L, 4606.00 ueql/L, and 4287.49 ueql/L, respectively.

3.3. Correlation Analysis of Hydrochemical Parameters

Riverine pH and ORP were significantly correlated with DO, Cond, RES, and TDS (Table 1), suggesting that pH and ORP were likely the basic indices of hydrochemical parameters. The Ca2+ and Mg2+ significantly correlated with TDS, with correlation coefficients as high as 0.96 and 0.87, which revealed that Ca2+ and Mg2+ occupied an absolute advantage in the total ions. Among the main anions, SO42− and HCO3 were significantly correlated with TDS values and constituted the main components, accounting for 88.9% of the total anions. There was a very significant positive correlation between Na+ and Cl (R = 0.96, p < 0.01), which were authenticated as the main components of substances from human activities. In addition, the TDS value had a significant negative correlation with Na+ and Cl, which revealed that the above anthropogenic effects mainly occur in areas with relatively low TDS. A significant linear correlation (p < 0.01) existed between HCO3 and K+, and Ca2+ and Mg2+, which showed a similar source and migration relationship among ions.

4. Discussions

4.1. Spatial Differentiation of Hydrochemical Characteristics

4.1.1. Physical and Chemical Parameters Variation

The water temperature gradually rose from upstream to downstream in the lower reservoir area of the Ganjing River, which was significantly higher than that in the tributaries such as the Huangjin River, Ganjing River, and Baishi River (Figure 4). Meanwhile, the temperature difference between the main stream and tributaries in the reservoir area was not obvious. The above phenomena were likely due to the water mixed effect and stratification in the lower reservoir. The pH value in the Sanhui River was generally higher than that of other river sections, and that was relatively low in the reservoir area. Due to the confluence of tributaries along the river, the pH value in the main stream of the Huangjin River, Sanhui River, and Baishi River decreased with fluctuation. The riverine ORP and DO values fluctuated with no special change pattern, which was likely affected by many factors such as velocity, water depth, aquatic organism absorption, and pollutant degradation. However, it was worth mentioning that the DO values in the reservoir area were generally lower than those of other river sections, which further confirmed the impact of limited water temperature exchange conditions owing to the large depth in the reservoir. The riverine TDS values had significant differences in different regions of the basin, especially in main streams. The TDS values in the main stream of the Baishi River were generally higher than those of other rivers, with a gradually decreasing trend from upstream to downstream. The TDS values in the Sanhui River were high at the midstream and low at both the upstream and downstream, which were consistent with its tributaries. The TDS values in the main stream of the Huangjin River gradually decreased and were generally lower than those in the Sanhui River and Baishi River. The TDS values in the lower reservoir area of the Ganjing River were generally lower than that in the other three main tributaries’ basins and were relatively stable as a whole with little spatial difference. Overall, the TDS values in the main streams generally showed a downward trend from upstream to downstream, as a result of the inflow of tributaries.

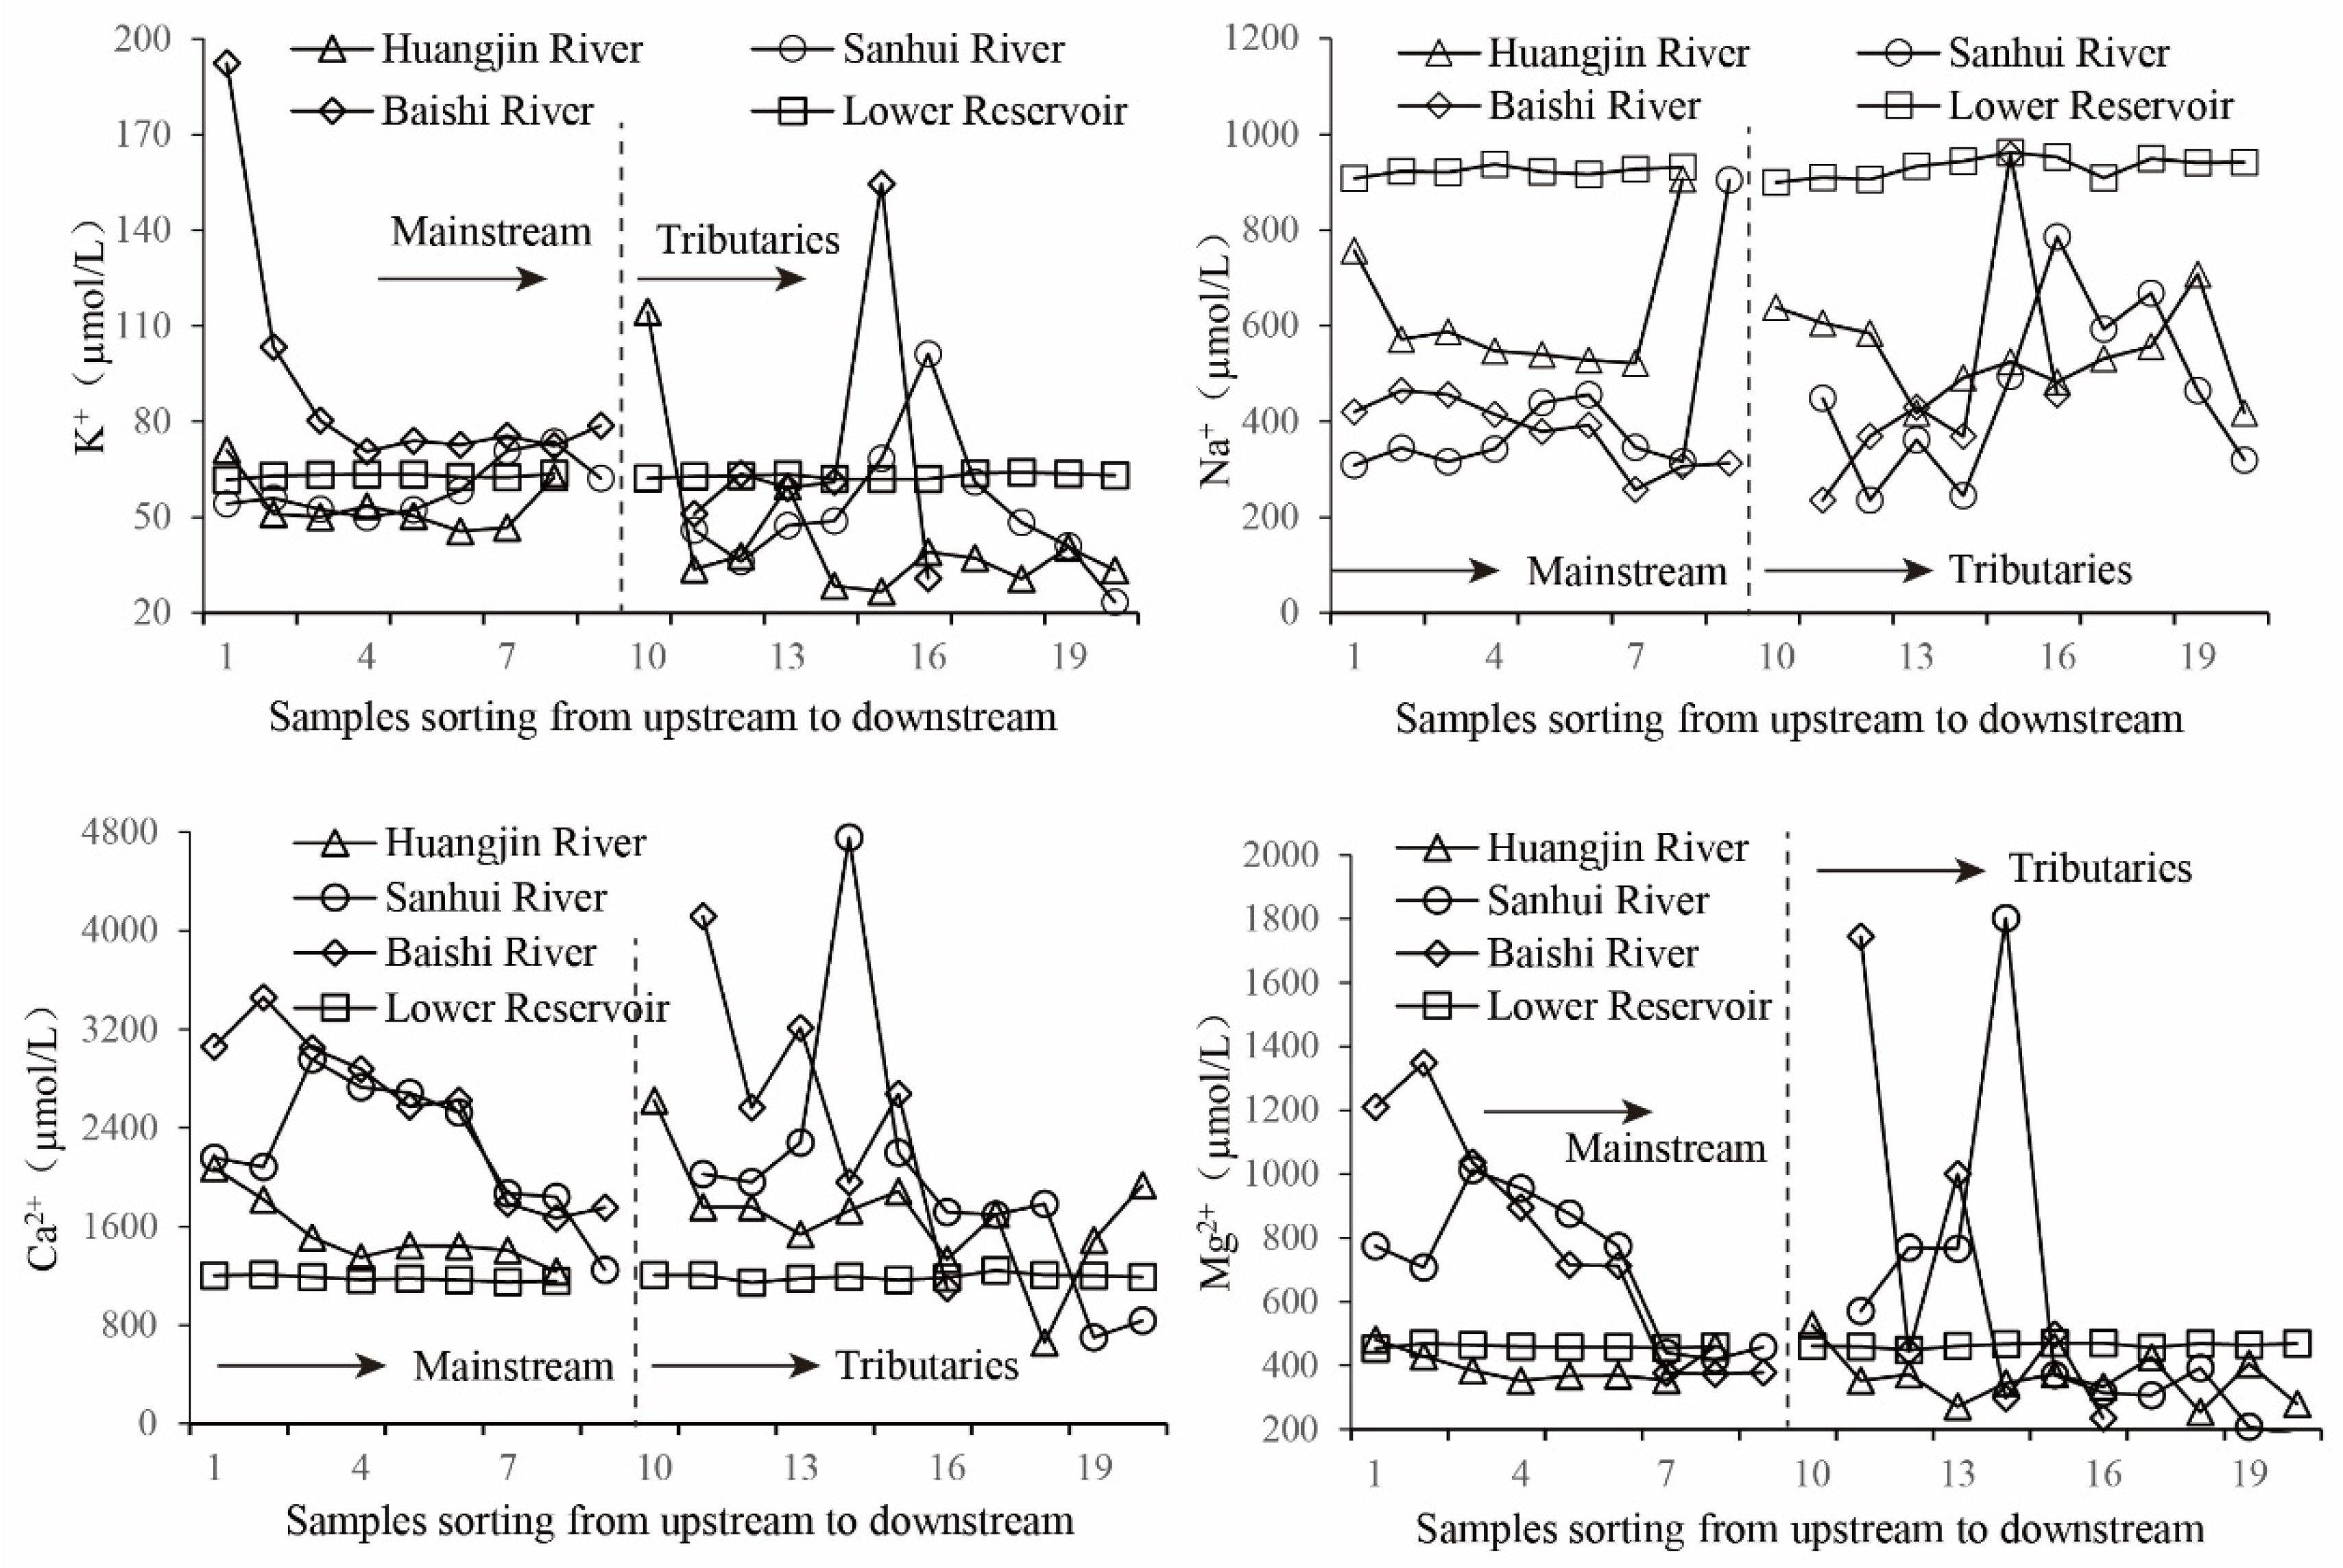
4.1.2. Spatial Characteristics of Cations

According to the spatial variation of main cations in different regions, the concentration of K+, Na+, Ca2+, and Mg2+ were relatively stable in the lower reservoir area of the Ganjing River (Figure 5), and they had different spatial variation laws, respectively. The K+ concentrations were generally higher in the Baishi River than those in other regions and generally decreased from upstream to downstream in the main stream of the Baishi River and Huangjin River. However, the K+ concentrations increased gradually from upstream to downstream in the main stream of the Sanhui River, and those were relatively stable as a whole in the reservoir area. The Na+ concentrations had significant spatial variations in different regions, which was the most in the main stream. In addition, the Na+ concentrations were generally higher in the reservoir area than those in other regions, followed by the Huangjin River. The variations of Na+ concentrations appeared to cross-distribute in the main streams of the Baishi River and Sanhui River, which were higher in the upper reaches of the Baishi River than those in the lower reaches of the Sanhui River. The Na+ concentrations in the main streams of the Huangjin River and Baishi River decreased gradually, while those in the main stream of the Ganjing River increased first and then decreased. The Na+ concentration in the estuary of the Huangjin River and Sanhui River rapidly increased to the values in the reservoir, which was largely affected by the backflow of the reservoir area. The Ca2+ and Mg2+ concentrations had similar spatial variations in the basin. Except for individual points in the upper reaches of the Baishi River and Sanhui River, the Ca2+ and Mg2+ concentrations in the Huangjin River, Baishi River, and Sanhui River gradually decreased from upstream to downstream, and those in the reservoir area were generally stable.

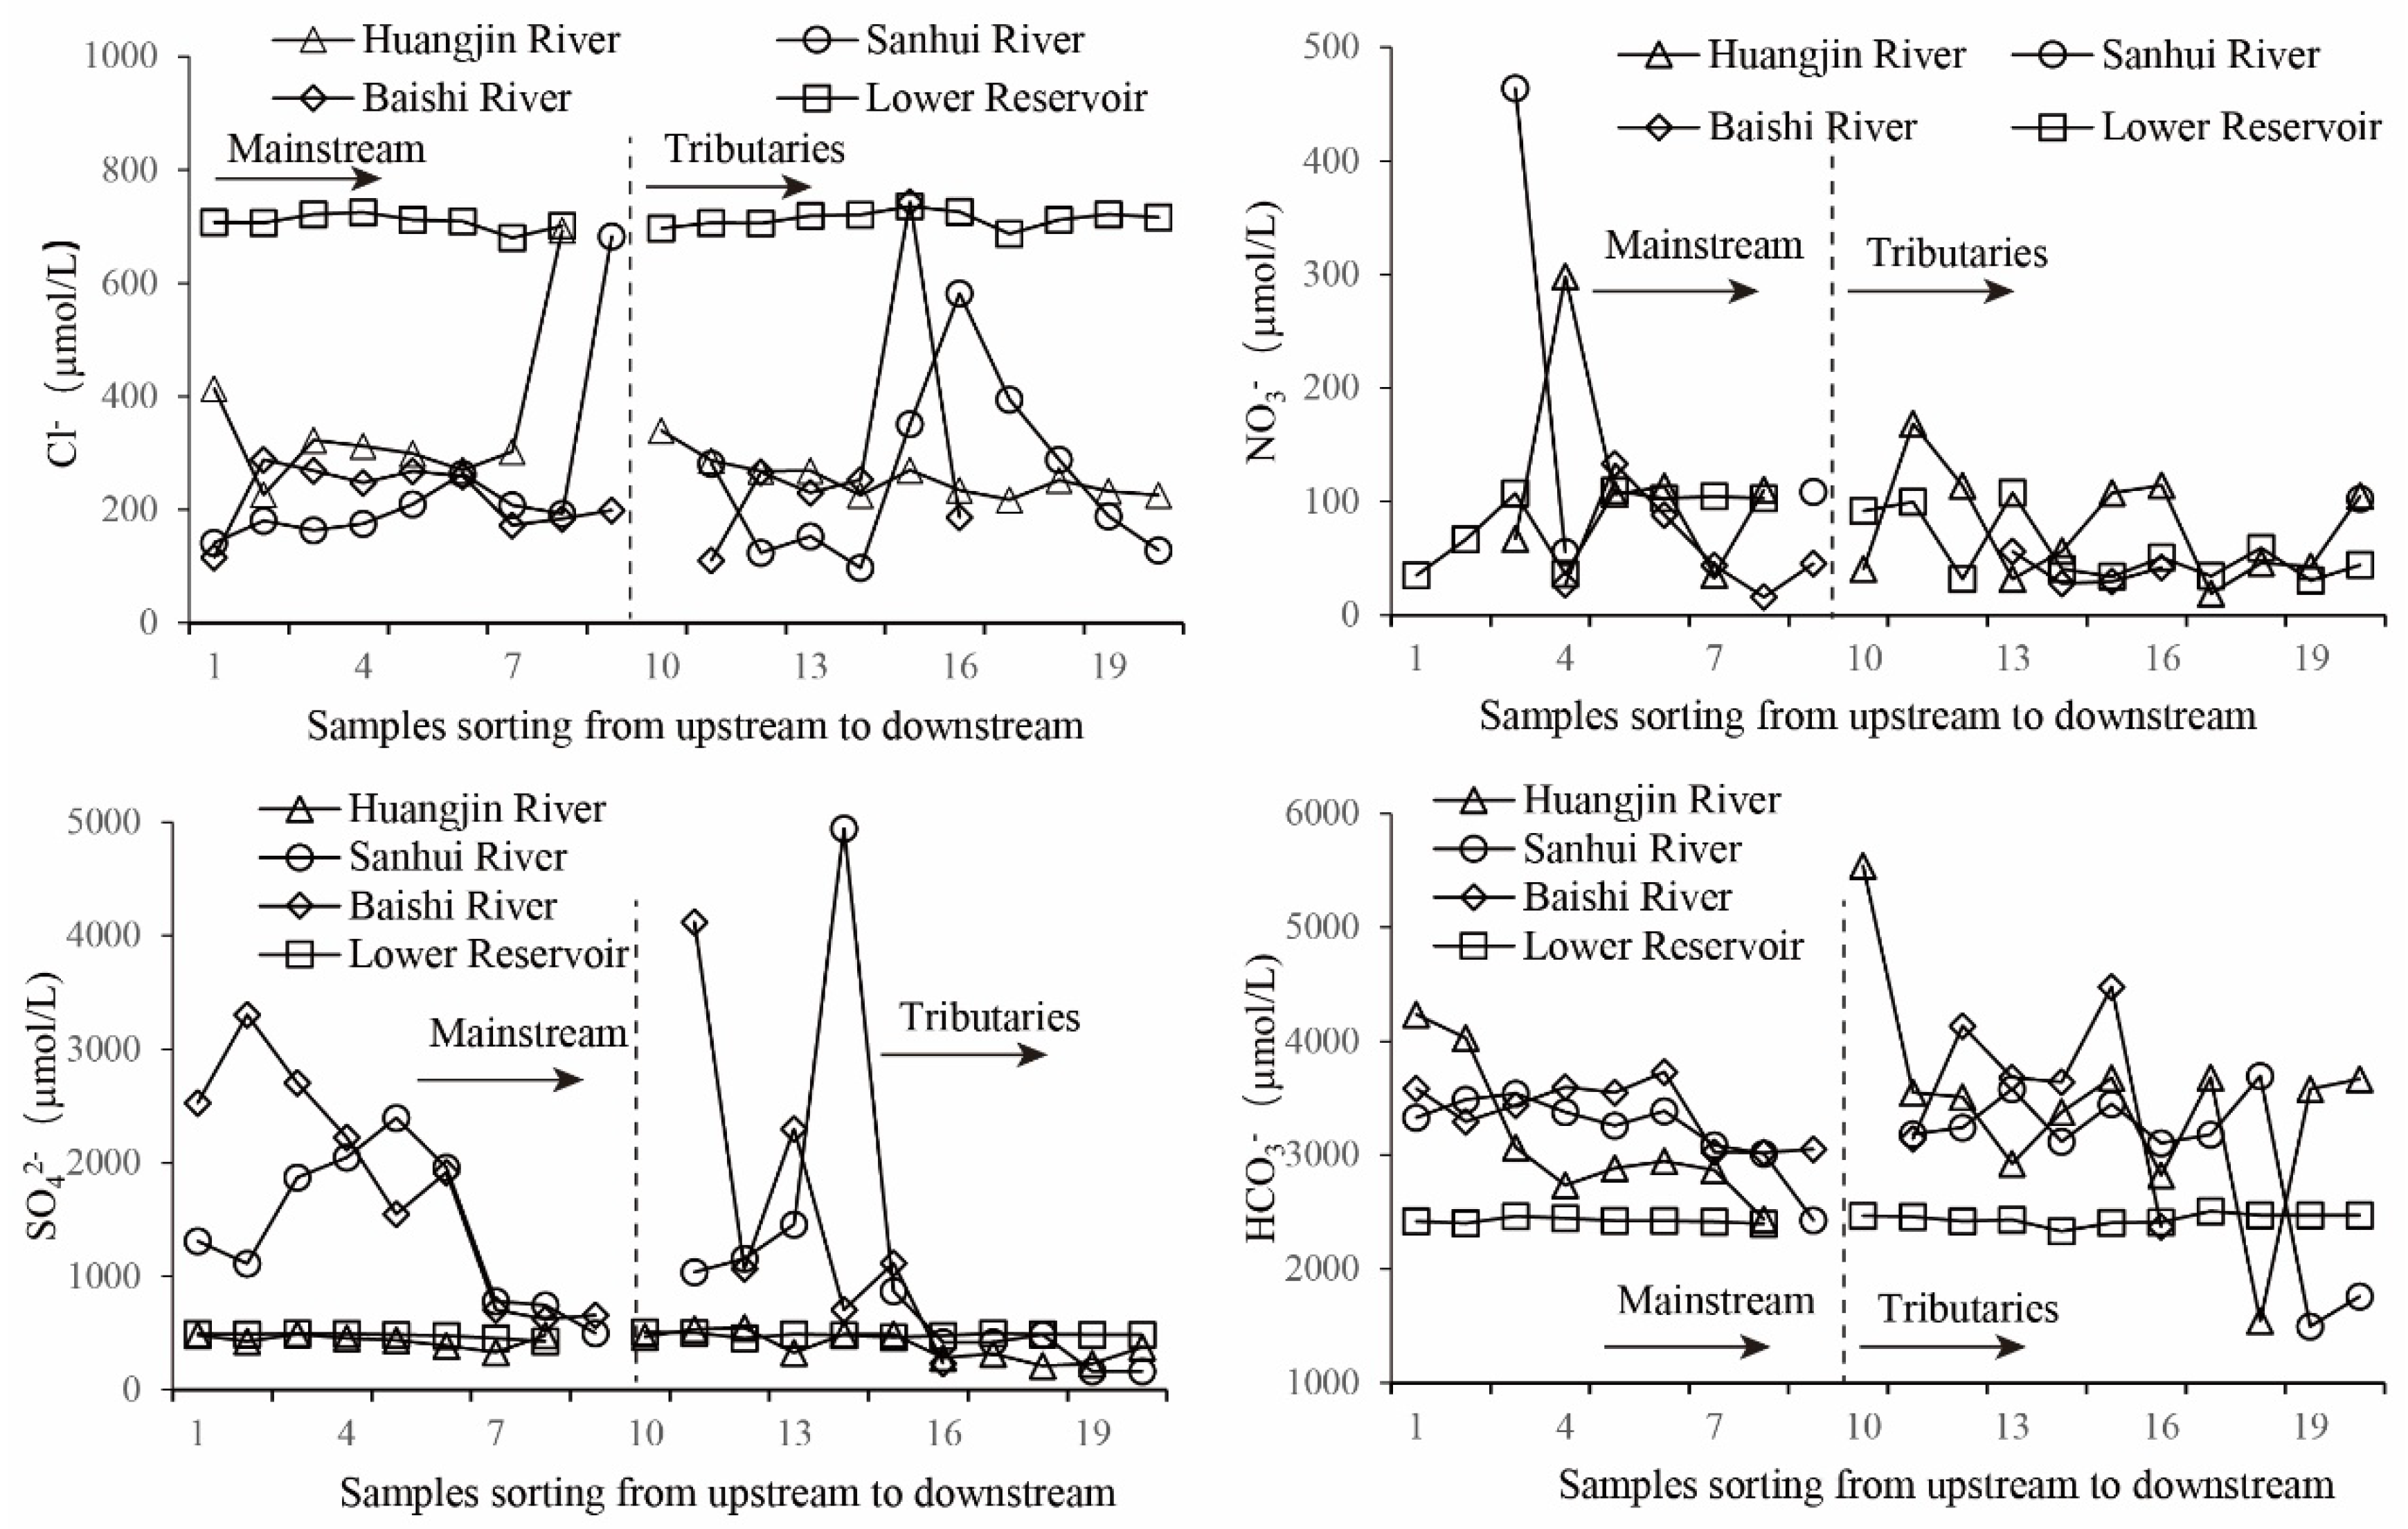
4.1.3. Spatial Characteristics of Anions

The Cl concentrations decreased gradually from upstream to downstream as a whole in the main streams of the Huangjin River and Baishi River, except for individual points (Figure 6). However, the Cl concentrations gradually increased in the upper reaches of the Sanhui River and decreased in the lower reaches. The Cl concentrations in the estuaries of the Huangjin River and Sanhui River were close to that in the reservoir area, which was consistent with Na+ concentration. The Cl concentrations in the tributaries of the Huangjin River also showed a gradually decreasing trend, which was in accordance with the main stream. The NO3 concentrations had no obvious spatial variation whether in the main streams or in the tributaries. Previous studies have shown that artificial pollutants were the main source of NO3 concentrations [6], and the above phenomena reflected the randomness of human activities in the water environment. The SO42− concentrations decreased gradually from upstream to downstream in the main stream of the Baishi River, while those in the main stream and tributaries of the Sanhui River both increased first and then decreased. By comparison, the SO42− concentrations in the Huangjin River and the lower reservoir area of the Ganjing River were low, and that spatial fluctuation was not obvious. The HCO3 concentrations decreased gradually from upstream to downstream in the main stream of the Huangjin River, Sanhui River, and Baishi River, which was likely related to the decreasing trend of tributaries or the degassing of carbon dioxide. The HCO3 concentrations were generally stable, with an average concentration of about 3532.13 umol/L, and decreased to 3025.45 umol/L after passing the Baishi Reservoir.

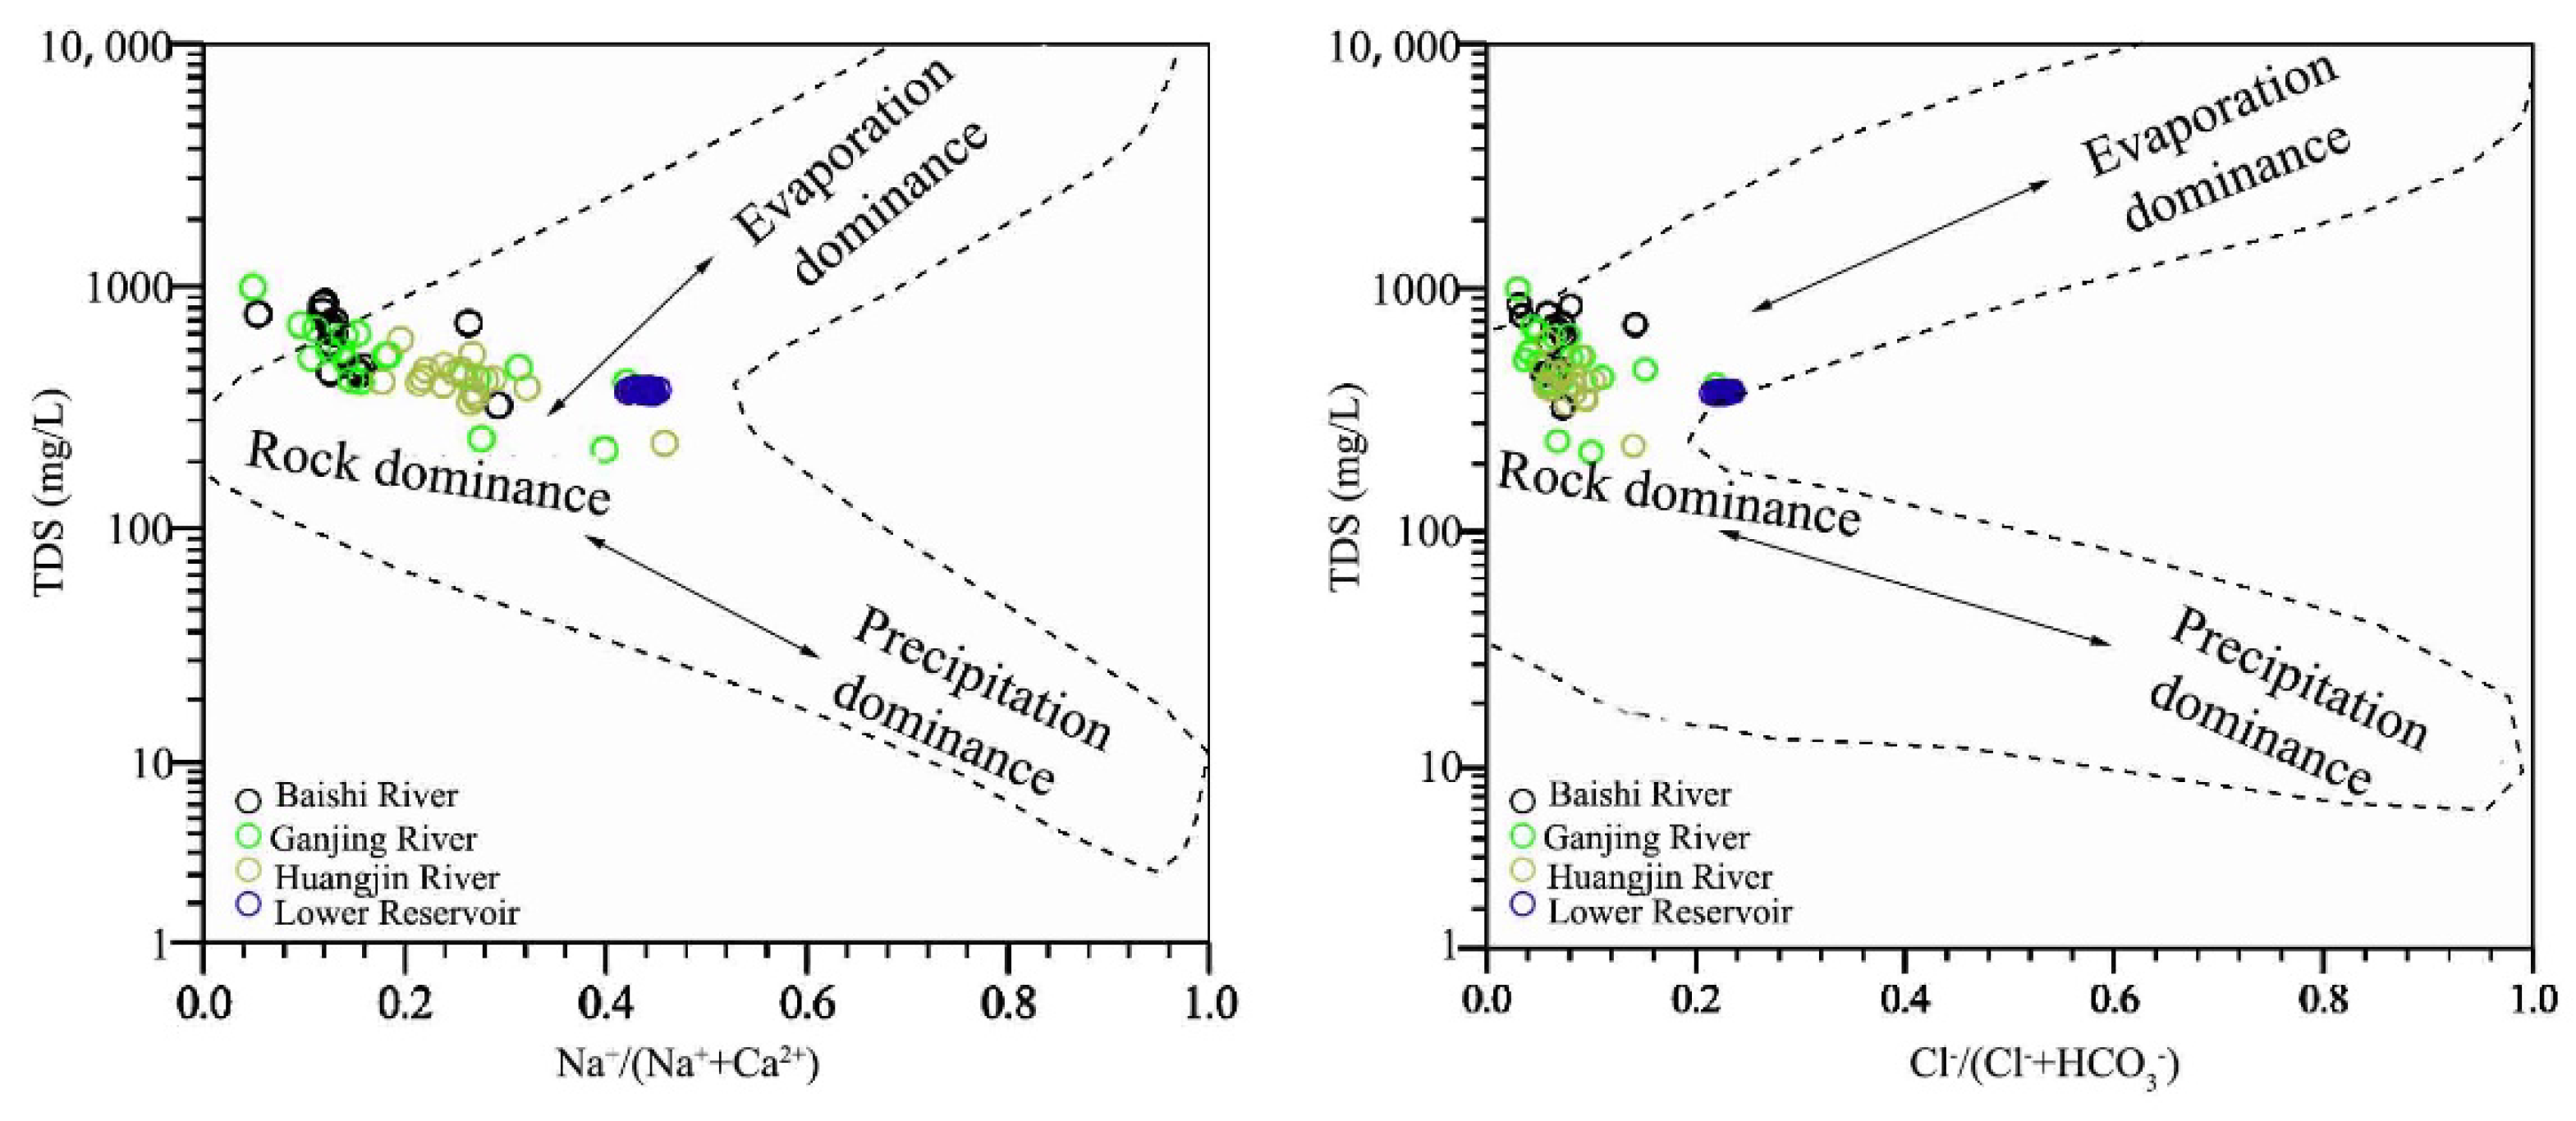
4.2. Influence of Rock Weathering on Hydrochemistry

The riverine hydrochemistry was mainly controlled by rock weathering, atmospheric rainfall, and evaporation crystallization under natural conditions [8,11,24]. There were low TDS values and high ratios of Na+/(Na+ + Ca2+) and Cl/(Cl + HCO3) in the riverine water controlled by atmospheric rainfall, while high TDS values and low ratios of Na+/(Na+ + Ca2+) and Cl/(Cl + HCO3) in the riverine water were controlled by evaporation crystallization. In contrast, the ratios of Na+/(Na+ + Ca2+) and Cl/(Cl + HCO3) in the riverine water controlled by rock weathering were generally low [8]. The TDS values in the Ganjing River Basin ranged from 213.00 to 994.33 mg/L (Figure 7), and the ratios of Na+/(Na+ + Ca2+) and Cl/(Cl + HCO3) were 0.05~0.46 and 0.03~0.24, respectively, which were generally controlled by rock weathering (Figure 7). According to the distribution of Gibbers, the ratios of Na+/(Na+ + Ca2+) and Cl/(Cl + HCO3) were generally high and relatively concentrated in the lower reservoir area of the Ganjing River, compared with other river sections.
The concentration ratios of the main ions to Na+ in riverine water were usually standardized to eliminate the influence of the dilution effect and evaporation effect when the qualitative studies of major ionic sources were conducted [4,11,23]. Results showed that the riverine hydrochemistry characteristics in the basin were located between silicate rock and carbonate rock weathering ends (Figure 8). In contrast, the Baishi River and Sanhui River were more inclined to the end element of carbonate rock weathering, followed by the tributary of the Huanjin River. The riverine hydrochemistry characteristics in the reservoir area were close to the end of silicate rock weathering. The average values of Ca/Na, Mg/Na, and HCO3/Na in the basin were 4.04, 1.21, and 6.21, respectively, which were slightly higher than the average values of hydrochemistry in the Yangtze River Basin (2.51, 5.02, 0.88) [6], much higher than the average values of the global silicate basins (0.35, 0.24, 2) [11], and lower than the Xijiang River Basin, where carbonate rocks were widely exposed (6.14, 1.39, 12.81) [23]. Based on the above analysis, the hydrochemistry characteristics were mainly controlled by the weathering of carbonate rocks and silicate rocks. Although the reservoir was inflowed by several rivers, the ratios of end element in the lower reservoir area of the Ganjing River were lower than the average of above rivers, which revealed that the backwater of the Yangtze River had an important impact on the hydrochemistry characteristics.

4.3. The Estimation of the Ion Sources

According to the above analysis, the ions mainly came from silicate rock and carbonate rock weathering in the Ganjing River. In addition, atmospheric rainfall and human activities were also important sources [25]. The mass balance equation of riverine ions forward modeling could be expressed as:
[ X ] r i v = [ X ] a t m + [ X ] c a r + [ X ] s i l + [ X ] a n t h
where [X]riv was the riverine ions; the [X]atm, [X]car, [X]sil, and [X]anth represented the ions from atmospheric input, carbonates weathering, silicates weathering, and anthropogenic inputs, respectively.

4.3.1. Atmospheric Input

The riverine water in the Ganjing River was mainly supplied by atmospheric rainfall, which was an important source of ions in the river [4,26,27]. Atmospheric rainfall was collected in the upper, middle, and lower reaches of the basin during the sampling period, and the ionic compositions were analyzed. The K+, Na+, Ca2+, Mg2+, Cl, NO3, and SO42− were 12.19 µmol/L, 25.93 µmol/L, 23.71 µmol/L, 5.42 µmol/L, 45.89 µmol/L, 6.38 µmol/L, and 22.05 µmol/L, respectively. The ion concentrations sourced from atmospheric input can be calculated according to Equation (2). The annual average rainfall in the Ganjing River Basin was 1200 mm, and the annual runoff depth was 529.67 mm. By calculation, the amount of K+, Na+, Ca2+, Mg2+, Cl, NO3, and SO42− from atmospheric rainfall accounted for 51.4%, 11.7%, 3.4%, 2.8%, 38.1%, 27.8%, and 11.4% of the riverine ion concentrations, respectively (Table 2).
X r i v * = P D × X r a i n
where X riv * was X ionic concentration from atmospheric rainfall in rivers (μmol/L). Xrain was the X ionic concentration in atmospheric rainfall. P and D denote the annual average precipitation (1200 mm) and runoff depth (529.67 mm), respectively.

4.3.2. Anthropogenic Input

Previous studies have shown that domestic water discharge and agricultural fertilization were usually the main forms of human activities, which largely caused the enrichment of Cl, Na+, K+, and NO3 in the river [4,6]. There was no evaporite exposed in the Ganjing River Basin, the remaining Cl and NO3 were all attributed to anthropogenic sources after deducting the atmospheric sedimentation sources. Previous research gave the ratios of Cl, NO3, and SO42− between the above material sources, which were 8.5, 1.8, and 2.0, respectively [26]. The ratio of Cl to Na+ in the domestic water was close to 1.15 in the sea salt [11]. Taking the molar ratios of NO3/Na (4), Cl/Na (5), and K/NO3 (0.35) from agricultural activities and K/Na (0.16), Mg/Na (0.2), and Ca/Na (0.8) from urban activities into account [6], the amount of major ions from domestic emission were calculated. Accordingly, the amount of K+, Na+, Ca2+, Mg2+, Cl, NO3, and SO42− from human activities accounted for 17.23%, 31.85%, 12.81%, 9.89%, 61.95%, 72.17%, and 26.26%, respectively. Among the above anthropogenic sources, the ratio of domestic emission sources to agricultural activity sources was 4.79.

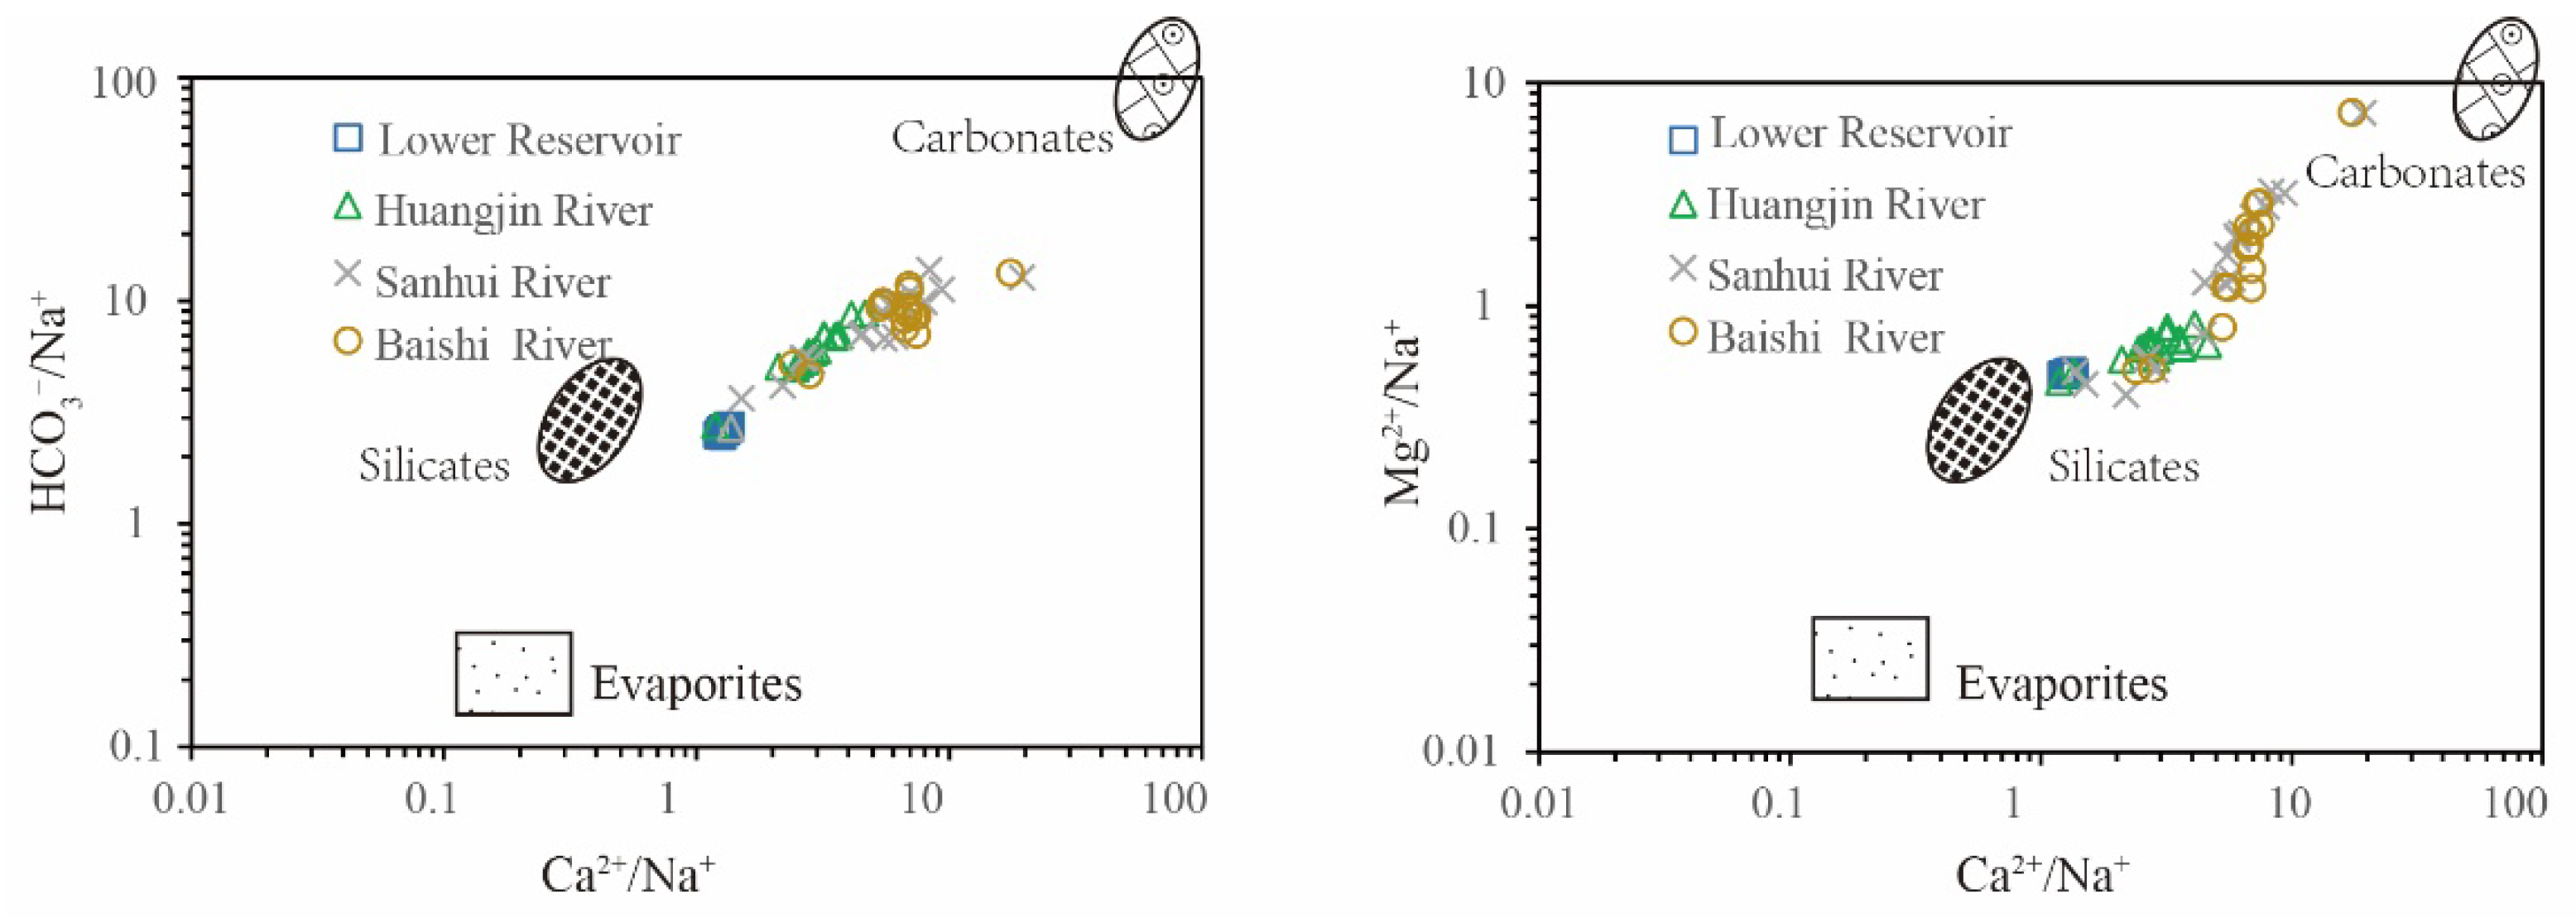
4.3.3. Rock Weathering Sources

The remaining ions, deducting atmospheric inputs and anthropogenic inputs, were mainly derived from the chemical weathering of carbonate and silicate minerals, which was verified by the end members graph (Figure 8). The ratios of Mg/Na and Ca/Na in the typical silicate and carbonate basins, respectively, were 0.2, 0.35 and 50, 10 [11,28]. According to the above ratios, K+, Mg2+, Ca2+, and Na+ deducting atmospheric and anthropogenic inputs were divided into silicate and carbonate weathering sources. Correspondingly, the sources of HCO3 were divided, considering the equilibrium relationship with cations. According to the stratigraphic setting in the basin, there was not enough evidence to support the existence of pyrite and gypsum. The precipitation (acid precipitation) was likely the main source of SO42−, which also participated in rock weathering. Therefore, the remaining ion charges were supplemented by SO42−, and the SO42− produced from rock weathering sources could be calculated.

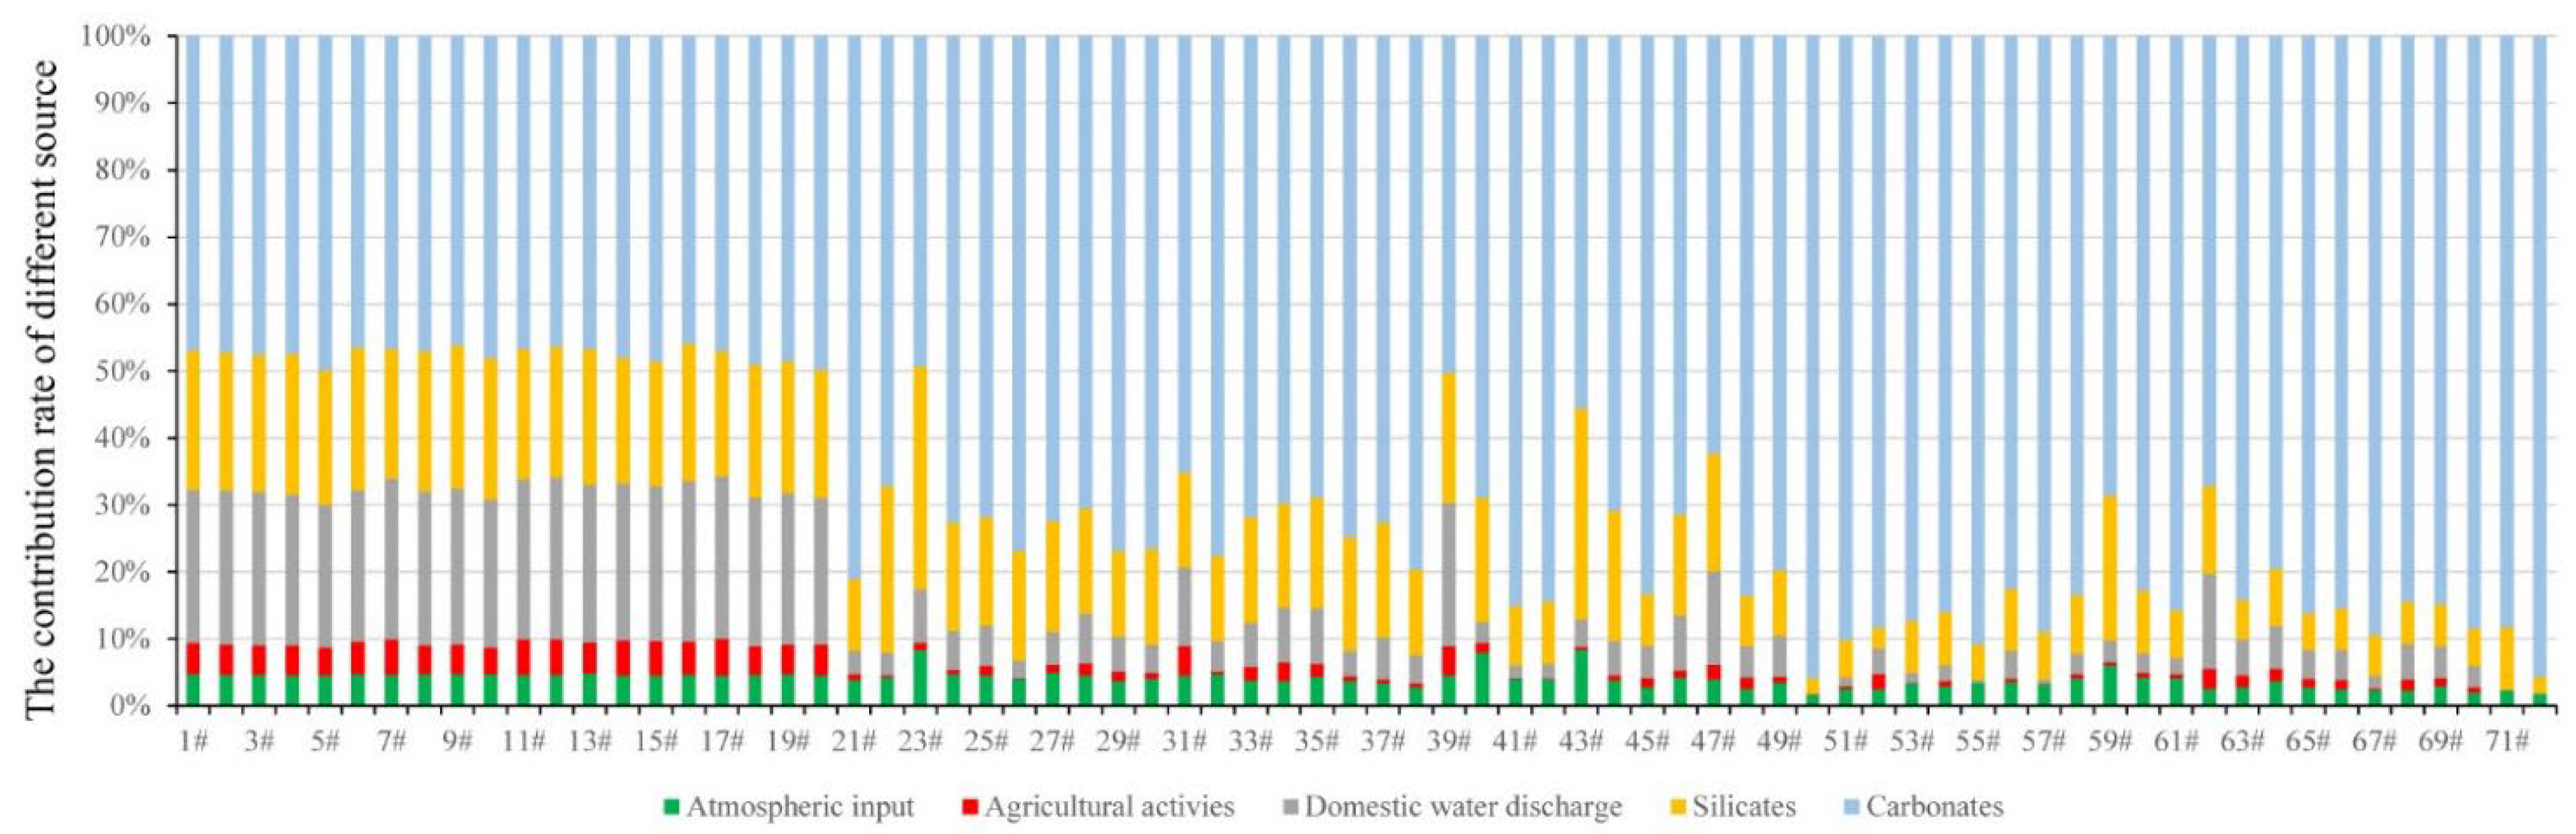
4.3.4. The Contribution Rates

According to the above ionic sources analysis, the mean contribution rates of atmospheric rainfall, agricultural activities, domestic emission, silicate weathering source, and carbonate weathering source in the TDS were 4.01%, 2.09%, 9.96%, 14.38%, and 69.63% (Table 2, Figure 9), respectively. The contribution rates confirmed that the riverine hydrochemistry was mainly controlled by carbonate weathering in the Ganjing River Basin, which were generally consistent with the silicate weathering (12%) and carbonate weathering (63.9%) contribution rates in the Jialing River Basin [29]. The standard deviation of contribution rates of atmospheric rainfall in different regions was ±1.28%, and the deviation was even as low as 0.07% in the reservoir area, which indicated that the contribution rate of atmospheric rainfall in the basin was relatively stable. Anthropogenic inputs contributed 27.80% of ions in the lower reservoir area of the Ganjing River, which was seven times the average value in the other regions of the basin. Previous studies had shown that anthropogenic activities brought 20~30% of dissolved solid in the Chongqing section of the TGR [6], which confirmed that that contribution rate of anthropogenic activities was reasonable, and the hydrochemical characteristics in the lower reservoir area of the Ganjing River were mainly affected by the backwater of TGR. The average contribution rate of rock weathering in the Huangjin River, Sanhui River, and Baishi River Basins was more than 90%, and the contribution rate of carbonates weathering was even up to 78.01%, which illustrated that rock weathering was the main source of dissolved matter in the basin. The average contribution rate of carbonates weathering was 10 times that of silicate weathering in the Baishi River Basin, and the ratios were 7.09, 4.24, and 2.36 in the Sanhui River, Huangjin River, and Lower Reservoir, respectively. The average contribution rate of carbonates weathering was 47.47% in the lower reservoir area of the Ganjing River, which was consistent with that (40~50%) in the Chongqing section of the TGR [6].

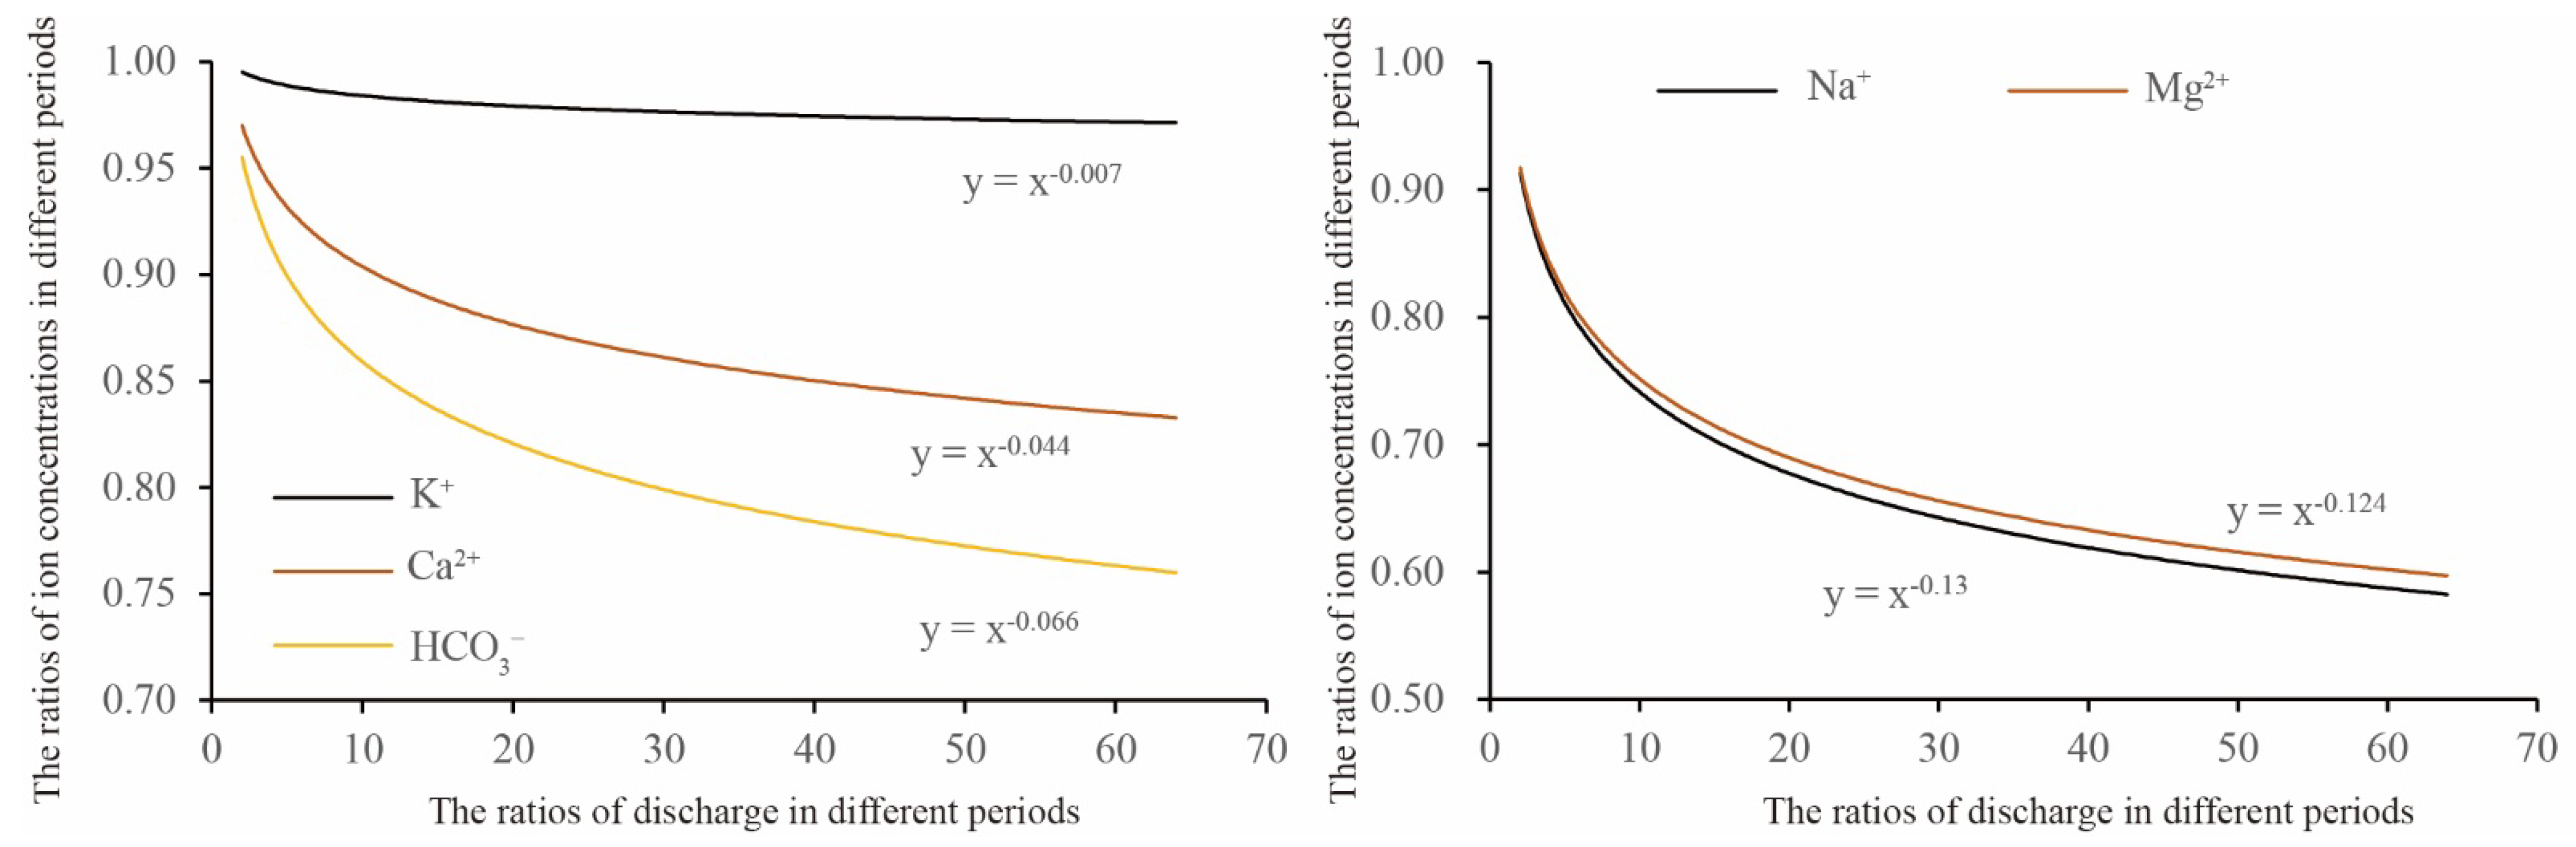
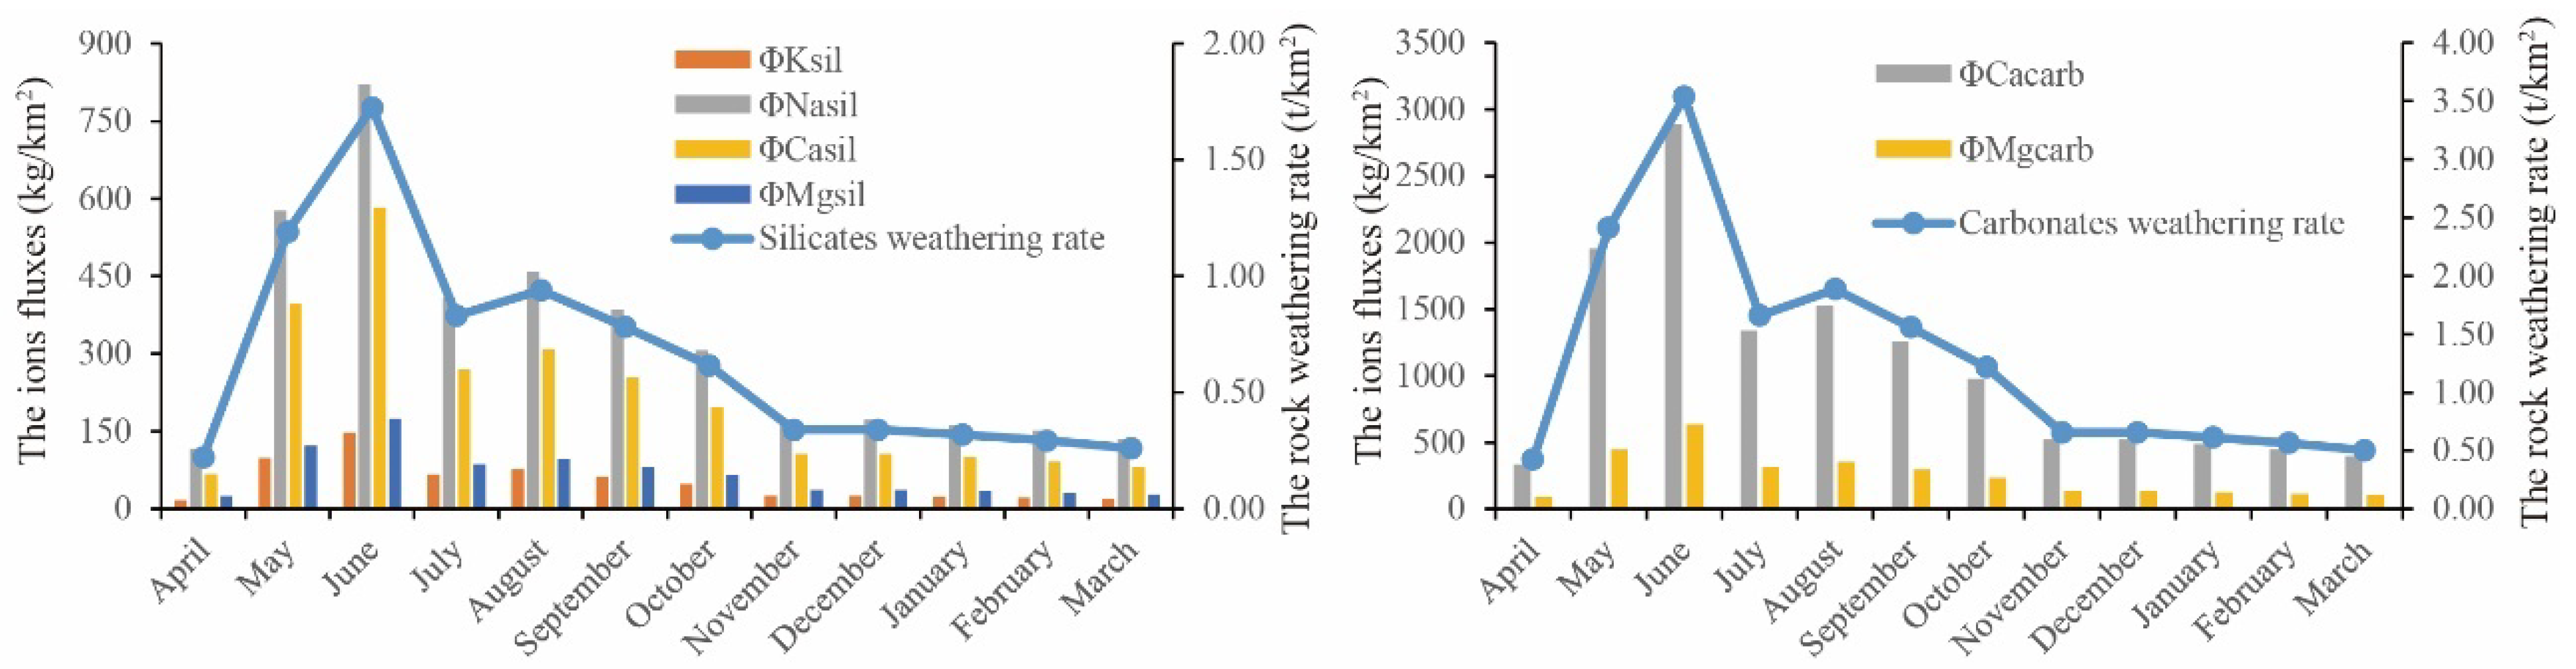
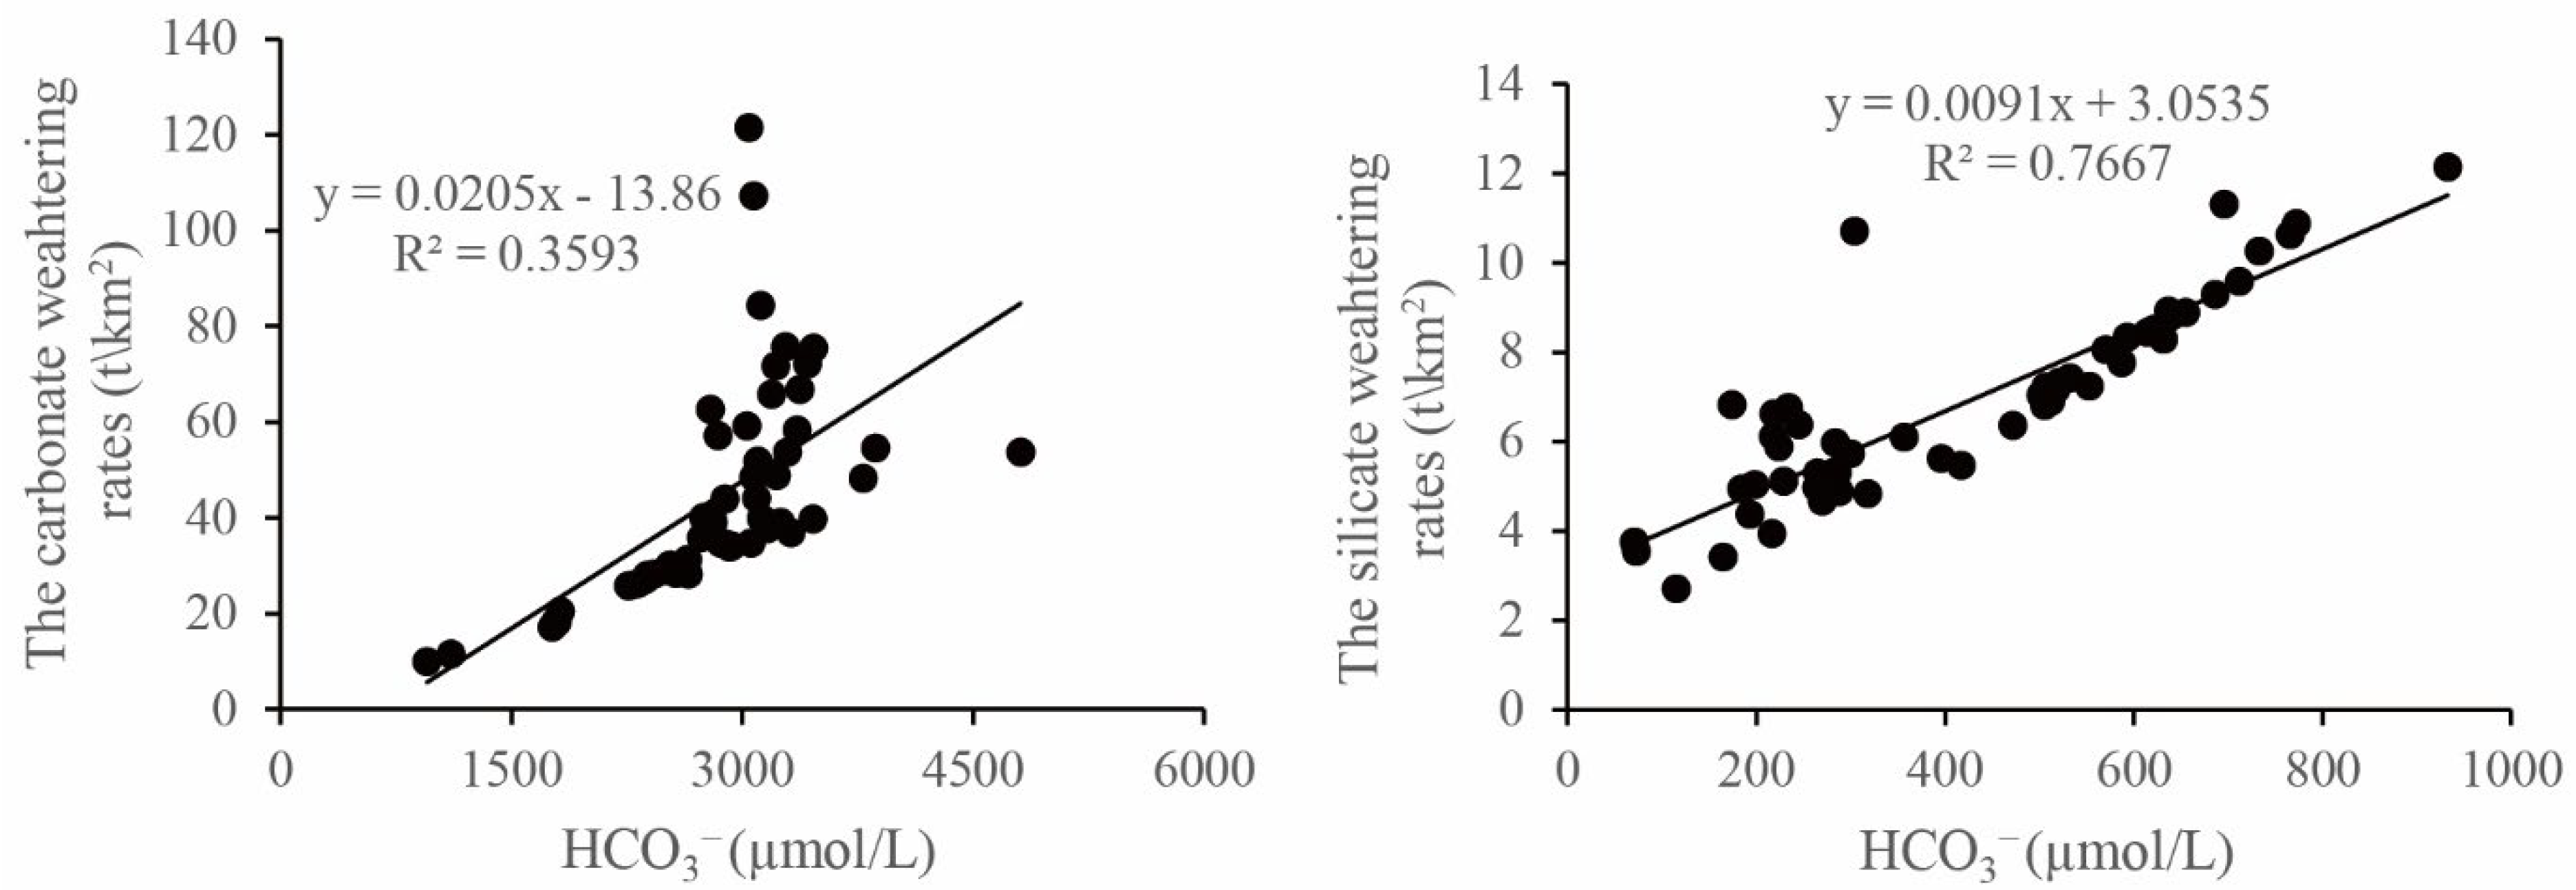
4.4. Rock Weathering and CO2 Consumption

The annual average discharge was 4.82 × 10⁸ m3 in the Ganjing River Basin, of which, 79.6% occurred in the flood season from May to October and 20.4% in the dry season from November to April. Studies have shown that the ionic concentration was the typical power function of riverine runoff (Equation (3)), which was widely used in major rivers in the world [1,29,30]. Accordingly, the ratios of ion concentration in different periods were calculated by the following formula (Equation (4)).
C i = a × Q b
C i j C i k = ( Q j Q k ) b
where Ci was the ionic concentration and Q was the discharge in the basin; the a and b denoted the regression parameters of the function. The j and k represented different periods.
Scholars have established the power function relationships between ion concentrations and riverine discharge based on the measured data in the Jialing River Basin [29]. Taking that the contribution of silicate weathering source and carbonate weathering (14.38% and 69.63%) in this basin were similar to those (12% and 63.9%) in the Jialing River Basin into consideration, the riverine ion concentrations under a different discharge were simulated through the above power function relationship (Figure 10), so as to eliminate the dilution effect caused by the change of discharge in the flood season.
According to the main cation concentrations from silicates and carbonates weathering calculated in Section 4.3, the riverine cation concentrations under different discharges were simulated with the above power function curves (Figure 10), and the cation output fluxes of different sources were counted monthly (Figure 11). Generally, the rock weathering rates including silicates and carbonates were estimated based on the cation fluxes as follows (Equations (5) and (6)).
S W R = Φ K s i l + + Φ N a s i l + + Φ C a s i l 2 + + Φ M g s i l 2 +
C W R = Φ C a c a r b 2 + + Φ M g c a r b 2 +
where SWR and CWR were silicate and carbonate weathering rates (t/km2), and the sil and carb denote the ions from silicates and carbonates weathering. The Φ meant the monthly fluxes of riverine ions.
Accordingly, the rock weathering rate was calculated as 23.54 t/km2 in the basin above 19#, in order to avoid the backwater of the TGR, of which, the silicate and carbonate weathering rates were 7.85 t/km2 and 15.68 t/km2, respectively. Among the existing research results, Chetelat et al. had calculated the silicate and carbonate weathering rates, ranging from 0.7 to 7.1 t/km2/y and 6 to 21 t/km2/y, respectively. Meanwhile, the rock weathering rates were 23.6 t/km2/y in the Jialing River [29] and 22.89 t/km2/y in the Xiaojiang River [31], which were the important tributaries in the TGR. Therefore, the above research results revealed the rationality of rock weathering rates in the Ganjing River. Moreover, the silicate and carbonate weathering rates significantly (p < 0.01) correlated with HCO3 concentrations (Figure 12). The H2CO3 formed by CO2 and H2O in the atmosphere or soil was the important acidic medium involved in rock weathering. On the one hand, the above correlation relationship further revealed the rationality of rock weathering rates in the basin; on the other hand, the rock chemical weathering was the important carbon sink process in the basin.
Riverine HCO3 concentration was the important basis for estimating the carbon sink capacity of rock chemical weathering in the basin, which mainly came from carbonate and the atmospheric or soil CO2 absorbed by rock weathering. Therefore, the half of HCO3 stemming from carbonate mineral weathering should be deducted when the actual carbon sink capacity is calculated in the basin [13]. The HCO3* monthly output fluxes were simulated by the power function between HCO3 concentration after deduction and riverine discharge. On this basis, the HCO3* flux produced from silicate and carbonate weathering was calculated by the following Equation (7).
H C O 3 * = [ H C O 3 ] s i l + 1 2 [ H C O 3 ] c a r b
                  [ Φ C O 2 ] = Φ H C O 3 * / S
Accordingly, the atmospheric CO2 consumption flux was 6.88 × 10⁵ mol/y/km2 (Equation (8)), of which, the 2.67 × 10⁵ mol/y/km2 and 3.59 × 10⁵ mol/y/km2 originated from silicates and carbonates weathering, respectively. The annual CO2 flux absorbed by rock weathering in the Ganjing River Basin was 0.63 × 10⁹ mol/y, accounting for about 0.75‰ of the CO2 flux (837 × 109 mol/y) above Datong Station in the Yangtze River Basin; however, its controlling area only accounted for 0.50‰ of the Yangtze River Basin [6], which revealed that there was high carbon sink potential in the Ganjing River Basin.

5. Conclusions

The Ganjing River located in the hinterland of TRG was systematically investigated to analyze the ionic composition and spatial variation, quantify the ionic source and influencing factors by the forward model, and assess the chemical weathering rates and CO2 consumption. The following conclusions were as follows:
(1) The water showed moderately alkalescent in the Ganjing River Basin, with the pH value ranging from 7.87 to 8.64. The riverine physical and chemical parameters showed obvious spatial distribution characteristics, which were relatively stable in the lower reservoir area of the Ganjing River. The TDS value fluctuated from 213.00 to 994.33 mg/L, with an average value of 473.31 ± 154.87 mg/L, which was higher than that of the global rivers’ average.
(2) The hydrochemistry was controlled by the type of “HCO3–Ca2+”. The Ca2+ was the main component in the cations and accounted for 43.83~74.53% of the total anions. The HCO3 ranged from 1542.87 to 5542.16 μmol/L and accounted for 70.48% of total anions. Most ions except NO3 were relatively stable in the lower reservoir area of the Ganjing River, where the concentrations of Ca2+ and HCO3 were obviously lower than those in other river sections. The above phenomena were largely due to the water mixing caused by the backflow of the reservoir area.
(3) Rock weathering was the main source of riverine ions in the basin, accounting for 84.01% of the total ions, of which, the silicate weathering source and carbonate weathering source contributed 14.38% and 69.63%, respectively. The carbonate weathering generally dominated the hydrochemical characteristics, which was also demonstrated by the analysis of ions’ components. The contribution rates of atmospheric rainfall were relatively low and stable in different river sections, with an average of 4.01 ± 1.28%. Anthropogenic activities contributed 12.05% of riverine ions, which were an important source of dissolved matter that cannot be ignored. Especially, anthropogenic inputs contributed 27.80% of ions in the lower reservoir area of the Ganjing River.
(4) Based on the empirical power functions, the rock weathering rate was calculated as 23.54 t/km2 in the Ganjing River Basin, which already eliminated the dilution effect caused by the change of discharge. The silicate and carbonate weathering rates were 7.85 t/km2 and 15.68 t/km2, respectively. Accordingly, the atmospheric CO2 consumption flux was 6.88 × 10⁵ mol/y/km2, of which, the 2.67 × 10⁵ mol/y/km2 and 3.59 × 10⁵ mol/y/km2 originated from silicates and carbonates weathering. The annual CO2 consumption flux accounted for about 0.75‰ of the CO2 flux (837 × 109 mol/y) in the Yangtze River Basin, which revealed that there was high carbon sink potential in the Ganjing River Basin.

Author Contributions

Conceptualization, L.D.; Formal analysis, C.Z.; Investigation, K.J., W.L., Y.L. and Y.H.; Data curation, R.Z.; Writing—review & editing, Q.Z.; Project administration, L.D.; Funding acquisition, X.G. All authors have read and agreed to the published version of the manuscript.

Funding

This research was funded by Knowledge Innovation Program of Wuhan-Shuguang [2022020801020245], Central Public-interest Scientific Institution Basal Research Fund of China [CKSF2021744/TB], Open Project Program of Chongqing Key Laboratory of Karst Environment [Cqk202101], and National Key R&D Program of China [2021YFE0111900].

Conflicts of Interest

The authors declare no conflict of interest.

References

  1. Moquet, J.-S.; Guyot, J.-L.; Crave, A.; Viers, J.; Filizola, N.; Martinez, J.-M.; Oliveira, T.C.; Sánchez, L.S.H.; Lagane, C.; Casimiro, W.S.L.; et al. Amazon River dissolved load: Temporal dynamics and annual budget from the Andes to the ocean. Environ. Sci. Pollut. Res. 2016, 23, 11405–11429. [Google Scholar] [CrossRef] [PubMed] [Green Version]
  2. Maavara, T.; Chen, Q.; Van Meter, K.; Brown, L.E.; Zhang, J.; Ni, J.; Zarfl, C. River dam impacts on biogeochemical cycling. Nat. Rev. Earth Environ. 2020, 1, 103–116. [Google Scholar] [CrossRef] [Green Version]
  3. Li, S.-L.; Liu, C.-Q.; Li, J.; Lang, Y.-C.; Ding, H.; Li, L.-B. Geochemistry of dissolved inorganic carbon and carbonate weathering in a small typical karstic catchment of Southwest China: Isotopic and chemical constraints. Chem. Geol. 2010, 277, 301–309. [Google Scholar] [CrossRef]
  4. Wu, W.-H.; Zheng, H.-B.; Yang, J.-D.; Luo, C.; Zhou, B. Chemical weathering, atmospheric CO2 consumption, and the controlling factors in a subtropical metamorphic-hosted watershed. Chem. Geol. 2013, 356, 141–150. [Google Scholar] [CrossRef]
  5. Jiang, L.-G.; Yao, Z.-J.; Liu, Z.-F.; Wang, R.; Wu, S.-S. Hydrochemistry and its controlling factors of rivers in the source region of the Yangtze River on the Tibetan Plateau. J. Geochem. Explor. 2015, 155, 76–83. [Google Scholar] [CrossRef]
  6. Chetelat, B.; Liu, C.-Q.; Zhao, Z.-Q.; Wang, Q.-L.; Li, S.-L.; Li, J.; Wang, B.-L. Geochemistry of the dissolved load of the Changjiang Basin rivers: Anthropogenic impacts and chemical weathering. Geochim. Cosmochim. Acta 2008, 72, 4254–4277. [Google Scholar] [CrossRef]
  7. Wang, P.; Yu, J.-J.; Zhang, Y.-C.; Liu, C.-M. Groundwater recharge and hydrogeochemical evolution in the Ejina Basin, northwest China. J. Hydrol. 2013, 476, 72–86. [Google Scholar] [CrossRef]
  8. Gibbs, R.J. Mechanisms controlling world water chemistry. Science 1970, 170, 1088–1090. [Google Scholar] [CrossRef]
  9. Meybeck, M. Total mineral dissolved transport by major world rivers. Hydrol. Sci. Bull. 1976, 20, 265–284. [Google Scholar] [CrossRef]
  10. Stallard, R.-F.; Edmond, J.-M. Geochemistry of the Amazon: 2. The influence of geology and weathering environment on the dissolved load. J. Geophys. Res. Ocean. 1983, 88, 9671–9688. [Google Scholar] [CrossRef]
  11. Gaillardet, J.; Dupré, B.; Louvat, P.; Allègre, C. Global silicate weathering and CO2 consumption rates deduced from the chemistry of large rivers. Chem. Geol. 1999, 159, 3–30. [Google Scholar] [CrossRef]
  12. Berner, R.A.; Berner, R.A. A model for atmospheric CO2 over Phanerozoic time. Am. J. Sci. 1991, 291, 339–376. [Google Scholar] [CrossRef]
  13. Amiotte Suchet, P.; Probst, J.L. Modelling of atmospheric CO2 consumption by chemical weathering of rocks: Application to the Garonne, Congo and Amazon basins. Chem. Geol. 1993, 107, 205–210. [Google Scholar] [CrossRef]
  14. Sun, P.; Ma, Z.; Zhang, Q.; Singh, V.-P.; Xu, C.-Y. Modified drought severity index: Model improvement and its application in drought monitoring in China. J. Hydrol. 2022, 612, 128097. [Google Scholar] [CrossRef]
  15. Li, Y.-Y.; Gao, B.; Xu, D.Y.; Peng, W.-Q.; Liu, X.-B.; Qu, X.-D.; Zhang, M. Hydrodynamic impact on trace metals in sediments in the cascade reservoirs, North China. Sci. Total Environ. 2020, 716, 136914. [Google Scholar] [CrossRef]
  16. Zhou, Z.-W.; Zhou, Z.-F.; Xu, H.-Y.; Li, M.-W. The Hydrochemical and Isotopic Evolution of the Surface Water and Groundwater for Impoundment in the Xiluodu Reservoir, Jinsha River, China. Sustainability 2020, 12, 5805. [Google Scholar] [CrossRef]
  17. Chen, Q.-W.; Shi, W.-Q.; Huisman, J.; Maberly, S.C.; Zhang, J.-Y.; Yu, J.-H.; Yi, Q.-T. Hydropower reservoirs on the upper Mekong River modify nutrient bioavailability downstream. Natl. Sci. Rev. 2020, 7, 1449–1457. [Google Scholar] [CrossRef] [Green Version]
  18. Wang, H.; Sun, F.-B.; Liu, W.-B. Characteristics of streamflow in the main stream of Changjiang River and the impact of the Three Gorges Dam. Catena 2020, 189, 104498. [Google Scholar] [CrossRef]
  19. Yang, L.-H.; Zeng, S.-D.; Xia, J.; Wang, Y.-L.; Huang, R.-Y.; Chen, M.-H. Effects of the Three Gorges Dam on the downstream streamflow based on a large-scale hydrological and hydrodynamics coupled model. J. Hydrol. Reg. Stud. 2022, 40, 101039. [Google Scholar] [CrossRef]
  20. Zhang, S.-J.; Tang, Q.; Bao, Y.-H.; He, X.-B.; Tian, F.-X.; Lü, F.-Y.; Wang, M.-F.; Anjum, R. Effects of seasonal water-level fluctuation on soil pore structure in the Three Gorges Reservoir, China. J. Mt. Sci. 2018, 15, 2192–2206. [Google Scholar] [CrossRef]
  21. Dai, H.-C.; Zheng, T.-G.; Liu, D.-F. Effects of Reservoir Impounding on Key Ecological Factors in the Three Gorges Region. Procedia Environ. Sci. 2010, 2, 15–24. [Google Scholar] [CrossRef] [Green Version]
  22. Xiang, R.; Wang, L.-J.; Li, H.; Tian, Z.-B.; Zheng, B.-H. Water quality variation in tributaries of the Three Gorges Reservoir from 2000 to 2015. Water Res. 2021, 195, 116993. [Google Scholar] [CrossRef] [PubMed]
  23. Gao, Q.-Z.; Tao, Z.; Huang, X.-K.; Nan, L.; Yu, K.-F.; Wang, Z.-G. Chemical weathering and CO2 consumption in the Xijiang River basin, South China. Geomorphology 2009, 106, 324–332. [Google Scholar] [CrossRef]
  24. Stallard, R.F.; Edmond, J.M. Geochemistry of the Amazon: 1. Precipitation chemistry and the marine contribution to the dissolved load at the time of peak discharge. J. Geophys. Res. Ocean. 1981, 86, 9844–9858. [Google Scholar] [CrossRef]
  25. Zhang, Q.-Z.; Tao, Z.; Ma, Z.-W.; Tang, W.-K.; Gao, Q.-Z.; Xu, P.; Lin, Y.-W. Riverine hydrochemistry and CO2 consumption in the tropic monsoon region: A case study in a granite-hosted basin, Hainan Island, China. Environ. Earth Sci. 2016, 75, 436. [Google Scholar] [CrossRef]
  26. Li, S.-Y.; Xu, Z.-F.; Wang, H.; Wang, J.-H.; Zhang, Q.-F. Geochemistry of the upper Han River basin, China: 3: Anthropogenic inputs and chemical weathering to the dissolved load. Chem. Geol. 2009, 264, 89–95. [Google Scholar] [CrossRef]
  27. Li, S.-Y.; Lu, X.-X.; Bush, R.T. Chemical weathering and CO2 consumption in the Lower Mekong River. Sci. Total Environ. 2014, 472, 162–177. [Google Scholar] [CrossRef]
  28. Han, G.-L.; Liu, C.-Q. Water geochemistry controlled by carbonate dissolution: A study of the river waters draining karst-dominated terrain, Guizhou Province, China. Chem. Geol. 2004, 204, 1–21. [Google Scholar] [CrossRef]
  29. Li, Z.; Zhong, J.; Li, S.-L.; Lang, Y.-C.; Zhu, X.-T.; Chen, S. The effects of hydrological variations on chemical weathering: Evidences from temporal water chemistry, stable carbon and sulfur isotopes. Catena 2022, 214, 106301. [Google Scholar] [CrossRef]
  30. Moon, S.; Chamberlain, C.P.; Hilley, G.E. New estimates of silicate weathering rates and their uncertainties in global rivers. Geochim. Cosmochim. Acta 2014, 134, 257–274. [Google Scholar] [CrossRef]
  31. Wang, D.; Han, G.-L.; Li, B.-G.; Hu, M.-M.; Wang, Y.-C.; Liu, J.-K.; Li, X.-Q. Characteristics of Ions Composition and Chemical Weathering of Tributary in the Three Gorges Reservoir Region: The Perspective of Stratified Water Sample from Xiaojiang River. Water 2022, 14, 379. [Google Scholar] [CrossRef]
Figure 1. The lithology and sampling sites in the Ganjing River Basin.
Sustainability 14 15376 g001
Figure 2. The physical and chemical parameters in the different tributaries’ sections.
Sustainability 14 15376 g002
Figure 3. Piper diagram for the water samples in the Ganjing River Basin.
Sustainability 14 15376 g003
Figure 4. The spatial variation of physicochemical indexes in the Ganjing River Basin.
Sustainability 14 15376 g004
Figure 5. The spatial variation of major cations in the Ganjing River Basin.
Sustainability 14 15376 g005
Figure 6. The spatial variation of major anions in Ganjing River Basin.
Sustainability 14 15376 g006
Figure 7. The plot of the major ions within the Gibbs.
Sustainability 14 15376 g007
Figure 8. Molar ratios of HCO3/Na and Ca/Na, and Mg/Na and Ca/Na.
Sustainability 14 15376 g008
Figure 9. The contribution rate statistics of ionic sources for TDS in different sections.
Sustainability 14 15376 g009
Figure 10. Power function relationships between ion concentration ratios and discharge ratios according to previous research [29].
Sustainability 14 15376 g010
Figure 11. The monthly cation output fluxes of different sources and weathering rates.
Sustainability 14 15376 g011
Figure 12. The relationship between rock (silicate and carbonate) weathering rates and HCO3 concentrations.
Sustainability 14 15376 g012
Table 1. The correlation analysis among the hydrochemical indexes.
pHORPDOECRESTDSK+Na+Ca2+Mg2+ClNO3SO42−DSiHCO3
pH1
ORP−0.435 **1
DO0.757 **−0.383 **1
EC0.534 **−0.380 **0.2271
RES−0.302 **0.254 *0.088−0.853 **1
TDS0.534 **−0.380 **0.2271.00 **−0.853 **1
K+−0.042−0.233 *−0.248 *0.454 **−0.478 **0.454 **1
Na+−0.662 **0.416 **−0.721 **−0.445 **0.178−0.445 **0.1491
Ca2+0.594 **−0.367 **0.340 **0.964 **−0.790 **0.964 **0.308 **−0.571 **1
Mg2+0.430 **−0.275 *0.0570.866 **−0.703 **0.866 **0.262 *−0.347 **0.858 **1
Cl−0.654 **0.394 **−0.783 **−0.392 **0.094−0.392 **0.1940.959 **−0.522 **−0.291 *1
NO3−0.277 *0.027−0.094−0.0910.070−0.091−0.1980.093−0.118−0.0710.0931
SO42−0.121−0.2710.1250.514 **−0.2810.514 **−0.115−0.2480.369 *−0.140−0.2300.1521
DSi−0.1590.086−0.324 **−0.0320.058−0.0320.1180.082−0.0610.1270.067−0.190−0.118
HCO30.435 **−0.262 *0.372 **0.590 **−0.611 **0.590 **0.314 **−0.376 **0.626 **0.248 *−0.428 **−0.1240.365 *−0.1531
** Correlation is significant at the 0.01 level; *correlation is significant at the 0.05 level.
Table 2. The contribution rate statistics of ionic sources for TDS in different sections.
Section Atmospheric Input (%)Agricultural Fertilization (%)Domestic Water Discharge (%)Silicate Weathering (%)Carbonates Weathering (%)
Lower Reservoir AreaAverage4.664.6823.1120.1247.47
Range4.57~4.793.87~5.4121.28~24.2918.68~21.3746.11~50
Standard Deviation0.070.480.840.901.10
Huangjin RiveAverage4.321.466.6616.7370.86
Range2.67~8.270.16~4.502.57~21.9310.64~33.1849.45~81.11
Standard Deviation1.111.244.324.968.54
Sanhui RiverAverage3.810.984.7311.2179.46
Range1.57~8.340.02~4.370.08~21.382.42~31.5150.38~95.83
Standard Deviation1.691.095.157.2712.54
Baishi RiverAverage3.071.044.128.1283.71
Range1.77~6.010.01~3%0.06~14.132.50~21.6767.15~95.77
Standard Deviation1.140.823.314.477.39
The BasinAverage4.012.099.9614.3869.63
Deviation1.281.838.816.7116.40
Publisher’s Note: MDPI stays neutral with regard to jurisdictional claims in published maps and institutional affiliations.

