Article

How Does China Develop Green Service Industries? A Perspective on Policy Evolution

1
Institute of Industrial Economics, Jiangsu University, Zhenjiang 212013, China
2
School of Finance and Economics, Jiangsu University, Zhenjiang 212013, China
*
Author to whom correspondence should be addressed.
Sustainability 2022, 14(22), 15378; https://doi.org/10.3390/su142215378
Submission received: 18 October 2022 / Revised: 30 October 2022 / Accepted: 2 November 2022 / Published: 18 November 2022

Abstract

:
In the process of promoting the development of a low-carbon economy, green services lag behind the green manufacturing industry. This paper applies the textual analysis method and systematically analyses the evolutionary trends and structural characteristics of green service policies to further optimise the service policy system and strengthen the quality of the green service supply. This paper identifies 859 policies introduced since 1986 and uses the content analysis method to analyse changes in the number of policies, the relationships between policy subjects, the formal types of texts and the composition of policy instruments. The results show that (1) the number and overall effectiveness of green service industry policies promulgated by the central government are increasing, such that the formulation of green service industry policies has passed the exploratory phase and has entered the stage of high-quality development; (2) there is a wide range of obvious interministerial cooperative phenomena, the modes of cooperation are relatively fixed, and the overall intersuperior cooperation has been strengthened but is characterised by phased development; (3) the distribution of policy forms is uneven, with many documents characterised by low effectiveness and a lack of high-efficiency documents; (4) the policy object structure is relatively complete, but the industrial distribution is unbalanced; (5) there is an imbalance among the three policy tools of supply, environment and demand. Those tools that are embodied in the environment are deemed more important than those of supply and demand.

1. Introduction

In the 70 years since the founding of New China, China’s economic construction has made remarkable achievements. However, a series of resource and environmental problems have also been brought along in their wake, and the conflict between economic growth and the protection of the ecological environment has become increasingly prominent. China’s industrial development has entered the transformation stage of intelligent, green and low-carbon development [1]. In this context, the entire society has reached an unprecedented consensus about developing green industries and promoting the transformation of green development. To focus limited resources on more critical industries, the National Development and Reform Commission and seven other departments jointly issued Green Industry Guidance Catalogue (2019 edition) [2]. This document defines six types of green industries: the energy conservation and environmental protection industry, the clean production industry, the clean energy industry, the ecological environment industry, green infrastructural upgrading and green services. Green services are the elements of the green service industry that provide important support for the development of other green industries. Green services include consulting services, project operation management and evaluation reviews, environmental monitoring and testing, and certification and promotion of green technology products. Their main function is to promote the technological progress of the green industry, maintain continuity in green production processes, improve the production efficiency of the green industry, and strengthen the supervision and management of the green industry. Green services were formed and developed during the process of the professional development of the green manufacturing industry. They are not only ‘lubricants’ that contribute to the efficient development of green manufacturing but also indirect inputs that help enhance the output value of green products and services. In recent years, with the deepening development of green manufacturing in China, all kinds of green service industry policies have come into being. However, academic research on green service policy has just started, and most of the existing studies have focused on specific green service policies, such that understanding of the connotations, classification and main functions of green service policies is not clear enough. This paper holds that green services represent a kind of industry that provides supportive services to the green industry related to all aspects of green manufacturing. Green service policy promotes the high-quality development of the green manufacturing industry by strengthening the service supply and improving the internalisation of the enterprise environment. This paper collects China’s green service policies at the central and provincial levels and presents a comprehensive analysis of policy evolution and structural characteristics. The main objective of this paper is to clarify the main functions and contents of green service policies; systematically sort out the green service policies issued by central and local governments and analyse the changes in the number of policies, policy contents and policy tools; and depict the evolution and structural characteristics of China’s green service policy system.

2. Literature Review

Although green service policies have been widely used in various fields, related research has not matured.
The definition of green services in the existing research is unclear. Before the Green Industry Guidance Catalogue (2019 edition) was issued, the boundaries of the green service industry were unclear, and there was no standard conceptual definition. In the academic field, a few related studies have included ‘green service policy’ as a keyword. Most relevant studies have focused on specific green service policies, for example, cleaner production auditing [3,4,5], carbon emission trading [6,7,8,9,10], energy right trading [11,12], emission permit trading [13,14,15], green certificate trading [16,17], environmental impact assessment [18,19,20,21,22], ecological damage assessment [23]. Although these policies reveal the function of a green service policy from different angles, they are not called green service policies. Moreover, previous studies have paid more attention to the importance of specific green service policies in green transformation and environmental protection [24,25], but there have been few studies on the formation, development and systematic construction of green service policies.
The main research on green service policies has focused on the analysis of policy effectiveness. Guerra et al. studied the effects of mandatory environmental impact assessments for marine projects and found that all projects benefited from such assessments [19]. Yu et al. studied the fiscal and tax-reduction effects of green card trading and power-generation quota systems on enterprises [16]. Ren et al. developed total factor productivity by studying the emission trading system [13]. By studying cleaner production standard regulation, Han et al. found that its impact on productivity was negative in the early stage and positive in the later stage [4]. Ren et al. studied the carbon trading market and trading-rights-related policies and determined the economic benefits and implementation paths among enterprises of different sizes [26]. Xian et al. studied the carbon emission trading system and ascertained its impact on the opportunity cost and marginal cost of emissions reduction [27]. Shen et al. used the DID method to verify the emission reduction effects of a carbon emission trading system [7]. By studying the carbon trading system, Zhang et al. identified the characteristics of its emission-reduction potential and its contribution to emission reduction over time [28]. Guo et al. studied the pollutant discharge charge policy and found that it compensated for emission damage and that the initial emission quota payment policy increased the emission costs of enterprises, thereby reducing COD emissions in most parts of China [15]. Liu et al. studied energy and carbon emission trading policies and found that using a combination of policies has better benefits on output, energy conservation and emission reduction than using a single policy [11]. Yang et al. studied carbon emission trading policies and found they promote employment and emission reduction [29]. By studying green industrial policies, Chen et al. put forward that green industrial policies can solve the contradiction between economic growth and the environment and improve environmental benefits through the adjustment of the economic structure [25].
Theoretical analysis based on experience lacks data rigour, and a text content analysis that can quantitatively study qualitative issues is currently a more mature policy research method. Although this method is rarely used in the research of green service industry policies, it has been widely used in the research of other green policies. Si et al. studied the evolution characteristics and policy tool selection of China’s rural green development policies based on text quantification. On this basis, they used coupling and coordination models to test policy performance [30]. Ran used NVivo software to analyse the discourses on green governance in the ‘Government Work Report’ over the years and studied the evolution logic of government green governance policies and values at different stages [31]. Peng et al. used T-LAB 9.1 software to conduct a text analysis of China’s cleaner production policy and studied its characteristics through thematic relevance and theme analysis [3]. Liao constructed an analysis framework of policy types and policy tools, dividing environmental policies into the command and control, market and information types. Through research on China’s environmental policy, they found that China’s environmental policy lacks effectiveness and is mainly based on notification types. Market-based policy tools are used more than command-and-control policy tools and focus on environmental innovation applications rather than R&D [32]. These studies are mostly carried out from the dimensions of basic policy information (posting time and document type), policy subjects, policy topics, policy tools and policy objectives and are further supplemented by methods such as the synergy model or social network analysis for in-depth exploration [33].
These studies have enriched research on the green service policy system, but a few studies have conducted systematic textual content research on the entire green service policy system and have analysed the evolution, overall characteristics and internal logic of the green service policy system in China. Based on the reasons for appeals, this paper is based on Chapter 6 of the Green Industry Guidance Catalogue (2019 edition) and selects the green service policy on the central level of China. This paper uses text content analysis methods. From policy efficacy, publishing subject, text type, policy theme and policy tools, this paper studies the basic attributes and characteristics of China’s green service policy and its main functional fields, the evolution of departmental cooperation and the degree of cooperation among issuing bodies, and the preference of policy tools when the government builds the green service policy system. First, on the basis of the issuing department and the legal effect of the text, the effectiveness of the green industry policies is quantitatively scored, the overall effectiveness of the policy is measured in a time series, and the country’s change in the green service policy is analysed. Then, from the perspective of the policy subject, the posting characteristics of various departments and the interdepartmental cooperation between departments are analysed. Finally, the content of the policy text, mainly from the perspective of policy tools, is analysed. A policy tool analysis framework is established, and the characteristics of policy tool selection in the formulation of China’s green service policy are analysed.

3. Methodology and Data

3.1. Research Methods

Text content analysis is a widely used literature research method that can structure unstructured content to perform quantitative analyses of qualitative problems. Abstraction and interpretation are its core processes. Through abstraction, the target content of the text is extracted, analysed and expressed as content coding, and different classifications or modes are obtained [34]. There are two general abstract methods. The first involves building a structured coding structure from top to bottom for content coding; the second involves using grounded theory from bottom to top or other ways to compress and code text through similarities and differences and then constantly summarising topics or categories to make them more abstract or explanatory. This paper adopts the former to construct a structured policy tool analysis framework to abstractly code policy tools. The interpretation is the result of restructuring and understanding the abstract and does not involve a simple description but a comprehensive and thorough analysis.

3.2. Sample Selection and Measurement

The industrial policy mainly affects the development and application of technology and the construction of the market. A green service policy is a type of industrial policy. It mainly implements technology development, product application and market construction through the management of technologies, products, projects, institutions or enterprises that affect the green service industry. It also builds service industry support for the development of the green industry. It is the sum of various policies that promote the development of the green service industry. The text of the green service policy selected in this paper is mainly derived from the pkulaw database, and the subject terms of the policy search are extracted according to the related catalogue of green services in Chapter 6 of the Green Industry Guidance Catalogue (2019 edition). The subject terms are cut for each entry in the catalogue, and 57 subject terms, such as green industry project survey, cleaner production audit and energy management, are extracted. A total of 26 subject terms with specific policy results and 1493 policy documents at the central level are retrieved. Each item is checked and filtered, and documents that are low in relevance, non-government documents, and other documents that are not consistent with the research in this paper are deleted. Replies or letters are also deleted, thus retaining 859 documents. The search results of the subject terms (Table 1) show that the country’s green service industry policies in environmental impact assessment, cleaner production and energy management are more prominent.
Although numerous policy documents are retrieved, most of them are low-binding documents, such as notices and announcements, which cannot accurately express the changes in policy strength only by quantity. Therefore, this paper quantifies the effectiveness of the issuing agency and the type of policy documents and establishes a quantitative standard for the type of text retrieved by referring to the quantification methods of Peng [35] and Zhang [36]. The most extensive quantitative standard is currently used to assign values to policy documents. According to the level of the main body of the document and the type of policy text, a quantitative scale from 1 to 5 is formulated. The specific quantitative standards are shown in Table 2.

4. General Characteristics of Green Service Policy Documents

4.1. Analysis of the Posting Rhythm

Through a quantitative analysis of 859 policies, the annual increase in the number, effectiveness and average effectiveness of China’s green service industry policies is calculated, as shown in Figure 1. The establishment of China’s green service policy system began with corporate environment and energy management. The first policy document is the ‘Provisions of the State Council on Strengthening the Environmental Management of Township and Sub-district Enterprises’. Since 1986, with the development of China’s green industry, the government’s emphasis on the green service industry has gradually increased. Although the number of documents issued and the overall effectiveness of the policy has fluctuated, the overall trend has shown an upward trend year by year. The implementation of policies is continuous and cumulative. In fact, the number of policies that take effect each year and their total effectiveness is increasing.
From 1986 to 1998, the fluctuation of China’s green service policy was minimal, and its quantity and effectiveness values were very low. During this period, because of the early stages of reform and opening up, economic development was still relatively extensive, the understanding of green development was insufficient, and the overall number and effectiveness of China’s green service industry policies were relatively weak. At this stage, China’s green service policy is in its infancy, with few policies and unstable development characteristics. There was a blank window period in 1998 because this year was in the transformation period of China’s government functions, and almost all industrial specialised economic departments were rectified, which was also an important reason for the reduction of relevant policies in this period.
From 1999 to 2013, which belonged to the exploratory period of China’s green service policy system, the number and total effectiveness of China’s green service industry policies showed a spiral and rapid upward trend. The average effectiveness of the policy also fluctuated greatly during this period, showing that the government was still in the groping and advancing stages. Furthermore, several documents related to the green service industry in legal form were issued. During this period, China became increasingly aware of the importance of developing the green service industry and made efforts to actively play the role of a promising government and actively promote the development of the green service industry.
After 2013, the number and effectiveness of postings stabilised. Although the fluctuations in different years are still large, there has been no significant increase or even a slight decline. Furthermore, the average effectiveness maintained a relatively stable level, indicating that after long-term exploration and policy accumulation, the construction of China’s green service policy system has entered the stage of comprehensive formation and that the policy system framework has begun to take shape.
Although both the number of policies and the overall effectiveness have shown an upward trend, the average effectiveness has declined. It was not until 2013 that the trend became consistent with the development trend in the number of policies and total effectiveness [37]. The reason is that although the Chinese government issued a large number of policies every year after 1999, it contained a large number of low-effectiveness documents, such as notices and announcements, which diluted the average effectiveness, resulting in a failure to improve the average effectiveness of the policies. This also shows that the increase in the overall effectiveness of China’s green service policy is not caused by the legal effectiveness of the policy itself but by the number of policies. A complete policy system needs more high-quality policies as support. Figure 1 illustrates that while the number and effectiveness of policies are fading, the average effectiveness is on the rise, indicating that the exploratory period for policy formulation has passed and that the quality of policies has begun to recover. This is also a sign that the formulation of green service industry policies is moving towards a comprehensive improvement stage. The next step is to further improve the policy system.

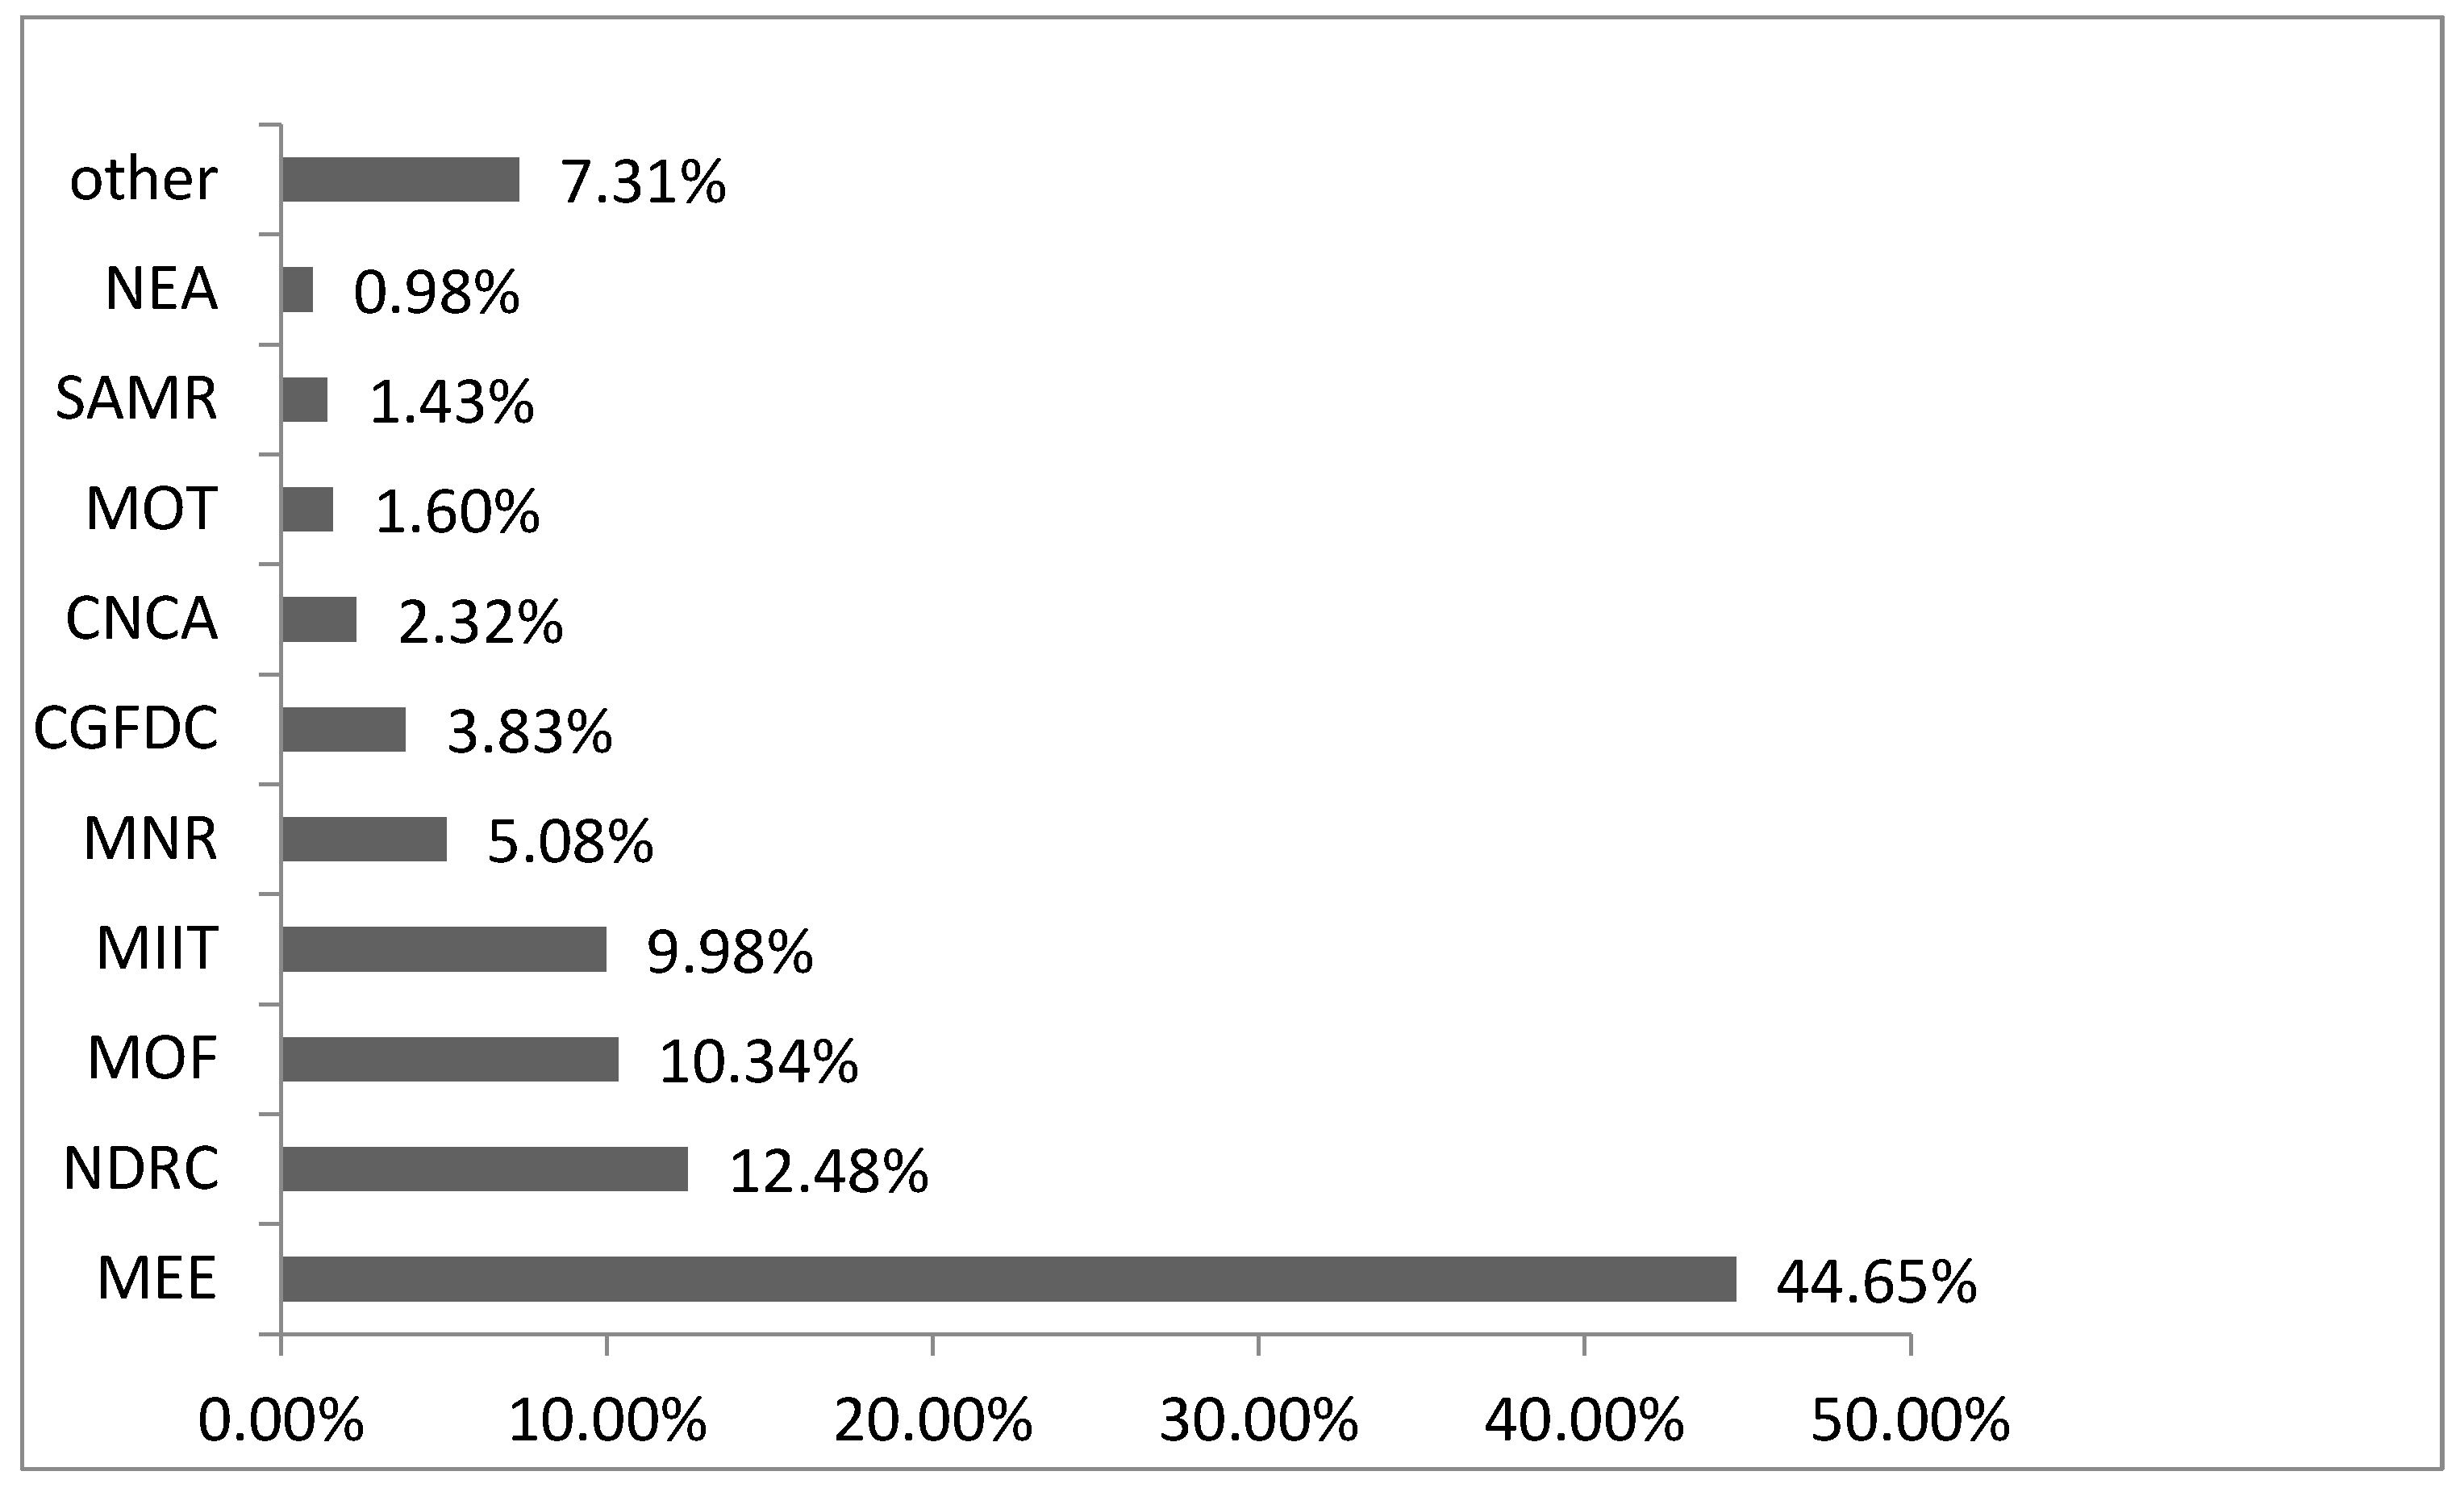
4.2. Analysis of the Issuing Subject

4.2.1. Policy Subject Composition

The policy subject is an important participant in the entire policy life cycle, from policy formulation to policy implementation to policy evaluation. Considering that the issuing subjects of some policies have been revoked or changed, this paper clarifies the history of institutional change and takes its current administrative department as the main body of dissemination. After sorting out, 44 distributing bodies were found to be involved in this study. Although China’s green service policy involves many subjects, namely, the Ministry of Ecological Environment, the National Development and Reform Commission, the Ministry of Finance, the Ministry of Industry and Information Technology, the Ministry of Natural Resources, the China Green Food Development Centre, the Certification and Accreditation Administration of the People’s Republic of China and the Ministry of Transport, the State Administration for Market Regulation is responsible for more than 90% of the policy release. The proportion of documents issued by various central departments in the green service policy system is presented in Figure 2. Among these, the Ministry of Ecological Environment is far ahead of all the main bodies in issuing documents, participating in the issuance of nearly half of the policies, followed by the National Development and Reform Commission.

4.2.2. Collaborative Analysis of Policy Subjects

Jointly promulgating policies is an important means for the coordinated governance of various government departments. The specific implementation of complex policies often makes it difficult to assign to a single department. In the process of policy issuance, horizontal interdepartmental cooperation can better integrate resources and produce new functions in coordination and cooperation so as to improve overall efficiency. Therefore, the horizontal cross-departmental coordination of the main body of the paper is worth studying. Among the departments that issued a large number of policy documents, more than 80% of the policies, with the participation of the Ministry of Finance, the National Development and Reform Commission, and the Ministry of Industry and Information Technology, were issued in cooperation with other departments. In the green service policy cooperation system, the most common cooperation mode is cooperation among the three departments, followed by cooperation among the various departments closely related to green development [38], such as the Ministry of Ecological Environment, the Ministry of Natural Resources and the National Energy Administration. This mode of cooperation reflects that China attaches great importance to the close integration of policy and economic development, finance, industrial development and informatisation in promoting the development of the green service industry. This interministerial cooperation mode is also more conducive to the implementation of policy and measures. Although the Ministry of Ecological Environment has a large number of policies issued in cooperation with other departments, the number of policies issued by the Ministry of Ecological Environment is relatively large. Hence, the proportion of joint publications is not high. In addition, departmental cooperation also has the characteristic of mutual cooperation between departments with similar functions.
Although the policy is still mainly issued by a single authority department, multi-department cooperation cannot be underestimated. The cooperation structure of policy subjects in China’s green service policy system is shown in Figure 3. Policies promulgated jointly by multiple departments account for nearly 20%, and three-sector cooperation and second-sector cooperation are mainly used in multi-sector cooperation.
The departmental coordination of policy promulgation is scored quantitatively, where the departmental coordination degree of each policy document = the number of the main body of the document − 1. The formula of the annual coordination degree and average coordination degree of policy subjects is shown in Equation (1). Ci represents the overall coordination degree of the green service policy in the i-th year, Nij represents the number of subjects who issued the j-th policy in the i-th year, and CPi represents the overall average coordination degree of the green service policy in the i-th year. The joint promulgation of green service industry policies over the years is shown in Figure 4.
C i = j N i j 1 , C P i = C i n
The green service policy promulgated by interministerial cooperation is not simply increasing year by year, but there are two peaks in the overall upward trend. The first peak was due to the small number of policies and instability. The second peak occurred in 2013 after the policy release entered the exploratory period. The interministerial cooperation that the policy was promulgated before 2013 has deepened year by year. This is a stage where China’s green service policy is constantly exploring policy-guided industrial development and continuously exploring the development of the green service industry through interministerial cooperation between policy entities to unite resources from various departments. However, in 2013, there was a rapid decline in the peak. This is because the State Council’s institutional reform in 2013 reduced the overlap and decentralisation of the government functions of various departments. The policy formulation also ended the exploratory period and entered a steady and comprehensive improvement period.

4.3. Analysis of the Promulgation of Policy Text

By analysing the issuance of 859 policy texts obtained, we discovered that the policy text form is diverse; there are most ineffective documents such as notices and announcements. Although some files are published in the form of notifications, they are not notifications, so this article will trace back to the type of the original file for calculation. The number of various documents on China’s green service policy and the proportion of the proportion is shown in Table 3.
Although the file type is varied, there is more than half of the low-efficacy file type (483, 56.23%), which includes mainly a variety of notices and announcements. The ‘notice’ policy text in China’s green service support system is mainly aimed at the carrying out, strengthening and implementation of a certain work or activity related to the green service industry, as well as the supplementary explanation of related issues. The topics covered most in these texts are the field of environmental impact assessment, especially the related work of its talent institutions and projects, and the second is the field of energy management, with its supervision-, certification- and training-related works being the most prominent. ‘Announcement’ is similar to ‘notice’ in part; that is, the announcement of relevant matters. In addition, there is mainly a variety of qualification approval announcements, project acceptance announcements, approval announcements and other result disclosure documents, mainly involving the fields of environmental impact assessment and geological disaster assessment.
The medium-efficiency document types accounted for 40.16%, mainly including catalogue-type documents for issuing various guidance catalogues or promoting catalogues (86,10.01%), method-type documents for issuing various management methods (75,8.75%) and standard-type documents for publishing various industry standards (70,8.15%). These documents mainly refer to product (technology) catalogues, guidance catalogues, project catalogues and promotion catalogues that promote green service-related technologies and provide guidance and define relevant boundaries for industrial development. Project catalogues mainly refer to construction projects that involve environmental impact assessment, whereas promotion catalogues are mainly related to ‘Energy’-saving Products Benefiting the People Project. ‘Method’-type documents mainly provide normative guidance for the management of various related activities and entities, including product certification management, product (technology) promotion, organisation (personnel) management and other management methods. ‘Standard’-type documents mainly include two major types of specifications: specifications for the development of related work in the green service industry and technical specifications [39]. The technical specifications in China’s green service policy system are mainly published in the form of standards. The standard documents are distinguished, and the standard documents only contain industry standards that are not technical specifications. ‘Opinion’-type documents mainly aim to provide flexible guiding opinions or suggestions for the development of related work or the management of institutions and projects. They are not only oriented and referenced for work development and object management but also in the formulation of more detailed green service industry policies.
There are a few types of high-efficiency documents, accounting for only 3.61%, and they are mostly published in prescribed forms. ‘Regulation’-type documents mainly aim to clearly define the responsibilities or responsibilities of relevant institutions and related monitoring or management procedures with strong constraints. The ‘regulation’ documents in China’s green service policy system focus on management regulations and make normative provisions on the qualifications of management objects, their rights and responsibilities, related procedures, and rewards and punishments. The ‘regulations’, ‘methods’ and ‘programme’ have certain similarities in form and content, but the ‘regulations’ are stricter and more binding, whereas the ‘methods’ and ‘programmes’ focus more on the implementation of specific measures and have stronger execution power.

5. Analysis of the Content of the Policy Text

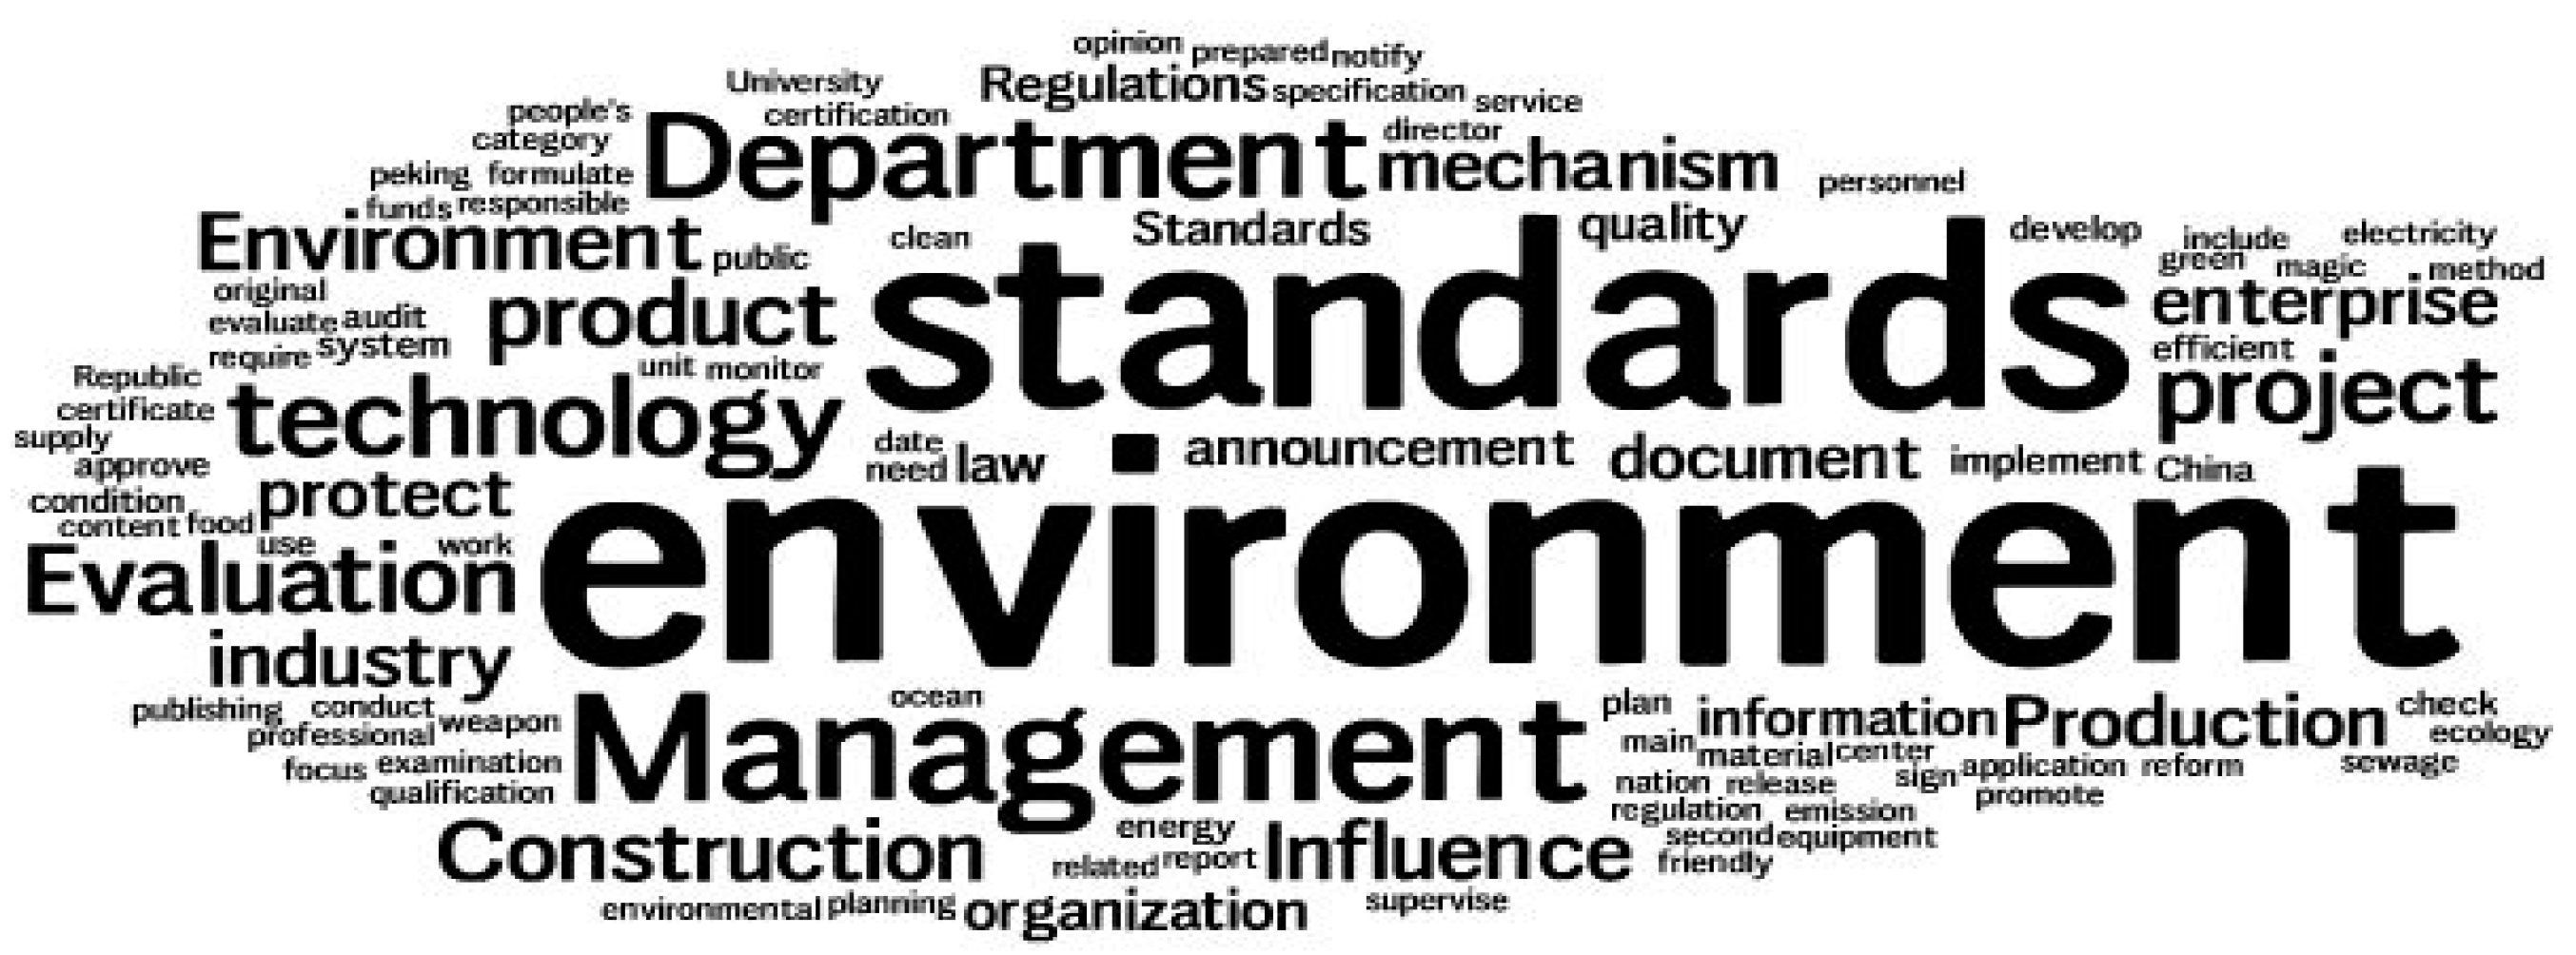
5.1. Analysis of Policy Keywords
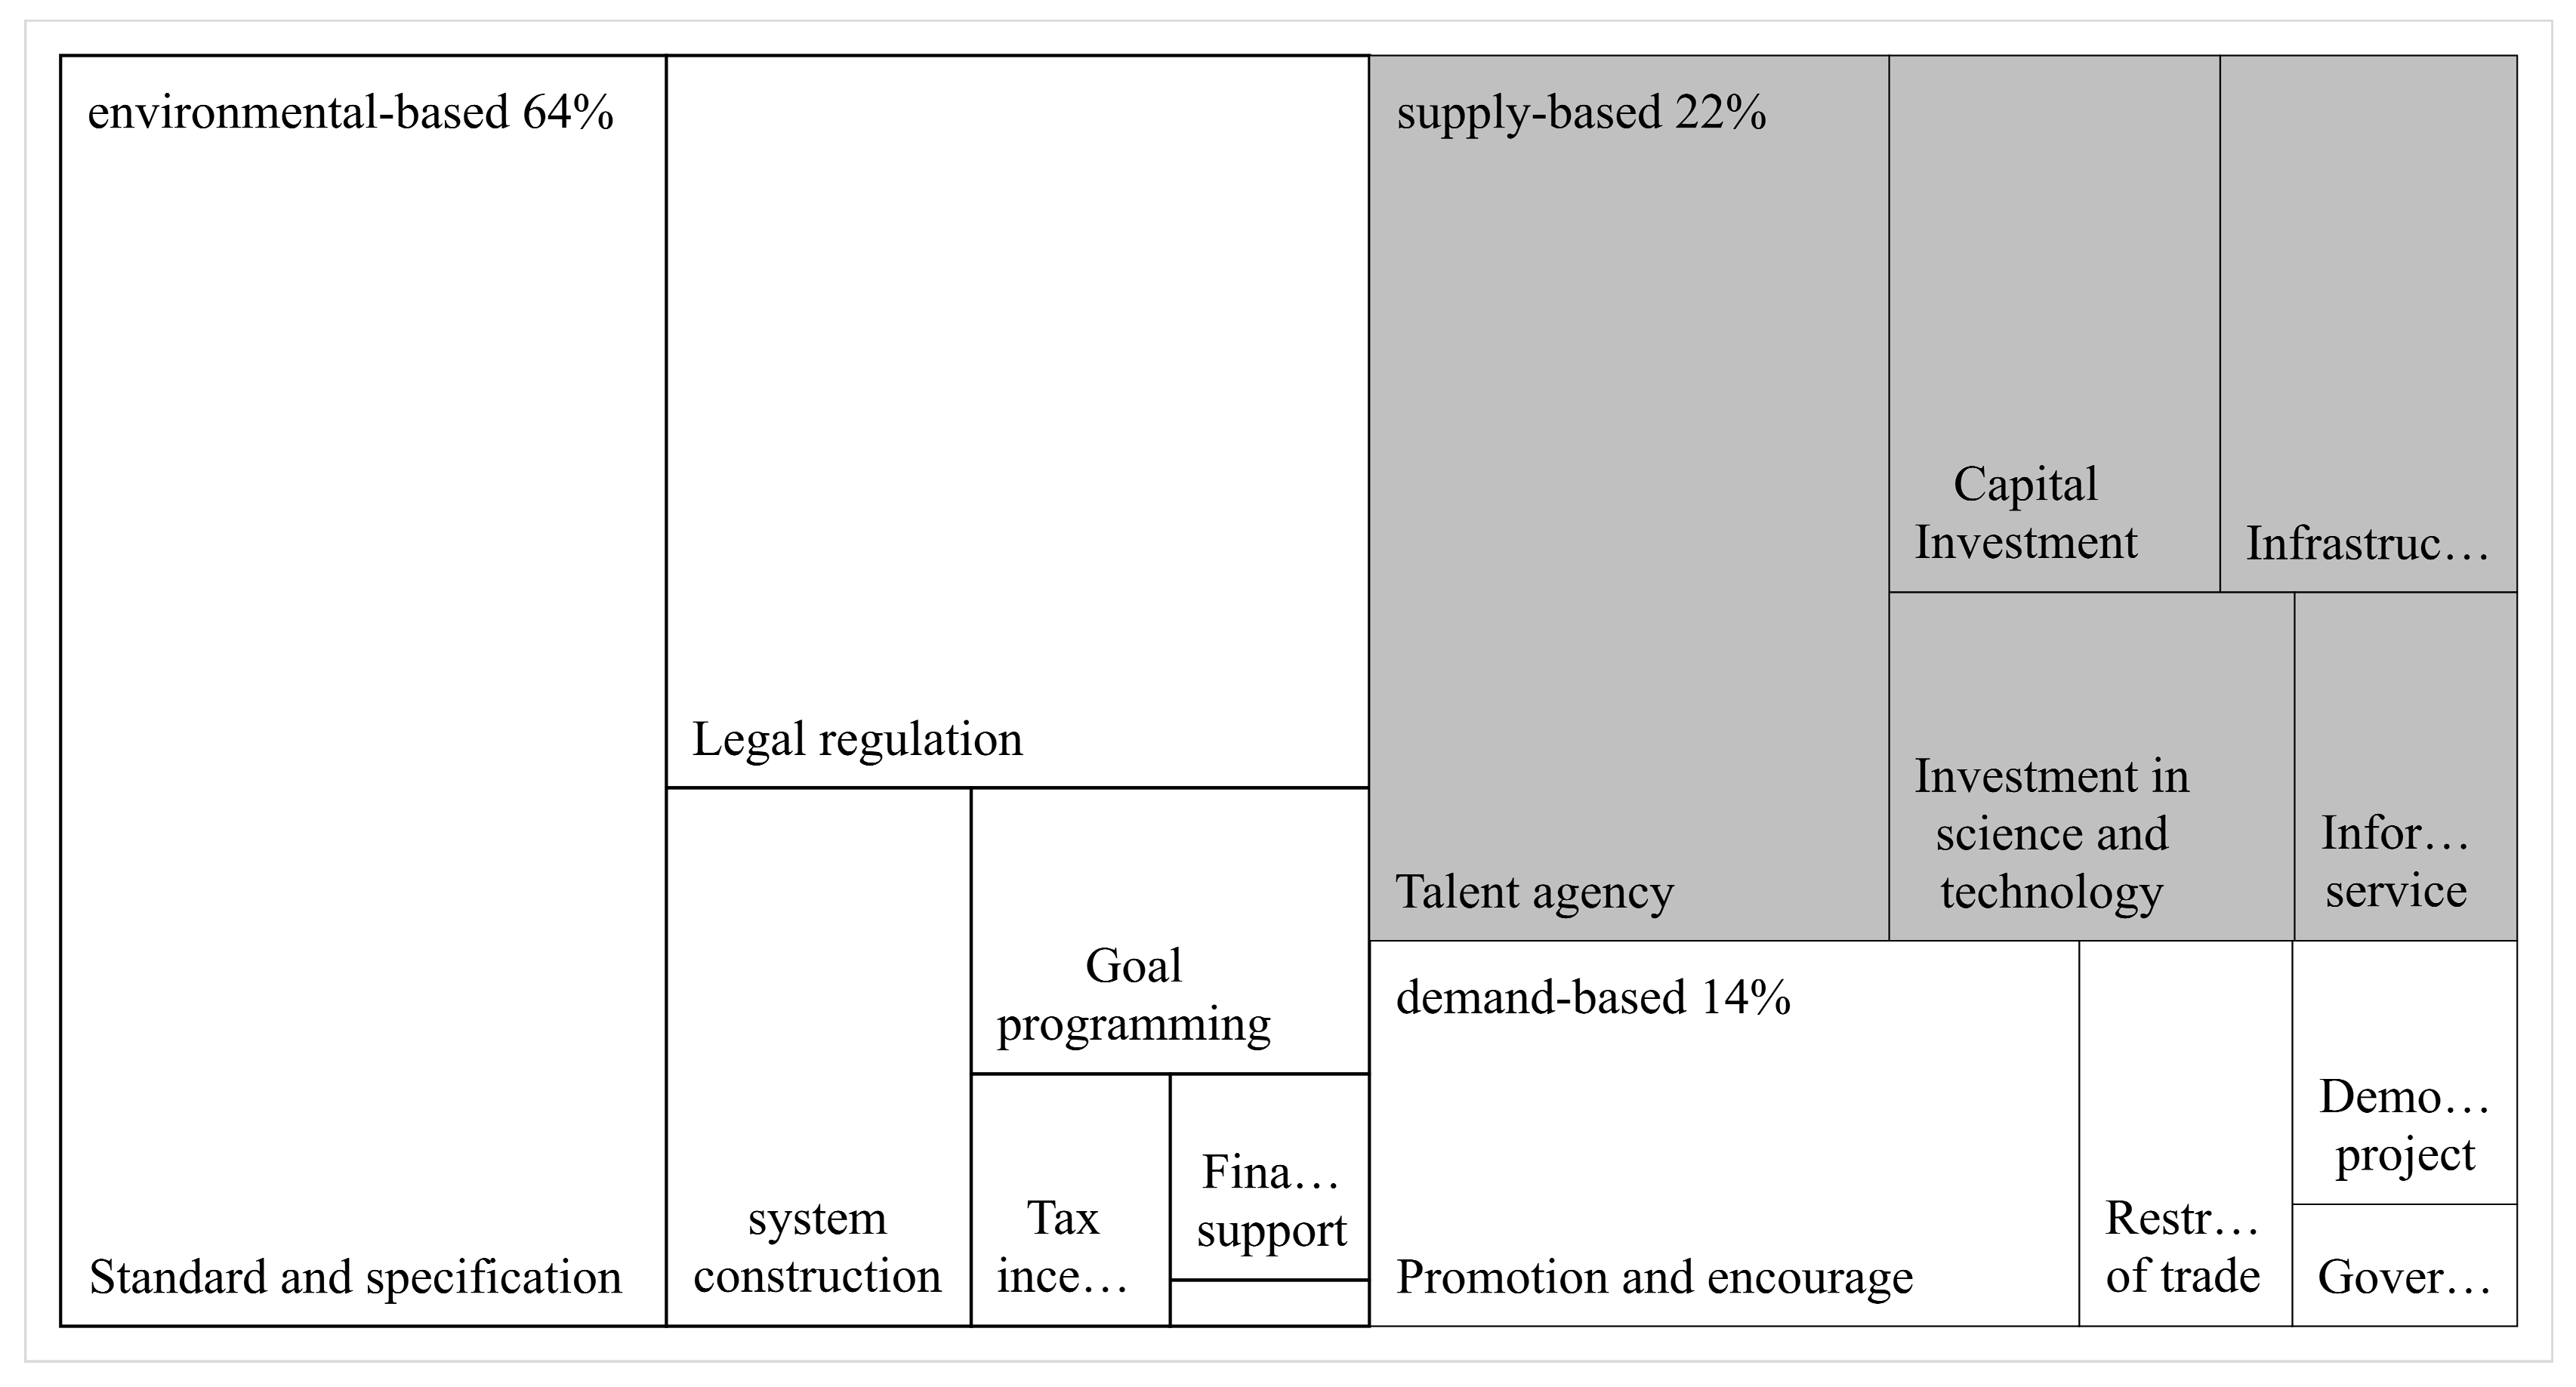
Given that most of the 859 documents selected above are low-efficiency notices and announcement documents, during the analysis of text content, the text set is further streamlined to remove low-efficiency and partial batch catalogue files, and 278 of them are selected. The word frequency statistics in the 278 articles were calculated using NVivo, and a stop vocabulary table was established for irrelevant words. Finally, a word cloud map is generated, as shown in Figure 5. The information in this figure reflects the main policy tools, target orientation and main policy object orientation used in China’s green service policy system.
The word ‘environment’ has the highest frequency, which is partly related to the maximum number of documents corresponding to the policy theme ‘environmental impact assessment’. The other main reason is that China’s green service policy pays attention to creating a good environment for industrial development using environment-oriented policy tools. The second is ‘standards’. In the certification and management of related technologies, products, institutions and talents, especially environmental labelling products, environmental impact assessment technologies and cleaner production standards, the Chinese government strives to form a unified or referenceable standard and provide a reliable basis for the development of related work. ‘Management’ means that in China’s green service policy system, the central government pays more attention to strengthening the management of various tasks, especially supervision and management. The scope of management covers a wide range, such as ‘certification’, ‘inspection’, ‘monitoring’ and ‘audit’, which are the objects of management work involved in the green service policy system. The keywords ‘project’, ‘institution’, ‘unit’, ‘enterprise’, ‘product’ and ‘technology’ mainly characterise the overall objective tendency of China’s green service policy. Among them, the project is mainly related to environmental impact assessment projects, the organisation is mainly related to supervision and testing and personnel training, the unit is mainly related to unit qualification review, the company is mainly related to the corporate environment and the policy trends of key enterprises, and the products and technologies are mainly related to the certification, promotion and standard formulation of products and technologies related to the development of green services.

5.2. Policy Tools

A policy tool is a method adopted by the policy subject in a policy to achieve the expected goal, and it is also a bridge between the policy goal and the policy application environment. It is a way for policy makers to transform the goals and ideas of industrial development into reality. The analysis of policy tools can discover the government’s preference for the means or paths adopted to achieve specific goals. Policy tools can be divided into different types from different perspectives. The most widely used approach is to divide into three categories: supply-based, environmental-based and demand-based, according to the application field of policy [40]. The second is divided into five categories—financial foreign exchange, fiscal taxation, administrative measures, personnel measures and other economic measures—based on the implementation of specific policies [41]. The third is divided into control type, market type, voluntary negotiation type and information type based on the strength of government control [42,43]. This essay uses the first type. Secondary policy tools refer to existing research and are adjusted according to the study of policy documents. The final classification of policy tools is shown in Table 4. The supply-based policy tool is the government’s promotion of industrial development through the promotion of factors. Promoting elements include infrastructure construction and resource input, such as technology, talent, capital and information services. Demand-based policy tools influence the market’s demand for green products or services through government procurement, demonstration projects and trade controls and reduce market demand uncertainty, thereby stabilising demand and generating a driving force for industrial development. Environmental-based policy tools do not directly affect the supply and demand related to the industry, but they can improve the industrial environmental factors that affect the development of the industry through measures, such as target planning, financial taxation, standards and regulations, and provide a good development environment for the industry.
A policy may use multiple policy tools at the same time or a single policy tool. The implementation of policy tools in different coded clauses varies. Some policy tools only mention relevant clauses without giving details. Some policy tools put forward very specific plans when they are applied. A single use of a number of policy tools cannot accurately assess the characteristics of the use of various policy tools in green service policy. Therefore, this paper interprets the content of each policy and explains its level of detail or implementation according to the corresponding policy tools of the text content. The quantification standards are shown in Table 5. The scoring standards of 1, 3 and 5 are used. The scoring standards of 4 and 2 points are between the three points. The higher the score, the more detailed the content description and the more specific the implementation measures.
This paper uses NVivo software to establish a three-level node according to the policy tool analysis framework, and the policy text is coded. The 865 effective terms are extracted from 256 articles and coded for these terms. The frequency structure chart of the basic policy tools of China’s central green service policy is shown in Figure 6. In Figure 7, in all the encoded policy terms, the environmental-based policy dominates, accounting for more than half, followed by the supply-based policy and, finally, the demand-based policy. When the implementation of the policy tools of each encoded term is considered, the policy tool structure shows no significant change, but the proportion of environmental-based policy tools is increased significantly, and the proportion of supply-based policy tools is reduced. Environmental policy tools are not only widely used in policy making but are also implemented in detail. The most frequently used environmental policy tools are standard policy tools and regulation policy tools, which are also the most widely used policy tools. Standards and specifications mainly rely on the establishment of various industry standards and specifications to provide a better development environment for the green service industry. This paper shows that these standards and specifications are concentrated in specific industries. The regulation mainly relies on various mandatory management measures and disciplinary measures to restrain the behaviours and qualifications of various subjects in green service, such as government departments, institutions and personnel. In addition, information disclosure and public participation are not included in the framework of policy tool analysis but are encoded separately in node coding statistics. China has attached increasing importance to the application of information disclosure and public participation in promoting industrial development in recent years.
However, the above analysis cannot reflect the dynamic changes in policy tools. Therefore, this paper takes year as an attribute and classifies each encoded policy text in NVivo. By establishing cases and querying, the statistics of node numbers of the three types of policy tools in different years are obtained, as shown in Figure 8. The figure shows the evolution of the application of supply-, demand- and environmental-based policy tools in China’s green service policy system in different years. Environmental policy tools occupy the dominant position throughout the consolidation, indicating that the central government has a tendency to choose from environmental policy tools when making a green service policy. The second is supply-based policy tools. The demand-based policy tool uses less than environmental-based policy tools and mainly uses promotion and encouragement, indicating that the government is more inclined to the free market and does not intervene directly in the market. There are ups and downs in the evolution of the total frequency and total intensity of sub-policy tools, but the changes in the two and the average intensity of policy measures are different. In recent years, the overall frequency and intensity of policy tools have decreased, but the average intensity has been rising. The use of policy tools has become more targeted, and policy making has become more high-quality.
Note: The right side of the two clustering histograms represents the frequency of policy tools, whereas the left side represents the result of frequency weighted according to the implementation intensity. The line chart is the sum of the implementation efforts of all policy tools divided by the frequency of policy tools.

6. Conclusions and Policy Implications

6.1. Conclusions

Based on the quantitative analysis of policy texts and interpretation of policy tools, the paper found that China’s green service policy system has the following characteristics.
First, the main body of the policy involves a wide range, and the phenomenon of interdepartmental cooperation is obvious. China’s green service policy system involves 44 subjects. However, a few departments undertake the most policy formulation, and the horizontal cooperation between departments is obvious. Almost 20% of the policies are formulated by multi-department cooperation, and the cooperation mode is relatively fixed. The average cooperation intensity shows two peaks in the time sequence, but the overall cooperation intensity constantly increased before 2013.
Second, the types of policies are rich and complete, but high-efficiency documents are lacking. Almost all document types issued by the government are covered, but the number of documents of different types varies greatly. Most of them are low-efficiency documents, such as notices and announcements, and lack high-efficiency documents, such as regulations. The structure of different policy effectiveness documents is unbalanced and still needs to be improved.
Third, the structure of the policy object is perfect, but the structure of the policy industry is unbalanced. The policy objects cover ‘project’, ‘institution’, ‘unit’, ‘enterprise’, ‘product’ and ‘technology’, which are related to the green service industry. Almost all sub-sectors have special policy documents, but there are serious imbalances among different industries, and environmental impact assessment has numerous policy tilts. Although the policy system is almost perfect, there are policy deficiencies in consulting services related to the green industry.
Finally, policy tools are diverse but unbalanced, focusing on environmental, light demand-based and supply-based policy tools. The structure of policy tools is unbalanced, over-relying on environmental policy tools and emphasising management, whereas supply-based policy tools and demand-based policy tools are used too infrequently. Demand-based policy tools are mainly used for promotion and encouragement, whereas others are rarely used. In supply-oriented policy, science and technology investment and information services are especially light.

6.2. Policy Implications

The government guides the strategic direction of industrial development through policies and constructs a sound and reasonable policy system to promote industrial development is the key to the role of the government. Based on an analysis of the characteristics of green service policy in China, the following suggestions are put forward for the improvement of green service policy systems in the future.
(1)
Balance the policy guidance of various subdivisions of the green service industry and improve the policy industry structure. Although China’s green service policy covers a wide range and is increasingly getting stronger, there is still an imbalance among the industries. China still needs to further improve the policy system, strengthen policy efforts and build a green service industry development mechanism guided by the government, with corporate and public participation as the main body and extensive mobilisation of enthusiasm from all walks of life. This guides more social resources towards the green service industry to promote the optimisation of production factors and market development of the green service industry.
(2)
Strengthen coordination and cooperation between departments, coordinate the resources of various departments and enhance policy implementation. Because of the particularity of its industrial attributes, the green service industry serves the green industry of economic development and environmental protection, and it has both economic and ecological environmental attributes. As the green service industry covers many subsectors, its policy formulation is complicated. It is difficult for a single department to cope with the implementation of comprehensive policies, so it is necessary to strengthen horizontal cooperation between departments; organically combine ecological departments with finance, market supervision, national economic industry development and industrial information; fully mobilise and coordinate resources of various departments; and form a resultant force to promote the development of the green service industry.
(3)
The government should combine various policy tools to optimise the green service policy system. At present, the choice of policy tools in China’s green service policy system tends to be environment oriented, but it does not pay enough attention to the supply-oriented factors that promote industrial development. Given that the green service industry is a knowledge-intensive industry, it is especially necessary to strengthen the application of talent institutions, scientific and technological investment, and information services in the use of policy tools. Although regulatory and command-and-control tools perform well in terms of policy effectiveness [44], supply and demand are the sources of water to promote industrial development. Therefore, it is necessary to strengthen the use of supply-based and demand-based policy tools, balance and enrich the structure of policy tools, and establish a long-term mechanism suitable for market encouragement, supply guarantees and environmental constraints.
(4)
The government should strengthen coordination with green industry policies when formulating policies to match the development needs of green industries. According to the Green Industry Guidance Catalogue (2019 edition), the green service industry is a supporting industry that serves the green industry. Therefore, the formulation of green service industry policies should match the development of the green industry; strengthen the coordination between green service industry policies and relevant green industry policies in policy formulation, policy objectives, policy tool selection and policy implementation; strengthen the communication and convergence between interrelated policies; and establish a green development policy system that is focused, interrelated and complementary.

Author Contributions

D.H.: formal analysis, visualisation and writing (review and editing). Y.T.: investigation, methodology, project administration and writing (original draft). M.R. and J.Y.: visualisation/data presentation and revision and proofreading of manuscripts. All authors have read and agreed to the published version of the manuscript.

Funding

This research was funded by the National Office for Philosophy and Social Sciences (grant number 21BTJ050), the General Program of the National Natural Science Foundation of China (grant number 71974078) and the Philosophy and Social Science Excellent Innovation Team Construction Foundation of Jiangsu Province (grant number SJSZ2020-20).

Institutional Review Board Statement

Not applicable.

Informed Consent Statement

Not applicable.

Data Availability Statement

The policy data used in this paper are all from the public database pkulaw (http://en.pkulaw.cn/), the policies we picked from this database is from 1 January 1986 to 31 December 2019.

Acknowledgments

We acknowledge Li for his support for the collection of policy data in this article and Yang for his support for text analysis methods.

Conflicts of Interest

The authors declare no conflict of interest.

References

  1. Dan, S. Green development and the new stage of global industrialization: China’s progress and comparison. China Ind. Econ. 2018, 10, 5–18. (In Chinese) [Google Scholar]
  2. National Development and Reform Commission. Green Industry guidance Catalog (2019 Edition). Available online: https://www.amac.org.cn/businessservices_2025/ywfw_esg/esgzc/zczgsc/202007/t20200714_9848.html (accessed on 13 March 2019).
  3. Peng, H.T.; Liu, Y. A comprehensive analysis of cleaner production policies in China. J. Clean. Prod. 2016, 135, 1138–1149. [Google Scholar] [CrossRef] [Green Version]
  4. Han, C.; Hu, H. How Cleaner Production Standards and Regulations Dynamically Affect Total Factor Productivity—A Quasi-natural Experimental Analysis of Eliminating Other Policy Interferences. China Ind. Econ. 2015, 5, 70–82. (In Chinese) [Google Scholar]
  5. Jiao, Y.Q.; Su, M.R.; Ji, C.W.; Yang, S.Y.; Zhang, P.; Li, C.D.; Liu, L.L. Cleaner production instruments assisting sustainable transition at urban scale: A case study of Dongguan, a typical manufacturing city in China. J. Clean. Prod. 2019, 210, 1449–1461. [Google Scholar] [CrossRef]
  6. Liu, L.; Zhang, Y. Research on carbon tax system based on carbon emission trading market. Tax Res. 2019, 2, 46–52. (In Chinese) [Google Scholar]
  7. Shen, J.; Tang, P.; Zeng, H. Does China’s carbon emission trading reduce carbon emissions? Evidence from listed firms. Energy Sustain. Dev. 2020, 59, 120–129. [Google Scholar] [CrossRef]
  8. Yang, W.; Pan, Y.; Ma, J.; Zhou, M.; Chen, Z.; Zhu, W. Optimization on Emission Permit Trading and Green Technology Implementation under Cap-and-Trade Scheme. J. Clean. Prod. 2018, 194, 288–299. [Google Scholar] [CrossRef]
  9. Ding, G.; Deng, Y.L.; Lin, S.S. A study on the classification of China’s provincial carbon emissions trading policy instruments: Taking Fujian province as an example. Energy Rep. 2019, 5, 1543–1550. [Google Scholar] [CrossRef]
  10. Liu, C.; Pan, A. Research on accounting policy of emission right trading under carbon emission trading system. Financ. Theory Pract. 2015, 36, 77–82. (In Chinese) [Google Scholar]
  11. Liu, H.; Wang, Y. The economic dividend effect under the tradable policy combination of energy use rights and carbon emission rights. China Popul. Resour. Environ. 2019, 29, 1–10. (In Chinese) [Google Scholar]
  12. Chen, Z. The coordinated use of energy consumption tax and energy right trading system. Resour. Sci. 2019, 41, 2205–2215. (In Chinese) [Google Scholar]
  13. Ren, S.; Zheng, J.; Liu, D.; Chen, X. Does the emission trading mechanism increase the total factor productivity of enterprises? Evidence from Chinese listed companies. China Ind. Econ. 2019, 5, 5–23. (In Chinese) [Google Scholar]
  14. Ye, W.I.; Liu, L.X.; Zhang, B. Designing and implementing pollutant emissions trading systems in China: A twelve-year reflection. J. Environ. Manag. 2020, 261, 110207. [Google Scholar] [CrossRef] [PubMed]
  15. Guo, M.; Zhang, Y.W.; Ye, W.L.; Liu, L.X.; Bi, J.; Wang, J.N. Pricing the permission of pollution: Optimal control-based simulation of payments for the initial emission allowance in China. J. Clean. Prod. 2018, 174, 139–149. [Google Scholar] [CrossRef] [Green Version]
  16. Yu, Y.; Li, C. Green Certificate Trading, Electricity Sale Quota System and Renewable Energy Finance and Tax-ation Burden Reduction Effect. China Popul. Resour. Environ. 2020, 30, 80–88. (In Chinese) [Google Scholar]
  17. Yu, X.; Dong, Z.; Zhou, D.; Sang, X.; Chang, C.T. Integration of tradable green certificates trading and carbon emissions trading: How will Chinese power industry do. J. Clean. Prod. 2020, 10, 123485. [Google Scholar] [CrossRef]
  18. Wu, M.; Cheng, F. On the interaction and connection between environmental impact assessment and pollution discharge permit system——from the perspective of system logic and structural suggestions. J. Beijing Univ. Technol. (Soc. Sci. Ed.) 2020, 22, 117–124. (In Chinese) [Google Scholar]
  19. Guerra, F.; Grilo, C.; Pedroso, N.M.; Henrique, C. Environmental Impact Assessment in the marine environment: A comparison of legal frameworks. Environ. Impact Assess. Rev. 2015, 55, 182–194. [Google Scholar] [CrossRef]
  20. Bond, A.; Fischer, T.B.; Fothergill, J. Progressing quality control in environmental impact assessment beyond legislative compliance: An evaluation of the IEMA EIA Quality Mark certification scheme. Environ. Impact Assess. Rev. 2017, 63, 160–171. [Google Scholar] [CrossRef]
  21. Zheng, X.; Li, Z.; Wang, J.; He, J.; Bao, C. Analysis of China’s Planning Environmental Impact Assessment System—From the Perspective of New Institutional Economics. Environ. Prot. 2017, 45, 20–25. (In Chinese) [Google Scholar]
  22. Runhaar, H.; Gommers, A.; Verhaegen, K.; Cooman, K.; Corens, P. The effectiveness of environmental assessment in Flanders: An analysis of practitioner perspectives. Environ. Impact Assess. Rev. 2019, 76, 113–119. [Google Scholar] [CrossRef]
  23. Li, Y. The reform of the ecological environment damage compensation system: Status quo, problems and legislative sugestions. Ningxia Soc. Sci. 2018, 4, 79–85. (In Chinese) [Google Scholar]
  24. Li, X.; Zhang, Y.; Jiang, F. Green Industrial Policy: Theoretical Evolution and China’s Practice. J. Financ. Econ. Res. 2019, 45, 4–27. (In Chinese) [Google Scholar]
  25. Chen, L.Y.; Zhou, R.; Chang, Y.; Zhou, Y. Does green industrial policy promote the sustainable growth of polluting firms? Evidences from China. Sci. Total Environ. 2020, 10, 142927. [Google Scholar] [CrossRef]
  26. Ren, X.S.; Ma, Q.; Liu, Y.J.; Zhao, G.H. The impact of carbon trading policy on the economic performance of highly polluting indus-trial enterprises: Empirical analysis based on multiple mediating effect model. Resour. Sci. 2020, 42, 1750–1763. (In Chinese) [Google Scholar]
  27. Xian, Y.J.; Wang, K.; Wei, Y.M.; Huang, Z.M. Opportunity and marginal abatement cost savings from China’s pilot carbon emissions permit trading system: Simulating evidence from the industrial sectors. J. Environ. Manag. 2020, 271, 110975. [Google Scholar] [CrossRef]
  28. Zhang, Y.J.; Liang, T.; Jin, Y.L.; Shen, B. The impact of carbon trading on economic output and carbon emissions reduction in China’s industrial sectors. Appl. Energy 2020, 260, 114290. [Google Scholar] [CrossRef]
  29. Yang, X.Y.; Jiang, P.; Pan, Y. Does China’s carbon emission trading policy have an employment double dividend and a Porter effect? Energy Policy 2020, 142, 111492. [Google Scholar] [CrossRef]
  30. Si, L.; Wang, J. The policy text analysis and policy performance demonstration of rural green development. J. Lanzhou Univ. (Soc. Sci. Ed.) 2018, 46, 148–157. (In Chinese) [Google Scholar]
  31. Ran, L. 1949–2020 China’s government green governance policy text analysis: Logic of change and basic experience. J. Shenzhen Univ. (Humanit. Soc. Sci. Ed.) 2020, 37, 46–55. (In Chinese) [Google Scholar]
  32. Liao, Z.J. Content analysis of China’s environmental policy instruments on promoting firms’ environmental innovation. Environ. Sci. Policy 2018, 88, 46–51. [Google Scholar] [CrossRef]
  33. Zhang, N.; Ma, X.; Zhang, Y.; Liu, H.; Qin, C.; Liu, W. Collaborative analysis of China’s public information resource opening policy based on text content analysis. Inf. Theory Pract. 2020, 43, 115–122. (In Chinese) [Google Scholar]
  34. Lindgen, B.M.; Lundman, B.; Granheim, U.H. Abstraction and interpretation during the qualitative content analysis process. Int. J. Nurs. Stud. 2020, 108, 1–6. [Google Scholar] [CrossRef]
  35. Peng, J.; Zhong, W.; Sun, W. Policy Measurement, Policy Coordinated Evolution and Economic Performance: An Empirical Study Based on Innovation Policy. Manag. World 2008, 9, 25–36. (In Chinese) [Google Scholar]
  36. Zhang, G.; Li, J.; Guan, X. The evolution analysis of inter-ministerial policy game and coordination of energy saving and emission reduction. Manag. Rev. 2019, 31, 250–263. (In Chinese) [Google Scholar]
  37. Li, W.; Xu, J.; Ostic, D.; Yang, J.; Guan, R.; Zhu, L. Why low-carbon technological innovation hardly promote energy efficiency of China?-Based on spatial econometric method and machine learning. Comput. Ind. Eng. 2021, 160, 107566. [Google Scholar] [CrossRef]
  38. Batrancea, L.; Rus, M.I.; Masca, E.S.; Morar, I.D. Fiscal Pressure as a Trigger of Financial Performance for the Energy Industry: An Empirical Investigation across a 16-Year Period. Energies 2021, 14, 3769. [Google Scholar] [CrossRef]
  39. Batrancea, L.; Rathnaswamy, M.K.; Batrancea, I. A Panel Data Analysis on Determinants of Economic Growth in Seven Non-BCBS Countries. J. Knowl. Econ. 2022, 13, 1651–1665. [Google Scholar] [CrossRef]
  40. Shen, L.; He, B.; Jiao, L.; Song, X.; Zhang, X. Research on the development of main policy instruments for improving building energy-efficiency. J. Clean. Prod. 2016, 112, 1789–1803. [Google Scholar] [CrossRef]
  41. Wu, J.; Jiang, S.; Li, X. Comparative Research on China’s Regional 5G Industrial Policy—Analysis Based on Policy Objectives, Tools and Implementation. J. Inf. 2020, 39, 104–112. [Google Scholar]
  42. Rothwell, R. Reindustrialization and technology: Towards a national policy framework. Sci. Public Policy 1985, 12, 113–130. [Google Scholar] [CrossRef]
  43. Mu, Q. Comments and Prospects of Policy Tools for Energy-saving and Environmental Protection Industry. China Environ. Manag. 2019, 11, 44–49. (In Chinese) [Google Scholar]
  44. Azhgaliyeva, D.; Liu, Y.; Liddle, B. An empirical analysis of energy intensity and the role of policy instruments. Energy Policy 2020, 145, 1–9. [Google Scholar] [CrossRef]
Figure 1. Evolution of the number of policies, total effectiveness and average effectiveness. Data source: Drawn by the author according to the sorted data from the pkulaw database.
Sustainability 14 15378 g001
Figure 2. Composition of main policy entities and the proportion of issued documents. Data source: Drawn by the author according to the sorted data from the pkulaw database. MEE: Ministry of Ecological Environment; NDRC: National Development and Reform Commission; MOF: Ministry of Finance; MIIT: Ministry of Industry and Information Technology; MNR: Ministry of Natural Resources; CGFDC: China Green Food Development Center; CNCA: Certification and Accreditation Administration of the People’s Republic of China; MOT: Ministry of Transport; SAMR: The State Administration for Market Regulation; NEA: National Energy Administration.
Sustainability 14 15378 g002
Figure 3. Structure of coordinated publication of policy subjects. Data source: Drawn by the author according to the sorted data from the pkulaw database.
Sustainability 14 15378 g003
Figure 4. Synergy and average synergy of interdepartmental joint publication. Data source: Drawn by the author according to the sorted data from the pkulaw database.
Sustainability 14 15378 g004
Figure 5. Policy text keyword word cloud. Data source: Drawn by the author according to the sorted data from the pkulaw database. Note: The larger the font of the keyword in the figure, the higher the word frequency.
Sustainability 14 15378 g005
Figure 6. Strength of green service policy tools. Note: Environment-based policy tools include standard and specification, legal regulation, system construction, goal planning, tax incentives and financial support. Supply-based policy tools include talent agency, capital investment, infrastructure construction, technology investment and information service. Demand-based policy tools include promotion and encouragement, trade control, demonstration project, government procurement and foreign contracting. Data source: Drawn by the author according to the sorted data from the pkulaw database.
Sustainability 14 15378 g006
Figure 7. Frequency of use of green service policy tools. Data source: Drawn by the author according to the sorted data from the pkulaw database.
Sustainability 14 15378 g007
Figure 8. Evolution of policy tools (for each year, the right bar chart shows the frequency of policy tool use, and the left bar chart shows the strength of policy tool use). Data source: Drawn by the author according to the sorted data from the pkulaw database.
Sustainability 14 15378 g008
Table 1. Statistics on the subject terms of the green service policy system.
Subject TermsFrequencySubject TermsFrequency
Environmental impact assessment381Carbon emission12
Energy-saving products104Renewable energy11
Green food48Organic food11
Pollution permit43Low-carbon product certification10
Energy management42Green building materials7
Geological hazard risk assessment32Pollution source monitoring6
Environmental labelling products32Water-saving products5
Clean manufacturing28Energy audit5
Power demand side management22Energy monitoring4
Business environment19Energy saving assessment3
Environmental damage17Comprehensive utilisation of resource products2
Ecological environment monitoring14Water right transaction1
Table 2. Quantification standards for policy effectiveness.
ScoreScoring Criteria
5Laws promulgated by the National People’s Congress and its Standing Committee
4Regulations and provisions promulgated by the State Council; orders from various ministries and commissions
3Interim regulations and provisions, plans, decisions, opinions, methods and standards promulgated by the State Council; regulations, provisions and decisions promulgated by various ministries and commissions
2Opinions, methods, plans, guidelines, interim regulations, rules, conditions, standards, norms, catalogues and rules issued by various ministries and commissions
1Notices, announcements, directories, procedures
Table 3. Types of China’s green service policy documents.
TypeLawArticleRegulationDecisionOpinionMethodPlanStandardGuidelineRuleSpecificationCatalogueDirectoryNoticeAnnouncementOther
Quantity522222375147011264086724121718
Proportion
(%)
0.580.232.560.23%2.688.731.638.151.283.034.6610.010.8128.0625.262.10
High efficiencyMedium efficiencyLow efficacy
31 (3.61%)345 (40.16%)483 (56.23%)
Table 4. Classification of policy tools for green service industry policies.
Types of Policy ToolsTypes of Sub Tools
Supply-basedTalent agency
Capital investment
Infrastructure construction
Technology investment
Information service
Environmental-basedStandard and specification
Legal regulation
System construction
Goal planning
Tax incentives
Financial support
Intellectual property
Demand-basedPromotion and encouragement
Trade control
Demonstration project
Government procurement
Foreign contracting
Table 5. Quantitative standards for policy implementation.
ScoreJudging Detailed Criteria
5Put forward specific policy implementation plans, which are pertinent, such as clarifying specific implementation methods or related systems.
3There are relevant brief descriptions but no detailed specific measures.
1Only mentions or involves relevant clauses and does not give specific measures.
Publisher’s Note: MDPI stays neutral with regard to jurisdictional claims in published maps and institutional affiliations.

