

Climatic Control of Urban Spaces Using Natural Cooling Techniques to Achieve Outdoor Thermal Comfort
 , , , and
Abstract
:1. Introduction
1.1. Context
1.2. Climate Control of Outdoor Spaces
1.3. Aim of This Study
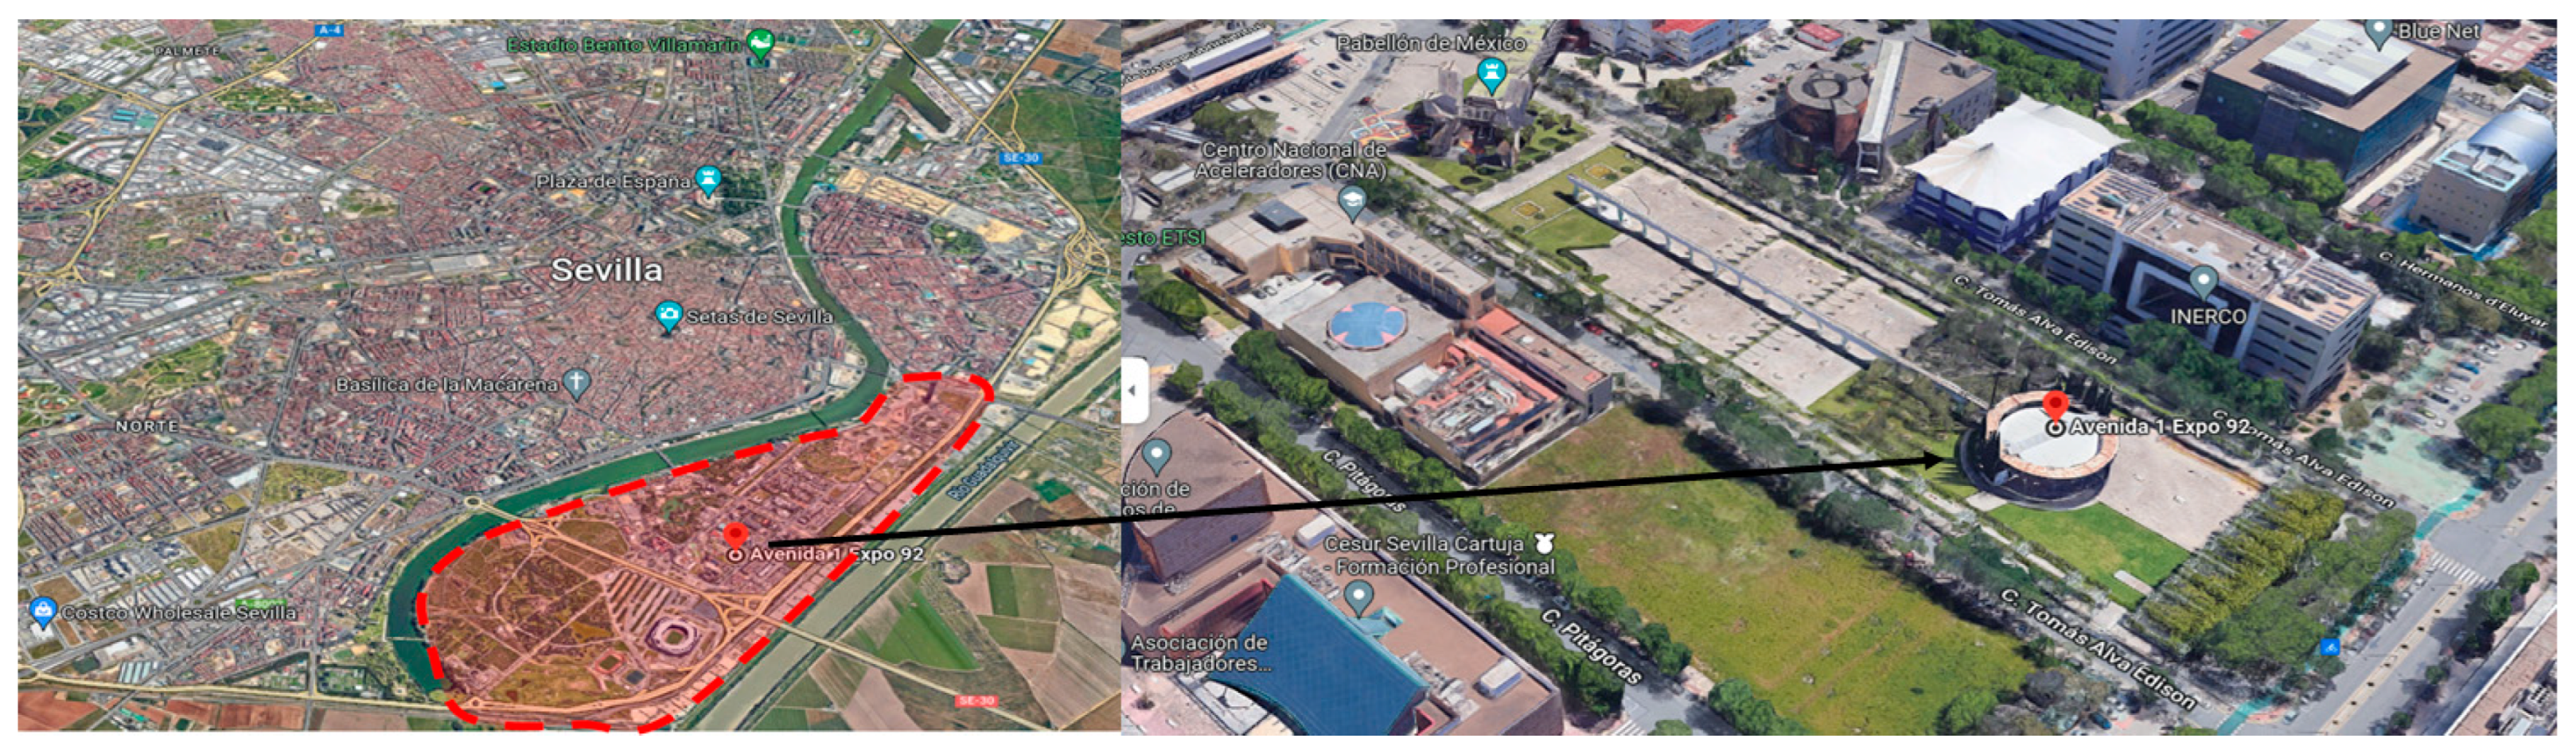
2. Case study
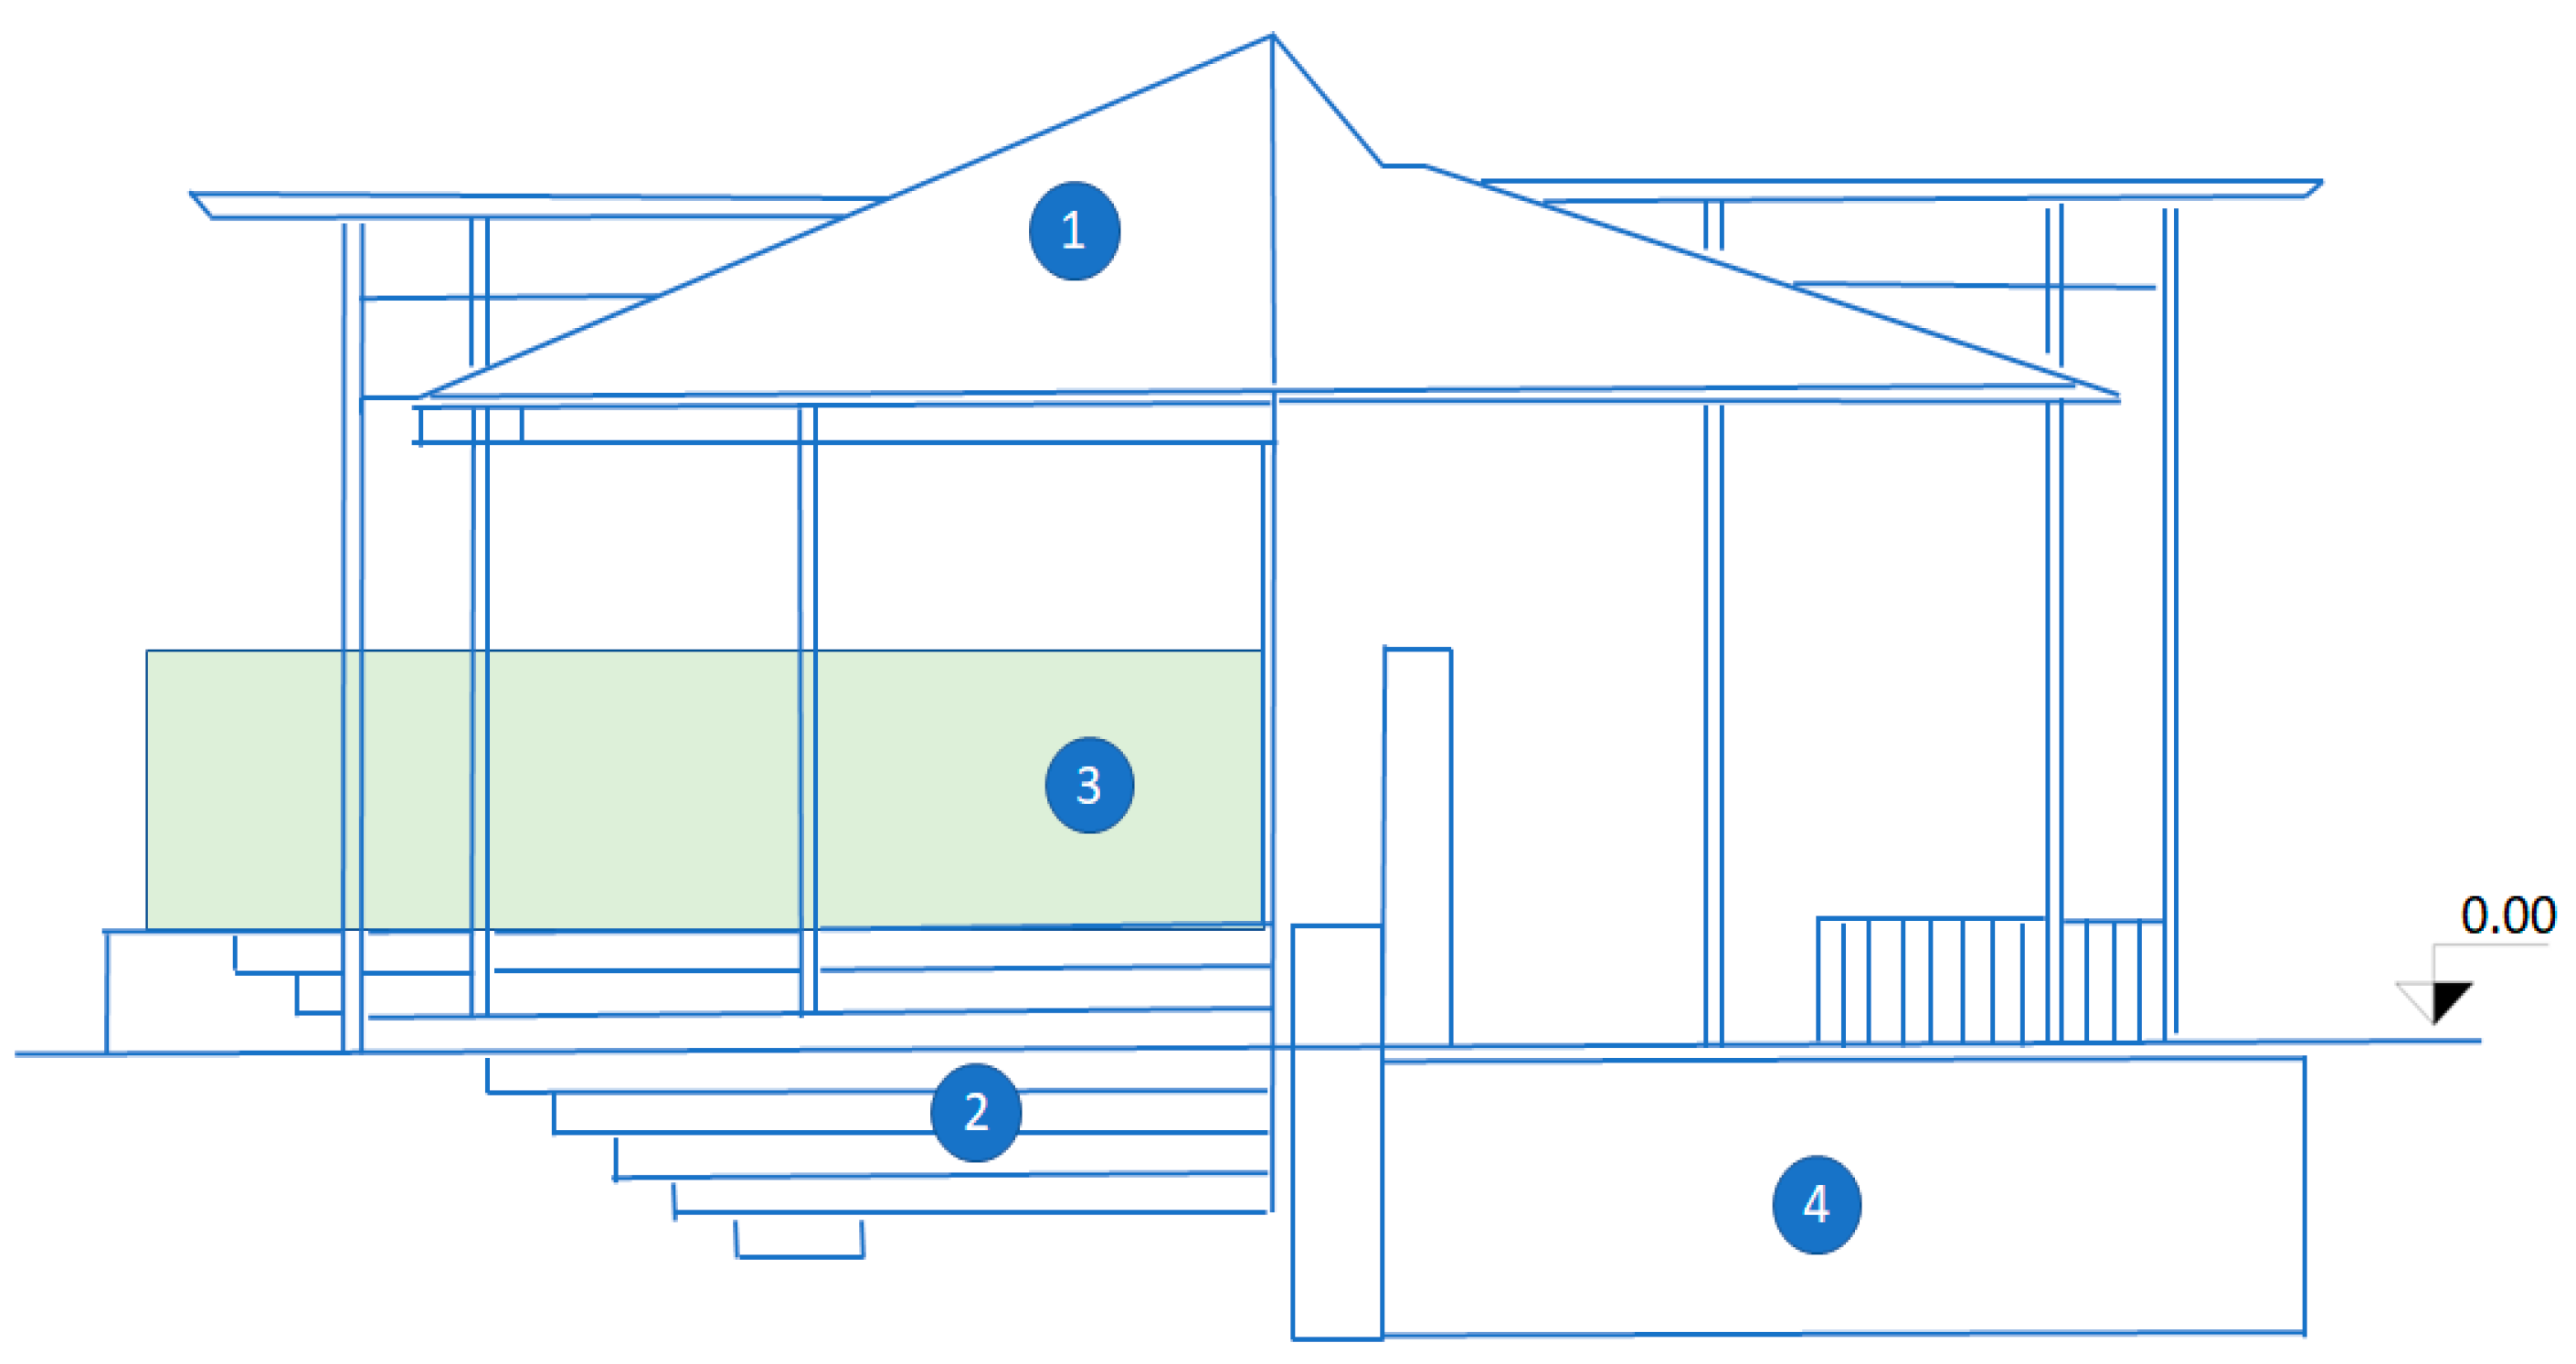
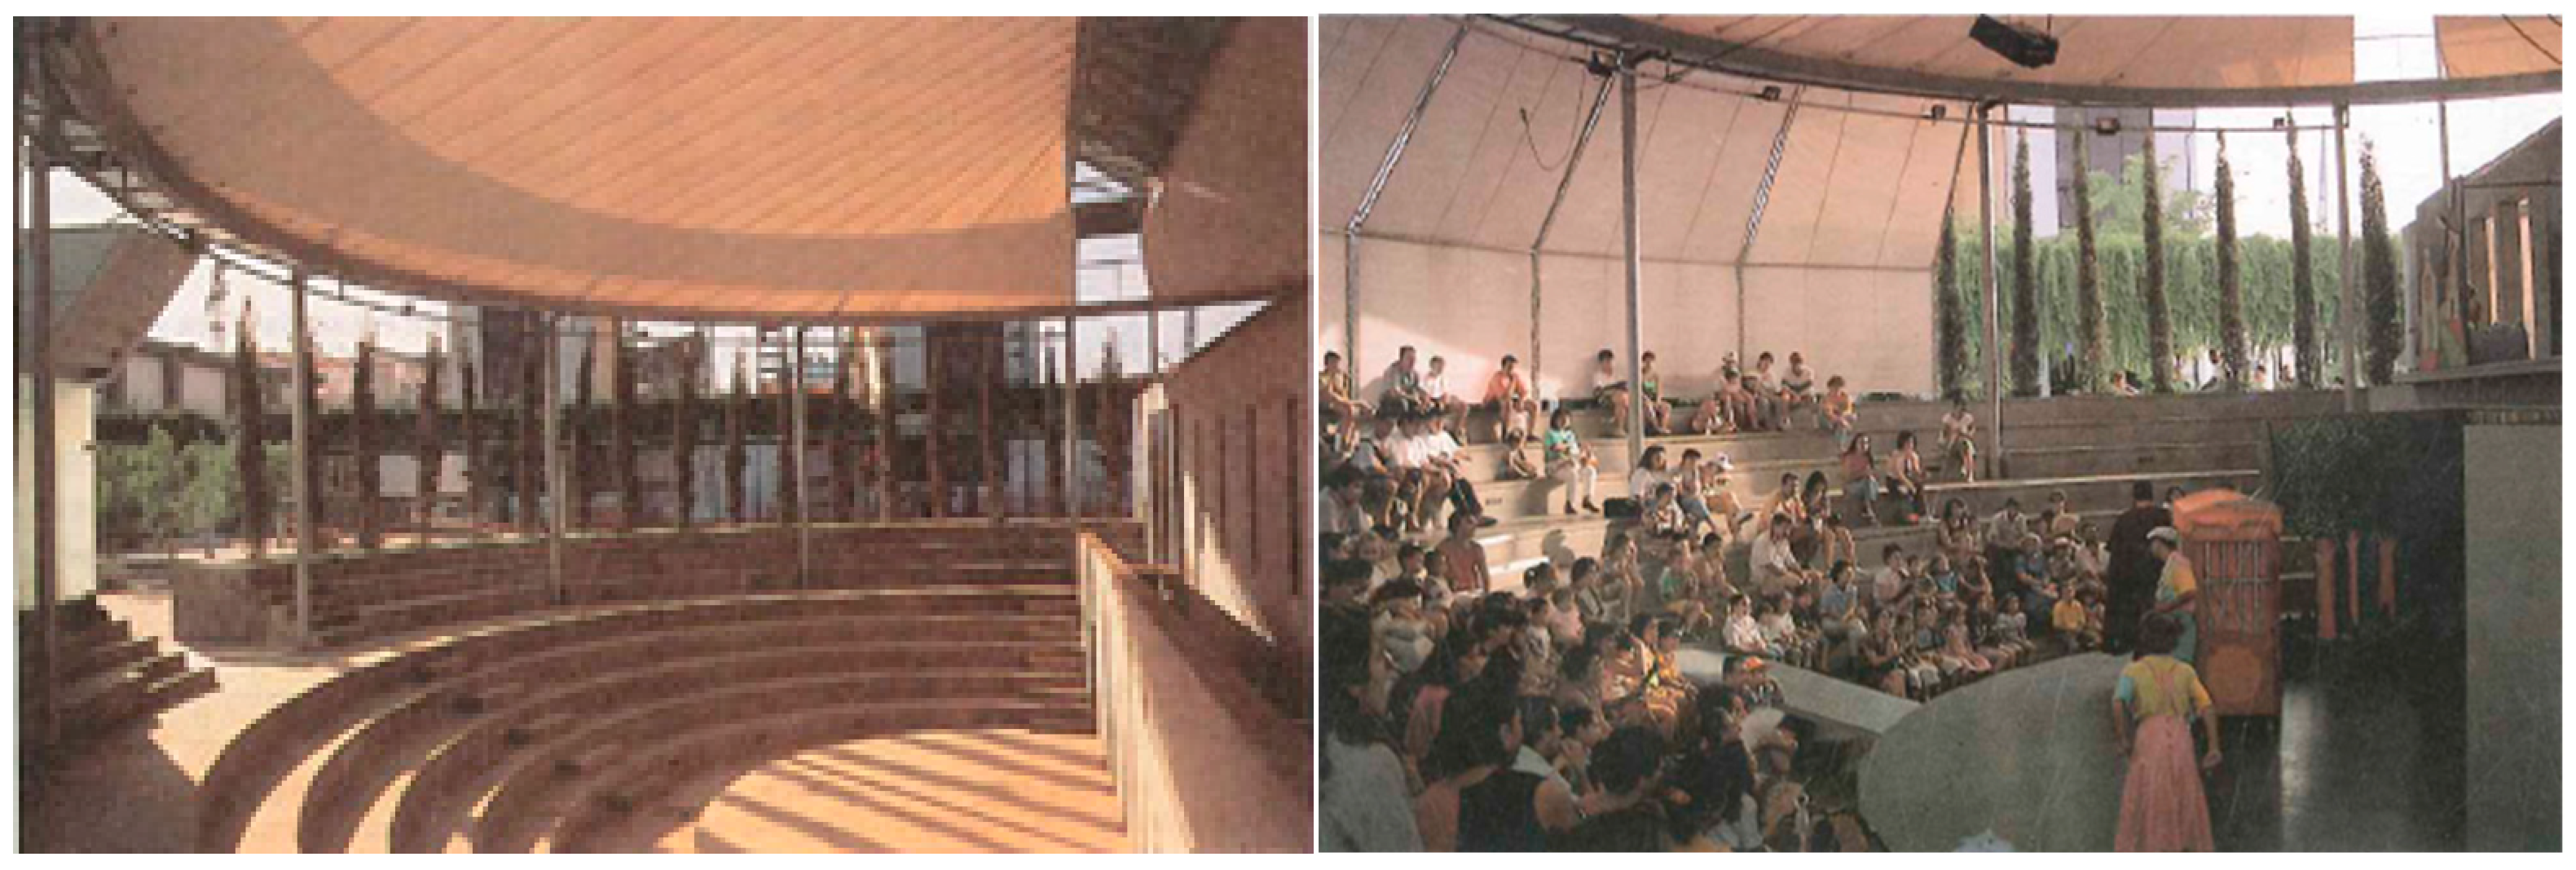
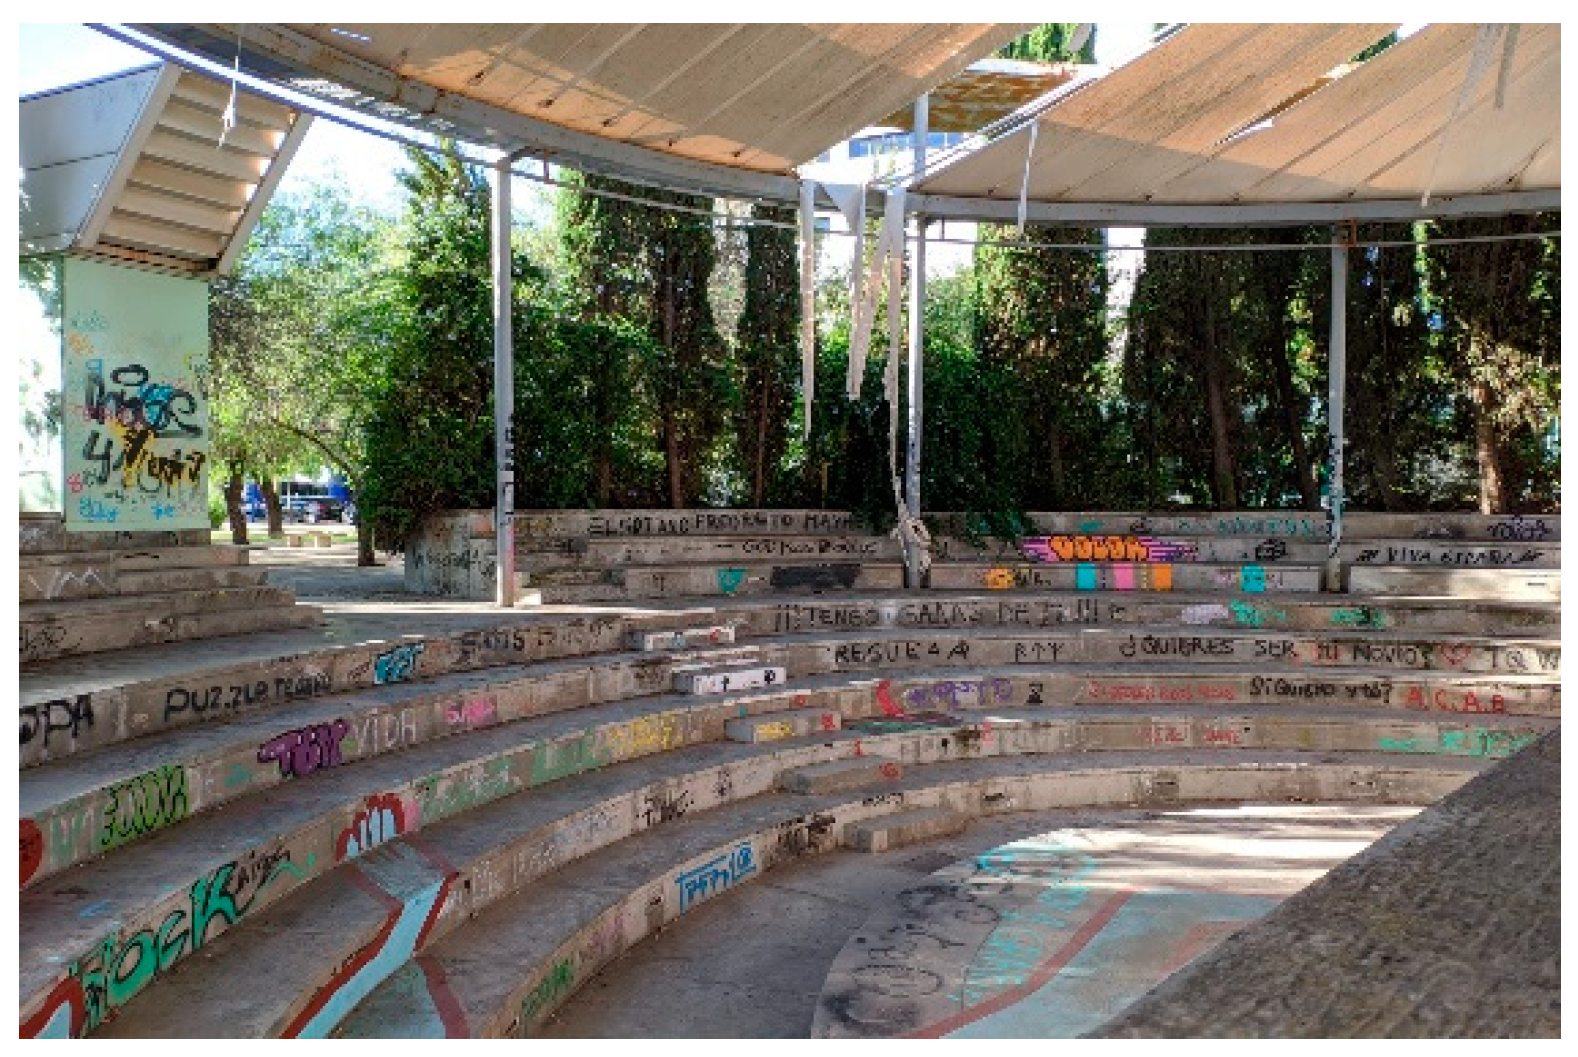
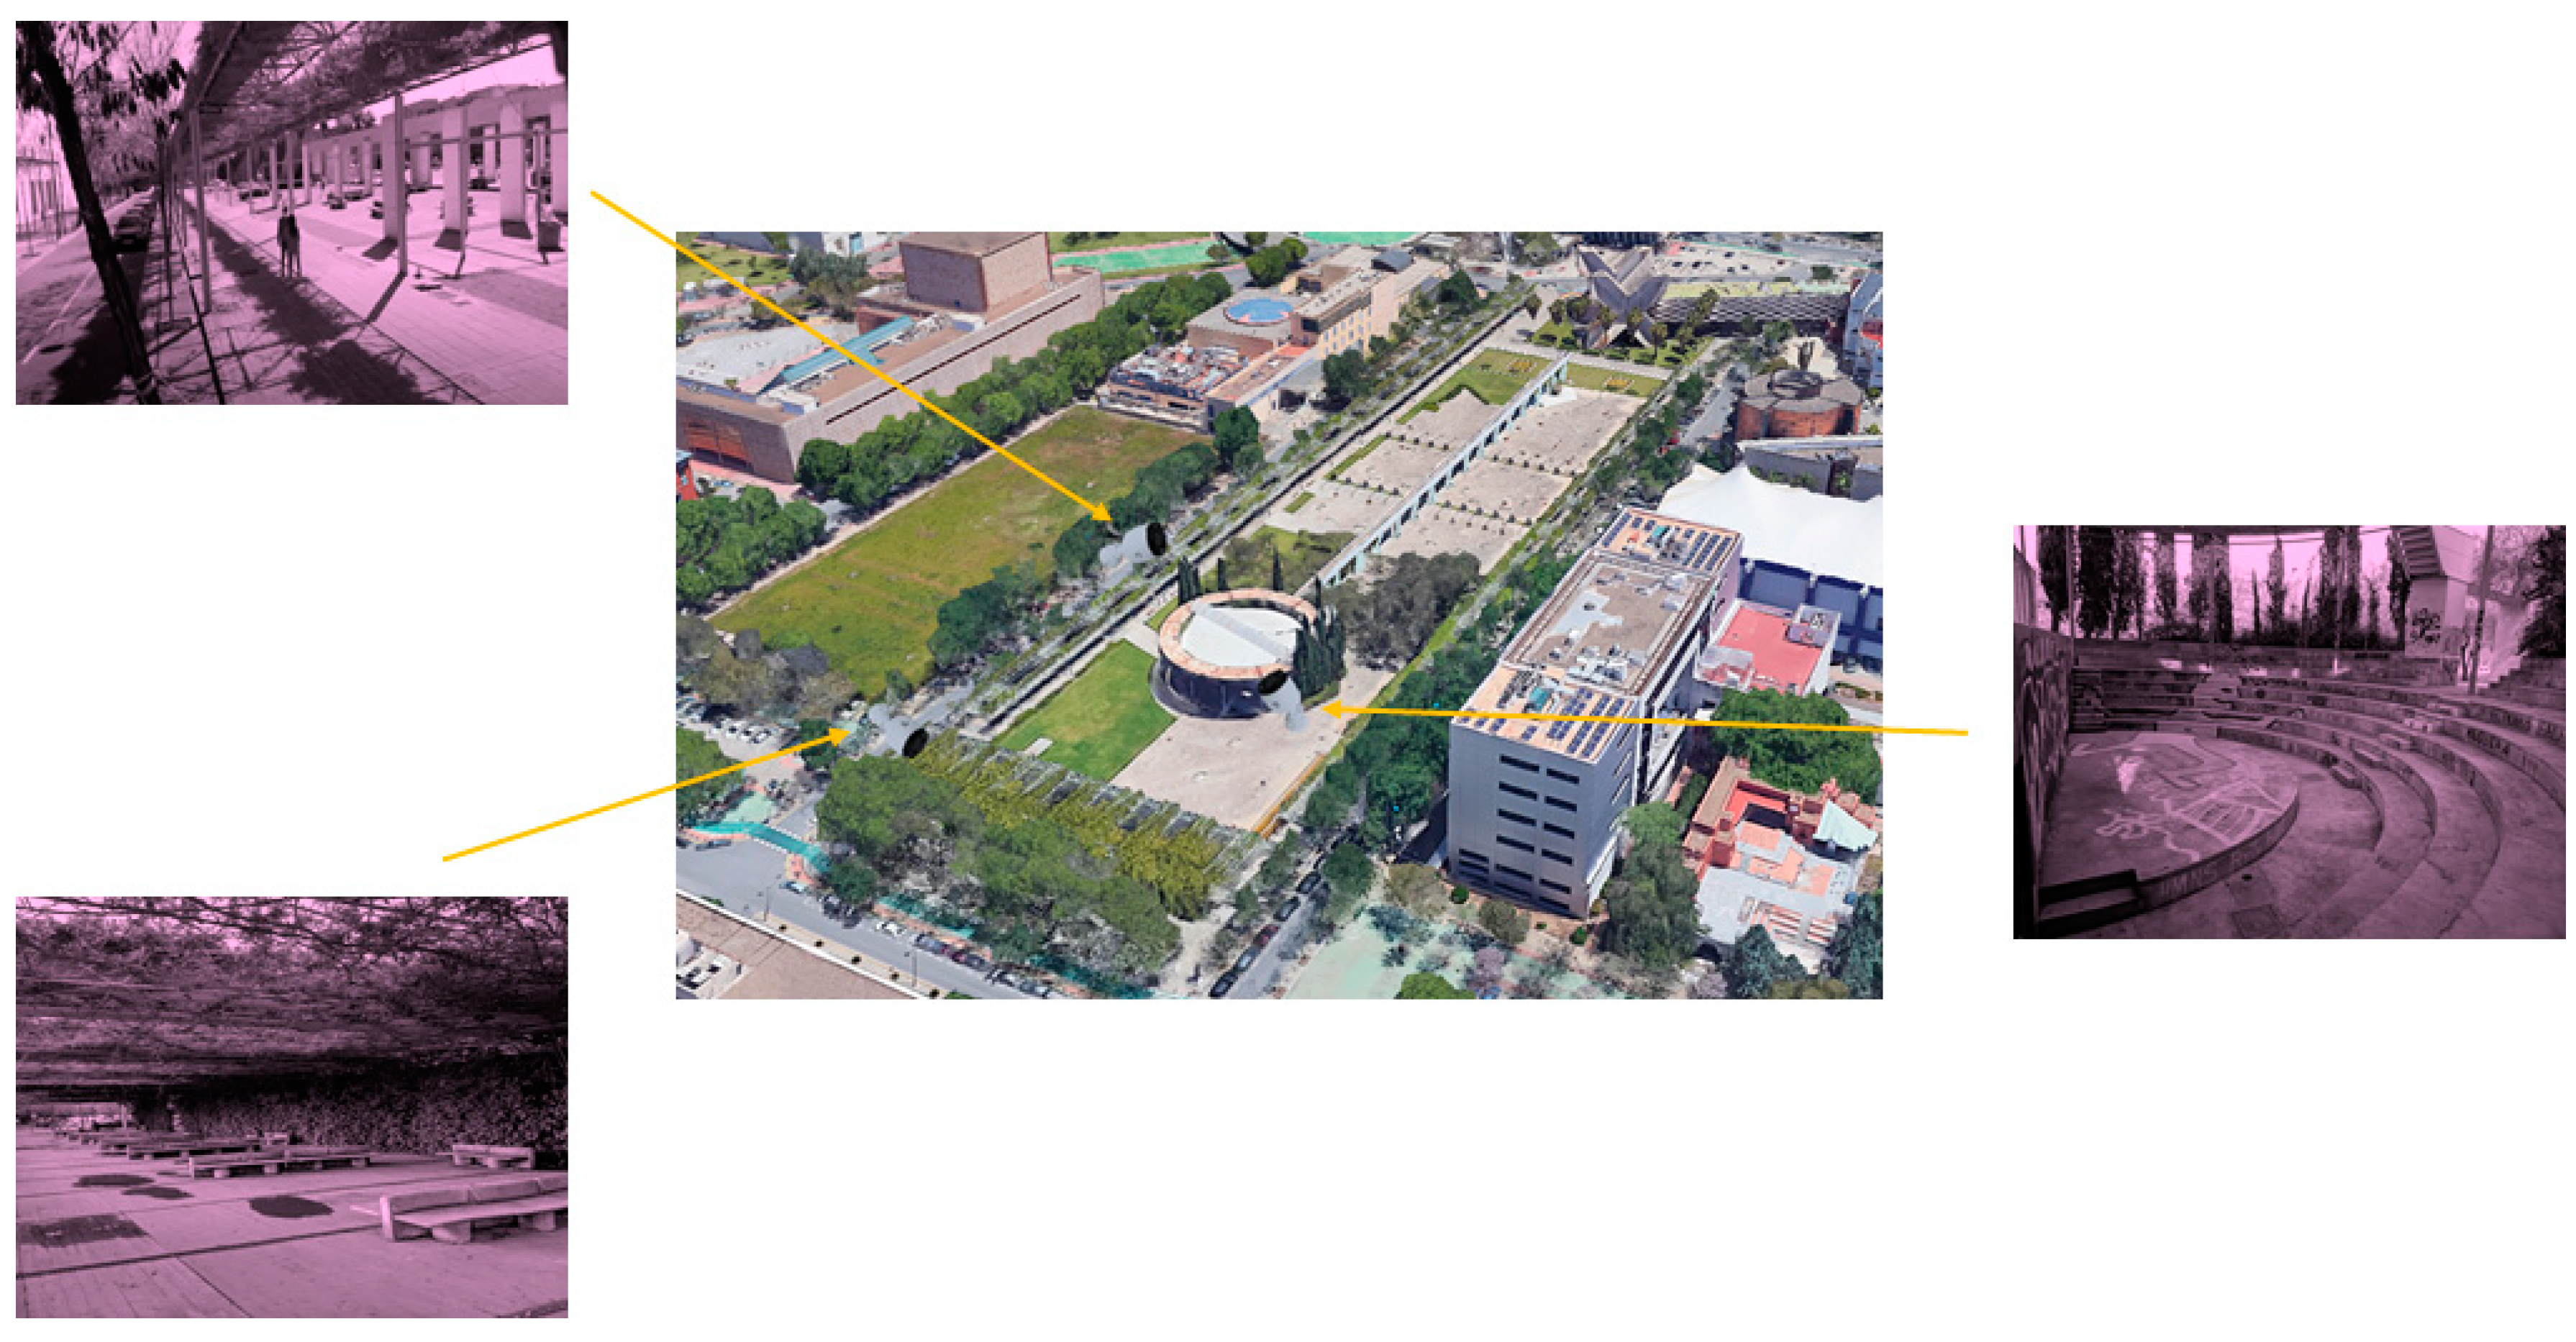
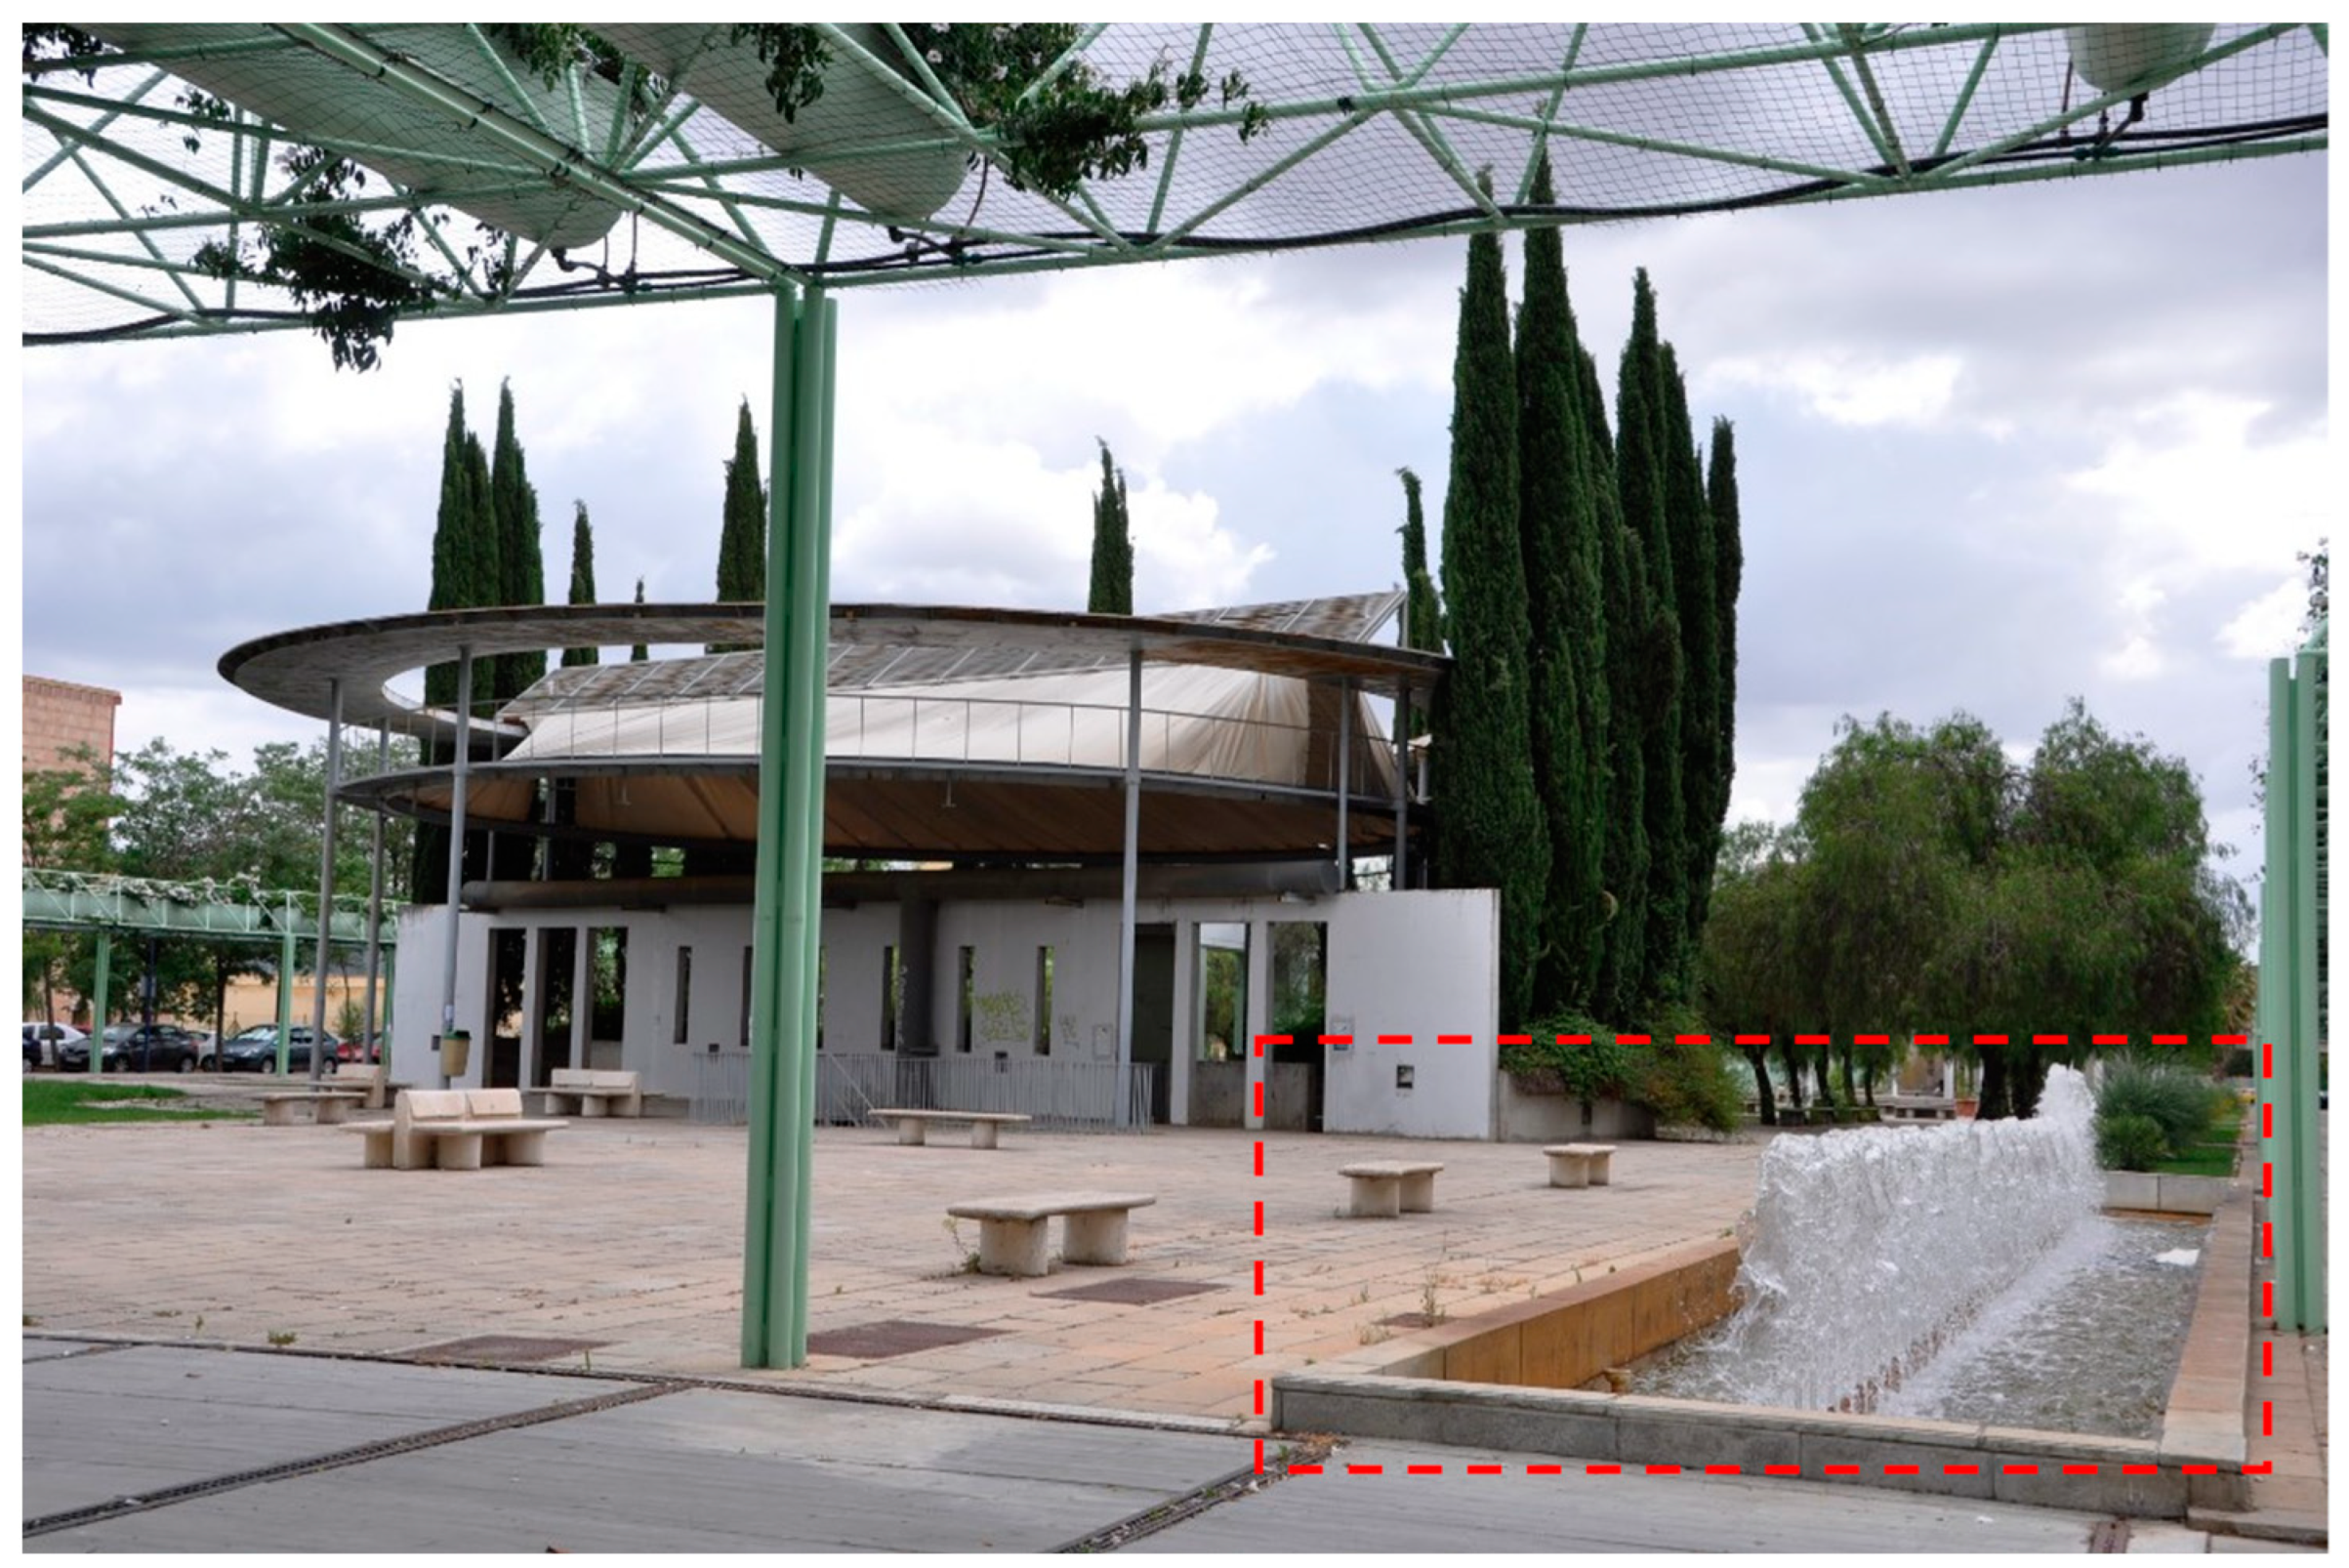
2.1. Description of the Amphitheatre
- To provide a solar control system (shadings), the site had a simple white PVC cover (low absorptivity) that also served an aesthetic purpose.
- The amphitheatre is located in a depression about the level of the avenue and has a diameter wall running from north to south that encloses the stage, separating the place where shows take place from the avenue.
- The seating terraces are completely surrounded by trees/vegetation that acted as natural barriers, enclosing the space better.
- This space was used as changing rooms for the different artists who performed a show daily.
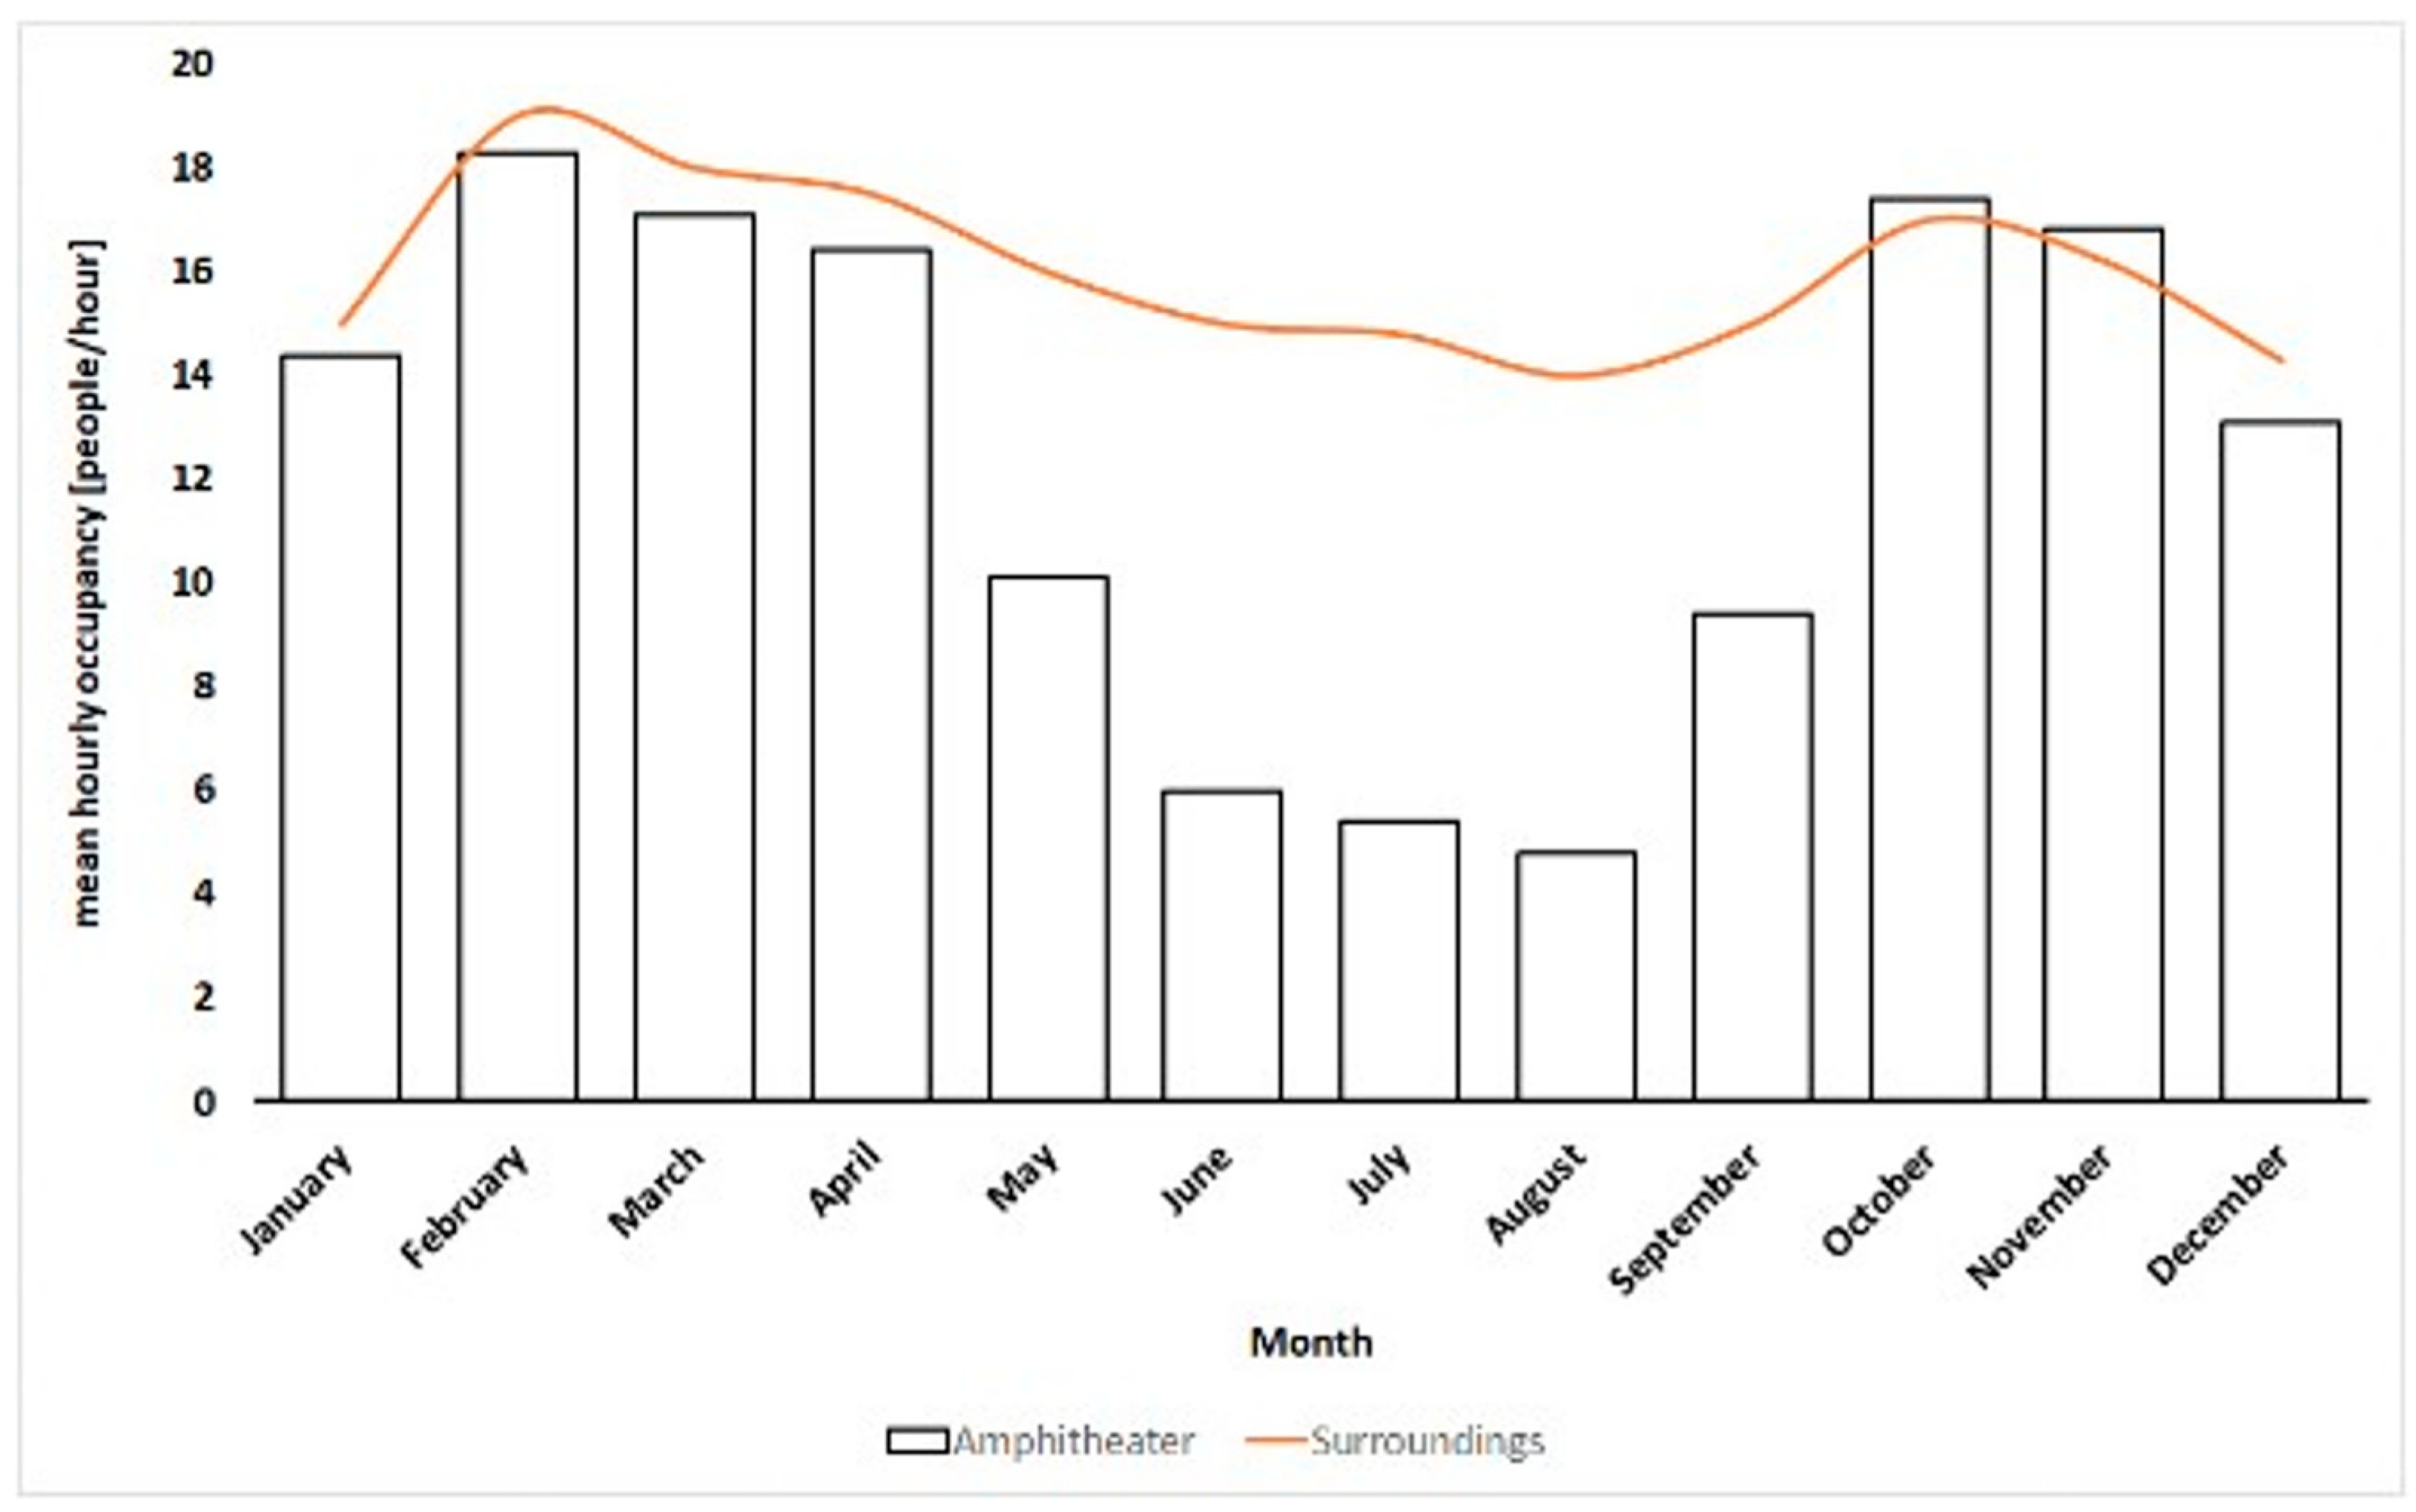
2.2. Occupancy of the Amphitheatre and Its Surroundings Occupancy
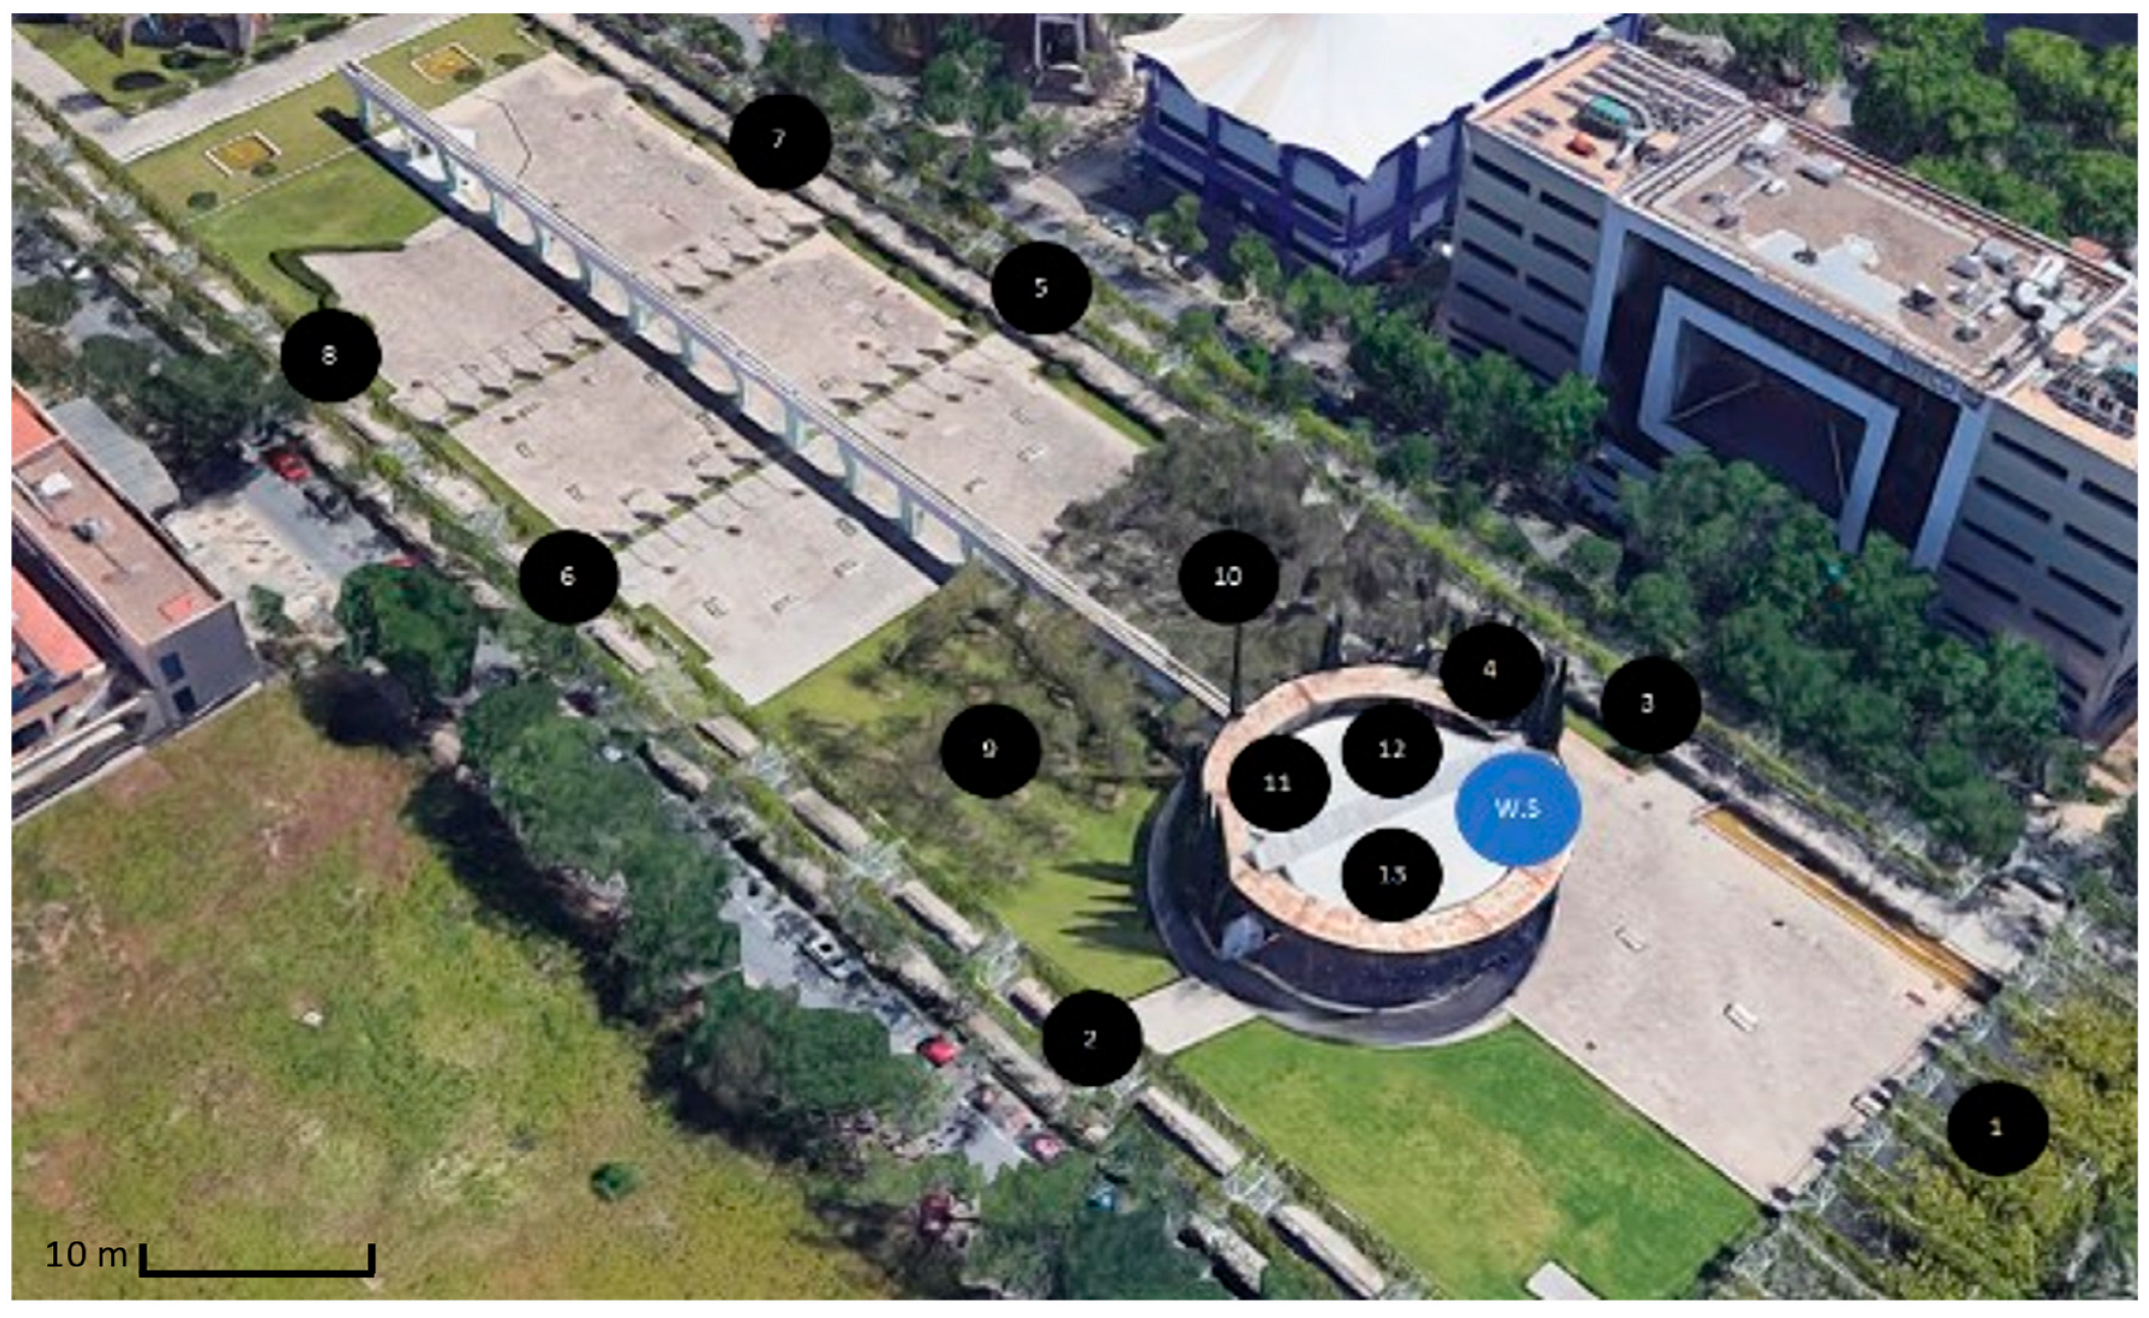
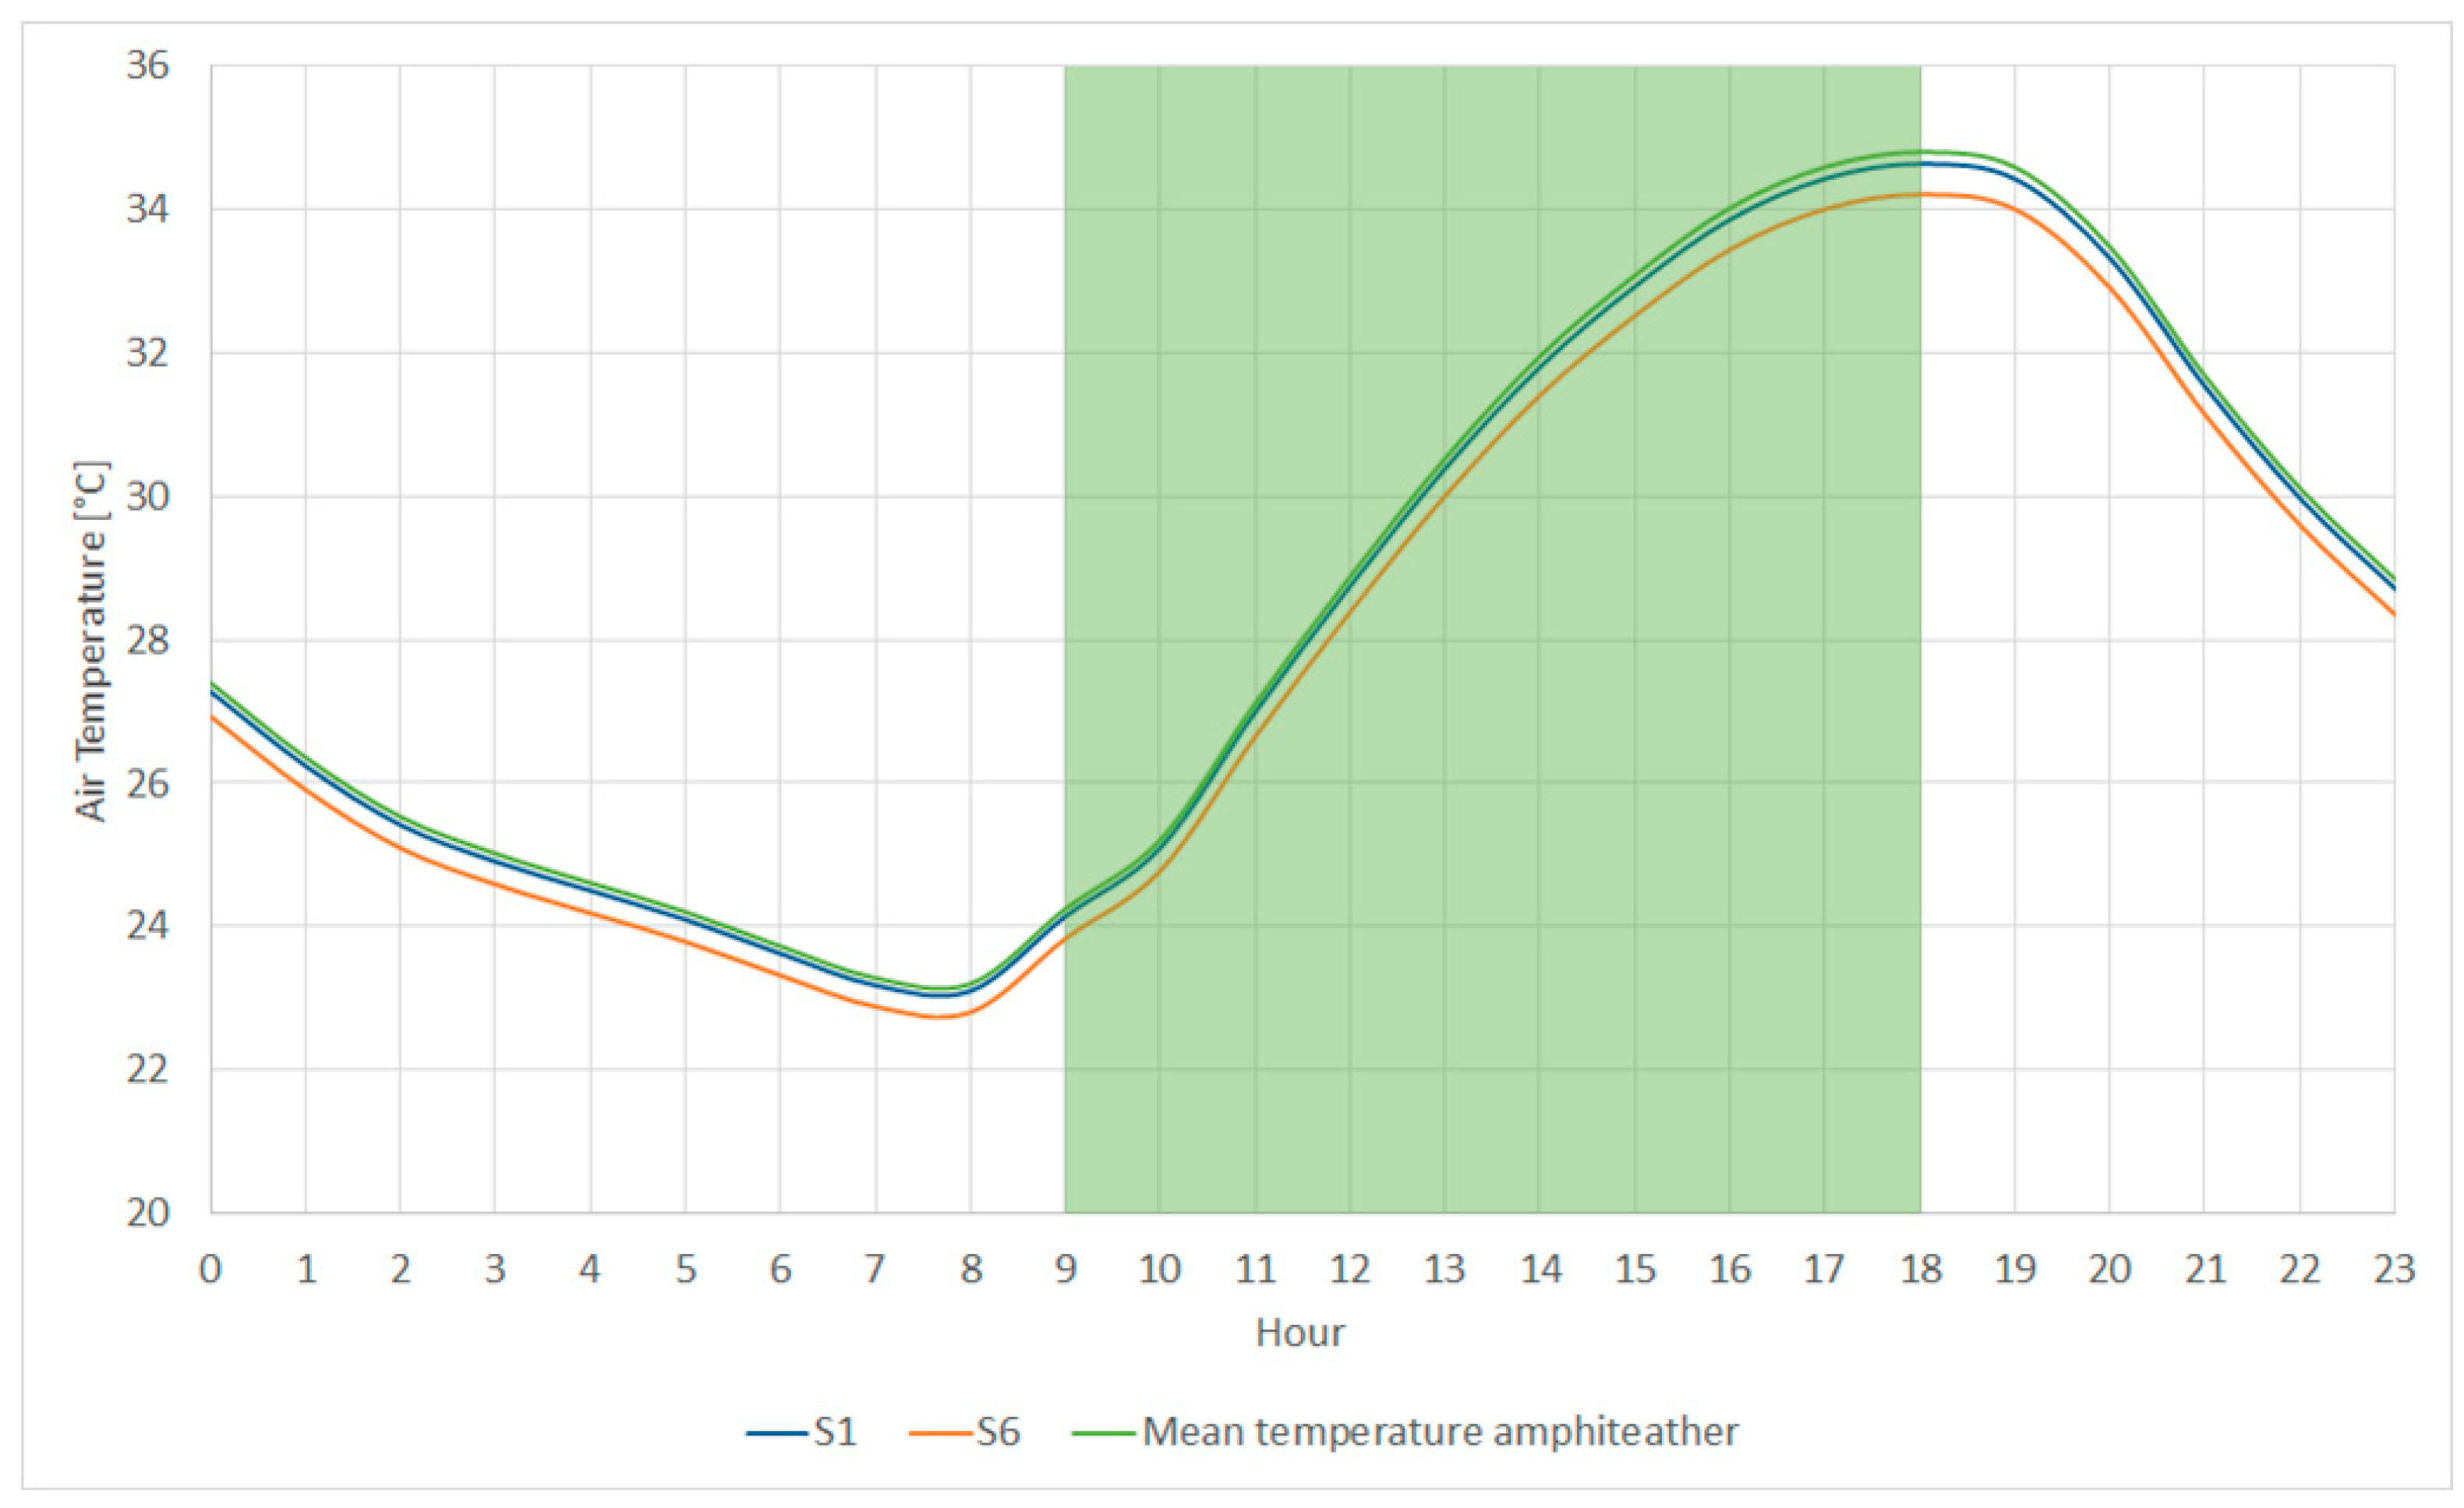
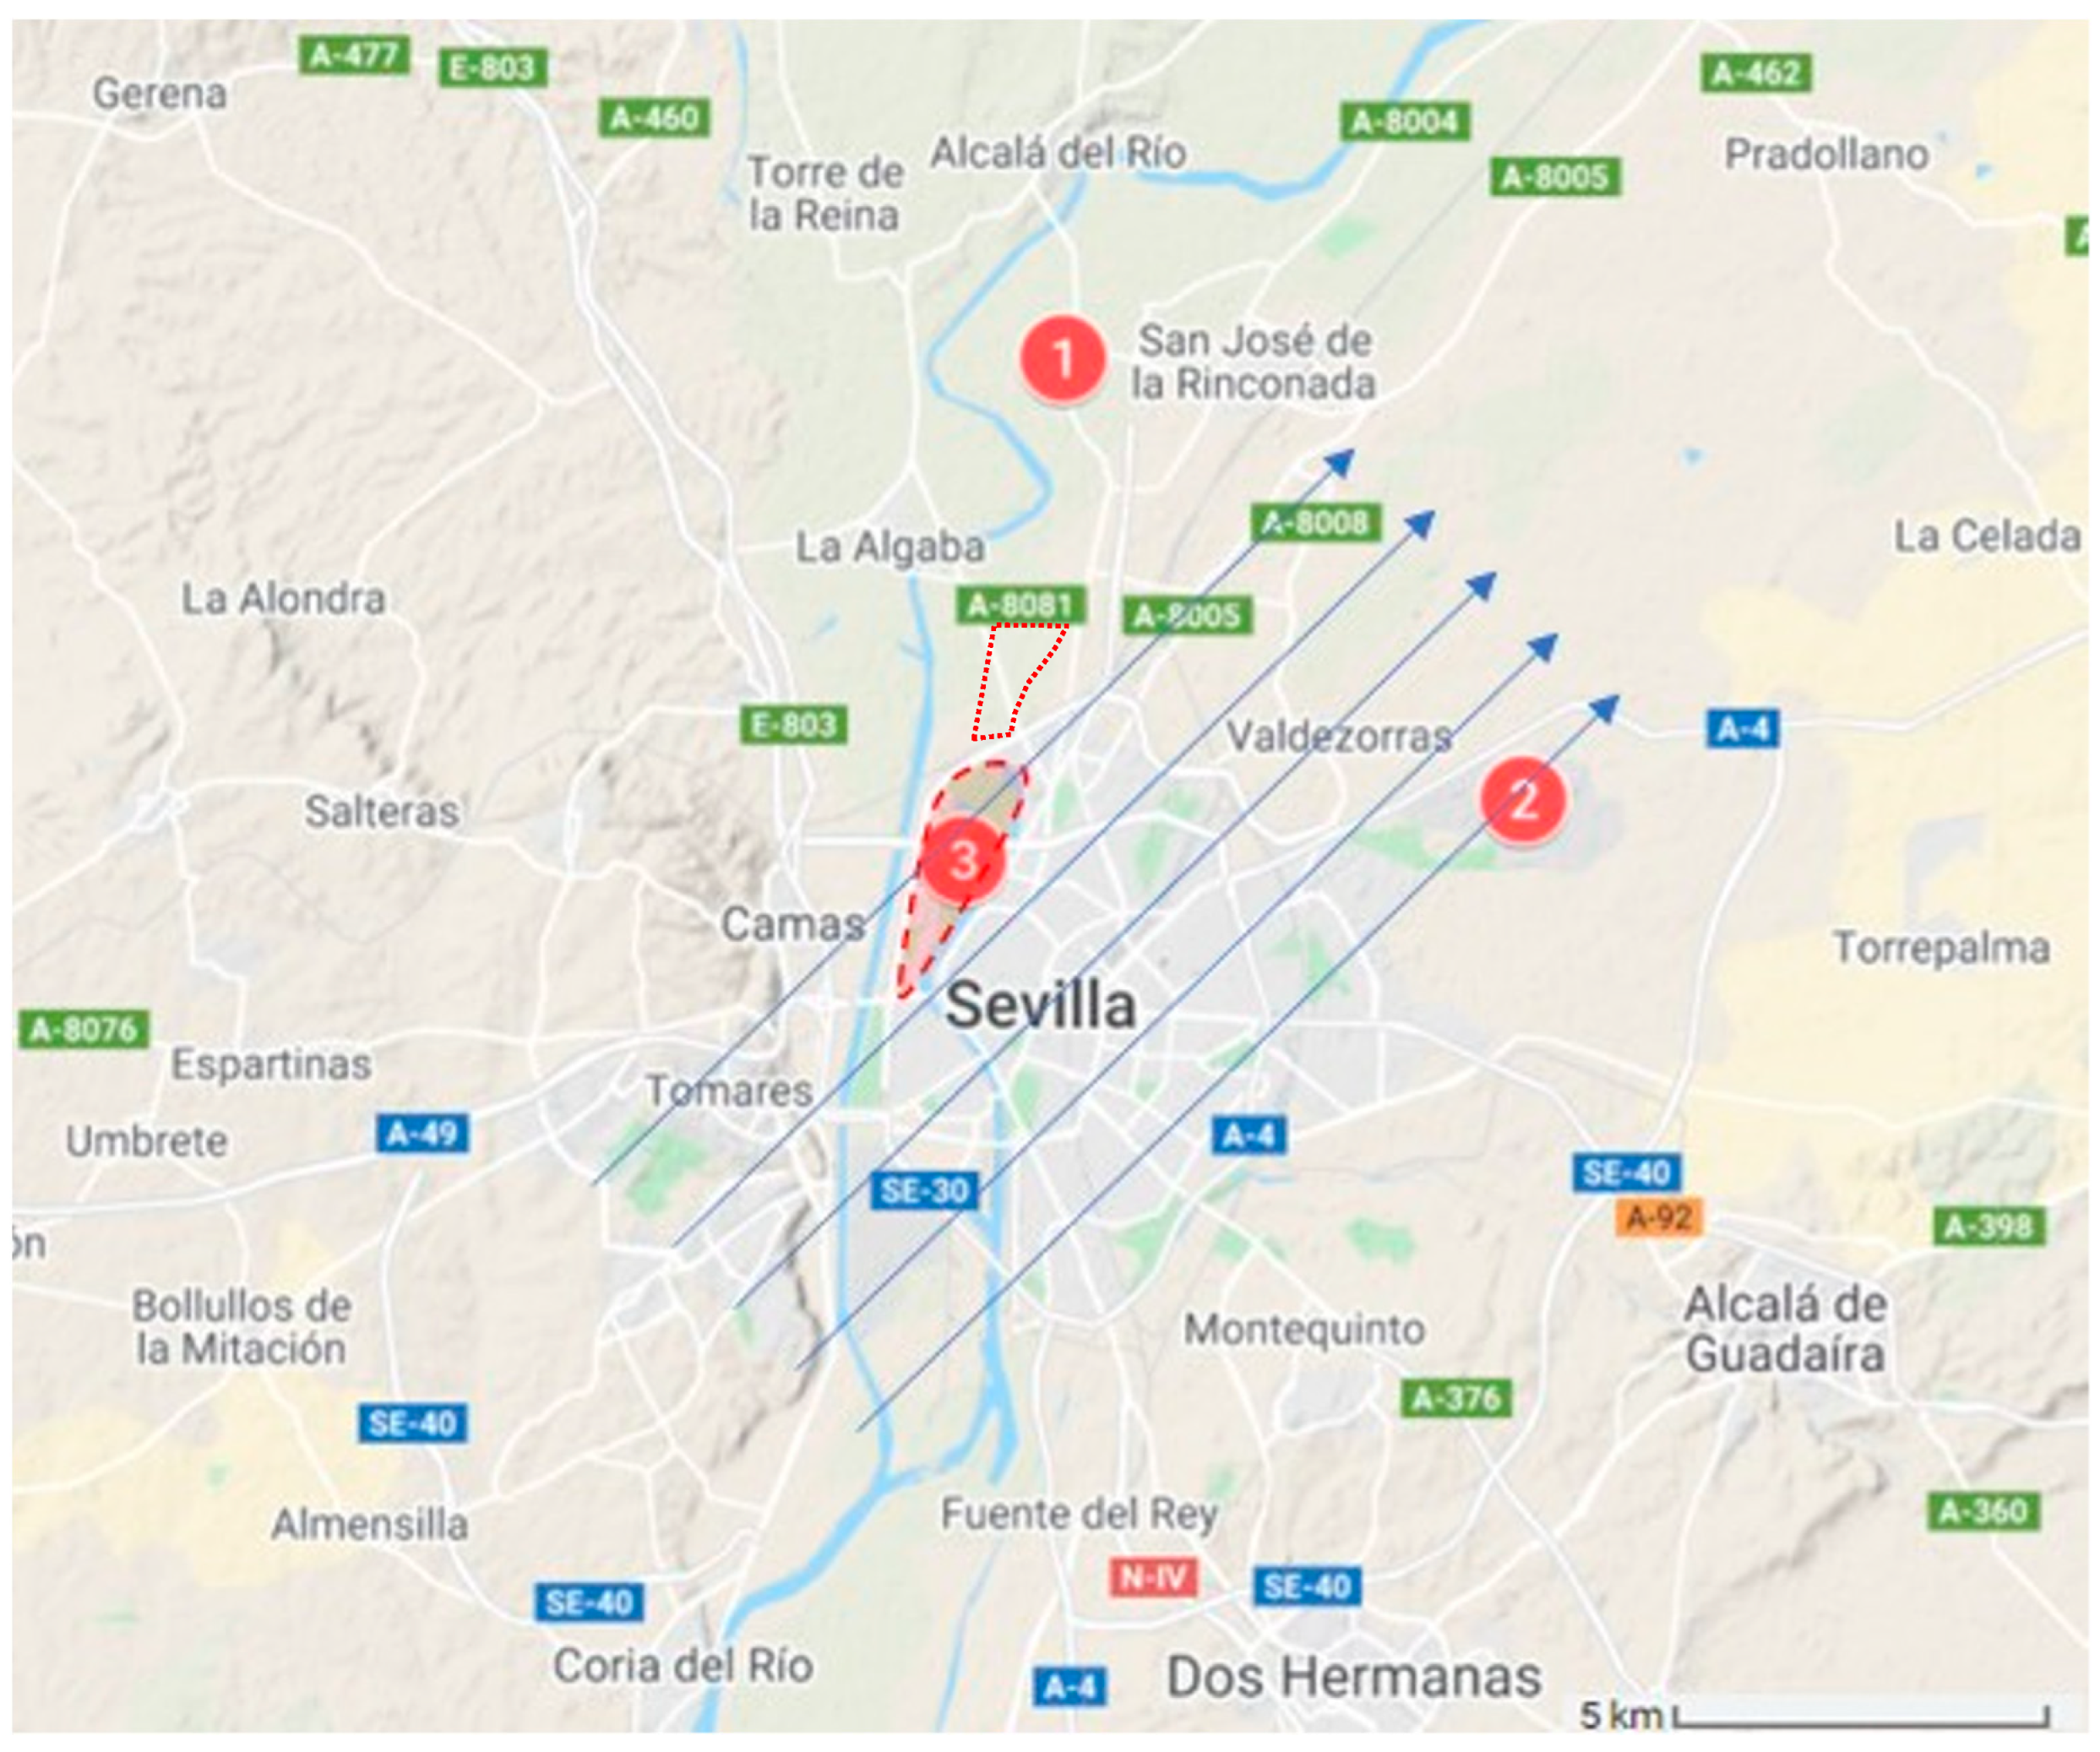
2.3. Analysis of the UHI
2.4. Design Intervention
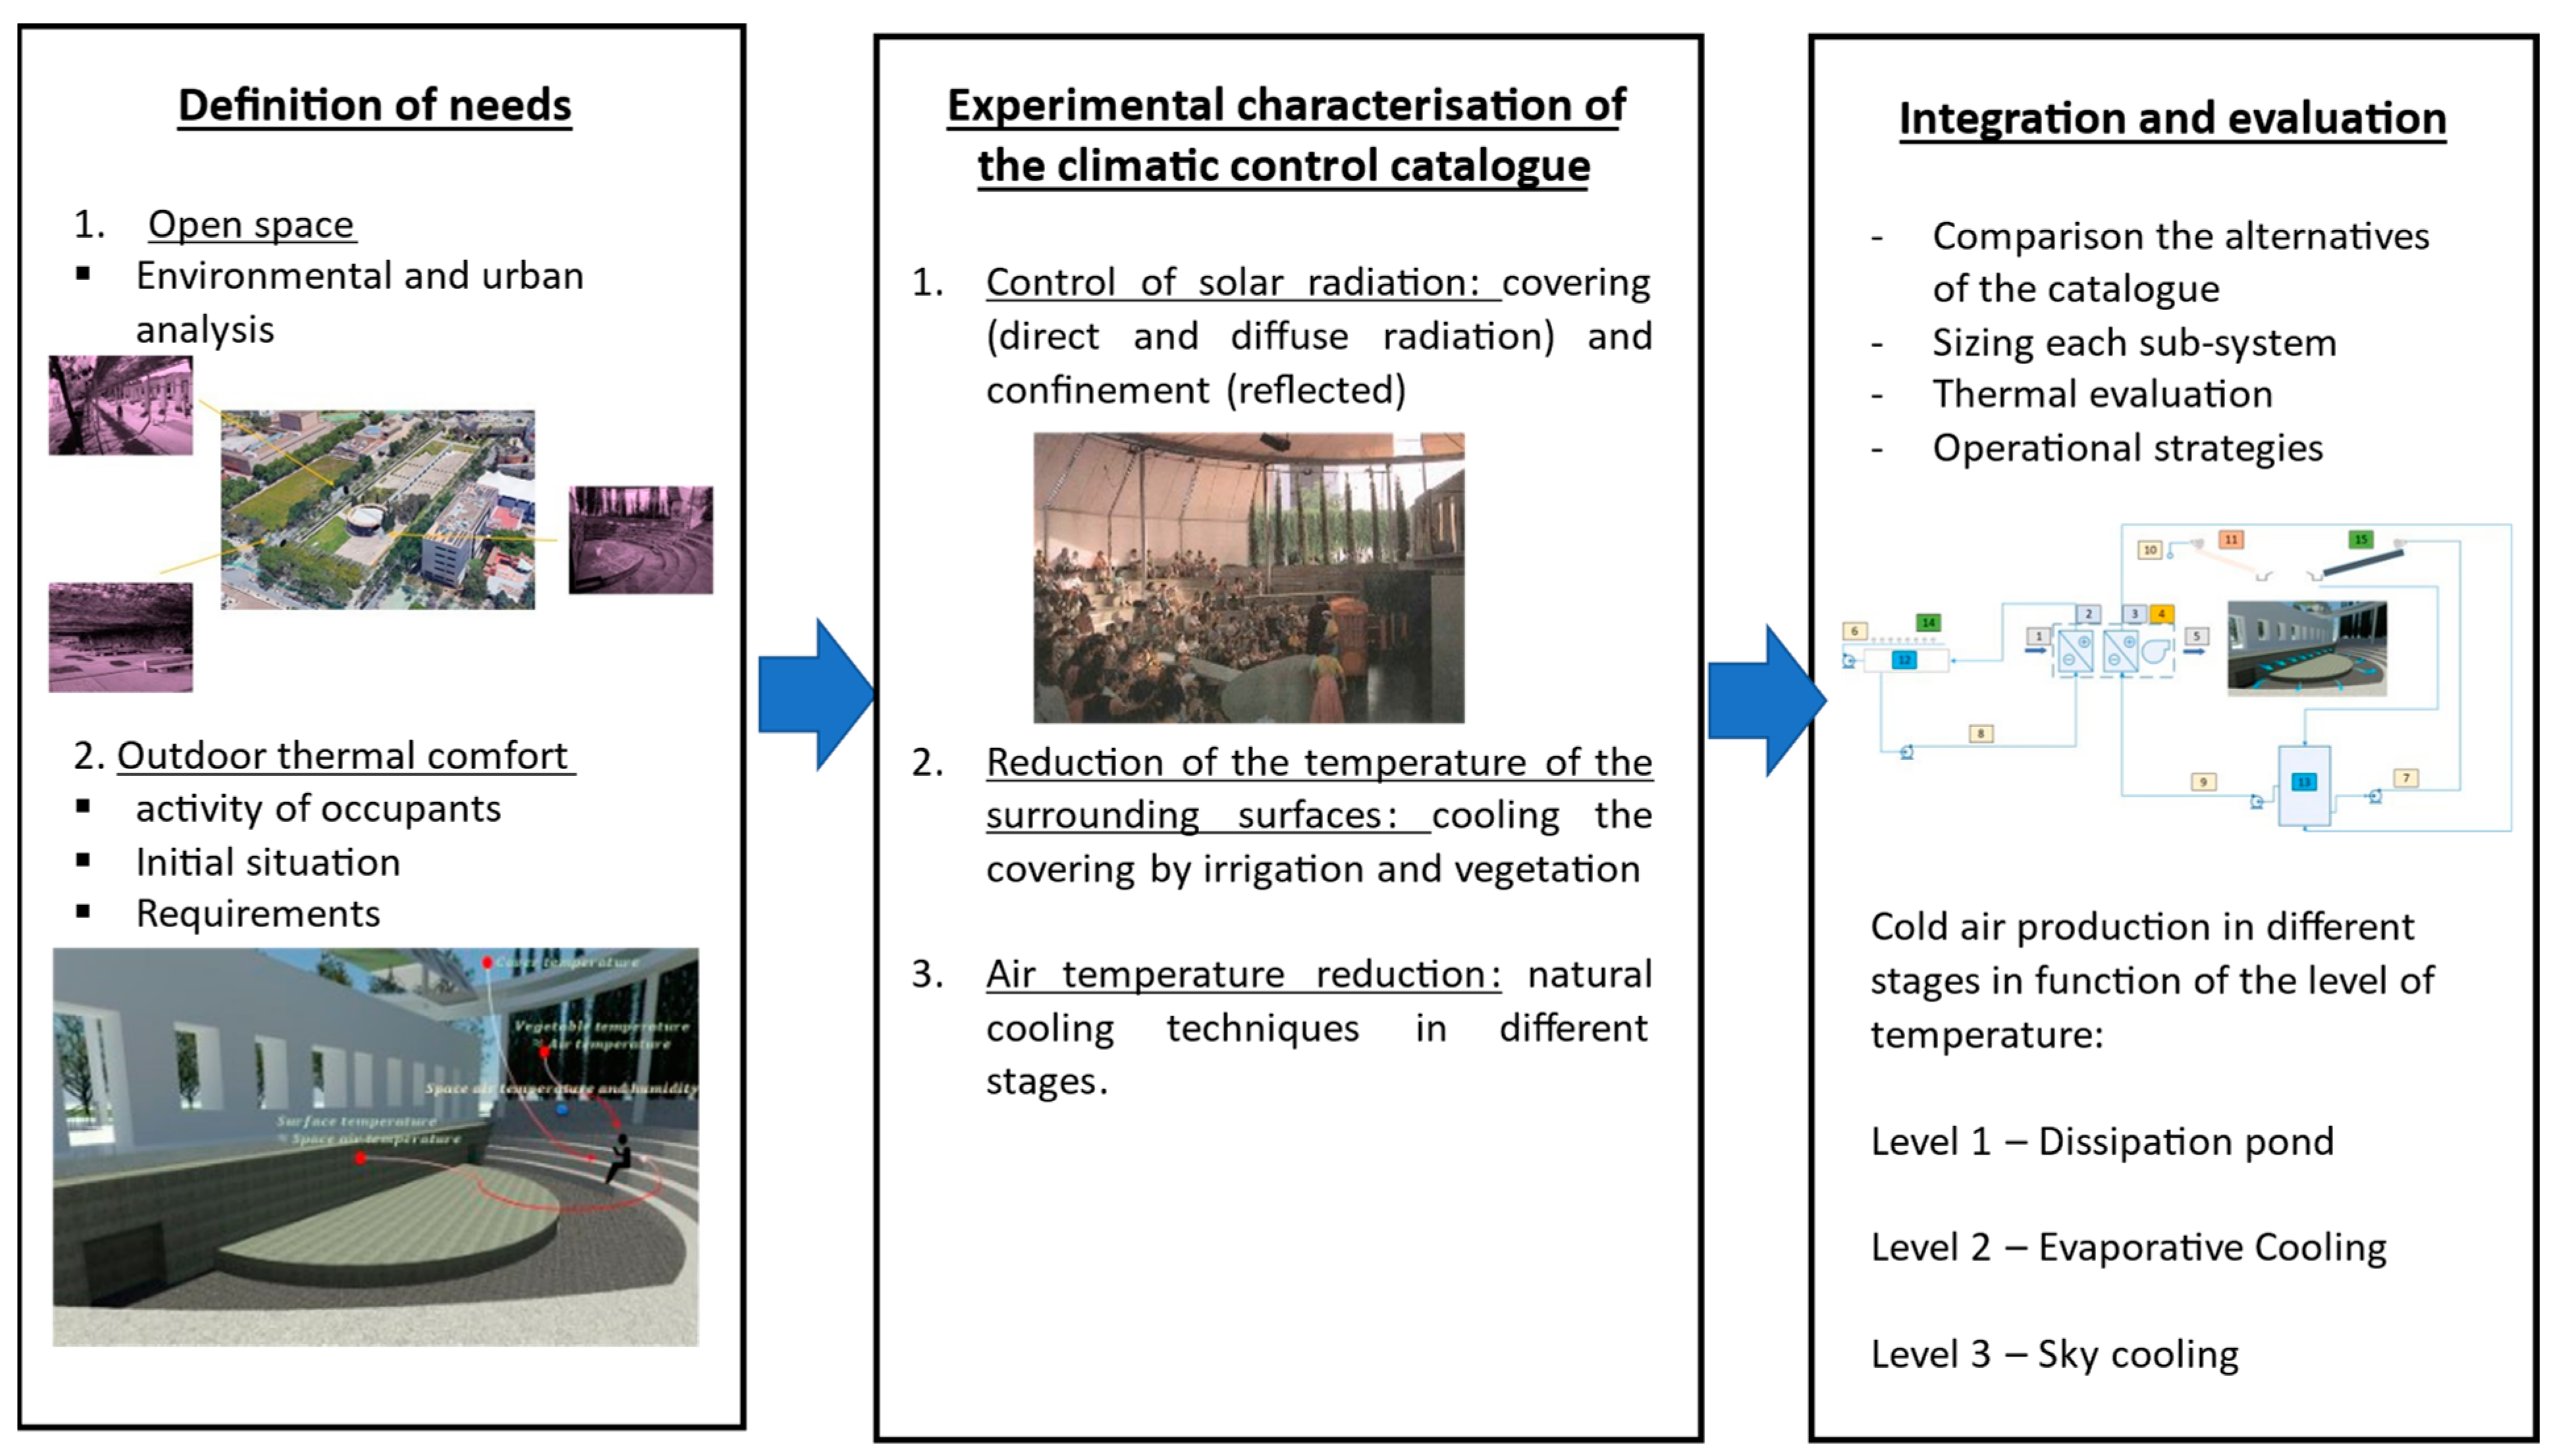
3. Method
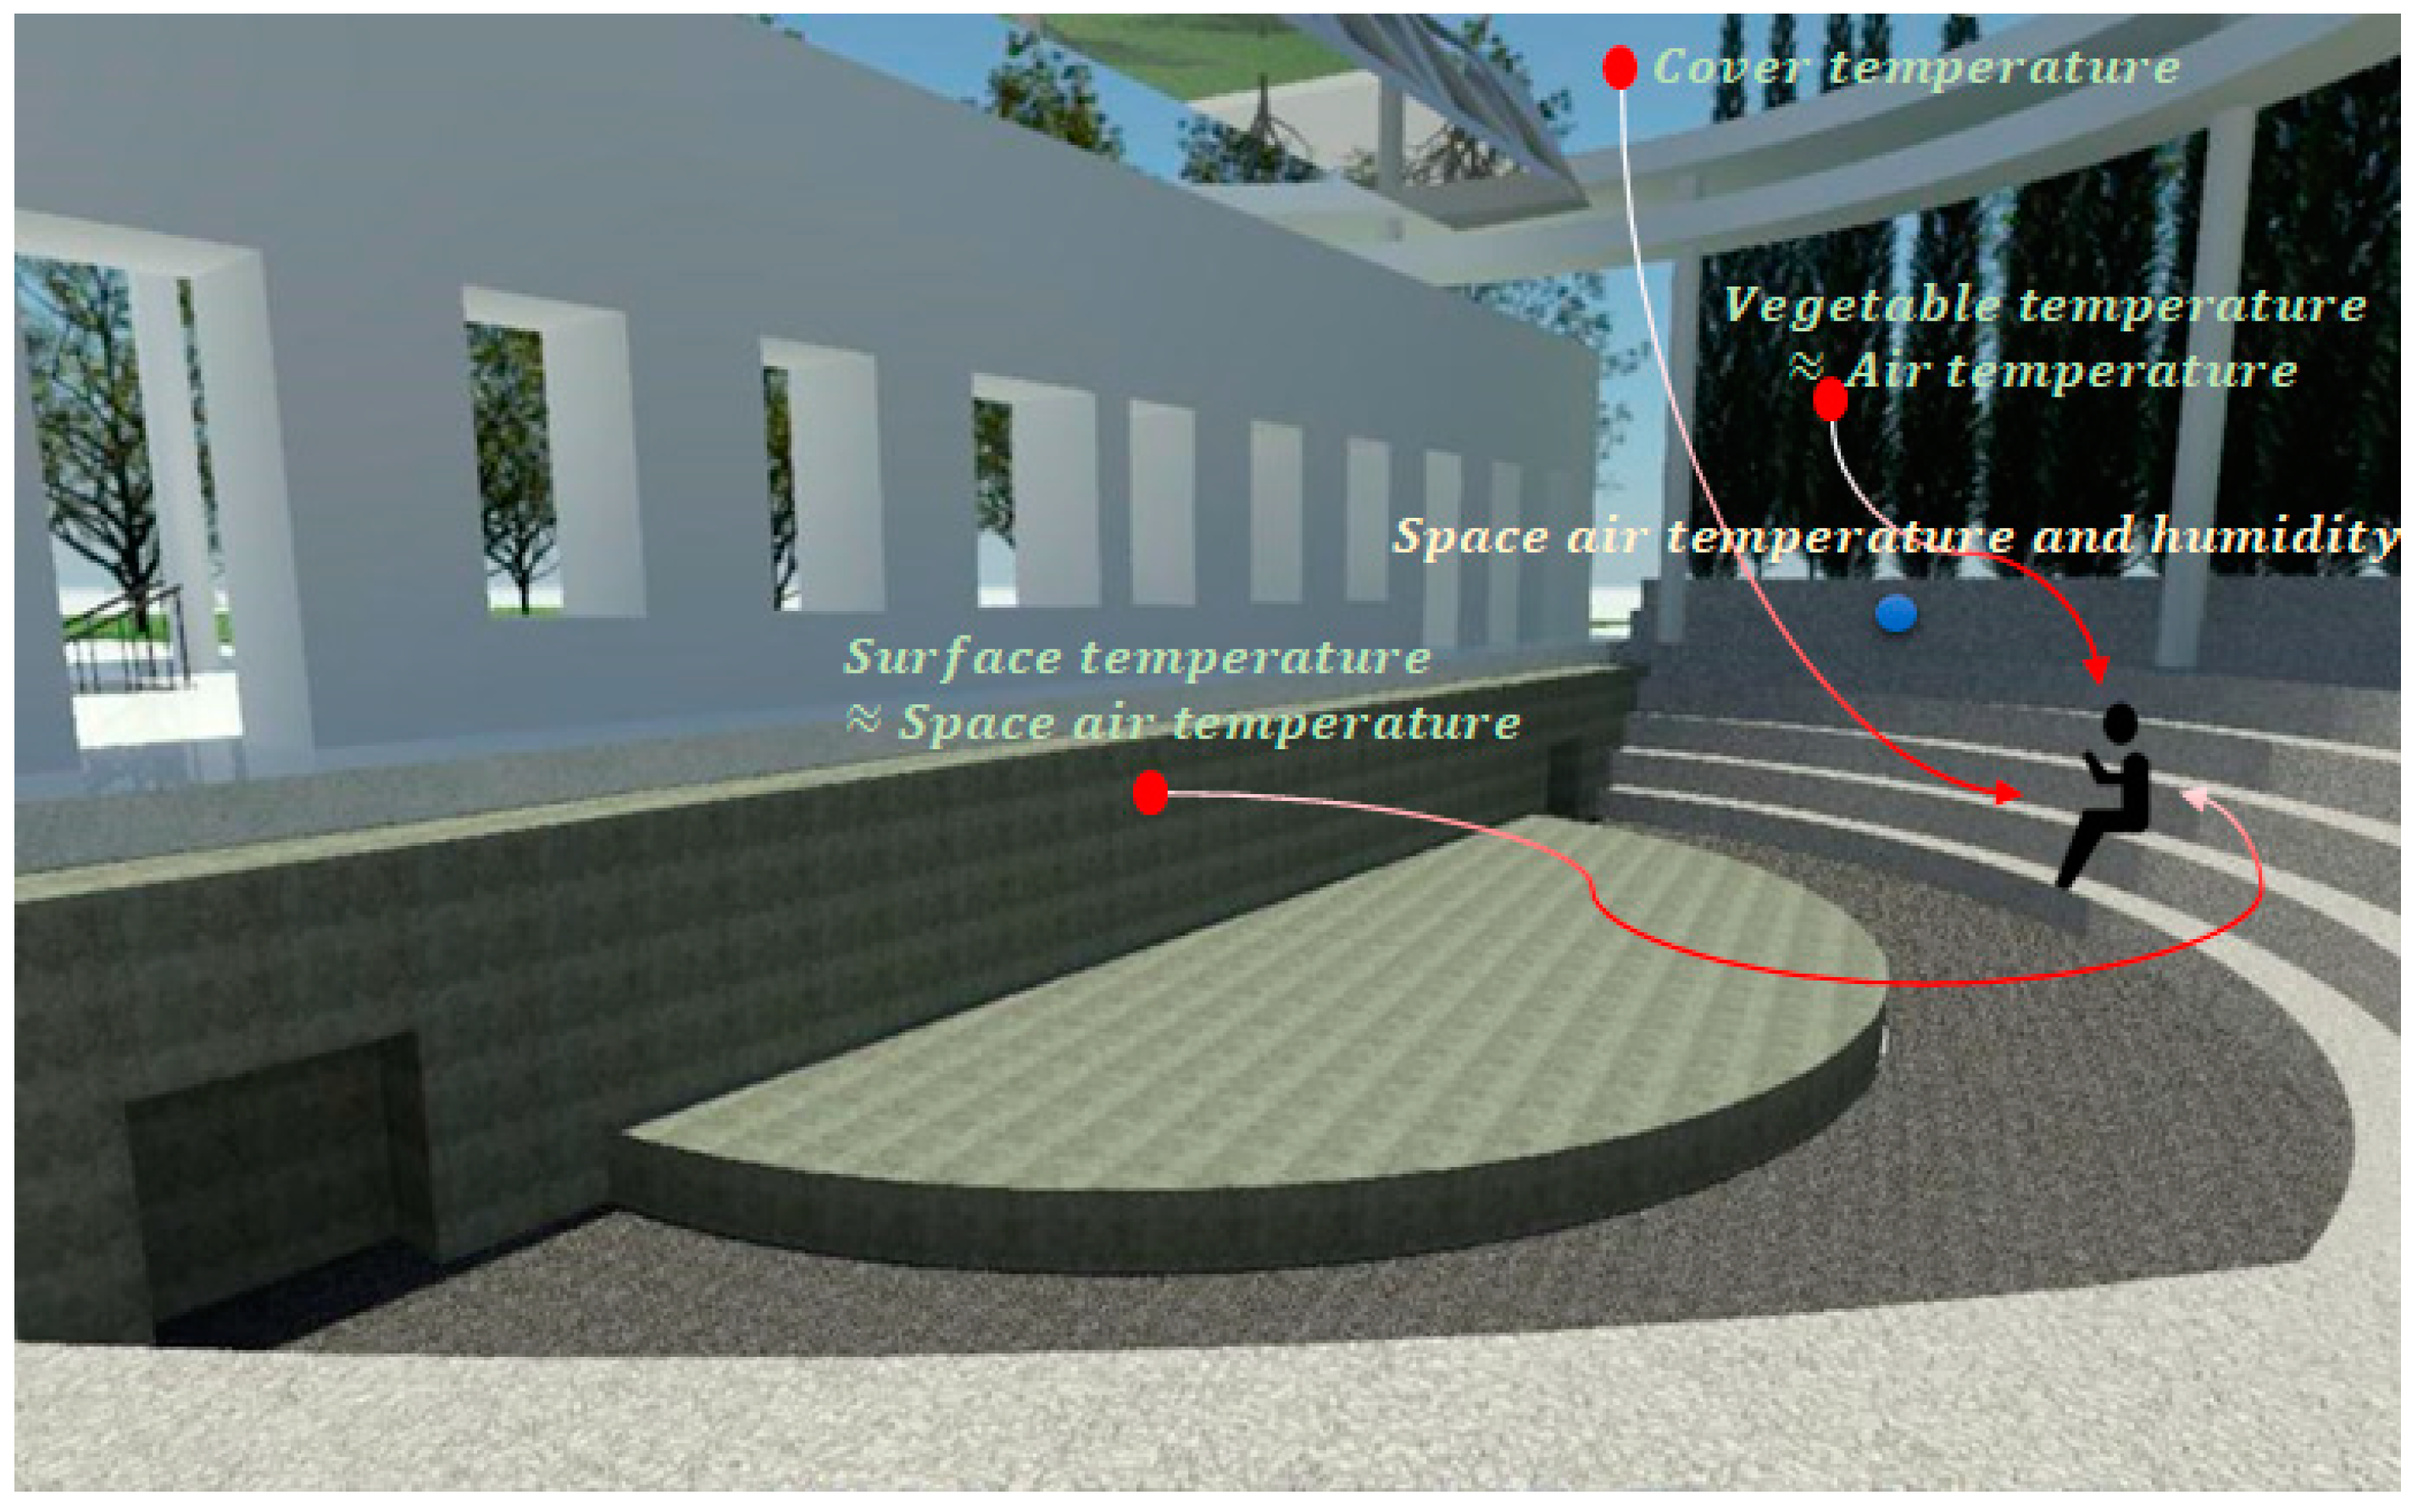
3.1. Outdoor Thermal Comfort
- Tiers of seating: the temperature of the tiers of seating is considered to be equal to the ambient temperature of the confined space.
- Vegetation barrier: The natural barrier temperature corresponds to the temperature outside of the amphitheatre unless evaporative barriers are used to cool the air entering it.
3.2. Identification of Microclimate Control Strategies
- Influence of solar radiation on the occupant: This amount is the greatest of all the gains in outdoor spaces. Consequently, blocking the radiation is the most effective measure, to such an extent that it is of little interest to incorporate any additional technique if the radiant heat exchange has not first been eliminated to a significant degree.
- Influence of convective exchange: the convective fraction is not the decisive parameter, so techniques focusing on decreasing air temperature should only be applied after other measures have been taken.
- Influence of air velocity: This ensures that sweating is effective as evaporation takes place more efficiently, thus favouring the convective exchange by increasing the air-skin transfer coefficient. On the other hand, in outdoor spaces, techniques are used aimed at the localised decrease of the ambient temperature, so the means must be in place to control the parasitic air inflow.
3.3. Description of the Mzicroclimate Control Strategies
- Reduce the solar radiation striking an individual, both its direct and diffuse components and the fractions reflected by other surfaces.
- Reduce the effect of long-wave radiation received from other warmer surfaces, even changing the radiant heat exchange from positive to negative, converting it into heat loss.
- Reduce the gains due to convection and convert them into heat losses whenever possible.
4. Results
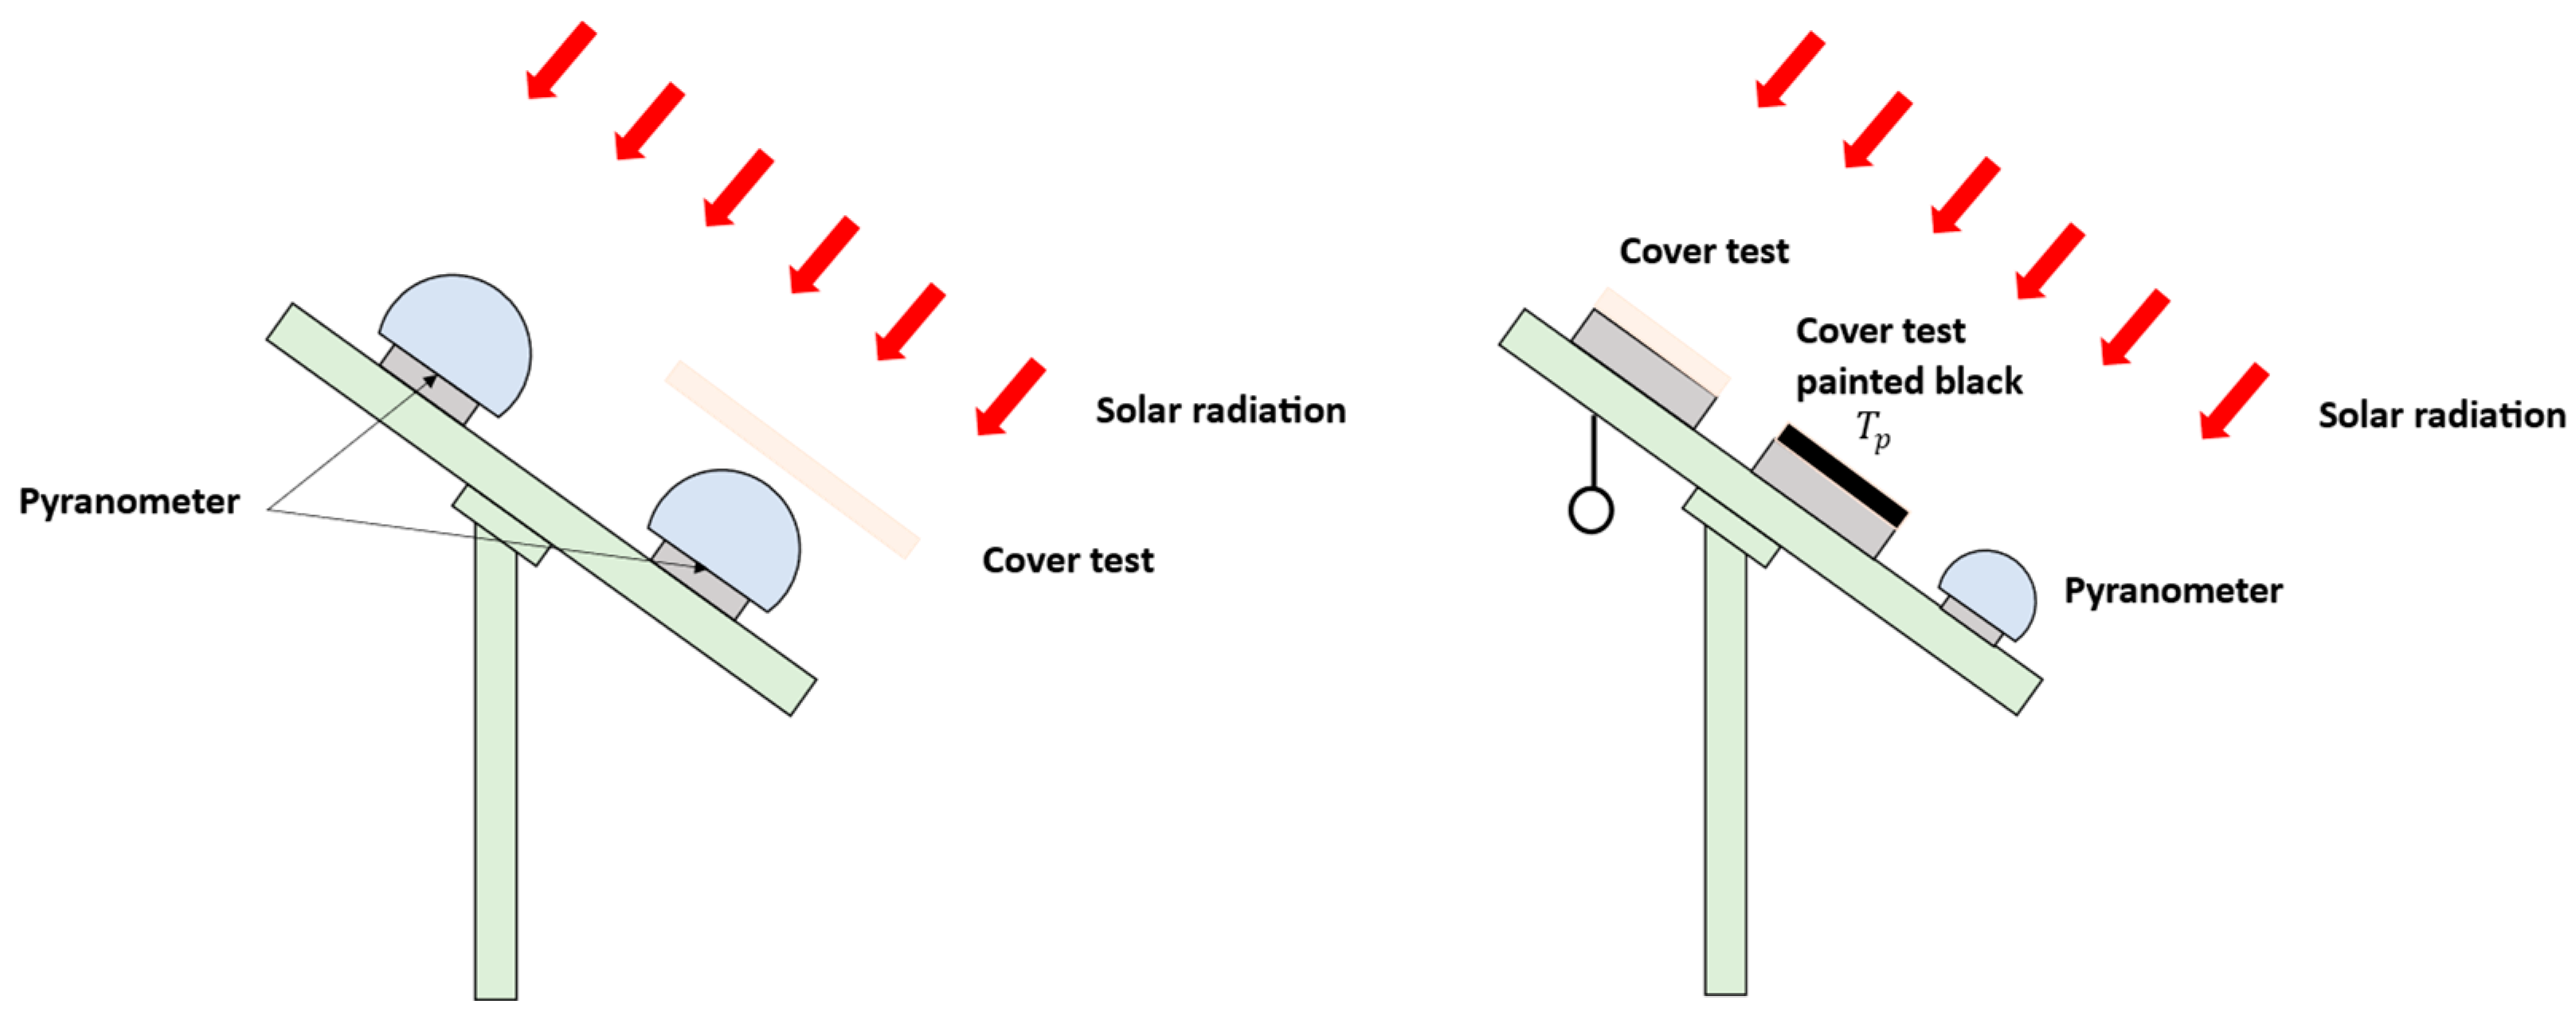
4.1. Reduction of Solar Radiation
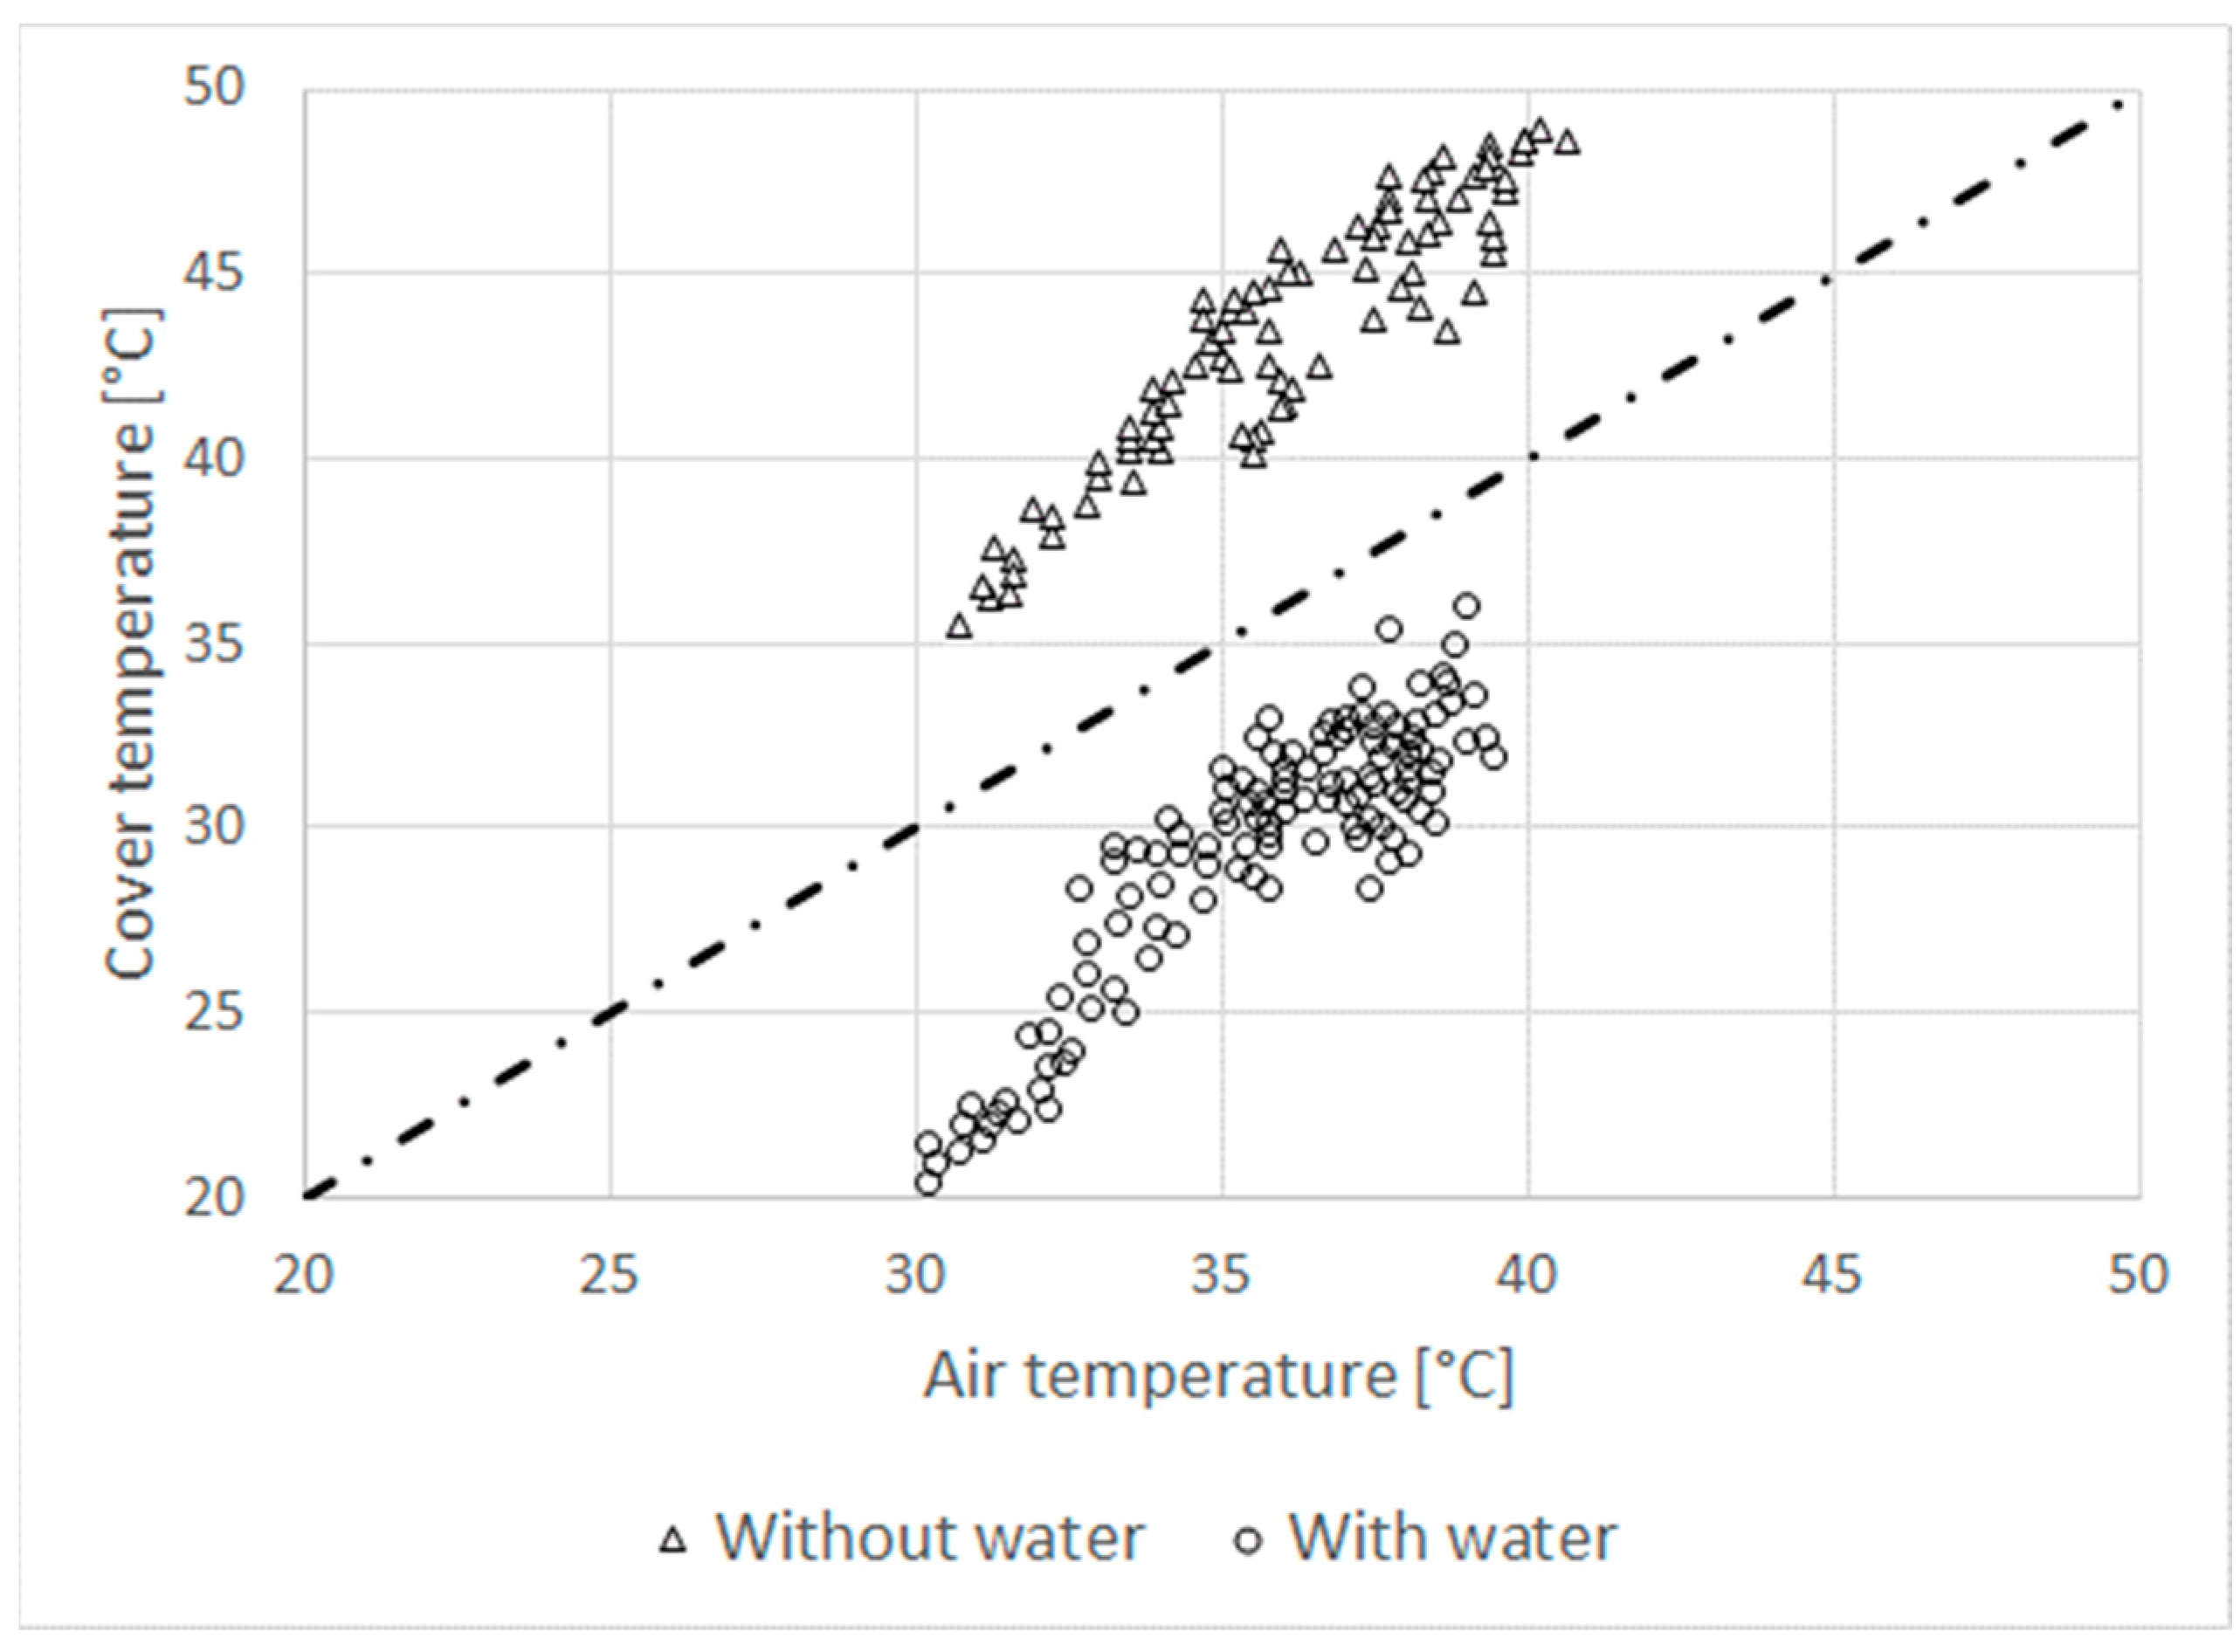
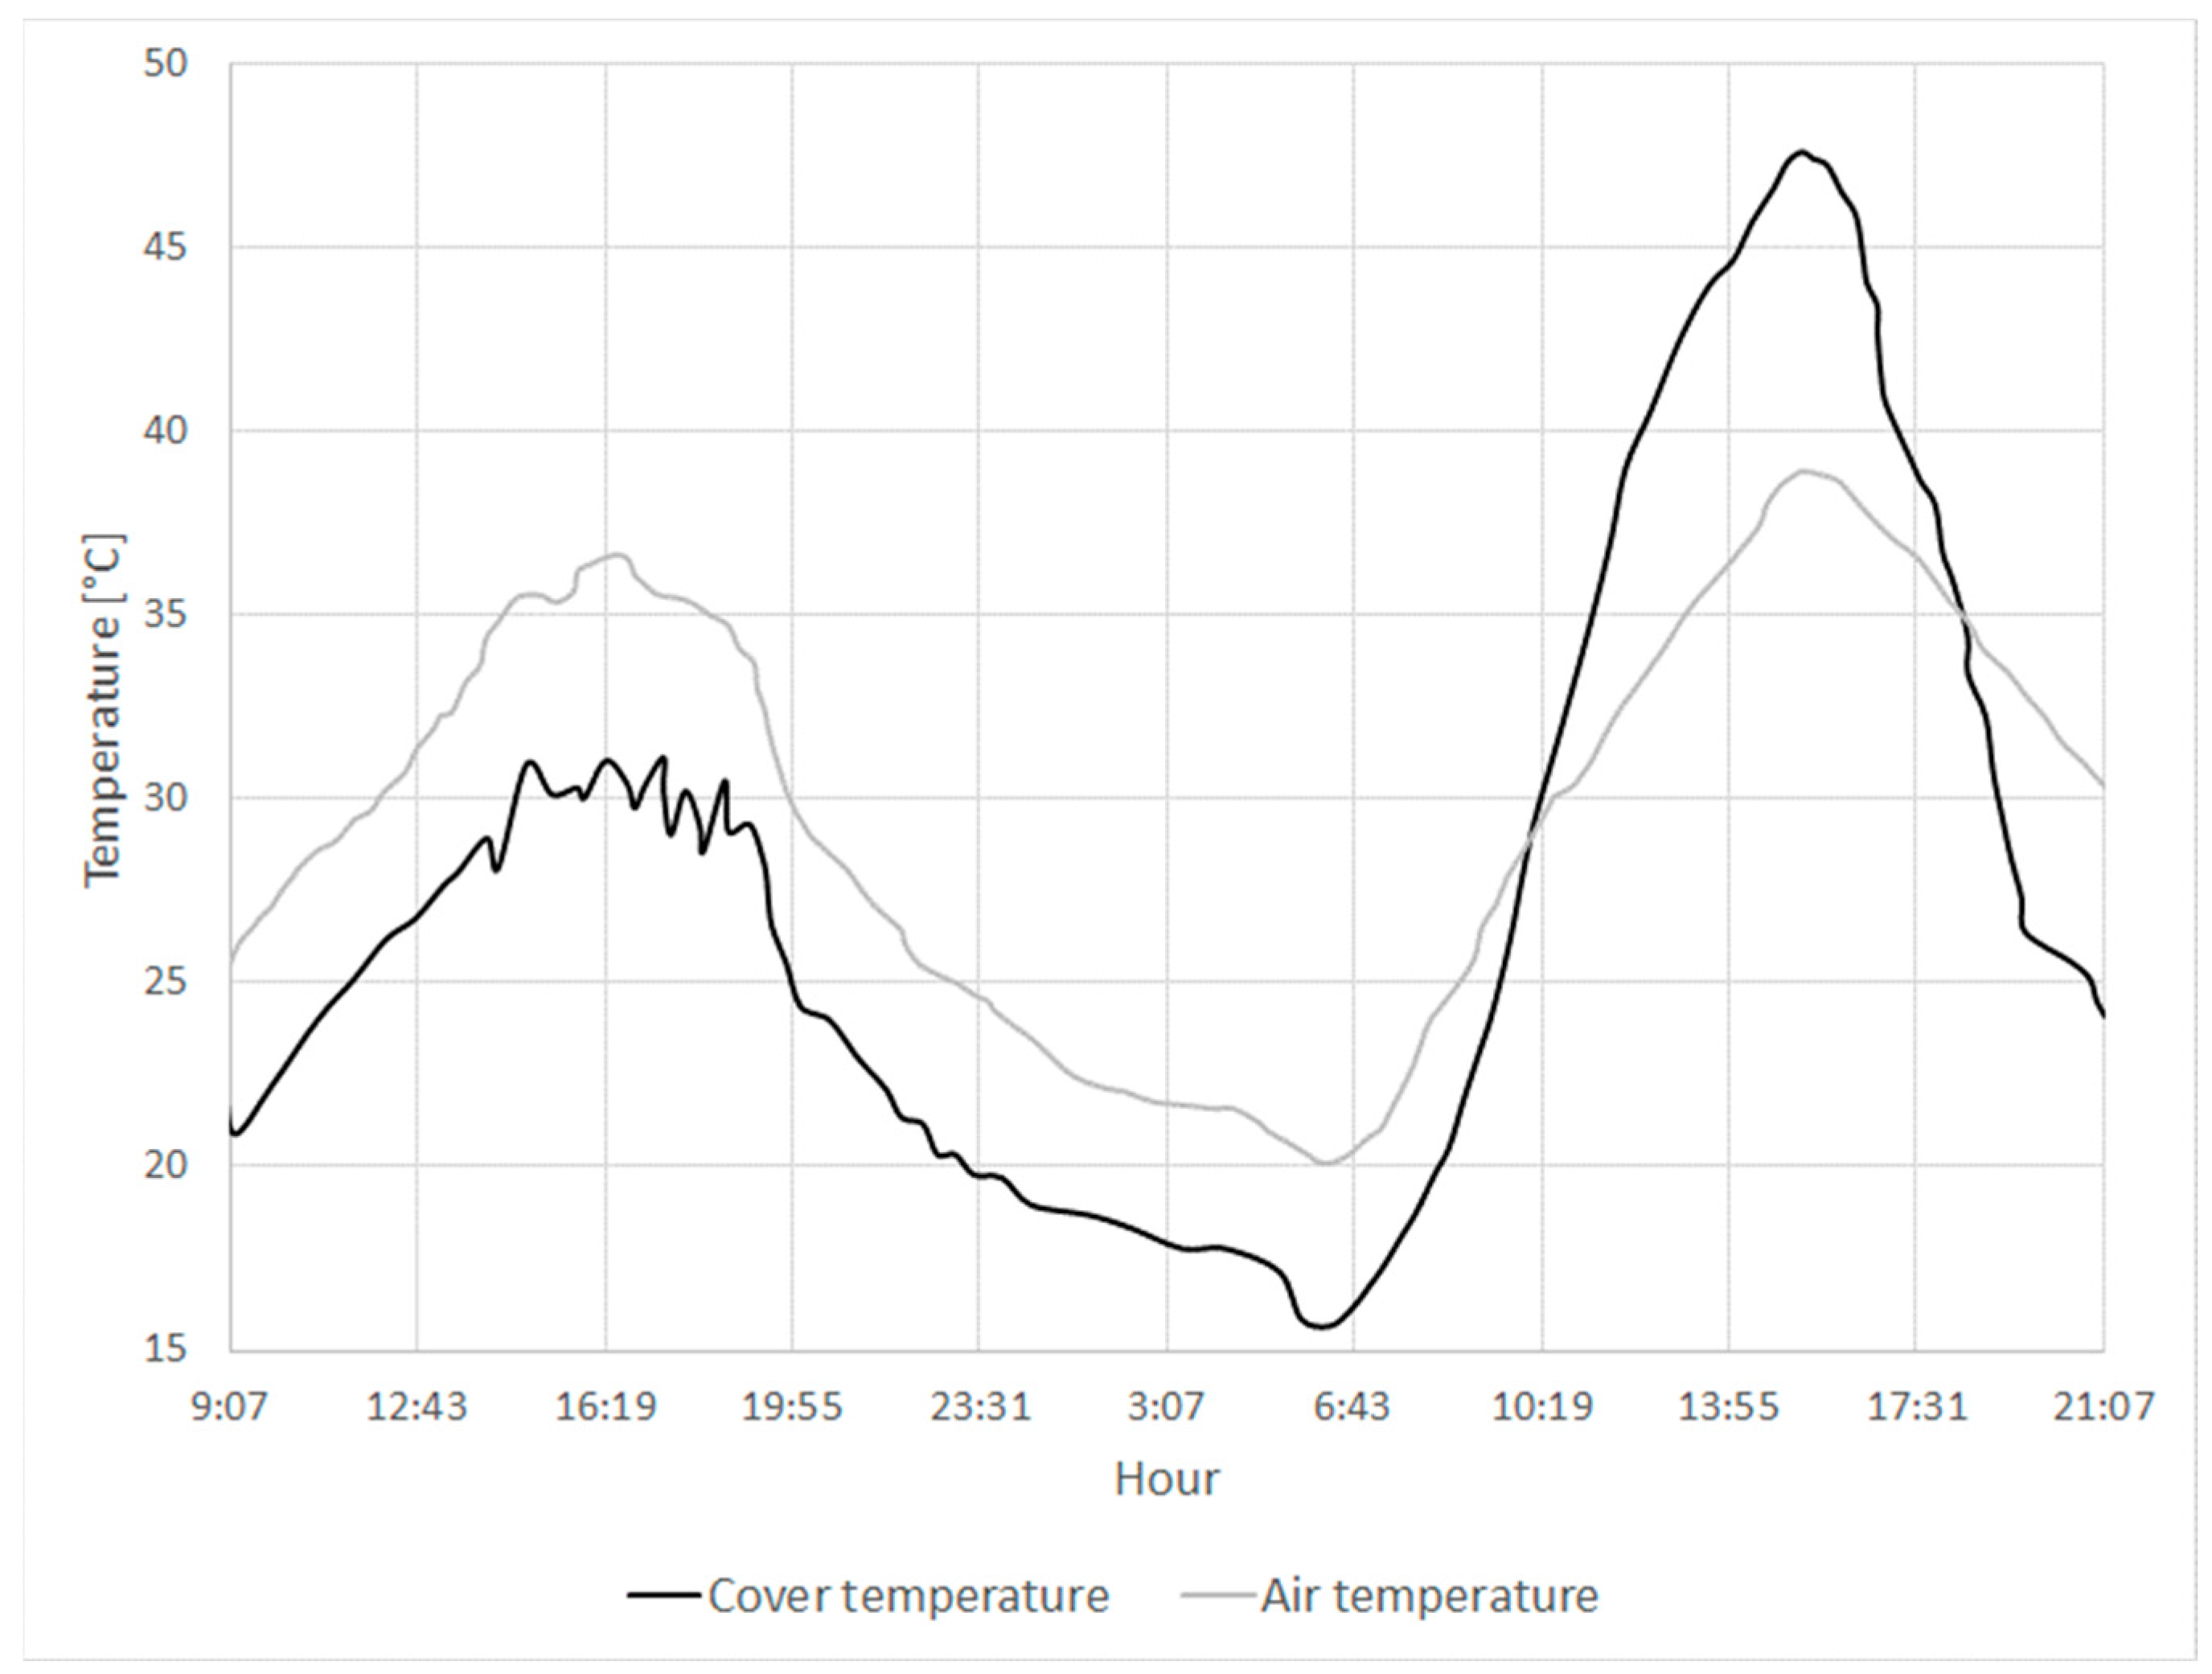
4.2. Sprinkling Water on the Cover
4.3. Cool Air Production
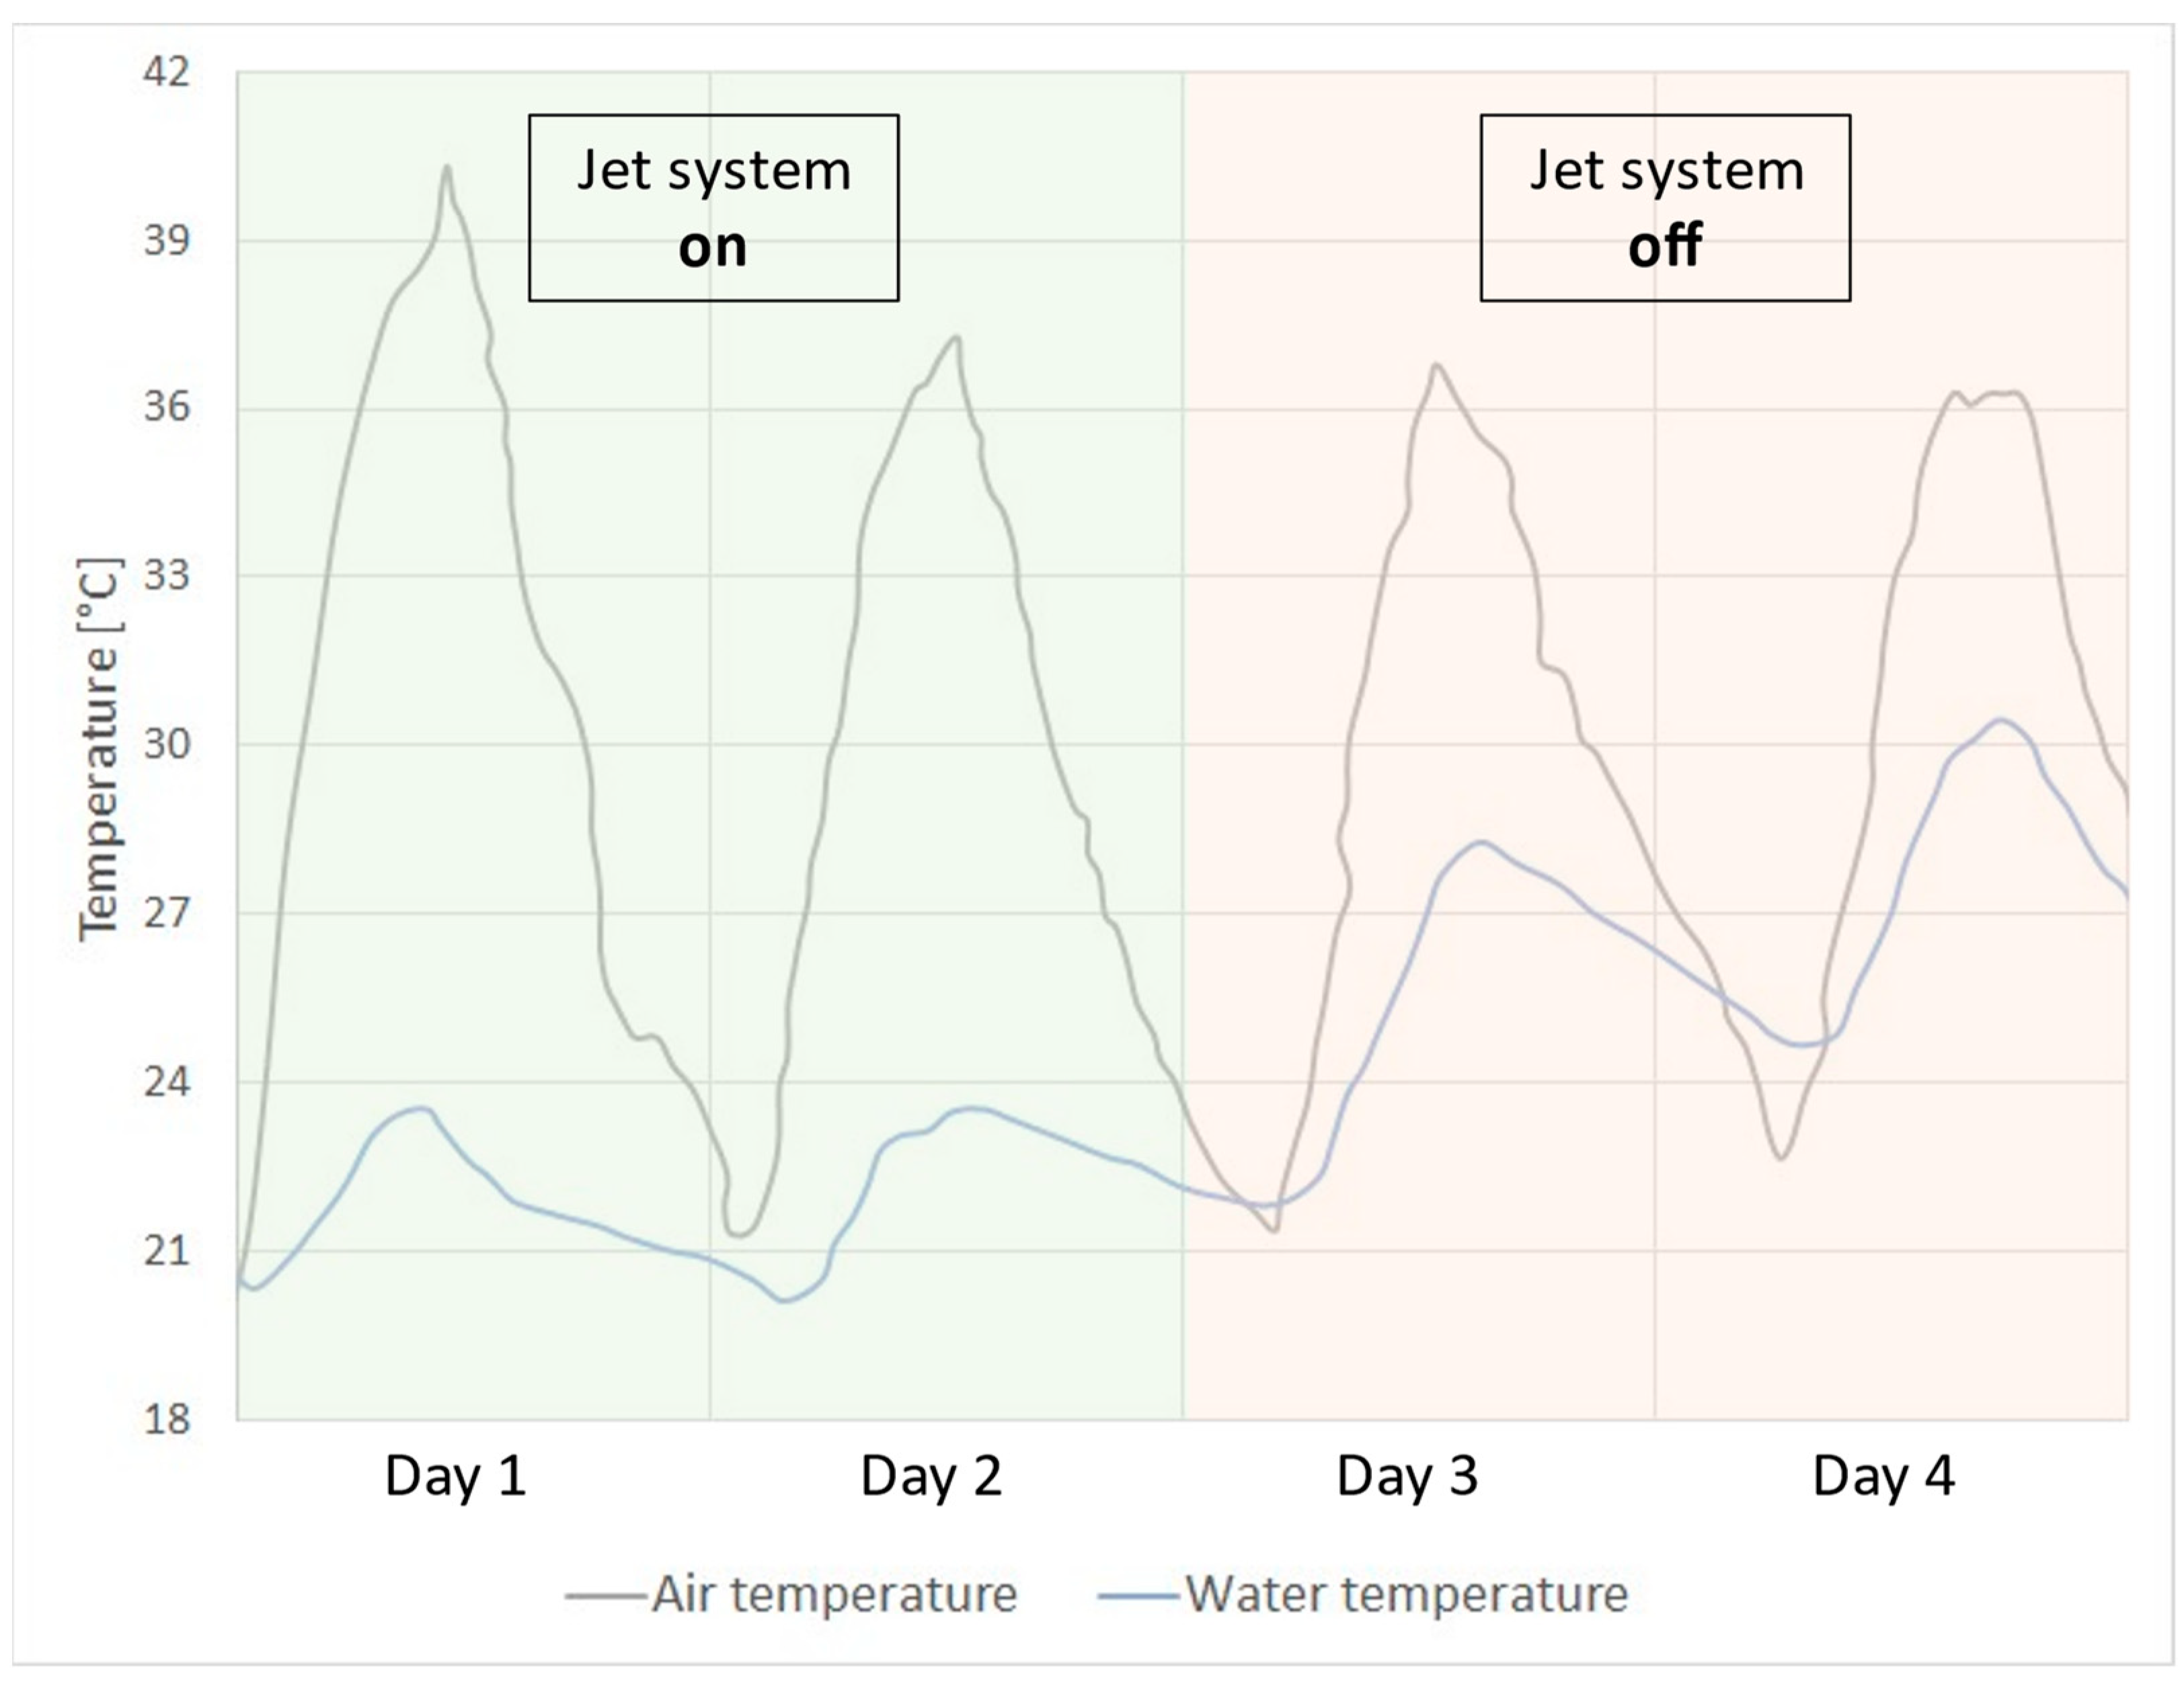
4.4. Cold Air Production by Water Pond
- Whether there are jets or not;
- Number and type of jets (unit flow and mean drop size);
- Operating scheme of the jets;
- Depth of pond.
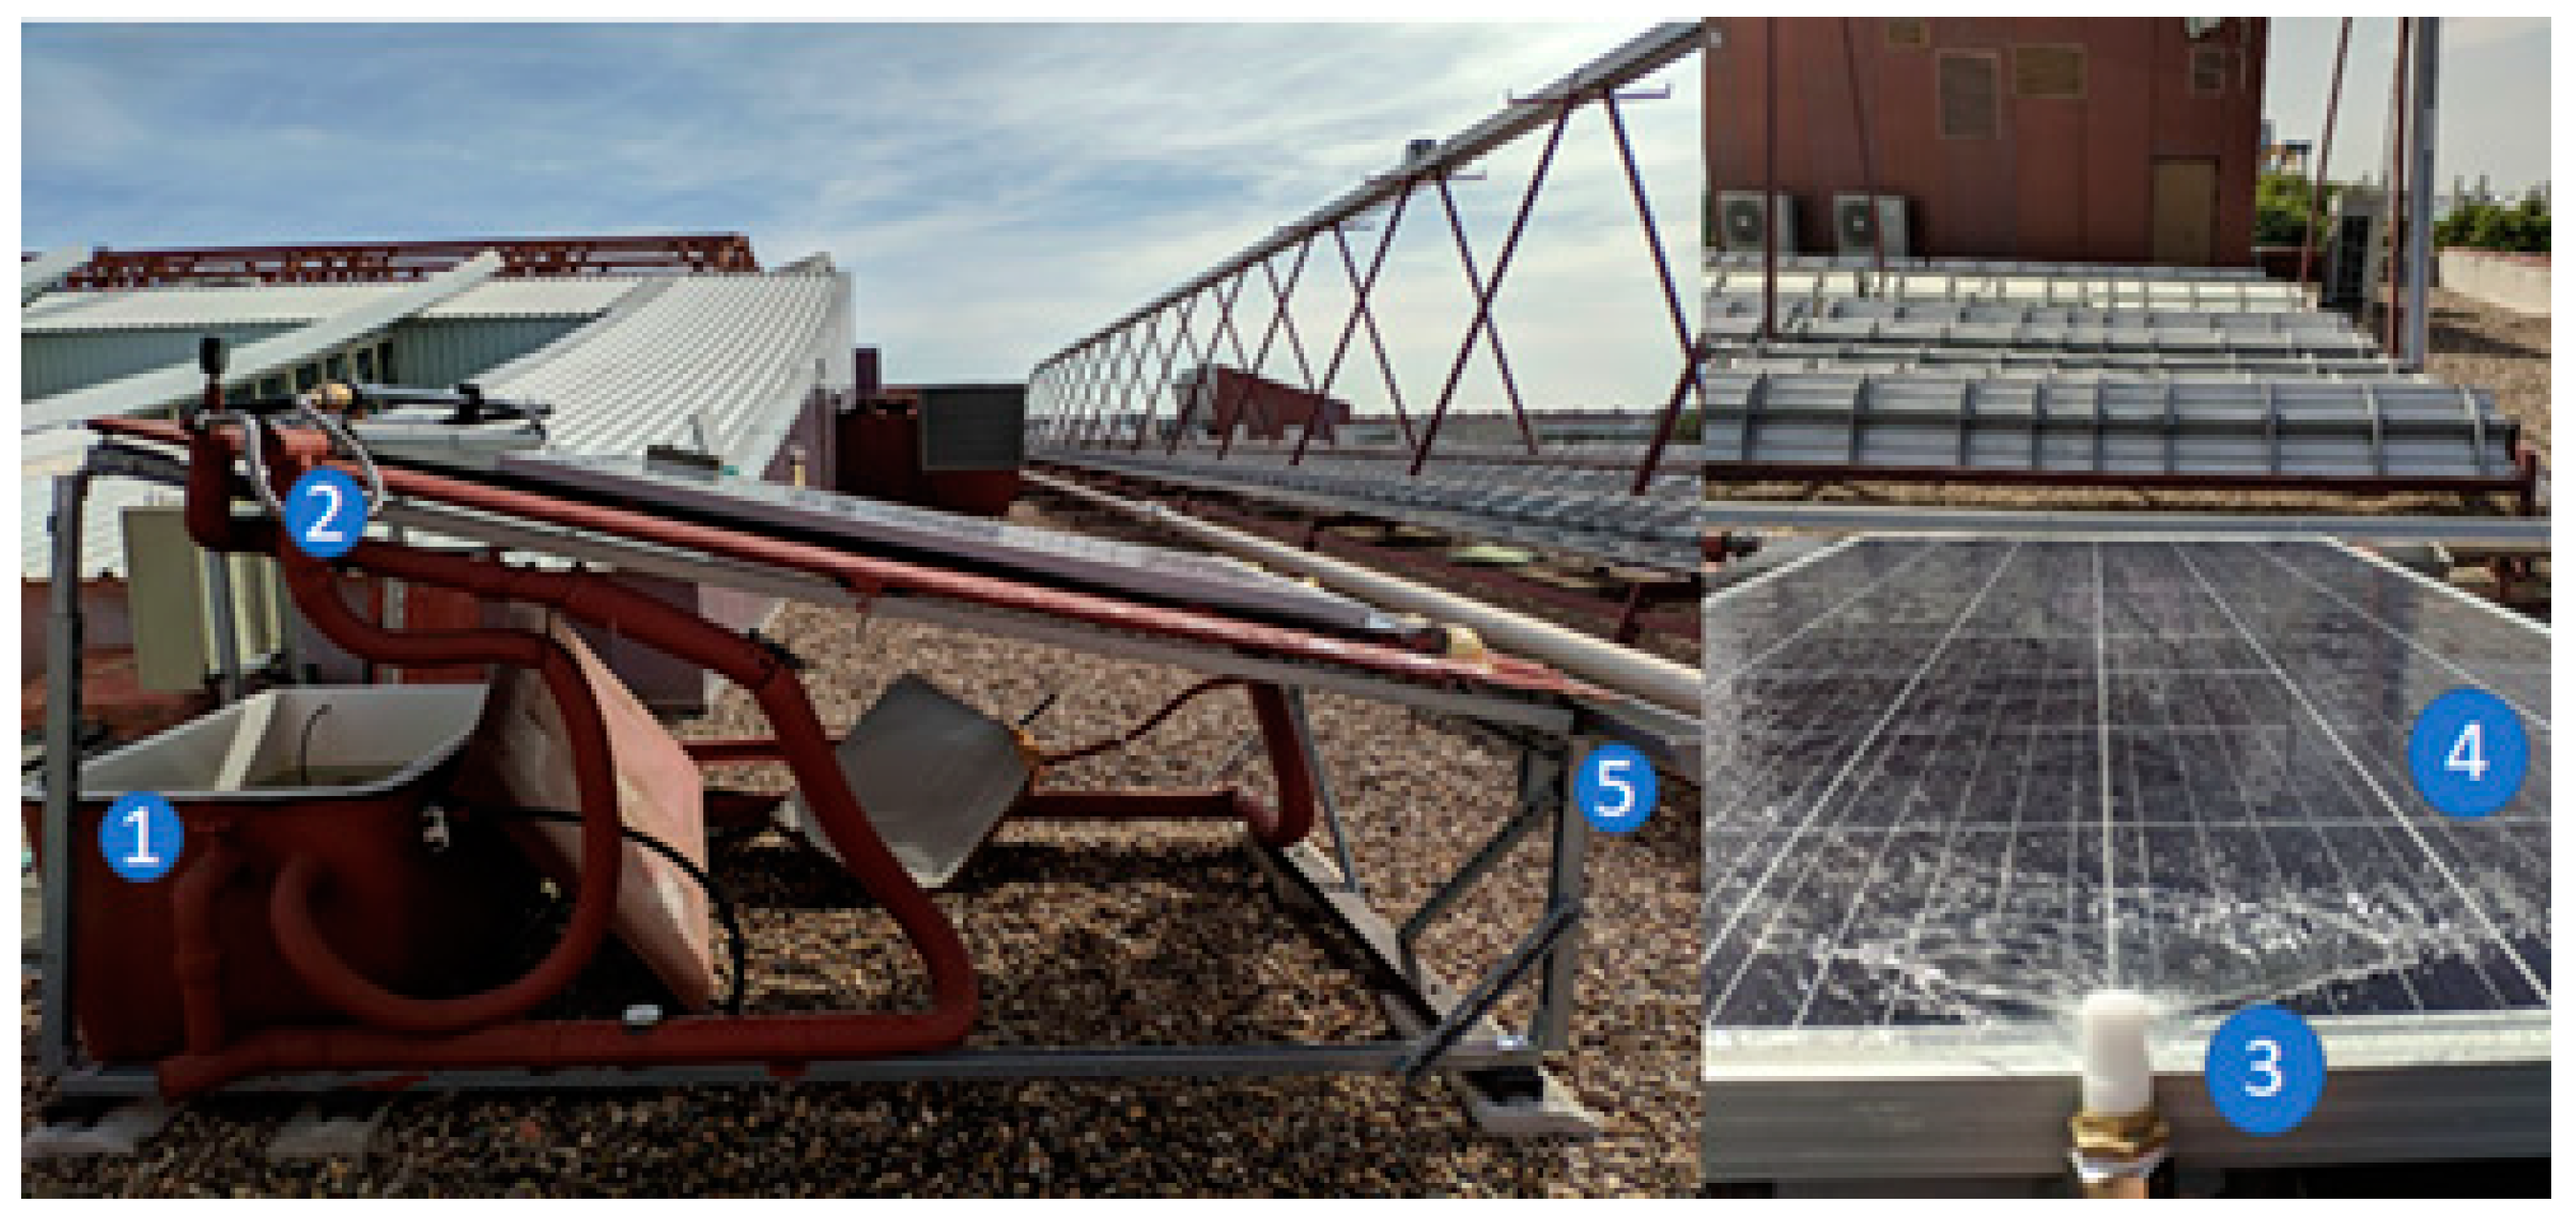
4.5. Cold Air Production by Falling Film System
- Storage tank.
- Pump and pipes.
- Jet nozzle allows to generate a homogeneous water film.
- Photovoltaic water downflow panel for nocturnal radiative cooling (low reflectance and transmittance in the atmospheric window, which is equivalent to high emissivity (approximately 0.90)).
- Water collection gutter for returning the water to the storage tank.
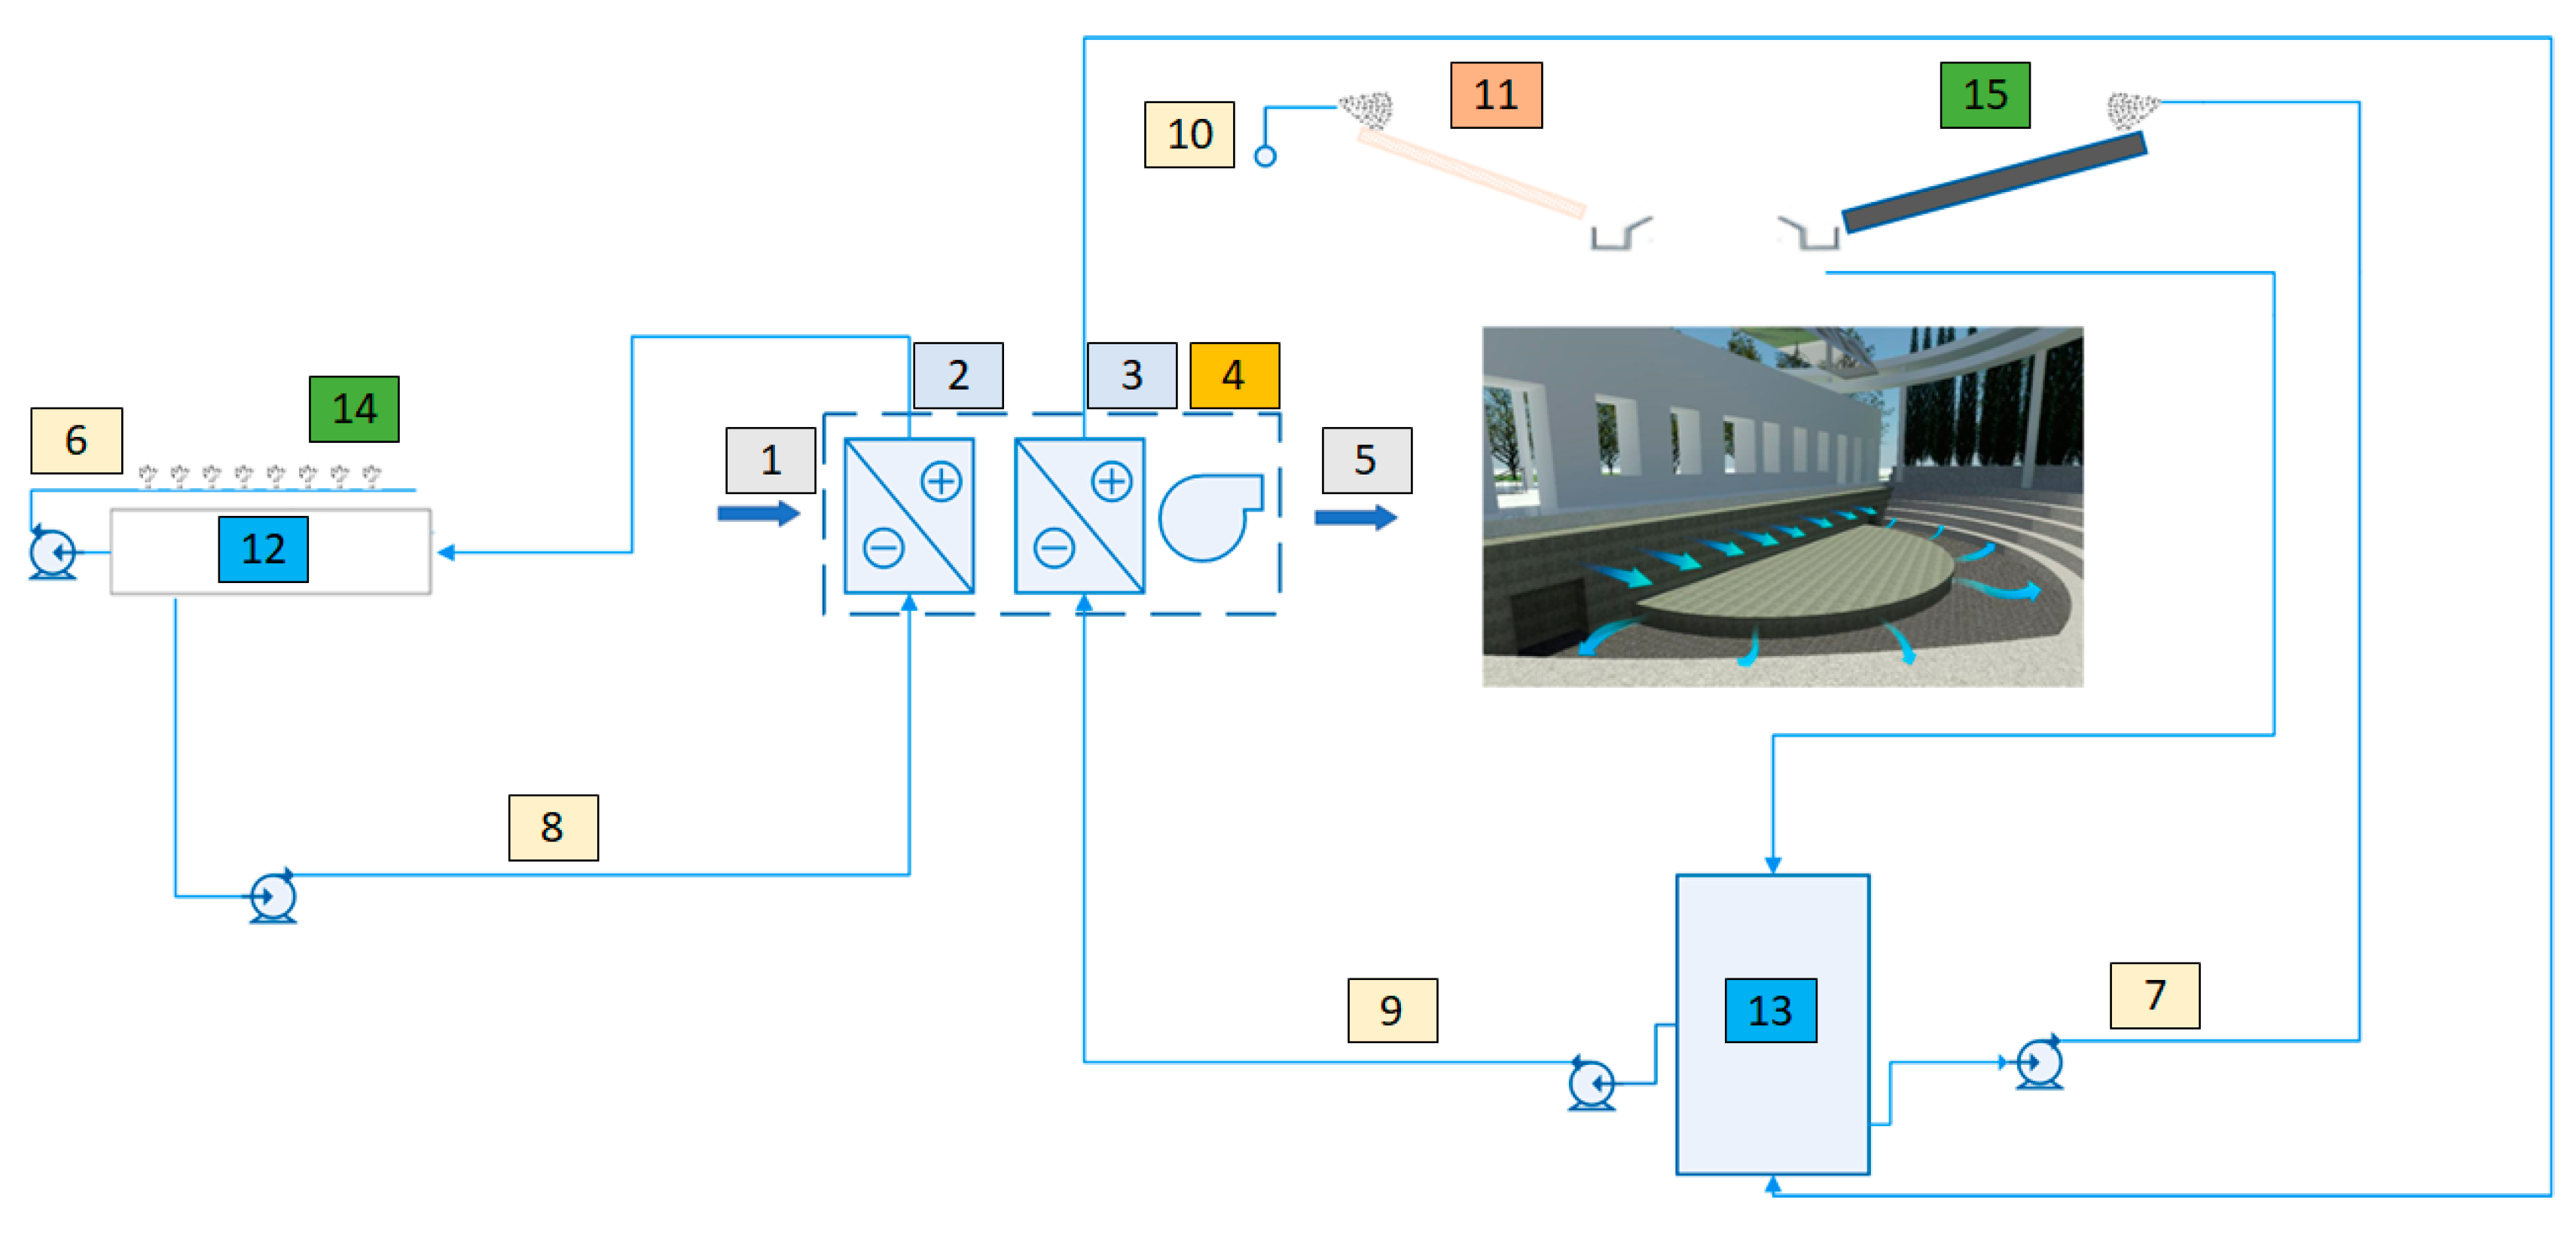
4.6. Integrated Systems and Solutions
- ID 2 and ID 3: The natural cooling coil consists of an exchanger that uses cold water from the storage pond/tank as the dissipation fluid. This coil is modelled on an exchanger-type element (TRNSYS type 91) with an exchange efficiency of 0.8.
- ID 11: The sprinkler system for the cover was implemented in TRNSYS editor according to the experimental results described in Section 4.2.
- ID 12: Storage pond for water cooled by the natural dissipation system (Type 144).
- ID 13: Storage tank for water cooled by the natural dissipation system (Type 39).
- ID 14: The evaporative dissipation system using jets on the pond was implemented using TRNSYS editor and integrated into type 144.
- ID 15: Nocturnal dissipation system with natural falling water film system. The simplified model described in Section 3 was developed using TRNSYS editor.
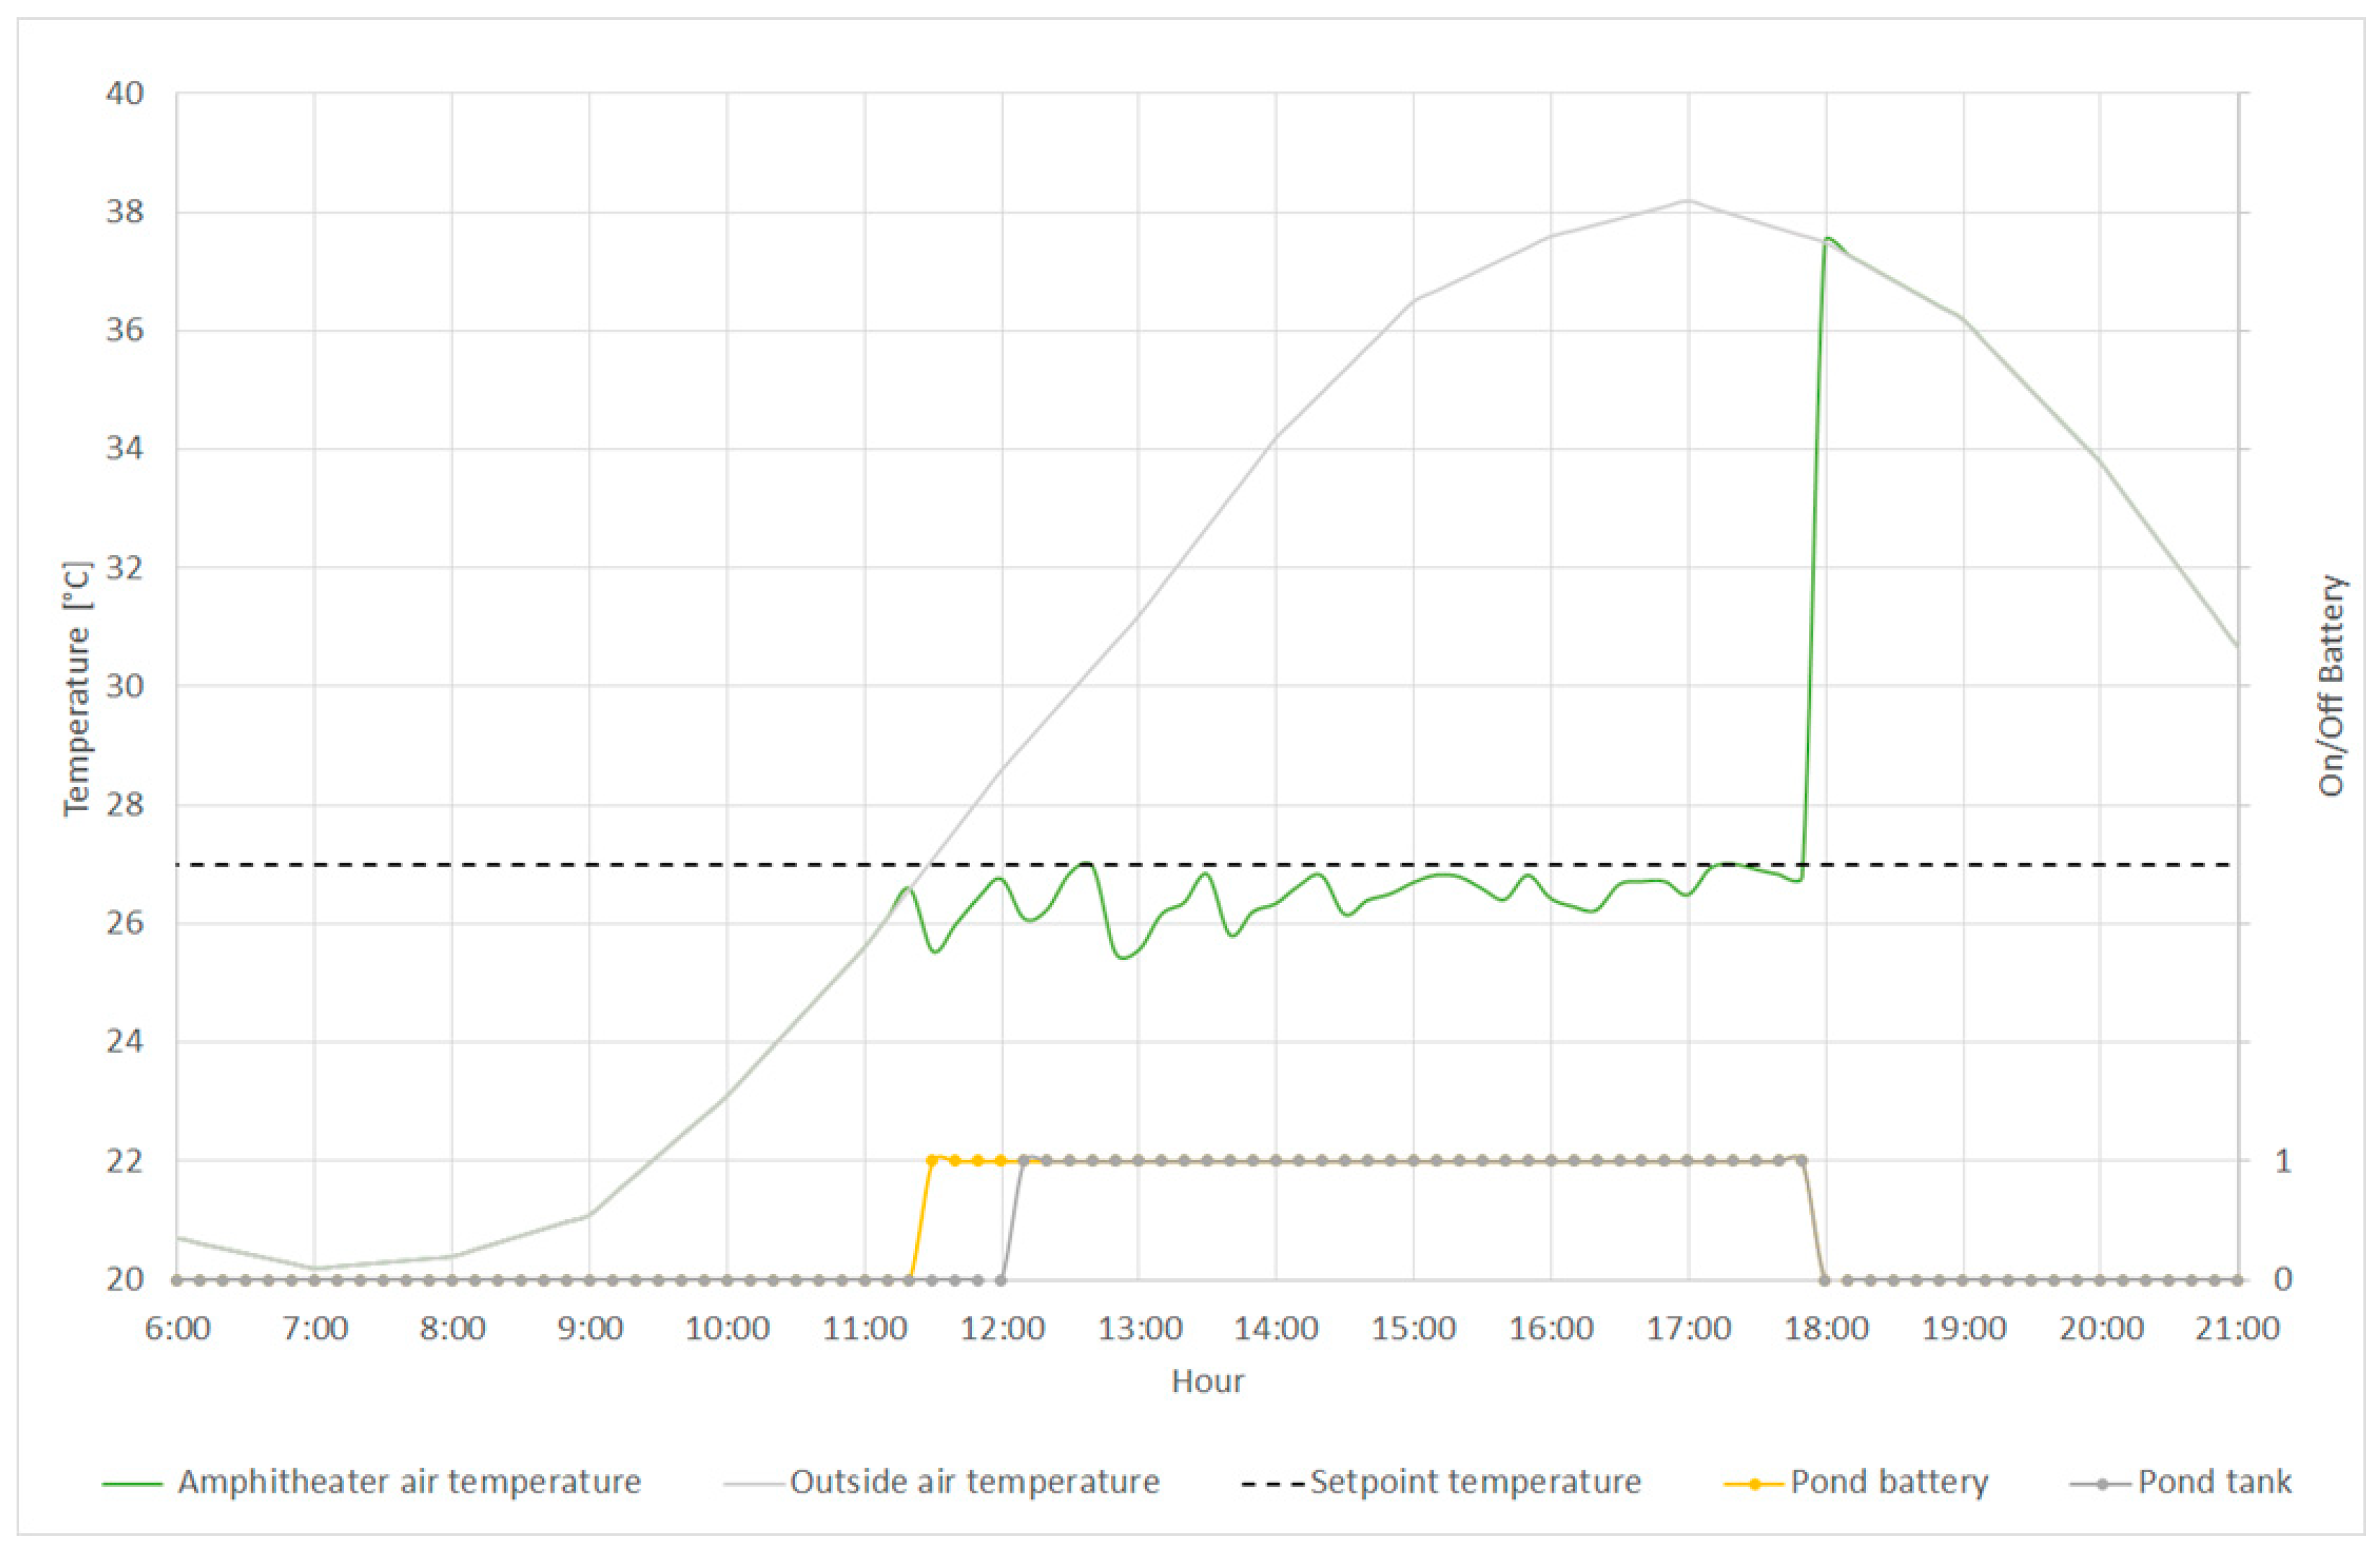
- The setpoint temperature for the amphitheatre is 27 °C during working hours.
- The evaporative cooling system with the pond (ID 14) operates whenever .
- The sprinkler system over the textile cover is used when the surface temperature is higher than 30 °C. This system tries to reduce the surface temperature of the cover to under 30 °C to achieve thermal comfort in the amphitheatre.
5. Discussion
- In view of the orders of magnitude of heat flows, the criteria for outdoor conditioning spaces would take the following order: 1-Reduce the solar radiation striking the subject. 2-Reduce the effect of long-wave radiation received from other hotter surfaces. 3-Reduce gains due to convection.
- Regarding the decrease in solar radiation, from the study involving testing different materials, shapes and colours etc., the conclusion is reached that the most that can be achieved is that the surface temperature is in line with the air temperature (zero overheating).
- The cooling of covers using water can be highly effective, achieving temperature decreases of around 12 °C in the case of light-coloured covers and around 20 °C in the case of mid-range colours when compared with the same covers without water.
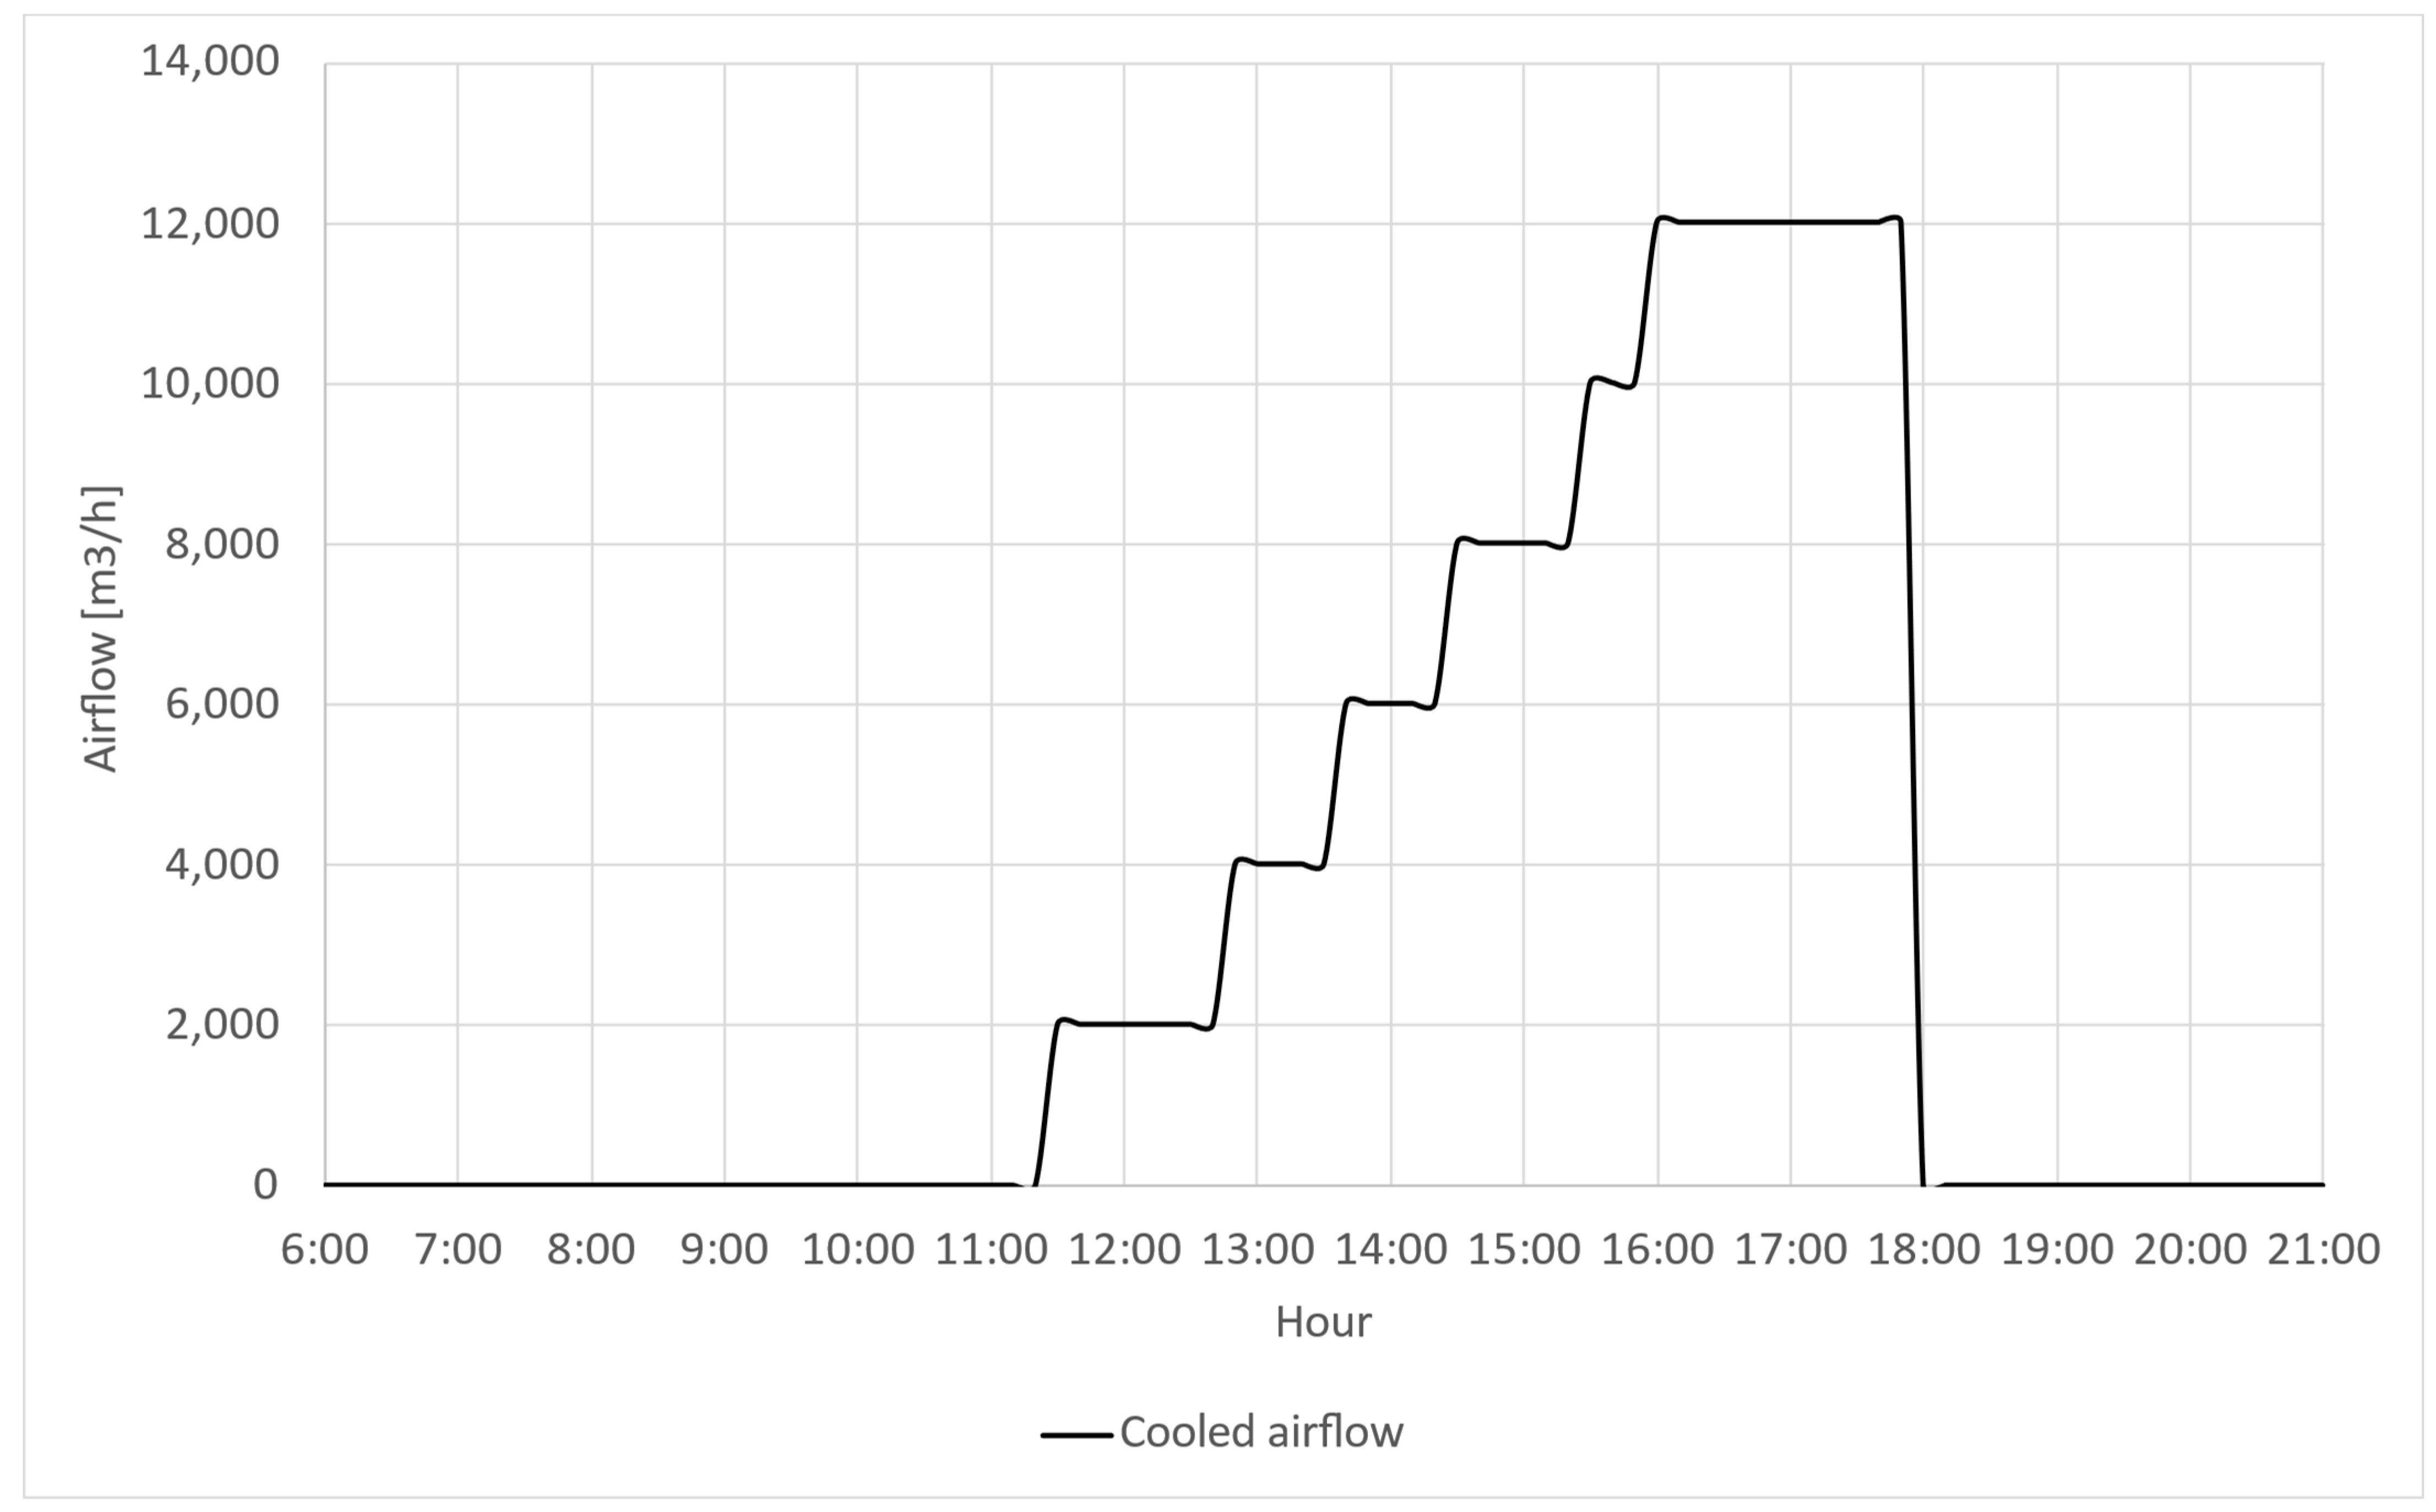
- The amount of fresh air introduced into the amphitheatre depends on the level of enclosure and the outdoor air temperature. The combination of both will determine the air temperature in the space. In the present case study, to maintain an average air temperature of 26 °C, it would be necessary to force an amount of air ranging from 4578 m3/h to 21,102 m3/h depending on the temperature of the forced air (18 to 24 °C).
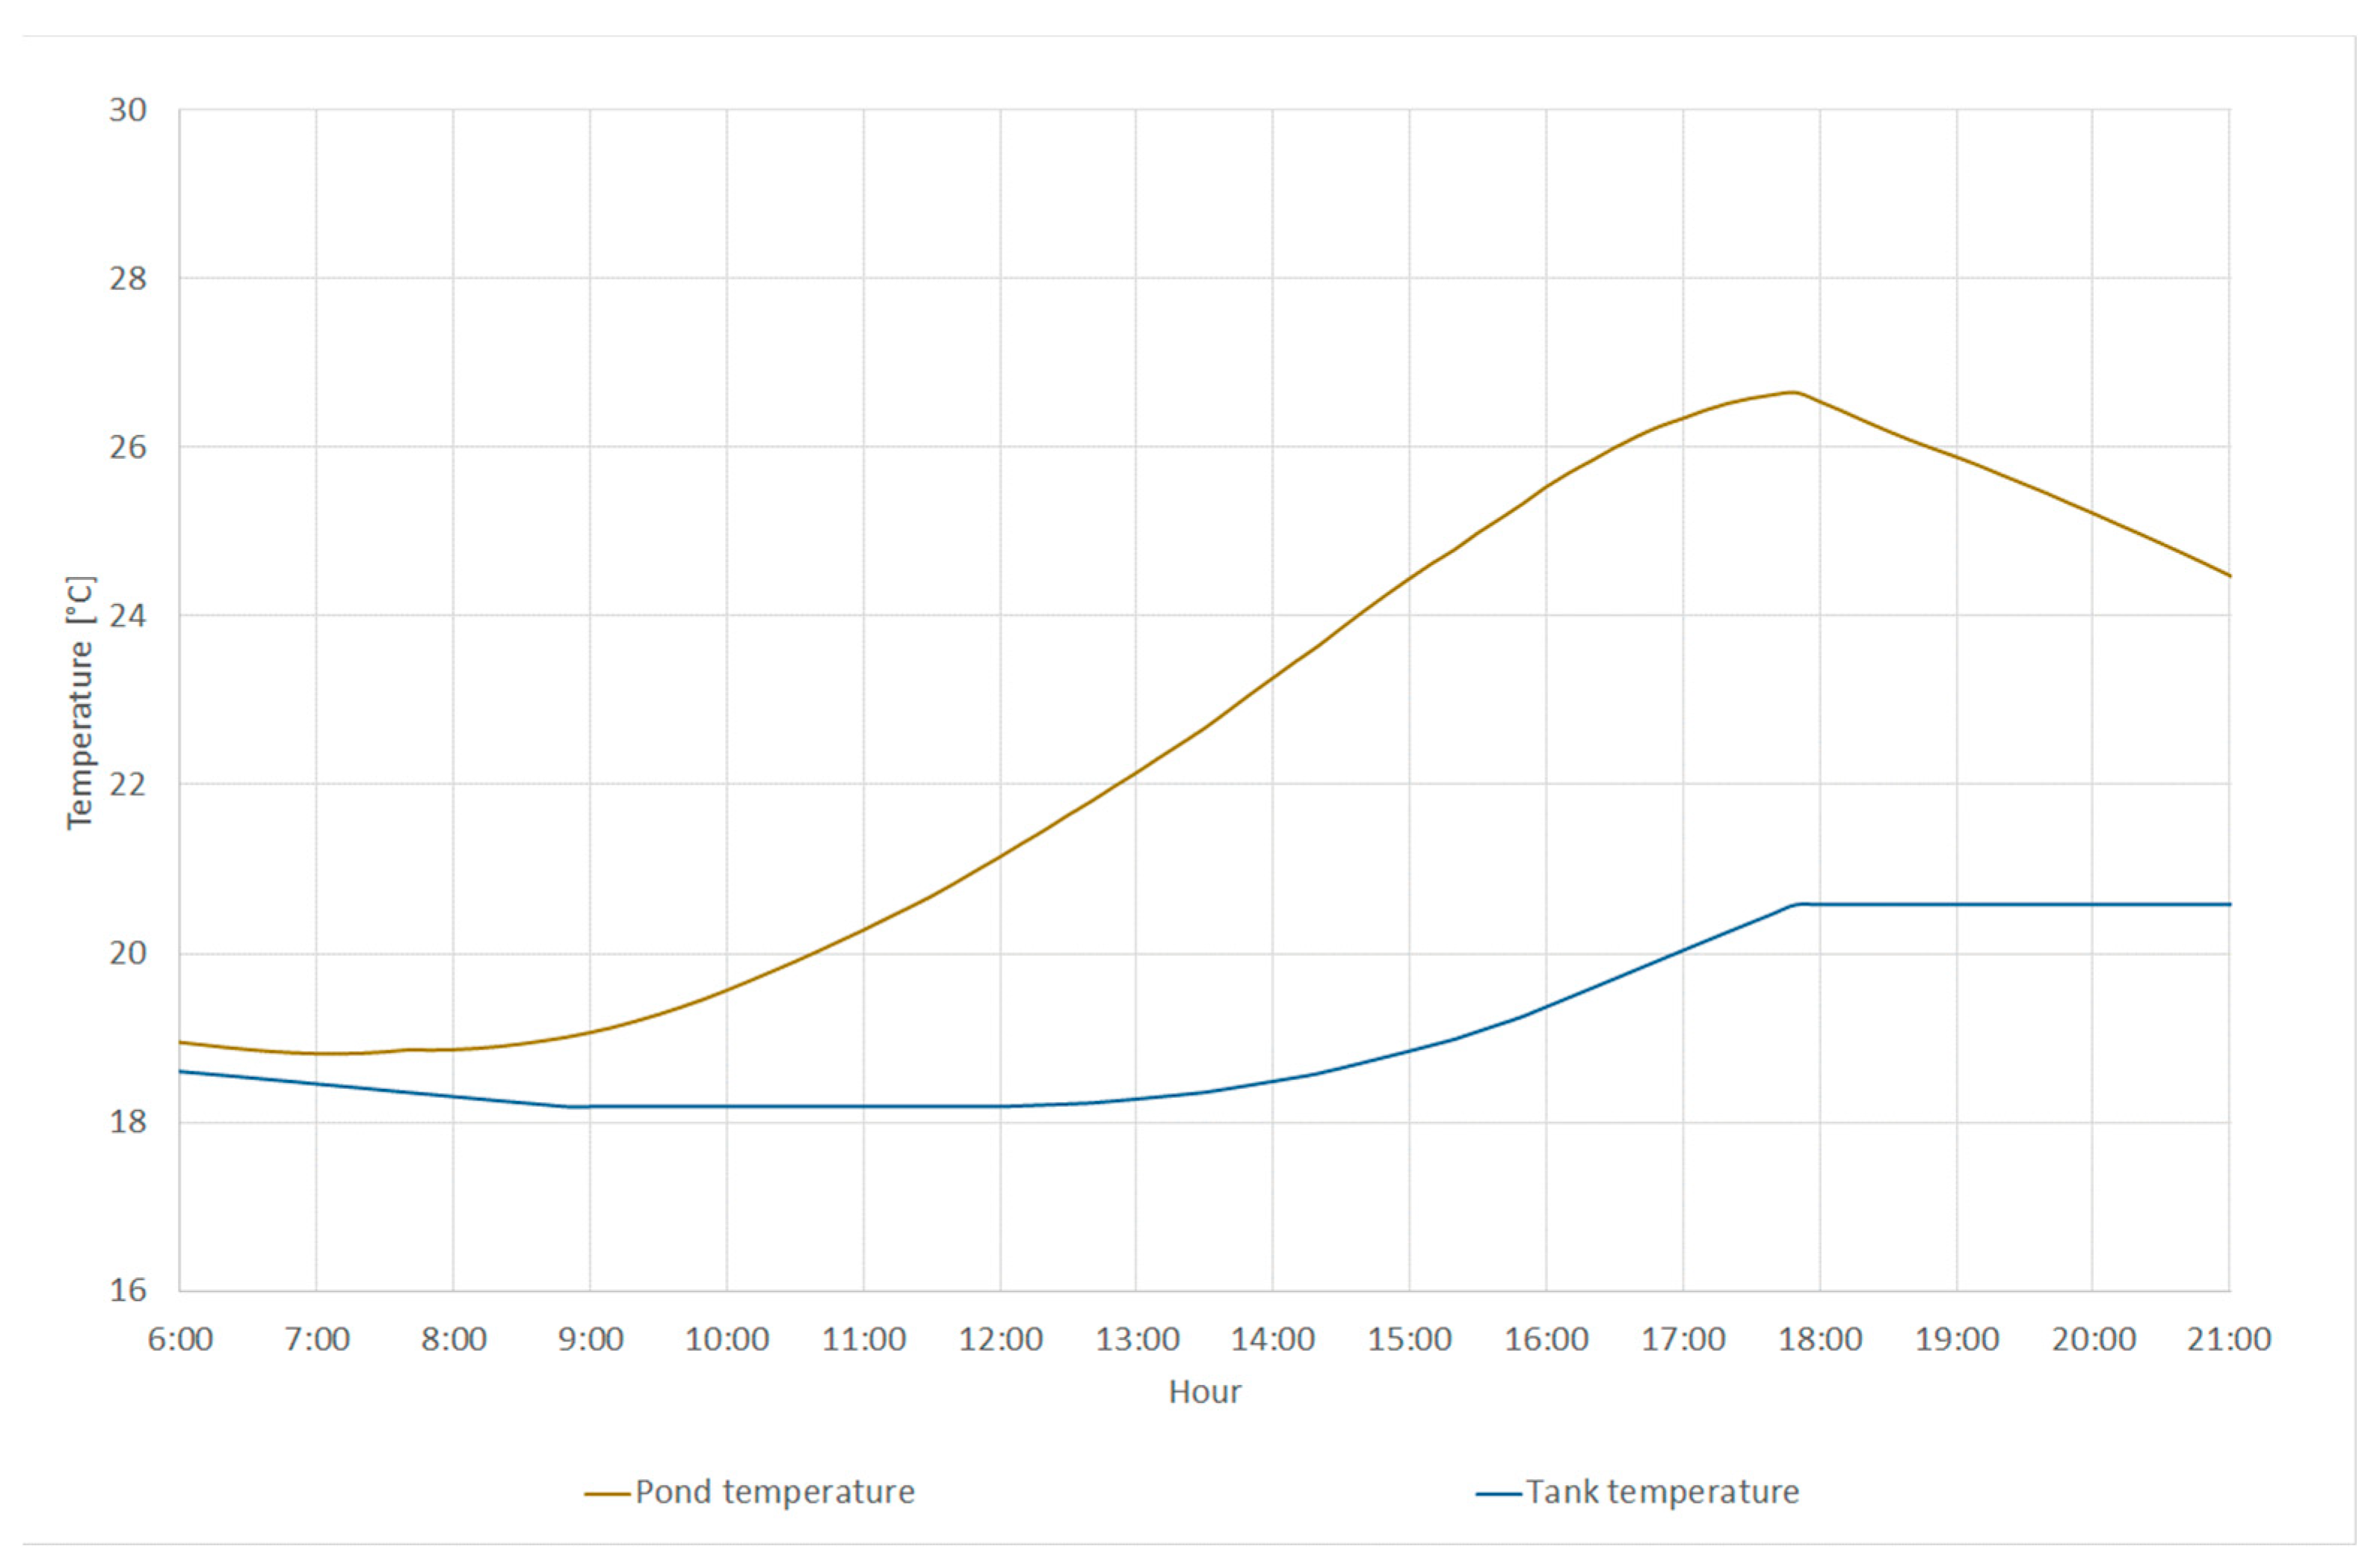
- Cold air is produced in the initial stage by means of the use of a nearby water pond. The pond is a dissipation system, where it is possible to keep water temperature below of air temperature. So, this water is used to cool the air. For that, the water pond employs jets as a natural sink (part of the water is evaporated to decrease the temperature of the rest of the water).
- The characteristics of the space to be treated (geometric dimensions, orientation, degree of confinement).
- The activity of the occupants and foreseen length of stay in the area.
- Effectiveness and cost of the possible techniques to be used.
- Possibility of integration of these techniques into the area without distortion of its aesthetic content.
6. Conclusions
- Thanks to the results obtained from the identification of the variables to control in outdoor spaces, it seems clear that comfort in outdoor spaces should be viewed in a different way to comfort in indoor spaces. It is enough to reduce the level of sweating, which involves acting on the most significant controllable heat gains in some way, trying to reduce them or, if possible, convert them into losses.
- The temperature of the water in the pond must not exceed 20.7 °C, forcing air into the amphitheatre at 24 °C, corresponding to a flow of 21,000 . On the basis of this requirement, the study demonstrated the need for a second heat sink, which was finally defined based on the optimised functioning of the whole installation.
- This study developed the PV falling-film system and validated its cooling capacity. The system cools the second body of water.
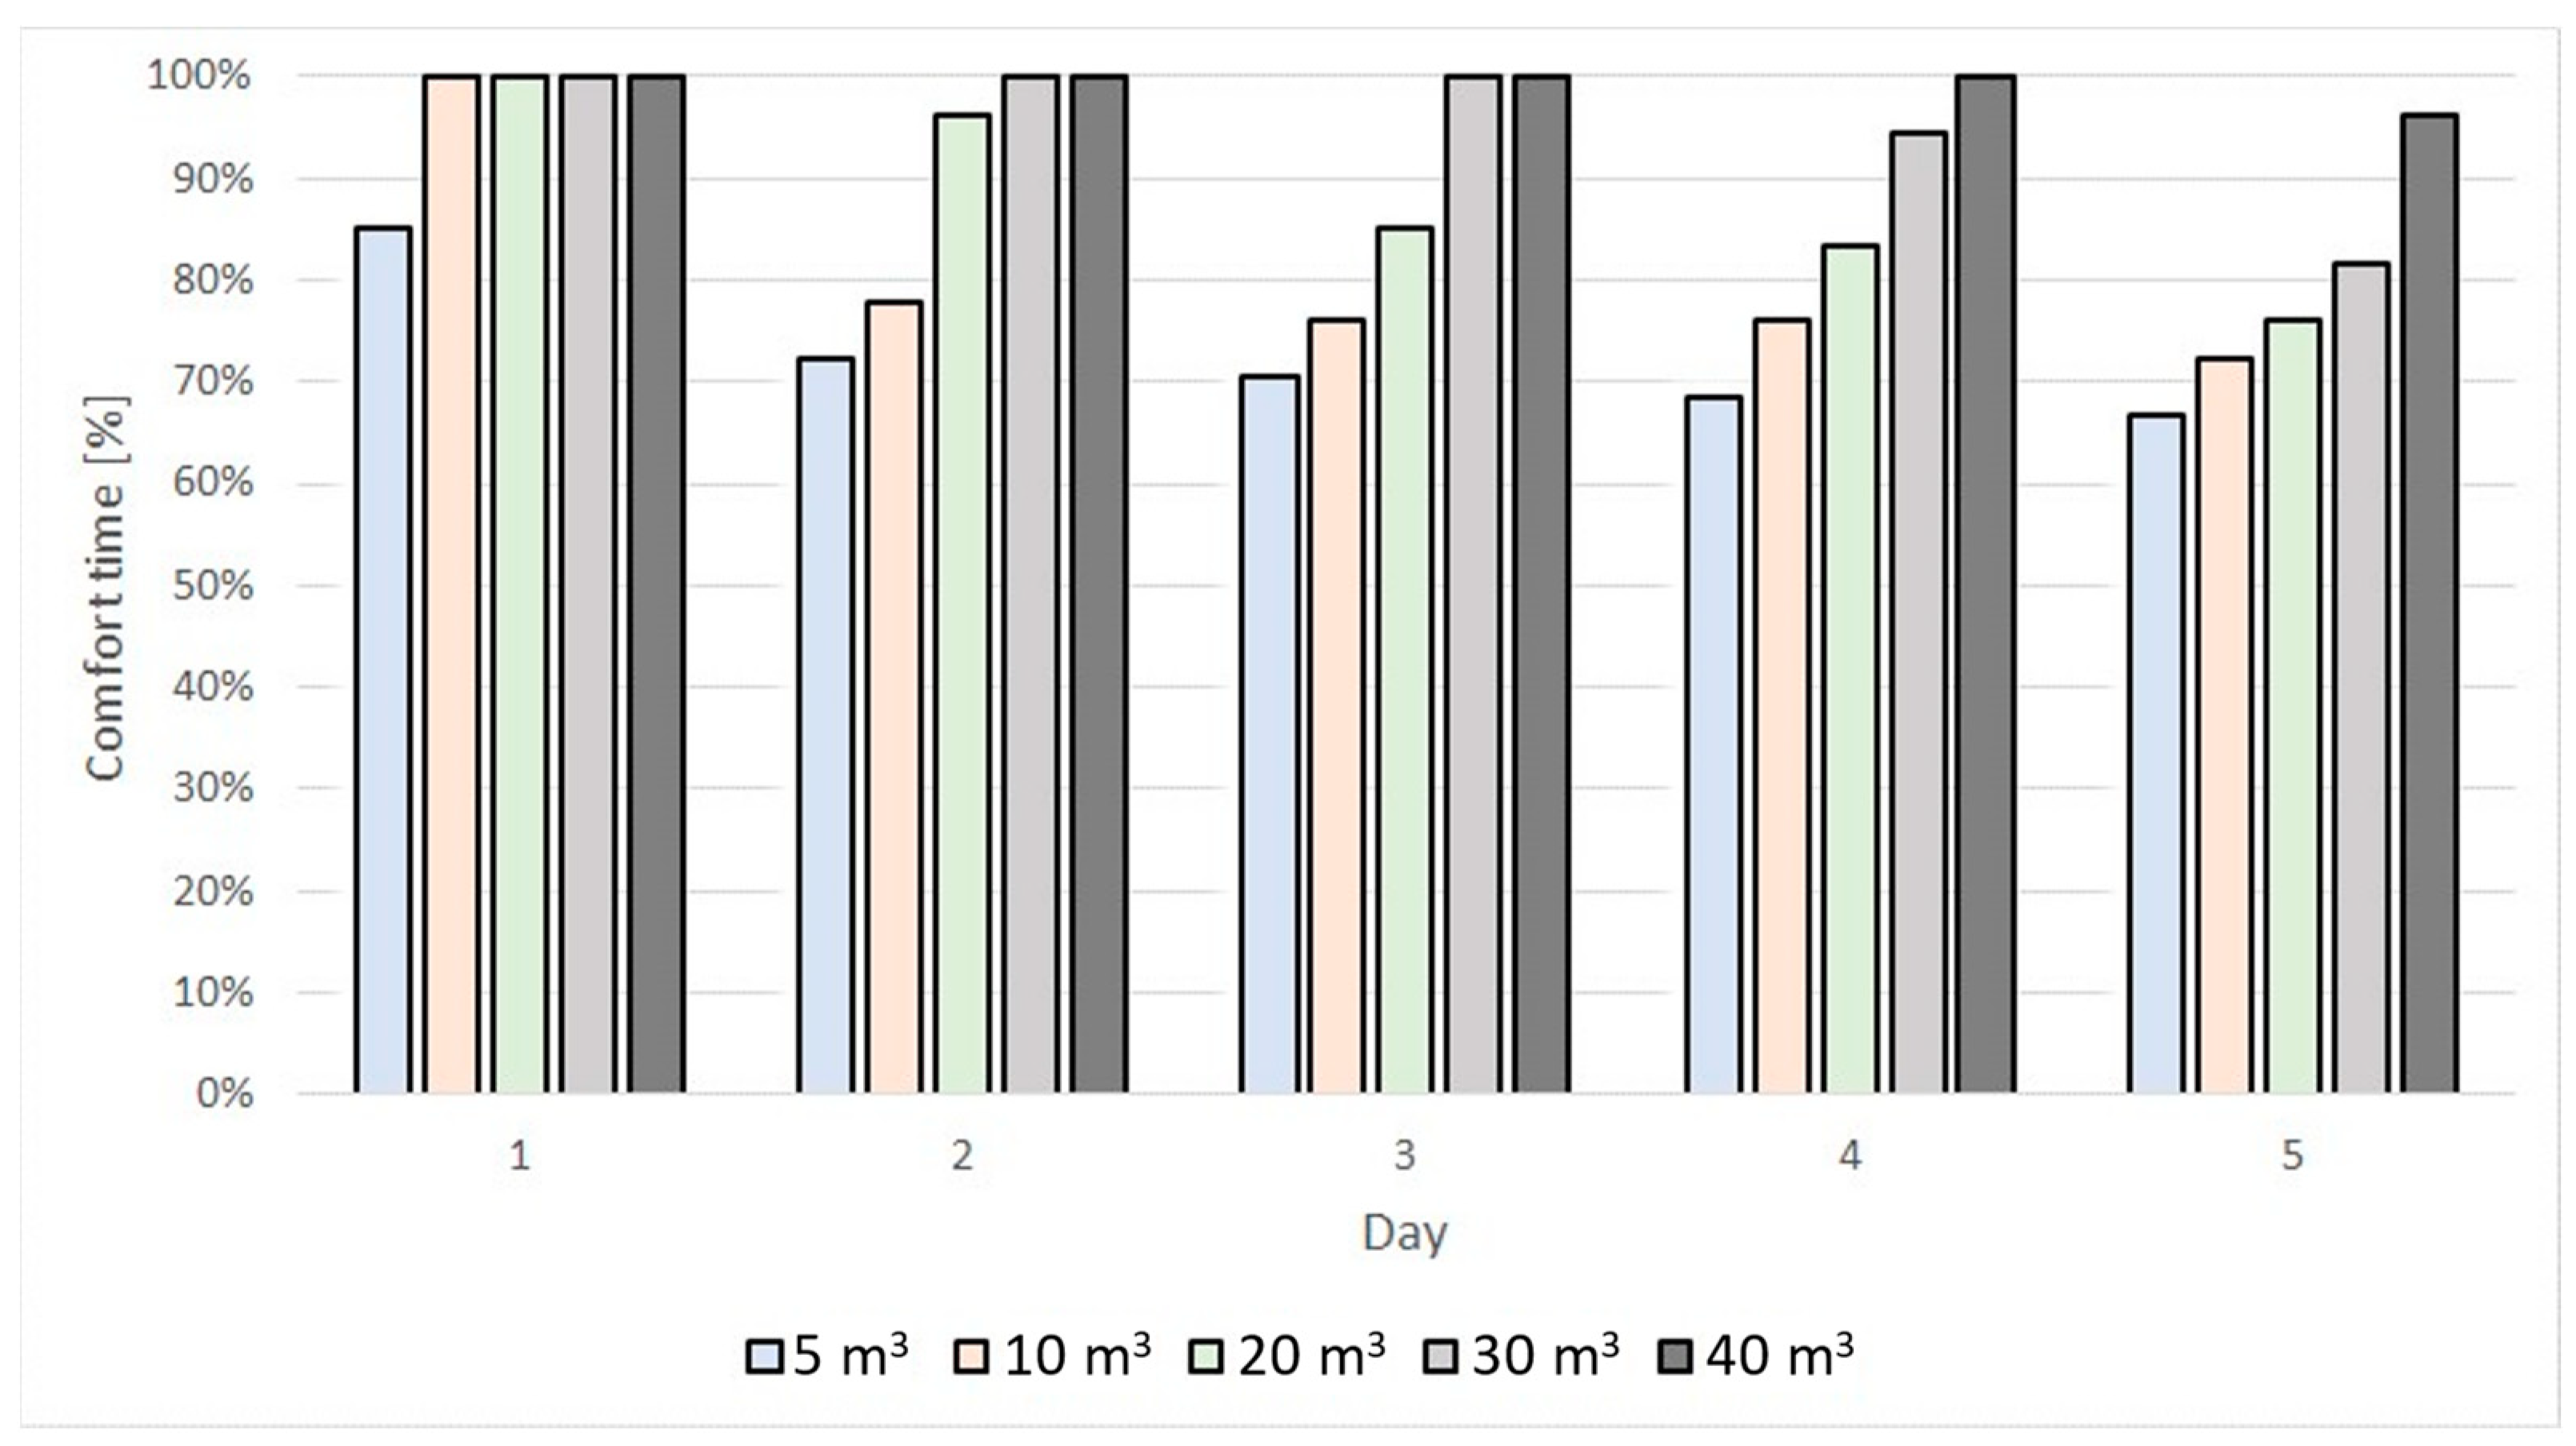
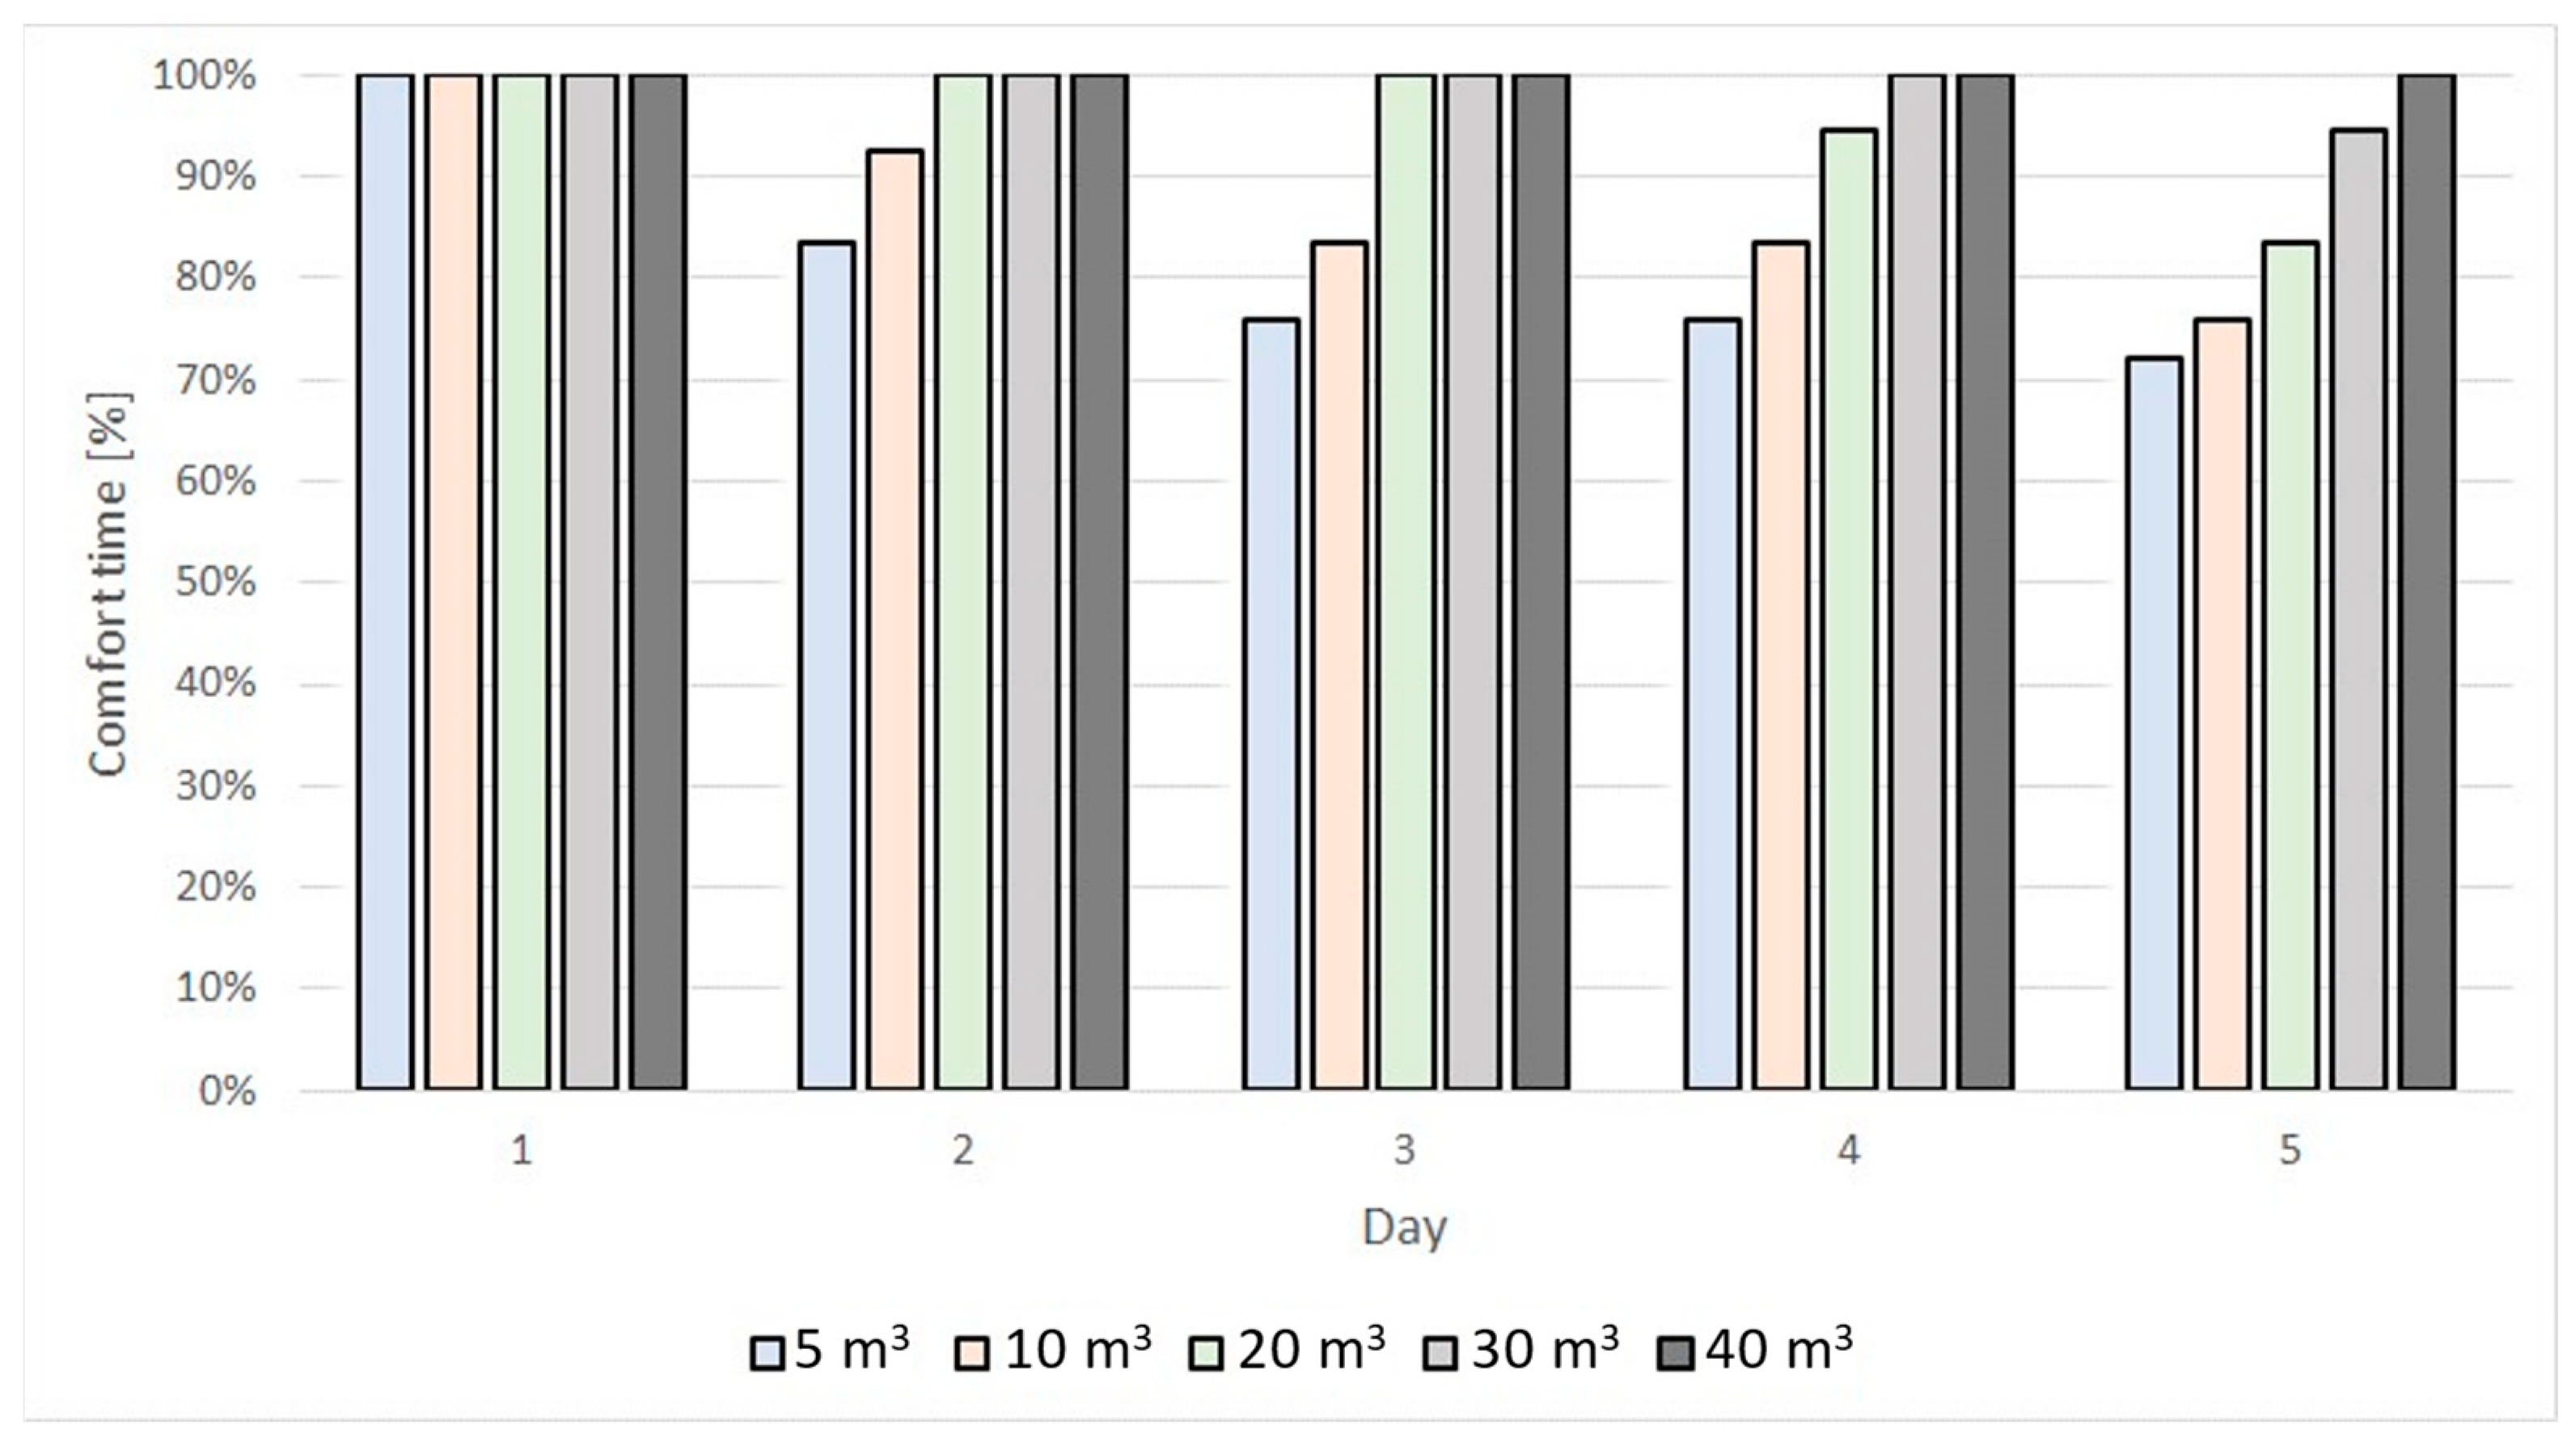
- The simulation of the whole system in TRNSYS, based on the capacity of the water tank to be optimised, shows that, with a minimum volume of water of 80 m3, the amphitheatre is completely conditioned under the critical conditions of the study; furthermore, the implementation of a smart control system that adapts the air flow forced into the amphitheatre according to the actual conditions makes the conditioning more efficient, keeping the comfort conditions stable and allowing for a water tank with a smaller volume to be installed.
Author Contributions
Funding
Institutional Review Board Statement
Informed Consent Statement
Data Availability Statement
Acknowledgments
Conflicts of Interest
Abbreviations
| Variable/Acronym/Abbreviation | Description |
| EXPO-92 | Universal Exposition of 1992 in Seville |
| PVC | Polyvinyl chloride |
| UHI | Urban Heat Island |
| ITS | The intensity of Thermal Stress |
| CFD | Computational Fluid Dynamic |
| ACH | Air Change per Hour |
| PV | Photovoltaic Systems |
| TRNSYS | Transient System Simulation Tool |
| TMY | Typical Meteorological Year |
References
- United Nations. New Urban Agenda; United Nations: New York, NY, USA, 2019; ISBN 9789211327311. [Google Scholar]
- Hartig, T.; Mitchell, R.; de Vries, S.; Frumkin, H. Nature and Health. Annu. Rev. Public Health 2014, 35, 207–228. [Google Scholar] [CrossRef] [PubMed] [Green Version]
- AR6 Climate Change 2021: The Physical Science Basis—IPCC. Available online: https://www.ipcc.ch/report/sixth-assessment-report-working-group-i/ (accessed on 3 May 2022).
- Lowe, S.A. An energy and mortality impact assessment of the urban heat island in the US. Environ. Impact Assess. Rev. 2016, 56, 139–144. [Google Scholar] [CrossRef]
- Ismagilova, G.; Safiullin, L.; Gafurov, I. Using Historical Heritage as a Factor in Tourism Development. Procedia-Soc. Behav. Sci. 2015, 188, 157–162. [Google Scholar] [CrossRef] [Green Version]
- Marcheschi, E.; Vogel, N.; Larsson, A.; Perander, S.; Koglin, T. Residents’ acceptance towards car-free street experiments: Focus on perceived quality of life and neighborhood attachment. Transp. Res. Interdiscip. Perspect. 2022, 14, 100585. [Google Scholar] [CrossRef]
- Ghanem, S.; Ahmad, A.F.; Aboualy, S. COVID-19 Bringing Cairenes Back to their Streets. J. Urban Manag. 2021, 10, 393–408. [Google Scholar] [CrossRef]
- Guerra Macho, J.; Cejudo López, J.M.; Molina Félix, J.L.; Álvarez Domínguez, S.; Velázquez Vila, R. Control Climático en espacios Abiertos: Evaluación del Proyecto EXPO’92, Sevilla; Editorial Ciemat: Sevilla, Spain, 1994. [Google Scholar]
- Santamouris, M.; Kolokotsa, D. Urban Climate Mitigation Techniques; Routledge: London, UK, 2016; ISBN 978-0415712132. [Google Scholar]
- Dimoudi, A.; Nikolopoulou, M. Vegetation in the urban environment: Microclimatic analysis and benefits. Energy Build. 2003, 35, 69–76. [Google Scholar] [CrossRef] [Green Version]
- Irmak, M.A.; Yİlmaz, S.; Yİlmaz, H.; Ozer, S.; Toy, S. Evaluation of different thermal conditions based on THI under different kind of tree types—As a specific case in a Ata Botanic Garden in eastern Turkey. Glob. NEST J. 2013, 15, 131–139. [Google Scholar] [CrossRef]
- Darvish, A.; Eghbali, G.; Eghbali, S.R. Tree-configuration and species effects on the indoor and outdoor thermal condition and energy performance of courtyard buildings. Urban Clim. 2021, 37, 100861. [Google Scholar] [CrossRef]
- Meili, N.; Acero, J.A.; Peleg, N.; Manoli, G.; Burlando, P.; Fatichi, S. Vegetation cover and plant-trait effects on outdoor thermal comfort in a tropical city. Build. Environ. 2021, 195, 107733. [Google Scholar] [CrossRef]
- Lai, D.; Liu, W.; Gan, T.; Liu, K.; Chen, Q. A review of mitigating strategies to improve the thermal environment and thermal comfort in urban outdoor spaces. Sci. Total Environ. 2019, 661, 337–353. [Google Scholar] [CrossRef]
- El-Bardisy, W.M.; Fahmy, M.; El-Gohary, G.F. Climatic Sensitive Landscape Design: Towards a Better Microclimate through Plantation in Public Schools, Cairo, Egypt. Procedia-Soc. Behav. Sci. 2016, 216, 206–216. [Google Scholar] [CrossRef] [Green Version]
- Su, Y.; Wu, J.; Zhang, C.; Wu, X.; Li, Q.; Liu, L.; Bi, C.; Zhang, H.; Lafortezza, R.; Chen, X. Estimating the cooling effect magnitude of urban vegetation in different climate zones using multi-source remote sensing. Urban Clim. 2022, 43, 101155. [Google Scholar] [CrossRef]
- Elgheznawy, D.; Eltarabily, S. The Impact of Sun Sail-Shading Strategy on the Thermal Comfort in School Courtyards; Elsevier Ltd.: Amsterdam, The Netherlands, 2021; Volume 202, ISBN 0000000159. [Google Scholar]
- Kántor, N.; Chen, L.; Gál, C.V. Human-biometeorological significance of shading in urban public spaces—Summertime measurements in Pécs, Hungary. Landsc. Urban Plan. 2018, 170, 241–255. [Google Scholar] [CrossRef]
- Lee, I.; Voogt, J.A.; Gillespie, T.J. Analysis and Comparison of Shading Strategies to Increase Human Thermal Comfort in Urban Areas. Atmosphere 2018, 9, 91. [Google Scholar] [CrossRef] [Green Version]
- Li, L.; Li, Y.; Wu, Z.; Xu, P.; Peng, X.; Wang, H.; Fan, C. Window ejected thermal plume dispersion and recirculation behavior in urban street canyon with different building height ratios under wind. Case Stud. Therm. Eng. 2021, 27, 101220. [Google Scholar] [CrossRef]
- Jing, Y.; Zhong, H.-Y.; Wang, W.-W.; He, Y.; Zhao, F.-Y.; Li, Y. Quantitative city ventilation evaluation for urban canopy under heat island circulation without geostrophic winds: Multi-scale CFD model and parametric investigations. Build. Environ. 2021, 196, 107793. [Google Scholar] [CrossRef]
- Miao, C.; Yu, S.; Zhang, Y.; Hu, Y.; He, X.; Chen, W. Assessing outdoor air quality vertically in an urban street canyon and its response to microclimatic factors. J. Environ. Sci. 2022, 124, 923–932. [Google Scholar] [CrossRef]
- Wang, W.; Wang, D.; Chen, H.; Wang, B.; Chen, X. Identifying urban ventilation corridors through quantitative analysis of ventilation potential and wind characteristics. Build. Environ. 2022, 214, 108943. [Google Scholar] [CrossRef]
- Li, W.; Wang, F.; Bell, S. Simulating the sheltering effects of windbreaks in urban outdoor open space. J. Wind Eng. Ind. Aerodyn. 2007, 95, 533–549. [Google Scholar] [CrossRef]
- Mahgoub, A.O.; Ghani, S. Numerical and experimental investigation of utilizing the porous media model for windbreaks CFD simulation. Sustain. Cities Soc. 2020, 65, 102648. [Google Scholar] [CrossRef]
- Oke, T.R. Street design and urban canopy layer climate. Energy Build. 1988, 11, 103–113. [Google Scholar] [CrossRef]
- Li, Z.; Ming, T.; Shi, T.; Zhang, H.; Wen, C.-Y.; Lu, X.; Dong, X.; Wu, Y.; de Richter, R.; Li, W.; et al. Review on pollutant dispersion in urban areas-part B: Local mitigation strategies, optimization framework, and evaluation theory. Build. Environ. 2021, 198, 107890. [Google Scholar] [CrossRef]
- Anupam, B.R.; Sahoo, U.C.; Chandrappa, A.K.; Rath, P. Emerging technologies in cool pavements: A review. Constr. Build. Mater. 2021, 299, 123892. [Google Scholar] [CrossRef]
- Aletba, S.R.O.; Hassan, N.A.; Jaya, R.P.; Aminudin, E.; Mahmud, M.Z.H.; Mohamed, A.; Hussein, A.A. Thermal performance of cooling strategies for asphalt pavement: A state-of-the-art review. J. Traffic Transp. Eng. 2021, 8, 356–373. [Google Scholar] [CrossRef]
- Santamouris, M. Regulating the damaged thermostat of the cities—Status, impacts and mitigation challenges. Energy Build. 2015, 91, 43–56. [Google Scholar] [CrossRef]
- Wang, C.; Wang, Z.-H.; Kaloush, K.E.; Shacat, J. Cool pavements for urban heat island mitigation: A synthetic review. Renew. Sustain. Energy Rev. 2021, 146, 111171. [Google Scholar] [CrossRef]
- Sharifi, A.; Yamagata, Y. Roof ponds as passive heating and cooling systems: A systematic review. Appl. Energy 2015, 160, 336–357. [Google Scholar] [CrossRef]
- Wang, H.; Lei, C. A numerical investigation of combined solar chimney and water wall for building ventilation and thermal comfort. Build. Environ. 2019, 171, 106616. [Google Scholar] [CrossRef]
- Binarti, F.; Koerniawan, M.D.; Triyadi, S.; Utami, S.S.; Matzarakis, A. A review of outdoor thermal comfort indices and neutral ranges for hot-humid regions. Urban Clim. 2019, 31, 100531. [Google Scholar] [CrossRef]
- Guerrero, M.; Sánchez, J.; Antonio, J.; Ríos, T. Falling-film as natural cooling technique: Modelling and energy impact assessment. Energy Convers. Management. 2020, 221, 113168. [Google Scholar] [CrossRef]
- Gao, J.; Li, A.; Xu, X.; Gang, W.; Yan, T. Ground heat exchangers: Applications, technology integration and potentials for zero energy buildings. Renew. Energy 2018, 128, 337–349. [Google Scholar] [CrossRef]
- Delgado, M.G.; Ramos, J.S.; Domínguez, S.; Ulloa, F.T.; Ríos, J.A.T. Evaporative Mist Cooling as Heat Dissipation Technique: Experimental Assessment and Modelling. Appl. Sci. 2020, 10, 6026. [Google Scholar] [CrossRef]
- Delgado, M.G.; Ramos, J.S.; Domínguez, S. Using the sky as heat sink: Climatic applicability of night-sky based natural cooling techniques in Europe. Energy Convers. Manag. 2020, 225, 113424. [Google Scholar] [CrossRef]
- Rodríguez, L.R.; Ramos, J.S.; de la Flor, F.J.S.; Domínguez, S. Analyzing the urban heat Island: Comprehensive methodology for data gathering and optimal design of mobile transects. Sustain. Cities Soc. 2020, 55, 102027. [Google Scholar] [CrossRef]
- Delgado, M.G.; Medina, D.C.; Ramos, J.S.; Amores, T.R.P.; Domínguez, S.; Ríos, J.A.T. Adaptative Cover to Achieve Thermal Comfort in Open Spaces of Buildings: Experimental Assessment and Modelling. Appl. Sci. 2021, 11, 7998. [Google Scholar] [CrossRef]
- ASHRAE ANSI/ASHRAE Standard 55; Thermal Environmental Conditions for Human Occupancy. ASHRAE: Atlanta, GA, USA, 2017.
- Höppe, P. Different aspects of assessing indoor and outdoor thermal comfort. Energy Build. 2002, 34, 661–665. [Google Scholar] [CrossRef]
- Nikolopoulou, M.; Baker, N.; Steemers, K. Thermal comfort in outdoor urban spaces: Understanding the human parameter. Sol. Energy 2001, 70, 227–235. [Google Scholar] [CrossRef]
- Pearlmutter, D.; Jiao, D.; Garb, Y. The relationship between bioclimatic thermal stress and subjective thermal sensation in pedestrian spaces. Int. J. Biometeorol. 2014, 58, 2111–2127. [Google Scholar] [CrossRef]
- DuBois, D.; DuBois, E.F. A formula to estimate the approximate surface area if height and weight be known. Nutrition 1989, 5, 303. [Google Scholar]
- ASHRAE. ASHRAE Handbook Fundamentals—Chapter 8 Thermal Comfort. In 2017 ASHRAE Handbook Fundamentals; ASHRAE: Atlanta, GA, USA, 2017. [Google Scholar]
- ISO 7933:2004; Ergonomics of the Thermal Environment—Analytical Determination and Interpretation of Heat Stress Using Calculation of the Predicted Heat Strain. ISO: Geneva, Switzerland, 2004.
- Nikolopoulou, M.; Steemers, K. Thermal comfort and psychological adaptation as a guide for designing urban spaces. Energy Build. 2003, 35, 95–101. [Google Scholar] [CrossRef]
- Shooshtarian, S.; Lam, C.K.C.; Kenawy, I. Outdoor thermal comfort assessment: A review on thermal comfort research in Australia. Build. Environ. 2020, 177, 106917. [Google Scholar] [CrossRef]
- Coccolo, S.; Kämpf, J.; Scartezzini, J.-L.; Pearlmutter, D. Outdoor human comfort and thermal stress: A comprehensive review on models and standards. Urban Clim. 2016, 18, 33–57. [Google Scholar] [CrossRef]
- Epstein, Y.; Moran, D.S. Thermal Comfort and the Heat Stress Indices. Ind. Health 2006, 44, 388–398. [Google Scholar] [CrossRef] [Green Version]
- Bergman, T.L.; Incropera, F.P. Fundamentals of Heat and Mass Transfer, 8th ed.; Wiley: Hoboken, NJ, USA, 2011; ISBN 0470501979. [Google Scholar]
- ISO 7243:2017; Ergonomics of the Thermal Environment—Assessment of Heat Stress Using the WBGT (Wet Bulb Globe Temperature) Index. ISO: Geneva, Switzerland, 2017.
- ANSYS Fluent Software. CFD Simulation, version 2022; ANSYS Fluent Software: Canonsburg, PA, USA, 2022. [Google Scholar]
- Sakiyama, N.R.M.; Frick, J.; Bejat, T.; Garrecht, H. Using CFD to Evaluate Natural Ventilation through a 3D Parametric Modeling Approach. Energies 2021, 14, 2197. [Google Scholar] [CrossRef]
- Delgado, M.G.; Ramos, J.S.; Ríos, J.A.T.; Domínguez, S. Falling-film as natural cooling technique: Modelling and energy impact assessment. Energy Convers. Manag. 2020, 221, 113168. [Google Scholar] [CrossRef]
- Delgado, M.G.; Ramos, J.S.; Moreno, M.P.; Ríos, J.A.T.; Domínguez, S. Experimental analysis of atmospheric heat sinks as heat dissipators. Energy Convers. Manag. 2020, 207, 112550. [Google Scholar] [CrossRef]
- Adesanya, M.A.; Na, W.-H.; Rabiu, A.; Ogunlowo, Q.O.; Akpenpuun, T.D.; Rasheed, A.; Yoon, Y.-C.; Lee, H.-W. TRNSYS Simulation and Experimental Validation of Internal Temperature and Heating Demand in a Glass Greenhouse. Sustainability 2022, 14, 8283. [Google Scholar] [CrossRef]
- UNE 100014:2004; Air Conditioning. Basis for the Project. Outside Conditions of Calculation. AENOR: Madrid, Spain, 2004.
- Yilmaz, S.; Külekçi, E.A.; Mutlu, B.E.; Sezen, I. Analysis of winter thermal comfort conditions: Street scenarios using ENVI-met model. Environ. Sci. Pollut. Res. 2021, 28, 63837–63859. [Google Scholar] [CrossRef]
- Toy, S.; Yilmaz, S. Evaluation of urban-rural bioclimatic comfort differences over a ten-year period in the sample of Erzincan city reconstructed after a heavy earthquake. Atmosfera 2010, 23, 387–402. [Google Scholar]


| Mean Radiant Temperature | |||||||||||
|---|---|---|---|---|---|---|---|---|---|---|---|
| 20 | 22 | 24 | 26 | 28 | 30 | 32 | 34 | 36 | 38 | ||
| Space air temperature | 17 | 0.00 | 0.00 | 0.00 | 0.00 | 0.00 | 0.00 | 0.00 | 0.00 | 0.00 | 0.00 |
| 20 | 0.00 | 0.00 | 0.00 | 0.00 | 0.00 | 0.00 | 0.00 | 1.76 | 5.81 | 9.86 | |
| 22 | 0.00 | 0.00 | 1.54 | 5.50 | 9.48 | 13.49 | 17.53 | 21.60 | 25.69 | 29.82 | |
| 24 | 13.34 | 17.28 | 21.24 | 25.24 | 29.26 | 33.31 | 37.39 | 41.50 | 45.54 | 49.80 | |
| 26 | 33.01 | 36.99 | 41.00 | 45.03 | 49.10 | 53.19 | 57.31 | 61.46 | 65.64 | 69.84 | |
| 28 | 52.74 | 56.75 | 60.80 | 64.88 | 68.98 | 73.12 | 77.28 | 81.47 | 85.69 | 89.94 | |
| 30 | 73.38 | 75.43 | 77.50 | 79.58 | 81.67 | 83.77 | 85.89 | 88.02 | 90.17 | 92.32 | |
| Component of the Balance | Amount (W) | Percentage (%) | External Controllability | |
|---|---|---|---|---|
| Gains | Internal generation − Metabolism | 60 | 24 | Not controllable |
| Total radiation (direct + diffuse + reflected) | 135 | 55 | Controllable | |
| Long-wave radiant exchange | 35 | 14 | Controllable and susceptible to being negative | |
| Convection | 15 | 7 | Controllable and susceptible to being negative | |
| Losses | Total gains | 245 | 100 | - |
| Exchange with the sky vault | 25 | 11 | Controllable | |
| Sweating | 220 | 89 | Real effectiveness controllable | |
| Total losses | 245 | 100 | - |
| Criteria | Generic Action | Specific Action |
|---|---|---|
| Reduction in solar radiation | Block direct and diffuse radiation Block reflected radiation | Covers Enclosing space Treatment of surrounding surfaces |
| Reduction or inversion of long-wave radiant exchange | Reduction in temperatures of surrounding surfaces | Covers: sprinkling with water film |
| Reduction or inversion of convective exchange | Reduction in air temperature | Enclosing space Sensible cooling Latent cooling |
| Type of Textile | |||
|---|---|---|---|
| Clean white | 0.27 | 0.70 | 0.03 |
| Dirty white | 0.23 | 0.61 | 0.16 |
| Clean cream | 0.25 | 0.58 | 0.17 |
| Dirty cream | 0.22 | 0.46 | 0.32 |
| ACH | |
|---|---|
| 2 | 2.72 |
| 4 | 3.20 |
| 6 | 3.58 |
| Air Temperature of Drive Air (°C) | Required Airflow (m3/h) |
|---|---|
| 18 | 4578 |
| 19 | 5232 |
| 20 | 6104 |
| 21 | 7325 |
| 22 | 9156 |
| 23 | 12,208 |
| 24 | 21,102 |
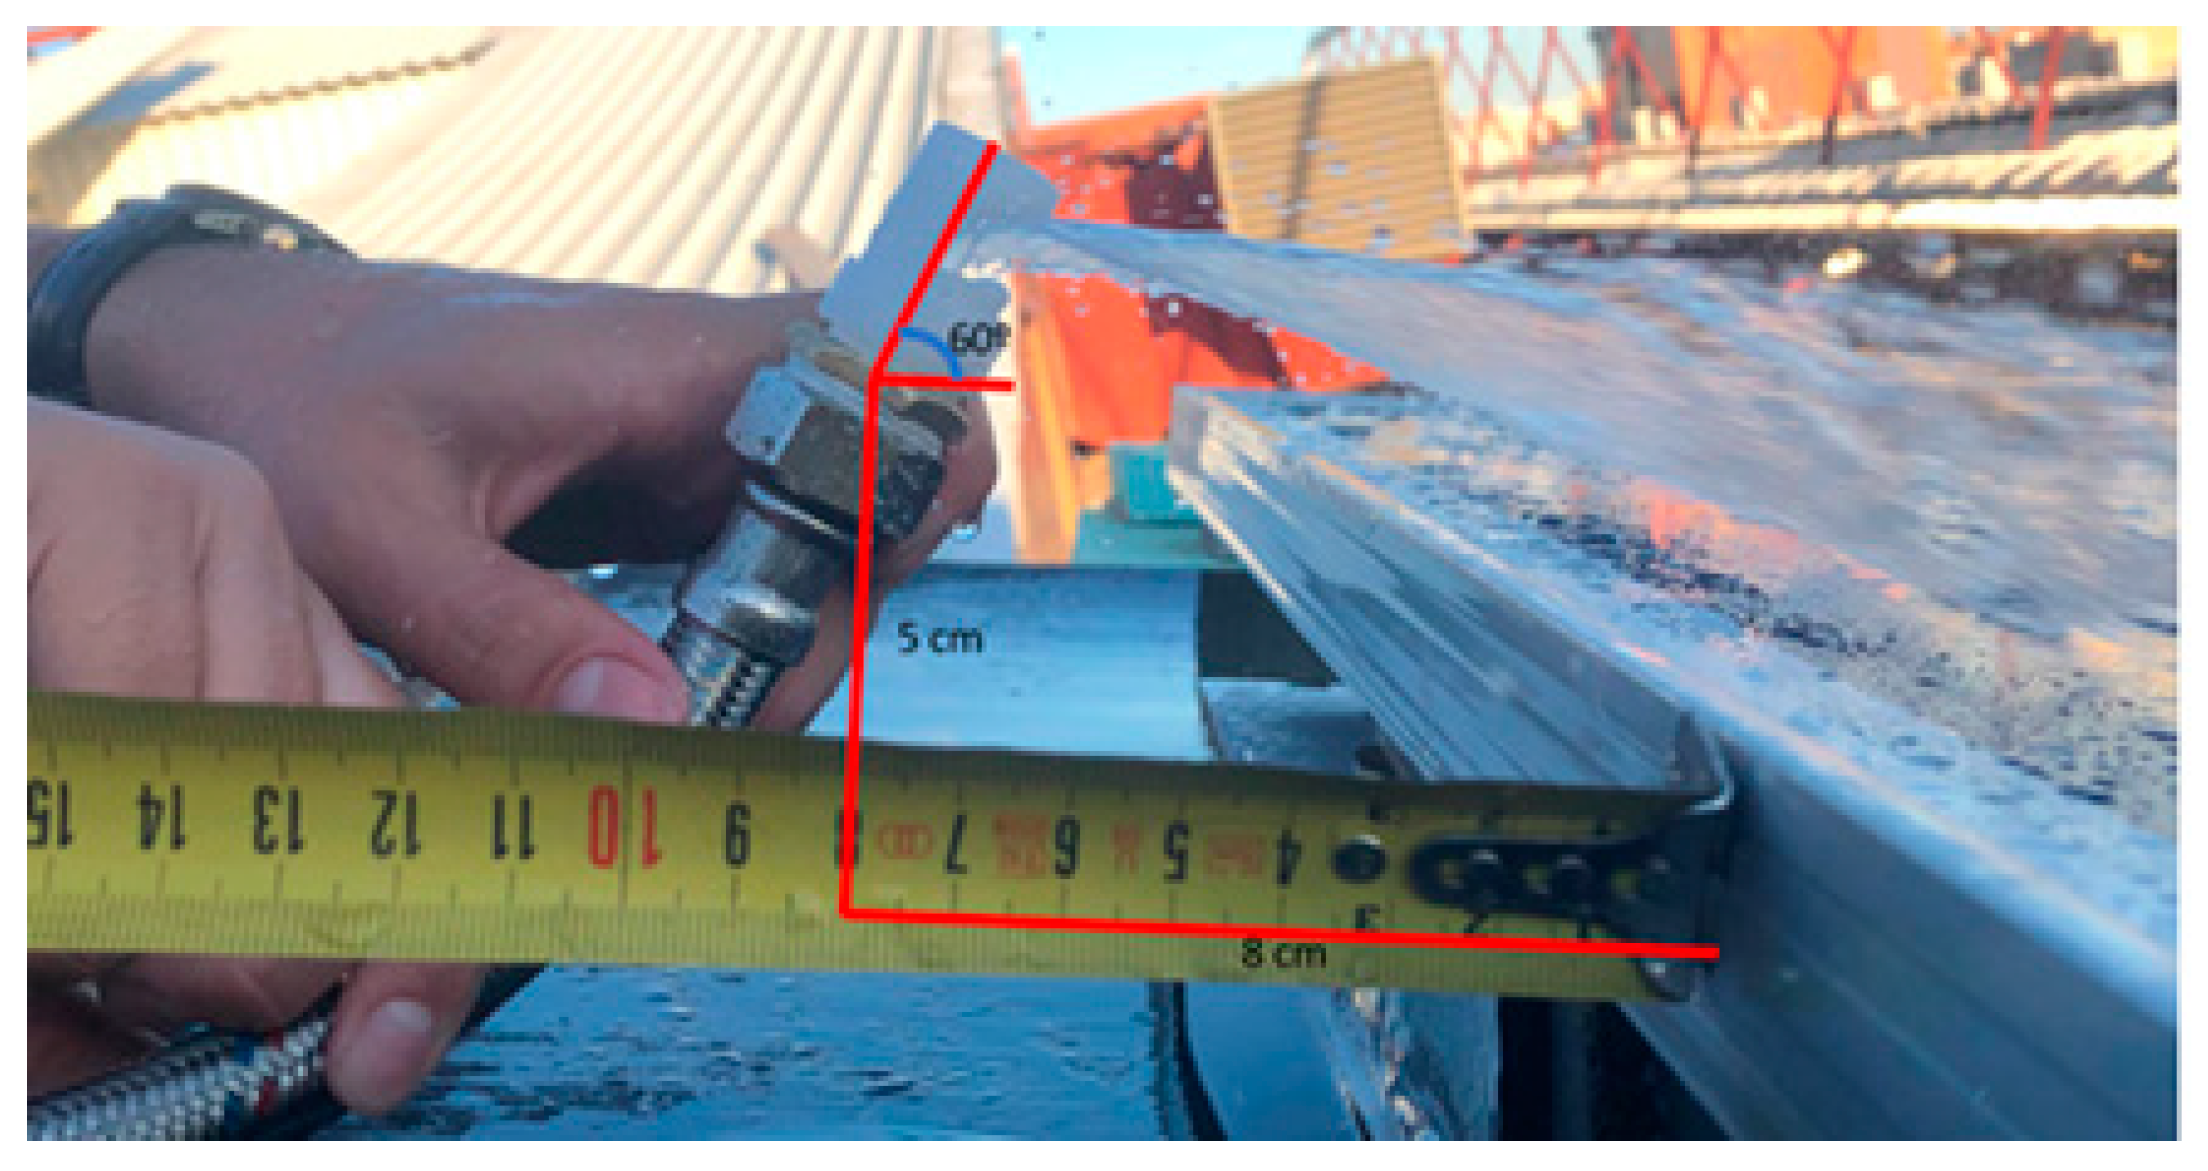
| Nozzle | Pressure | Flow | Film | Losses | Optimal Position | ||
|---|---|---|---|---|---|---|---|
| CW4 | 0.7 bar | 16 l/min | Complete | Low | 8 cm horizontal | 5 cm height | 60º angle |
| ID | Description |
|---|---|
| 1 | Outdoor air |
| 2 | Natural cooling coil–Pond |
| 3 | Natural cooling coil–Pond |
| 4 | Fan to force air to the space |
| 5 | Air distribution to amphitheatre |
| 6 | Water circuit of evaporation system |
| 7 | Water circuit of the natural dissipation system |
| 8 | Water circuit of the natural cooling coil |
| 9 | Water circuit of the natural cooling coil |
| 10 | Mains water-Sprinkling water on textile cover |
| 11 | Sprinkler system textile cover |
| 12 | Storage pond for water cooled by the natural dissipation system |
| 13 | Storage tank for water cooled by the natural dissipation system during the night |
| 14 | Evaporative cooling system |
| 15 | Falling-film cooling system |
| Day | Average Temperature | Maximum Temperature |
|---|---|---|
| 1 | 29.7 | 35.7 |
| 2 | 29.9 | 38.0 |
| 3 | 31.0 | 38.0 |
| 4 | 30.8 | 38.0 |
| 5 | 31.5 | 38.2 |
Publisher’s Note: MDPI stays neutral with regard to jurisdictional claims in published maps and institutional affiliations. |
© 2022 by the authors. Licensee MDPI, Basel, Switzerland. This article is an open access article distributed under the terms and conditions of the Creative Commons Attribution (CC BY) license (https://creativecommons.org/licenses/by/4.0/).
Share and Cite
Medina, D.C.; Delgado, M.G.; Amores, T.R.P.; Toulou, A.; Ramos, J.S.; Domínguez, S.Á. Climatic Control of Urban Spaces Using Natural Cooling Techniques to Achieve Outdoor Thermal Comfort. Sustainability 2022, 14, 14173. https://doi.org/10.3390/su142114173
Medina DC, Delgado MG, Amores TRP, Toulou A, Ramos JS, Domínguez SÁ. Climatic Control of Urban Spaces Using Natural Cooling Techniques to Achieve Outdoor Thermal Comfort. Sustainability. 2022; 14(21):14173. https://doi.org/10.3390/su142114173
Chicago/Turabian StyleMedina, Daniel Castro, MCarmen Guerrero Delgado, Teresa Rocío Palomo Amores, Aurore Toulou, Jose Sánchez Ramos, and Servando Álvarez Domínguez. 2022. "Climatic Control of Urban Spaces Using Natural Cooling Techniques to Achieve Outdoor Thermal Comfort" Sustainability 14, no. 21: 14173. https://doi.org/10.3390/su142114173