Article

Study on the Spatio-Temporal Evolution of Land Use in Resource-Based Cities in Three Northeastern Provinces of China—An Analysis Based on Long-Term Series

1
School of Urban Economics and Public Administration, Capital University of Economics and Business, Beijing 100070, China
2
Beijing Key Laboratory of Megaregions Sustainable Development Modeling, Beijing 100070, China
*
Author to whom correspondence should be addressed.
Sustainability 2022, 14(20), 13683; https://doi.org/10.3390/su142013683
Submission received: 7 September 2022 / Revised: 22 September 2022 / Accepted: 17 October 2022 / Published: 21 October 2022

Abstract

:
Land is the basis of development, and the unique patterns of the spatio-temporal evolution of land use in resource-based cities can reflect regional development, help land resources to be used efficiently and rationally, promote scientific regulation, and achieve high-quality development. Based on the land use data of resource-based cities in three northeastern provinces from 1980 to 2020, the spatio-temporal evolution characteristics and driving factors of land use in the sample study area were studied by the Markov transfer matrix and a parametric optimal geographic detector model. The results showed that: (1) From the perspective of time, the land use changes in the sample study area were active, mainly reflected in the continuous conversion of forest land transfer-out (11.66%) and arable land transfer-in (11.28%), and the dynamic attitude of forest land showed a trend of decreasing, then increasing and then decreasing, while the dynamic attitude of arable land showed a trend of increasing, then decreasing and then increasing. (2) Spatially, the areas where land conversion occurred were mainly concentrated in the northern part of the study area and the border area in the east, which is also the area where forest land was converted to arable land and grassland was converted to arable land, and the expansion of construction land was more common; (3) In terms of influencing factors, land conversion before 2000 was mainly influenced by socio-economic factors, and population quantity and urbanization rate had stronger explanatory power. The spatial and temporal evolution of forest land conversion to arable land was realized by the interaction of various factors, and the driver interactions were all non-linearly enhanced and bi-factor enhanced. (4) In terms of influencing factors, land conversion before 2000 was mainly influenced by socio-economics, with population quantity and urbanization rate having a stronger explanatory power; after 2000, land conversion was mainly influenced by physical geography, with precipitation and temperature having a stronger explanatory power. (5) The spatio-temporal evolution of forest land conversion to cropland was realized by the interaction between various factors, and the driving factor interactions all showed non-linear enhancement and bifactor enhancement.

1. Introduction

Land Use and Land Cover Change (LUCC) is a hot area of academic research in ecology [1,2,3], environment [4,5,6], geography [7,8], and so on. LUCC shows the spatio-temporal dynamics of the surface landscape and objectively records the process and results of human behavioral activities on the surface ecosystem [9,10,11,12]. However, land use patterns are changing due to climate issues such as global warming, the intensification of human behavioral activities, and the advancement of urbanization and industrialization. In this regard, domestic and foreign scholars have undertaken much research on land use change and its driving mechanisms [13,14]. From the scope of the study areas selected by scholars, the existing studies have mainly focused on a province [15,16,17], a city [18,19], a county [20], a watershed [6,21] and a specific region [8,22,23,24]. The scope of the studies is concentrated, and the time series is short, making it difficult based on the fact that land use changes is the subject of long-term development and evolution. Most studies have focused on the transfer in and out of cropland [7,8,23,25] analysis. In terms of research methods, scholars have mainly explored the drivers of land use change by building regression models [26], and in recent years have more often used GeoDetector Models [7,8,27]. From the research results, precipitation, temperature, population, urbanization processes, and social development are the main drivers of land use changes [28,29,30,31].
Resource-based cities are the cities that rely on their unique natural resources and socio-economic characteristics [32,33,34]. Their leading industries have depended on local natural resources for a long time; however, the limited natural resources limit urban development and have led to resource-based cities becoming a relatively lagging category of cities in China and even in the world. However, research on resource-based cities in Northeast China has mostly focused on their economic development and the reasons for their underdevelopment [35,36]. There are fewer analyses related to their land use change, and the years are older [34,37]. In recent years, China has achieved remarkable results in spatial governance, territorial spatial planning has been solidly promoted, and land use adjustment has entered a new stage nationwide. Therefore, exploring the rational land use and evolution of resource-based cities has gradually become the focus of scholars at home and abroad.
Based on the above analysis, this paper uses five periods land use data of all the three northeastern provinces’ resource-based cities in China as the basis from 1980 to 2020, uses ArcGIS spatial analysis software and RStudio software, and integrates physical geo-graphic factors and socio-economic factors through the Parametric-Optimal Geodetector Model [38,39,40] (OPGD) to analysis the land use change characteristics of resource-based cities in the study area over the past 40 years. It explores the driving mechanism of land use change in different periods and the interaction of the driving factors in order to provide support for the analysis of land use evolution laws in resource-based cities and promote land policy innovation in resource-based cities scientifically.

2. Materials and Methods
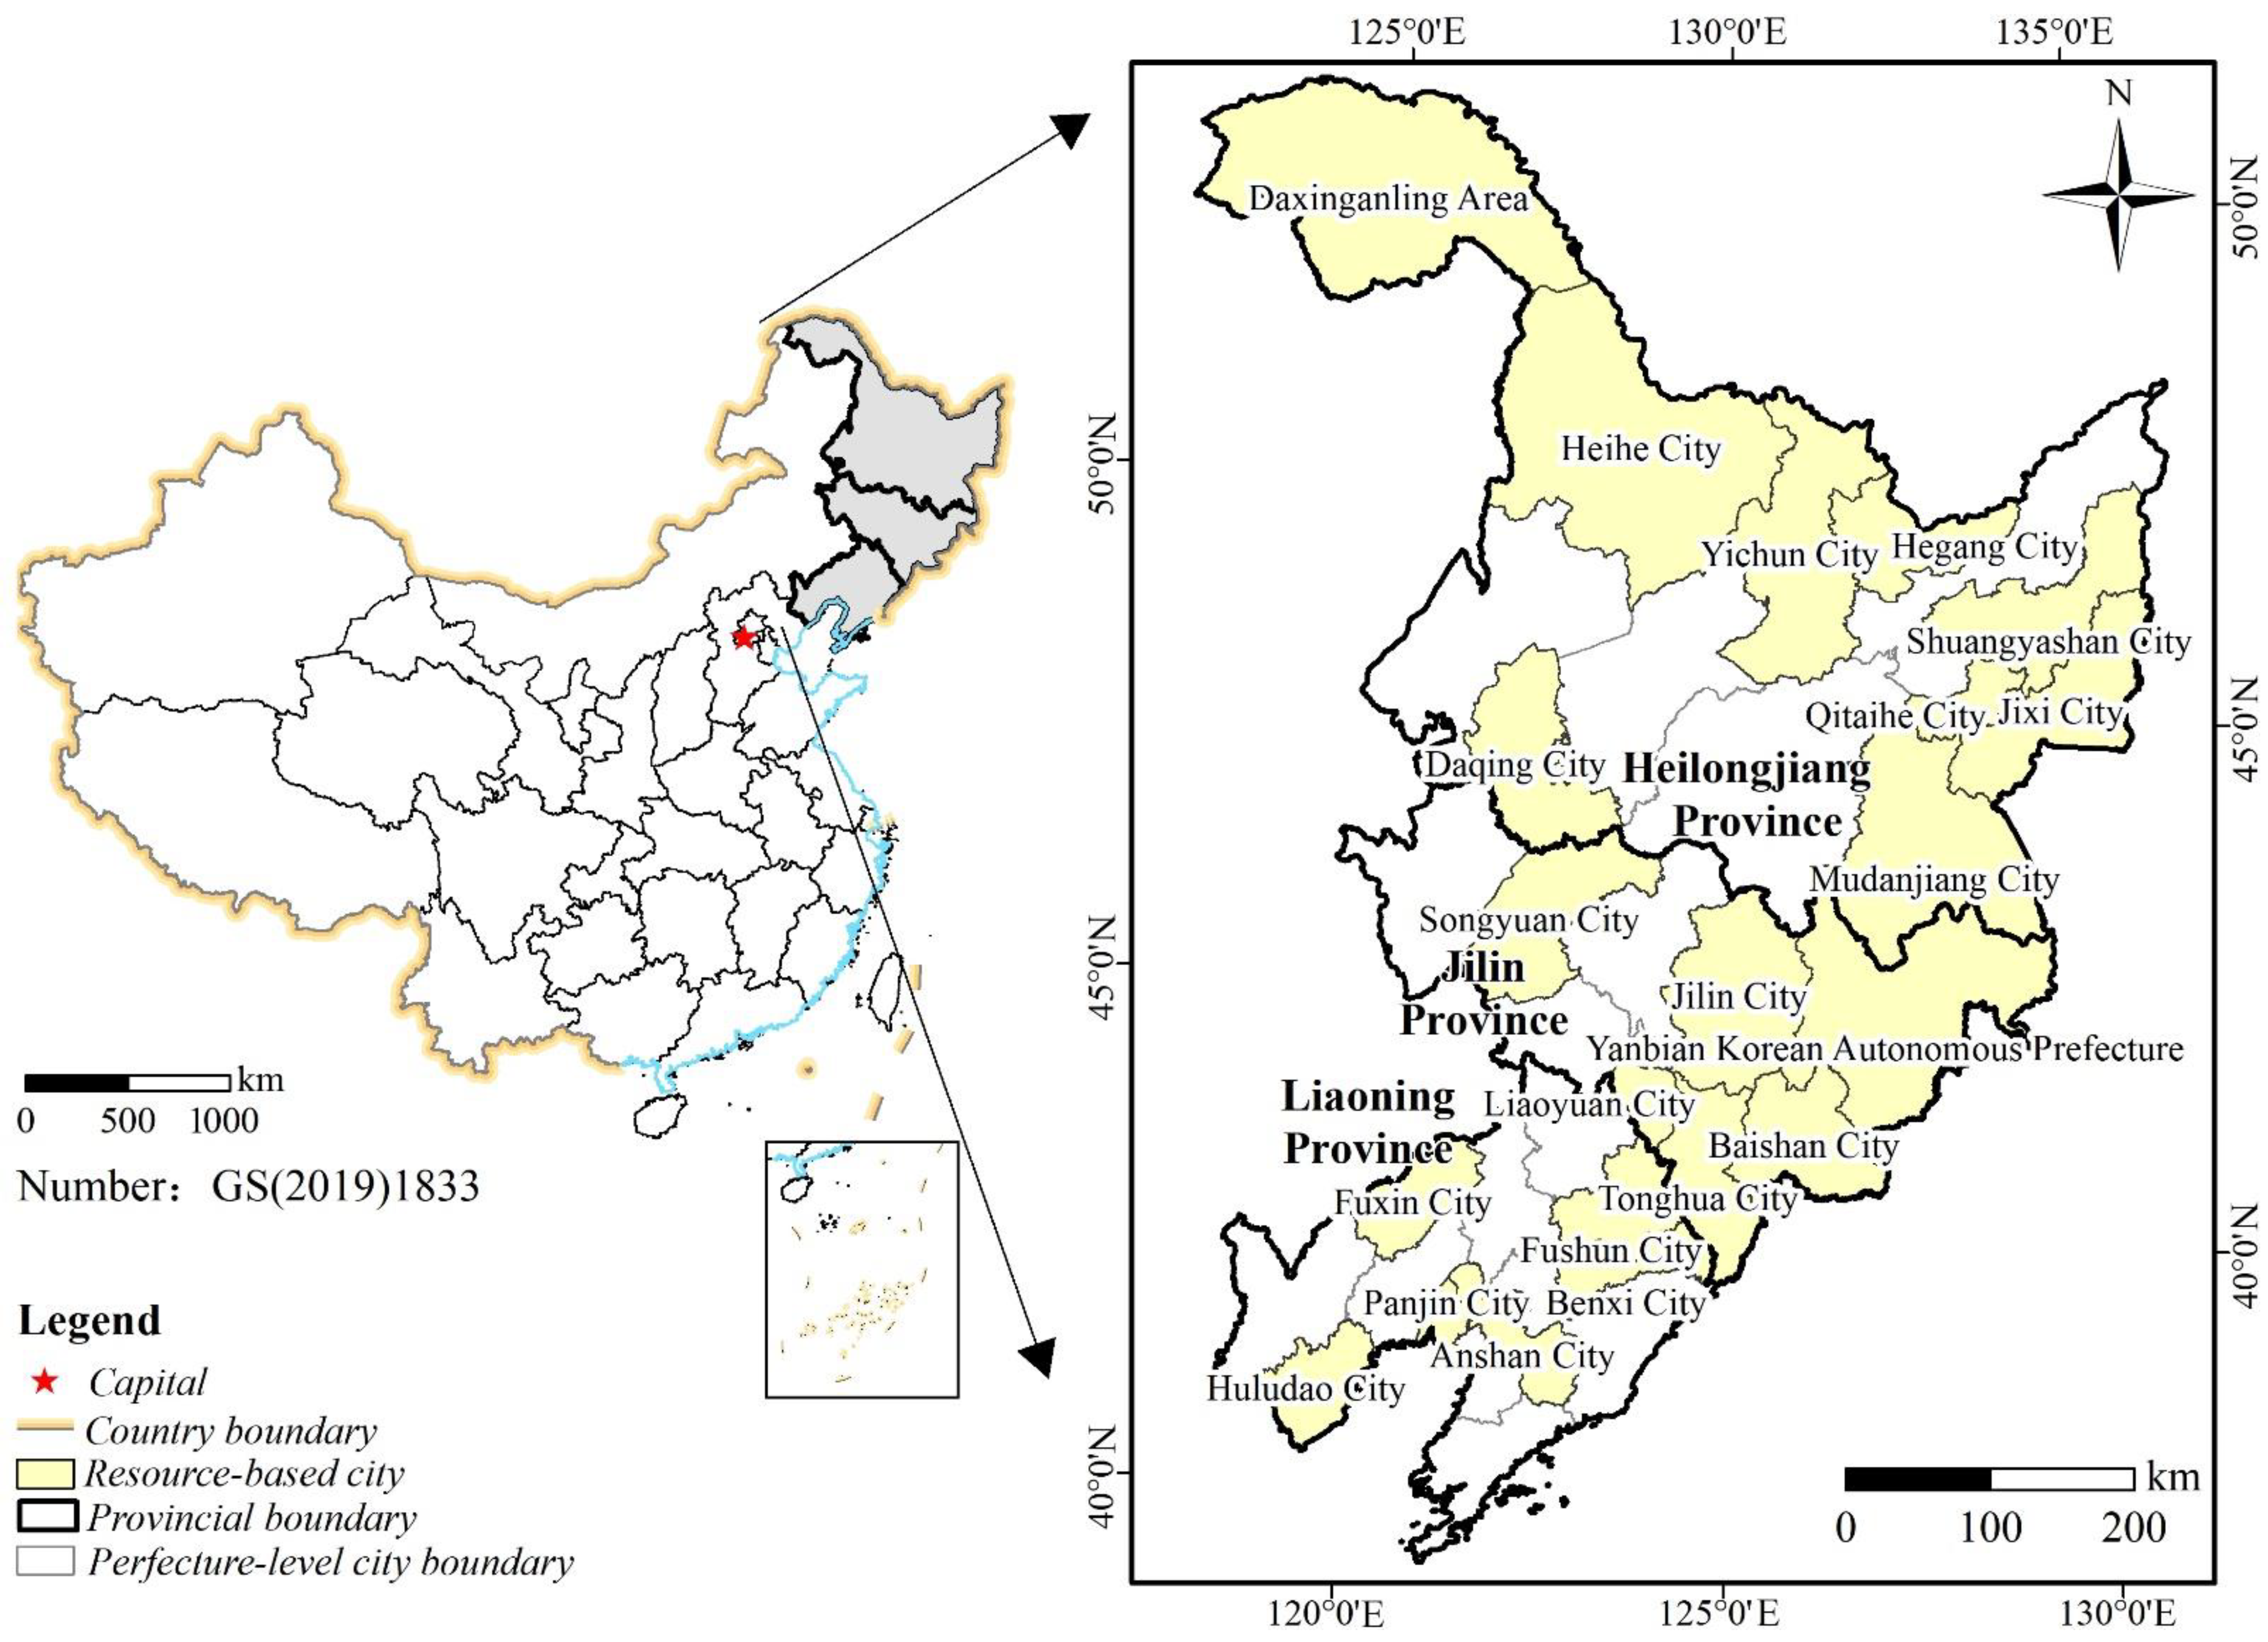
2.1. Study Area

The three northeastern provinces (118°53′~135°05′ E, 38°43′~53°33′ N) are the collective name of the Heilongjiang, Jilin, and Liaoning provinces. The region is adjacent to Russia and North Korea, and there are 36 prefecture-level cities (Figure 1). According to the list of resource-based cities determined by the National Plan for Sustainable Development of Resource-based Cities (2013–2020) [41], there are 21 resource-based cities in the region (Table 1), and their area accounts for 59.94% of the total area of the three northeastern provinces, which is the most concentrated area of resource-based cities in China. As an important strategic resource security area, a critical commodity food base, and a “ballast” for national food security, the analysis of the evolution of land use in the three northeastern provinces and the investigation of the driving mechanism of land use change are essential for optimizing the regional land resource allocation and scientific regulation of land use and promoting the transformation and upgrading of resource-based cities and high-quality development. It is crucial for optimizing the allocation of regional land resources and scientific regulation of land use and promoting the transformation and upgrading of resource-based cities and high-quality development.

2.2. Data Sources

Due to the special properties of land and its conversion with a long-term cycle, this paper selected the data of the study area for five periods of 1980, 1990, 2000, 2010, and 2020, respectively. Among them, the land use data were obtained from the 1 km raster dataset of the Resource and Environment Science Data Center of the Chinese Academy of Sciences (https://www.resdc.cn/, accessed by 15 April 2022); among the driver data, the elevation and slope data were obtained from the new global 30 m DEM (Digital Elevation Model) dataset released by the National Aeronautics and Space Administration (NASA), which has the characteristics of realism and comprehensive coverage. Precipitation and temperature data were obtained from the spatial interpolation dataset provided by the Data Center for Resource and Environmental Sciences of the Chinese Academy of Sciences, based on the daily observation data from more than 2400 meteorological stations’ national collation, calculation, and spatial interpolation processing. Socio-economic data were obtained from the China City Statistical Yearbook, Liaoning Statistical Yearbook, Jilin Statistical Yearbook, Heilongjiang Statistical Yearbook, and provinces and cities’ statistical bulletins, from 1980 to 2020 (https://www.cnki.net/, accessed by 15 April 2022).

2.3. Research Methodology

2.3.1. Land Use Dynamic Attitude

The dynamic land use attitude can genuinely reflect the degree of dynamic changes of land use types and is divided into single land use attitude and comprehensive land use attitude. The response to the change of a specific land use type in a particular time in a specific region is the single land use dynamic attitude is calculated by the following formula:
K = U b U a U a × 1 T × 100 %

2.3.2. Markov Transfer Matrix

The Markov transfer matrix reflects the current land use status and the area size of land types at the beginning and end of a period, as well as the mutual transfer of land use types within that period, and is calculated as follows:
P i j = P 11 P 1 N P N 1 P N N
where Pij denotes the area of land use type change at the beginning and end of the period, and N is the total number of land use types.

2.3.3. Parametric-Optimal Geodetector Model

Geodetector is a statistical method that can detect the spatial variability of geographic elements and the magnitude of their driving forces and is widely used to study regional spatial and temporal changes and socio-economic development [7,8,25,40]. Since the Geodetector Model needs to discretize continuous variables, in this process problems such as poor discretization results can arise due to subjectivity. Therefore, based on the traditional Geodetector Model, the Parametric-Optimal Geodetector Model uses a supervised discretization method of spatial data discretization to select the parameter combination with the largest q-value [38,39,40], to exclude subjectivity and insignificant results due to poor discretization. The process was implemented by RStudio software. According to the actual situation of this study, two detector models, risk factor detection, and interaction factor detection in the Parametric-Optimal Geodetector Model were used.
Risk factor detection: This was used to detect the spatial variation characteristics of land use change in the study area and the intensity of the driver’s explanation of the spatial variation characteristics of land use change. Its calculation formula is as follows:
q = 1 h = 1 L N h δ h 2 N δ 2 = 1 S S W S S T
S S W = h = 1 L N h δ h 2 , S S T = N δ 2
where h is the stratification of Y and X; Nh and N are the number of cells of layer h and the number of full cells, respectively, and are the variance of the Y values of layer h and the variance of the whole area, respectively; and SSW and SST are the variance within the layer and the total variance of the whole area, respectively. q takes values in the range [0, 1], and the larger its value, the more obvious the spatial heterogeneity of land use change, which indicates that X explains q*100% of Y.
Interaction detection: This was used to detect the strength of interaction between risk factors, in particular to detect whether there was an enhanced or weakened relationship between the explanatory power of the drivers X1 and X2 together on land use change, or whether each driver existed relatively independently [40].

3. Results and Analysis

3.1. Analysis of the Spatio-Temporal Evolution of Land Use

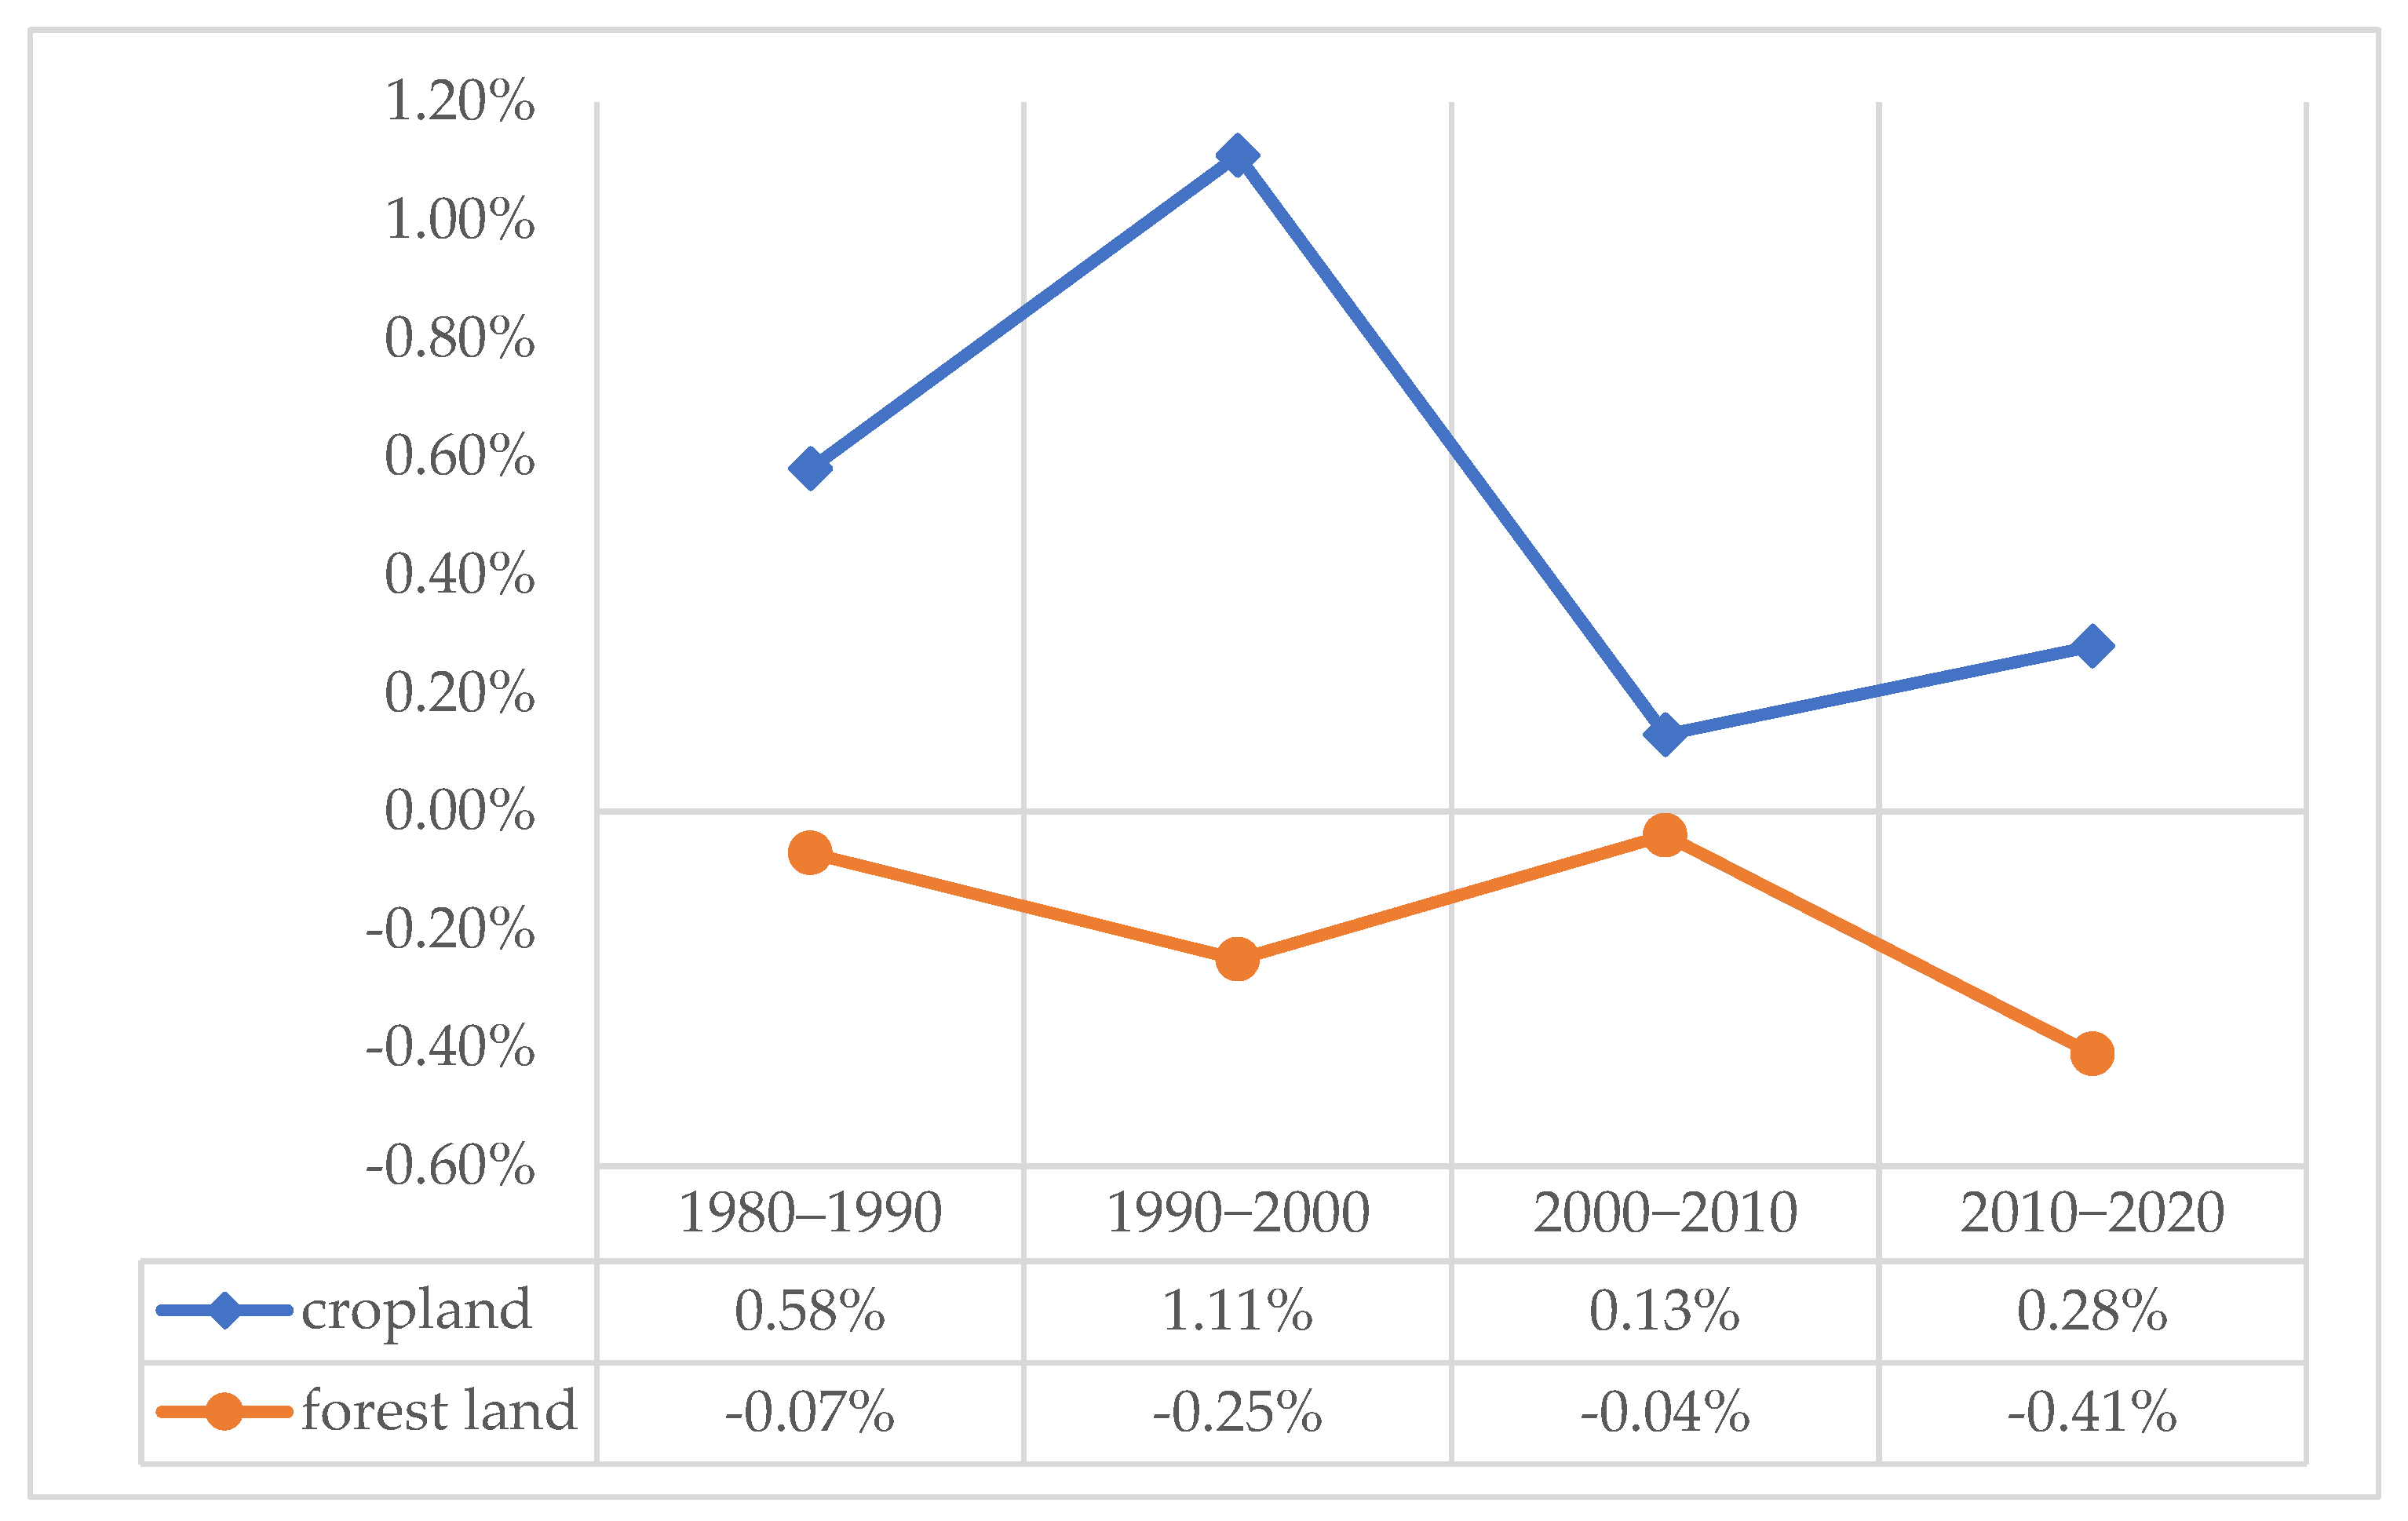
3.1.1. Temporal Evolution of Land Use Change

As can be seen from Table 2, land use change within the study area was mainly dominated by forest land and cropland. Forest land accounted for 60.52% in 1980 and decreased to 55.97% in 2020, and cropland accounted for 22.57% in 1980 and increased to 27.62% in 2020.
According to the Markov principle and through ArcGIS software, Table 3 shows that the areas of cropland, built-up land, and unused land increased, and the areas of forest land, grassland, and water decreased. The largest increase was cropland, with a conversion area of 23,700 km2 from 1980; the smallest increase was unused land, with a conversion area of 11,247 km2 from 1980; the most significant decrease was forest land, with a conversion area of 21,321 km2 from 1980, and a minor decrease was water bodies, with a conversion area of 1609 km2 from 1980.
Table 4 shows that the most significant degree of land use change from 1980 to 2020 was the conversion of forest land to cropland with 5.70%, the conversion of cropland to forest land with 3.32%, the conversion of forest land to unused land with 3.16%, and the land use changes in this period were mainly dominated by cropland transfer-in (11.28%) and forest land transfer-out (11.66%). In terms of time, the most significant degree of land use change in 1980–1990 was cropland transfer-in (1.47%), mainly reflected in the conversion of unused land, grassland, and forest land to cropland, with the percentages of 0.50%, 0.49%, and 0.47%, respectively; the enormous rate of land use conversion was unused land (0.74%), mainly reflected in the conversion of unused land to cropland and grassland, with the percentages of the land use pattern in this period being relatively stable, with relatively smooth changes. Land use changes from 1990 to 2000 were similar to the previous period, and the most significant change was also cropland transfer-in (4.39%), transfer from forest land, and grassland and unused land, accounting for 2.36%, 1.13%, and 0.50%, respectively. The most significant degree of land use change in this period was from forest land and grassland, with 2.90% and 1.54%, respectively, and both mainly transferred to cropland, with a 2.63% change from forest land and a 1.13% change from grassland. The greatest extent of change in land use during the period 2000–2010 was the forest land transfer-out (1.51%), mainly to cropland and grassland, accounting for 1.04% and 0.34%, respectively; the greatest extent of change was cropland transfer-in (1.87%), mainly to forest land and built-up land, accounting for 1.04% and 0.43%, respectively; and the land use situation during this period was similar to the period 1980–1990, with a relatively stable land use pattern and relatively insignificant changes in land types. In the period 2010–2020, the most significant degree of land use change was forest land transfer-out (10.22%), mainly to cropland, unused land, and grassland, accounting for 4.63%, 3.00%, and 1.97%, respectively, and the most significant degree of land use change was cropland transfer-in (8.35%), mainly to forest land and unused land, accounting for 4.16% and 1.21%, respectively.
In general, the typical land use changes in the study area over 40 years mainly reflected the conversion of forest land to cropland, followed by cropland to forest land, in which the land use dynamics of cropland showed an apparent N-shaped dynamic trend and the land use dynamics of forest land showed a slow inverted N-shaped dynamic trend (Table 5, Figure 2). From this, it is easy to find that the increase in cropland and the decrease in forest land had a specific correlation.

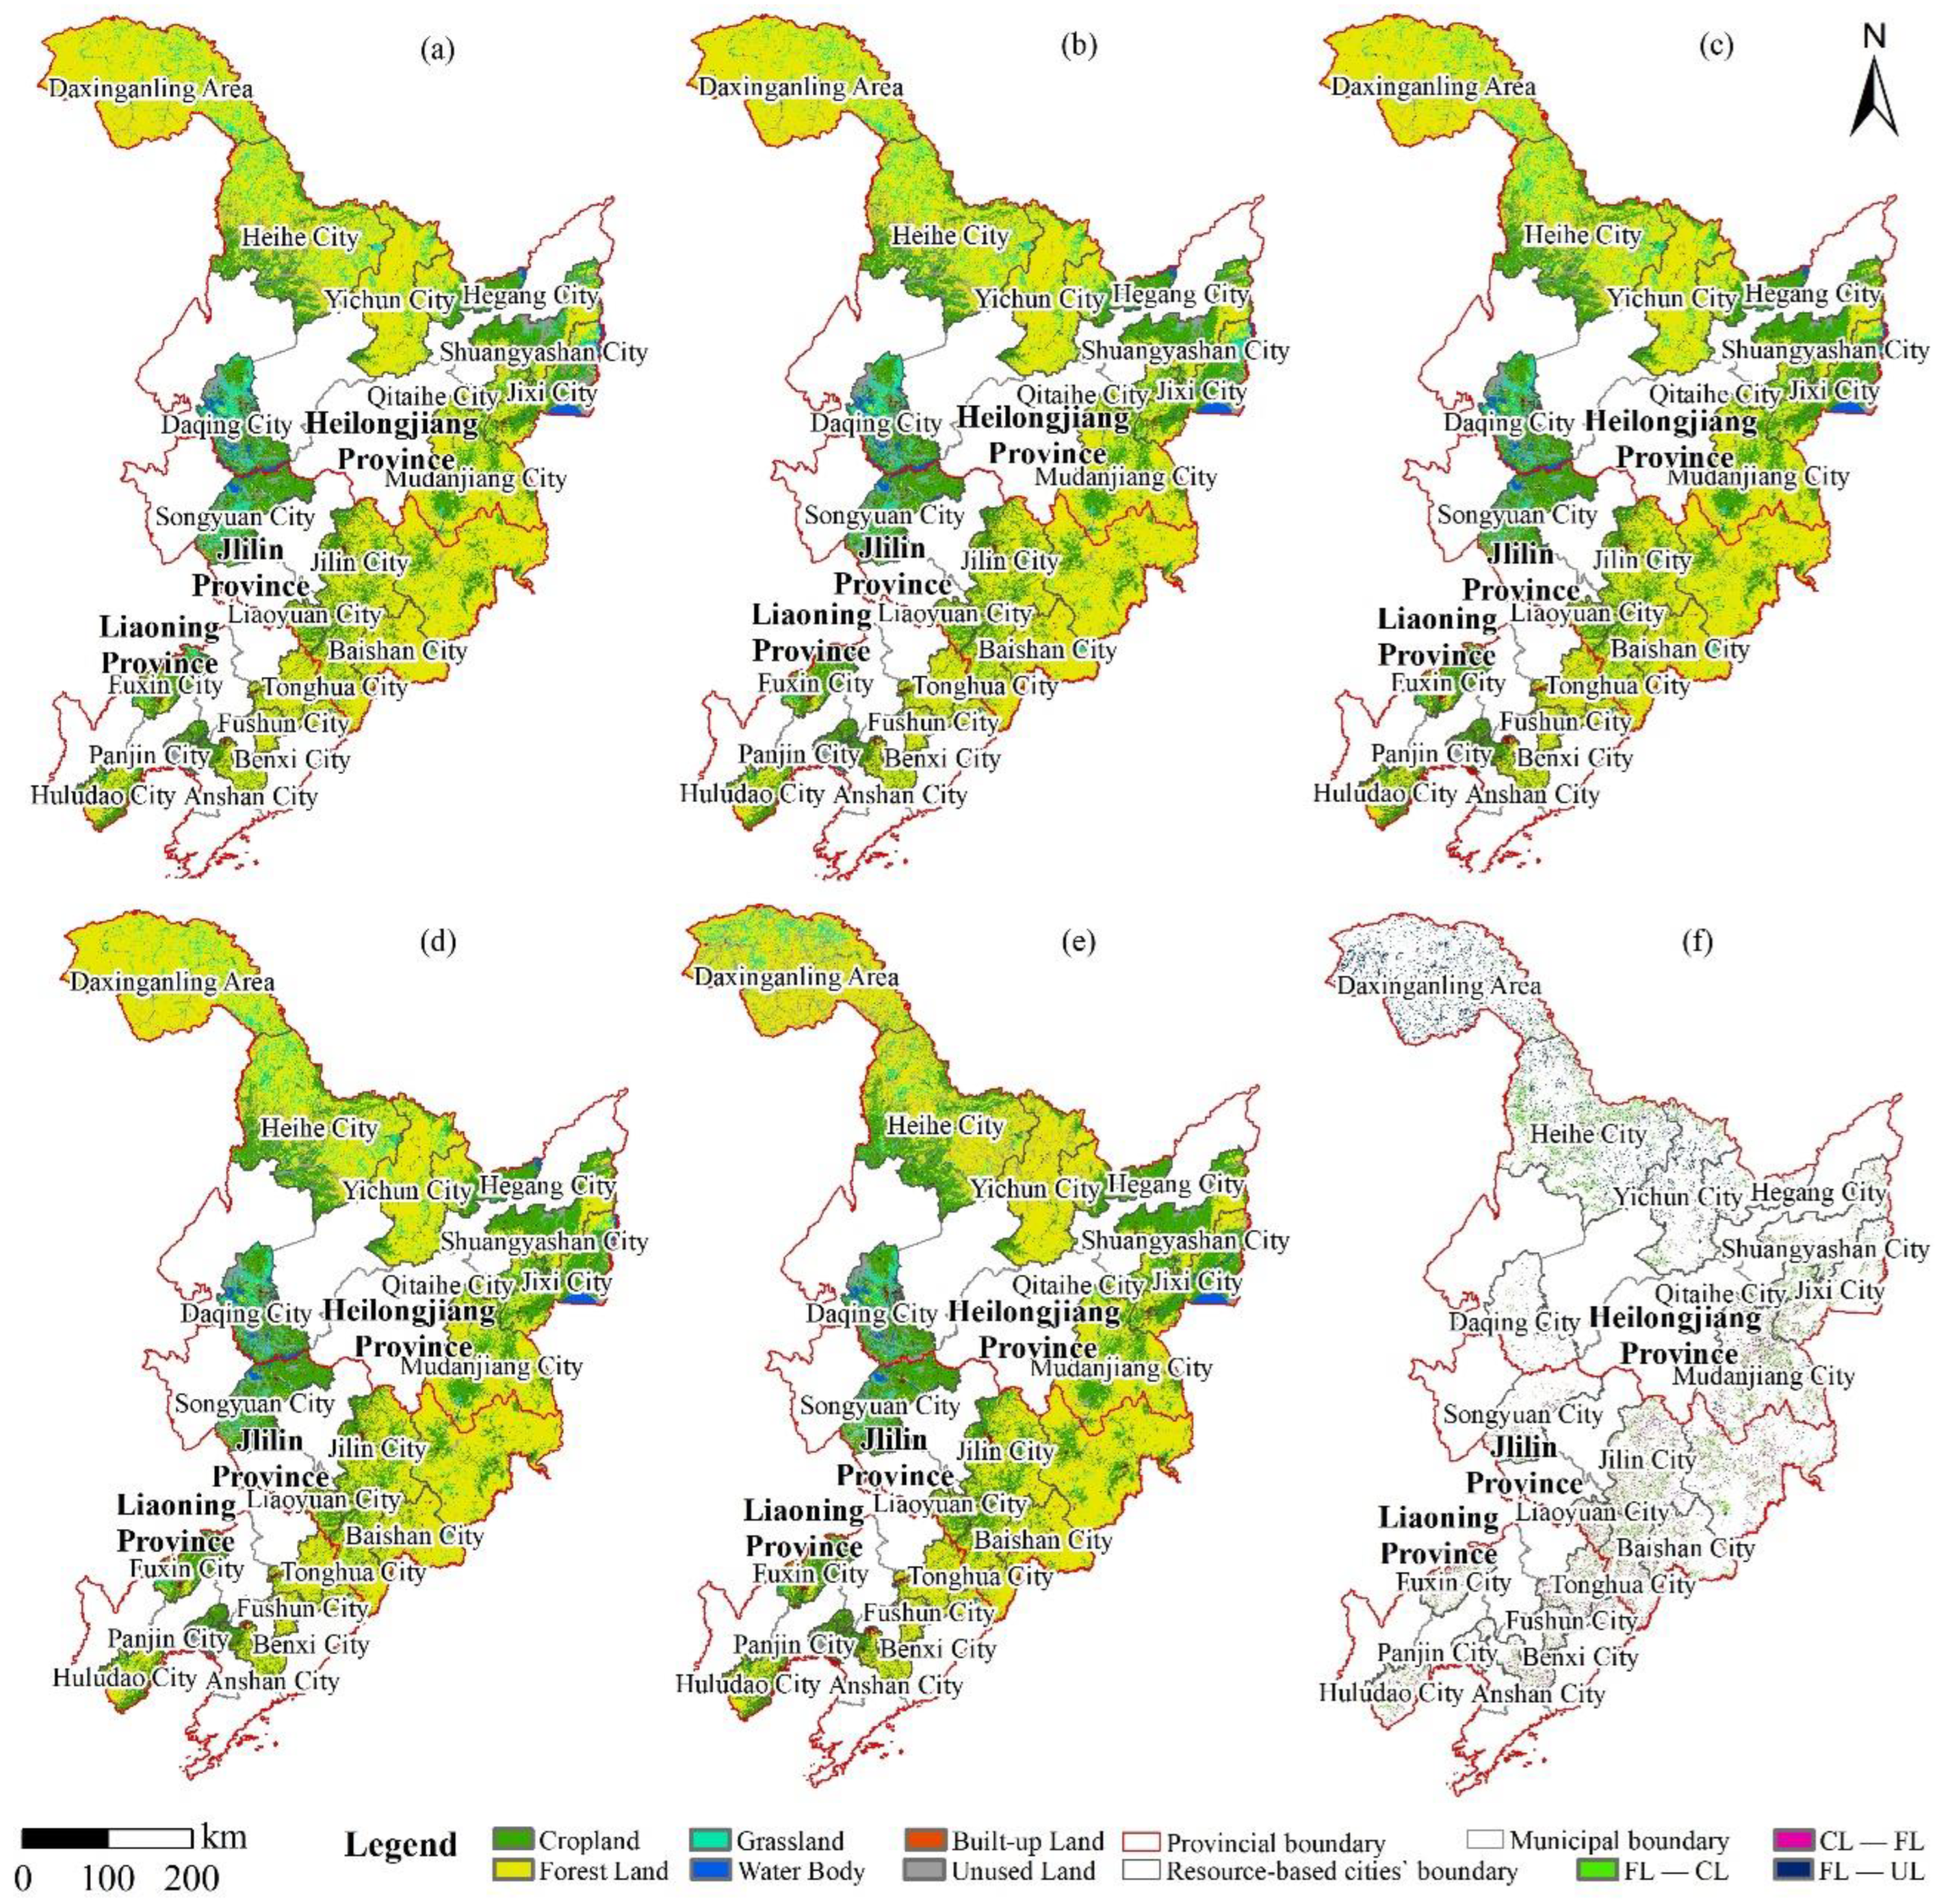
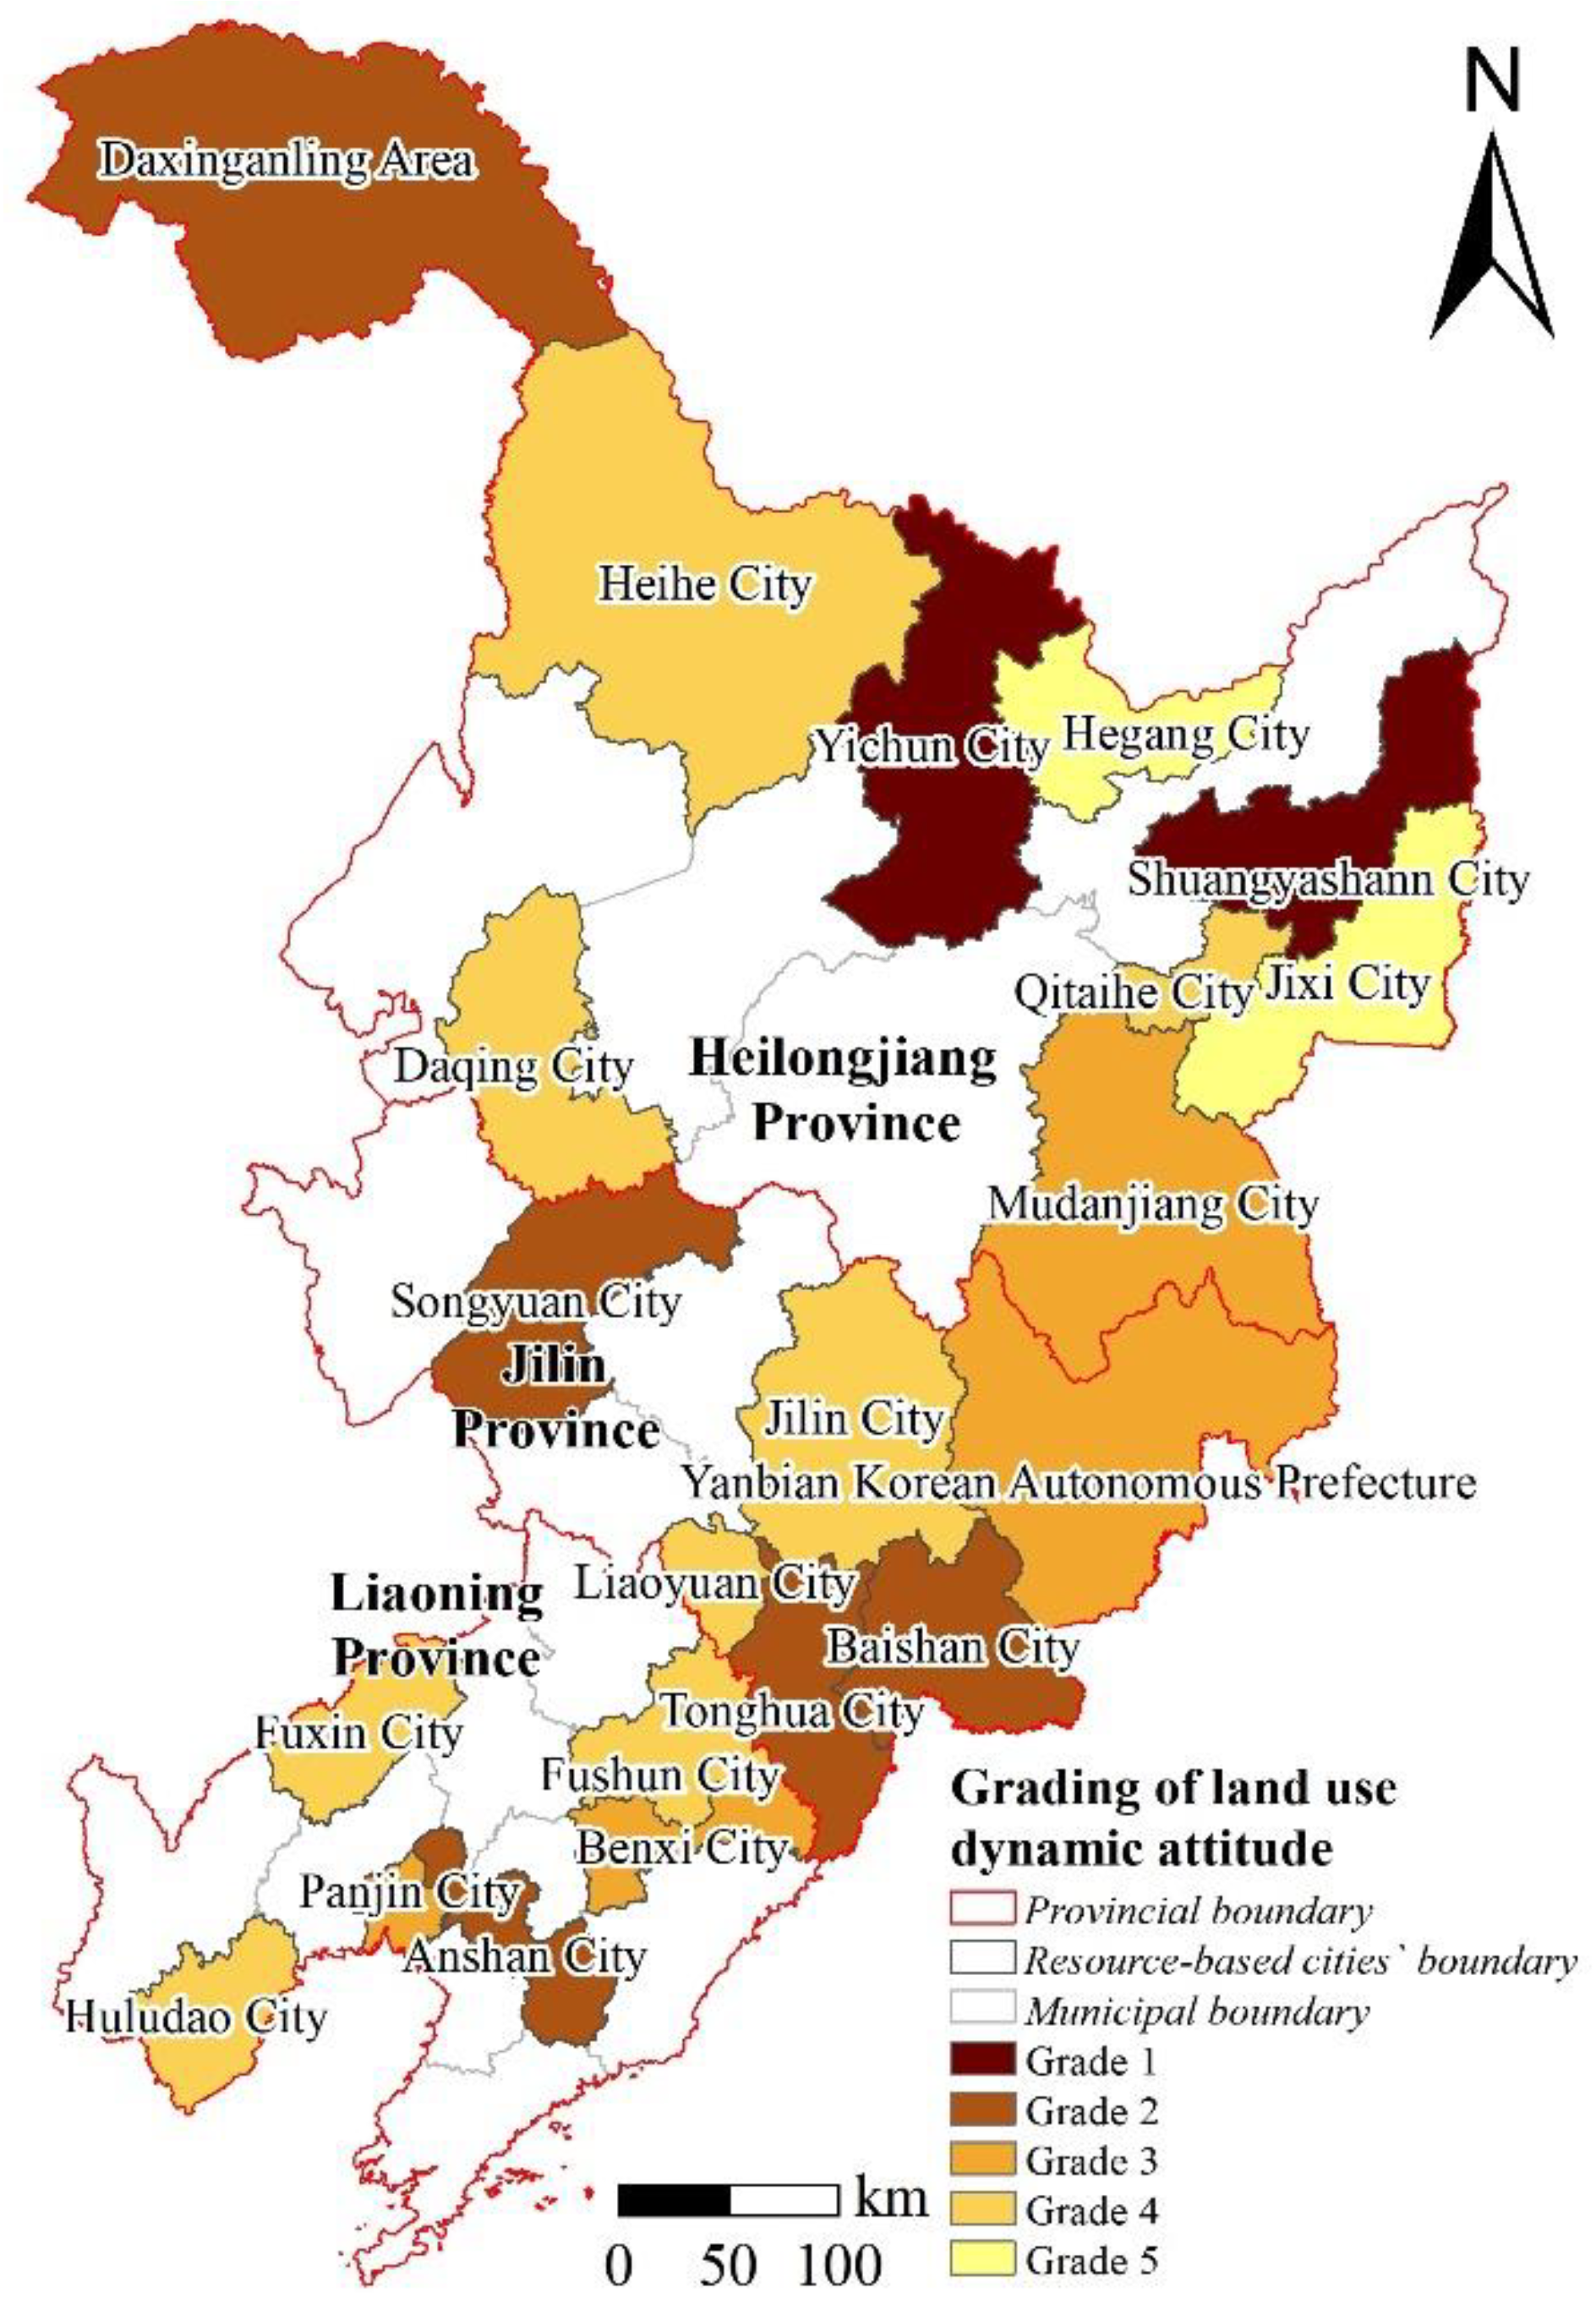
3.1.2. Spatial Distribution of Land Use Change

The maps of the current land use situation in each period and the spatial distribution of typical land use changes in the study area were obtained by ArcGIS (Figure 3). From Figure 4, we can see the distribution of land use in the study area, and it is evident that in the border area near Russia in the north of the study area, in 40 years, large areas of forest land were converted to unused land and forest land converted to cropland, and the grassland has shown signs of overall expansion to the north. In the eastern part of the study area near the border with Korea, a large area of forest land was also converted to cropland; in the western part of the study area, a large area of grassland was converted to cropland; and the central part of the study area there has been an evident expansion of built-up land. The expansion of built-up land was also evident in the northeastern and central areas of the study area, as well as in the southern areas, all of which showed different degrees of built-up land expansion, and the expansion was concentrated in heavy industrial resource-based cities with abundant reserves of raw coal, crude oil and iron ore.
To further clarify the degree of dynamic attitudinal changes of land use in the study area, the degree of land use change in the study area was divided into five levels using the ArcGIS Natural Breaks (Jenks) method (Figure 4), with level 1 indicating the most significant degree of changeand decreasing level by level. As can be seen from Figure 5, the prefecture-level cities with the most significant degree of land use change in the study area from 1980 to 2020 were Yichun City and Shuangyashan City, which are adjacent to the Russian border, mainly embodied in the change of forest land to unused land and cropland. The cities with the next highest degree of change were Daxinganling Area, which is adjacent to the Russian border, Baishan City and Tonghua City, which are adjacent to the Korean border, as well as Songyuan City and Anshan City, where the change in land use was mainly reflected in the transfer of forest land to cropland. The cities with the degree of change in land use dynamics of grade 3 included Mudanjiang City and Yanbian Korean Autonomous Region, which are adjacent to the border with North Korea, and Benxi City and Panjin City, where the change in land type was mainly reflected in the transfer of forest land to cropland. The rest of the resource-based cities had relatively inactive land use dynamics. Among them, Heihe City, which is adjacent to the Russian border, and Daqing City, Qitaihe City, Jilin City, Liaoyuan City, Fuxin City, Fushun City, and Huludao City were in level 4 of land use dynamics, mainly reflecting the transfer of forest land to cropland and Jixi City and Hegang City had a minor level of land use dynamics, mainly reflected in the transfer of grassland to cropland.
It should be noted that all four resource-based cities of the national timber reserve base had an apparent degradation of forest land, and the transfer-out was mainly to cropland and unused land. The possible reasons for this phenomenon are: such cities mainly rely on the development of woodcraft industry clusters, and thus consume wood much faster than the rate of finished timber; secondly, with the development of the social economy, land resources have become more and more scarce, and the population food problem has come to the fore, thus reclaiming cropland in the border areas where land is vast and people are scarce becomes the first choice; finally, due to the relatively harsh climatic and environmental conditions in the border areas, resulting in forest land. The probability of conversion to unused land has increased and accelerated.

3.2. Driving Factor Analysis

3.2.1. Driving Factor Detection

The first step was to make the selection of the driving factors. According to the results of related research and combined with the characteristics of the study area as a resource-based city, this paper selected the driving factor indicators from two dimensions: physical geography and socio-economics. Considering the quantifiability and accessibility of the driving factors, the following indicators were selected: Slope (X1), Elevation (X2), Precipitation (X3), Temperature (X4), Population (X5), Urbanization rate (X6), GDP (X7), Gross industrial output value (X8), and Gross agricultural output value (X9).
The most important type of land use change in the study area was converting forest land to cropland. Based on the Parametric-Optimal GeoDetector Model to detect the driving factors of spatio-temporal evolution of forest land to cropland in the study area (Table 6), the results were all significant. Table 6 shows that the urbanization rate and population were the main drivers of forest land conversion to cropland in 1980–1990 and the slope and the GDP also had strong explanatory power. From 1990–2000, the main drivers were still urbanization rate and population size, and it can be seen that the explanatory power of urbanization rate and population size increased significantly in this period. At the same time, the explanatory power of elevation and precipitation also increased. The main driving factors in 2000–2010 changed from the socio-economic factors in the first 20 years to the natural geographic factors dominated by precipitation and temperature. The main driving factors in 2010–2020 changed from the gross agricultural output value and gross industrial output value in the socio-economic factors.
Not surprisingly, due to the intensification of the population over the past 40 years, securing an orderly supply of food is fundamental to people’s livelihood. Due to the limited land resources, the newly reclaimed cropland could only be achieved by cutting down deep forests and reclaiming wasteland, resulting in the increase in cropland mainly in the border resource-based urban areas where timber resources are mainly re-served. During the same period, some of the resource-based cities became the first development areas by their resource advantages, such as Anshan City, Fushun City, Benxi City, Panjin City, Jilin City, Songyuan City, Daqing City, Hegang City, Jixi City, etc., resulting in the apparent expansion of built-up land in these cities. In the past 20 years, the popula-tion and urbanization rate have gradually stabilized compared with the previous 20 years, and the impact on the land use pattern has gradually weakened. From 2000 to 2020, the population in the three northeastern provinces has stabilized. China has introduced policies on returning cropland to forest land and grass land to cope with the ecological environment, which has effectively curbed the degradation of forest land and gradually stabilized the land use pattern.

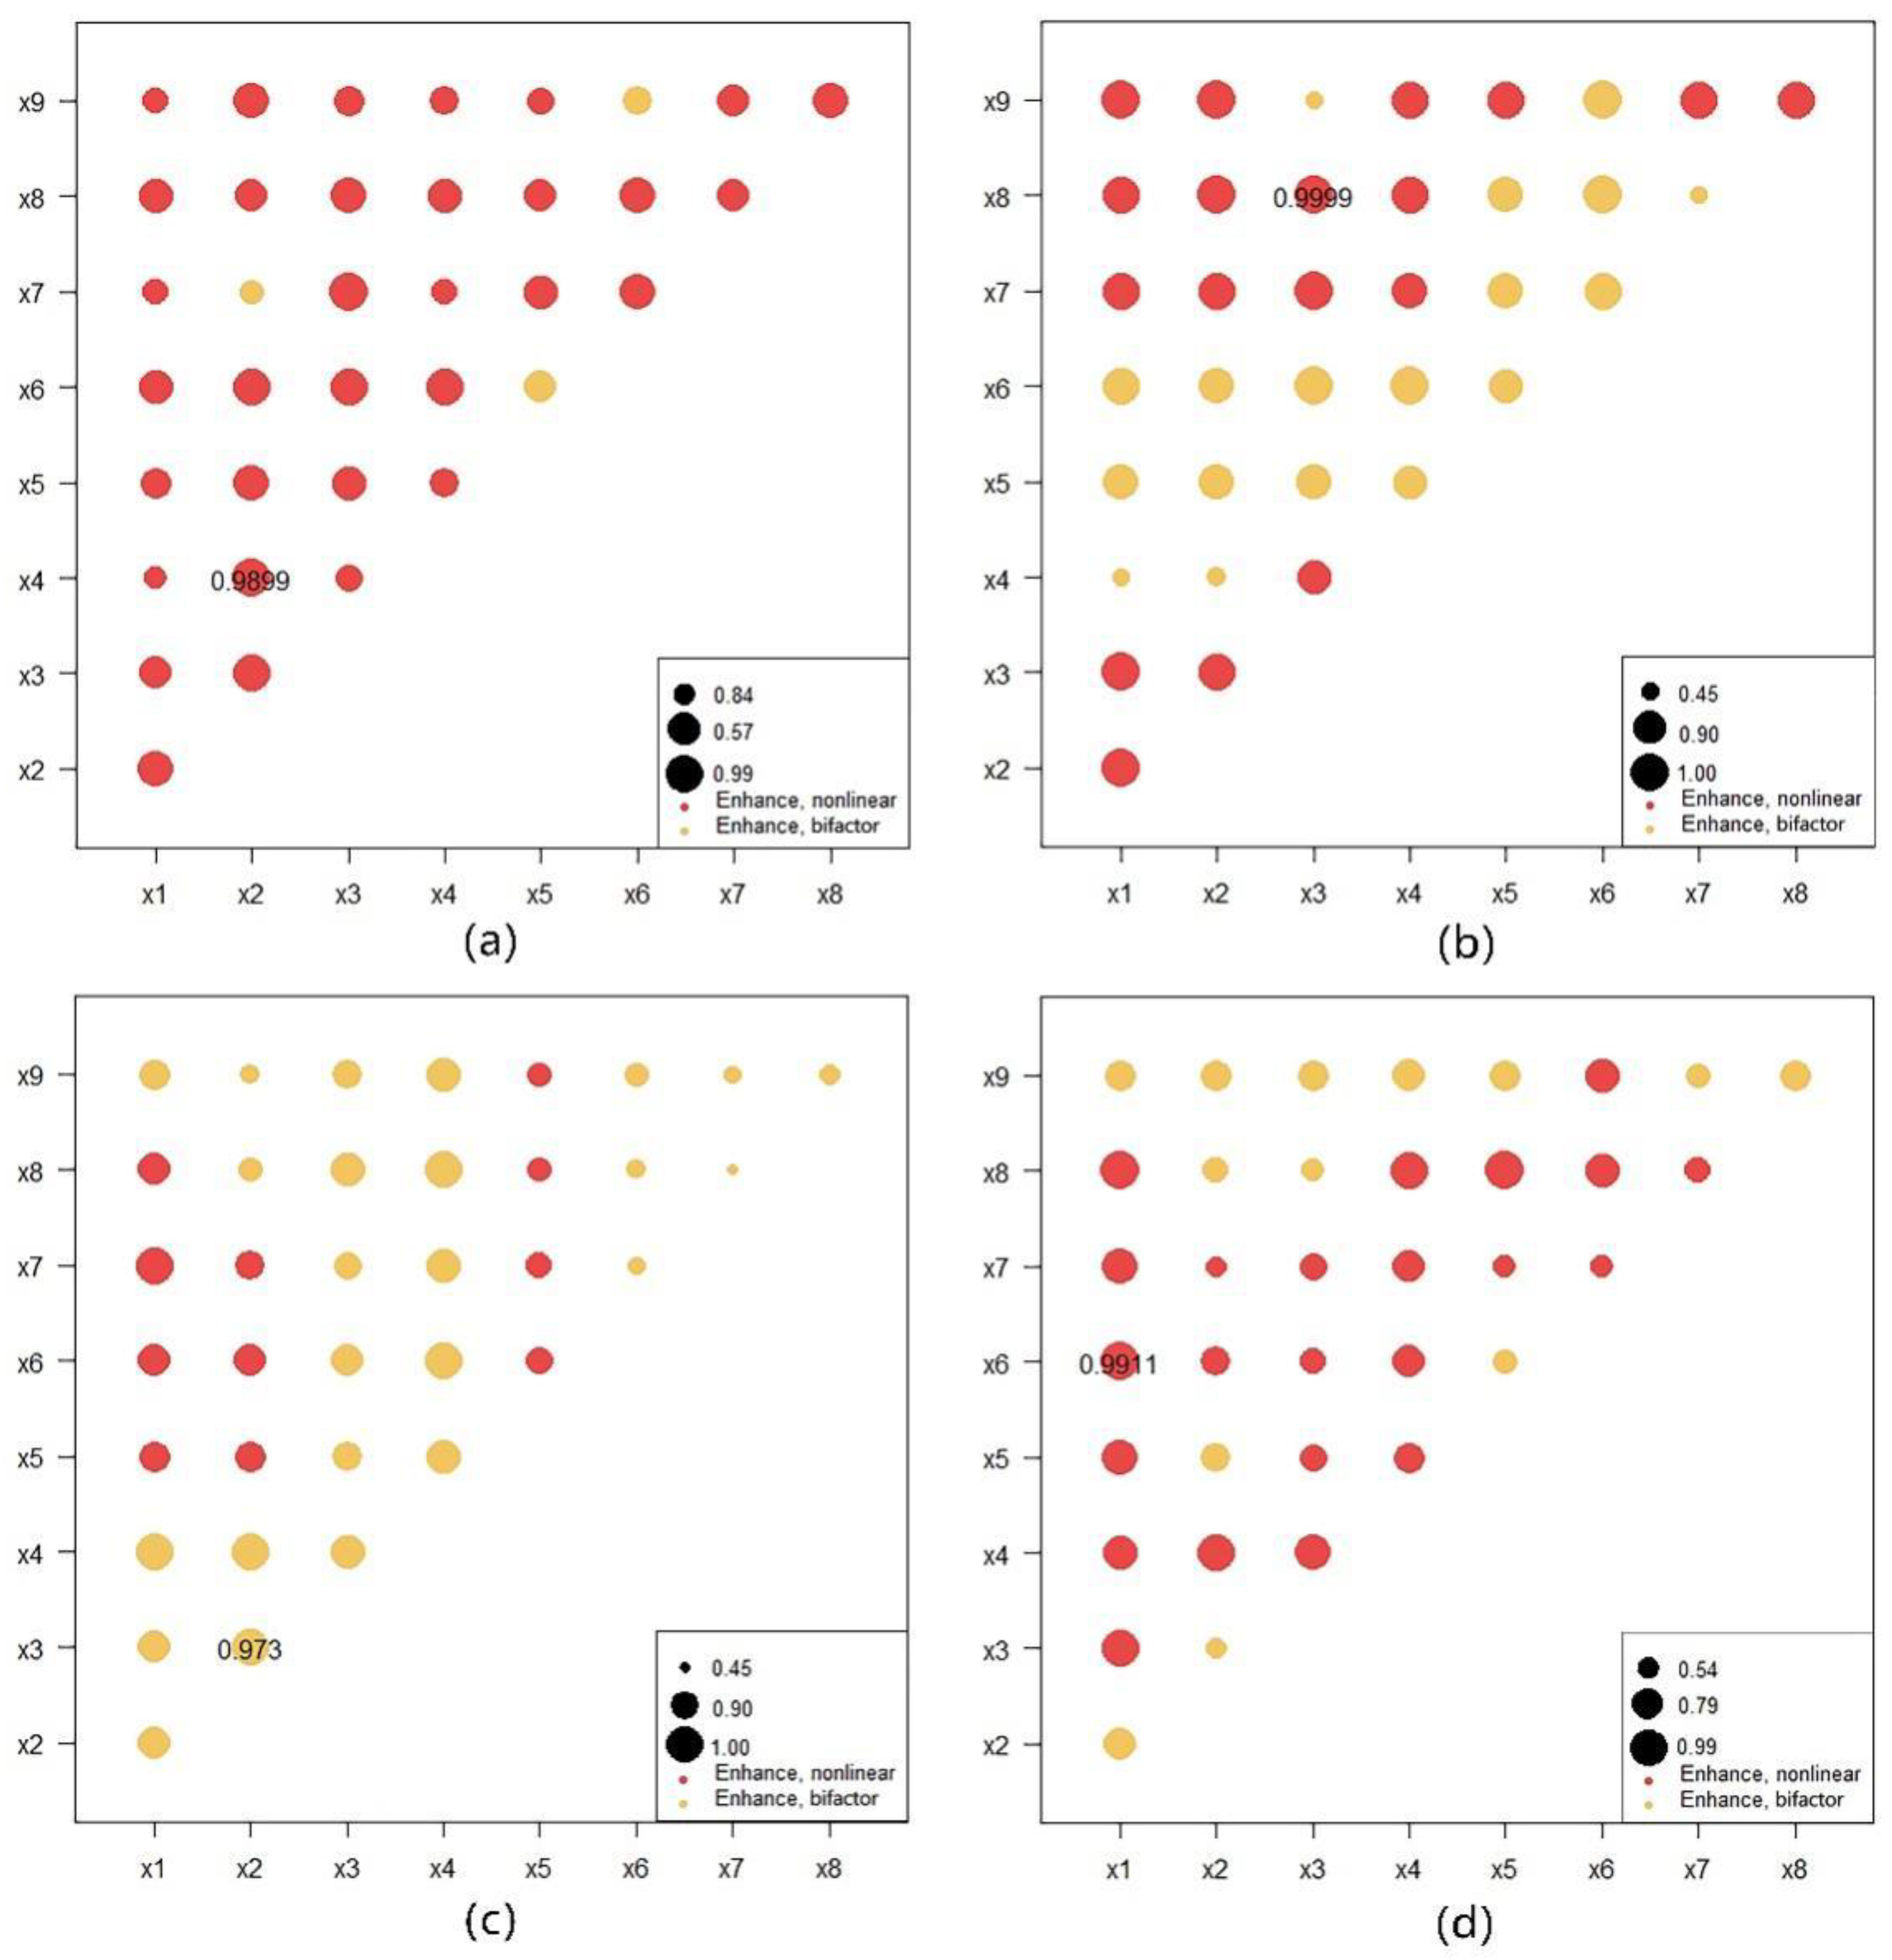
3.2.2. Driving Factor Interaction Detection

Since the spatio-temporal evolution of land use is not the result of single-factor action but by multiple factor interactions, it was necessary to obtain the factor interactions for four periods, 1980–1990, 1990–2000, 2000–2010, and 2010–2020, by interaction detection with the Parametric-Optimal Geodetector Model. The results showed that the interaction strength of the nine driving factors was greater than the single interaction strength of each factor, showing a non-linear enhancement and a bifactor enhancement effect and indicating that the land use pattern of resource-based cities in study area over 40 years resulted from the interaction of factors such as precipitation, temperature, population, and urbanization rate.
It can be seen from Figure 5, in the period 1980–1990, most of the interactions of land use change from forest land to cropland showed non-linear enhancement. Moreover, the non-linear enhancement factors with strong interactions were temperature–slope, precipitation–GDP, slope–precipitation, temperature–urbanization rate, slope–urbanization rate, and precipitation–urbanization rate. Population size–urbanization rate, urbanization rate–gross agricultural output value, and slope–GDP represent bifactor enhancement. It can be seen that population size and urbanization rate enhanced the explanatory power of each interaction in this period.
The interactions from 1990 to 2000 showed half non-linear enhancements and half bifactor enhancements. The non-linear enhancements with more substantial explanatory power were precipitation–gross industrial output value, precipitation–GDP, elevation–gross agricultural output value, elevation–precipitation, slope–gross agricultural output value, slope–gross industrial output value, etc. The bifactor enhancements with more substantial explanatory power were precipitation–urbanization rate, temperature–urbanization rate, urbanization rate–gross agricultural output value, urbanization rate–gross industrial output value, elevation–urbanization rate, and urbanization rate–GDP, etc. It can be seen that temperature, precipitation, urbanization rate, and population size enhanced the explanatory power of each interaction in this period.
The interaction presentation status of 2000–2010 was different from the first period, which was mostly bifactor-enhanced and less non-linear-enhanced. The interaction factors with reliable explanatory power were slope–precipitation, temperature–urbanization rate, temperature–gross industrial output value, elevation–temperature, slope–temperature, and temperature–agricultural, all of which were bifactor-enhanced. The non-linear factors with more substantial explanatory power were elevation–GDP, elevation–gross industrial output value, slope–urbanization rate, elevation–urbanization rate, elevation–population number, slope–population size, etc. It can be seen that temperature, precipitation, and urbanization rate enhanced the explanatory power of each interaction in this period.
The period 2010–2020 showed a relatively balanced state, where the non-linear enhancements with reliable explanatory power were elevation–urbanization rate, elevation–gross industrial output value, population size–gross industrial output value, temperature–gross industrial slope–temperature and elevation–precipitation. The bifactor enhancements with reliable explanatory power were elevation–slope, temperature–gross agricultural output value, elevation–gross agricultural output value, population size–gross agricultural output value, precipitation–gross agricultural output value, and gross industrial output value–gross agricultural output value, etc. Gross industrial and agricultural product, precipitation, and temperature in this period enhanced the explanatory power of each interaction.

4. Conclusions and Discussion

4.1. Conclusions

This paper integrated ArcGIS spatial analysis software and RStudio software and used land use dynamic attitude, Markov transfer matrix, and Parametric-Optimal Geodetector Model to explore the spatio-temporal evolution of land use and its driving mechanisms in resource-based cities in three northeastern provinces of China for 40 years. The main conclusions as follows:
(1) From the typical land use changes in the study area, the area of cropland increased obviously and positively, and its land use dynamics showed a trend of first increasing and then decreasing and then slowly increasing; the area of forest land decreased obviously and negatively, and its land use dynamics showed a trend of first decreasing and then increasing and then decreasing, and the two change trends were roughly axisymmetric. It can be understood that the transfer in of cropland was positively correlated with the transfer out of forest land to a certain extent, which was the same as the result of the study on land use change in the northern border zone of Heilongjiang. The increase in cropland area mainly came from forest land, grassland, and unused land, and the decrease in forest land area was mainly transferred out to cropland. Land use change was relatively smooth in the two periods of 1980–1990 and 2000–2010, and LUCC was in a relatively stable pattern.
(2) From the spatial distribution of typical land use changes in the study area, the most active areas of LUCC changes in the study area over 40 years were the northern border area and the eastern border area of China. The resource-based cities adjacent to the Russian region mainly showed the conversion of forest land to cropland and forest land to unused land, and the grassland in the region showed an apparent concentration of northward movement; and the resource-based cities adjacent to the Korean region mainly showed the conversion of forest land to cropland. All the cities in the study area showed different degrees of built-up land expansion.
(3) The explanatory power of the drivers in each period: the main drivers in 1980–1990 and 1990–2000 were urbanization rate and population size and they both belonged to the socio-economic factors; the strongest explanatory power drivers in 2000–2010 were precipitation and temperature and they were physical geography factors; and in 2010–2020, gross agricultural output value and elevation had the most muscular explanatory power.
(4) Driver interactions in each period: the strength of driver interactions varied among periods, and there were no independent drivers. Driver interactions from 1980 to 1990 mostly showed non-linear enhancements; in contrast, 2000–2010 driver interactions mostly showed bifactor enhancements; 1990–2000 and 2010–2020 driver interactions showed a relatively balanced situation of non-linear enhancements and bifactor enhancements.

4.2. Discussion

4.2.1. Compared with Other Studies in LULC

This study found that 1980–1990 and 1990–2000 both had significant increases in the cropland area. The main driving factors of both periods were the urbanization rate and the population. The large population was needed to provide labor resources during this period. For this purpose, cropland was needed to meet the orderly supply of food and to provide strong support for accelerated urbanization, indicating that food production had to meet the immediate needs of population growth during this period. The precipitation and the temperature increased significantly from 2000 to 2010, so the main driving forces during this period were no longer socio-economic factors but precipitation and temperature among natural geographic factors. During this period, the State Council proposed the policy of returning farmland to forest land and grass land, and the country introduced the strategy of revitalizing old industrial bases and the strategy of revitalizing northeast China, and the three northeastern provinces responded positively to the national call, which slowed down the increase in cropland significantly and reduced forest land and grass land slowly to different degrees. However, due to the severe winters in the three northeastern provinces, the rural areas need to burn coal for heating, and due to the presence of large areas of straw burning and high-density industrial production, the accumulation of greenhouse gases in the region has increased, thus affecting the spatio-temporal evolution of land use patterns in the region.
This is consistent with the results of the study of LULC in the northern zone of China by Dan Liu and Junfeng Tian et al. Meanwhile, the findings of this study confirm the findings from the LULC perspective from those of Dan Cui and Jianying Zhao et al., that urbanization and economic modernization in resource-based cities are the core factors leading to the LULC transformation. The difference is that there is no new research related to LULC about resource-based cities in whole Northeast China, and this study fills the gap of LULC research in resource-based cities.

4.2.2. Implications, Limitations, and Future Study

The time series selected in this paper coincided with the forty years of reform and opening up of China, and it can be seen that China’s economy has developed significantly over the past forty years. At the beginning of reform and opening up, the three northeastern provinces relied on their resource advantages to support their initial development stage. With the depletion of resources and the introduction and popularization of ecological civilization, China introduced a series of policies for the protection of resources and the development planning of resource-based cities in northeast China, which led to a new stage of planning and adjustment of the land structure of each city.
In response to the above analysis, differentiated land conservation strategies could be adopted to ensure that land use is scientific and reasonable to guarantee the sustainable development of land resources. In this regard, this paper makes up for the research on the spatio-temporal evolution of land use in resource-based cities with a long time series and on a large scale, but due to the difficulties in data acquisition and the limitation of article length, the study of LULC in the whole area of three northeastern provinces could not be conducted. A study of the spatio-temporal evolution of land use in the whole region of Northeast China should be conducted, and the research results could be compared and analyzed with the results of this study to further explore the characteristics, evolution patterns, influencing factors, and coupling between resource-based cities and non-resource-based cities in the region of Northeast China. Finally, this research could provide strong support for the transformation of global resource-based cities as well as high-quality development.

Author Contributions

Conceptualization, methodology, data curation, formal analysis, writing—original draft preparation, Y.P.; writing—review and editing, visualization, supervision, Q.L.; project administration and funding acquisition, Y.Z. All authors have read and agreed to the published version of the manuscript.

Funding

This research was funded by the Ministry of Education in 2020 for the Late Stage of Philosophical and Social Science Research: A Synergistic Study on Undertaking Industrial Transfer, Resource and Environmental Carrying Capacity and Territorial Spatial Pattern, grant number 20JHQ013; Capital University of Economics and Business for Postgraduate Students with Academic Degrees in Science and Technology Innovation Project; Capital University of Economics and Business Young Academic Innovation Team Project (QNTD202209).

Institutional Review Board Statement

Not applicable.

Conflicts of Interest

The authors declare no conflict of interest.

References

  1. Meng, Q.; Zhang, L.; Wei, H.; Cai, E.; Dong, X. Spatio-temporal evolution of the supply and demand risk of ecosystem services in the Yihe River Basin based on LUCC. Acta Ecol. Sin. 2022, 5, 2033–2049. [Google Scholar] [CrossRef]
  2. Liu, B.; Pan, L.; Qi, Y.; Guan, X.; Li, J. Land Use and Land Cover Change in the Yellow River Basin from 1980 to 2015 and Its Impact on the Ecosystem Services. Land 2021, 10, 1080–1103. [Google Scholar] [CrossRef]
  3. Albert, C.H.; Herve, M.; Fader, M.; Bondeau, A.; Leriche, A.; Monnet, A.C.; Cramer, W. What ecologists should know before using land use/cover change projections for biodiversity and ecosystem service assessments. Reg. Environ. Change 2020, 3, 1–12. [Google Scholar] [CrossRef]
  4. Vadrevu, K.; Ohara, T. Focus on land use cover changes and environmental impacts in South/Southeast Asia. Environ. Res. Lett. 2020, 15, 201–205. [Google Scholar] [CrossRef]
  5. Li, L.; Zhou, S.; Zhou, B.; Dai, L.; Chang, T.; Bao, G.; Zhou, H.; Zhi, L. Land use transformation and its eco-environmental response in process of the regional development: A case study of jiangsu province. Sci. Geogr. Sin. 2013, 33, 1442–1449. [Google Scholar] [CrossRef]
  6. Bao, J.; Gao, S.; Ge, J. Dynamic land use and its policy in response to environmental and social-economic changes in China: A case study of the Jiangsu coast (1750–2015). Land Use Policy 2019, 80, 169–180. [Google Scholar] [CrossRef]
  7. Li, D.; Zhou, J.; Zhan, D. Spatial and temporal changes and driving factors of cropland in Heilongjiang Province. Sci. Geogr. Sin. 2021, 41, 1266–1275. [Google Scholar] [CrossRef]
  8. Liu, D.; Li, L. Spatiotemporal change and driving factors of land use in the northern border transect of China,1995–2015. Resour. Sci. 2021, 43, 1208–1221. [Google Scholar] [CrossRef]
  9. He, C.; Zhang, J.; Liu, Z.; Huang, Q. Characteristics and progress of land use/cover change research during 1990–2018. Acta Geogr. Sin. 2021, 76, 2730–2748. [Google Scholar] [CrossRef]
  10. Global Land Project (GLP). Science Plan and Implementation Strategy; IGBP Secretariat: Stockholm, Sweden, 2005. [Google Scholar]
  11. Ferreira, I.J.M.; Bragion, G.D.; Ferreira, J.H.D.; Benedito, E.; Couto, E.V. Landscape pattern changes over 25 years across a hotspot zone in southern brazil. South. For. J. For. Sci. 2019, 1, 175–184. [Google Scholar] [CrossRef]
  12. Couto, E.V.; Oliveira, P.B.; Vieira, L.M.; Schmitz, M.H.; Ferreira, J.H.D. Integrating Environmental, Geographical and Social Data to Assess Sustainability in Hydrographic Basins: The ESI Approach. Sustainability 2020, 7, 3054–3072. [Google Scholar] [CrossRef] [Green Version]
  13. Faichia, C.; Tong, Z.; Zhang, J.; Liu, X.; Al-Shaibah, B. Using rs data-based ca-markov model for dynamic simulation of historical and future lucc in vientiane, laos. Sustainability 2020, 20, 8410–8419. [Google Scholar] [CrossRef]
  14. Meneses, B.M.; Reis, E.; Pereira, S.; Vale, M.J.; Reis, R. Understanding Driving Forces and Implications Associated with the Land Use and Land Cover Changes in Portugal. Sustainability 2017, 3, 351–370. [Google Scholar] [CrossRef] [Green Version]
  15. Lu, X.; Shi, Y.; Chen, C. Monitoring cropland transition and its impact on ecosystem services value in developed regions of China: A case study of Jiangsu Province. Land Use Policy 2017, 69, 25–40. [Google Scholar] [CrossRef]
  16. Li, K.M.; Feng, M.; Biswas, A.; Su, H.; Niu, Y.; Cao, J. Driving Factors and Future Prediction of Land Use and Cover Change Based on Satellite Remote Sensing Data by the LCM Model: A Case Study from Gansu Province, China. Sensors 2020, 20, 2757–2777. [Google Scholar] [CrossRef]
  17. Shi, G.; Ye, P.; Ding, L.; Quinones, A.; Li, Y.; Jiang, N. Spatio-Temporal Patterns of Land Use and Cover Change from 1990 to 2010: A Case Study of Jiangsu Province, China. Int. J. Environ. Res. Public Health. 2019, 16, 907–926. [Google Scholar] [CrossRef] [Green Version]
  18. Li, Y.; Yang, F.; Yang, L.; Shang, X.; Hu, G.; Jia, L. Spatial pattern changes and influencing factors of land use in Yulin City in the past 40 years. Arid Land Geogr. 2021, 44, 1011–1021. [Google Scholar] [CrossRef]
  19. Li, Y.; Niu, L.; Zhao, Q. Analysis of land use/cover change in Fushun mining area from 1989 to 2019. Sci. Surv. Mapp. 2021, 46, 96–104. [Google Scholar] [CrossRef]
  20. Huang, H.; Zhou, Y.; Qian, M.; Zeng, Z. Land Use Transition and Driving Forces in Chinese Loess Plateau: A Case Study from Pu County, Shanxi Province. Land 2021, 10, 1–15. [Google Scholar] [CrossRef]
  21. Guo, F.; Tong, L.; Qiu, F.; Li, Y. Spatio-temporal differentiation characteristics and influencing factors of green development in the eco-economic corridor of the Yellow River Basin. Acta Geogr. Sin. 2021, 76, 726–739. [Google Scholar] [CrossRef]
  22. Luan, C.; Liu, R.; Peng, S. Land-use suitability assessment for urban development using a GIS-based soft computing approach: A case study of Ili Valley, China. Ecol. Indic. 2021, 123, 107333. [Google Scholar] [CrossRef]
  23. Fernandez-Nogueira, D.; Corbelle-Rico, E. Land Use Changes in Iberian Peninsula 1990-2012. Land 2018, 7, 99–111. [Google Scholar] [CrossRef] [Green Version]
  24. Chen, C.; Bi, L.; Zhu, K. Study on Spatial-Temporal Change of Urban Green Space in Yangtze River Economic Belt and Its Driving Mechanism. Int. J. Environ. Res. Public Health 2021, 18, 12498–12518. [Google Scholar] [CrossRef] [PubMed]
  25. Zhang, G.; Liu, J.; Zhang, Z. Spatial-temporal Changes of Cropland in China for the Past 10 Years Based on Remote Sensing. Acta Geogr. Sin. 2003, 3, 323–332. [Google Scholar] [CrossRef]
  26. Wang, W.; Cao, Y.; Su, R.; Song, L.; Zhuang, Y.; Zhou, W. Driving Forces of cropland Change in China-Driving factors and Driving Mechanism. Chin. J. Agric. Res. Reg. Plan. 2020, 41, 21–30. [Google Scholar] [CrossRef]
  27. Zhang, R.; Liu, W.; Song, Z. Spatio-temporal evolution and driving factors of national development zones of China based on geodetectors. J. Nat. Resour. 2021, 36, 2672–2683. [Google Scholar] [CrossRef]
  28. Han, H.; Wang, X.; Niu, L.; Liang, X.; Jiang, X.; Tan, Z. The land-use and land-cover change characteristics and driving forces of cropland in Central Asian countries from 1992 to 2015. Chin. J. Eco-Agric. 2021, 29, 325–339. [Google Scholar] [CrossRef]
  29. Tian, J.; Wang, B.; Wang, S. Land Use Transition in Northeast China: Features Measurement and Mechanism Exploration. Econ. Geogr. 2020, 40, 184–195. [Google Scholar] [CrossRef]
  30. Wang, M.; Shi, W. Spatial-Temporal Changes of Newly cropland in Northern China and Its Zoning Based on Driving Factors. Sci. Agric. Sin. 2020, 53, 2435–2449. [Google Scholar] [CrossRef]
  31. Li, J.; Dong, S.; Li, Y.; Yang, Y. The pattern and driving factors of land use change in the China-Mongolia-Russia economic corridor. Geogr. Res. 2021, 40, 3073–3091. [Google Scholar] [CrossRef]
  32. Cui, D.; Bu, X.; Xu, Z.; Li, G.; Wu, D. Comprehensive evaluation and impact mechanism of high-quality development of China’s resource-based cities. Acta Geogr. Sin. 2021, 76, 2489–2503. [Google Scholar] [CrossRef]
  33. Zhao, Y. A Research Review and Prospect on the Transformation and Development. On Econ. Probl. 2021, 11, 17–25. [Google Scholar] [CrossRef]
  34. Che, X.; Li, C. Spatial Distribution Characteristics of Land Intensive Use and Driving Factors of Resource-based Cities in Northeast China. Resour. Dev. Mark. 2014, 30, 1320–1323. [Google Scholar] [CrossRef]
  35. Huang, Y.; Fang, Y.; Gu, G.; Liu, J. The Evolution and Differentiation of Economic Convergence of Resource-based Cities in Northeast China. Chin. Geogr. Sci. 2018, 28, 495–504. [Google Scholar] [CrossRef] [Green Version]
  36. Wang, Y. Development characteristics, influencing mechanism and coping strategies of resource-based cities in developing countries: A case study of urban agglomeration in Northeast China. Environ. Sci. Pollut. Res. 2022, 29, 25336–25348. [Google Scholar] [CrossRef]
  37. Wen, B.; Pan, Y.H.; Zhang, Y.; Liu, J.; Xia, M. Does the Exhaustion of Resources Drive Land Use Changes? Evidence from the Influence of Coal Resources-Exhaustion on Coal Resources-Based Industry Land Use Changes. Sustainability 2018, 10, 2698–2711. [Google Scholar] [CrossRef] [Green Version]
  38. Song, Y.; Wang, J.; Ge, Y. An optimal parameters-based geographical detector model enhances geographic characteristics of explanatory variables for spatial heterogeneity analysis: Cases with different types of spatial data. GIS Sci. Remote Sens. 2020, 57, 593–610. [Google Scholar] [CrossRef]
  39. Zhang, R.; Chen, Y.; Zhang, X.; Fang, X.; Ma, Q.; Ren, L. Spatial-temporal Pattern and Driving Factors of Flash Flood Disasters in Jiangxi Province Analyzed by Optimal Parameters-Based Geographical Detector. Geogr. Geo-Inform. Sci. 2021, 37, 72–80. [Google Scholar] [CrossRef]
  40. Wang, J.; Xu, C. Geodetector: Principle and prospective. Acta Geogr. Sin. 2017, 72, 116–134. [Google Scholar] [CrossRef]
  41. Document of the State Council the notice of the State Council on the Issuance of the National Sustainable Development Plan for Resource-based Cities (2013–2020). Available online: http://www.gov.cn/zfwj/2013-12/03/content_2540070.htm (accessed on 15 April 2022).
Figure 1. Location of the resource-based cities of the three northeastern provinces in China.
Sustainability 14 13683 g001
Figure 2. The dynamic attitude changes trend of forest land and cropland.
Sustainability 14 13683 g002
Figure 3. Spatial distribution of land use and typical land use conversion in the study area. Notes: CL, FL and UL represent cropland, forest land and unused land, respectively; (ae), represent the land use classification of 1980, 1990, 2000, 2010, and 2020, (f), represent the typical land use conversion of 1980–2020.
Sustainability 14 13683 g003
Figure 4. Grading of land use dynamic attitude change in the study area.
Sustainability 14 13683 g004
Figure 5. Results of driving factor interaction detection from different periods. Notes: (ad), represent the period of 1980–1990, 1990–2000, 2000–2010, and 2010–2020.
Sustainability 14 13683 g005
Table 1. The three northeastern provinces’ resource-based cities.
ProvincePrefectural Districts
Liaoning ProvinceFuxin City, Fushun City, Benxi City, Anshan City, Panjin City, Huludao City
Jilin ProvinceSongyuan City, Jilin City, Liaoyuan City, Tonghua City, Baishan City,
Yanbian Korean Autonomous Prefecture
Heilongjiang ProvinceHeihe City, Daqing City, Yichun City, Hegang City, Shuangyashan City, Qitaihe City, Jixi City, Mudanjiang City, Daxinganling Area
Table 2. Land use change index over the study area from 1980 to 2020 (km2).
YearLand Use Type
CLFLGLWBBLUL
1980Area(km2)105,888283,90035,32011,285831724,429
Percentage%22.5760.527.532.411.775.21
2020Area(km2)129,588262,57919,840967611,78035,676
Percentage%27.6255.974.232.062.517.60
Single land use
dynamic attitude/%
0.56−0.19−1.10−0.361.041.15
Notes: CL, FL, GL, WB, CL, and UL represent Cropland, Forest Land, Grassland, Water Bodies, Built-up Land, and Unused land.
Table 3. Transfer matrix of land use from 1980 to 2020.
Year/
Land Use Type km2
2020
CLFLGLWBBLULTotal
1980CL76,68415,5602309172265043109105,888
FL26,736229,17710,0081408174214,829283,900
GL964812,8135273525527653435,320
WB207810884504887291249111,285
BL454188816618523062318317
UL990130531634949410848224,429
Total129,588262,57919,840967611,78035,676469,139
Notes: CL, FL, GL, WB, CL, and UL represent Cropland, Forest Land, Grassland, Water Bodies, Built-up Land, and Unused land.
Table 4. Typical land use changes from 1980 to 2020.
Land Use ChangeTransfer-OutChange Area/hm2PercentageLand Use ChangeTransfer-inChange Area/hm2Percentage
Forest land transfer-outCL26,7365.70cropland transfer-inFL27,6365.70
GL10,0082.13GL96482.06
WB14080.30WB20780.44
BL17420.37BL45410.97
UL14,8293.16UL99012.11
Notes: CL, FL, GL, WB, CL, and UL represent Cropland, Forest Land, Grassland, Water Bodies, Built-up Land, and Unused land.
Table 5. Land use change index in different periods.
Land Use
Type
1980–19901990–20002000–20102010–2020
Area Change
/hm2
Single-
Motion Attitude/%
Area Change
/hm2
Single-
Motion Attitude/%
Area Change
/hm2
Single-
Motion Attitude/%
Area Change
/hm2
Single-
Motion Attitude/%
CL61450.5813851.1115860.1335870.28
FL−1929−0.07−4045−0.25−1170−0.04−11,185−0.41
GL−2606−0.74−4652−1.4210830.39−9304−3.19
WB2560.23−432−0.37−238−0.21−1199−1.10
BL5850.7013371.50−862−0.8424032.56
UL−2461−1.01−1593−0.72−399−0.2015,6987.86
Notes: CL, FL, GL, WB, CL, and UL represent Cropland, Forest Land, Grassland, Water Bodies, Built-up Land, and Unused land.
Table 6. Results of the detection of driving factors in different periods.
PeriodExplanation ValuePhysical Geographic DriversSocio-Economic Drivers
X1X2X3X4X5X6X7X8X9
1980–1990q0.1460.4080.3370.1880.4370.5210.3570.2880.270
1990–2000q0.3660.3330.3540.1730.8210.8820.1770.3160.132
2000–2010q0.5230.4640.6750.8490.1260.2790.1900.2470.379
2010–2020q0.4600.4060.2180.3340.3930.2810.1300.4180.569
Note: X1 is Slope; X2 Elevation; X3 is Precipitation; X4 is Temperature; X5 is Population size; X6 is Urbanization rate; X7 is GDP; X8 is Gross industrial output value; X9 is Gross agricultural output value.
Publisher’s Note: MDPI stays neutral with regard to jurisdictional claims in published maps and institutional affiliations.

