Article

An Analysis of Renewable Energy Technology Integration Investments in Malaysia Using HOMER Pro

by
Muhammad Aqil Afham Rahmat
1,
Ag Sufiyan Abd Hamid
2,*,
Yuanshen Lu
3,
Muhammad Amir Aziat Ishak
1,
Shaikh Zishan Suheel
1,
Ahmad Fazlizan
1 and
Adnan Ibrahim
1,*
1
Solar Energy Research Institute, Universiti Kebangsaan Malaysia, Bangi 43600, Selangor, Malaysia
2
Faculty of Science and Natural Resources, Universiti Malaysia Sabah, Kota Kinabalu 88400, Sabah, Malaysia
3
Faculty of Engineering, Architecture and Information Technology, The University of Queensland, St Lucia, QLD 4072, Australia
*
Authors to whom correspondence should be addressed.
Sustainability 2022, 14(20), 13684; https://doi.org/10.3390/su142013684
Submission received: 25 September 2022 / Revised: 11 October 2022 / Accepted: 19 October 2022 / Published: 21 October 2022

Abstract

:
Renewable energy systems are technologies that can generate electricity from solar, wind, hydroelectric, biomass, and other renewable energy resources. This research project aims to find the best renewable energy technology combinations for several scenarios in Malaysia. The strategies are analysed by evaluating the investments in the renewable energy systems in each of the decided scenarios in Malaysia, Pekan, Pahang and Mersing, Johor, using HOMER Pro software. The finding shows that the PV–wind hybrid system has a better net present cost (NPC) than the other systems for both scenarios, which are USD −299,762.16 for Scenario 1 and USD −642,247.46 for Scenario 2. The PV–wind hybrid system has 4.86-year and 2.98-year payback periods in Scenarios 1 and 2. A combination of RE technologies yielded fewer emissions than one kind alone. The PV–wind hybrid system provides a quicker payback period, higher money savings, and reduced pollutants. The sensitivity results show that resource availability and capital cost impact NPC and system emissions. This finding reveals that integrated solar and wind technologies can improve the economic performance (e.g., NPC, payback period, present worth) and environmental performance (e.g., carbon dioxide emissions) of a renewable energy system.

1. Introduction

Renewable energy, energy efficiency, and electrifying end-uses reduce emissions by 94% [1]. Clean renewable energy is a good alternative to fossil fuels since it can be used globally. Renewable energy sources include hydropower, wind, solar, and biomass [2]. The sources of natural gas in Malaysia will be depleted in 70 years as predicted by experts. The expectation is also that oil consumption rates will decrease for about 16 years. The Malaysian government is working on creating a significant change in its energy policy due to the awareness of energy security and climate change [3]. The Malaysian Ministry of Energy and Natural Resources (KeTSA) set a target of 31% RE share in the national installed capacity mix by 2025. Hence, the Malaysian Renewable Energy Roadmap (MyRER) has been commissioned to create a national strategic plan to guide renewable energy policy in Malaysia for the development toward the RE share target of 31% in the national capacity mix in 2025 and to aid the further transition to a low-carbon electricity sector through the 2035 milestone [4]. Malaysia also plans to decrease the greenhouse gas (GHG) emission concentration level of the Gross Domestic Product (GDP) by up to 45% by 2030, referring to 2015 numbers [5].
In Malaysia, primarily solar energy, such as solar photovoltaics (PV), is used to replace conventional energy. The main issue is that the feasibility of a solar PV system does not depend on its upfront costs, maintenance costs, and grid tariff policy only but is also restricted by several factors such as irradiation characteristics, land utilization, and options for renewable energy technologies. All of these factors will contribute to the payback period of the system. Therefore, a good combination of RE technologies is essential to improving their performance, developing methods for precisely forecasting their electricity generation, and combining them with other traditional generating sources in a reliable manner.
Even though there are several studies analysing the technical, economic, and environmental impacts of renewable energy use, an extensive study of the investment aspects of payback duration, net present cost (NPC), and present value concerning environmental factors are pretty demanding.
The primary purpose of this research project is to study the best strategies in renewable energy technology combinations for several scenarios in Malaysia by evaluating the investment strategies for solar technology, wind technology, and hybrid technology of wind and solar in Malaysia. The following are the contributions of this study:
  • This study provides an investment analysis of the economic aspects, primarily on NPC, present value, and payback period, as well as the environmental aspect, mainly on carbon dioxide emissions.
  • The situation of renewable energy in Malaysia and renewable energy scenarios in various countries is reviewed.
  • A comprehensive study is conducted of hybrid systems that comprise photovoltaic panels and wind turbines with battery storage.
  • A sensitivity analysis of hybrid renewable energy systems is conducted based on resource availability and capital cost parameters.

1.1. The Status of Renewable Energy in Malaysia

Renewable energy systems are technologies that can generate electricity from solar, wind, hydroelectric, biomass, and other renewable energy resources. These technologies are significant in providing energy resource options most efficiently.
The development potential of renewable energy varies from country to country. There are several strategies for utilizing a country’s renewable energy resources. In a continental country like Brazil, where energy production factors vary by area, states with wind potential may support this industry via regional industrial policies (IPs) that supplement national policies [6]. The interviews by Ahmed M. A. Mohamed et al. show that energy costs in Libya are lower than globally. Local investments demand more extended payback periods [7].
Qiang Wang et al. studied China and India found that the correlations between income growth, rising energy demand, and technological development (declining energy intensity) can help address increasing energy use in both nations [8]. Wadim Strielkowski et al. [9] reviewed that the shift to renewable energy is one of the most significant parts of Russia’s modernization. The empirical findings of Chor Foon Tang et al. for India showed support for the tourism-led growth hypothesis, whereas the energy-led growth hypothesis was rejected [10]. Finally, Mita Bhattacharya et al. researched the impact of renewable energy use on economic growth in various countries [11]. According to long-run production elasticities, renewable energy usage boosts economic output in 57% of the selected nations.
Utilizing other resources can provide access to a location with difficulty with power cables, such as rural and remote areas [12]. These technologies can also be applied to urban areas for optimum renewable energy performance. The electricity consumption in urban and rural areas is quite different. Energy demand functions have been predicted as the tariff function, real GDP, price of gas, and the populations in rural and urban regions. Electricity utilization in urban areas is much higher than in rural areas due to the higher population and higher exposure to electrical equipment and facilities [13]. The population of Malaysia in 2021 has been estimated at 32.7 million, which is 0.2% of the annual growth rate. The growth rate of noncitizens has decreased from 3 million to 2.7 million due to the spread of the COVID-19 pandemic. Meanwhile, the growth rate of citizens showed a stable increase of 1% population from 29.7 million in 2020 to 30 million in 2021 [14].
Malaysia is one of the ideal locations for solar energy generation [3]. Solar energy is the most suitable for use in Malaysia due to its location [15], which is situated in the equatorial region and receives massive solar radiation of 400–600 MJ/m2 per month [5,16]. Separately, just one square meter of PV module is enough to produce 150 W of power [17]. From here, such a country appears to be perfect for investing in and utilizing solar energy. Moreover, Malaysia has excellent prospects for growing small businesses as it will open more paths to generating electricity from solar PV and thermal technology [18]. From the perspective of irradiation analysis, the amount of insolation received by Malaysia ranges from 1400 kWh/m2 to 1900 kWh/m2, with an average of 1643 kWh/m2 per year because of having more than ten sun hours per day. According to Muhammad-Sukki et al., installing 1 kWp panels with a space of 431 km2 could meet Malaysia’s power demand in 2005 [19].
In addition to solar energy, the government also has included wind energy as another option for national energy and intends to build wind turbines mainly on the east coasts. Based on several studies and data from Malaysia Meteorological Department (MMD), Kuala Terengganu and Mersing, Johor, located in Peninsular Malaysia, has the highest wind potential region. In contrast, Kudat, Sabah, has the highest wind speed in East Malaysia [5,20]. Although the availability of wind energy in Malaysia is quite limited compared with other countries such as Denmark and Australia, some locations are discovered to have high wind speeds at a certain time, specifically during monsoon. Therefore, there is still an opportunity to generate wind energy as the fastest wind speed varies between 6 and 12 m/s [21].
A national wind mapping will upgrade the research on wind energy implementation [22]. Wind energy in Malaysia for onshore locations could generate up to 1.5 MW, but the government is currently assessing the prospect of onshore wind energy to determine the feasibility of wind energy in the feed-in-tariff (FiT) mechanism with other types of RE resources [5]. However, the offshore wind energy prospect has still not been tapped by the government. The example of two worthless wind energy projects in Perhentian Island and Swallow Reef and Perhentian Island proved that it is quite challenging to install wind turbines without suitable assessments [5,21].
The availability of renewable energy needs to be utilized efficiently to reduce CO2 emissions and improve energy efficiency in Malaysia [23]. Moreover, the implication will meet the Malaysian goal of reducing the greenhouse gas (GHG) emission level of the gross domestic product (GDP) by up to 45% by 2030 [5]. A comprehensive RE strategy must be implemented because it takes several years to replace one form of primary energy and a century to obtain 50% market penetration [24]. Additional incentive programmes and a new R&D direction in renewable energy should be considered to support the potential area of research and increase the rate of renewable energy implementation in Malaysia [25].
In rural and urban regions, citizens in Malaysia have an appropriate level of awareness regarding renewable energy. However, renewable energy costs are quite high, making them unaffordable for middle-class or low-income families [26]. Energy utilization in urban and rural regions is quite different due to several factors, such as population density, cultural life, and geographical location. The population in Malaysia is nearly 71.3% in the urban regions, while in the rural areas, it is about 28.7% [27].
The National Electricity Board in Malaysia has implemented the PV system for rural electrification since 1980. Furthermore, the Ministry of Rural Development has supplied PV systems for rural electrification since late 1990 [28]. The limitation of wind resources is one of the challenges of using wind energy in Malaysia. However, the issue of limited wind resources can be solved by using a hybrid system by integrating a few wind turbines with solar panels or diesel generators, such as in Sabah and Sarawak. Hybrid solar–PV diesel and wind–PV hybrid systems are cost-effective, environmentally friendly, low-maintenance alternative power solutions for electrifying off-grid rural areas [28,29].
In general, Sarawak and Sabah are the two states in Malaysia with the lowest concentration of poor people and the smallest electricity coverage, and in turn have the highest potential for renewable energy utilization. Solar energy and hydropower have the most potential among renewable energy sources [27]. Due to that, the hybrid technology of RE is being included in the electrification project in the rural areas in Malaysia to decrease GHG emissions and increase energy demand [28]. A stand-alone microgrid system with fully renewable energy technology and hybrid energy storage can be utilized in rural areas, especially in remote areas or on islands [30], to supply electricity generation to the community [31]. The tropical islands in Malaysia have a high potential for solar energy, but they must be combined with other renewable energy sources to form a hybrid system [30]. In Mersing, Malaysia, citizens appreciated the use of RE in remote regions and were persuaded of the potential for RE development as an alternative energy source in remote areas [14,29,30,32].
According to data from Shafie et al., the population of Malaysia, which is 25.4 million, 75% of its population will stay in urban areas by the year 2020, and the population will have doubled twice since 1980 [24]. The multiple regression analysis results from Alam et al. [33] revealed that several factors, perceived ease of use, awareness, perceived behavioural control, relative advantage, and cost reduction, have substantial impacts on small-scale renewable energy usage intention in the house-holds area.
Solar and wind energy are the highest potential renewable resources for urban areas. Hybrid renewable energy systems, such as wind–solar hybrid renewable energy generation systems with rainwater collection applications, are suitable for urban high-rise utilization. This design is ideal for large-scale systems and cost-effective construction of downtown skyscrapers in urban locations [32,33]. Solar energy can increase socioeconomic well-being and improve the green potential for Malaysia’s urban residents and the energy industry [34]. The usage of advanced technology in solar, such as hybrid photovoltaic thermal (PV/T) collector solar absorption cooling systems in large buildings, can create colossal money savings for an extended period [35]. Meanwhile, wind energy can be used as an alternative resource to overcome the limitations of utilizing solar energy in urban areas.
Green technology, such as solar, hydro, and wind, is suitable for optimizing renewable energy and maintaining a healthy environment. Therefore, green agendas in the growth of green technology and raising awareness are expected to reach all Malaysians to adopt a green culture for future generations [36]. One of the driving factors of the growth of green technology is the involvement of banks that created opportunities to finance RE projects. Thus, it leads to an increase in the adoption of RE technologies in Malaysia [37]. Other factors contributing to the development of renewable energy in Malaysia are project funding, investment by the government, environmental levies, and obstacles and risks for green investment [38].
This research will use two types of RE technology: solar photovoltaics (PV) and wind turbines. It can be seen that solar and wind are good alternative resources in Malaysia, but the main problem that the country is subject to the unpredictability of climate change. Due to that, hybrid RE technology can solve these issues.
A photovoltaic wind–battery system is a cost-effective hybrid renewable energy system in rural communities [39]. Adding battery storage to the hybrid renewable energy system in rural areas significantly impacts the system’s technical, economic, and environmental performance [40].
The hybrid RE of solar and wind for low wind speed areas could be solved with small wind turbines to provide additional energy for the hybrid system for most locations disturbed by cloudy in the rainy seasons for solar utilization [41]. The use of hybrid renewable energy resources has several advantages, including lower levelized cost of energy (LCOE), lower greenhouse gas (GHG) emissions, and the allocation of electricity to remote rural areas via distributed generation and microgrids [42]. Other than that, the hybrid renewable energy system will help investors stop using conventional resources and invest in renewable energy due to increasing electricity use [43,44].
The decision to install solar photovoltaic (PV) panels is environmentally and financially beneficial. However, since solar installation is capital-intensive, financial justifications frequently precede environmental arguments. The feasibility of solar PV installation can be analysed by calculating the simple payback period (SPB), as it can be used to calculate the duration between initial capital cost and investment return on solar PV. Energy payback period (EPB) can also be used to know the installation merits of the PV system as an investment strategy [45].
In addition to payback period, financial feasibility can also be assessed by calculating the return on investment (ROI). In Malaysia, the SPB and ROI are calculated depending on the net energy metering (NEM) schemes and feed-in tariff (FiT) [46]. NEM was introduced by the Malaysian government in 2016 with a quota distribution of 500 MW until 2020 to stimulate renewable energy consumption in this country with the concept that energy generated would be consumed first. Then any excess energy would be transmitted back to the national energy company, Tenaga Nasional Berhad (TNB). Then, NEM 2.0 was introduced, where the scheme permitted excess PV energy to be transferred back to the grid on a “one-on-one” offset basis. After that, NEM 3.0 was initiated to increase the usage of solar PV by dividing it into three categories: NEM GoMEn Programme (Government Ministries and Entities), NOVA Programme (Net Offset Virtual Aggregation), and NEM Rakyat Programme. This new scheme will be implemented from 2021 to 2023 with a quota distribution of 500 MW [47].
Wind energy consists of offshore and onshore. Malaysia is still new in research on the type of equipment for offshore wind energy. This country has a bright prospect for using alternative energy to produce electricity in offshore locations such as Kijal, Malaysia. The location is in Terengganu, which is rich in offshore wind energy. It has considerable wind potential across the shallow sea and coastal line to create a wind park for generating electricity [48].
The sensitivity analysis in Mekhilef et al. [49] shows that the feed-in tariff is a crucial criterion for analysing the feasibility of an offshore wind farm in Malaysia. Private sector investment in offshore wind energy systems would be enticed by a feed-in tariff greater than the breakeven point. Moreover, an exciting policy will give an excellent perspective to the private sector to invest in offshore energy systems. For onshore wind energy, Malaysia is located in a low-wind speed area, limiting the areas with potential for wind turbine installation. The investment costs of the wind project for onshore location are wind turbine system cost, installation cost, and maintenance cost. The project has the most significant contribution to initial capital cost, while the remaining expenses are related to the construction [50].
The simulation analysis from Mukhtaruddin et al. proved that the combination of PV–wind-grid systems shows a lower net present cost (NPC) of RM14980, which is 16% lower than the design of the PV–grid system [51]. The sensitivity analysis demonstrated that the FiT rate for PV–wind-grid systems must have a minimum rate of RM1. 80 to get a payback period as competitive as PV–grid systems. Thus, it is assumed that hybrid PV–wind-grid systems are the most feasible economic choice. Comparing the hybrid system in the coastal area between FiT and a self-sustained house, it can be seen that the return on investment (ROI) for the self-sustained house is much higher than for FiT. The payback period for the FiT programme is much more extended than the self-sustained house. Due to that, selling back excess electricity produced to Tenaga Nasional Berhad (TNB) is not convenient [52]. Based on the analysis from U.H.P. Plants [53], a hybrid renewable energy system is more cost-effective for the owners and developers of power plants as it can give better return on investment than pure repowering investment or overplanting using only wind technology.
Sunanda Sinha et al. reviewed 19 software programs that can be used to design, analyse, and optimize the economic viability of the hybrid system, including the Hybrid Optimization Model for Electric Renewables (HOMER), RETScreen and Transient Energy System Simulation Program (TRNSYS) [54]. Among the 19 programs, HOMER is considered the most helpful tool because it can perform optimization and sensitivity analysis and has the most renewable energy system combinations.

1.2. The HOMER Pro Simulation Tool

Several simulation tools can be used to determine the feasibility of renewable energy systems in terms of the technical [37,38,50,51,52], economic [37,38,50,51,52], and environmental [53,54,55] aspects. The analysis involves a computer simulation to determine whether the project can be proceeded or not by looking at the design of the system, economic viability and environmental impact of the project. HOMER Pro software can optimize microgrid design in several sectors, such as rural areas, island places, military locations, and grid-connected buildings. It was created by National Renewable Energy Laboratory and improved and distributed by HOMER Energy [38,50,53,56]. The software consists of several tools that can evaluate the engineering and economic aspect of the system by comparing the base system with the current system [57].
It can be used to analyse solar, wind, and hybrid systems economically. The software also can be used to carry out the simulation, optimization and sensitivity analysis of renewable energy technologies [44,52,58,59]. Different scenarios and several case studies can be performed for payback period analysis using factors like installation, depreciation, maintenance, and availability [46]. In the present study, the payback period analysis compares the different combinations of RE technology with each scenario. HOMER can also calculate the payback period by analysing the proposed system, such as a grid-only system where the most significant payback period has the shortest duration [60].
The software is a powerful tool many researchers worldwide use to plan and analyse types of renewable energy systems. According to Bahramara et al. [61], it has been used for a wide range of loads from 0.626 kW to 2,213,000 kW. This software modelled many combinations of resources, components, and technologies. In addition, HOMER Pro software includes the overall cost of the system to obtain the economic viability of the systems, such as the component costs (capital, salvage, operation and maintenance, and replacement), component specifications, units of the component used, and lifetime operation [62].
In recent years, there have been several studies on using HOMER Pro software to use renewable energy technologies. The software is used to study the feasibility of renewable energy technology on several usages, such as electric vehicle charging stations, off-grid telecommunication towers, and electricity generation for university campuses [37,38,54]. The studies focus more on the feasibility analysis of the best technology combinations. Table 1 summarises the research on renewable energy utilization using HOMER Pro software for several purposes.
Recently, Ahmed Abdulmula et al. analysed the technical and cost-effective performance of RE utilization using HOMER Pro to develop a green off-grid telecommunication tower in Malaysia to substitute diesel generators [41]. Furthermore, Ashish Kumar Karmakera et al. assessed the feasibility of a hybrid renewable energy-based by using HOMER Pro for electric vehicle charging station (EVCS) in Bangladesh [59]. Additionally, Chhunheng Lao et al. used HOMER Pro to find the best scenario for a hybrid system by analyzing its techno-economic [56].
As part of the strategy for this study, there were two technology alternatives: solar photovoltaics (PV) and small-scale wind turbines. Based on the chosen locations in Malaysia, these two technologies were used to support the electricity demand in the selected area. These strategies were evaluated based on their utilization and investment analysis using Hybrid Optimization of Multiple Energy Resources (HOMER) Pro software. The expected research outcome was identifying the best strategies after using the RE technologies for several scenarios in Malaysia. Then, we defined several typical scenarios of a system and its energy demands, reflecting facts such as regional conditions (to determine the climate and renewable resource availability) and locations. We also provide the results of investments in different technology selections and combinations.
This manuscript assesses the best renewable energy utilization techniques for various scenarios in Malaysia, which were successfully analysed using the HOMER Pro programme. Simulation studies found that PV–wind hybrid technology was a superior solution for the utilization of renewable energy.
The manuscript is organized as follows: Section 2 describes the study’s methodology, including the selected sites, input parameters, equations, and single-line diagram; Section 3 gives the analysis of the simulation and sensitivity results of HOMER Pro; Section 4 discusses the results from Section 3, and Section 5 concludes the study.

2. Methodology

The optimal solutions for renewable energy use in Malaysia are analysed using a computational simulation method with HOMER Pro software. The simulation process of obtaining the payback period, net present cost, present worth, and system emissions of each scenario using the software can be divided into three parts: defining input data, simulating each scenario, and analysing the output results.
  • Define inputs data
  • The input information is collected from various resources such as the Sustainable Energy Development Authority Malaysia (SEDA Malaysia) and Energy Commission. The input components were resource information, the consumption pattern of the community, the system’s capital cost, installation cost, maintenance cost, and details of the chosen location. In addition, four schematic designs were set up for the simulation process.
  • Simulation of each scenario
The collected information was put into the HOMER software for a simulation process. First, the simulation was run for different scenarios based on its electricity consumption, the combination of RE technology used, and the type of system. Then, the payback period was calculated in the HOMER Pro according to Equation (1). The software estimated each system’s net present cost and present worth according to Equations (2) and (3).
4.
Analysing the output results
5.
After the simulation, the payback period, components costs, net present cost and present worth for each scenario were analysed to choose the best investment strategy for utilizing renewable energy resources in Malaysia.
P a y b a c k   P e r i o d = I n i t i a l   I n v e s t m e n t   o r   O r i g i n a l   C o s t   o f   t h e   A s s e t C a s h   I n f l o w s
N e t   P r e s e n t   C o s t   ( N P C ) = All - time   present   value   over   project   lifetime   Revenues   earned   over   the   project   lifetime
P r e s e n t   w o r t h = N P C   b a s e   s y s t e m N P C   c u r r e n t   s y s t e m
The two study locations were in in Malaysia. Two types of renewable energy were considered for these locations in Malaysia: wind and solar energy. The chosen location determined the technology, energy consumption, solar irradiation, and wind speed.
The strategies are analysed based on four factorse:
  • Investment
  • Resource availability
  • Location
  • Emissions
  • Figure 1 below is a single-line diagram of the renewable energy systems in Pekan, Pahang, and Mersing, Johor.
Figure 1. Single-line diagram of the renewable energy system.
Sustainability 14 13684 g001

2.1. Scenarios

Each scenario was produced by looking at its energy demands and reflecting facts such as regions (to determine the climate and renewable resource availability), locations and land size. Different combinations of technology also are observed in the renewable energy utilization strategy. In each scenario, there are two simulation results with different RE technologies. The description and limitations for each scenario are tabulated in Table 2. Figure 2 and Figure 3 show the locations for Pekan, Pahang, and Mersing, Johor, obtained from Google Maps. Wind turbine is not applicable for scenario 1 aims to see the effect of the absence of wind energy source in scenario 1. The same applies to Solar PV in scenario 2.

2.2. Input Parameters

There are three input parameters for the simulation process: equipment costs, load demands, and electricity price. The equipment costs are prepared based on the locations of the scenario. The cost is standardized for both scenarios since the place is categorized in the same area, which is a residential area. Table 3 summarises each component’s input cost and capacity/unit. It can be divided into four costs: capital, replacement, and operation and maintenance.
The demand load of the location is set up under residential load for both Pekan, Pahang, and Mersing, Johor, locations, which can be considered as a residential area with a rural community. The average demand load for both locations is 337.8 kWh/month. Since the locations are outside of the United States (US), HOMER Pro software matched the demand load to the US location of a similar climate by using the Koaeppen-Geiger climate classification system [57].

2.3. Schematic Designs

There are four different schematic designs, with each scenario having two designs. For example, Figure 4 below shows four schematic designs for two scenarios. The two locations are each tested with two schematic designs.
As shown in Figure 4, designs (a) and (b) share the same location but have different system designs. Design (a) includes solar PV technology, a converter, a diesel generator, and battery storage. In contrast, design (b) has a hybrid system that combines solar PV and wind turbine technologies. The other components of design (b) are identical to design (a) in terms of the model and its capacity. However, the wind turbine technology is not feasible because the location has a low wind speed compared with other locations in Malaysia. In addition, it is categorized as a rural area, so the battery storage component is needed for this design.
On the other hand, design (c) and design (d) share the same location but different schematic designs. Design (c) comprises wind turbine technology, diesel generator, converter, and battery storage. The schematic design of (d) is almost the same as (c), but the only difference on (d) is that it has solar PV technology. Both designs have higher wind speeds and are in rural areas, so the designation of wind turbine technology only is tested, and the battery component for both designs is included.

3. Results

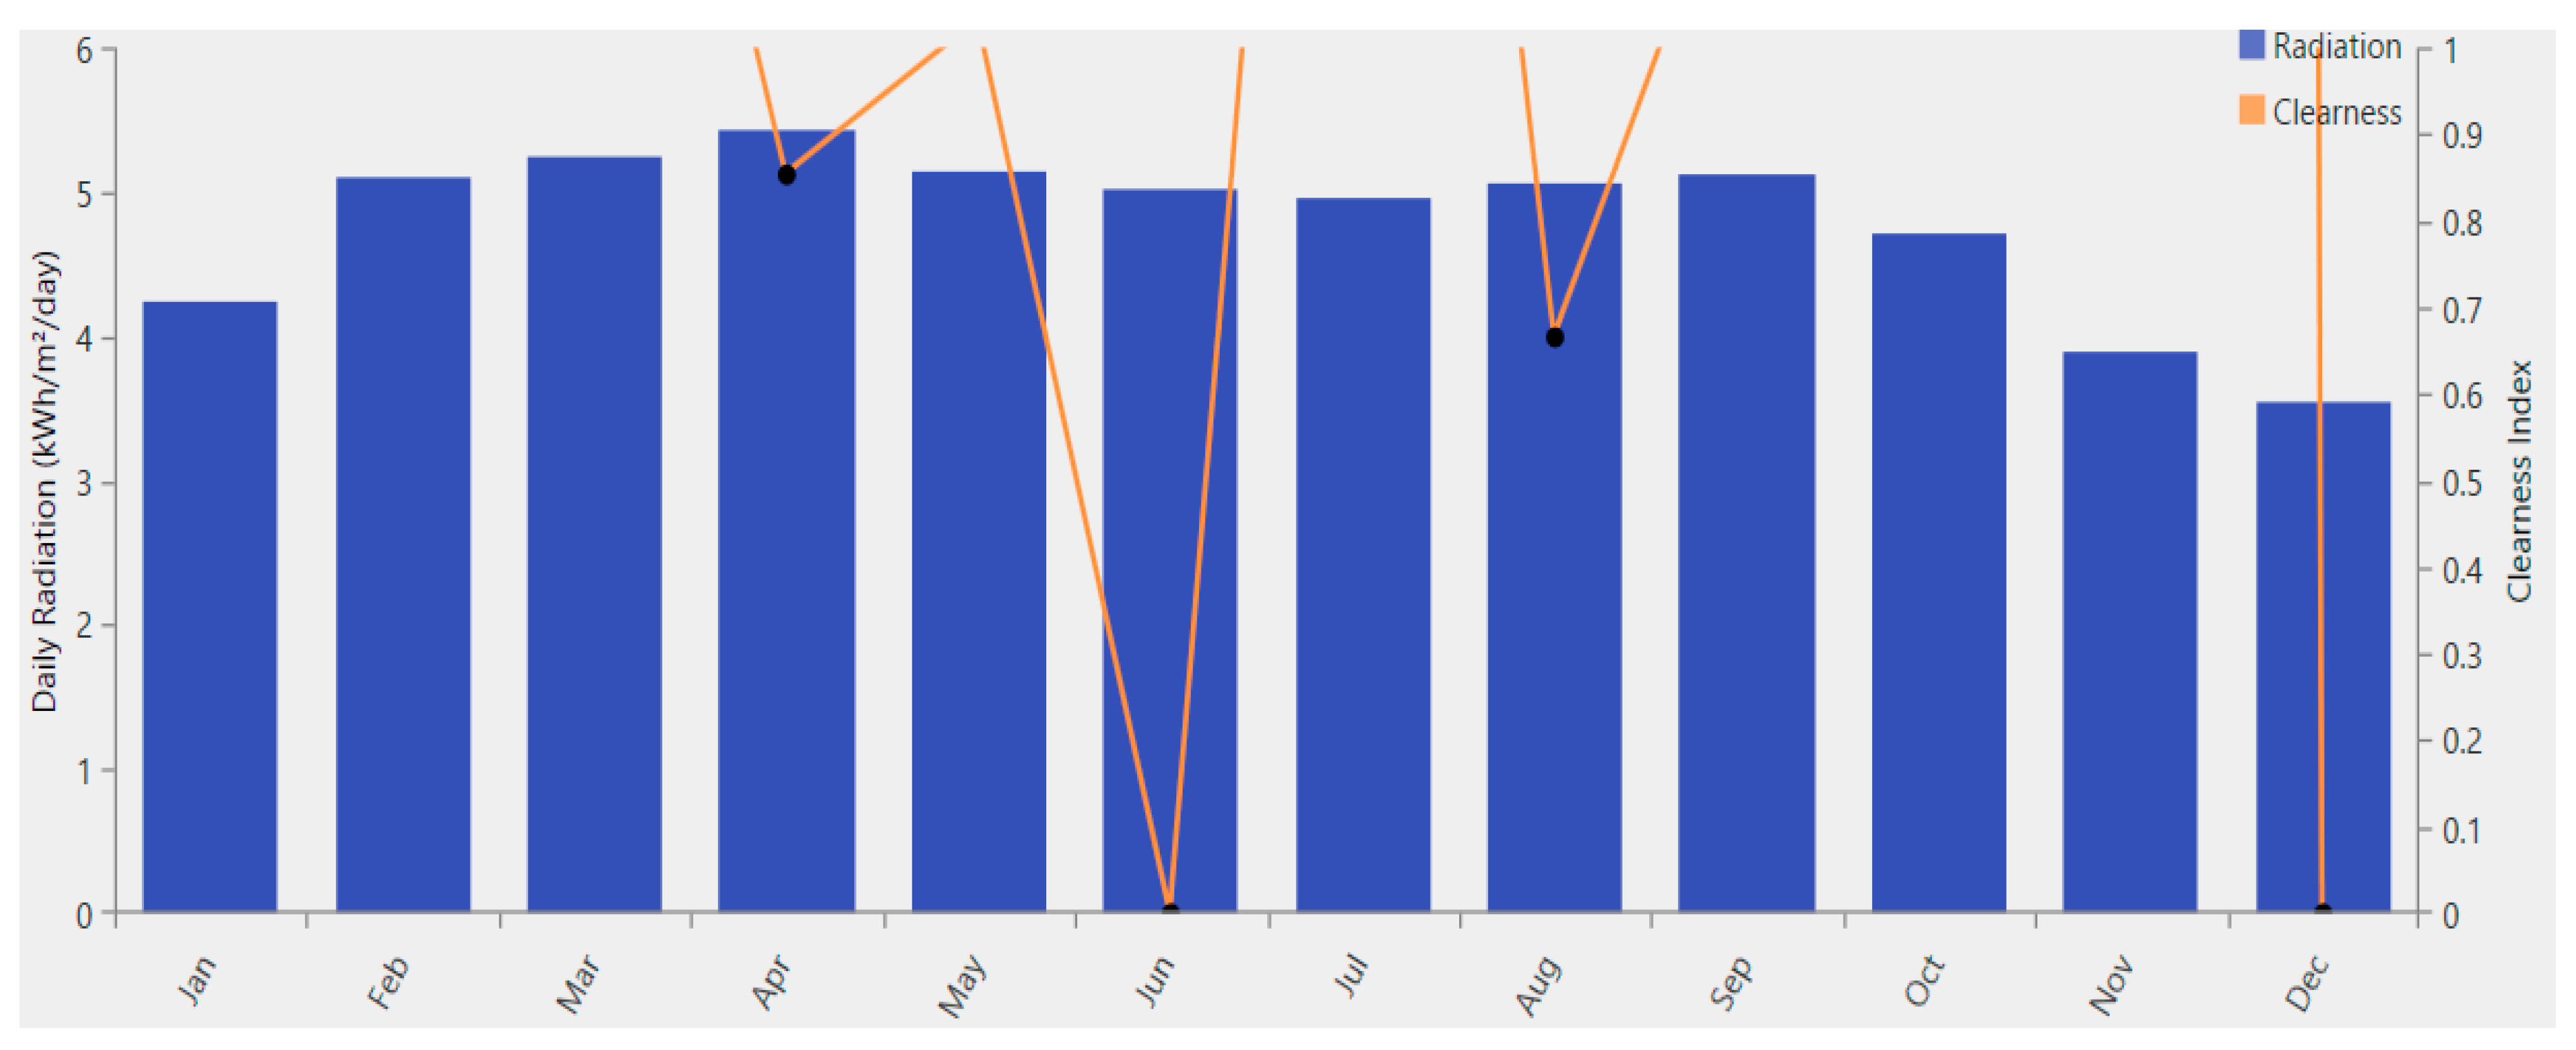
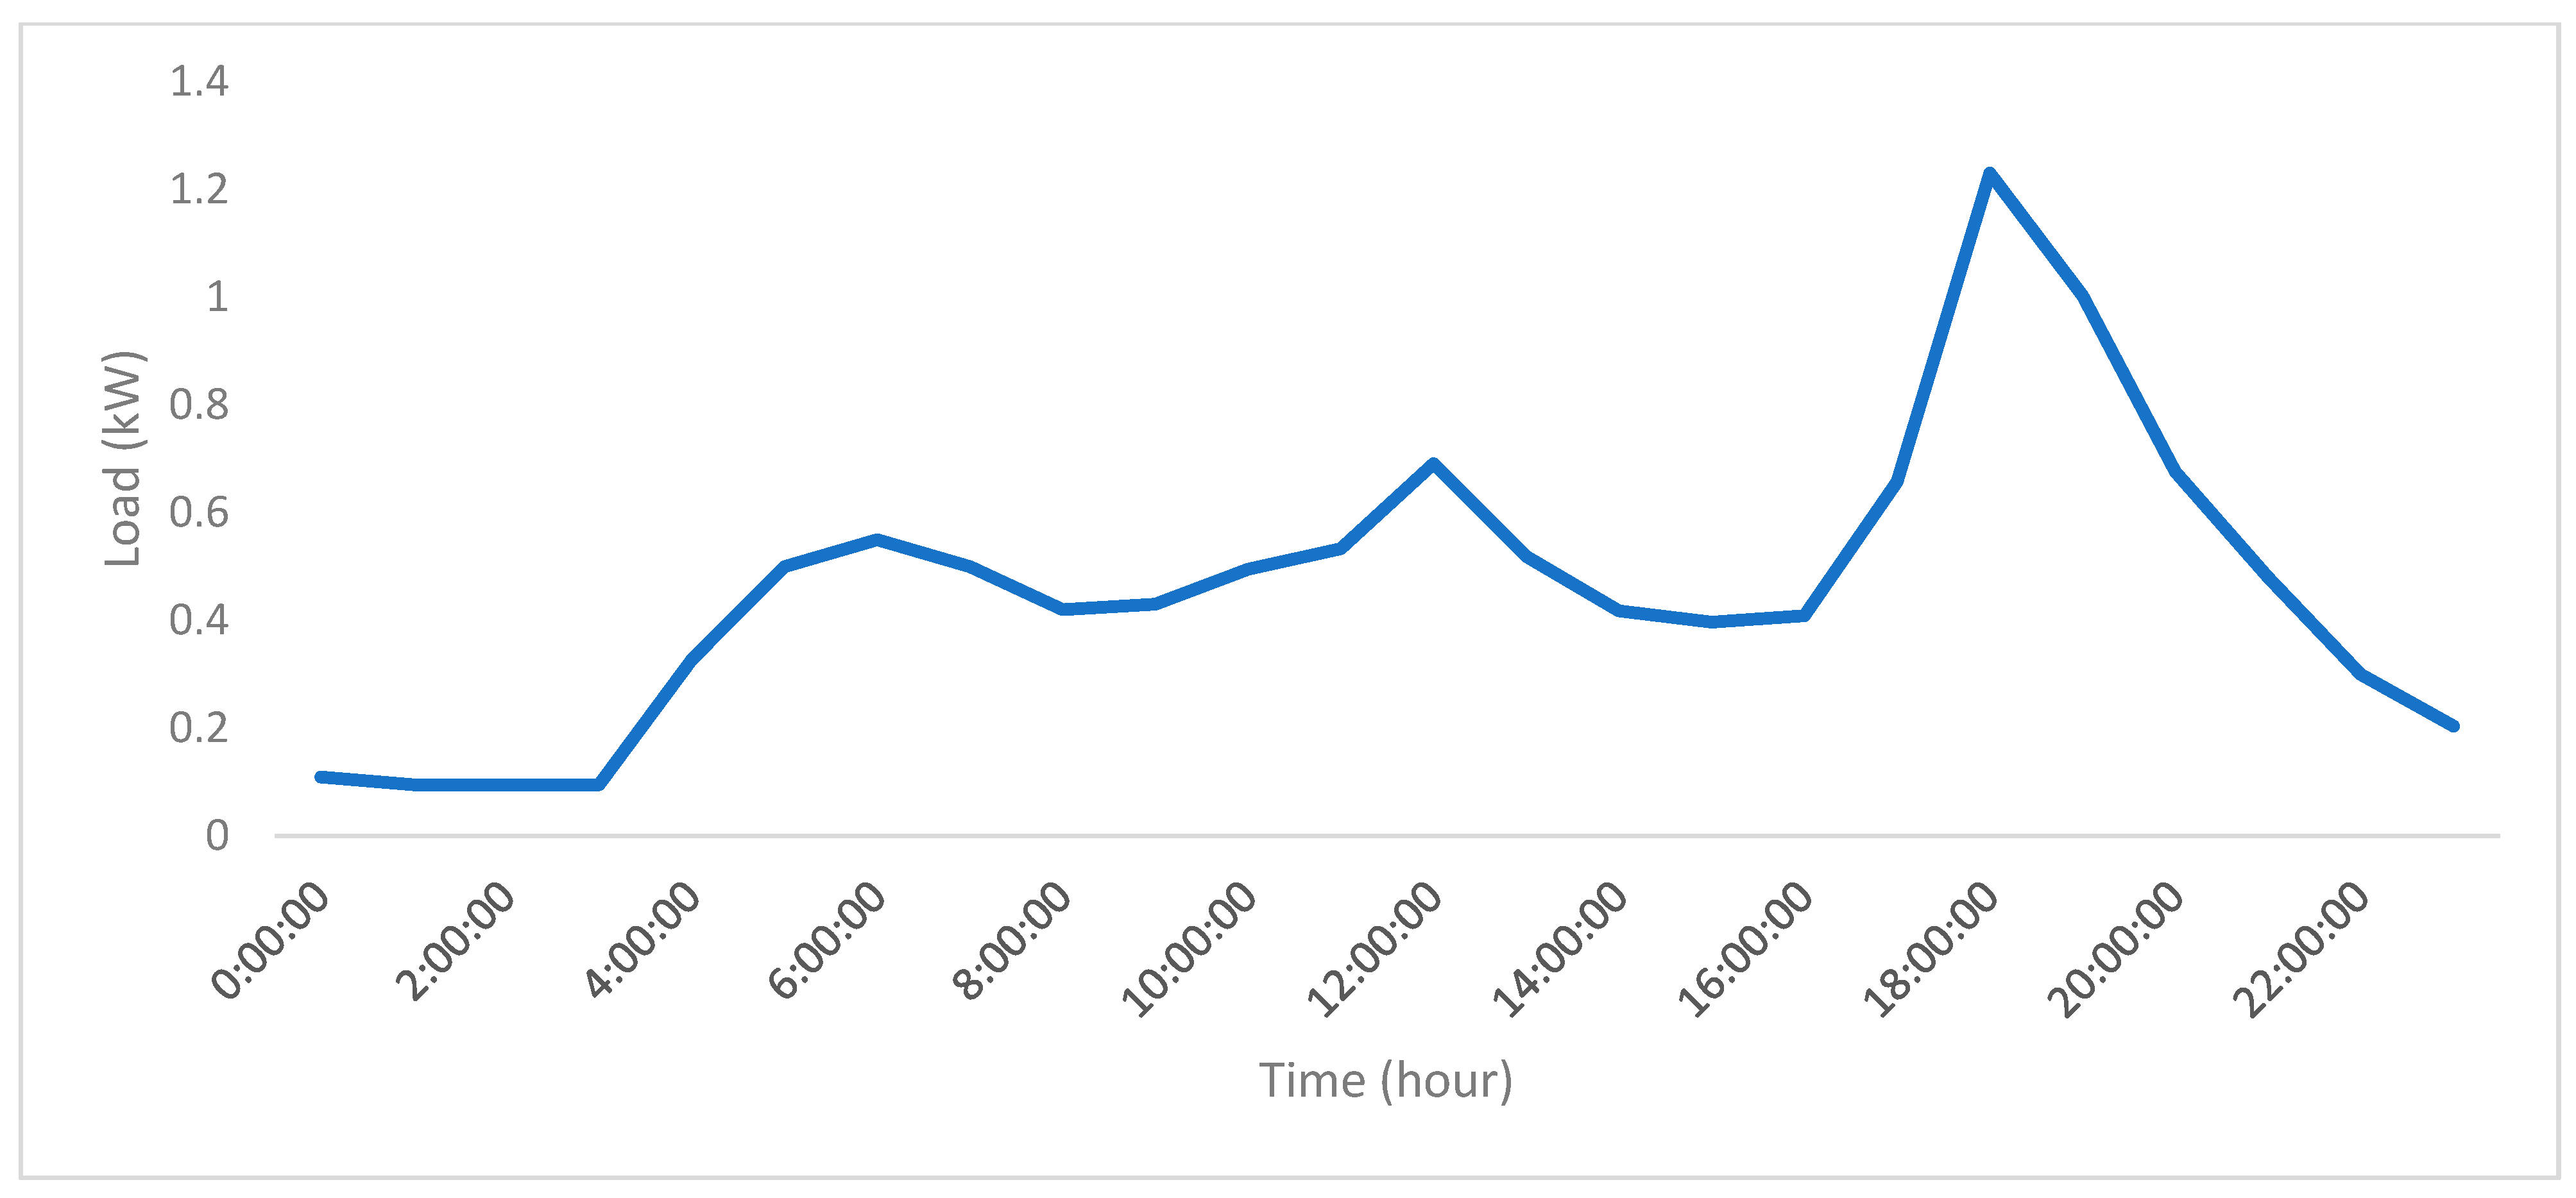
3.1. Resources Availability and Load Demand
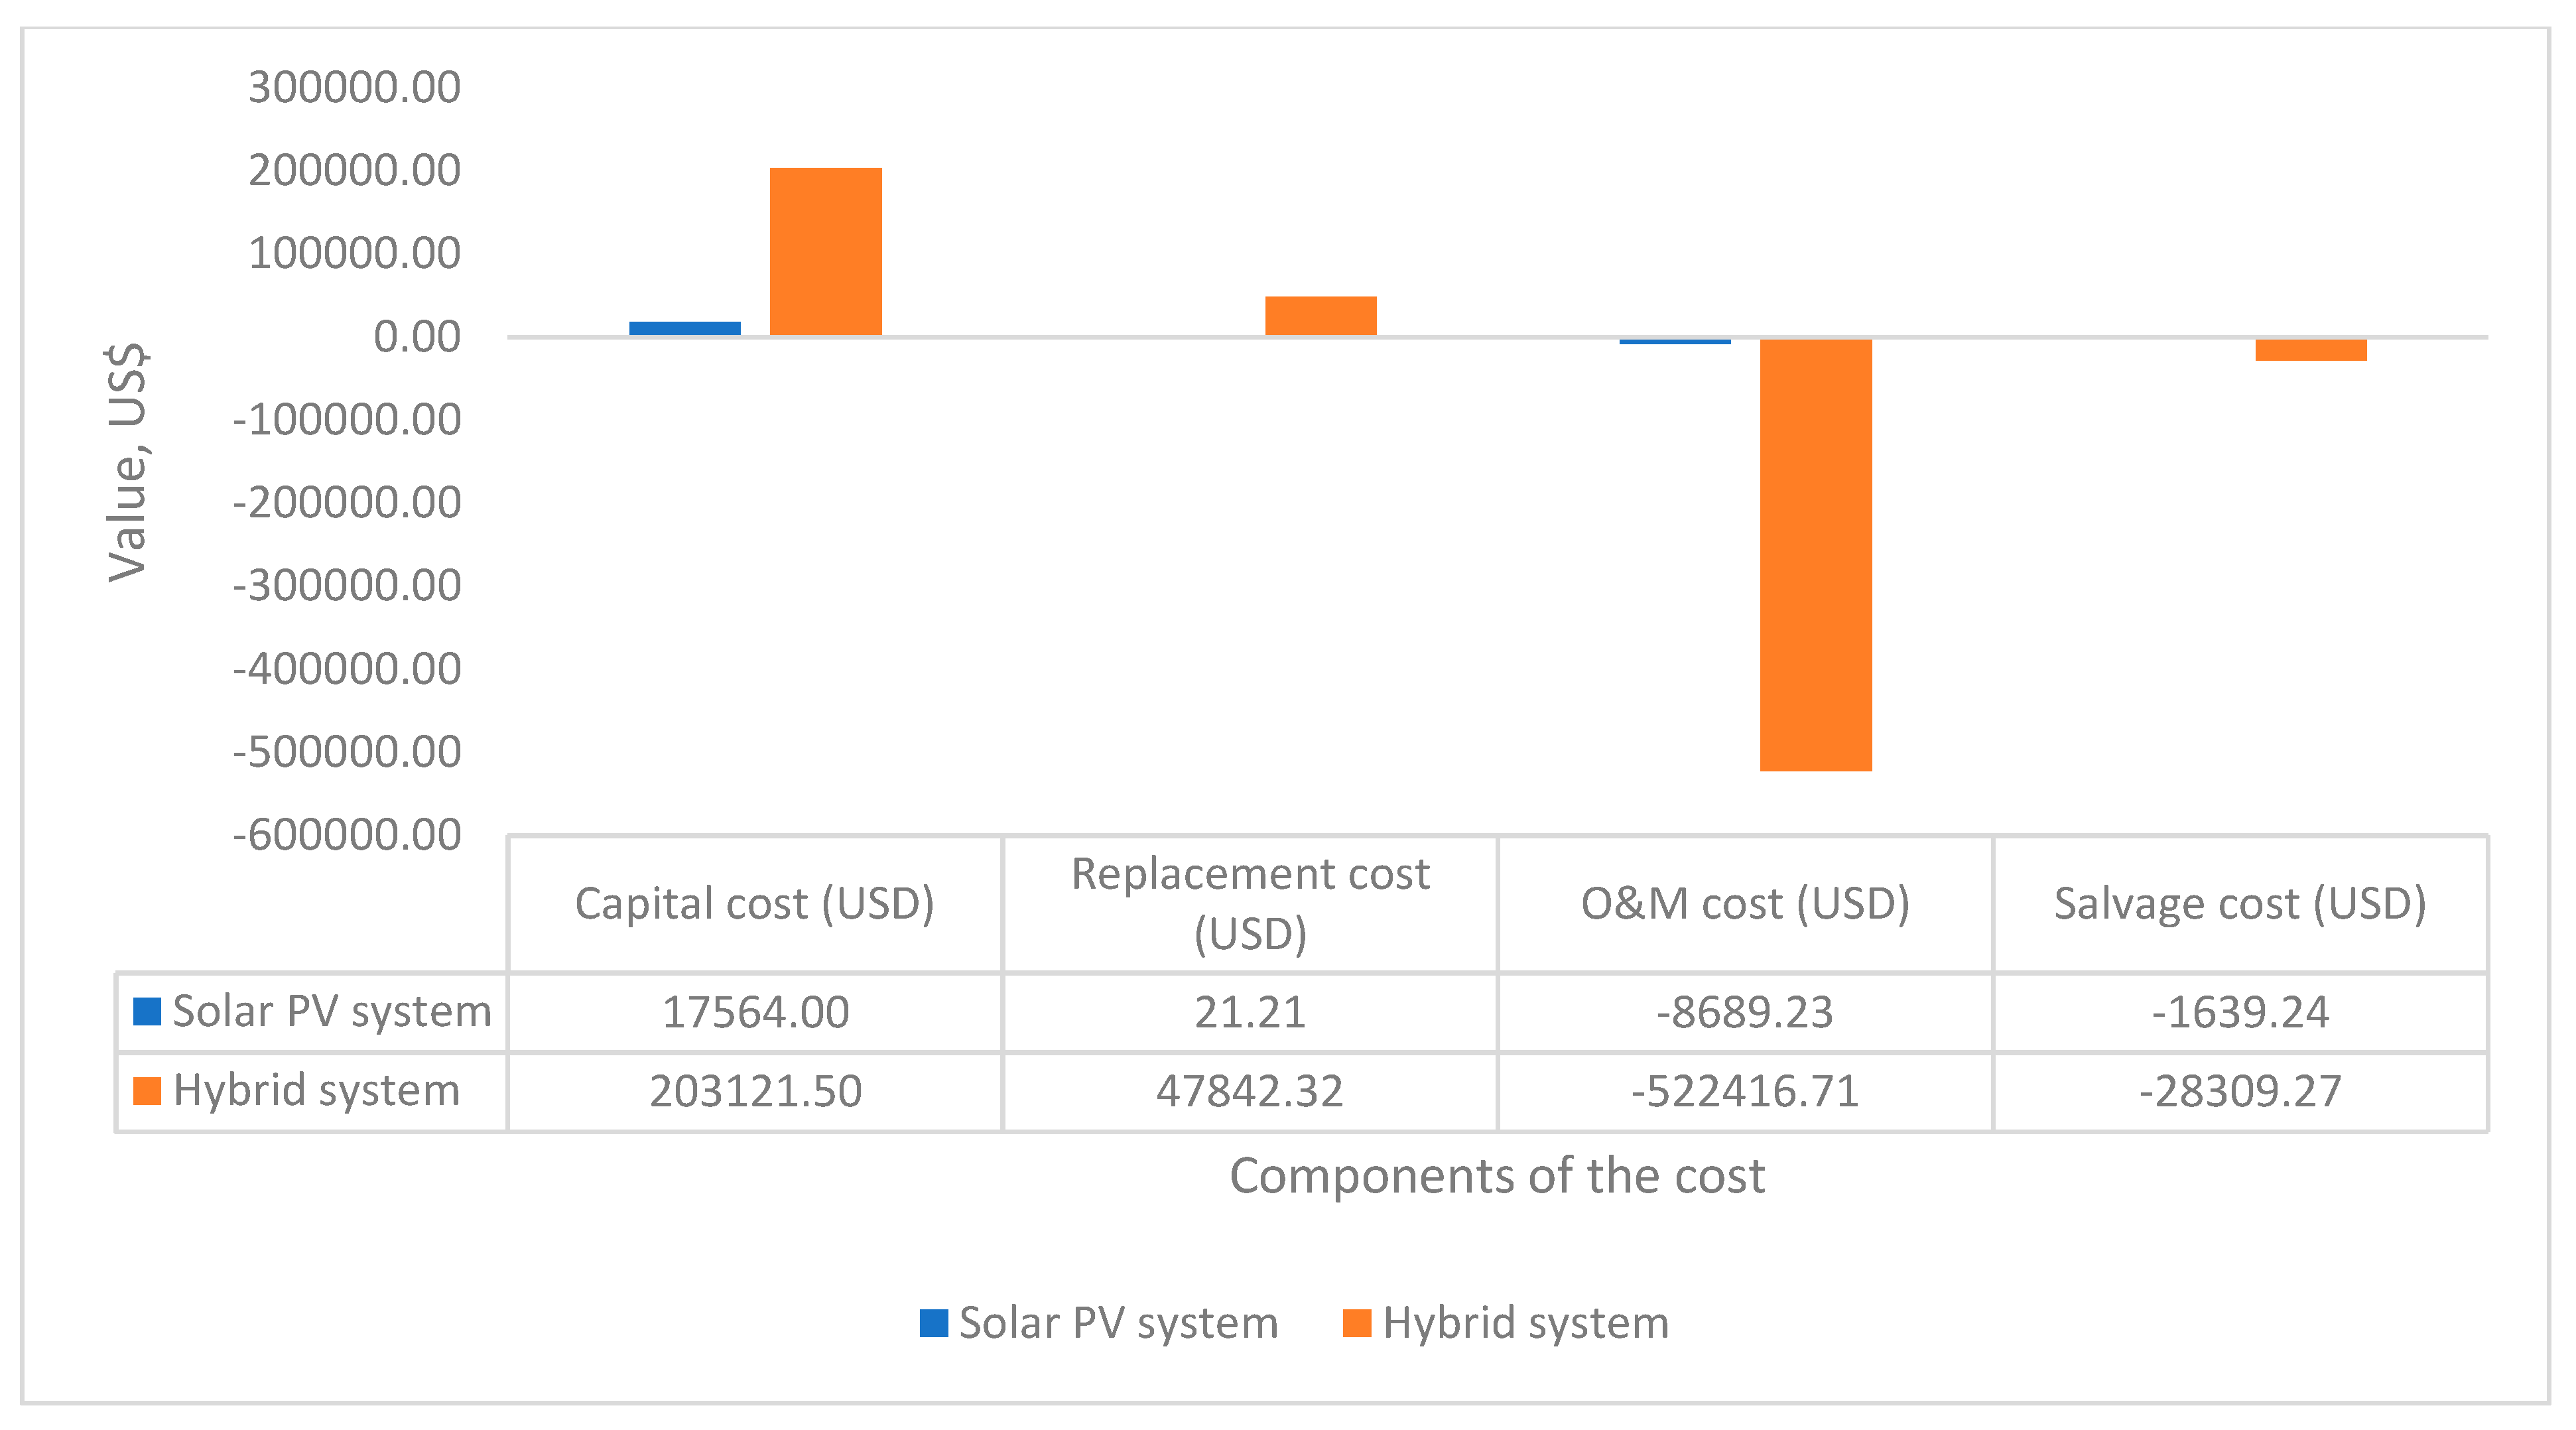
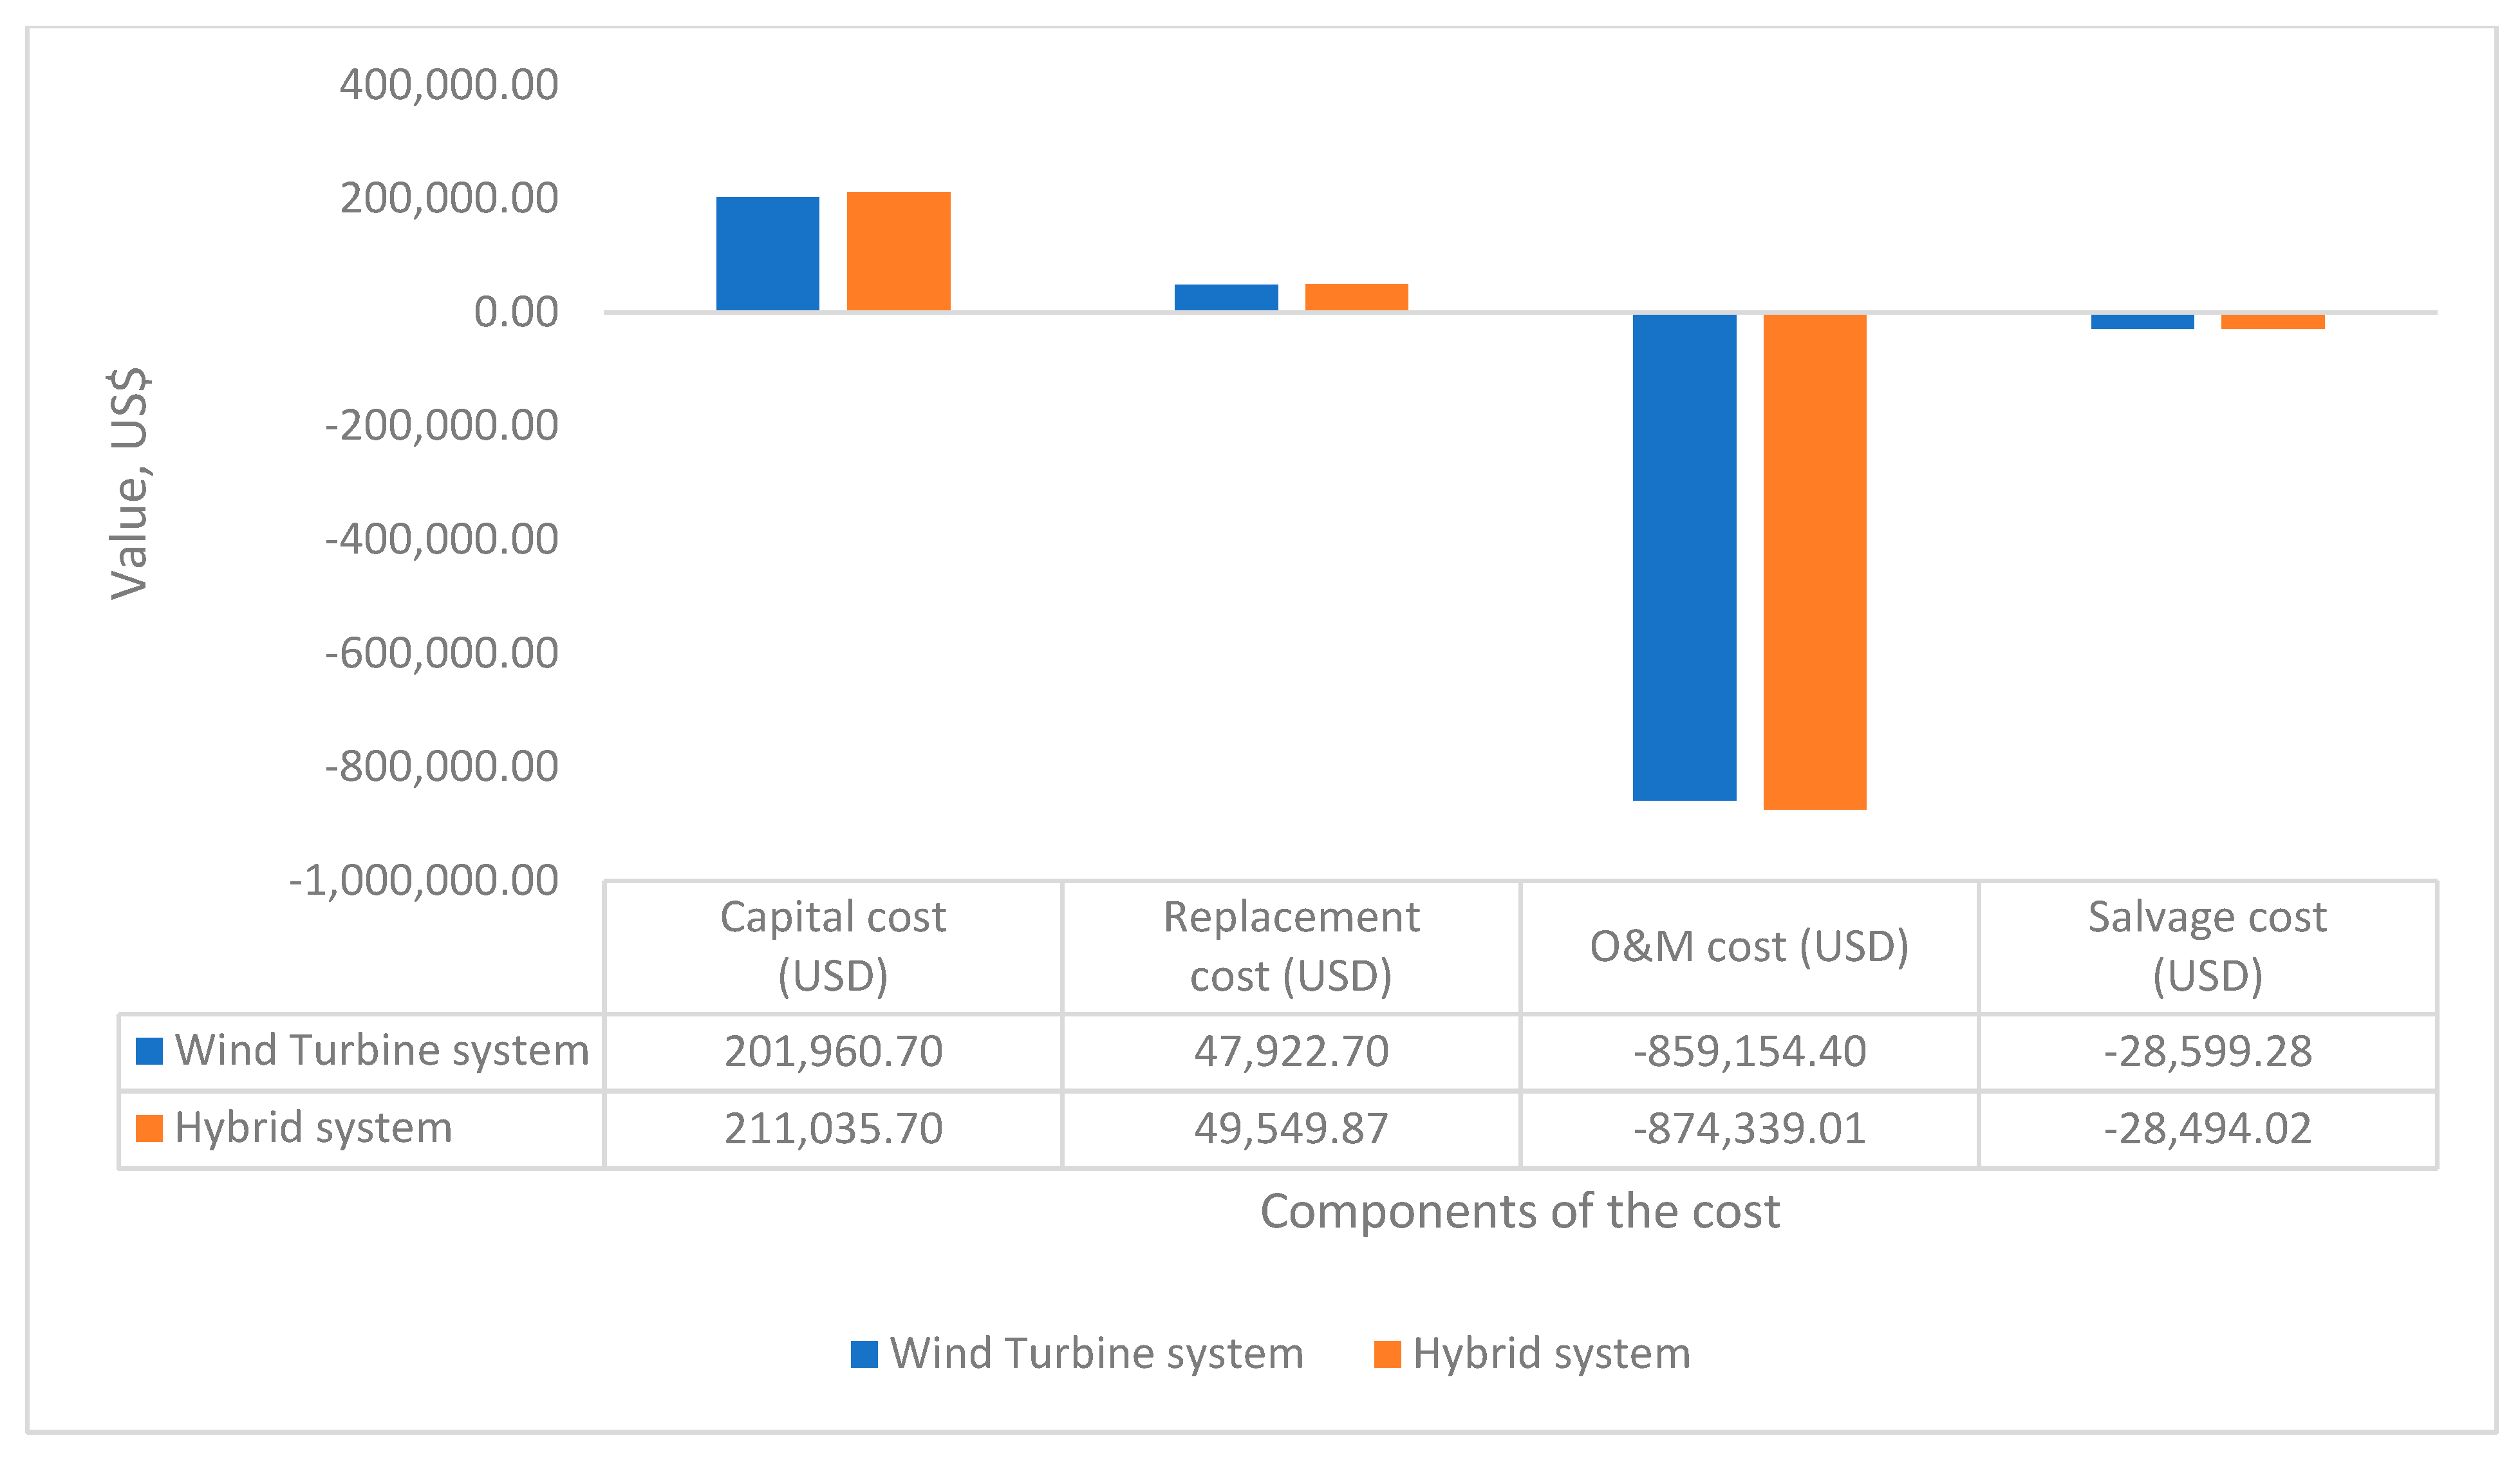
Two locations have been chosen. The first is Pekan, Pahang, on the east coast of Peninsular Malaysia, which has enough solar energy to generate electricity. Solar energy and wind energy resources are obtained from NASA Prediction of Worldwide Energy Resources in the HOMER Pro software. Figure 5 presents a monthly global horizontal irradiance (GHI) for the location of Pekan, Pahang.
The annual average of solar GHI was 4.79 kWh/m2/day, with the highest average monthly radiation in April at 5.420 kWh/m2/day, while the lowest GHI was in December at 3.55 kWh/m2/day. Figure 6 illustrates a monthly wind resource for the location of Pekan, Pahang.
The annual average of this location was 3.56 m/s, and the highest wind speed was in January at 5.37 m/s. The lowest wind speed was at 2.61 m/s in May. Wind turbine technology is not feasible for Scenario 1 because of the lower annual average wind speed. Figure 7 shows a monthly average of GHI resources for Mersing, Johor, with a yearly average GHI of 4.60 kWh/m2/day. From Figure 6, it can be shown that the highest radiation was at 5.08 kWh/m2/day, which fell in April, while the lowest was in December at 3.62 kWh/m2/day. Figure 8 shows a monthly average of wind resources for the location of Mersing, Johor. The highest wind speed was recorded in January at 6.09 m/s, while the lowest wind speed was recorded in April at 2.99 m/s. The annual average wind speed for this location is 4.1 m/s.
The load demand for both rural areas is depicted in Figure 9 throughout the length of one day. According to Figure 9, the hours between 6:00 and 8:00 pm had the greatest load demand, equivalent to 1.231 kW. Conversely, the load demand was at its lowest at 0.095 kW between midnight and 3:00 am.

3.2. Cost Analysis

The cost analysis of the simulation results for the scenario is shown in bar graphs and detailed explanations in the following scenarios. The capital costs, replacement costs, and operation and maintenance (O&M) costs for each simulation are presented based on the different scenarios and schematic design of the renewable energy system. The results can be divided into two scenarios: Scenario 1 and Scenario 2. From the graphs, the positive value means the cash is outflow, while the negative value means the cash is inflow. Figure 10 shows a cost summary of the solar PV and PV–wind hybrid system (hybrid system) design under Scenario 1 at Pekan, Pahang.
Figure 11 shows a cost summary of the design of the wind turbine and PV–wind hybrid systems (hybrid systems) under Scenario 2 at Mersing, Johor. Table 4 shows a total NPC between the solar PV system and PV–wind hybrid system under Scenario 1, while Table 5 shows a total NPC between the wind turbine system and the PV–wind hybrid system under Scenario 2.
Total net present cost is the current value of all costs of installing and operating the equipment over the project lifespan minus the current value of all revenues earned over the project duration [57]. The positive value of NPC means the operation and installation costs are much higher than the revenues. The negative value means the revenue earned through the project duration is much bigger than the installation and equipment operation cost.
Based on Figure 10, positive cash flow belongs to capital and replacement costs, while negative cash flow belongs to salvage costs and O&M costs. The highest cash outflow for the solar PV system is on capital cost at USD 17,564, while the highest cash inflow is O&M cost at USD – 8689.23. Meanwhile, for the hybrid system, the highest cash outflow incurs a capital cost, while the highest negative cash flow value is O&M cost. It can be shown that both systems have the highest cash outflow on capital cost while the cost that generates income happens on O&M cost.
The O&M cost consists of electricity generation from renewable energy technology and energy sold during grid operation. The renewable energy system initially incurs a very high capital cost, leading to higher cash outflow than other component costs. By comparing the costs of two different system designs, the PV–wind hybrid system has higher capital cost, replacement cost, salvage cost, and O&M cost than the solar PV system. The costs show a huge difference between the designs, with O&M having the most significant difference between these two systems.
The HOMER Pro software calculated the NPC for each system. From Table 4, the solar PV system has a positive NPC, which is USD 7256.74, while the hybrid system has a negative NPC, which is USD −299,762.16. The total NPC for the hybrid system, which is a negative value, is much better than the that of PV system because of the wind turbine technology in the hybrid system. The wind turbine technology in the PV–wind hybrid system has generated more revenue than the solar PV system.
From Figure 11, the component costs between the wind turbine and the hybrid system in Scenario 2 show a minimal difference. By comparing four component costs of the wind turbine system, it can be observed that capital cost has the largest cash outflow of USD 201,960.70, while O&M cost has the biggest cash inflow of USD 859,154.40 compared with other component costs. For the hybrid system in Figure 11, among the component costs, the largest cash outflow belongs to the capital cost of USD 211,035.70, and the highest cash inflow belongs to the O&M cost of USD 874,339.01. Thus, from both systems, O&M cost contributes the highest income to the system, while capital cost has the highest cash outflow, leading to a more extended payback period.
Comparing the cost between the wind turbine system and the hybrid system in Scenario 2, the wind turbine system has lower capital costs and replacement costs than the hybrid system. However, hybrid technology has a higher cash inflow on O&M costs than wind turbine technology. In terms of salvage cost, the wind turbine design has a slightly higher cash inflow than hybrid design.
Table 5 shows a slight net cost difference between the wind turbine and PV–wind hybrid configurations. It can be seen that the hybrid system has a bigger negative value of USD −642,247.46 than the hybrid system of USD −637,870.28. It is shown that the PV–wind hybrid technology has a much better present cost than wind turbine technology. Hence, the hybrid system in this scenario has a bigger negative NPC. Moreover, the wind turbine system used nine units for electricity generation, making the present cost almost the same.

3.3. Payback Period by Scenario

The payback period was calculated using HOMER Pro software, which was extracted from the simulation results. Scenario 1 at Pekan, Pahang, consists of the solar PV and PV–wind hybrid systems, while Scenario 2 at Mersing, Johor, consists of a wind turbine and PV–wind hybrid system. Table 6 and Table 7 show the payback periods for both scenarios with the different designs of the systems. In addition, the net present worth for each system is also tabulated in Table 6 and Table 7. Net present worth is the difference in net present cost between the base and current systems.
Based on Table 6, the present net worth for a hybrid system is much greater than the solar PV system. Thus, a PV–wind hybrid system can save more money over the project lifetime than a solar PV system. Furthermore, regarding the payback period, the PV–wind hybrid system has a shorter payback period of 4.86 years compared with the solar PV system of 8.59 years. Therefore, the hybrid system has a 1.2 times shorter payback period than the PV system. As a result, the Scenario 1 PV–wind hybrid system is a much better strategy than the solar PV system.
It can be analysed that PV–wind hybrid technology is a more suitable strategy than the wind turbine system for this scenario. Based on Table 7, the net present worth in Scenario 2 for the PV–wind hybrid system of USD 659,990 is much larger than the wind turbine system of USD 655,613. Hybrid technology has higher savings than wind turbine technology when the current system is compared to the base system. By comparing the payback period, the PV–wind hybrid design has a shorter payback period of 2.98 years than the wind turbine design of 3.06 years.

3.4. Emissions

The system’s emissions are collected from the simulation result of HOMER Pro software to know the amount of each type of pollutant produced yearly by the power system in kg/year. For renewable energy, greenhouse gas emissions (GHG) from other resources than power stations are dominant [63,64,65]. Figure 10 shows the emissions that have been produced for each of the systems in the simulation results. There are a total of two emission readings in both Scenario 1 and Scenario 2.
According to Figure 12, carbon dioxide plays a significant role in the composition of pollutants. For example, regarding carbon dioxide under Scenario 1, the solar PV system produces higher carbon dioxide than the PV–wind hybrid system, with a 485 kg/year difference. Meanwhile, under Scenario 2, the wind turbine system produces higher carbon dioxide for carbon dioxide than the PV–wind hybrid system, with a 307 kg/year difference. In addition, the systems also produced sulphur dioxide and nitrogen oxide pollutants in a minimal kg/year.
The solar PV system in Scenario 1 and the wind turbine system in Scenario 2 emit more pollutants than other systems because the system generates more electricity, produces thermal energy, and has a high grid electricity consumption. This is because the emissions come from the system’s generator, boiler, and grid. Thus, it can be shown that the PV–wind hybrid system is a much more favourable strategy to be used for both scenarios because of their lower emission.

3.5. Chosen Strategies

The payback period determines which renewable energy utilization method has the best investment strategy for the scenarios. Other considerations are the net present worth, net present cost, and the emissions produced from the system. For scenario 1, which is in Pekan, Pahang, the better strategy is a PV–wind hybrid system compared with the solar PV system. This is because the PV–wind hybrid system has a much shorter payback period and lower emissions produced from the system. The hybrid system also generates more revenues and saves more money than the PV system in this scenario. For Scenario 2, which is in Mersing, Johor, the PV–wind hybrid system is a much better solution than the wind turbine system. The reason is that the hybrid system has a much better payback period, and lower emissions generate from the system. The NPC of this system shows that it can generate more revenues, and the present worth also shows that this system can save more money than the wind turbine system.

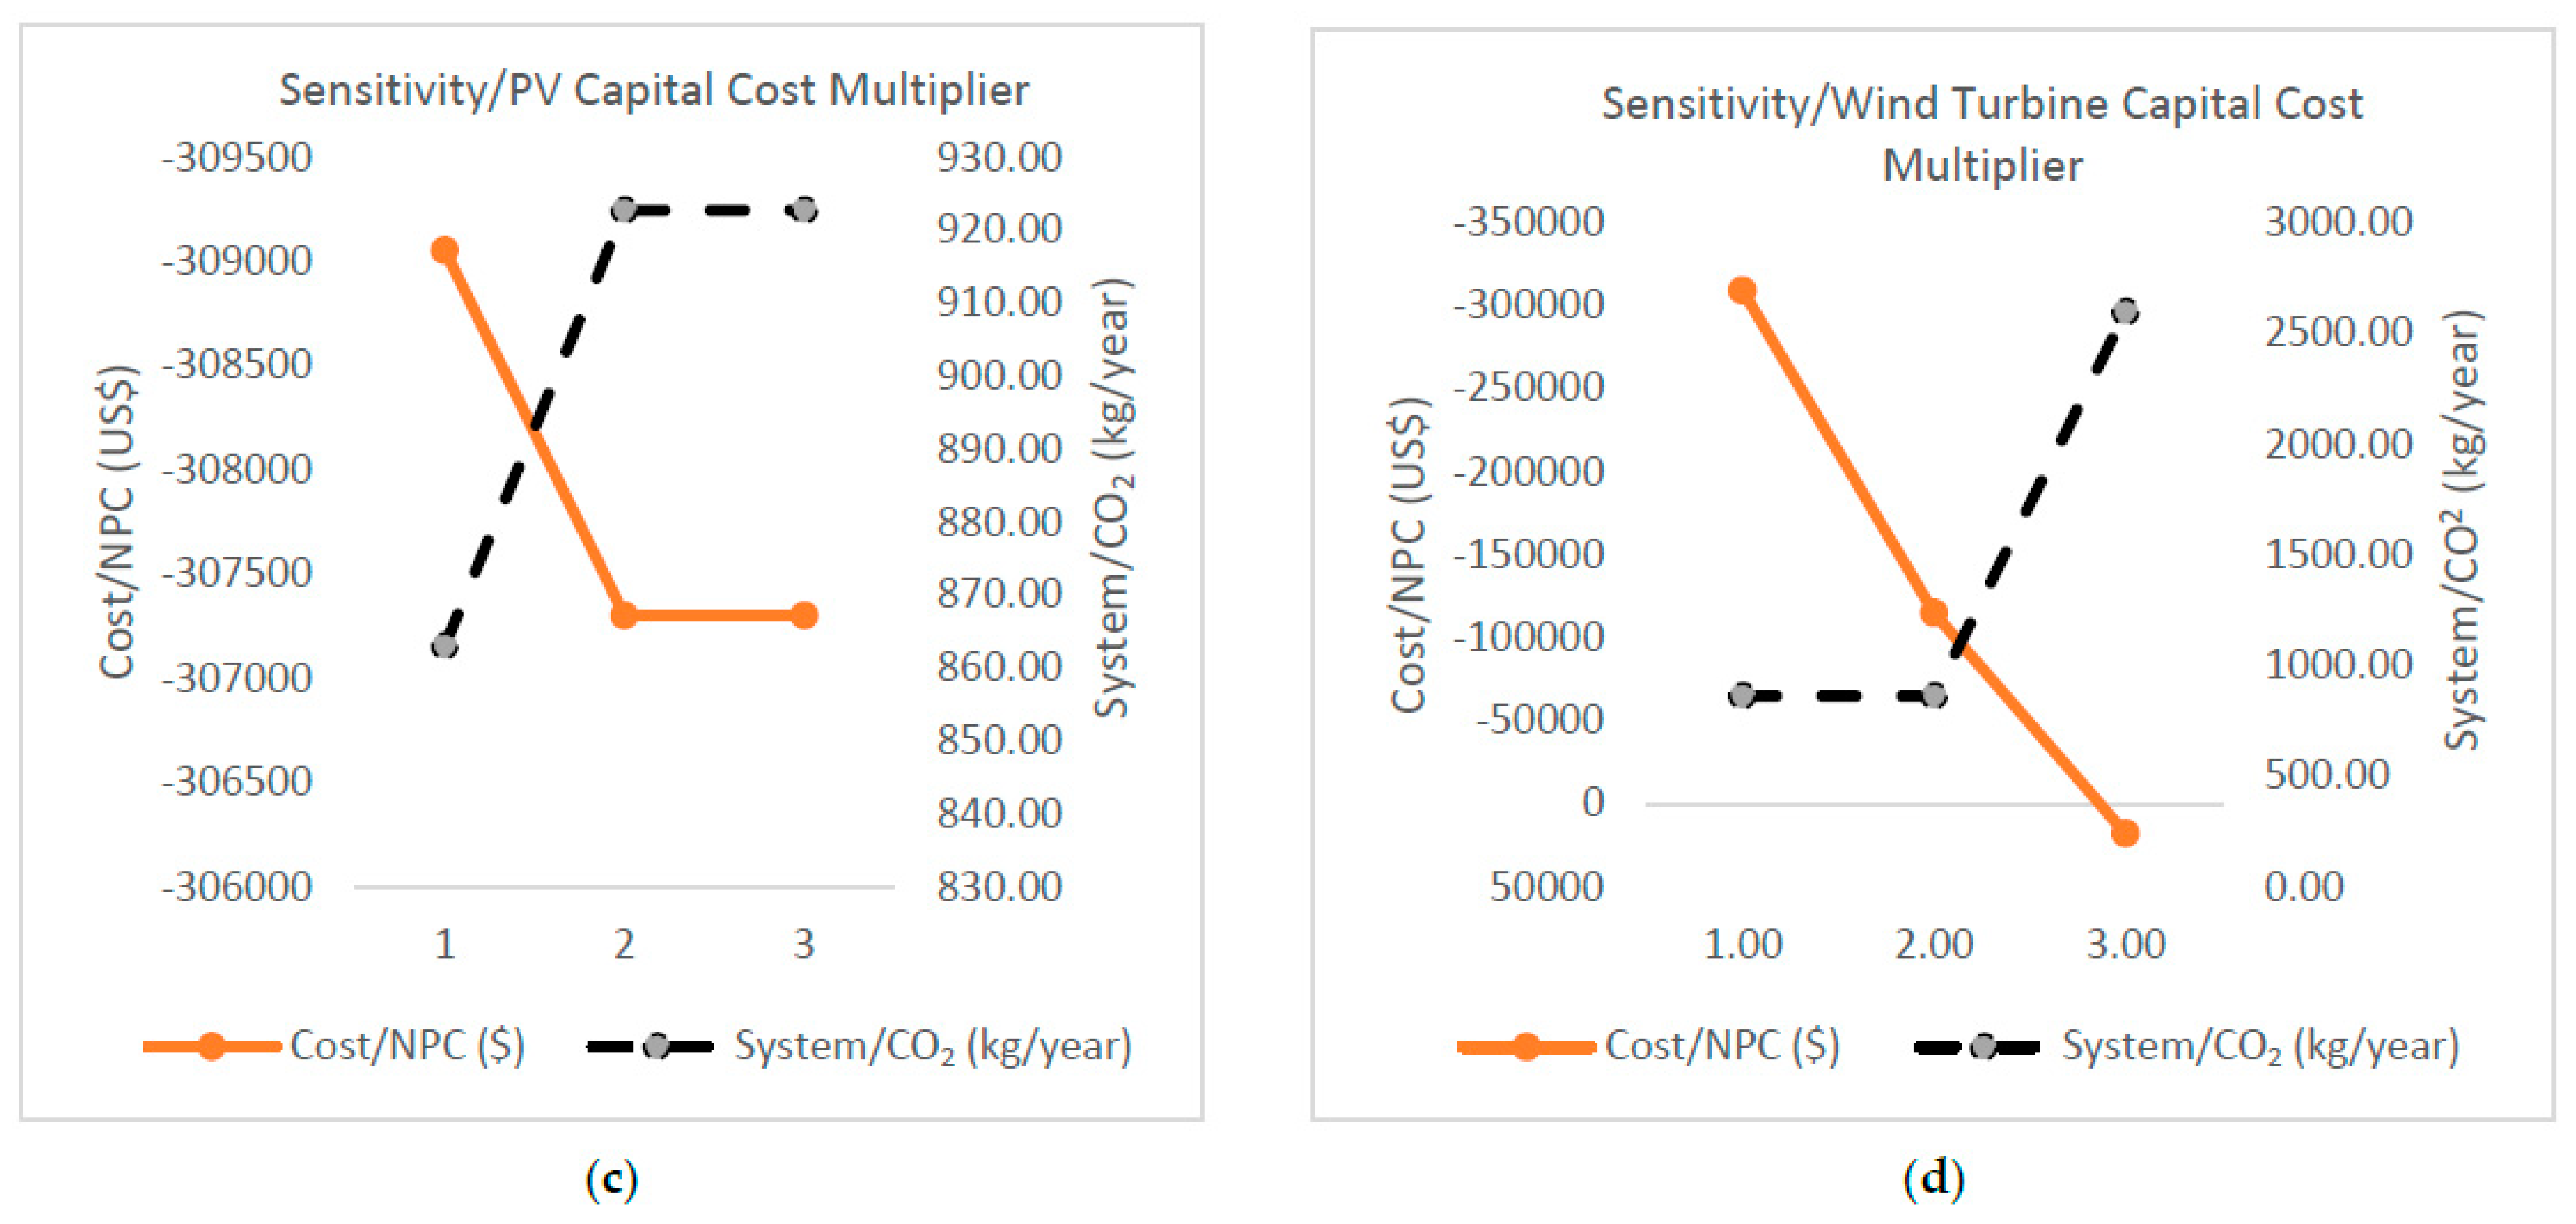
3.6. Sensitivity Analysis

In accordance with the selected strategies in Section 3.5, a sensitivity analysis was undertaken of the PV–wind hybrid system for each scenario to examine the impacts of modifying parameters on the renewable energy system. The sensitivity parameters chosen for this research were daily radiation, average wind speed, and PV panel and wind turbine capital costs. For each sensitivity variable, the value was altered by 10% for solar radiation and wind speed and by a factor of 1 to 3 for the capital cost multiplier. The values for each scenario’s sensitivity parameters are shown in Table 8.
By giving a range of values, the significance of a variable and how its value affects the solution may be established by evaluating its sensitivity. The analysis is based on the NPC and carbon dioxide (CO2) emissions. Negative NPC indicates that revenues surpass costs. The findings of the sensitivity analysis for the hybrid RE system in Scenarios 1 and 2 are shown in Figure 13 and Figure 14.
According to the sensitivity analysis depicted in Figure 13, the NPC for the hybrid system in Scenario 1 reduced by 41% and grew by 32% from the current value of USD 309,053 when the solar scaled average declined from 4.79 to 4.31 kWh/m2/day and climbed from 4. 79 to 5. 27 kWh/m2/day, respectively. As the solar scaled average fluctuates, CO2 emissions increase by 23% and decrease by 16%. Meanwhile, for wind speed parameters, the NPC increased, and CO2 emissions decreased as the scaled average wind speed ranged from 3.20 m/s to 3.92 m/s.
In terms of the PV capital cost parameter, the NPC declined by −0. 57% and began stabilizing between multipliers 2 and 3. However, CO2 emissions climbed to 923 km per year, and multiplier 2 stayed unchanged. As the capital cost multiplier of wind turbines went from 1 to 3, the NPC fell from USD 309,053 to USD 17,742, but carbon dioxide emissions climbed.
As shown in Figure 14, in Scenario 2, the NPC increased from USD 652,250 to USD 653,482 as the average scaled solar power ranged from 4.14 to 5.06 kWh/m2/day. As the solar radiation parameter fluctuates, the CO2 emissions drop from 472 to 464 kg/year. As the scaled average wind speed fluctuates between 3.69 and 4.51 m/s, the NPC grows, and emissions fall. Regarding the capital cost of PV panels and wind turbines, the NPC cost was reduced by 0.94% when the PV capital cost was multiplied by three. However, the emissions rose to 7% and then to 49%. An increase in the capital cost of wind turbines by a factor of three dropped the NPC cost by up to 59% but had no discernible effect on CO2 emissions.

4. Discussion

Various parameters are used to assess the investment analysis for each scenario. The investment plan analysis includes the system’s payback period, net present cost, present value, and emissions. The payback time must be as short as possible for the optimal investment strategy in renewable energy use. The greater the negative value of NPC and the greater the net present value, the better the investment decision. During the simulation process, the selected parameters of the power system that uses RE technology are calculated based on a number of factors that could affect the choice of strategy. For example, adjustments of ±10% in the parameters of solar radiation, wind speed, and capital cost of the photovoltaic panel and wind turbine can affect the net present cost and emissions from the system.
(a)
Technology used
The cost of the power system may be affected by the renewable energy technology used. According to Table 6 and Table 7, using two kinds of renewable energy technologies may reduce the payback time. This is because the present value of two RE technologies, often known as a hybrid system, is much greater than that of a single RE technology.
(b)
Costs of the component
There are four components in the cost analysis: capital cost, replacement cost, salvage cost, and operation and maintenance (O&M) cost. The capital cost and O&M cost significantly influence the system’s net present cost. Capital expenditures are cash outflows, while operations and maintenance expenditures are cash inflows. The capital cost parameter in the sensitivity analysis shown in Figure 13 and Figure 14 reduces the NPC of the RE system while concurrently influencing its carbon dioxide emissions. The component costs are estimated depending on the simulation’s input parameters. The greater the negative value of NPC, the shorter the system’s payback time.
(c)
Resource availability
Solar energy and wind energy are the two resources examined for this project. The wind speed at the location in Scenario 1 is not high enough to make the design of wind turbine technology possible. However, the combination of solar PV with a wind turbine is viable. Therefore, the hybrid system in Scenario 1 may yield a greater return on investment than the PV system alone. Due to the increased wind speed at this site, the second scenario compares the wind turbine system with the hybrid system. However, hybrid technology can only generate a superior return on investment compared with wind turbine technology. The fluctuation in solar radiation and wind speed factors influences the NPC and CO2 emissions of the system. Parameters relating to solar radiation and wind speed are inversely related to net present cost, whereas sensitivity parameters are directly proportional to CO2 emissions.
(d)
Unit of the component used
The component’s unit is also crucial for analyzing the investment plan. In Section 3.3 of Table 6’s results, it can be observed that the payback time difference between PV technology and PV–wind hybrid technology is rather considerable, at 3.73 years. The PV system has a payback time of 8.59 years, whereas the hybrid system has a payback period of 4.86 years. This is due to the fact that there are nine wind turbine units, resulting in a shorter payback time for the system.
For future research, a unique combination of renewable energy technologies can be input into the HOMER Pro simulation software for each scenario. Other renewable energy resources, such as biomass and hydro technology, may be used to augment the system’s present renewable energy technology. Additionally, a tool other than the HOMER Pro programme may be utilized to analyse the renewable energy use plan. RETScreen may also be used as a software tool to analyse the investments in renewable energy in Malaysia for several scenarios.

5. Conclusions

The best renewable energy utilization approaches for different Malaysian situations were determined using HOMER Pro. Solar, wind, and hybrid investment returns were evaluated independently. This project contains two scenarios in Pekan, Pahang, and Mersing, Johor, each having two simulated results.
Based on a comparison between the capital cost, replacement cost, salvage cost, and O&M cost for each system, the capital cost provides the most cash outflow. In contrast, the O&M cost contributes the greatest cash inflow from the system’s cost summary. In each case, the PV–wind hybrid system has a better net present cost (NPC) than the solar PV and wind turbine systems, USD 299,762.16 for Scenario 1 and USD 642,247.46 for Scenario 2. The PV–wind hybrid system has a shorter payback time of 4.86 years than Scenario 1’s solar PV system and 2.98 years shorter than Scenario 2’s wind turbine system. The PV–wind hybrid system has a present worth of USD 317,505 in Scenario 1 and US USD 659,990 in Scenario 2. Integrating RE technology shortened the payback period and increased the system’s present worth. The solar PV and wind turbine systems emit 485 kg/year and 307 kg/year more than the PV–wind hybrid system. Hence, integrated RE technology reduced system pollution. The sensitivity analysis shows that the NPC and CO2 emissions of the RE system are affected by the availability of resources and the cost of capital.
According to studies, the PV–wind hybrid system is preferable to a single RE technology on rural residential properties. Hybrid RE systems provide faster returns, more cost savings, and fewer pollutants. When evaluating renewable energy system strategies, payback time, NPC, present value, and system emissions influenced investment choices. The technology employed, the cost of components, the availability of resources, and the unit of the component used in the system all contribute to a faster payback period, a larger negative NPC, a larger present worth, and lower system emissions.

Author Contributions

Conceptualization, M.A.A.R., Y.L. and M.A.A.I.; methodology, M.A.A.R., Y.L. and M.A.A.I.; software, M.A.A.R., Y.L. and M.A.A.I.; validation, A.F. and S.Z.S.; formal analysis, M.A.A.R., Y.L. and M.A.A.I.; investigation, A.F. and S.Z.S.; resources, M.A.A.R., Y.L. and M.A.A.I.; data curation, M.A.A.R., Y.L. and M.A.A.I.; writing—original draft preparation, M.A.A.R., Y.L. and M.A.A.I.; writing—review and editing, A.S.A.H. and A.I.; visualization, M.A.A.R., Y.L. and M.A.A.I.; supervision, A.S.A.H., Y.L. and A.I.; project administration, A.S.A.H. and A.I.; funding acquisition, A.S.A.H. All authors have read and agreed to the published version of the manuscript.

Funding

This research was funded by: The INOVASI-2021-002 research grant, Universiti Kebangsaan Malaysia. The SPBK-UMS phase 1/2022 (SBK0518-2022) research grant, Universiti Malaysia Sabah. The APC was funded by Universiti Malaysia Sabah.

Institutional Review Board Statement

Not applicable.

Informed Consent Statement

Not applicable.

Data Availability Statement

Not applicable.

Acknowledgments

The authors would like to thank: The Solar Energy Research Institute, Universiti Kebangsaan Malaysia (UKM). The Faculty of Science and Natural Resources, Universiti Malaysia Sabah (UMS). The INOVASI-2021-002 research grant, Universiti Kebangsaan Malaysia (UKM). The SPBK-UMS phase 1/2022 (SBK0518-2022) (UMS) research grant.

Conflicts of Interest

The authors declare no conflict of interest.

References

  1. Gielen, D.; Boshell, F.; Saygin, D.; Bazilian, M.D.; Wagner, N.; Gorini, R. The Role of Renewable Energy in the Global Energy Transformation. Energy Strateg. Rev. 2019, 24, 38–50. [Google Scholar] [CrossRef]
  2. Balakrishnan, P.; Shabbir, M.S.; Siddiqi, A.F.; Wang, X. Environmental Effects Current Status and Future Prospects of Renewable Energy: A Case Study. Energy Sources Part A Recover. Util. Environ. Eff. 2019, 42, 2698–2703. [Google Scholar] [CrossRef]
  3. Shah Alam, S.; Omar, N.A.; Bin Ahmad, M.S.; Siddiquei, H.R.; Nor, S.M. Renewable Energy in Malaysia: Strategies and Development. Environ. Manag. Sustain. Dev. 2013, 2, 51. [Google Scholar] [CrossRef]
  4. SEDA Malaysia. SEDA Malaysia; SEDA Malaysia: Putrajaya, Malaysia, 2021; ISBN 9789672664307. [Google Scholar]
  5. Abdullah, W.S.W.; Osman, M.; Kadir, M.Z.A.A.; Verayiah, R. The Potential and Status of Renewable Energy Development in Malaysia. Energies 2019, 12, 2437. [Google Scholar] [CrossRef] [Green Version]
  6. Adami, V.S.; Antunes Júnior, J.A.V.; Sellitto, M.A. Regional Industrial Policy in the Wind Energy Sector: The Case of the State of Rio Grande Do Sul, Brazil. Energy Policy 2017, 111, 18–27. [Google Scholar] [CrossRef]
  7. Mohamed, A.M.A.; Al-Habaibeh, A.; Abdo, H. An Investigation into the Current Utilisation and Prospective of Renewable Energy Resources and Technologies in Libya. Renew. Energy 2013, 50, 732–740. [Google Scholar] [CrossRef] [Green Version]
  8. Wang, Q.; Li, R. Drivers for Energy Consumption: A Comparative Analysis of China and India. Renew. Sustain. Energy Rev. 2016, 62, 954–962. [Google Scholar] [CrossRef]
  9. Strielkowski, W.; Sherstobitova, A.; Rovny, P.; Evteeva, T. Increasing Energy Efficiency and Modernization of Energy Systems in Russia: A Review. Energies 2021, 14, 3164. [Google Scholar] [CrossRef]
  10. Tang, C.F.; Tiwari, A.K.; Shahbaz, M. Dynamic Inter-Relationships among Tourism, Economic Growth and Energy Consumption in India. Geosyst. Eng. 2016, 19, 158–169. [Google Scholar] [CrossRef]
  11. Bhattacharya, M.; Paramati, S.R.; Ozturk, I.; Bhattacharya, S. The Effect of Renewable Energy Consumption on Economic Growth: Evidence from Top 38 Countries. Appl. Energy 2016, 162, 733–741. [Google Scholar] [CrossRef]
  12. Krasteva, K. Renewable Energy Technologies; Ideal International E-Publication Pvt. Ltd.: Indore, India, 2018; ISBN 9789386675446. [Google Scholar]
  13. Bekhet, H.A.; Othman, N.S. bt Assessing the Elasticities of Electricity Consumption for Rural and Urban Areas in Malaysia: A Non-Linear Approach. Int. J. Econ. Financ. 2011, 3, 208. [Google Scholar] [CrossRef] [Green Version]
  14. Department of Statistics Malaysia Official Portal. Available online: https://www.dosm.gov.my/v1/index.php?r=column/cthemeByCat&cat=155&bul_id=ZjJOSnpJR21sQWVUcUp6ODRudm5JZz09&menu_id=L0pheU43NWJwRWVSZklWdzQ4TlhUUT09 (accessed on 4 September 2021).
  15. Tenaga Nasional Berhad. Tenaga Nasional Berhad TNB Annual Report 2018; Tenaga Nasional Berhad: Federal Territory of Kuala Lumpur, Malaysia, 2018. [Google Scholar]
  16. Mekhilef, S.; Safari, A.; Mustaffa, W.E.S.; Saidur, R.; Omar, R.; Younis, M.A.A. Solar Energy in Malaysia: Current State and Prospects. Renew. Sustain. Energy Rev. 2012, 16, 386–396. [Google Scholar] [CrossRef]
  17. Jayaraman, K.; Paramasivan, L.; Kiumarsi, S. Reasons for Low Penetration on the Purchase of Photovoltaic (PV) Panel System among Malaysian Landed Property Owners. Renew. Sustain. Energy Rev. 2017, 80, 562–571. [Google Scholar] [CrossRef]
  18. Oh, T.H.; Hasanuzzaman, M.; Selvaraj, J.; Teo, S.C.; Chua, S.C. Energy Policy and Alternative Energy in Malaysia: Issues and Challenges for Sustainable Growth—An Update. Renew. Sustain. Energy Rev. 2018, 81, 3021–3031. [Google Scholar] [CrossRef]
  19. Muhammad-Sukki, F.; Ramirez-Iniguez, R.; Abu-Bakar, S.H.; McMeekin, S.G.; Stewart, B.G. An Evaluation of the Installation of Solar Photovoltaic in Residential Houses in Malaysia: Past, Present, and Future. Energy Policy 2011, 39, 7975–7987. [Google Scholar] [CrossRef]
  20. Kadhem, A.A.; Wahab, N.I.A.; Abdalla, A.N. Wind Energy Generation Assessment at Specific Sites in a Peninsula in Malaysia Based on Reliability Indices. Processes 2019, 7, 399. [Google Scholar] [CrossRef] [Green Version]
  21. Alkawsi, G.; Baashar, Y.; Alkahtani, A.A.; Lim, C.W.; Tiong, S.K.; Khudari, M. Viability Assessment of Small-Scale on-Grid Wind Energy Generator for Households in Malaysia. Energies 2021, 14, 3391. [Google Scholar] [CrossRef]
  22. Al-Aqel, A.A.; Lim, B.K.; Noor, E.E.M.; Yap, T.C.; Alkaff, S.A. Potentiality of Small Wind Turbines along Highway in Malaysia. In Proceedings of the 2016 International Conference on Robotics, Automation and Sciences, Melaka, Malaysia, 5–6 November 2016. [Google Scholar] [CrossRef]
  23. Arroyo, F.R.M.; Miguel, L.J. The Role of Renewable Energies for the Sustainable Energy Governance and Environmental Policies for the Mitigation of Climate Change in Ecuador. Energies 2020, 13, 3883. [Google Scholar] [CrossRef]
  24. Shafie, S.M.; Mahlia, T.M.I.; Masjuki, H.H.; Andriyana, A. Current Energy Usage and Sustainable Energy in Malaysia: A Review. Renew. Sustain. Energy Rev. 2011, 15, 4370–4377. [Google Scholar] [CrossRef]
  25. Mohd Chachuli, F.S.; Mat, S.; Ludin, N.A.; Sopian, K. Performance Evaluation of Renewable Energy R&D Activities in Malaysia. Renew. Energy 2021, 163, 544–560. [Google Scholar] [CrossRef]
  26. Zakaria, S.U.; Basri, S.; Kamarudin, S.K.; Majid, N.A.A. Public Awareness Analysis on Renewable Energy in Malaysia. IOP Conf. Ser. Earth Environ. Sci. 2019, 268, 012105. [Google Scholar] [CrossRef]
  27. Borhanazad, H.; Mekhilef, S.; Saidur, R.; Boroumandjazi, G. Potential Application of Renewable Energy for Rural Electrification in Malaysia. Renew. Energy 2013, 59, 210–219. [Google Scholar] [CrossRef]
  28. Hossain, F.M.; Hasanuzzaman, M.; Rahim, N.A.; Ping, H.W. Impact of Renewable Energy on Rural Electrification in Malaysia: A Review. Clean Technol. Environ. Policy 2015, 17, 859–871. [Google Scholar] [CrossRef]
  29. Halim, A.; Fudholi, A.; Phillips, S.; Sopian, K. Review on Optimised Configuration of Hybrid Solar-PV Diesel System for Off-Grid Rural Electrification. Int. J. Power Electron. Drive Syst. 2018, 9, 1374. [Google Scholar] [CrossRef]
  30. Hamid, A.S.A.; Makmud, M.Z.H.; Rahman, A.B.A.; Jamain, Z.; Ibrahim, A. Investigation of Potential of Solar Photovoltaic System as an Alternative Electric Supply on the Tropical Island of Mantanani Sabah Malaysia. Sustainability 2021, 13, 2432. [Google Scholar] [CrossRef]
  31. Dawood, F.; Shafiullah, G.M.; Anda, M. Stand-Alone Microgrid with 100% Renewable Energy: A Case Study with Hybrid Solar Pv-Battery-Hydrogen. Sustainability 2020, 12, 2047. [Google Scholar] [CrossRef] [Green Version]
  32. Mohd Safari, M.A.; Masseran, N.; Jedi, A.; Mat, S.; Sopian, K.; Bin Abdul Rahim, A.; Zaharim, A. Rural Public Acceptance of Wind and Solar Energy: A Case Study from Mersing, Malaysia. Energies 2020, 13, 3855. [Google Scholar] [CrossRef]
  33. Alam, S.S.; Nik Hashim, N.H.; Rashid, M.; Omar, N.A.; Ahsan, N.; Ismail, M.D. Small-Scale Households Renewable Energy Usage Intention: Theoretical Development and Empirical Settings. Renew. Energy 2014, 68, 255–263. [Google Scholar] [CrossRef]
  34. Solar, T.; Bandar, K. Solar Energy for Socio-Economic Wellbeing in Urban Areas, Malaysia. J. Antarabangsa Alam Tamadun Melayu 2016, 4, 101–107. [Google Scholar]
  35. Yau, Y.H.; Chan, W.C.; Yu, C.W.F. Solar Thermal Systems for Large High Rise Buildings in Malaysia. Indoor Built Environ. 2014, 23, 917–919. [Google Scholar] [CrossRef]
  36. Mohd Sam, M.F.; Tahir, M.N.H.; Rajiani, I.; Muslan, N. Green Technology Compliance in Malaysia for Sustainable Business. J. Glob. Manag. 2011, 2, 55–65. [Google Scholar]
  37. Green Tech: The Rise of Environment-Friendly Technologies |The Edge Markets. Available online: https://www.theedgemarkets.com/article/green-tech-rise-environmentfriendly-technologies (accessed on 20 August 2021).
  38. Vaka, M.; Walvekar, R.; Rasheed, A.K.; Khalid, M. A Review on Malaysia’s Solar Energy Pathway towards Carbon-Neutral Malaysia beyond COVID’19 Pandemic. J. Clean. Prod. 2020, 273, 122834. [Google Scholar] [CrossRef] [PubMed]
  39. Fadaeenejad, M.; Radzi, M.A.M.; Abkadir, M.Z.A.; Hizam, H. Assessment of Hybrid Renewable Power Sources for Rural Electri Fi Cation in Malaysia. Renew. Sustain. Energy Rev. 2014, 30, 299–305. [Google Scholar] [CrossRef]
  40. Krishnamoorthy, M.; Periyanayagam, A.D.V.R.; Santhan Kumar, C.; Praveen Kumar, B.; Srinivasan, S.; Kathiravan, P. Optimal Sizing, Selection, and Techno-Economic Analysis of Battery Storage for PV/BG-Based Hybrid Rural Electrification System. IETE J. Res. 2020, 1–16. [Google Scholar] [CrossRef]
  41. Abdulmula, A.; Sopian, K.; Ludin, N.A.; Haw, L.C.; Elberki, A.; Aldawi, F.; Moria, H. Micropower System Optimization for the Telecommunication Towers Based on Various Renewable Energy Sources. Int. J. Electr. Comput. Eng. 2022, 12, 1069–1076. [Google Scholar] [CrossRef]
  42. Alkassem, A.; Draou, A.; Alamri, A.; Alharbi, H. Design Analysis of an Optimal Microgrid System for the Integration of Renewable Energy Sources at a University Campus. Sustainability 2022, 14, 4175. [Google Scholar] [CrossRef]
  43. Ur Rashid, M.; Ullah, I.; Mehran, M.; Baharom, M.N.R.; Khan, F. Techno-Economic Analysis of Grid-Connected Hybrid Renewable Energy System for Remote Areas Electrification Using Homer Pro. J. Electr. Eng. Technol. 2022, 17, 981–997. [Google Scholar] [CrossRef]
  44. Shahzad, M.; Qadir, A.; Ullah, N.; Mahmood, Z.; Saad, N.M.; Ali, S.S.A. Optimization of On-Grid Hybrid Renewable Energy System: A Case Study on Azad Jammu and Kashmir. Sustainability 2022, 14, 5757. [Google Scholar] [CrossRef]
  45. Kessler, W. Comparing Energy Payback and Simple Payback Period for Solar Photovoltaic Systems. E3S Web Conf. 2017, 22, 00080. [Google Scholar] [CrossRef] [Green Version]
  46. Wei, C.K.; Saad, A.Y. The Potential of Solar Energy for Domestic and Commercial Buildings in Malaysia. J. Adv. Res. Fluid Mech. Therm. Sci. 2020, 75, 91–98. [Google Scholar] [CrossRef]
  47. NEM 3.0—Renewable Energy Malaysia. Available online: http://www.seda.gov.my/reportal/nem/ (accessed on 25 August 2021).
  48. Albani, A.; Ibrahim, M.; Yong, K. The Feasibility Study of Offshore Wind Energy Potential in Kijal, Malaysia: The New Alternative Energy Source Exploration in Malaysia. Energy Explor. Exploit. 2014, 32, 329–344. [Google Scholar] [CrossRef]
  49. Mekhilef, S.; Chandrasegaran, D. Assessment of Off-Shore Wind Farms in Malaysia. In Proceedings of the TENCON 2011—2011 IEEE Region 10 Conference, Bali, Indonesia, 21–24 November 2011; pp. 1351–1355. [Google Scholar] [CrossRef]
  50. Albani, A.; Ibrahim, M.Z.; Taib, C.M.I.C.; Azlina, A.A. The Optimal Generation Cost-Based Tariff Rates for Onshore Wind Energy in Malaysia. Energies 2017, 10, 1114. [Google Scholar] [CrossRef] [Green Version]
  51. Mukhtaruddin, R.N.S.R.; Rahman, H.A.; Hassan, M.Y. Economic Analysis of Grid-Connected Hybrid Photovoltaic-Wind System in Malaysia. In Proceedings of the 2013 International Conference on Clean Electrical Power (ICCEP), Alghero, Italy, 11–13 June 2013; pp. 577–583. [Google Scholar] [CrossRef]
  52. Zailan, R.; Zaini, S.N.; Mohd Rashid, M.I.; Abdul Razak, A. Feasibility Study of Standalone PV-Wind-Diesel Energy Systems for Coastal Residential Application in Pekan, Pahang. MATEC Web Conf. 2017, 131, 2001. [Google Scholar] [CrossRef] [Green Version]
  53. Plants, U.H.P.; Silva, A.R.; Estanqueiro, A. From Wind to Hybrid: A Contribution to the Optimal Design of Utility-Scale Hybrid Power Plants. Energies 2022, 15, 2560. [Google Scholar]
  54. Sinha, S.; Chandel, S.S. Review of Software Tools for Hybrid Renewable Energy Systems. Renew. Sustain. Energy Rev. 2014, 32, 192–205. [Google Scholar] [CrossRef]
  55. Sukarno, K.; Hamid, A.S.A.; Jackson, C.H.W.; Pien, C.F.; Dayou, J. Comparison of Power Output between Fixed and Perpendicular Solar Photovoltaic PV Panel in Tropical Climate Region. Adv. Sci. Lett. 2017, 23, 1259–1263. [Google Scholar] [CrossRef]
  56. Lao, C.; Chungpaibulpatana, S. Techno-Economic Analysis of Hybrid System for Rural Electrification in Cambodia. Energy Procedia 2017, 138, 524–529. [Google Scholar] [CrossRef]
  57. Library. Available online: https://www.homerenergy.com/products/pro/docs/3.14/library.html (accessed on 23 October 2021).
  58. Odou, O.D.T.; Bhandari, R.; Adamou, R. Hybrid Off-Grid Renewable Power System for Sustainable Rural Electrification in Benin. Renew. Energy 2020, 145, 1266–1279. [Google Scholar] [CrossRef]
  59. Karmaker, A.K.; Ahmed, M.R.; Hossain, M.A.; Sikder, M.M. Feasibility Assessment & Design of Hybrid Renewable Energy Based Electric Vehicle Charging Station in Bangladesh. Sustain. Cities Soc. 2018, 39, 189–202. [Google Scholar] [CrossRef]
  60. Umar, R. Assessment of economic feasibility for grid- connected renewable energy system for a household application in terengganu. Int. J. Energy Prod. Mgmt. 2016, 1, 223–232. [Google Scholar] [CrossRef]
  61. Bahramara, S.; Moghaddam, M.P.; Haghifam, M.R. Optimal Planning of Hybrid Renewable Energy Systems Using HOMER: A Review. Renew. Sustain. Energy Rev. 2016, 62, 609–620. [Google Scholar] [CrossRef]
  62. Oviroh, P.O.; Jen, T.C. The Energy Cost Analysis of Hybrid Systems and Diesel Generators in Powering Selected Base Transceiver Station Locations in Nigeria. Energies 2018, 11, 687. [Google Scholar] [CrossRef] [Green Version]
  63. Bauer, C.; Treyer, K.; Heck, T.; Hirschberg, S. Greenhouse Gas Emissions from Energy Systems, Comparison, and Overview. Encycl. Anthr. 2017, 1–5, 473–484. [Google Scholar] [CrossRef]
  64. Hassan, Z.; Suffian Misaran@misran, M.; Siambun, N.J.; Sufiyan, A.; Hamid, A.; Madlan, M.A. Feasibility of Using Solar PV Waste Heat to Regenerate Liquid Desiccant in Solar Liquid Desiccant Air Conditioning System. J. Adv. Res. Exp. Fluid Mech. Heat Transf. 2020, 2, 10–16. [Google Scholar]
  65. Abd Hamid, A.S.; Razali, H. Solar Car: Brief Review and Challenges. Borneo Sci. J. 2019, 40, 27–37. [Google Scholar]
Figure 2. Kampung Batu Satu Peramu, Pekan, Pahang, Malaysia.
Sustainability 14 13684 g002
Figure 3. Kampung Air Puteri, Mersing, Johor, Malaysia.
Sustainability 14 13684 g003
Figure 4. Schematic designs for (a) Pekan, Pahang (solar PV), (b) Pekan, Pahang (hybrid), (c) Mersing, Johor (wind turbine), (d) Mersing, Johor (hybrid).
Sustainability 14 13684 g004
Figure 5. Global Horizontal Irradiance (GHI) for Pekan, Pahang.
Sustainability 14 13684 g005
Figure 6. Wind Resources for Pekan, Pahang.
Sustainability 14 13684 g006
Figure 7. Global Horizontal Irradiance (GHI) for Mersing, Johor.
Sustainability 14 13684 g007
Figure 8. Wind resources for Mersing, Johor.
Sustainability 14 13684 g008
Figure 9. Daily load.
Sustainability 14 13684 g009
Figure 10. Cost summary for Scenario 1.
Sustainability 14 13684 g010
Figure 11. Cost summary for Scenario 2.
Sustainability 14 13684 g011
Figure 12. Emissions from the system for Scenario 1 and Scenario 2.
Sustainability 14 13684 g012
Figure 13. Sensitivity results of PV–wind hybrid system for Scenario 1. (a) Solar radiation parameter for Scenario 1. (b) Wind speed parameter for Scenario 1. (c) The capital cost of the PV panel parameter for Scenario 1. (d) The capital cost of wind turbine parameter for Scenario 1.
Sustainability 14 13684 g013aSustainability 14 13684 g013b
Figure 14. Sensitivity results for Scenario 2. (a) Solar radiation parameter for Scenario 2. (b) Wind speed parameter for Scenario 2. (c) The capital cost of the PV panel parameter for Scenario 2. (d) The capital cost of wind turbine parameter for Scenario 2.
Sustainability 14 13684 g014
Table 1. A review of recent studies on several scenarios using HOMER Pro.
ReferencesYearsScenariosInvestment Analysis
[41]2022
  • Diesel generator with battery (DG + b)
  • Fixed PV module with battery (FPV + b)
  • Dual-Axis PV module tracker system with battery (DPV + b)
  • Fixed PV module and wind turbine with battery (FPV + WT + b)
  • Dual-Axis PV module tracker and wind turbine with battery (DPV + WT + b)
  • 2 KW Pico-hydropower with battery (HP + b)
The optimal layouts with the lowest net present cost (NPC) and cost of energy (COE) are (FPV + b) followed by (HP + b). The NPC and COE costs of (FPV + b) and (HP + b) are 17.45%, 16.45%, 15.9%, and 15.5% lower than those of diesel generators with battery (DG + b), respectively.
[42]2022
  • PV system only
  • Wind turbine only
  • A hybrid system of PV and wind turbine
The PV technology achieved the best option as it has the lowest initial cost per kW, 1150 USD/kW, LCOE of 0.051 USD/kWh, and a simple payback period of 18.6 years.
[31]2020
  • 100% solar PV–battery system
  • 100% solar PV–P2H2P system
  • 100% solar PV and hybrid battery-P2H2P system.
The most cost-effective scenario is a hydrogen-battery hybrid energy storage system. It revealed that it has the lowest NPC and COE over the 25-year project lifespan. In comparison to a battery-based storage system, it uses less excess energy.
[59]2018
  • The proposed electric vehicle charging station (EVCS) comprises a PV module and three biogas generators that generate electricity.
The current cost (NPC) is USD 56,202. The operating cost of the proposed design is USD 2540, and the levelized cost of energy/kWh is USD 0.1302. The proposed EVCS uses less energy than a conventional grid-based charging station. The payback period for solar PV and three biogas generators is 10.1 years, 3.0 years, 3.10 years, and 3.72 years, respectively.
[56]2017
  • Diesel-only
  • Hybrid diesel/PV without battery
  • Hybrid PV/diesel with battery system.
The design of PV/diesel with a battery system is the recommended solution. The system’s initial capital cost and total NPC are USD 2,260,000 and USD 16,661,344, respectively. The COE of the system is USD 0.377/kWh. The design can save 14.3% of diesel fuel consumption, and a carbon footprint can be saved. The most expensive design in electricity generation is diesel-only, while the second most expensive is hybrid diesel-PV without a battery system.
Present study
  • PV system and PV–wind hybrid system
  • Wind turbine and PV–wind hybrid system
The PV–wind hybrid system outperforms the other systems in both scenarios, with NPCs of USD −299,762.16 for Scenario 1 and USD 642,247.46 for Scenario 2. In Scenarios 1 and 2, the PV–wind hybrid system has a lower payback period of 4.86 years and 2.98 years, respectively, than the other systems. In addition, the hybrid system can emit lower emissions compared to one type of RE technology.
Table 2. Scenarios.
Table 2. Scenarios.
ScenariosRenewable Energy TechnologyLimitations
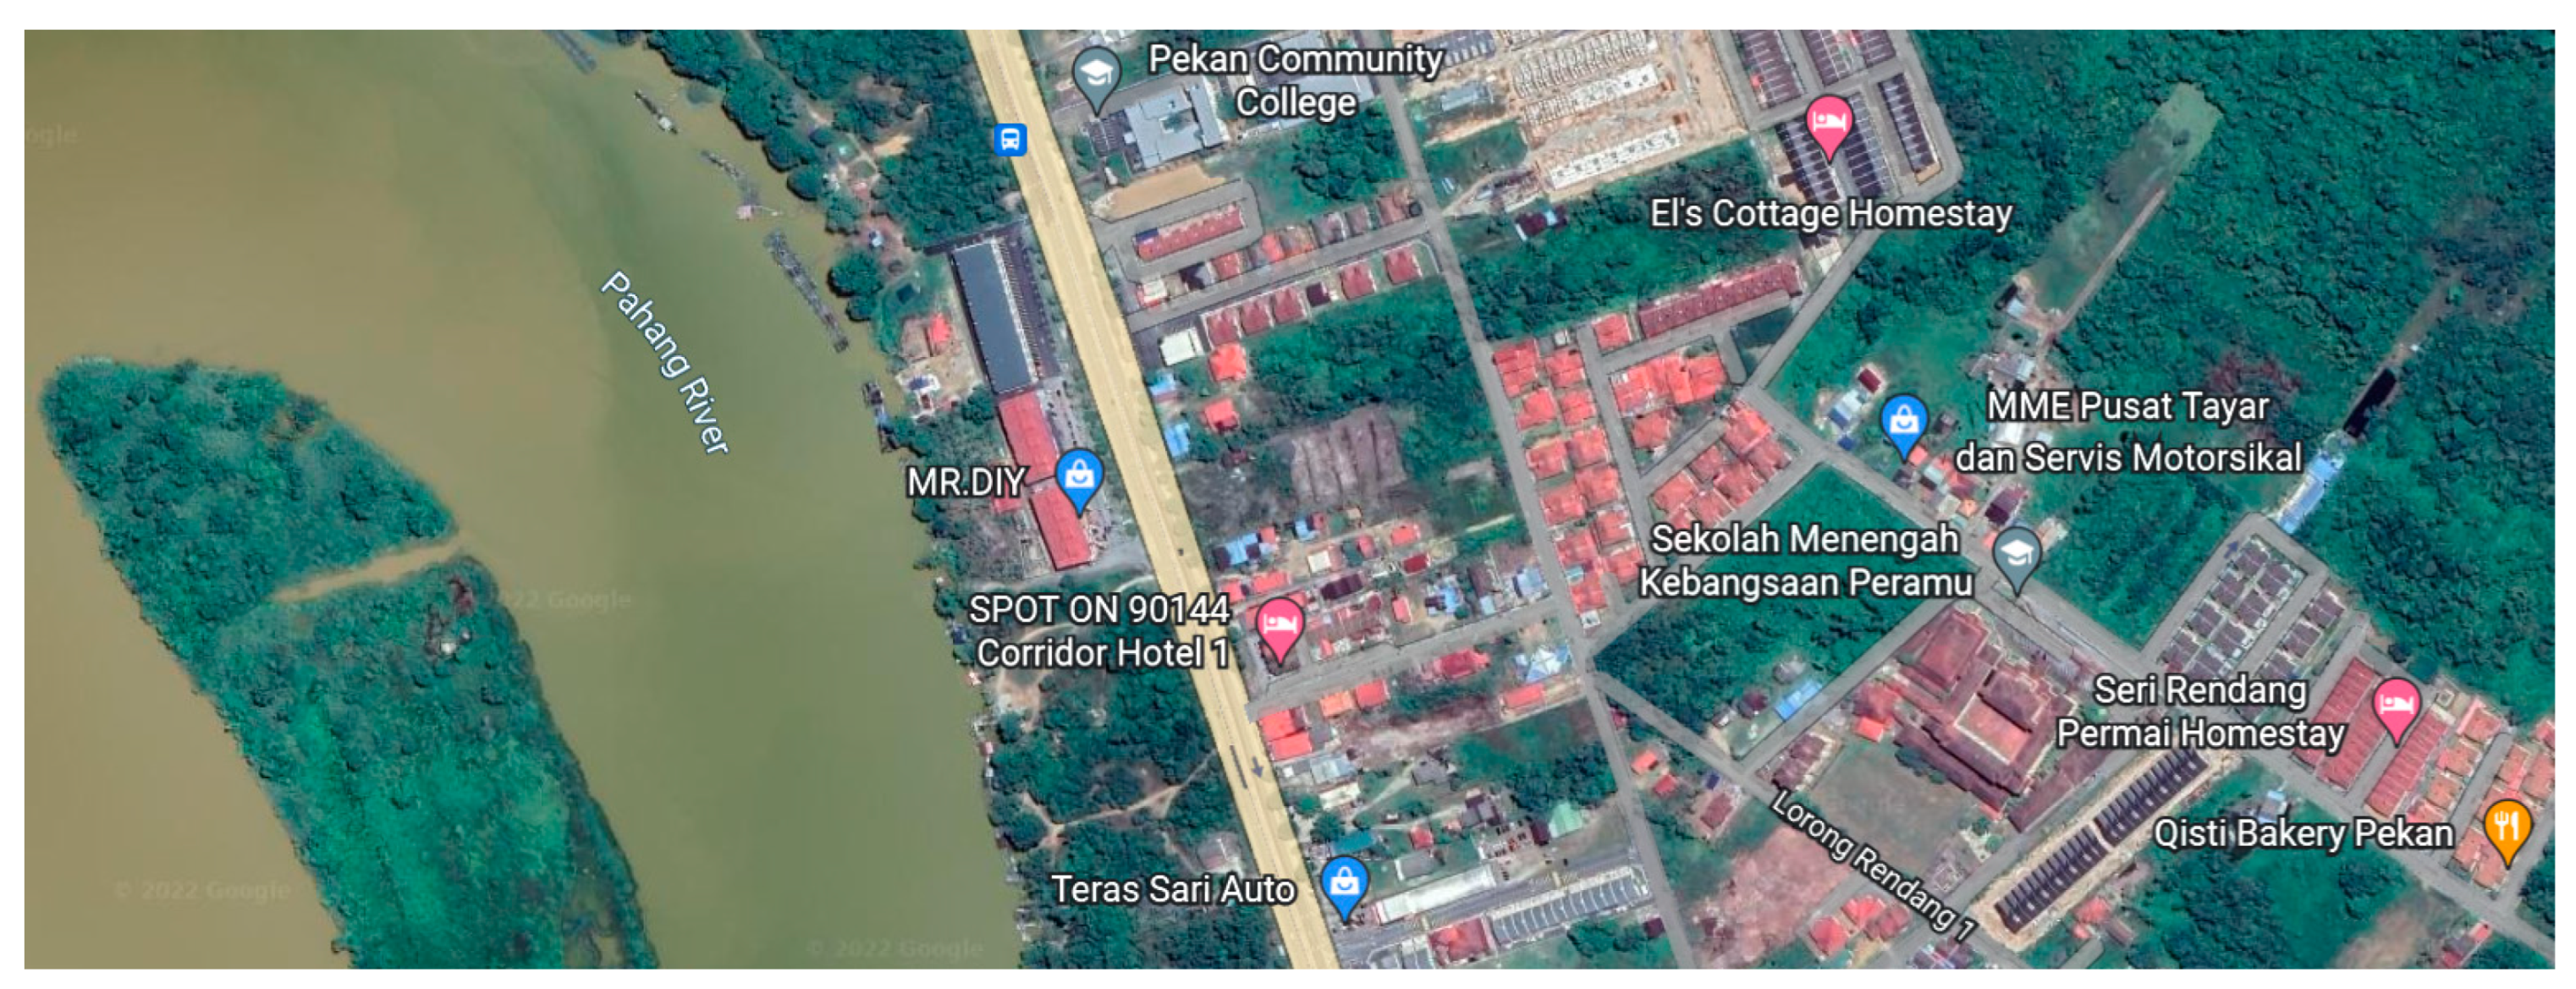
Scenario 1
(Location: Pekan, Pahang, Malaysia)
Pekan, Pahang, is located on the east coast of Peninsular Malaysia in Pahang. The village’s name is Kampung Batu Satu Peramu, a rural area that will have low consumption of electricity. It is located near the beach but has a lower wind speed than other locations. Therefore, a comparison is made using different RE technologies between hybrid and solar energy technology only since wind technology is unsuitable for this location.
  • Solar PV
  • PV–wind hybrid
  • Wind speed at this location is too low for wind turbine generation
  • Rural areas so low consumption of electricity
Scenario 2
(Location: Mersing, Johor, Malaysia)
The village’s name is Kampung Air Puteri, and it is situated near the beach, with solar and wind energy resources simultaneously. The location is rich in wind energy resources and is considered one of Malaysia’s highest wind speeds. According to Mohd Safari et al. [32], the area has a high public acceptance of installing renewable energy technology. RE technologies are compared between wind technology and hybrid technology with battery storage. The utilization of wind energy technology and hybrid technology will significantly benefit the people in that rural area.
  • Wind turbine
  • PV–wind hybrid
  • Rural areas so low consumption of electricity
Table 3. Summary of the input costs for the simulation results.
Component of the SystemCapacity/UnitCapital Cost, USDReplacement Cost, USDOperation and Maintenance Cost, USD
Generator16 kW650058000. 15/op. hour
Solar Panel5 kW11,0009500n/a
Converter1 kW11810015/year
Battery storage1 unit13251190175.2/year
Wind turbine9 units19,40015,00075/year
Table 4. Total Net Present Cost for Scenario 1.
RE TechnologiesTotal Net Present Cost. USD
Solar PV system7256.74
PV–wind hybrid system−299,762.16
Table 5. Total Net Present Cost for Scenario 2.
RE TechnologiesTotal Net Present Cost, USD
Wind-turbine system−637,870.28
PV–wind hybrid system−642,247.46
Table 6. Payback Period for Scenario 1.
Scenario 1: Pekan PahangNet Present Worth, USDPayback Period, Years
Solar PV system10,4868.59
PV–wind hybrid system317,5054.86
Table 7. Payback Period for Scenario 2.
Scenario 2: Mersing JohorNet Present Worth, USDPayback Period, Years
PV–wind hybrid system659,9902.98
Wind turbine system655,6133.06
Table 8. Sensitivity parameters.
Sensitivity ParametersScenariosValues
Solar Radiation, kWh/m2/dayScenario 1 (Pekan, Pahang)4.314.795.27
Wind, m/s3.23.563.92
PV Capital Cost (multiplier value), USD123
Wind Capital Cost (multiplier value), USD123
Solar Radiation, kWh/m2/dayScenario 2 (Mersing, Johor)4.144.65.06
Wind, m/s3.694.14.51
PV Capital Cost (multiplier value), USD123
Wind Capital Cost (multiplier value), USD123
Publisher’s Note: MDPI stays neutral with regard to jurisdictional claims in published maps and institutional affiliations.

