Article

The Impact of Green Innovation on Enterprise Performance: The Regulatory Role of Government Grants

1
China Center for Special Economic Zone Research, Shenzhen University, Shenzhen 518060, China
2
School of Economics & Management, Shanghai Ocean University, Shanghai 201306, China
3
School of Social and Public Administration, Lingnan Normal University, Zhanjiang 524088, China
4
School of Economics & Finance, Zhanjiang University of Science and Technology, Zhanjiang 524094, China
*
Author to whom correspondence should be addressed.
Sustainability 2022, 14(20), 13550; https://doi.org/10.3390/su142013550
Submission received: 6 September 2022 / Revised: 9 October 2022 / Accepted: 13 October 2022 / Published: 20 October 2022

Abstract

:
Green innovation has become an essential pathway to quality manufacturing development. This paper takes green innovation as a starting point to explore the impact of green innovation on enterprise performance and the regulatory effect of government grants, including fiscal subsidies and preferential taxation. An empirical study based on panel data of manufacturing firms listed in Shanghai and Shenzhen A-shares from 2011 to 2019 shows that green innovation contributes to improved enterprise performance. This paper studies the moderating impacts of financial subsidies and tax incentives using the Ordinary Least Squares (OLS) Model with consideration for the two-way fixed effects. The model adopts Tobin’s Q value as the explained variable and focuses on analyzing the influence mechanism of green innovation, financial subsidies, and tax incentives. Both fiscal subsidies and preferential taxation can strengthen the relationship between green innovation and enterprise performance, with the incentive effect of preferential tax being more pronounced when the two policies are pursued in parallel. In general, the regulatory impact of preferential taxation is more pronounced in high-tech manufacturing, while that of fiscal subsidies is in traditional manufacturing. Therefore, this study aims to provide reference suggestions for enterprises and governments to focus on green innovation and rationalize the use of government grants to improve enterprise performance.

1. Introduction

The report of the 19th Central Committee of the CPC proposed that China’s economy has shifted from a high-speed growth stage to a high-quality development stage. To promote high-quality development, it is not only necessary to unswervingly promote supply-side structural reform and implement the innovation-driven development strategy but also to vigorously promote green growth and correctly handle the relationship between “green” and “economy”, which is also an inherent requirement for promoting high-quality development. At this point, green innovation has also become an essential approach to green development for manufacturing enterprises [1,2,3]. In recent years, however, the environmental concerns of companies have come to the fore, and the failure to pursue economic efficiency alone as a business objective has not enabled them to grow in the long term, leading to differences in the impact of green innovation on enterprise performance. As green innovation plays a vital role in the development of a green economy, the government also encourages enterprises to engage in green innovation through various subsidies (e.g., fiscal sponsorships, preferential taxation) to help them reduce the risks associated with creation [4,5] and alleviate financing constraints [6,7,8,9]. Unfortunately, the effects of government grants are sometimes less than significant, and from time to time, fraudulent subsidies and rent-seeking distort the market.
Current research on the relationship between green innovation and enterprise performance is divided. Traditionally, it is believed that there is a conflict between green innovation and enterprise performance, with firms undertaking green innovation increasing firm costs and tying up resources [10,11,12], while the resulting enterprise performance does not cover the costs [13,14]. If enterprises are reactive to green innovation, it can threaten their financial performance [15,16]. Wong et al. found that implementing a green innovation strategy initially has a significant negative impact on firm value during the current stage of a firm’s development [17]. The revisionist view, represented by Porter, shows that green innovation and business performance can co-exist and that it can help enterprises improve efficiency and reduce costs; facilitate the accumulation of resources and capabilities for enterprises to promote green innovation behavior, product and process innovation, and help them gain a green premium and competitive advantage. Several scholars have demonstrated that green innovation reduces enterprise production costs and boosts enterprise performance in terms of both green product and process innovation [18,19,20].
On the other hand, they explored the impact of green product innovation on enterprise performance, arguing that green innovation brings cost not only efficiency but also profitability to firms and that the pursuit of green product innovation can better contribute to enterprise performance in terms of both cost efficiency and profitability even in a dynamic environment [21,22,23,24,25]. There is rich research literature exploring green innovation from different theoretical perspectives, and studies from a strategic flexibility perspective have found that green innovation can contribute to improved enterprise performance [26,27,28]. From the standpoint of executives’ environmental awareness, the accumulation of intangible green resources and capabilities such as green image and stakeholder recognition by green innovation is found to be a source of advantage for corporate growth, which is conducive to the formation of unique path advantages and the enhancement of corporate business performance [29,30]. With heavily polluting enterprises as research subjects, it was found that green technology innovation can promote enterprise performance [31,32,33,34].
In the transition period of high-quality growth, the mechanism of innovation has been in a vague state. As a developing country, policy guidance has always been the main driving force of science and technology. Therefore, the study on how financial subsidies and tax incentives affect the business performance of enterprises can guide future policy development. It fills the research gap in innovation-driven development in developing countries, especially answering academic disputes caused by the impact of green innovation on enterprise efficiency and cost and how the positive and negative effects play a role. Finally, it provides a reference for studying the impact of fiscal subsidies and tax incentives on enterprise development.
There are few studies on the relationship between green innovation, government grants, and enterprise performance. Existing scholars have mainly used green innovation as a mediating variable to investigate the impact of factors internal and external to the enterprise and enterprise performance [35,36] or around areas similar to government grants, such as environmental regulation [37,38,39,40] and environmental regulation, among others [41,42,43]. The above factors about green innovation and enterprise performance have been studied, and the results have not been uniform. Based on the above background, this paper will explore the relationship between green innovation and enterprise performance from two ways of government grants, which on the one hand, widens the research perspective on the relationship between green innovation and enterprise performance, and on the other hand, helps enterprises recognize the critical role of green innovation, and make reasonable use of preferential taxation and preferential taxation while providing reference suggestions for the government to formulate preferential policies. This paper studies the positive contribution of tax incentives and financial subsidies by using the moderating effect model and the role of tax incentives and financial support at the micro level by using Tobin’s Q theory as the explained variable. Scholars only study the positive contribution at the macro level but ignore the mechanism of innovation and financial support at the micro level. The research in this paper makes up for the gap in microanalysis.

2. Theoretical Framework

2.1. Green Innovation and Enterprise Performance

Green innovation refers to the reduced environmental damage to which companies modify products, processes, systems, and procedures [44,45,46]. Firstly, based on the resource-based view, green innovation can not only effectively reduce production and operating costs and improve resource utilization but also help business leaders to raise environmental awareness, encourage employees to think outside the box and increase employee participation in the organization, which is conducive to creating customer value, enabling companies to gain a competitive advantage, build a good corporate image and improve the enterprise performance. Secondly, based on a capability view perspective, green innovation is seen to enhance the critical capabilities of enterprises [47,48,49]. It can increase the overall green learning capacity of the organization by encouraging employees to actively learn green knowledge and skills [50,51,52], increasing the level of pollution prevention efforts of the company, and reducing the cost of environmental and non-compliance fees. It is also combined with a green innovation strategy to enhance the company’s innovation and integration capabilities; acquiring these key competencies allows the company to develop a unique pathway advantage and improve its performance. Finally, from the perspective of stakeholder theory, it is argued that green innovation not only strengthens long-term cooperation with suppliers, investors, and customers, eases financing constraints, and reduces market risks but also helps to urge enterprises to integrate green concepts into product design through green innovation strategies (such as front-end and end-of-pipe innovation), produce green products, meet stakeholders’ environmental demands, win consumers’ trust, and stimulate more green purchasing behavior, gain sustainable competitive advantages, enhance enterprise reputation, and directly or indirectly improve enterprise performance. On this basis, Hypothesis 1 is formulated.
Hypothesis 1.
All other things being equal, green innovation can improve enterprise performance.

2.2. The Regulatory Role of Government Grants

The view of information asymmetry theory suggests differences in the practical information available to both sides of a transaction in a market simultaneously. At the same time, innovation activities are fraught with risk and uncertainty and often require substantial capital investment. Enterprises usually want external funding support to mitigate these risks to reduce the tension. However, most enterprises carry out innovation with a cautious attitude, disclose less, make outside investors have insufficient understanding of the enterprise innovation project, not easily investment, enterprises and investors between information asymmetry and moral risks, and improve the enterprise financing costs [53,54,55]. In addition, green innovation can have a spillover effect, causing other companies to ride on the bandwagon and creating a positive externality, which makes the investment in R&D unequal to the benefits due to the company and reduces the incentive for companies to innovate green when the government needs to provide government grants to support companies.
As the two main instruments of government grants in China, fiscal subsidies and preferential taxation are increasing in scope and incentive yearly. However, there are significant differences between the two in incentive mechanisms and implementation processes. In the following, fiscal subsidies and preferential taxation are discussed, and hypotheses are presented.

2.2.1. Regulatory Role of Fiscal Subsidies

Fiscal subsidies are non-reimbursable government funding for specific enterprises through direct subsidies. An ex-ante incentive is available before the enterprise undertakes the innovation activity, which can directly increase the cash flow of the micro-entity with certainty. The government, as well as the fiscal authorities, will designate and direct the use of revenues. Such subsidies can both directly compensate for the lack of resources in firms’ innovation and alleviate the pressure on firms due to the high risks and costs of innovation inputs, help firms reduce the spillover of innovation, compensate for the decline in returns due to positive externalities, enhance firms’ incentives to green innovation, encourage them to invest more in innovation [56,57], promoting innovation output and thus increasing enterprise performance. Additionally, fiscal subsidies have a unique signaling effect, i.e., they can be used to subsidize enterprises through a messaging impact, equivalent to labeling them as supportive and encouraging. It recognizes them and indirectly helps them to raise their profile, reduce their financing costs, improve their external financing capacity, and promote innovation, thus contributing to improved performance. Based on this, this paper proposes Hypothesis 2.
Hypothesis 2.
Fiscal subsidies reinforce the impact of green innovation on enterprise performance.

2.2.2. Regulatory Role of Preferential Taxation

Preferential taxation is a form of indirect subsidy, which is a variety of preferential tax treatment given by the government to taxpayers through policies that deviate from the basic structure of the current tax system, mainly including the granting of tax rate concessions, tax credits, and tax deductions, tax rebates, etc., to encourage enterprises to increase the intensity of investment in innovation and the proportion of scientific and technological personnel, thereby reducing the tax burden and thereby subsidizing specific taxpayers and their activities [58,59]. Preferential taxation tends to be more detailed so that physical and human capital, for example, play a more significant role in innovation and accelerate the output of enterprise innovation. Preferential taxation can also be applied to promote technology transfer using more elaborate designs to compensate for spillover effects from innovative activities, accelerate the transfer of innovations, and encourage progress in the enterprise. Preferential taxation is more neutral than fiscal subsidies and is an ex-post incentive. This leads to Hypothesis 3.
Hypothesis 3.
Preferential taxation reinforces the impact of green innovation on enterprise performance.

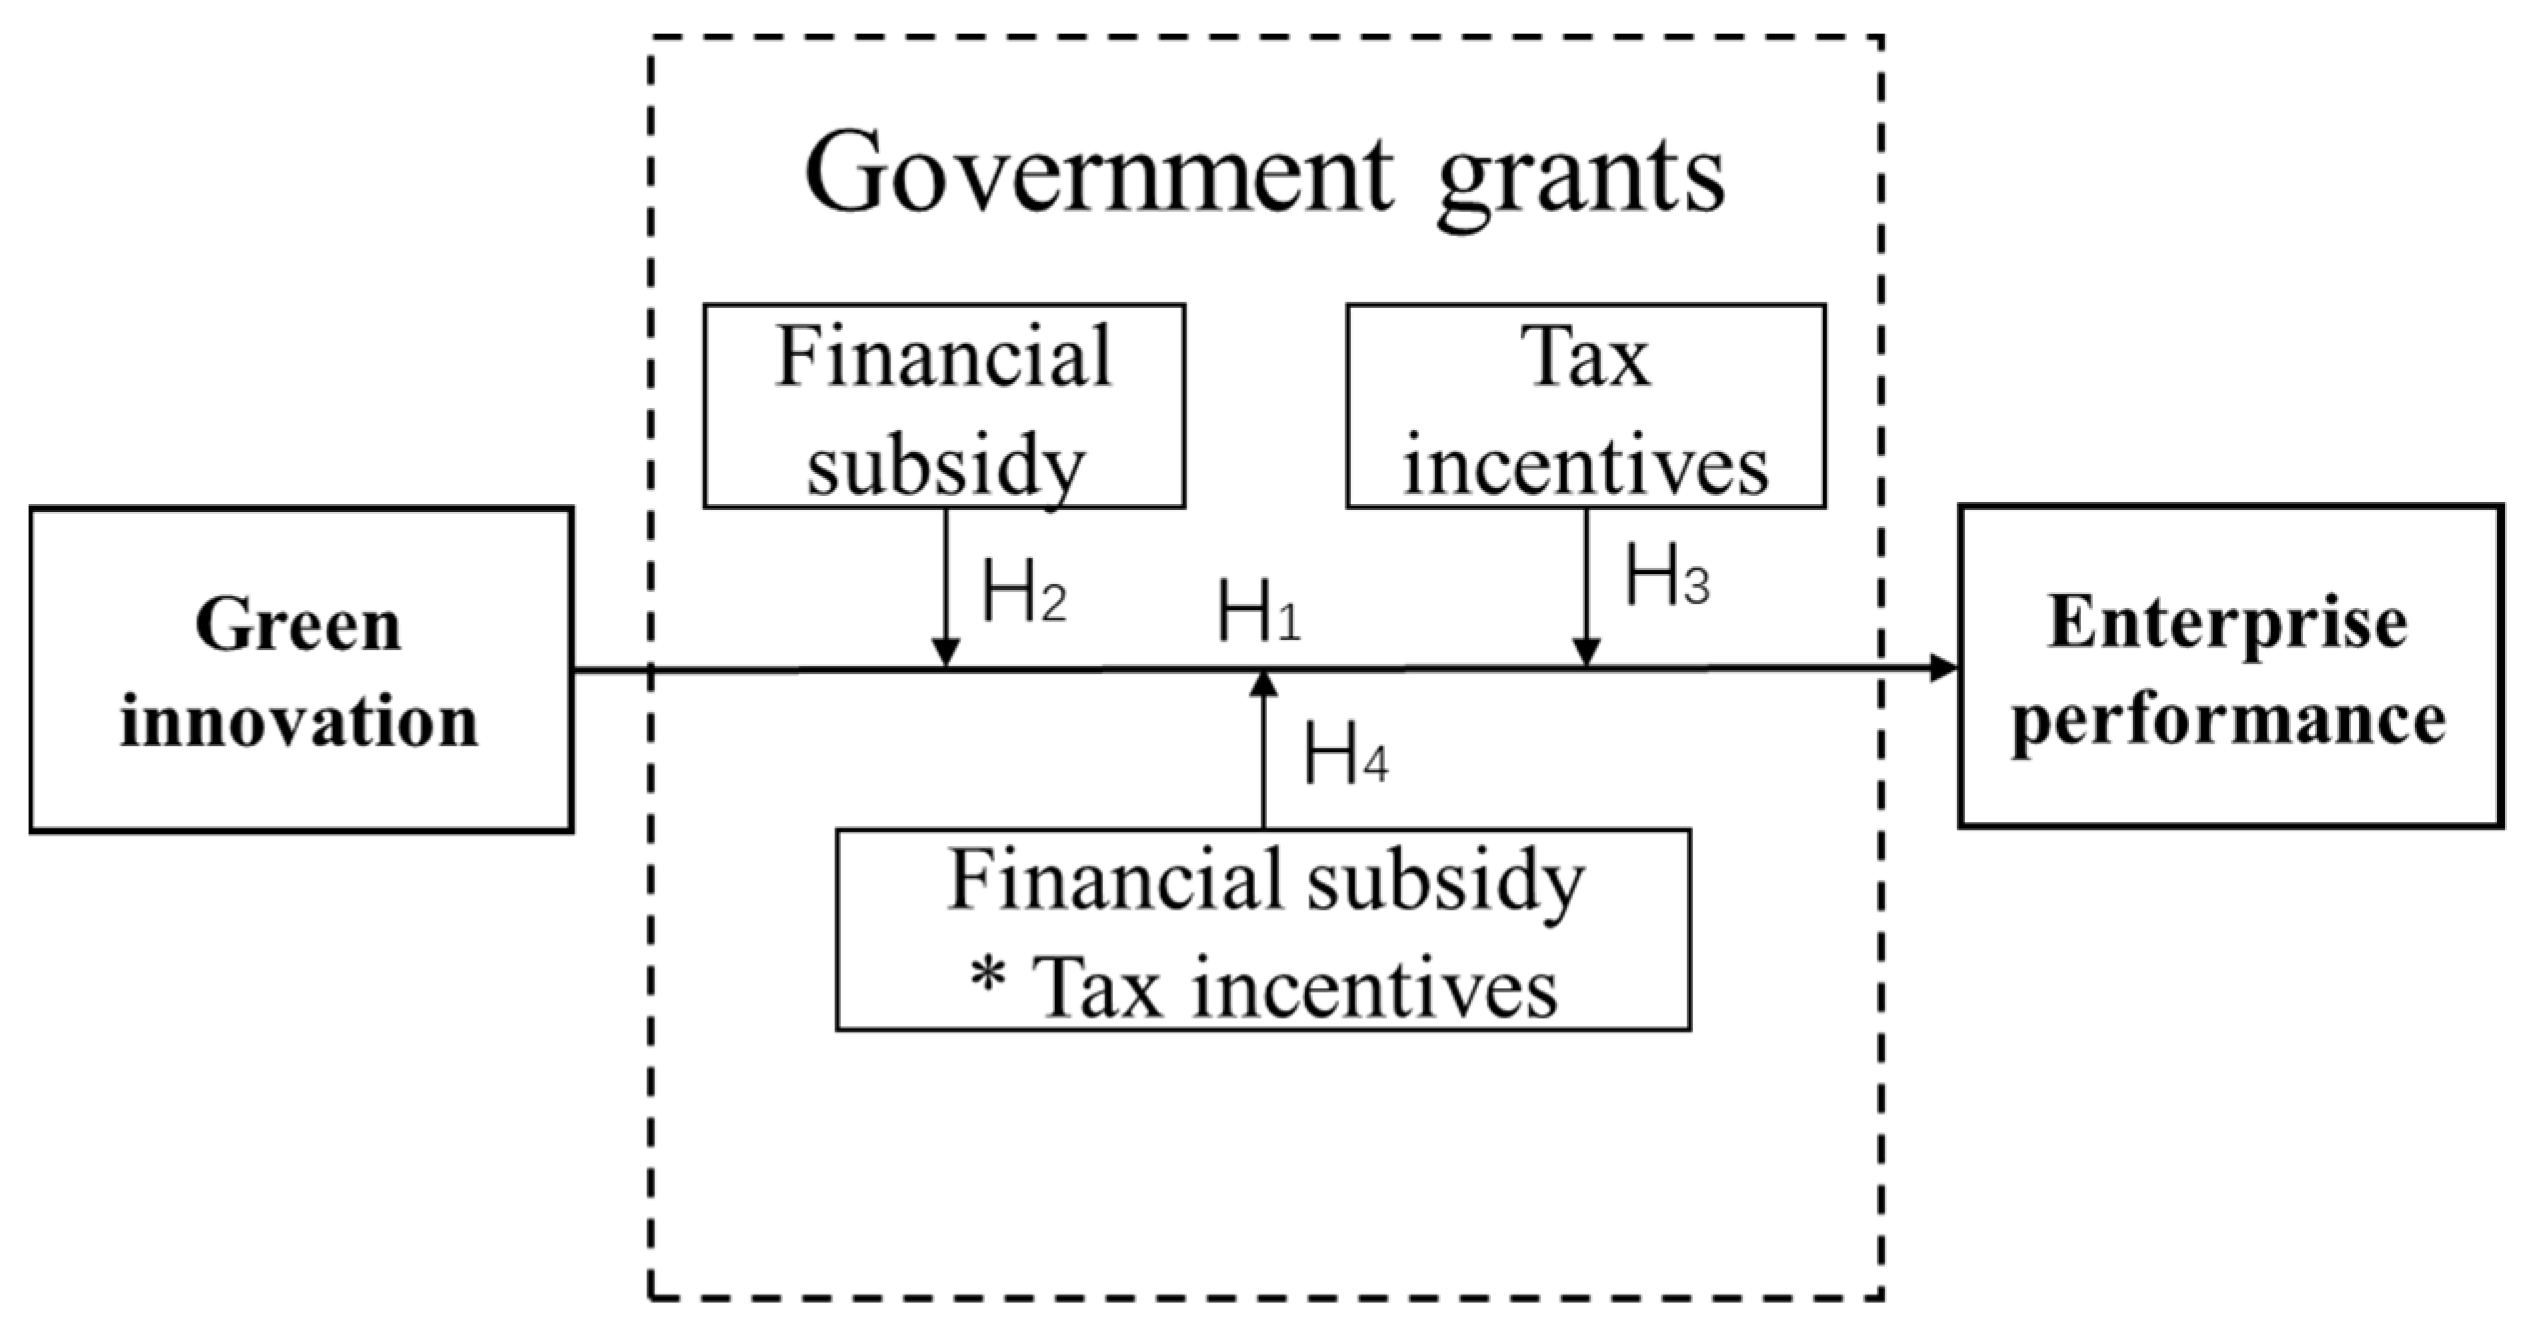
2.2.3. The Regulatory Effect of Fiscal Subsidies and Preferential Taxation When They Go Hand in Hand

When two policies, fiscal subsidies and preferential taxation, run in parallel, the fiscal contributions act as an ex-ante incentive, easing the financing constraints of enterprises, raising their expected revenues, and promoting innovative activities. Preferential taxation, as an ex-post incentive, further reduces the R&D cost of creative activities, accumulates wealth for the enterprise, and accelerates the reinvestment of the enterprise.
At the same time, when choosing government grants, some foreign scholars prefer preferential taxation with comprehensive coverage, fairness, and more autonomy than other funding methods (such as fiscal subsidies). Additionally, preferential tax may be more timely than fiscal expenditure considering the policy time lag [60,61,62]. R&D subsidies may distort the prices of innovation input factors, have a crowding-out effect on R&D investment, and may make firms dependent, but tax incentives positively impact both innovation effectiveness and innovation quality. Fiscal subsidies, while providing leverage, are more likely to have adverse effects than tax incentives, for example, by undermining fair competition for businesses. Short-term fiscal subsidies may distort resource allocation and disrupt the market if used for long-term purposes.
On the other hand, preferential taxation is favored by more scholars due to its wider target audience, more significant advantages in terms of market intervention, administrative costs and flexibility, and more substantial equity. This indirect way to encourage green innovation activities of enterprises solves the dilemma of insufficient funds and reflects the government’s leading role. This leads to Hypothesis 4:
Hypothesis 4.
The relationship between green innovation and enterprise performance is positively moderated by both policies in parallel, with the moderating effect of preferential taxation being more pronounced.
According to Schumpeter’s Theory of Economic Development, the fundamental reason to promote economic development is the “innovation” activities of entrepreneurs to reform the economic structure from the inside. Innovation is the “establishment of a new production function”. The entrepreneur implements a “new combination” of production factors and conditions. In this process, because of the discovery of new needs, the invention of new technologies and the development of new products need to pay a considerable cost. Therefore, it is noted that tax incentives and financial support can directly reduce the cost of innovative behavior. The elaboration of the tax incentives and financial support can be traced back to Keynesian fiscal policy. Indeed, Keynesian fiscal policy and Schumpeter’s innovation have been revealed to have a facilitation role in promoting economic growth. Respectively, the former encourages the increase of production and consumption and focuses on the amount of change. Additionally, the latter focuses on the innovation of economic and quality growth. So, the point of research is how to use fiscal policy to promote financial growth innovation.
The common feature of Schumpeter’s and fiscal stimulus theories is the requirement for firms to achieve much profitability. Fiscal stimulus focuses only on appearance, while Schumpeter’s economic theory of innovation focuses more on the innovative competitiveness of firms. How can financial support influence the firm’s innovation capacity and ultimately show an increase in comprehensive profitability? For this purpose, Tobin’s Q theory can be used to express the composite profitability, in other words, the ratio of the market value of the firm’s stock to the replacement cost of the assets represented by the store as the explanatory variable. Innovation capability is an essential factor in enhancing the competitiveness of enterprises, and the growth of innovation capability and corresponding financial subsidies are closely related. Therefore, this model adopts the moderating effect of fiscal subsidies and tax support, and this paper selects tax stimulus and fiscal subsidies as fiscal incentive variables. The number of patents measures the innovation ability of the firm. The variable selection combines Schumpeter’s economic theory of innovation and fiscal incentives.
Shown in Figure 1 is a model of the relationship between green innovation, government grants, and enterprise performance based on the above analysis and hypothesis.
The ability to innovate occupies an increasing proportion of corporate profits. Therefore, the explanatory power gradually increases in green innovation on business capabilities. For developing countries, science and technology and innovation capacity need policy support, which is most directly reflected in financial subsidies and tax incentives. Therefore, its theoretical context can be summarized as follows: innovation capacity determines the business performance of enterprises, and innovation capacity depends on financial subsidies and tax incentives. Among them, due to the differences in the development background of enterprises, for example, the innovation-driven transformation of stable enterprises can be solved by enterprise capability. In contrast, for the development of emerging enterprises, financial support is critical in innovation development. To distinguish the main factors of stable and emerging enterprises, this paper uses economic indicators and enterprise age as control variables, which increases the robustness of the moderating effect of financial subsidies and tax incentives.

3. Materials and Methods

3.1. Sample Selection and Data Sources

Manufacturing companies listed on A-shares in Shanghai and Shenzhen from 2011 to 2019 were selected as the research objects of this paper. Firstly, it is a good representation because of the characteristics of listed companies, such as solid innovation ability, high frequency of innovation activities, a large number of patents, and easy access to data. Additionally, secondly, compared to other industries, the manufacturing industry faces environmental pressure and social and governmental supervision as a pillar of the national economy and has higher enthusiasm and participation in green innovation.
Compared with traditional cross-sectional data sets or time series data sets, panel data sets have many advantages: for example, panel data can usually provide researchers with a large number of data points, thus increasing the degree of freedom of data and reducing the collinearity between explanatory variables, thus improving the effectiveness of measurement model estimates. To ensure the stability and validity of the data, after excluding the samples that had not operated continuously for two years, those with severe gaps in the data, and those in the ST category, enterprises with negative effective tax rates were also removed, of which all data were subjected to tailoring and balancing, resulting in the construction of a balanced panel database with 4039 observations. Of these, the green patents were collected manually through a patent search in the SIPO patent database of the China Intellectual Property Office, while all other data were obtained from the Guotaian database. The study was completed with the help of STATA 15.0 software.

3.2. Variable Design

Enterprise performance (Tobin’Q). Enterprise performance is measured in this study by drawing on De [63] and Chouaibi [64] via Tobin’s Q. Tobin’s Q is considered to be a market indicator that is somewhat future-pointing and risk-adjusted, reflecting current and future expected rates of return, and is more indicative of enterprise value and long-term performance.
Green Innovation (Gpatent). Existing literature on the measurement of corporate green innovation mainly includes industrial emissions and the sales revenue per unit of energy method, but all of these methods are highly subjective. Therefore, this paper draws on several studies [65,66,67] to overcome these shortcomings. Schumpeter’s innovation theory calls for destroying the old production process and replacing it with a new process as technological innovation. Green innovation is a new process and method to reduce environmental risks using new production methods. We believe that patents represent the generation of new knowledge and new processes. Here, we use the number of green patent applications to measure the degree of technological innovation. The advantage of using a company’s green patent applications to measure green innovation is that it is more objective and has a larger sample size. This is done by searching the patent database for patents containing key indicators such as “low carbon”, “environmental protection”, “green”, “pollution reduction”, “energy saving”, “clean”, “conservation”, “sustainable”, “ecological”, “environmental pollution”, etc., which are considered green patents.
Fiscal subsidies (Sub). Most scholars use the number of government grants or take the logarithm to measure budgetary contributions, but there is generally a lag effect of financial subsidy policies. Therefore, the studies by scholars mentioned earlier in this paper [68,69] used government grants with a one-period lag to represent fiscal subsidies.
Preferential taxation (Taxp). Income tax is a significant source of tax liability for businesses and a vital part of the tax revenue by the government. De Azevedo Rezende [63] and other scholars argue that the difference between the income tax rate and the effective tax rate better reflects the extent of preferential taxation, so this paper draws on previous research and uses the difference between the nominal and effective tax rates of income tax to measure the tax benefits received by enterprises.
Control variables. Other control variables need to be added to accurately study the impact of green innovation on enterprise performance and obtain robust results, excluding the effect of sample variability. Based on the experience of previous studies and the purpose of this paper, firm age (Age), firm size (Size), financial leverage (LEV), capital intensity (INVE), firm growth (Growth), operating efficiency (CE), and operating cash flow (CF) were selected as control variables and the year (Year) dummy variable was added to the model. The variable symbols and specific calculation methods are shown in Table 1.
Firstly, this paper designs the regression model of innovation ability on enterprise performance and then uses the moderating effect model to create the practical model of financial subsidies, tax incentives, and the combined effect of the two cross effects. The specific form of the model is expressed in Equations (1)–(4).

3.3. Modeling

This paper analyzes the following four-panel data models with two-way fixed effects to test the above hypotheses based on the Ordinary Least Squares (OLS) Model. To test the impact of green innovation on enterprise performance, model (1) is constructed, model (2) is used to test the moderating effect of fiscal subsidies, model (3) is used to test the moderating effect of preferential taxation, and model (4) is used to determine the moderating effect of the two policies when they are in parallel. Where Tobin’Qi,t represents enterprise performance, Gpatentsi,t represents green innovation, Subi,t-1 represents fiscal subsidies, Taxpi,t represents preferential taxation, Controli,t is the set of control variables, and εi,t is the regression residuals.
T o b i n Q i , t = α 0 + β 1 G p a t e n t s i , t +   θ i C o n t r o l i , t + ε i , t  
T o b i n Q i , t = α 0 + β 1 G p a t e n t s i , t + β 2 S u b i , t 1 + β 3 G p a t e n t s i , t × S u b i , t 1 +   θ i C o n t r o l i , t + ε i , t  
T o b i n Q i , t = α 0 + β 1 G p a t e n t s i , t + β 2 T a x p i , t + β 3 G p a t e n t s i , t × T a x p i , t +   θ i C o n t r o l i , t + ε i , t  
T o b i n Q i , t = α 0 + β 1 G p a t e n t s i , t + β 2 S u b i , t 1 + β 3 G p a t e n t s i , t × S u b i , t 1 + β 4 T a x p i , t + β 5 G p a t e n t s i , t × T a x p i , t +   θ i C o n t r o l i , t + ε i , t  

4. Empirical Results and Analysis

4.1. Descriptive Statistics

Table 2, descriptive statistics for the main variables, shows a mean value of 1.166 for green innovation, a maximum weight of 206, a minimum value of 0, and a standard deviation of 6.423, which indicates that there are significant differences in green patent applications between different manufacturing companies and a substantial stratification in willingness to innovate green. The maximum value of fiscal subsidies was 16.877, the minimum value was 0, and the standard deviation was 0.658, indicating that budgetary contributions generally assisted the sample enterprises. The maximum value of preferential taxation was 14.482, the minimum value 0, and the standard deviation 0.371, indicating that the sample enterprises received less preferential tariff. Additionally, the more significant standard deviations are for company age and financial leverage, meaning a more substantial variation in the time the sample companies have been established and the extent to which they have raised debt.

4.2. Correlation Test

Table 3 shows the correlation tests for the variables. (1) Both green innovation and fiscal subsidies have significant adverse effects on the explanatory variables, which may be because other relevant variables have not been added, making individual variables not accurately reflect the genuine relationship; preferential taxation has a non-significant positive relationship with them, indicating that preferential taxation can provide some assistance to improve the enterprise performance. (2) There is a significant positive relationship between firm age and operating cash flow on enterprise performance, indicating that an increase in firm age and operating cash flow can help enhance firm stability and facilitate firm growth. (3) The positive relationship between firm age on green innovation, fiscal subsidies, and preferential taxation indicates that as firms grow older, they accumulate more experience and resources, take a longer-term view, are more willing to innovate, and are more likely to receive fiscal subsidies and preferential taxation. (4) Firm size has a significant positive effect on green innovation, fiscal subsidies, and preferential taxation and a significant adverse effect on enterprise performance, suggesting that larger firms may be more likely to receive government subsidies in pursuing innovation. However, that excessive size, in turn, can hinder performance. Finally, the variables were subjected to a variance inflation factor test, and the maximum VIF was found to be 2.24, which is much less than ten. Therefore, there was no significant multicollinearity. Since the correlation is uncertain, the deterministic functional relationship between variables needs to be further studied in the future.

4.3. Regression Analysis

In making the model selection for the panel data, the F-test and Hausman test led to the choice of a fixed effects model for the final hypothesis testing. Cluster standard errors are used in regression to report results to eliminate the effects of heteroskedasticity and autocorrelation problems. In contrast, the regression tests for regulatory developments were performed by standardizing the variables of interest. Detailed regression results are shown in Table 4.
As seen in Table 4, model (1) reports the results of the impact of green innovation on enterprise performance and finds that green innovation is significantly and positively related to enterprise performance. The regression coefficient corresponding to green innovation is 0.0065. It has passed the significance test at the 0.01 level, verified in Hypothesis 1, indicating that green innovation activities undertaken by companies benefit their development and promote the improvement of their performance.
Model (2) reports the regulatory effect of fiscal subsidies, with a regression coefficient of 0.0040 for the cross-product term, which passes the significance test at the 0.1 level, and an adjusted R2 increase of 0.0015, indicating that fiscal subsidies play a positive regulatory role in the relationship between green innovation and enterprise performance, thus validating Hypothesis 2.
Model (3) reports the moderating effect of preferential taxation, from which it can be seen that the regression coefficient of the cross-product term is 0.0247 and has passed the significance test at the 0.05 level. The adjusted R2 increased by 0.0004, indicating that preferential taxation significantly contributed to the relationship between green innovation and enterprise performance, and Hypothesis 3 passed the test.
Model (4) reports the overall regulatory effect of fiscal subsidies and preferential taxation on the relationship between green innovation and enterprise performance. When both policies are included, the coefficient of the fiscal grants and green innovation interaction term is 0.0040, and the coefficient of the preferential taxation and green innovation interaction term is 0.0245, which are significant at the 0.1 and 0.05 levels, respectively. On the one hand, the parallelism between the two can still have a significant positive regulatory effect on the relationship between green innovation and enterprise performance. It can be seen that the coefficient of preferential taxation is significantly higher than that of fiscal subsidies, indicating that the regulating effect of a preferential tax is better than that of budgetary contributions.

4.4. Robustness Test

To ensure the robustness of the results, the following robustness tests were also performed in this paper.

4.4.1. Endogenous Test

Generally, firms tend to consider green innovation when their performance is high. To address the effect of bidirectional causality on the regression results, the model is re-regressed using a systematic GMM approach in this paper. Drawing on previous studies, the mean of the logarithm of the number of patents in the same industry and region in the same year was selected as the instrumental variable for green innovation. The results are shown in Table 5. The judgments revealed that the instrumental variables were selected appropriately, further validating Hypothesis 1.

4.4.2. Replacement Indicators

First, the explanatory variables were replaced. The regression results are presented in Table 6 using EVA instead of Tobin’s Q. It can be seen that the four hypotheses were primarily tested.
Second, explanatory variables were replaced. As the specific amount of green innovation investment is not separately marked within the company, R&D investment is used as a measure of green innovation instead of green patents. The results are shown in the right-hand column (1) of Table 6, proving that green innovation improves enterprise performance.
Finally, there is the substitution of moderating variables. The amount of government grants in the current period represents fiscal subsidies, and the amount of tax rebates received in the cash flow statement is used to measure tax benefits. Columns (2) and (3) conclude that fiscal subsidies and preferential taxation positively affect the relationship between green innovation and enterprise performance. Column (4) shows the results when the two policies are in parallel and finds that fiscal subsidies and after-preferential taxation have a positive regulatory effect. However, here the coefficient of preferential tax is smaller than that of budgetary contributions, and Hypothesis 4 is only partially tested.

4.4.3. Model Replacement

The above empirical procedure used a fixed effects model, which was changed here to an OLS model and re-run as a regression, and the results are still reasonably robust.

4.5. Further Analysis

In this paper, the manufacturing industry is divided into high-tech and traditional manufacturing industries to explore further the impact of green innovation on enterprise performance in manufacturing industry segments. Concerning the classification method of the High Technology Industry (Manufacturing) Classification (2017), six major categories, namely pharmaceutical manufacturing, aviation, spacecraft and equipment manufacturing, electronics and communications equipment manufacturing, computer and office equipment manufacturing, medical instrumentation, and instrumentation manufacturing, and information chemicals manufacturing, are classified as high technology manufacturing industries. The rest of the manufacturing sector is classified as traditional manufacturing. Most high-tech manufacturing industries are proliferating with high levels of innovation activity and several government incentives to encourage their development [70]. In contrast, traditional manufacturing industries have relatively little innovation activity and fewer government subsidies to apply, so the two manufacturing industries may differ in their regression results. Table 7 shows the regression results for high-tech and traditional manufacturing, in which green innovation positively impacts enterprise performance in both manufacturing segments, suggesting that green innovation can contribute to enterprise performance in both manufacturing sectors. Fiscal subsidies and preferential taxation have a positive regulatory effect in both high-tech and traditional manufacturing. The coefficient of cross-multiplication between fiscal sponsorships and green innovation is smaller in high-tech manufacturing and more extensive in conventional manufacturing. The coefficient of cross-multiplication between preferential taxation and green innovation is more significant in high-tech manufacturing and more minor in traditional manufacturing and even becomes negative in traditional manufacturing when the two policies co-exist, suggesting that preferential taxation has a better moderating effect in high-tech manufacturing, possibly because high-tech manufacturing enjoys more preferential taxation from the government and takes advantage of preferential taxation more frequently. On the other hand, fiscal subsidies are more positively promoted in traditional manufacturing, which may be caused by less preferential taxation for conventional manufacturing and more frequent use of budgetary contributions.
The innovation ability of the enterprise has a significant influence on the business ability of the enterprise. Fiscal subsidies and tax incentives have played an enhanced role. Fiscal subsidies and tax incentives can reduce the cost of innovation. Such innovative behavior will occur only when the economic gains brought by creative behavior are sufficiently attractive to enterprises. Therefore, the promoting effect is amplified in financial and tax support mechanisms, and enterprises will generate enough motivation to pursue innovation. Based on this analysis, the conclusions of this paper are robust. This conclusion enhances the government’s confidence in supporting innovative enterprises. Even though some enterprises may lead to innovation failure, the results show that such supportive behavior is beneficial from the macro perspective.

5. Conclusions and Policy Implications

5.1. Conclusions

In the context of high-quality development, manufacturing companies promote green innovation and improve enterprise performance has gradually become a hot spot in innovation. [71] Therefore, this paper focuses on the impact of green innovation on enterprise performance and the moderating effect of two types of government subsidies on the relationship between green innovation and enterprise performance. Theories such as resource base view, capability view, stakeholder theory, and information asymmetry theory were applied in the paper to conduct an empirical study on manufacturing companies listed in Shanghai and Shenzhen A-shares, and the following conclusions are drawn. (1) Green innovation by manufacturing firms contributes to improved enterprise performance. (2) Fiscal subsidies and preferential taxation play a facilitating role in the relationship between green innovation and enterprise performance. Both government grants have a positive moderating effect when they are in parallel, and the moderating effect of preferential taxation is more pronounced. (3) Green innovation in both high-tech and traditional manufacturing can promote enterprise performance, and the moderating effect of preferential taxation on the relationship is more pronounced in high-tech manufacturing. In contrast, the moderating effect of fiscal subsidies is more pronounced in traditional manufacturing.

5.2. Policy Implication

Based on the findings of this paper, the following recommendations are made at both the enterprise and government levels. From the enterprise perspective, firstly, the managers of enterprises should strengthen their green concepts and elevate them to a strategic level in order to form a green innovation strategy, and at the same time, organize green knowledge learning for the employees of the enterprises to draw sufficient attention to green innovation as a way and means for the enterprises to enhance their competitive advantage and establish a green image in order to gain more consumers’ favour; secondly, enterprises should increase their green innovation efforts, obtain more green resources and promote green innovation output; finally, senior management should pay close attention to the state’s fiscal subsidies and preferential taxation in relation to green innovation and environmental protection, and pay more attention to preferential tax when they exist at the same time, so as to promote the pace of green innovation by making full use of government grants, thereby promoting the improvement of enterprise performance.
From the government’s perspective, on the other hand, the government should first give more attention to green innovation by increasing the publicity and exposure of green innovation activities through new media and public platforms, helping to expand the positive impact of the green image of enterprises and reflecting strong support for green innovation. Second, the government should further increase fiscal subsidies to enterprises while establishing an effective evaluation mechanism. Generally, the R&D costs of enterprises’ innovative activities are often high, so the government needs to increase its subsidies. However, the government should establish a monitoring mechanism to evaluate contributions’ effectiveness and enhance fiscal contributions’ effectiveness to reduce undesirable problems such as fraudulent subsidies. Finally, the government should improve the preferential taxation policy system both by enhancing the magnitude of incentives for manufacturing enterprises’ innovative activities, making the policy more detailed and increasing the accuracy of preferential taxation to encourage enterprises to innovate, and also by enriching the form of preferential tax, for example, by mixing and matching tax-based relief policies and tax-based relief policies to mobilize enterprises’ enthusiasm and enhance the effectiveness of preferential taxation.
The government should formulate policies such as sustainable tax incentives and financial subsidies to encourage advanced manufacturing enterprises to accelerate the integration of innovation and the industrial chain to form new competitive advantages. At the same time, the government and enterprises should recognize the deficiencies of tax incentives for technology introduction in promoting independent innovation of core technologies of enterprises and adjust and optimize policies scientifically to make up for the shortcomings with the help of institutional advantages. Enterprises should clearly understand tax incentives, reasonably introduce technologies, promote independent innovation of core technologies and independent innovation efficiency, and maximize independent innovation of enterprises, especially independent innovation of core technologies.
Of course, the research in this paper is not deep enough in the field of industry differentiation. The analysis does not distinguish the differences in regional characteristics or the importance of technical areas for economic development. Therefore, future research should further deepen the study on the influence of regional factors. When considering the role of innovation capability in promoting the economy, the part of financial market improvement in fostering scientific and technological research and development should also be considered.

Author Contributions

Conceptualization, H.L.; methodology, H.L.; software, G.L.; validation, W.Z.; formal analysis, H.L. and W.Z.; investigation, H.L. and G.L.; resources, Z.C.; data curation, H.L., G.L. and W.Z.; writing—original draft preparation, H.L. and W.Z.; writing—review and editing, H.L. and G.L.; visualization, Z.C.; supervision, Z.C.; project administration, W.Z.; funding acquisition, W.Z. All authors have read and agreed to the published version of the manuscript.

Funding

This research was funded by the Grant-in-Aid for Humanities and Social Sciences Project in Zhanjiang (Grant Number: ZJ22YB21) and Guangdong philosophy and Social Sciences Youth Project (Grant Number: GD22YYJ18).

Institutional Review Board Statement

Not applicable.

Informed Consent Statement

Not applicable.

Data Availability Statement

Not applicable.

Conflicts of Interest

The authors declare no conflict of interest.

References

  1. Hao, X.; Chen, F.; Chen, Z. Does green innovation increase enterprise value? Bus. Strategy Environ. 2022, 31, 1232–1247. [Google Scholar] [CrossRef]
  2. Dai, D.; Xue, Y. The Impact of Green Innovation on a Firm’s Value from the Perspective of Enterprise Life Cycles. Sustainability 2022, 14, 1226. [Google Scholar] [CrossRef]
  3. Feng, Z.; Chen, W. Environmental regulation, green innovation, and industrial green development: An empirical analysis based on the Spatial Durbin model. Sustainability 2018, 10, 223. [Google Scholar] [CrossRef] [Green Version]
  4. Sun, Y.; Sun, H. Green innovation strategy and ambidextrous green innovation: The mediating effects of green supply chain integration. Sustainability 2021, 13, 4876. [Google Scholar] [CrossRef]
  5. Zhou, M.; Govindan, K.; Xie, X.; Yan, L. How to drive green innovation in China’s mining enterprises? Under the perspective of environmental legitimacy and green absorptive capacity. Resour. Policy 2021, 72, 102038. [Google Scholar] [CrossRef]
  6. Zhang, Y.; Xing, C.; Wang, Y. Does green innovation mitigate financing constraints? Evidence from China’s private enterprises. J. Clean. Prod. 2020, 264, 121698. [Google Scholar] [CrossRef]
  7. Song, M.; Chen, M.; Wang, S. Global supply chain integration, financing restrictions, and green innovation: Analysis based on 222,773 samples. Int. J. Logist. Manag. 2018, 29, 539–554. [Google Scholar] [CrossRef]
  8. Xiang, X.; Liu, C.; Yang, M. Who is financing corporate green innovation? Int. Rev. Econ. Financ. 2022, 78, 321–337. [Google Scholar] [CrossRef]
  9. Yu, C.-H.; Wu, X.; Zhang, D.; Chen, S.; Zhao, J. Demand for green finance: Resolving financing constraints on green innovation in China. Energy Policy 2021, 153, 112255. [Google Scholar] [CrossRef]
  10. Ma, W.; Zhang, R.; Chai, S. What drives green innovation? A game theoretic analysis of government subsidy and cooperatiRanran Zhanon contract. Sustainability 2019, 11, 5584. [Google Scholar] [CrossRef]
  11. Owen, R.; Brennan, G.; Lyon, F. Enabling investment for the transition to a low carbon economy: Government policy to finance early stage green innovation. Curr. Opin. Env. Sust. 2018, 31, 137–145. [Google Scholar] [CrossRef]
  12. Gohoungodji, P.; N’Dri, A.B.; Latulippe, J.-M.; Matos, A.L.B. What is stopping the automotive industry from going green? A systematic review of barriers to green innovation in the automotive industry. J. Clean. Prod. 2020, 277, 123524. [Google Scholar] [CrossRef]
  13. Soltmann, C.; Stucki, T.; Woerter, M. The impact of environmentally friendly innovations on value added. Environ. Resour. Econ. 2015, 62, 457–479. [Google Scholar] [CrossRef]
  14. Meckling, J.; Sterner, T.; Wagner, G. Policy sequencing toward decarbonization. Nat. Energy 2017, 2, 918–922. [Google Scholar] [CrossRef]
  15. Junaid, M.; Zhang, Q.; Syed, M.W. Effects of sustainable supply chain integration on green innovation and firm performance. Sustain. Prod. Consump. 2022, 30, 145–157. [Google Scholar] [CrossRef]
  16. Singh, M.K.; Kumar, P.; Agrawal, S. Analyzing the Green Manufacturing and Organizational Performance of the Indian SMEs. In Recent Trends in Industrial and Production Engineering; Springer: Singapore, 2022; pp. 47–56. [Google Scholar]
  17. Wong, C.Y.; Wong, C.W.; Boon-itt, S. Effects of green supply chain integration and green innovation on environmental and cost performance. Int. J. Prod. Res. 2020, 58, 4589–4609. [Google Scholar] [CrossRef]
  18. Sellitto, M.A.; Camfield, C.G.; Buzuku, S. Green innovation and competitive advantages in a furniture industrial cluster: A survey and structural model. Sustain. Prod. Consump. 2020, 23, 94–104. [Google Scholar] [CrossRef]
  19. Robinson, S.; Stubberud, H.A. Green innovation in Germany: A comparison by business size. J. Int. Bus. Res. 2013, 12, 47. [Google Scholar]
  20. Chang, C.-H. The influence of corporate environmental ethics on competitive advantage: The mediation role of green innovation. J. Bus. Ethics 2011, 10, 361–370. [Google Scholar] [CrossRef]
  21. Zhang, X.; Tang, Z. Construction of computer model for enterprise green innovation by PSO-BPNN algorithm and its impact on economic performance. PLoS ONE 2022, 17, e0262963. [Google Scholar] [CrossRef]
  22. Hao, J.; He, F. Corporate social responsibility (CSR) performance and green innovation: Evidence from China. Financ. Res. Lett. 2022, 48, 102889. [Google Scholar] [CrossRef]
  23. Kim, I.; Pantzalis, C.; Zhang, Z. Multinationality and the value of green innovation. J. Corp. Financ. 2021, 69, 101996. [Google Scholar] [CrossRef]
  24. Satta, G.; Spinelli, R.; Parola, F. Is tourism going green? A literature review on green innovation for sustainable tourism. Tour. Anal. 2019, 24, 265–280. [Google Scholar] [CrossRef]
  25. Li, Z.; Liao, G.; Wang, Z.; Huang, Z. Green loan and subsidy for promoting clean production innovation. J. Clean. Prod. 2018, 187, 421–431. [Google Scholar] [CrossRef]
  26. Chen, Y.-S. The driver of green innovation and green image–green core competence. J. Bus. Ethics 2008, 81, 531–543. [Google Scholar] [CrossRef]
  27. Kraus, S.; Rehman, S.U.; García, F.J.S. Corporate social responsibility and environmental performance: The mediating role of environmental strategy and green innovation. Technol. Forecast. Soc. 2020, 160, 120262. [Google Scholar] [CrossRef]
  28. Soewarno, N.; Tjahjadi, B.; Fithrianti, F. Green innovation strategy and green innovation: The roles of green organizational identity and environmental organizational legitimacy. Manag. Decis. 2019, 57, 3061–3078. [Google Scholar] [CrossRef]
  29. Chen, J.; Liu, L. Profiting from green innovation: The moderating effect of competitive strategy. Sustainability 2018, 11, 15. [Google Scholar] [CrossRef] [Green Version]
  30. Li, J.; Du, Y. Spatial effect of environmental regulation on green innovation efficiency: Evidence from prefectural-level cities in China. J. Clean. Prod. 2021, 286, 125032. [Google Scholar] [CrossRef]
  31. Arfi, W.B.; Hikkerova, L.; Sahut, J. External knowledge sources, green innovation and performance. Technol. Forecast. Soc. 2018, 129, 210–220. [Google Scholar] [CrossRef]
  32. Tariq, A.; Badir, Y.; Chonglerttham, S. Green innovation and performance: Moderation analyses from Thailand. Eur. J. Innov. Manag. 2019, 22, 446–467. [Google Scholar] [CrossRef]
  33. Hu, G.; Wang, X.; Wang, Y. Can the green credit policy stimulate green innovation in heavily polluting enterprises? Evidence from a quasi-natural experiment in China. Energy Econ. 2021, 98, 105134. [Google Scholar] [CrossRef]
  34. Zhang, Z.; Duan, H.; Shan, S.; Liu, Q.; Geng, W. The impact of green credit on the green innovation level of heavy-polluting enterprises—Evidence from China. Int. J. Environ. Res. Public Health 2022, 19, 650. [Google Scholar] [CrossRef]
  35. Peng, J.; Song, Y.; Tu, G.; Liu, Y. A study of the dual-target corporate environmental behavior (DTCEB) of heavily polluting enterprises under different environment regulations: Green innovation vs. pollutant emissions. J. Clean. Prod. 2021, 297, 126602. [Google Scholar] [CrossRef]
  36. Zhong, Z.; Peng, B. Can environmental regulation promote green innovation in heavily polluting enterprises? Empirical evidence from a quasi-natural experiment in China. Sustain. Prod. Consump. 2022, 30, 815–828. [Google Scholar] [CrossRef]
  37. Wang, H.; Qi, S.; Zhou, C.; Zhou, J.; Huang, X. Green credit policy, government behavior and green innovation quality of enterprises. J. Clean. Prod. 2022, 331, 129834. [Google Scholar] [CrossRef]
  38. Li, X.; Lai, X.; Zhang, F. Research on green innovation effect of industrial agglomeration from perspective of environmental regulation: Evidence in China. J. Clean. Prod. 2021, 288, 125583. [Google Scholar] [CrossRef]
  39. Fan, F.; Lian, H.; Liu, X.; Wang, X. Can environmental regulation promote urban green innovation Efficiency? An empirical study based on Chinese cities. J. Clean. Prod. 2021, 287, 125060. [Google Scholar] [CrossRef]
  40. Hsu, C.-C.; Quang-Thanh, N.; Chien, F.; Li, L.; Mohsin, M. Evaluating green innovation and performance of financial development: Mediating concerns of environmental regulation. Environ. Sci. Pollut. R. 2021, 28, 57386–57397. [Google Scholar] [CrossRef] [PubMed]
  41. Zhang, Q.; Ma, Y. The impact of environmental management on firm economic performance: The mediating effect of green innovation and the moderating effect of environmental leadership. J. Clean. Prod. 2021, 292, 126057. [Google Scholar] [CrossRef]
  42. Agustia, D.; Sawarjuwono, T.; Dianawati, W. The mediating effect of environmental management accounting on green innovation-Firm value relationship. Int. J. Energy Econ. Policy 2019, 9, 299–306. [Google Scholar]
  43. Qi, G.; Zeng, S.; Tam, C.; Yin, H.; Zou, H. Stakeholders’ influences on corporate green innovation strategy: A case study of manufacturing firms in China. Corp. Soc. Resp. Env. Ma. 2013, 20, 1–14. [Google Scholar]
  44. Roy, M.; Khastagir, D. Exploring role of green management in enhancing organizational efficiency in petro-chemical industry in India. J. Clean. Prod. 2016, 121, 109–115. [Google Scholar] [CrossRef]
  45. Wang, N.; Zhang, J.; Zhang, X.; Wang, W. How to Improve Green Innovation Performance: A Conditional Process Analysis. Sustainability 2022, 14, 2938. [Google Scholar] [CrossRef]
  46. Li, D.; Zheng, M.; Cao, C.; Chen, X.; Ren, S.; Huang, M. The impact of legitimacy pressure and corporate profitability on green innovation: Evidence from China top 100. J. Clean. Prod. 2017, 141, 41–49. [Google Scholar] [CrossRef] [Green Version]
  47. Singh, S.K.; Del Giudice, M.; Chierici, R.; Graziano, D. Green innovation and environmental performance: The role of green transformational leadership and green human resource management. Technol. Forecast. Soc. 2020, 150, 119762. [Google Scholar] [CrossRef]
  48. Gupta, H.; Barua, M.K. Supplier selection among SMEs on the basis of their green innovation ability using BWM and fuzzy TOPSIS. J. Clean. Prod. 2017, 152, 242–258. [Google Scholar] [CrossRef]
  49. Huang, J.-W.; Li, Y.-H. Green innovation and performance: The view of organizational capability and social reciprocity. J. Bus. Ethics 2017, 145, 309–324. [Google Scholar] [CrossRef]
  50. Fazal-e-Hasan, S.M.; Ahmadi, H.; Sekhon, H.; Mortimer, G.; Sadiq, M.; Kharouf, H.; Abid, M. The role of green innovation and hope in employee retention. Bus. Strategy Environ. 2022, 1–20. [Google Scholar] [CrossRef]
  51. Weng, H.-H.; Chen, J.-S.; Chen, P.-C. Effects of green innovation on environmental and corporate performance: A stakeholder perspective. Sustainability 2015, 7, 4997–5026. [Google Scholar] [CrossRef] [Green Version]
  52. Wu, G.-C. The influence of green supply chain integration and environmental uncertainty on green innovation in Taiwan’s IT industry. Supply. Chain. Manag. 2013, 18, 539–552. [Google Scholar] [CrossRef]
  53. Kong, T.; Sun, R.; Sun, G.; Song, Y. Effects of digital finance on green innovation considering information asymmetry: An empirical study based on Chinese listed firms. Emerg. Mark. Financ. Trade 2022, 1–13. [Google Scholar] [CrossRef]
  54. Li, D.; Huang, M.; Ren, S.; Chen, X.; Ning, L. Environmental legitimacy, green innovation, and corporate carbon disclosure: Evidence from CDP China 100. J. Bus. Ethics 2018, 150, 1089–1104. [Google Scholar] [CrossRef]
  55. Huang, Z.; Liao, G.; Li, Z. Loaning scale and government subsidy for promoting green innovation. Technol. Forecast. Soc. 2019, 144, 148–156. [Google Scholar] [CrossRef]
  56. Hu, D.; Qiu, L.; She, M.; Wang, Y. Sustaining the sustainable development: How do firms turn government green subsidies into financial performance through green innovation? Bus. Strategy Environ. 2021, 30, 2271–2292. [Google Scholar] [CrossRef]
  57. Yi, Y.; Wei, Z.; Fu, C. An optimal combination of emissions tax and green innovation subsidies for polluting oligopolies. J. Clean. Prod. 2021, 284, 124693. [Google Scholar] [CrossRef]
  58. Zhang, S.; Yu, Y.; Zhu, Q.; Qiu, C.M.; Tian, A. Green innovation mode under carbon tax and innovation subsidy: An evolutionary game analysis for portfolio policies. Sustainability 2020, 12, 1385. [Google Scholar] [CrossRef] [Green Version]
  59. Yang, W.; Ma, Q.; He, J.; Lu, S.; Chen, X. Can green innovation subsidies reduce the systemic risk of green innovative enterprises? A simulation study. Technol. Anal. Strategy 2021, 1–17. [Google Scholar] [CrossRef]
  60. Wang, Y.; Yu, L. Can the current environmental tax rate promote green technology innovation?-Evidence from China’s resource-based industries. J. Clean. Prod. 2021, 278, 123443. [Google Scholar] [CrossRef]
  61. Guo, Y.; Xia, X.; Zhang, S.; Zhang, D. Environmental regulation, government R&D funding and green technology innovation: Evidence from China provincial data. Sustainability 2018, 10, 940. [Google Scholar]
  62. Long, S.; Liao, Z. Are fiscal policy incentives effective in stimulating firms’ eco-product innovation? The moderating role of dynamic capabilities. Bus. Strategy Environ. 2021, 30, 3095–3104. [Google Scholar] [CrossRef]
  63. De Azevedo, R.L.; Bansi, A.C.; Alves, M.F.R.; Galina, S.V.R. Take your time: Examining when green innovation affects financial performance in multinationals. J. Clean. Prod. 2019, 233, 993–1003. [Google Scholar]
  64. Chouaibi, S.; Chouaibi, J.; Rossi, M. ESG and corporate financial performance: The mediating role of green innovation: UK common law versus Germany civil law. Euromed. J. Bus. 2021, 17, 46–71. [Google Scholar] [CrossRef]
  65. Amore, M.D.; Bennedsen, M. Corporate governance and green innovation. J. Environ. Econ. Manag. 2016, 75, 54–72. [Google Scholar] [CrossRef]
  66. Zhou, X.; Yu, Y.; Yang, F.; Shi, Q. Spatial-temporal heterogeneity of green innovation in China. J. Clean. Prod. 2021, 282, 124464. [Google Scholar] [CrossRef]
  67. Li, D.; Zhao, Y.; Zhang, L.; Chen, X.; Cao, C. Impact of quality management on green innovation. J. Clean. Prod. 2018, 170, 462–470. [Google Scholar] [CrossRef]
  68. Yaoteng, Z.; Xin, L. Research on green innovation countermeasures of supporting the circular economy to green finance under big data. J. Enterp. Inf. Manag. 2021, 35, 1305–1322. [Google Scholar] [CrossRef]
  69. Woo, C.; Chung, Y.; Chun, D.; Han, S.; Lee, D. Impact of green innovation on labor productivity and its determinants: An analysis of the Korean manufacturing industry. Bus. Strategy Environ. 2014, 23, 567–576. [Google Scholar] [CrossRef]
  70. Majeed, A.; Ye, C.; Chenyun, Y.; Wei, X. Roles of natural resources, globalization, and technological innovations in mitigation of environmental degradation in BRI economies. PLoS ONE 2022, 17, e0265755. [Google Scholar] [CrossRef]
  71. Ahmad, M.; Majeed, A.; Khan, M.A.; Sohaib, M.; Shehzad, K. Digital financial inclusion and economic growth: Provincial data analysis of China. China Econ. J. 2021, 14, 291–310. [Google Scholar] [CrossRef]
Figure 1. Conceptual model.
Sustainability 14 13550 g001
Table 1. Variable Definition.
Variable TypeVariable NameSymbolCalculation
Explained variableBusiness PerformanceTobin’s QTobin’s Q = year-end market value/book value of the business (%)
Explanatory variablesGreen innovationGpatentsNumber of green patent applications
ModeratorFinancial subsidySubGovernment subsidy with one lag period in the statement (Yuan)
Tax incentivesTaxpIncome Tax Rate minus Effective Tax Rate (%)
control variableCompany yearsAgeYear of measurement minus A year of establishment (Years)
Enterprise sizeSizeTotal assets log (Yuan)
capital concentrationINVENet Fixed Assets/Total Assets (%)
company growthGrowthoperating income growth rate
financial leverageLEVEBIT/EBIT (%)
Operational efficiencyCEOperating cost/operating income (%)
Operating cash flowCFNet cash flow from operating activities/total assets (%)
yearsYearcontrol year
Table 2. Descriptive statistics for variables.
VariablesObsAverageS.D.MinMax
Tobin’s40392.7121.710.77621.476
Gpatents40391.1666.4230206
Sub40390.2280.658016.877
Taxp40390.0670.371014.482
Age403913.5155.099235
Size40393.270.9350.7787.573
INVE40390.0610.05100.391
Growth40390.3021.653−1.24362.182
LEV40391.91637.85−8.9982402.774
CE40390.9060.1120.373.739
CF40390.0430.063−0.3190.372
Table 3. Pearson correlation coefficient analysis.
Variables(1)(2)(3)(4)(5)(6)(7)(8)(9)(10)(11)
(1) Tobin’Q1
(2) Gpatents−0.058 ***1
(3) Sub−0.053 ***0.385 ***1
(4) Taxp0.009−0.0020.0021
(5) Age0.028 *0.033 **0.030 *0.0141
(6) Size−0.287 ***0.241 ***0.427 ***0.0010.146 ***1
(7) INVE−0.037 **0.027 *−0.035 **−0.026 *−0.176 ***−0.083 ***1
(8) Growth0.031 *0.0080.0220.0030.0060.046 ***−0.037 **1
(9) LEV−0.0160.019−0.0040.002−0.020.016−0.018−0.0011
(10) CE−0.253 ***0.051 ***0.042 ***0.106 ***0.084 ***0.073 ***−0.116***−0.0030.0221
(11) CF0.186 ***−0.0130.02−0.0150.064 ***0.0150.070 ***−0.034 **−0.027 *−0.276 ***1
t statistics in parentheses * p < 0.1, ** p < 0.05, *** p < 0.01.
Table 4. Regression results.
VariablesTobin’s Q
(1)(2)(3)(4)
Gpatents0.0065 ***0.0457 *0.0464 ***0.0469 *
(2.71)(1.89)(2.76)(1.94)
Sub −0.1604 *** −0.1611 ***
(−2.97) (−2.98)
Gpatents × Sub 0.0040 * 0.0040 *
(1.72) (1.70)
Taxp −0.0242 ***−0.0243 ***
(−3.12)(−3.10)
Gpatents × Taxp 0.0247 **0.0245 **
(2.54)(2.52)
Age0.0665 ***0.0692 ***0.0678 ***0.0705 ***
(4.41)(4.58)(4.46)(4.63)
Size−0.8865 ***−0.8651 ***−0.8899 ***−0.8684 ***
(−10.69)(−10.47)(−10.68)(−10.46)
INVE1.2157 *1.2475 *1.2153 *1.2468 *
(1.72)(1.76)(1.71)(1.75)
Growth0.0234 *0.0233 *0.0234 *0.0233 *
(1.82)(1.82)(1.82)(1.82)
LEV−0.0007 ***−0.0007 ***−0.0007 ***−0.0007 ***
(−12.82)(−12.44)(−14.07)(−13.61)
CE−1.7958 ***−1.7846 ***−1.7973 ***−1.7862 ***
(−3.78)(−3.79)(−3.77)(−3.78)
CF0.9978 **0.9978 **0.9794 **0.9791 **
(2.13)(2.13)(2.08)(2.08)
YearYesYesYesYes
Constant5.5053 ***5.3808 ***5.5080 ***5.3745 ***
(13.03)(12.67)(13.02)(12.64)
Obs4039403940314031
R-squared0.42560.42710.4260.4275
t statistics in parentheses * p < 0.1, ** p < 0.05, *** p < 0.01.
Table 5. Results of systematic GMM estimation.
VariablesTobin’s Q
(1)
Gpatents0.0262 ***
(1.92)
Age0.0582
(3.10)
Size−0.8280
(−10.45)
INVE3.2582
(1.56)
Growth0.0134 ***
(6.23)
Lev−0.0007
(−13.06)
CE−2.0206
(−3.53)
CF1.0822
(2.49)
N3046
AR(1)0.000
AR(2)0.835
Hansen0.326
Note: *** Significant at 1% level. t-statistic is displayed in parentheses below the coefficients.
Table 6. Substitution of variables.
VariablesReplace Explained VariableSubstitution of Explanatory and Moderator Variables
(1)(2)(3)(4)(1)(2)(3)(4)
Input 0.0076 *
(1.93)
Gpatents0.2667 ***0.3083 *1.5301 ***0.3823 ** −0.0208−0.0315−0.0290
(3.11)(1.85)(16.67)(2.46) (−1.12)(−1.61)(−1.43)
Sub −0.5128 *** −0.4595 *** −0.0817 *** −0.0772 ***
(−4.85) (−4.63) (−4.39) (−4.11)
Gpatents × Sub 0.6879 *** 0.5810 *** 0.0067 *** 0.0044 **
(10.27) (8.76) (4.25) (2.33)
Taxp −0.7120 ***3.3829 *** −0.01570.0061
(−10.31)(39.48) (−0.70)(0.33)
Gpatents × Taxp 0.01790.0451 *** 0.0050 ***0.0027 *
(1.46)(4.28) (4.22)(1.73)
ControlsYesYesYesYesYesYesYesYes
YearYesYesYesYesYesYesYesYes
Constant−0.1943 ***−0.7573 ***0.2691 ***1.0897 ***4.8333 ***4.7555 ***4.7990 ***4.7590 ***
(−0.11)(−0.13)(0.05)(0.20)(14.11)(13.76)(13.94)(13.76)
Obs12,93812,83512,93812,57010,68010,68010,68010,680
R-squared0.2270.2500.1960.2930.3850.3860.3850.386
Note:*** Significant at 1% level; ** Significant at 5% level; * Significant at 10%. t-statistic is displayed in parentheses below the coefficients.
Table 7. Regression results for high-technology manufacturing and traditional manufacturing.
VariablesHigh-Tech ManufacturingTraditional Manufacturing
(1)(2)(3)(4)(1)(2)(3)(4)
Gpatents0.006 **0.040 **0.024 **0.039 **0.004 **−0.179−0.033−0.246 *
(1.45)(2.11)(1.42)(2.12)(1.16)(−1.65)(−1.21)(−1.79)
Sub −0.050* −0.051 * 0.048 0.049
(−1.70) (−1.70) (0.80) (0.82)
Gpatents × Sub 0.021 * 0.022 * 0.047 * 0.071 *
(1.63) (1.68) (1.95) (1.92)
Taxp 0.061 **0.063 ** −0.095 *−0.102 *
(2.06)(2.08) (−1.74)(−1.86)
Gpatents × Taxp 0.045 **0.047 ** 0.044**−0.033
(2.29)(2.33) (2.33)(−1.19)
Controlscontrolcontrolcontrolcontrolcontrolcontrolcontrolcontrol
Yearcontrolcontrolcontrolcontrolcontrolcontrolcontrolcontrol
Constant4.766 ***4.730 ***4.694 ***4.654 ***4.518 ***4.648 ***4.450 ***4.565 ***
(7.51)(7.62)(7.41)(7.52)(5.57)(6.07)(5.54)(6.04)
Obs24842484245724571 5551 5551 5741 574
R-squared0.4460.4480.4490.4500.3540.3550.3550.356
Note:*** Significant at 1% level; ** Significant at 5% level; * Significant at 10%. t-statistic is displayed in parentheses below the coefficients.
Publisher’s Note: MDPI stays neutral with regard to jurisdictional claims in published maps and institutional affiliations.

