1. Introduction
Originating from an unknown pneumonia case in Wuhan, China, in December 2019, coronavirus disease 2019 (COVID-19) continues to pose a global threat nowadays. The COVID-19 pandemic has caused unprecedented social and economic devastation on a large scale in numerous countries around the world. By 1 April 2022, 486,761,597 confirmed cases of COVID-19 and 6,142,735 deaths were reported worldwide. The United States is the most severely affected country with 79,342,899 confirmed cases of infection and 972,830 deaths between 3 January 2020 and 1 April 2022 according to the WHO [
1].
Many countries have implemented restrictions to reduce the spread of COVID-19, such as high-risk-area control, social distancing, and mandatory face masks. At the peak of the pandemic, restrictions and even bans on movement were imposed, resulting in widespread online telecommuting among workers as more people remained at home. Owing to travel restrictions, shopping malls and pedestrian streets had a sharp decrease in traffic [
2]. The COVID-19 pandemic substantially affected the urban public transport, where most people refuted using crowded public transport (such as buses or subway) due to the fear of infection [
3], thereby opting for private cars, taxis and bicycles over public transportation [
4].
Disruptions in transport behaviour are typically associated with major catastrophic events, such as natural disasters and public health incidents. For instance, when Hurricane Sandy flooded some tunnels of the New York City on 29 October 2012, the number of taxi trips noticeably decreased during the following week but returned to normal levels a week later [
5]. The taxi industry was severely impacted by the COVID-19 outbreak. Specifically, the earnings of approximately 200,000 taxi drivers in New York City plummeted in March 2020, and thousands of drivers lost their jobs owing to lack of demand for taxi services [
6].
Therefore, we investigated the impact of the COVID-19 pandemic on transportation based on taxi-trip big data to analyse spatio–temporal changes and trends in behaviour patterns and explore the factors driving these changes. This paper is structured as follows:
Section 2 collates relevant literature.
Section 3 presents the methods and data used in our investigation.
Section 4 presents the analysis results of the temporal and spatial changes in travel before and after the epidemic.
Section 5 discusses the impact of COVID-19 and anti-epidemic policies on travel behaviour. Finally,
Section 6 summarises our results and concludes this study.
2. Literature Review
The COVID-19 outbreak has affected the willingness of some citizens to travel, and anti-epidemic policies have also restricted the rights of people’s movements. This study focused on how to accurately analyse the impact of COVID-19 on transport travel and explore changes in people’s travel behaviour patterns. The results will provide data-driven guidelines for public transport market adjustments, safe travel, and scientific prevention and control measures. To this end, we reviewed the previous studies that combined the pandemic with travel impacts are discussed in this section.
First, studies exploring the impact of the pandemic on different modes of transport have been conducted. Yu et al. statistically analysed the relationships between journeys and per capita income, average number of stops per outing, distance travelled, duration, average speed, and spatial distribution of taxi jobs during the epidemic using taxi and online taxi data in Ningbo, China [
7]. Fernández Pozo et al. conducted a public transport research project in Madrid (Spain) and identified a 95% drop in ridership during the peak of the epidemic and a slow recovery, with lower-income commuters depending more heavily on public transport with less severe reductions in trips [
8]. Zheng et al. analysed the decline and recovery of the taxi industry during the epidemic based on taxi data from Shenzhen, China, and made recommendations to adjust taxi operation strategies [
9]. Nian et al. analysed the impact of COVID-19 on people’s social activities using taxi data in Chongqing, China. They reported that the number of trips significantly decreased after the outbreak, spatial correlation with taxi trips gradually weakened, and travel demand dwindled as well [
10].
Second, shifts in travel patterns have been investigated in some previous studies. Eisenmann et al. identified that public transport declined during the lockdown, whereas the use of private cars and bicycles increased in Germany [
4]. In a GPS-based study in Switzerland, Molloy et al. found that people travelled shorter distances daily and were increasingly inclined to use a bicycle [
11]. In surveying travel in China, Luan et al. found that people still preferred public transport for long-distance travel and that ride-hailing services dropped sharply [
12]. Hara and Yamaguchi analysed mobile phone location data in Japan and reported that during the epidemic, travel decreased significantly (even in the absence of mandatory restrictions), and the travel restraints did not change quickly after the emergency period was over [
13]. Abdullah et al. revealed that shopping was the main travel purpose, and people chose to travel by private cars and bicycles rather than by public transport [
14]. A Pakistan-based study also reported a shift from motorbikes to bicycles for short-distance travels [
15].
Overall, the impacts of the COVID-19 pandemic on various modes of transport and people’s travel choices have been extensively investigated. The pandemic has had a very strong impact on the transport sector and caused a dramatic shift in people’s travel patterns. However, only few studies explored the changes in travel patterns across COVID-19 waves. Moreover, most studies did not include sufficient temporal span or explore the policy implications behind the shift. Thus, this study used taxi trajectory data from New York City during the COVID-19 pandemic and conducted a cross-temporal characterisation over a long period to promote social sustainability.
3. Methods and Data
3.1. Pearson’s r
Pearson’s r is the product of the covariance ratios of two variables using their standard deviations and is an estimate of the degree of linear correlation between two datasets.
Given two random variables
,
, the calculation of
r is formalized by Equation (1):
Pearson’s r is essentially a normalised measure of covariance, with the measure always falling between −1 and 1.
3.2. Global Moran’s I
Global Moran’s
I is used to describe the correlation between adjacent locations across a location in space. This study used the Moran’s
I to test the global autocorrelation of taxi trajectories using Equaiton (2)
where
is the sum of the elements of the spatial weight matrix
,
is the total number of spatial units,
is the mean value of the spatial unit values, and
is the unit in the spatial weight matrix
.
Briefly, 0 <
I < 1 is considered a positive spatial autocorrelation,
I = 0 is considered spatially irrelevant, and −1 <
I < 0 is considered a negative spatial autocorrelation [
16].
3.3. Local Indicators of Spatial Association
3.3.1. Anselin Local Moran’s I
Anselin local Moran’s
I is a local indicator of spatial association (LISA). Anselin defines LISA as having the following two properties: the LISA of each observation indicates a significant degree of spatial clustering of similar values around that observation, and the sum of the LISA values of all observations is proportional to the overall target of spatial association [
17]. The local Moran’s
I is determined based on Equaiton (3):
where
is the value of element
,
is the mean value of the corresponding attribute, and
is the spatial weight between elements
and
.
Local Moran’s I measures the type of clusters and the areas in which they occur. The results enable classification of the significant locations as high–high and low–low spatial clusters and high–low and low–high spatial outliers.
3.3.2. Local Geary
Local Geary is also a LISA. It uses a different criterion for attribute similarity to detect any patterns that escape the local Moran [
18]. The equation of Local Geary is as follows:
For local Geary, the interpretation of significant locations in terms of the type of association is not as straightforward as that of local Moran’s I. It can distinguish between high–high and low–low clusters and other outliers. Herein, we used local Geary to detect any clustering patterns that may have been overlooked by local Moran’s I.
3.4. Graph
A directed graph
is an ordered binary group
, where
is a non-empty finite set, named the vertex set, of which the elements are named vertices or nodes.
is a finite subset of the Cartesian product
, called an edge set, and the elements are called directed edges or simply edges. For simplicity, we can define a matrix to represent a directed weighted graph with matrix
:
This study used the graph to process and analyse taxi data. Each taxi trip was defined as a ternary structure involving origin, destination, and time as follows:
The statistic of the number of taxis that travelled from one district to another within a certain time interval
is denoted as below:
is a function to calculate the size of the sets, and is the number of taxis from zone to zone over a period.
The weight value of one directed edge of the graph is denoted as follows:
3.5. COVID-19 Epidemic Data and Timeline
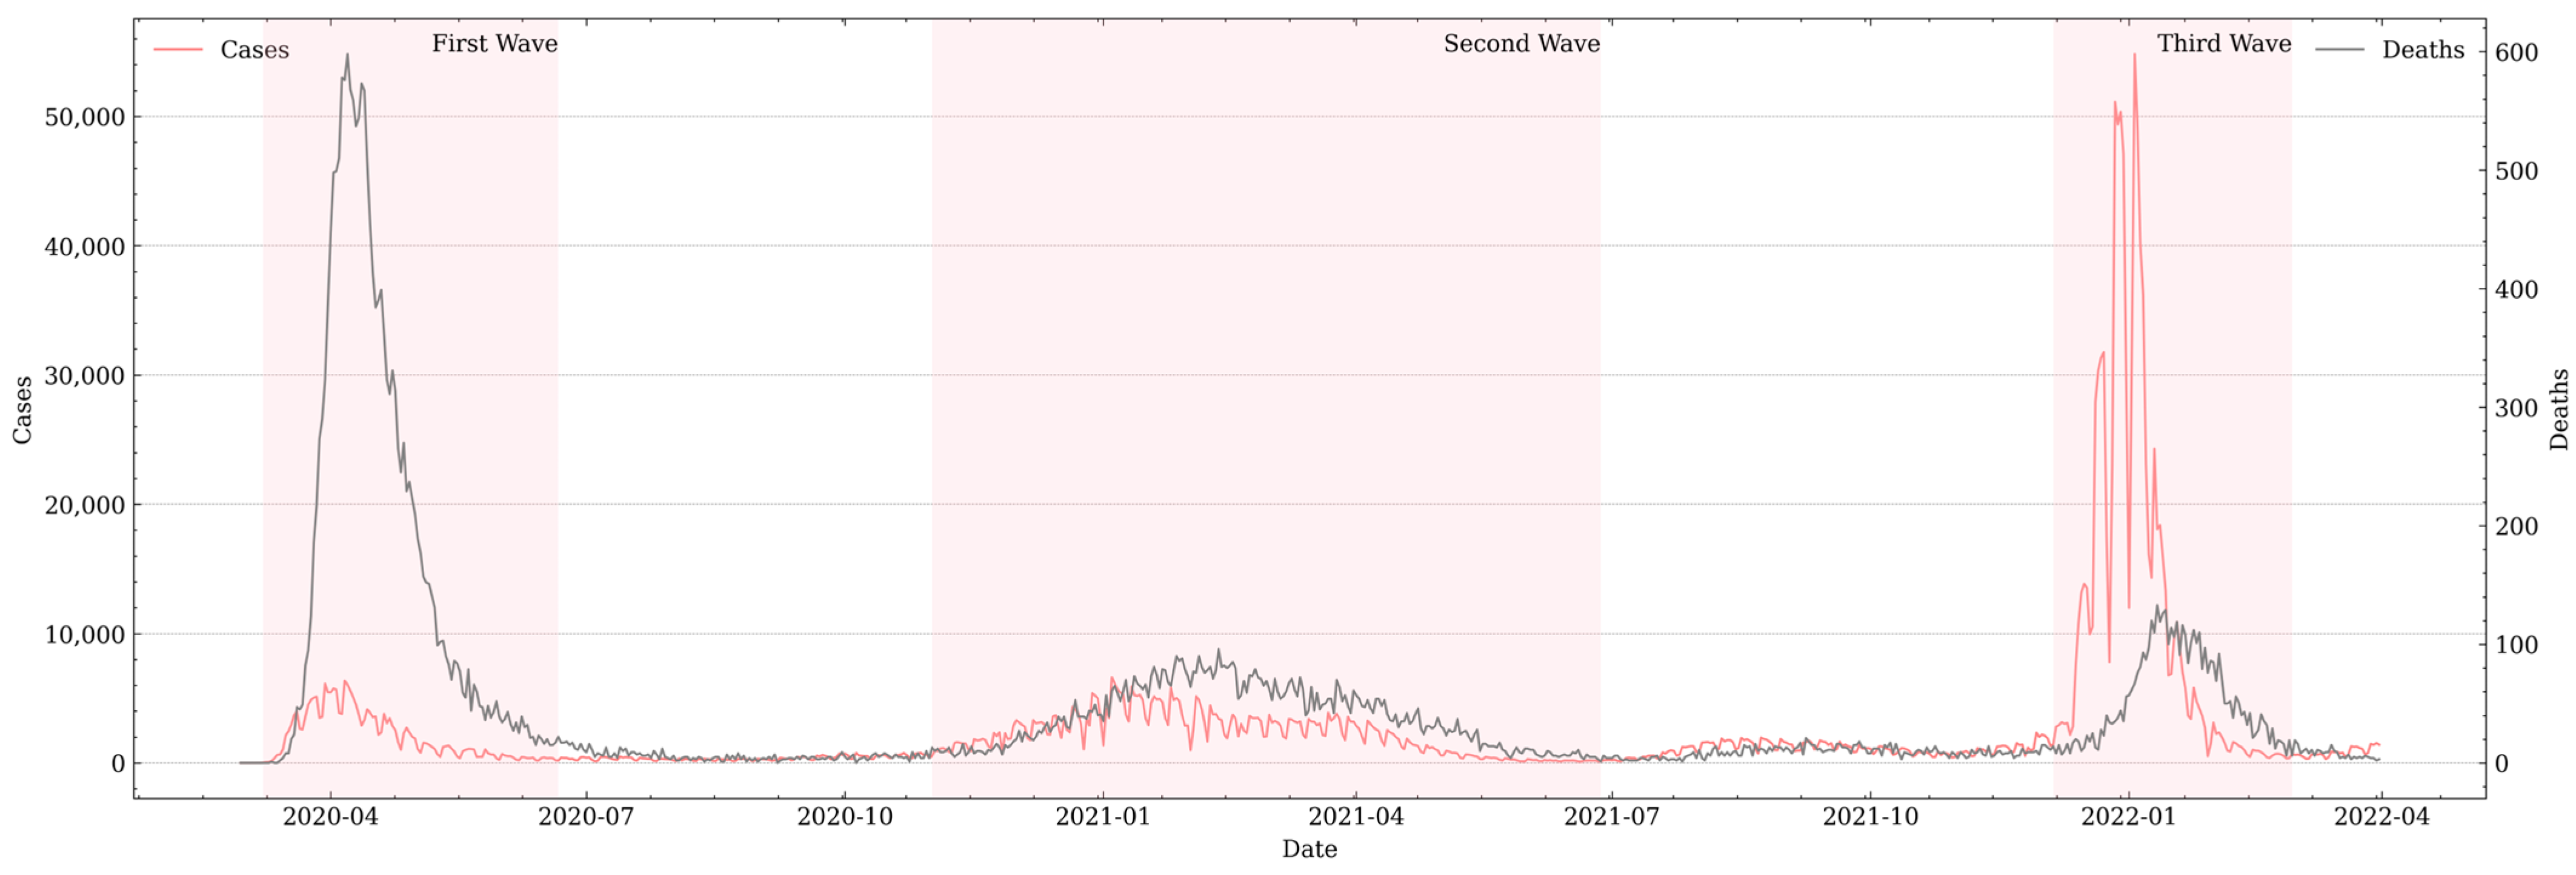
To explore the New York City epidemic, this study used externally available citywide epidemic data from the New York City Department of Health and encompassed the COVID-19 epidemic from 29 February 2020 to 31 March 2022, including the following fields: date, cumulative confirmed cases, suspected confirmed cases, hospitalised cases, cumulative deaths, and confirmed, hospitalised, and fatal cases.
From the outbreak to 31 March 2022, a cumulative total of 2,307,406 cases and 40,079 deaths were identified due to COVID-19 in New York City (
Figure 1).
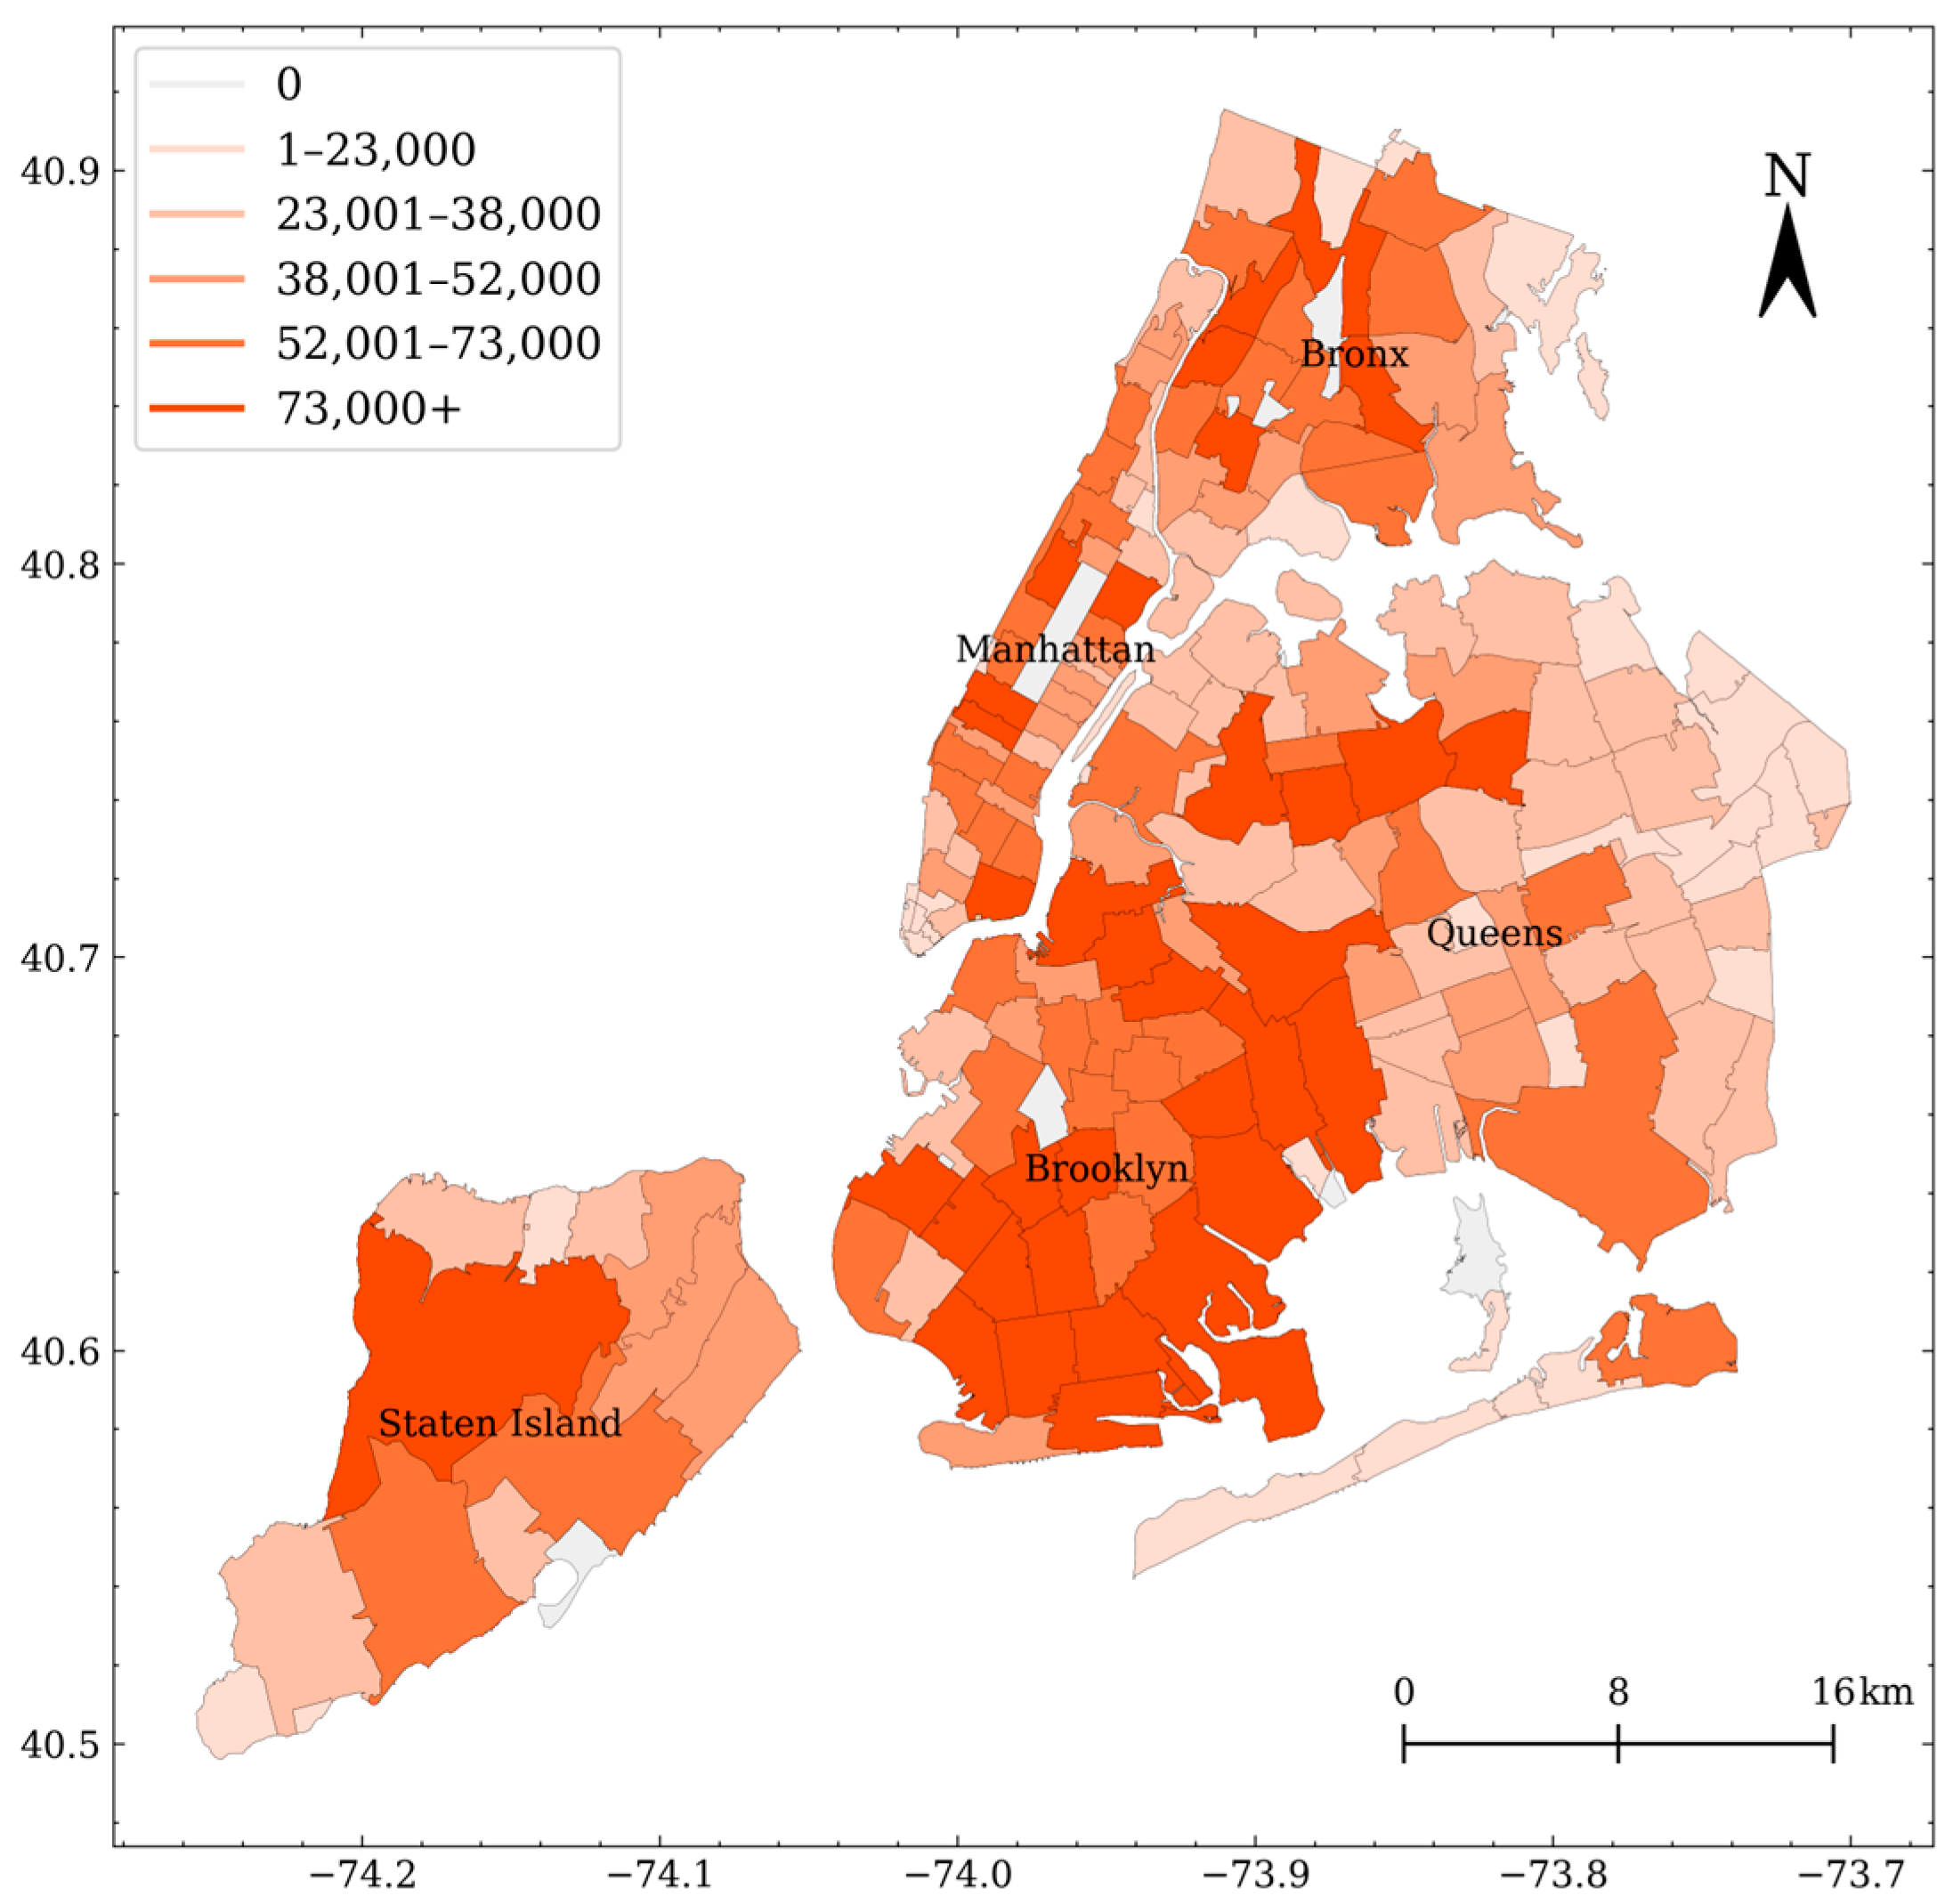
Figure 2 illustrates the spatial distribution of the cumulative confirmed COVID-19 cases in New York City as of 31 March 2022. The timeline of the New York City epidemic was discussed below. The first confirmed case of COVID-19 was recorded on 29 February 2020. On 22 March, all individuals (except essential service personnel) were legally obliged to work from home, and the number of new confirmed cases gradually decreased. On 8 June, New York City began to implement a four-phase reopening plan, which gradually eased epidemic restrictions. As a result, the number of COVID-19 cases increased and remained high thereafter. In early November, the number of cases rebounded, and restrictions on gatherings and travel were initiated on 13 November. On 15 June 2021, the whole of New York State reopened, and only a proof of vaccination was required for travel. However, the Omicron (BA.1) variant led to a spike in cases. On 3 January 2022, 54,834 cases were confirmed. In early February, the outbreak entered a phase of slow growth.
The timeline analysis of the dispersal of the epidemic in New York City identified three waves of the COVID-19 outbreak: (1) the first wave (from March 2020 to June 2020), which was accompanied by a restrictive anti-epidemic policy; (2) the second wave (from November 2020 to June 2021), which was accompanied by quarantine policies limiting the number of people at gatherings; and (3) the third wave (from December 2021 to February 2022), which had no restrictive anti-epidemic policy.
3.6. New York City Taxi Data
This study utilised taxi trip records provided by the New York City Taxi and Limousine Commission. The data contained externally available trip records for every taxi in New York City from 2009 to 2022. The dataset included time stamps (date and time to the second) for pick-up and drop-off, taxi pick-up zones, taxi drop-off zones, number of passengers, distance travelled, and trip costs (fares, taxes, tolls, and tips). Given the large data size, the trajectory data for the Yellow Medallion Taxi from January 2019 to March 2022 was selected for this study.
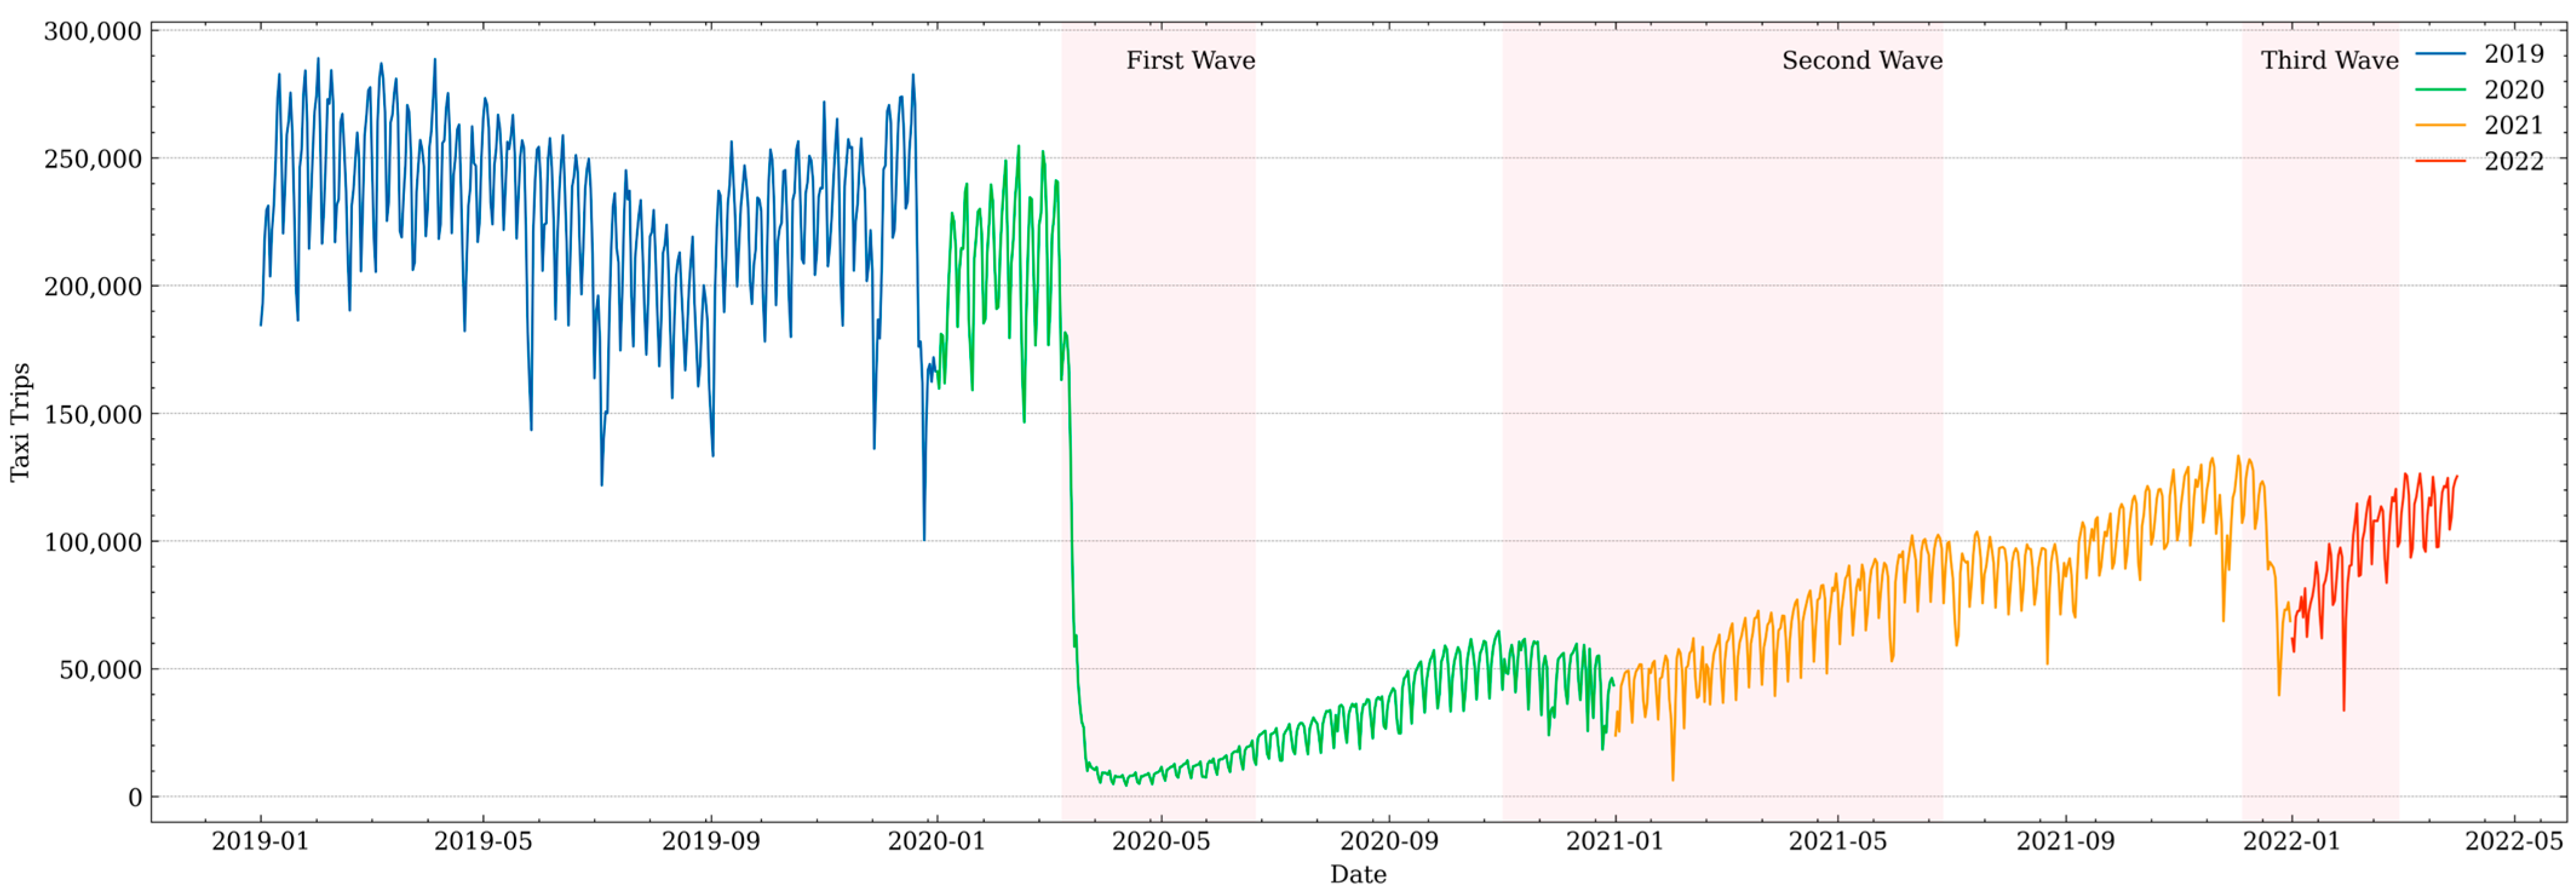
Figure 3 shows the number of New York City taxi trips from January 2019 to March 2022. The outbreak strongly affected the New York City taxi industry, with an extremely significant drop in the number of trips compared to the week before the outbreak (3–9 February 2020). Moreover, a week after the restrictions (23–29 March 2020), a drop of 95.3% was noted. After the first wave of the epidemic growth, the number of taxi journeys began to rebound; however, the growth rate was very slow, and by the end of March 2022 (two years after the outbreak), the number of taxi journeys remained below half the pre-epidemic level.
4. Results
4.1. Impacts of the Three Epidemic Waves on Taxi Journeys
After combining the results of
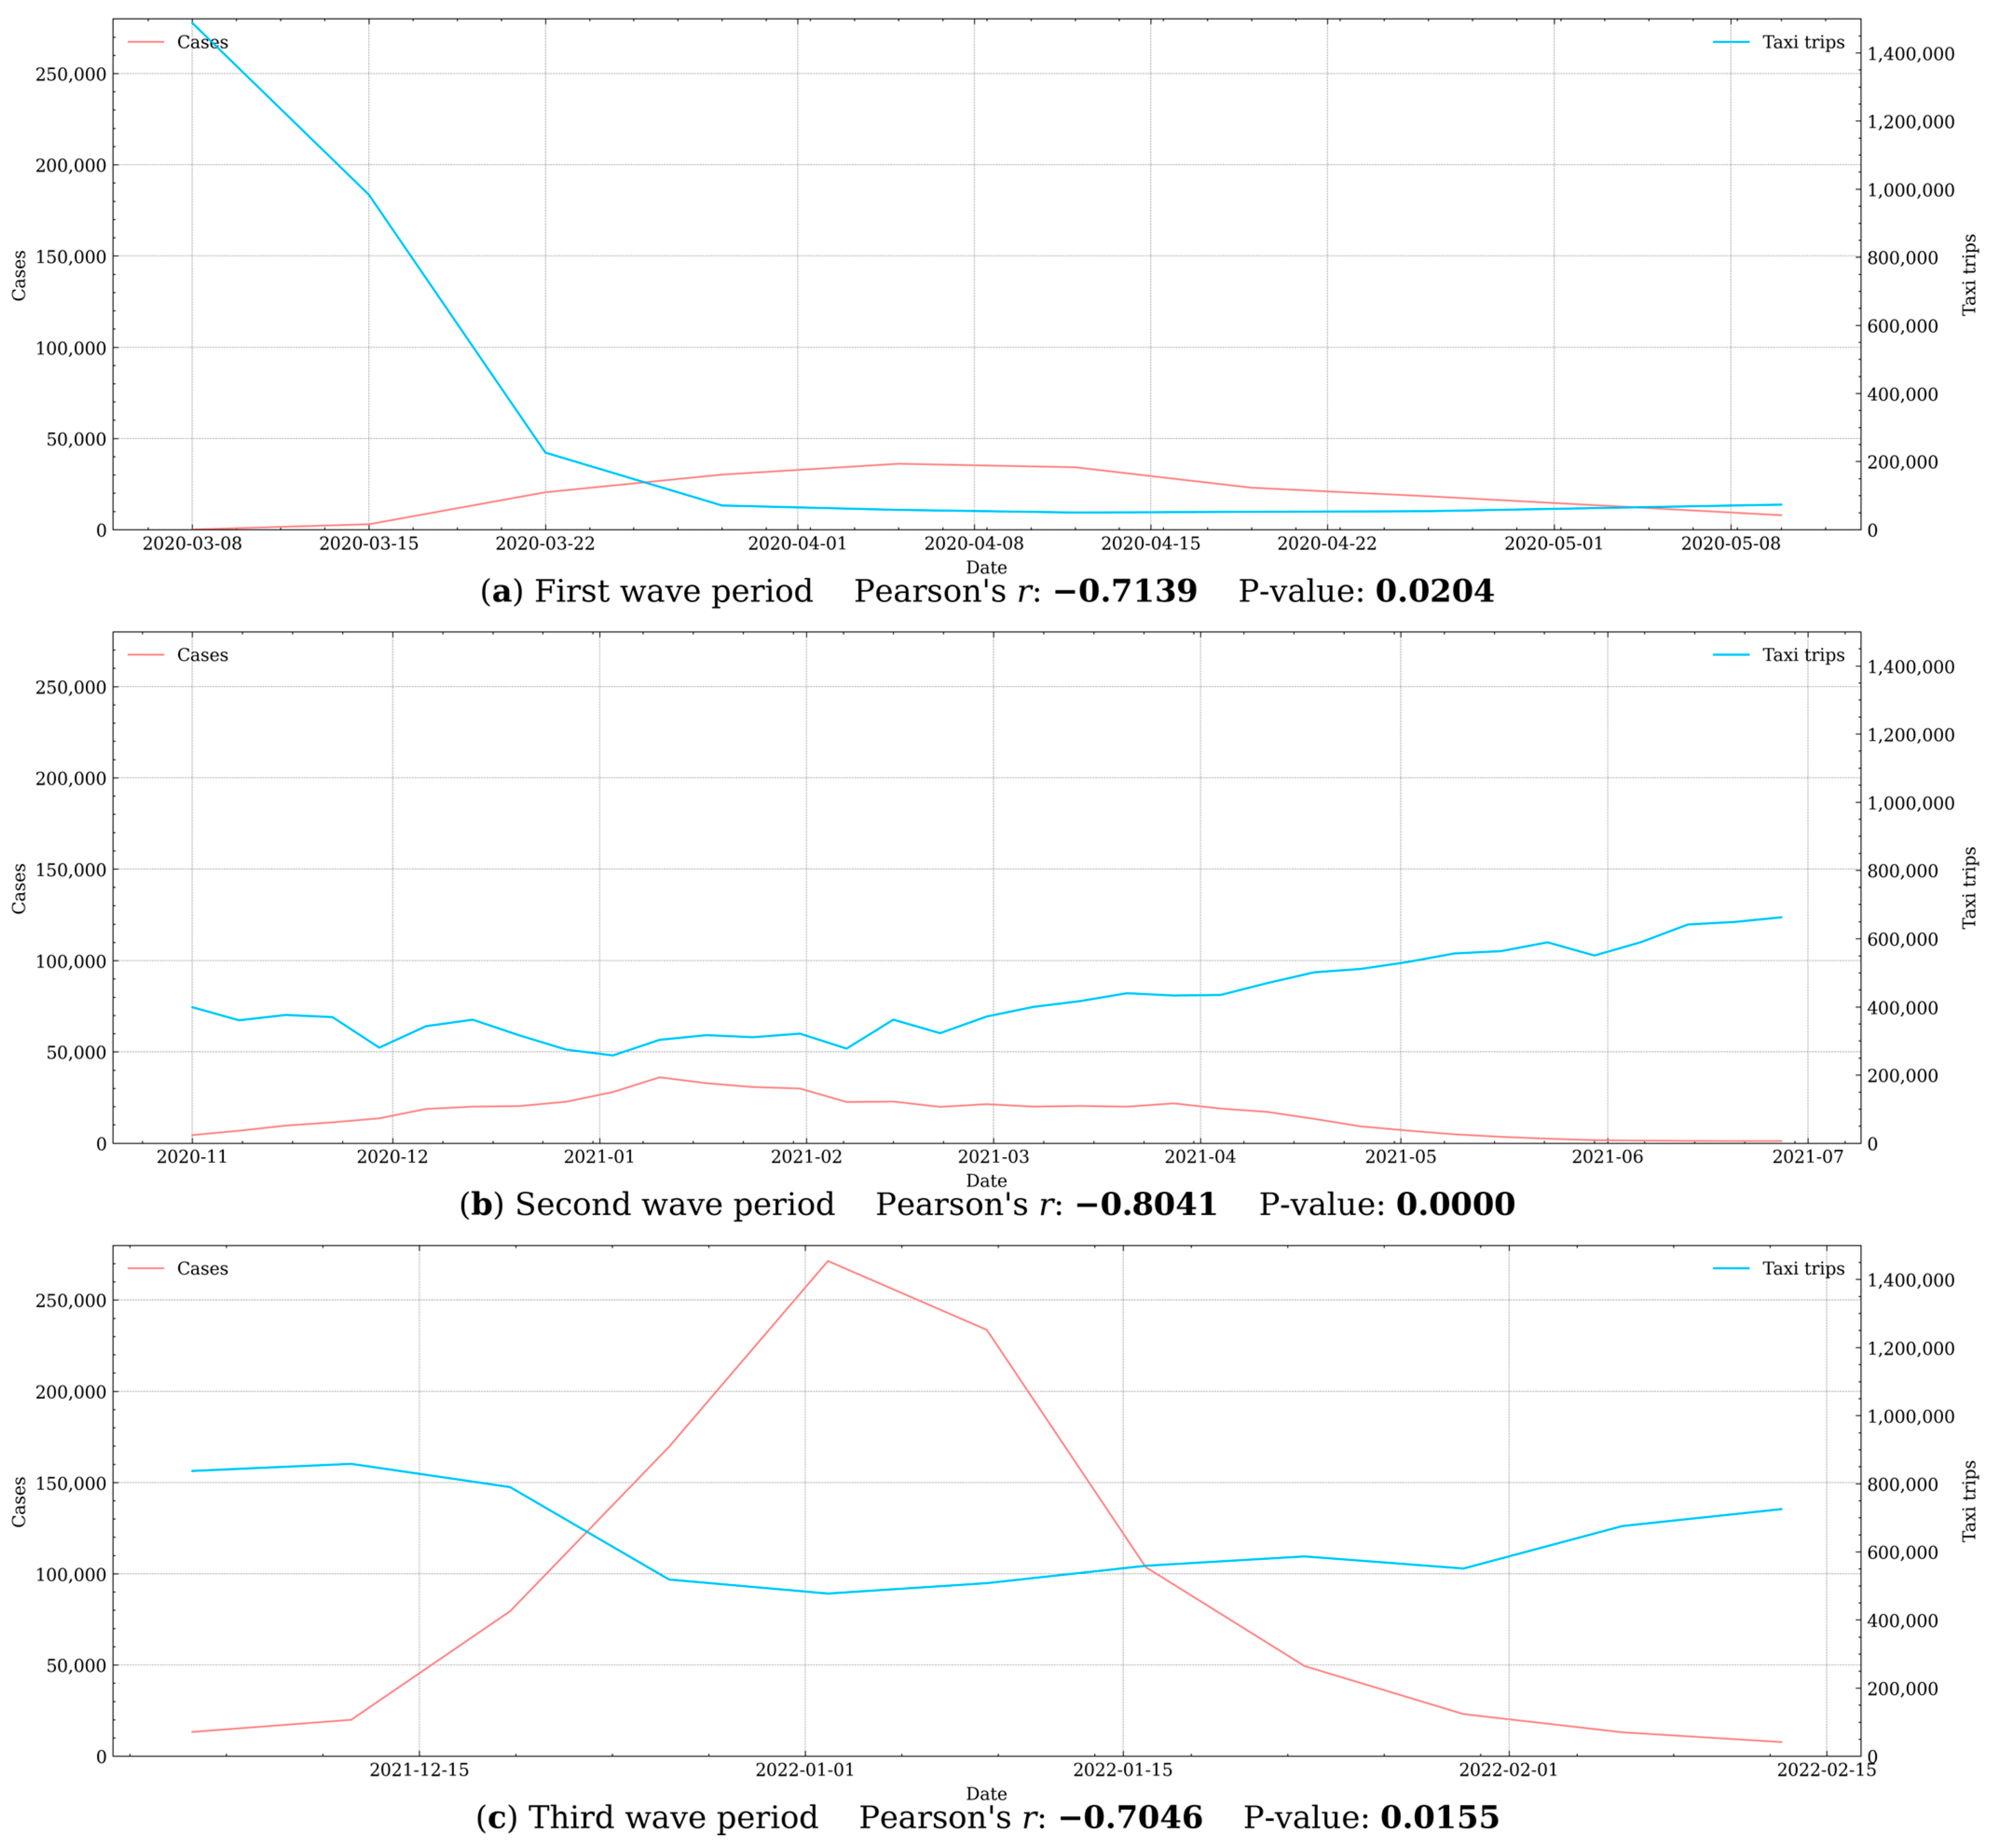
Section 3.5 on the New York City outbreak timeline, the Pearson correlation coefficient tested the relationship between confirmed cases in the three waves of the COVID-19 outbreak and taxi data in New York City, following a normality test.
Figure 4 shows a significant negative correlation between the number of confirmed cases and taxi trips during the three waves of the COVID-19 outbreak. Moreover, each wave of the epidemic had similar trends: as the number of new confirmed cases increased, that of the taxi trips decreased.
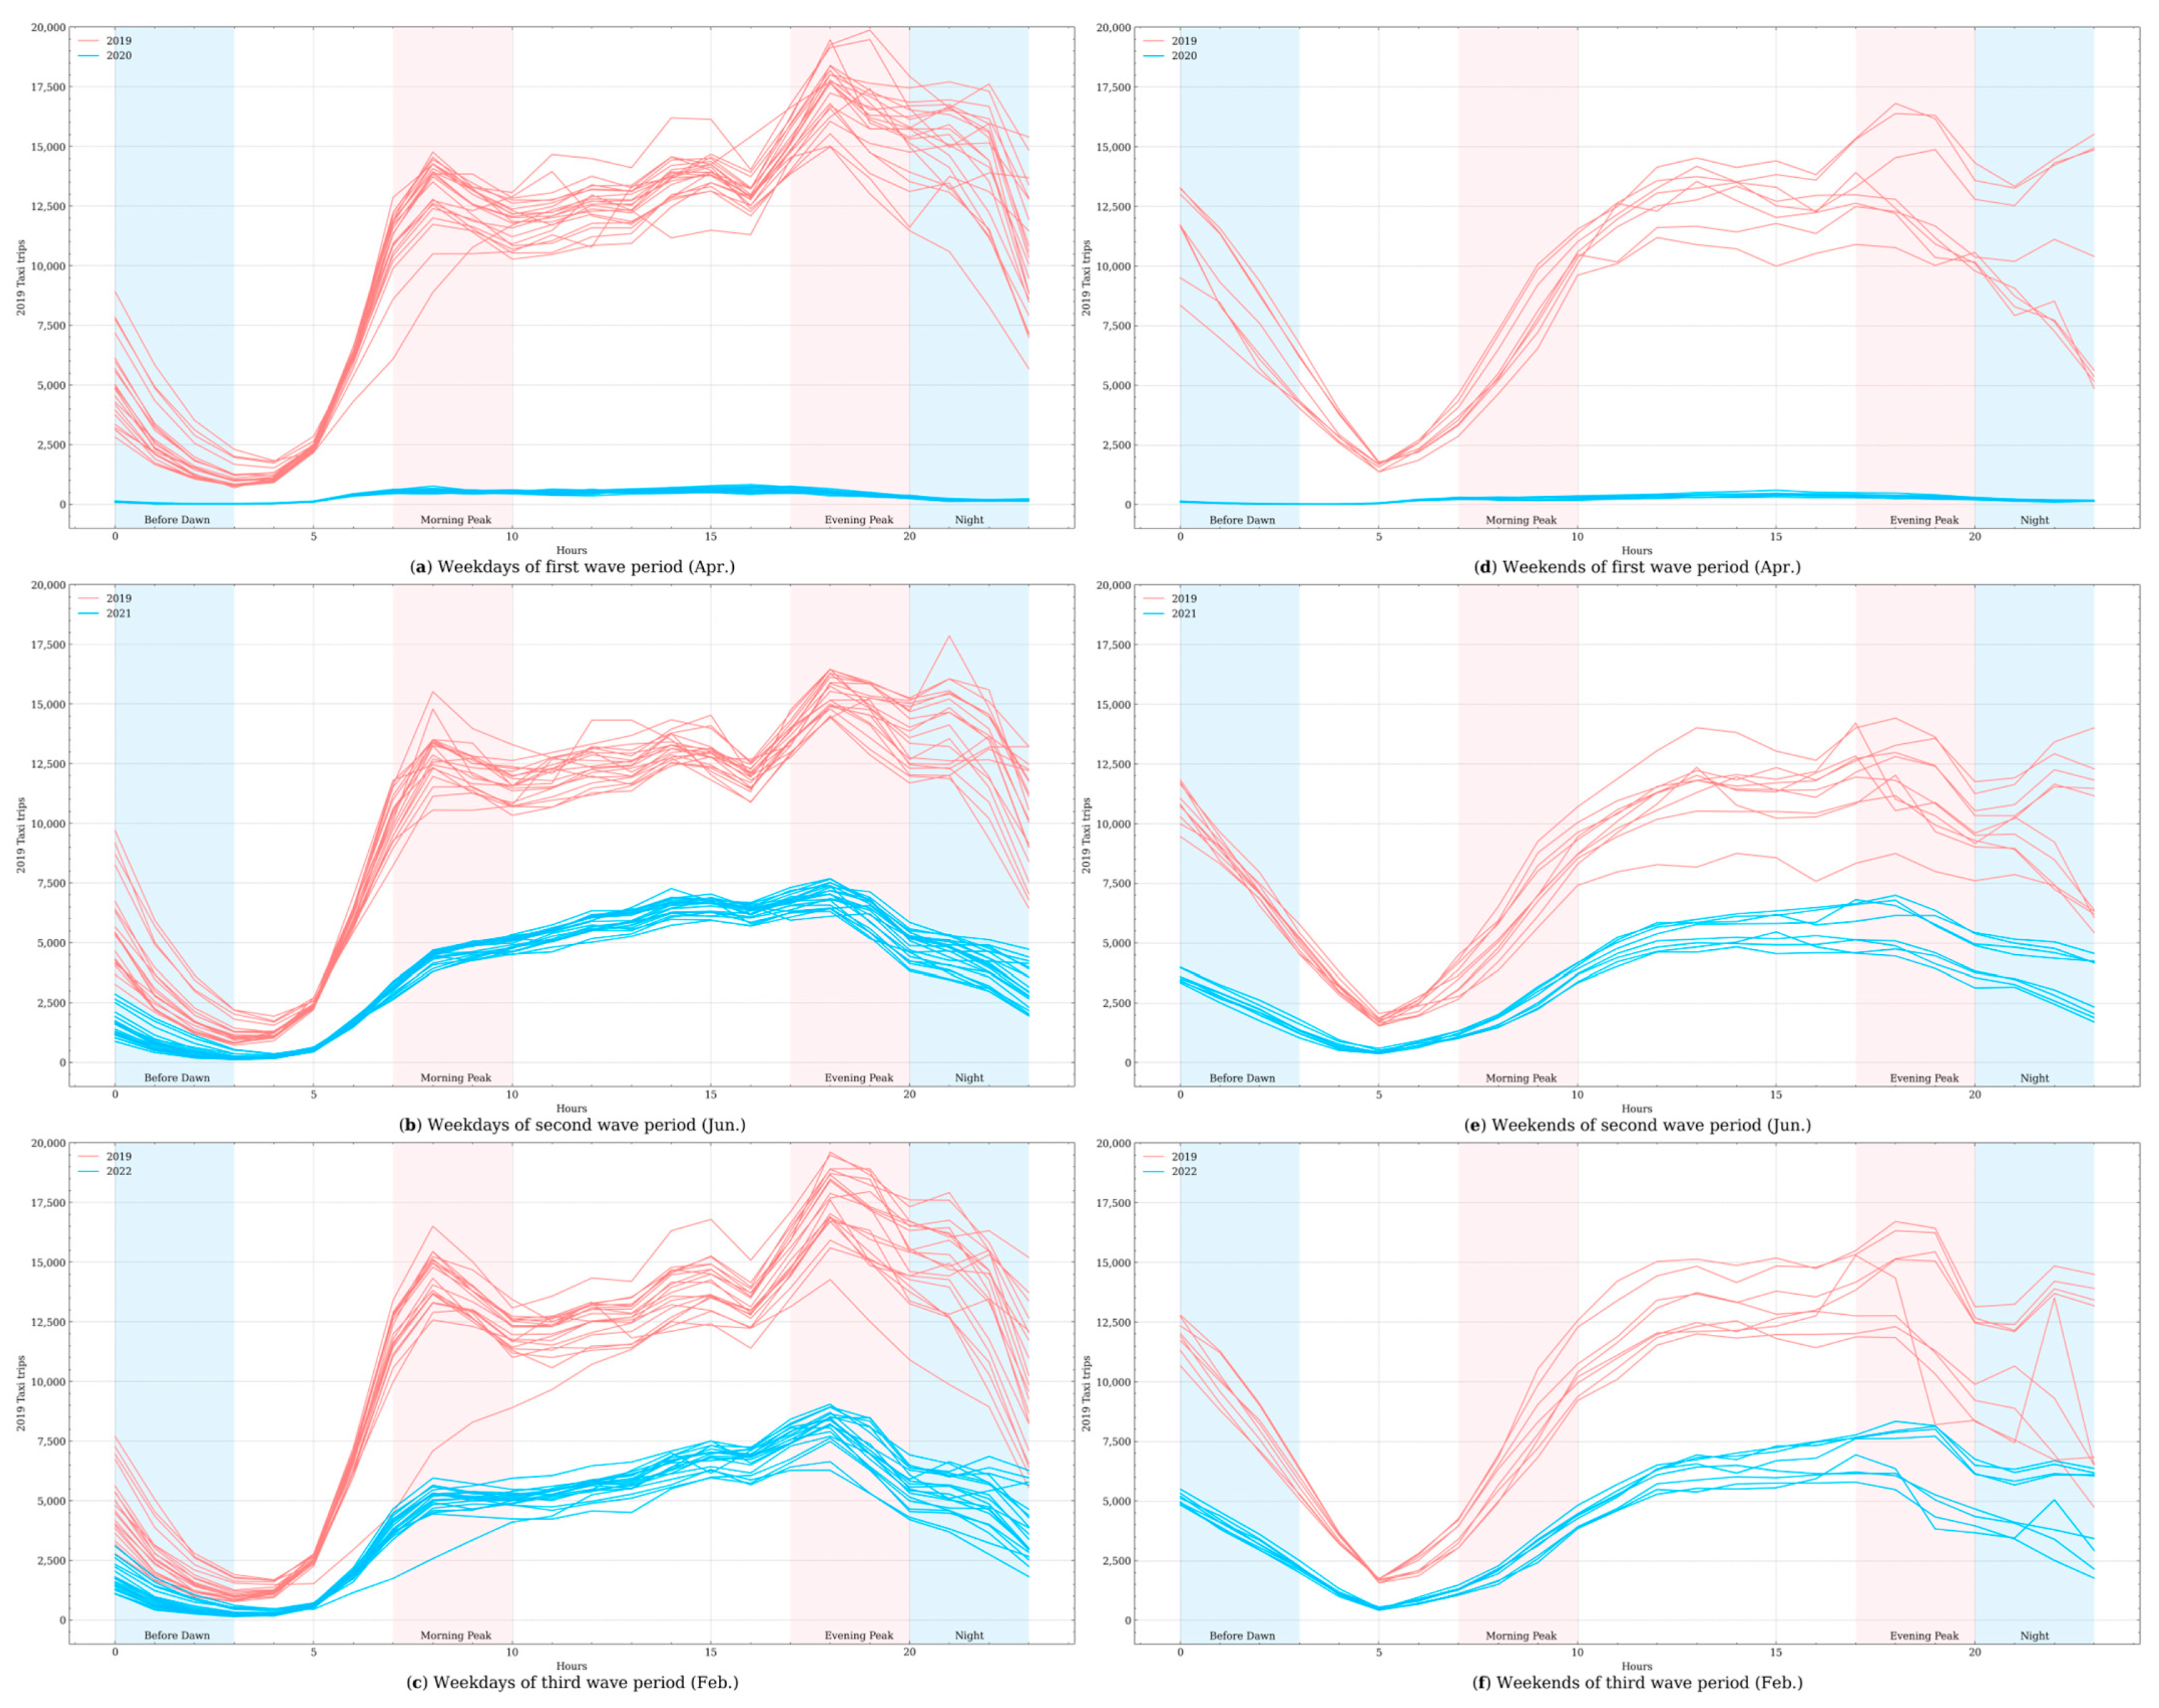
A comparison of the three waves with the same period in a normal year (2019) showed that daily travel patterns changed (
Figure 5). In 2019, the morning peak hours on weekdays were approximately between 7 a.m. and 9 a.m., whereas the evening peak hours were approximately between 17:00 and 19:00. There was a clear peak on Saturdays between 4 p.m. and 8 p.m. However, the advent of the COVID-19 outbreak changed these patterns. In addition to lowering the daily passenger volumes, the outbreak blurred the weekday morning and evening peak boundaries, with trips no longer concentrated in peak hours. The number of night taxi trips on weekdays and weekends also decreased significantly. This was particularly evident in June 2020 (when the first wave of the epidemic subsided), wherein the morning and evening peaks almost disappeared, and the original off-peak hours became the most frequented. Night-time and early morning journeys dropped significantly. The disappearance of peak hours could be attributed to the disappearance of commuter demand after implementing the pause order on 22 March 2020, when most workers in New York City were required to work from home. The drop in night and early morning trips may have been due to a reduction in night-time socialising to reduce the risk of infection. This may have been related to the restrictive policies limiting the number of people in a gathering, ban on restaurant dining-in, and closure of entertainment venues, such as bars. These findings indicate that strict anti-epidemic restrictions clearly restrained travel behaviour.
As the second wave of anti-epidemic policies began to being relaxed, taxi trip patterns were altered. Weekday morning peaks were not evident, evening peaks started emerging, and weekend night trips resumed. The return of travel patterns became more apparent after the reopening of New York State on 15 June 2021. Unlike the 2020 epidemic, the new Omicron wave did not cause dramatic changes in taxi journeys.
After the third wave of the epidemic decelerated, weekday trips in February 2022 were very similar to those in February 2019. The one exception was the large difference in the morning peak and an overall reduction in total trips when compared to the pre-epidemic period, suggesting that the number of taxi trips returned to pre-epidemic levels in February 2022 and that a liberal anti-epidemic policy enabled the restoration of traffic patterns.
4.2. Variations in Spatial Autocorrelation between Origins and Destinations
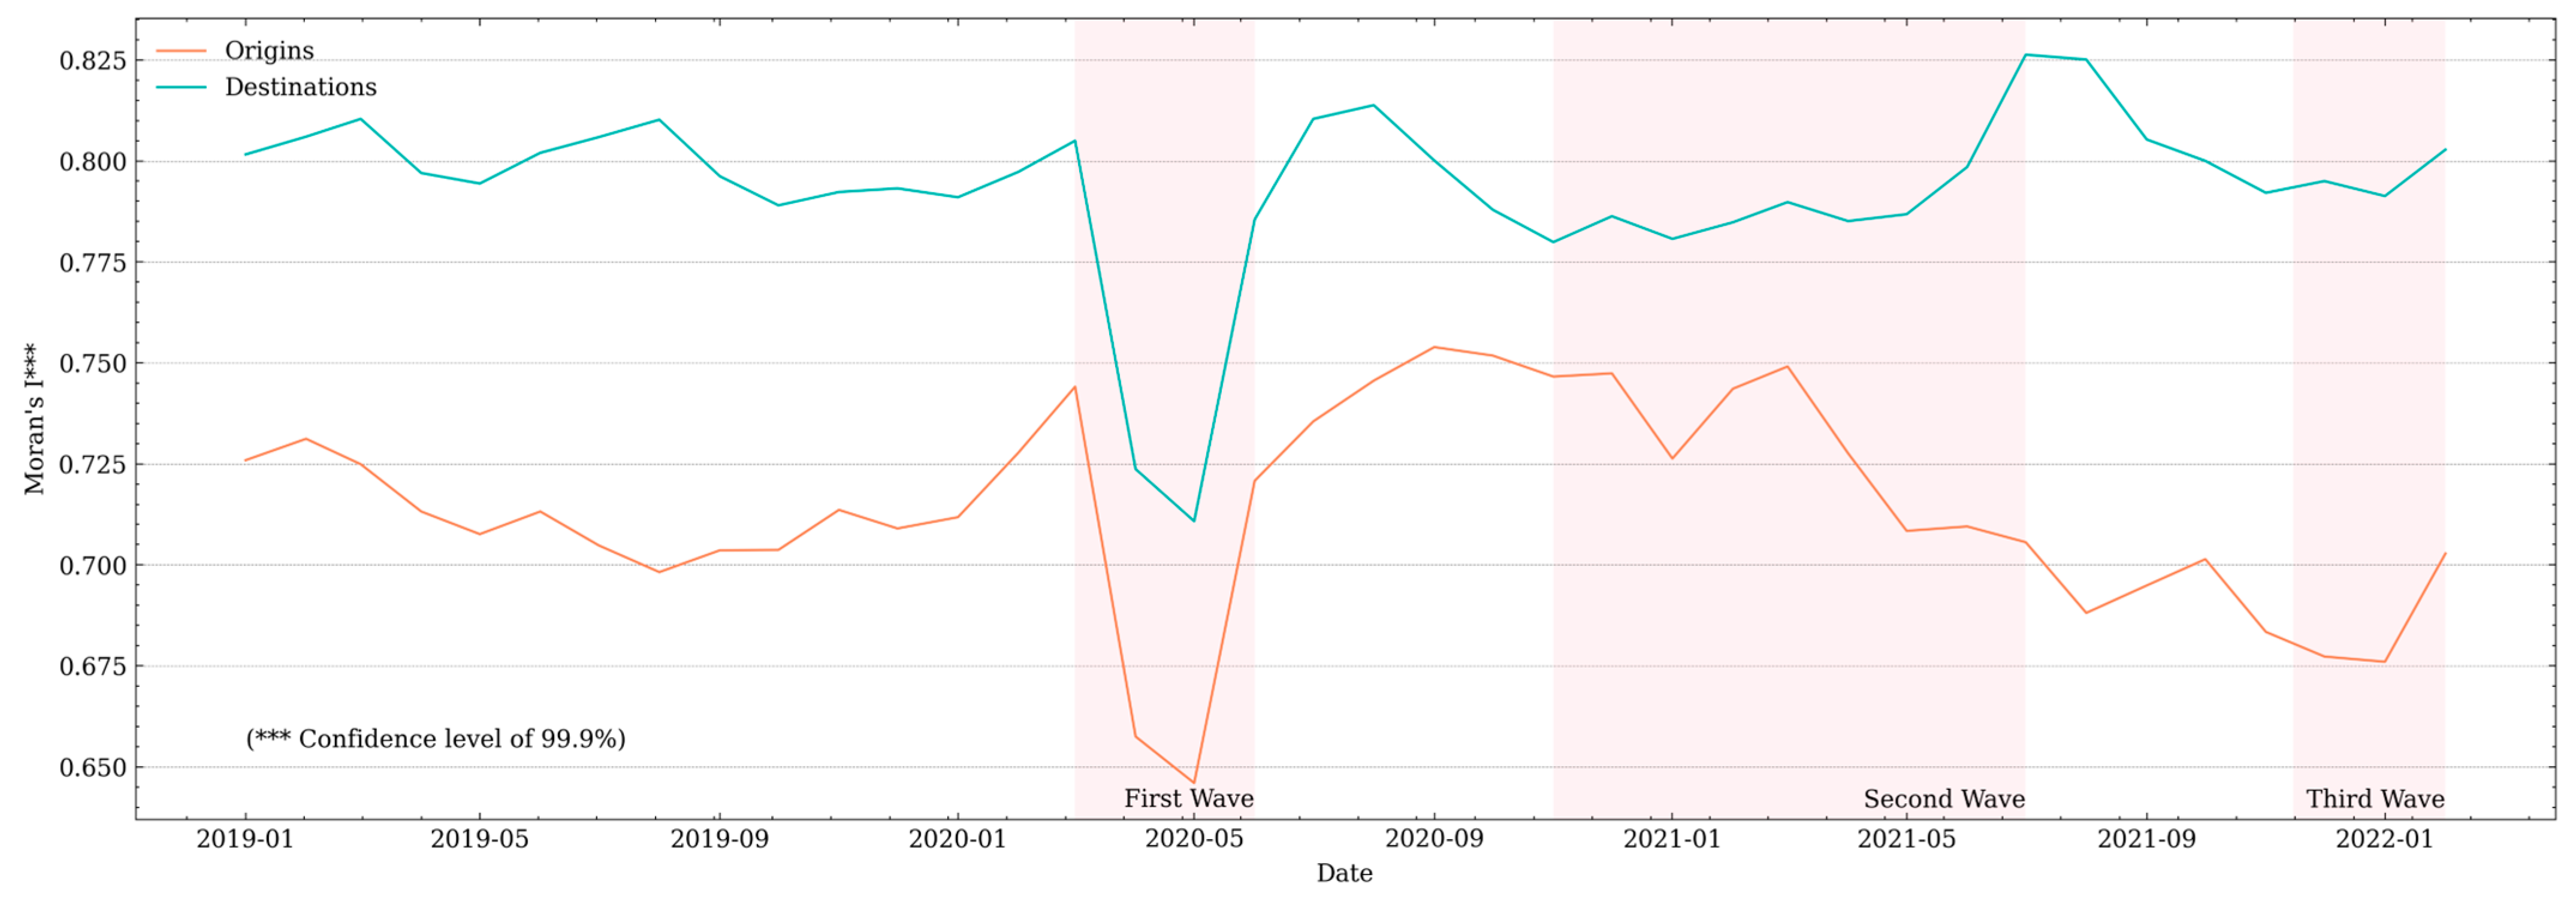
The monthly data used to calculate Moran’s
I for the start and end locations of taxi journeys (using a spatial weight matrix of rank two based on the Queen rule) revealed variations between normal and epidemic periods (
Figure 6). The distribution of taxi pick-ups and drop-offs in New York City during these periods exhibited spatial clustering at the global level. The Moran’s
I was higher in drop-off areas than in pick-up areas, indicating a stronger spatial autocorrelation in drop-off areas during the study period.
The variation in Moran’s I in pick-up and drop-off zones before the epidemic was minor. Between March and June (first wave of the COVID-19 outbreak), Moran’s I in both pick-up and drop-off zones decreased rapidly, indicating that the restrictive travel policy caused a rapid decrease in spatial autocorrelation. This was due to a significant decrease in the number of trips in almost all zones, with smaller differences between zones.
As the four-phase reopening plan was implemented, Moran’s I in both the pick-up and drop-off zones increased rapidly, indicating that the trip variations between zones became larger as anti-epidemic restrictions decreased. The lenient anti-epidemic policies during both the second and third waves of the epidemic also affected the spatial autocorrelation between origins and destinations. The pick-up zones were similar to the discrete distribution, and the drop-off zones were close to the aggregated distribution, with an increased variation in Moran’s I.
4.3. Variations in Spatial Clustering of Travel Destinations
LISA reveals possible clustering trends in data of empirical research [
19]. Local Moran’s
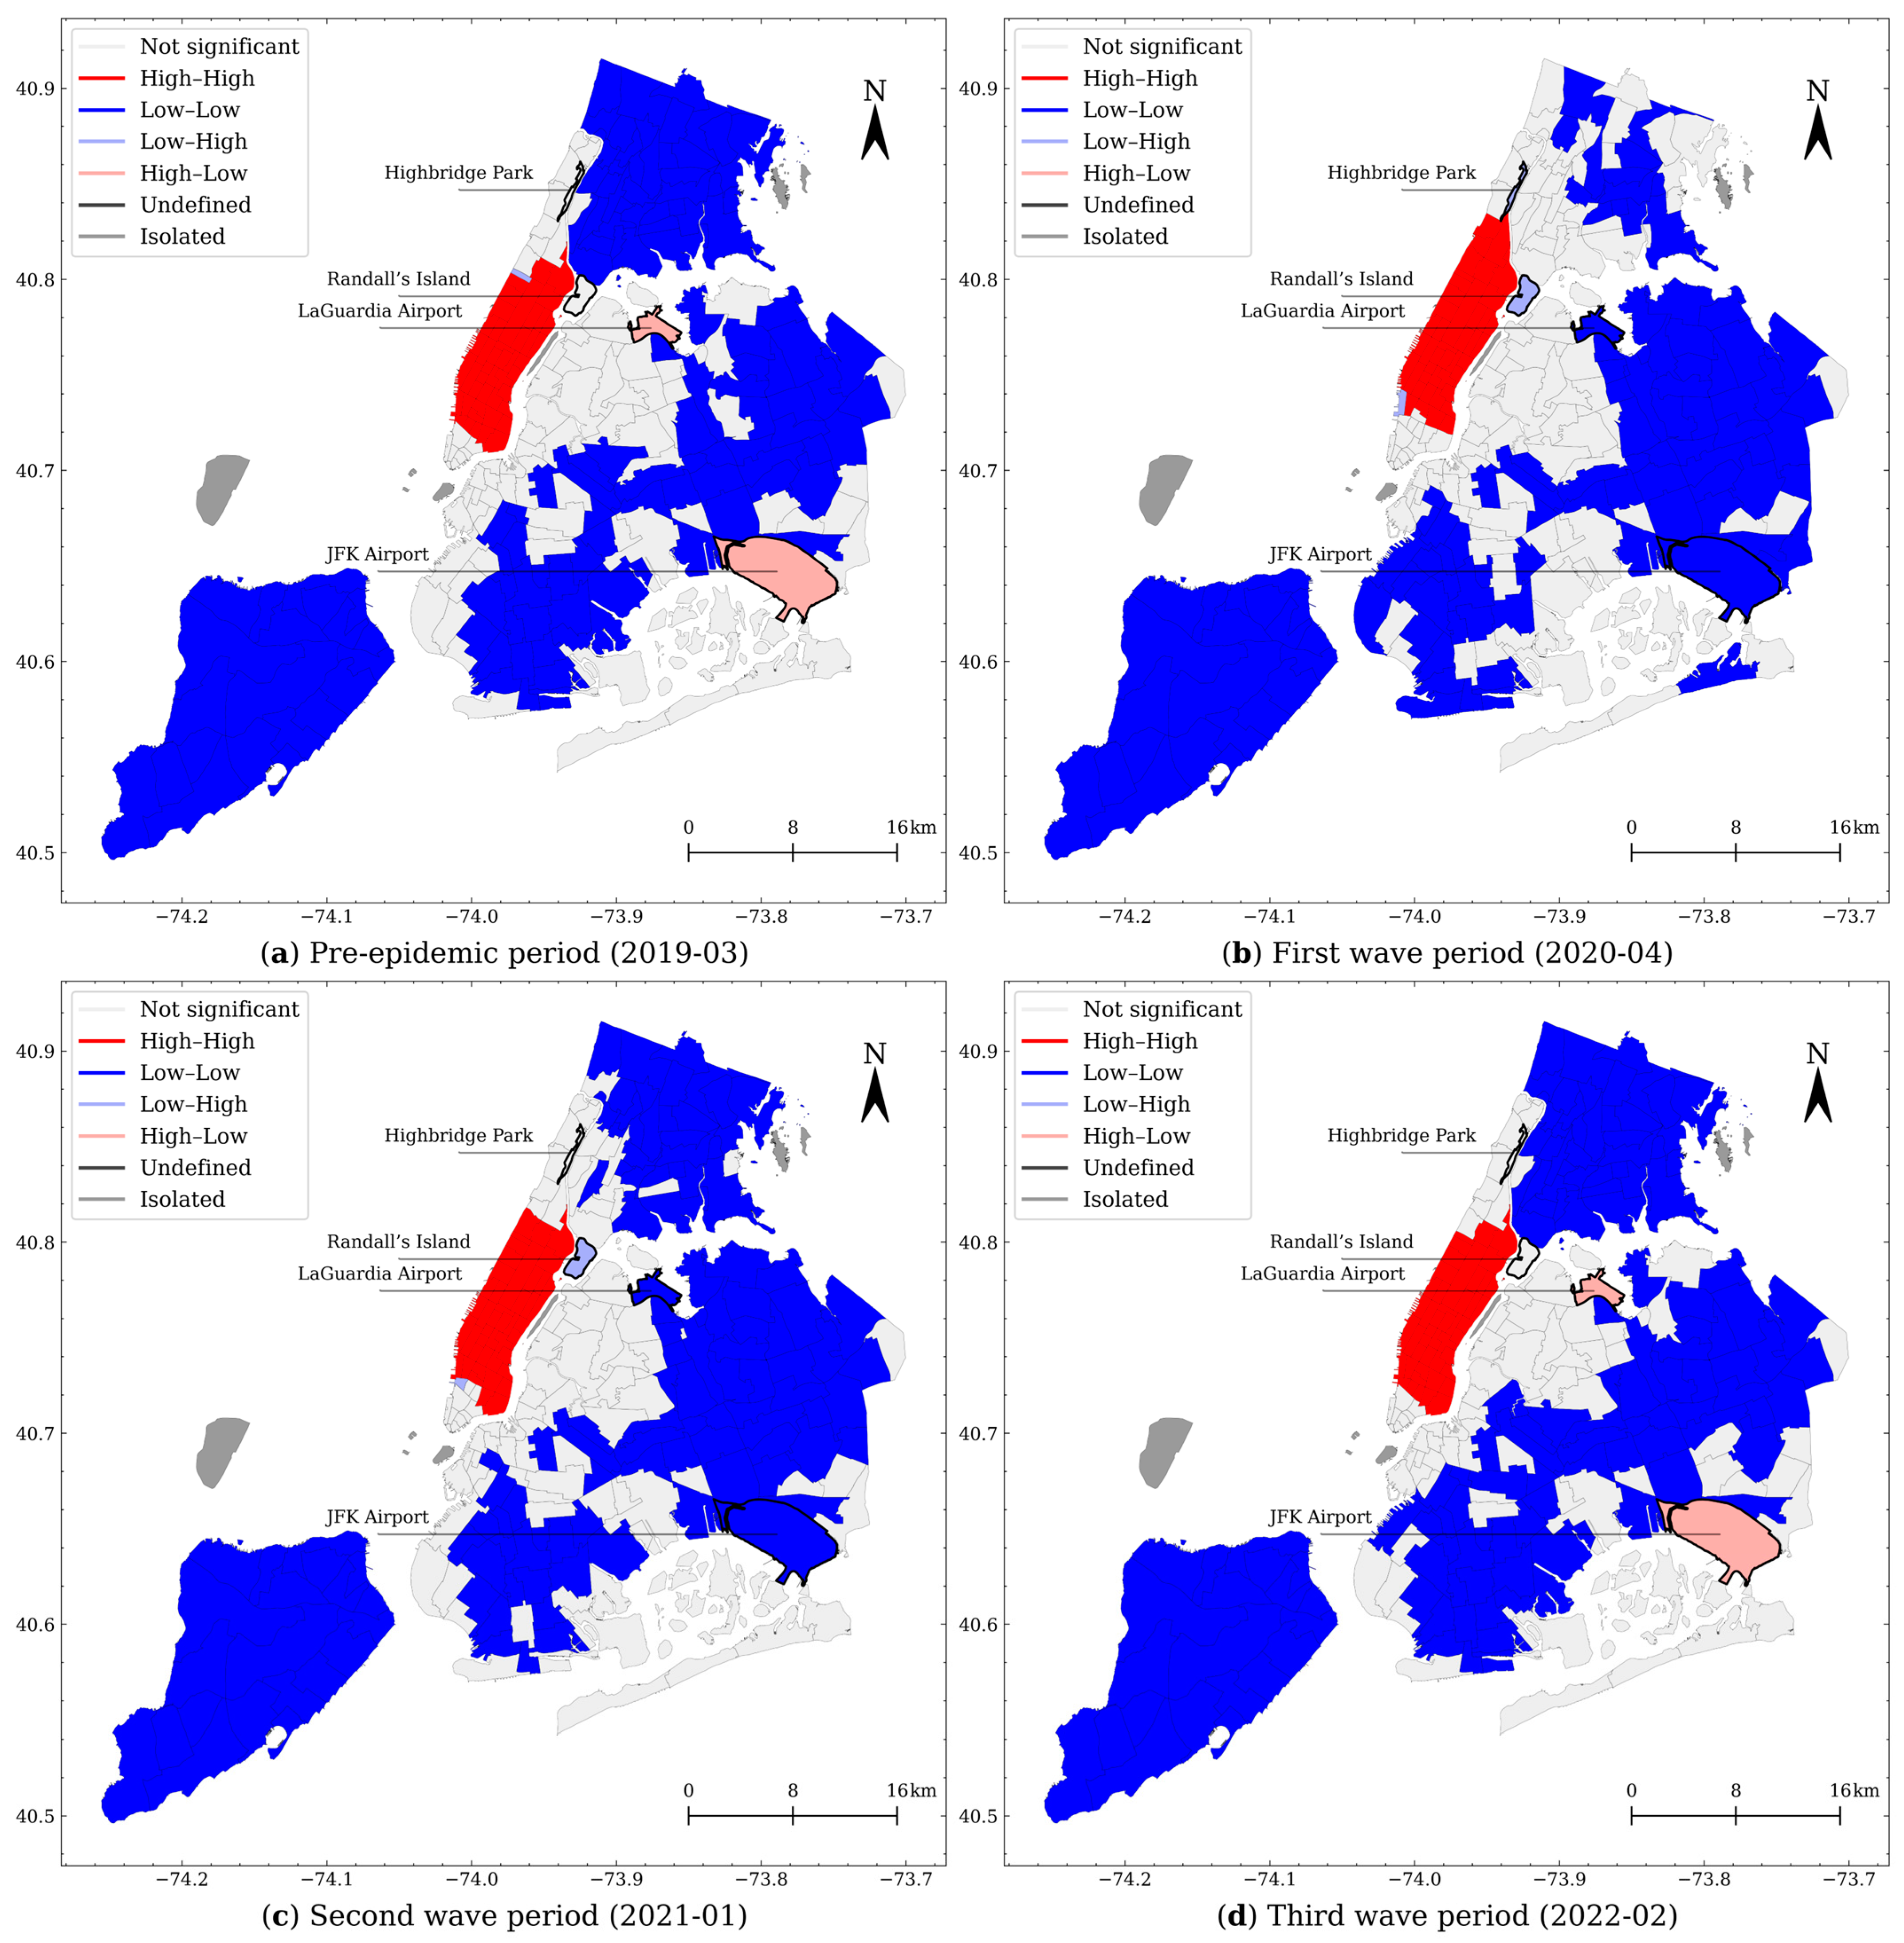
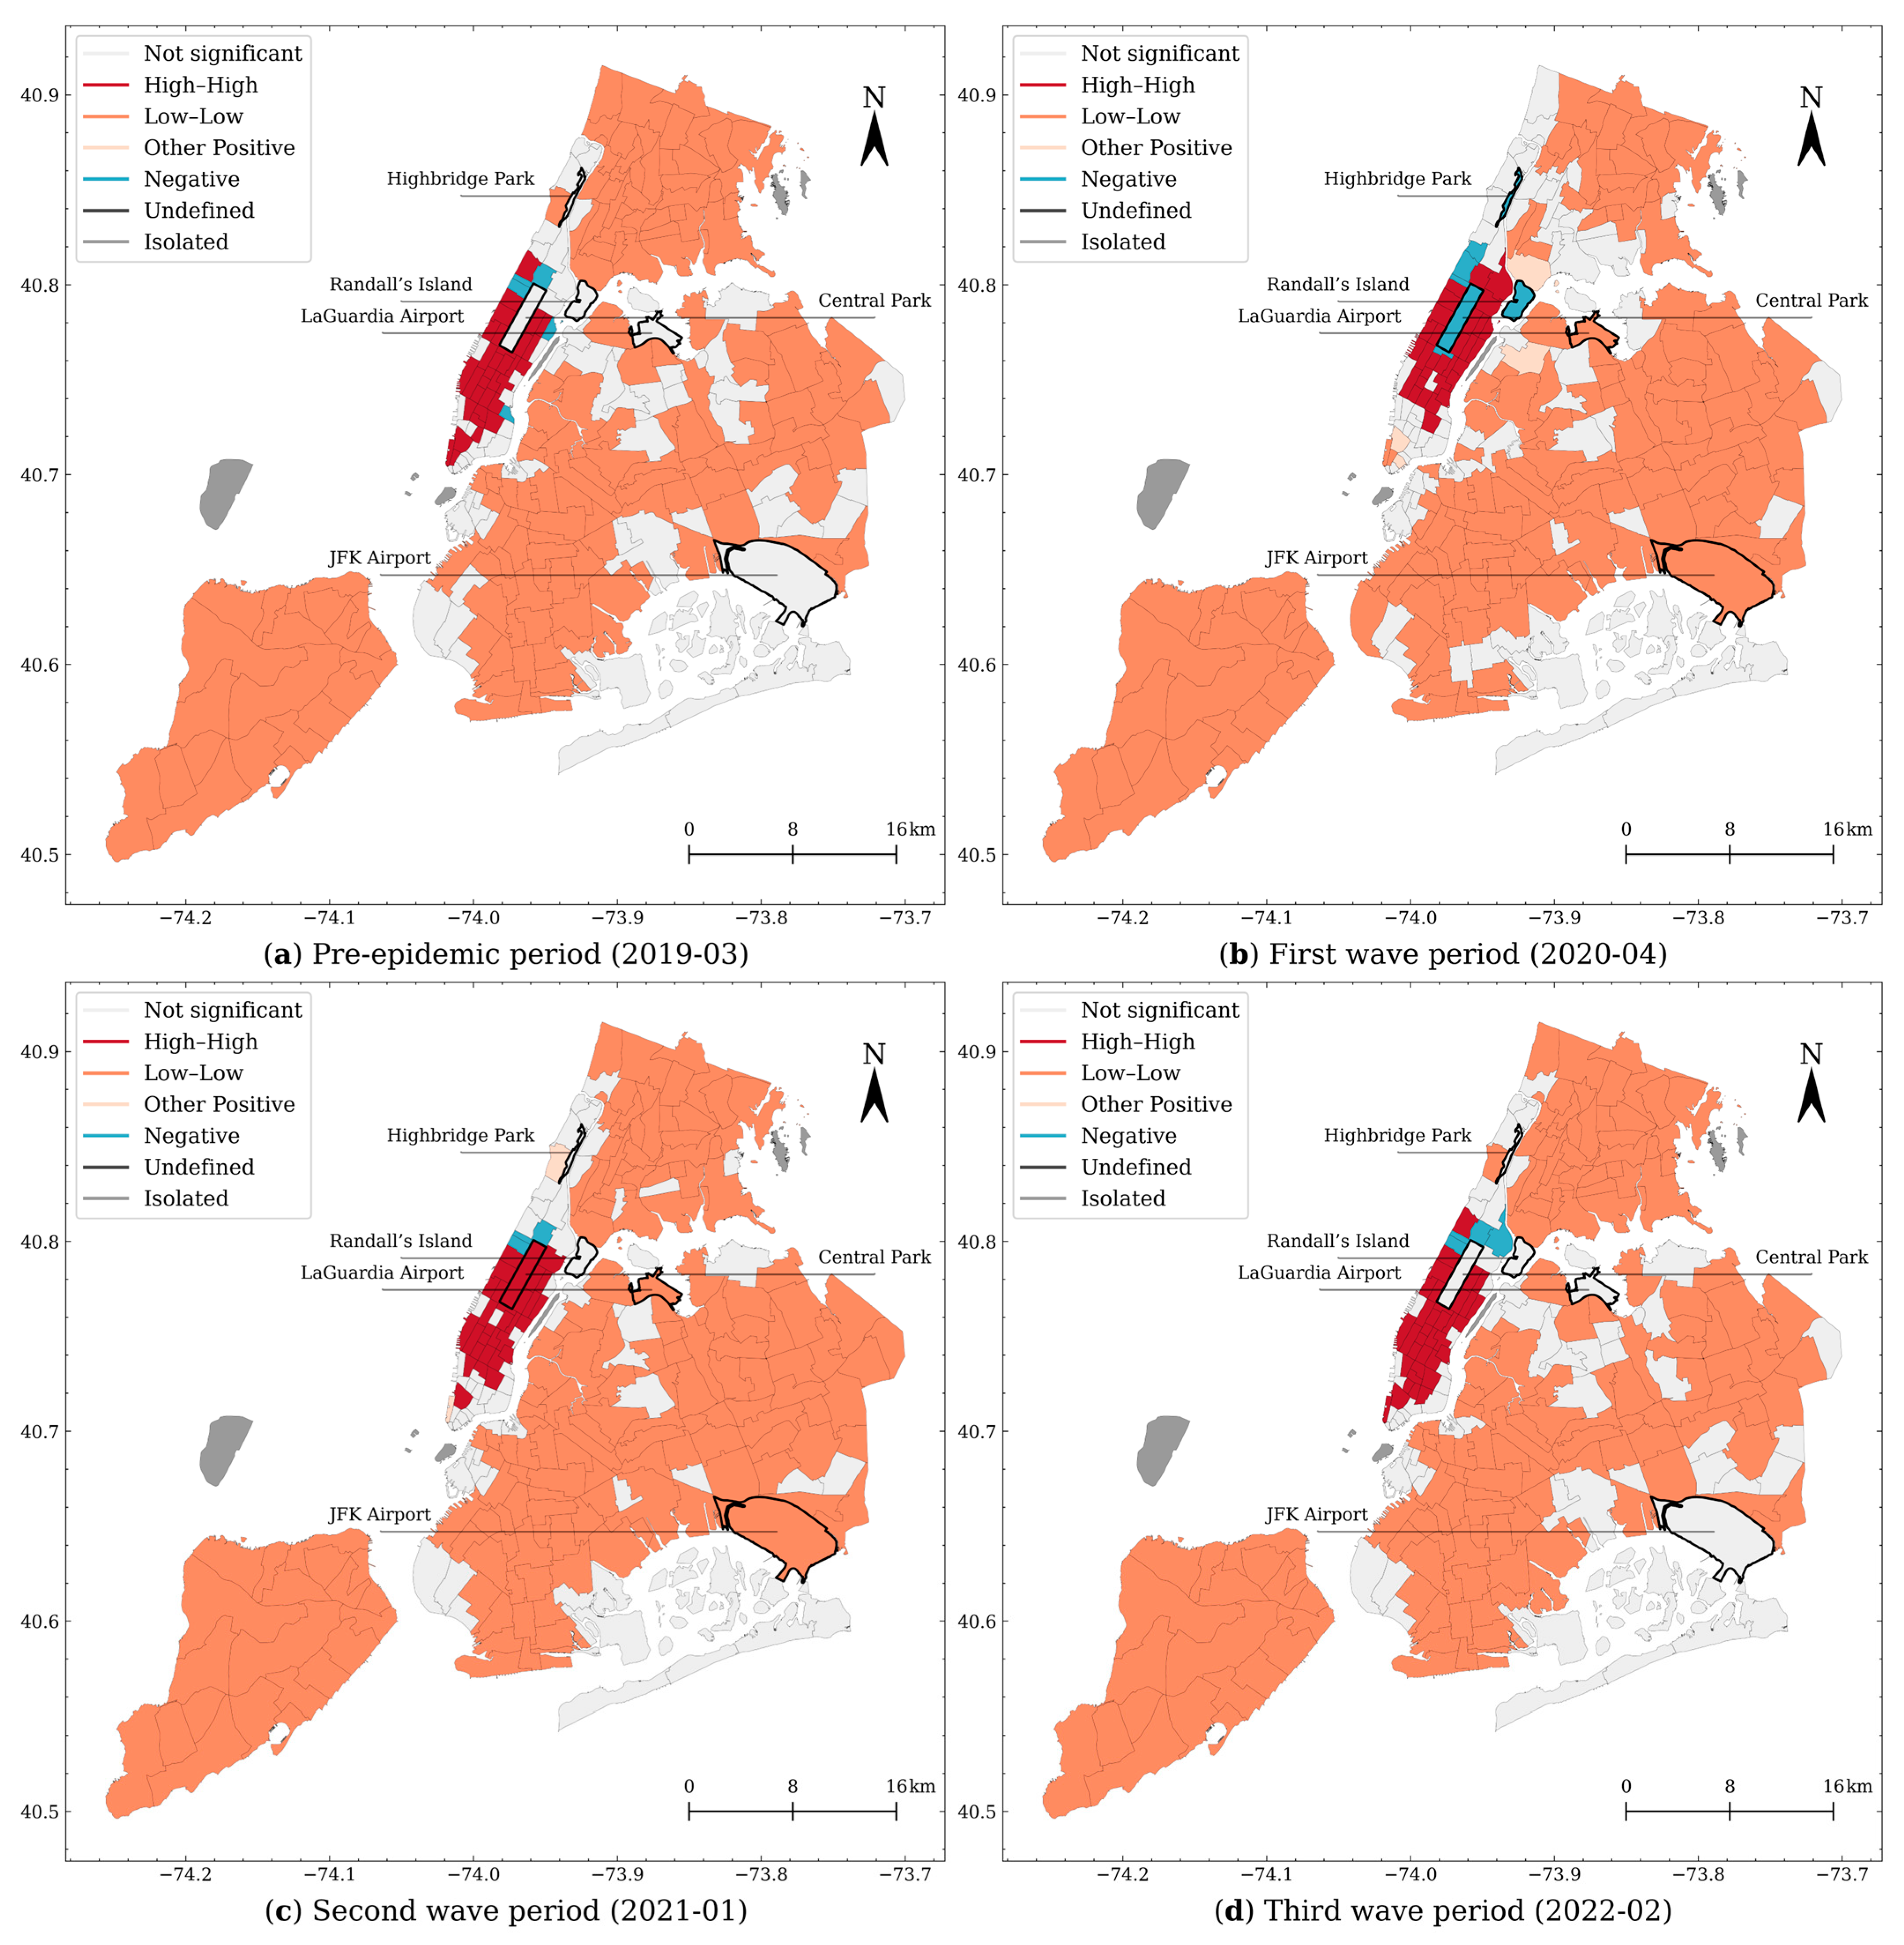
I and local Geary were used in clustering transport destinations during the outbreak. With the Monte Carlo method, the LISA map of the taxi drop-off area was created (
Figure 7 and
Figure 8). The detection results of Local Moran’s
I and local Geary were similar, indicating that the distribution of taxi drop-off areas in New York City prior to the outbreak exhibited significant spatial clustering characteristics.
The pre-epidemic drop-off zones with high–high clusters, accounting for 17.3%, were all located in Manhattan (and mostly in Midtown). The high–low cluster included the two major airports within New York City: JFK Airport and LaGuardia Airport. The two airports were isolated hot spots surrounded by cold spots, suggesting that taxi trips to the airports were much higher than taxi trips to their surrounding zones before the outbreak.
The distribution of taxi drop-off zones in New York City during the peak of the epidemic exhibited highly significant spatial clustering at the global scale. Two new low–high clusters were noted in April 2020: Randall’s Island Park and Highbridge Park. Additionally, local Geary detected negative clusters in Central Park. Therefore, park areas became unfrequented compared to the surrounding areas since the outbreak of the epidemic. On 1 April 2020, all playgrounds in New York City were closed; although parks were open, patrons were required to maintain a safe social distance to slow the spread of COVID-19 [
20]. This correlates with drastically reduced numbers of taxi trips to parks, indicating that the demand for park spaces during the epidemic was compromised by anti-epidemic policies.
Moreover, no high–low clusters were identified from April 2020. The previous high–low cluster of JFK and LaGuardia airports changed to low–low clusters after the outbreak. The outbreak led to a significant reduction in the number of passengers travelling by taxi to the airport, which was consistent with a reduction in long-distance travel due to epidemic prevention and control measures. First, on 10 March 2020, New York City required commuters to avoid public transport as much as possible to combat the spread of the virus, which inevitably affected taxis. Second, the airline industry was also affected by the outbreak, with flights at JFK and LaGuardia airports having 81.1% and 90.5% decreases, respectively (compared to February of the same year). Third, the reduction in taxi journeys may have been due to a shift in commuter attitudes, with air travellers commuting by private car to avoid infection.
However, these changes were temporary, and taxi arrivals at airports gradually increased over time. In July 2020, the clustering type for Highbridge Park became insignificant, corresponding to New York City’s Phase IV reopening plan, which permitted low-risk outdoor activities, including trips to nature parks with a 33% capacity. In April 2021, clustering changed to high–low at LaGuardia Airport, and Randall’s Island Park became insignificant. In May, the clustering at JFK also changed to high–low. These changes correspond to the end of the second wave of the epidemic, with fewer restrictions. At this stage, these areas had reverted to their pre-epidemic clustering patterns, indicating that over time, people were engaging in outdoor group activities, and taxi rides to the airport increased significantly.
4.4. Variations in Origin–Destination Distribution
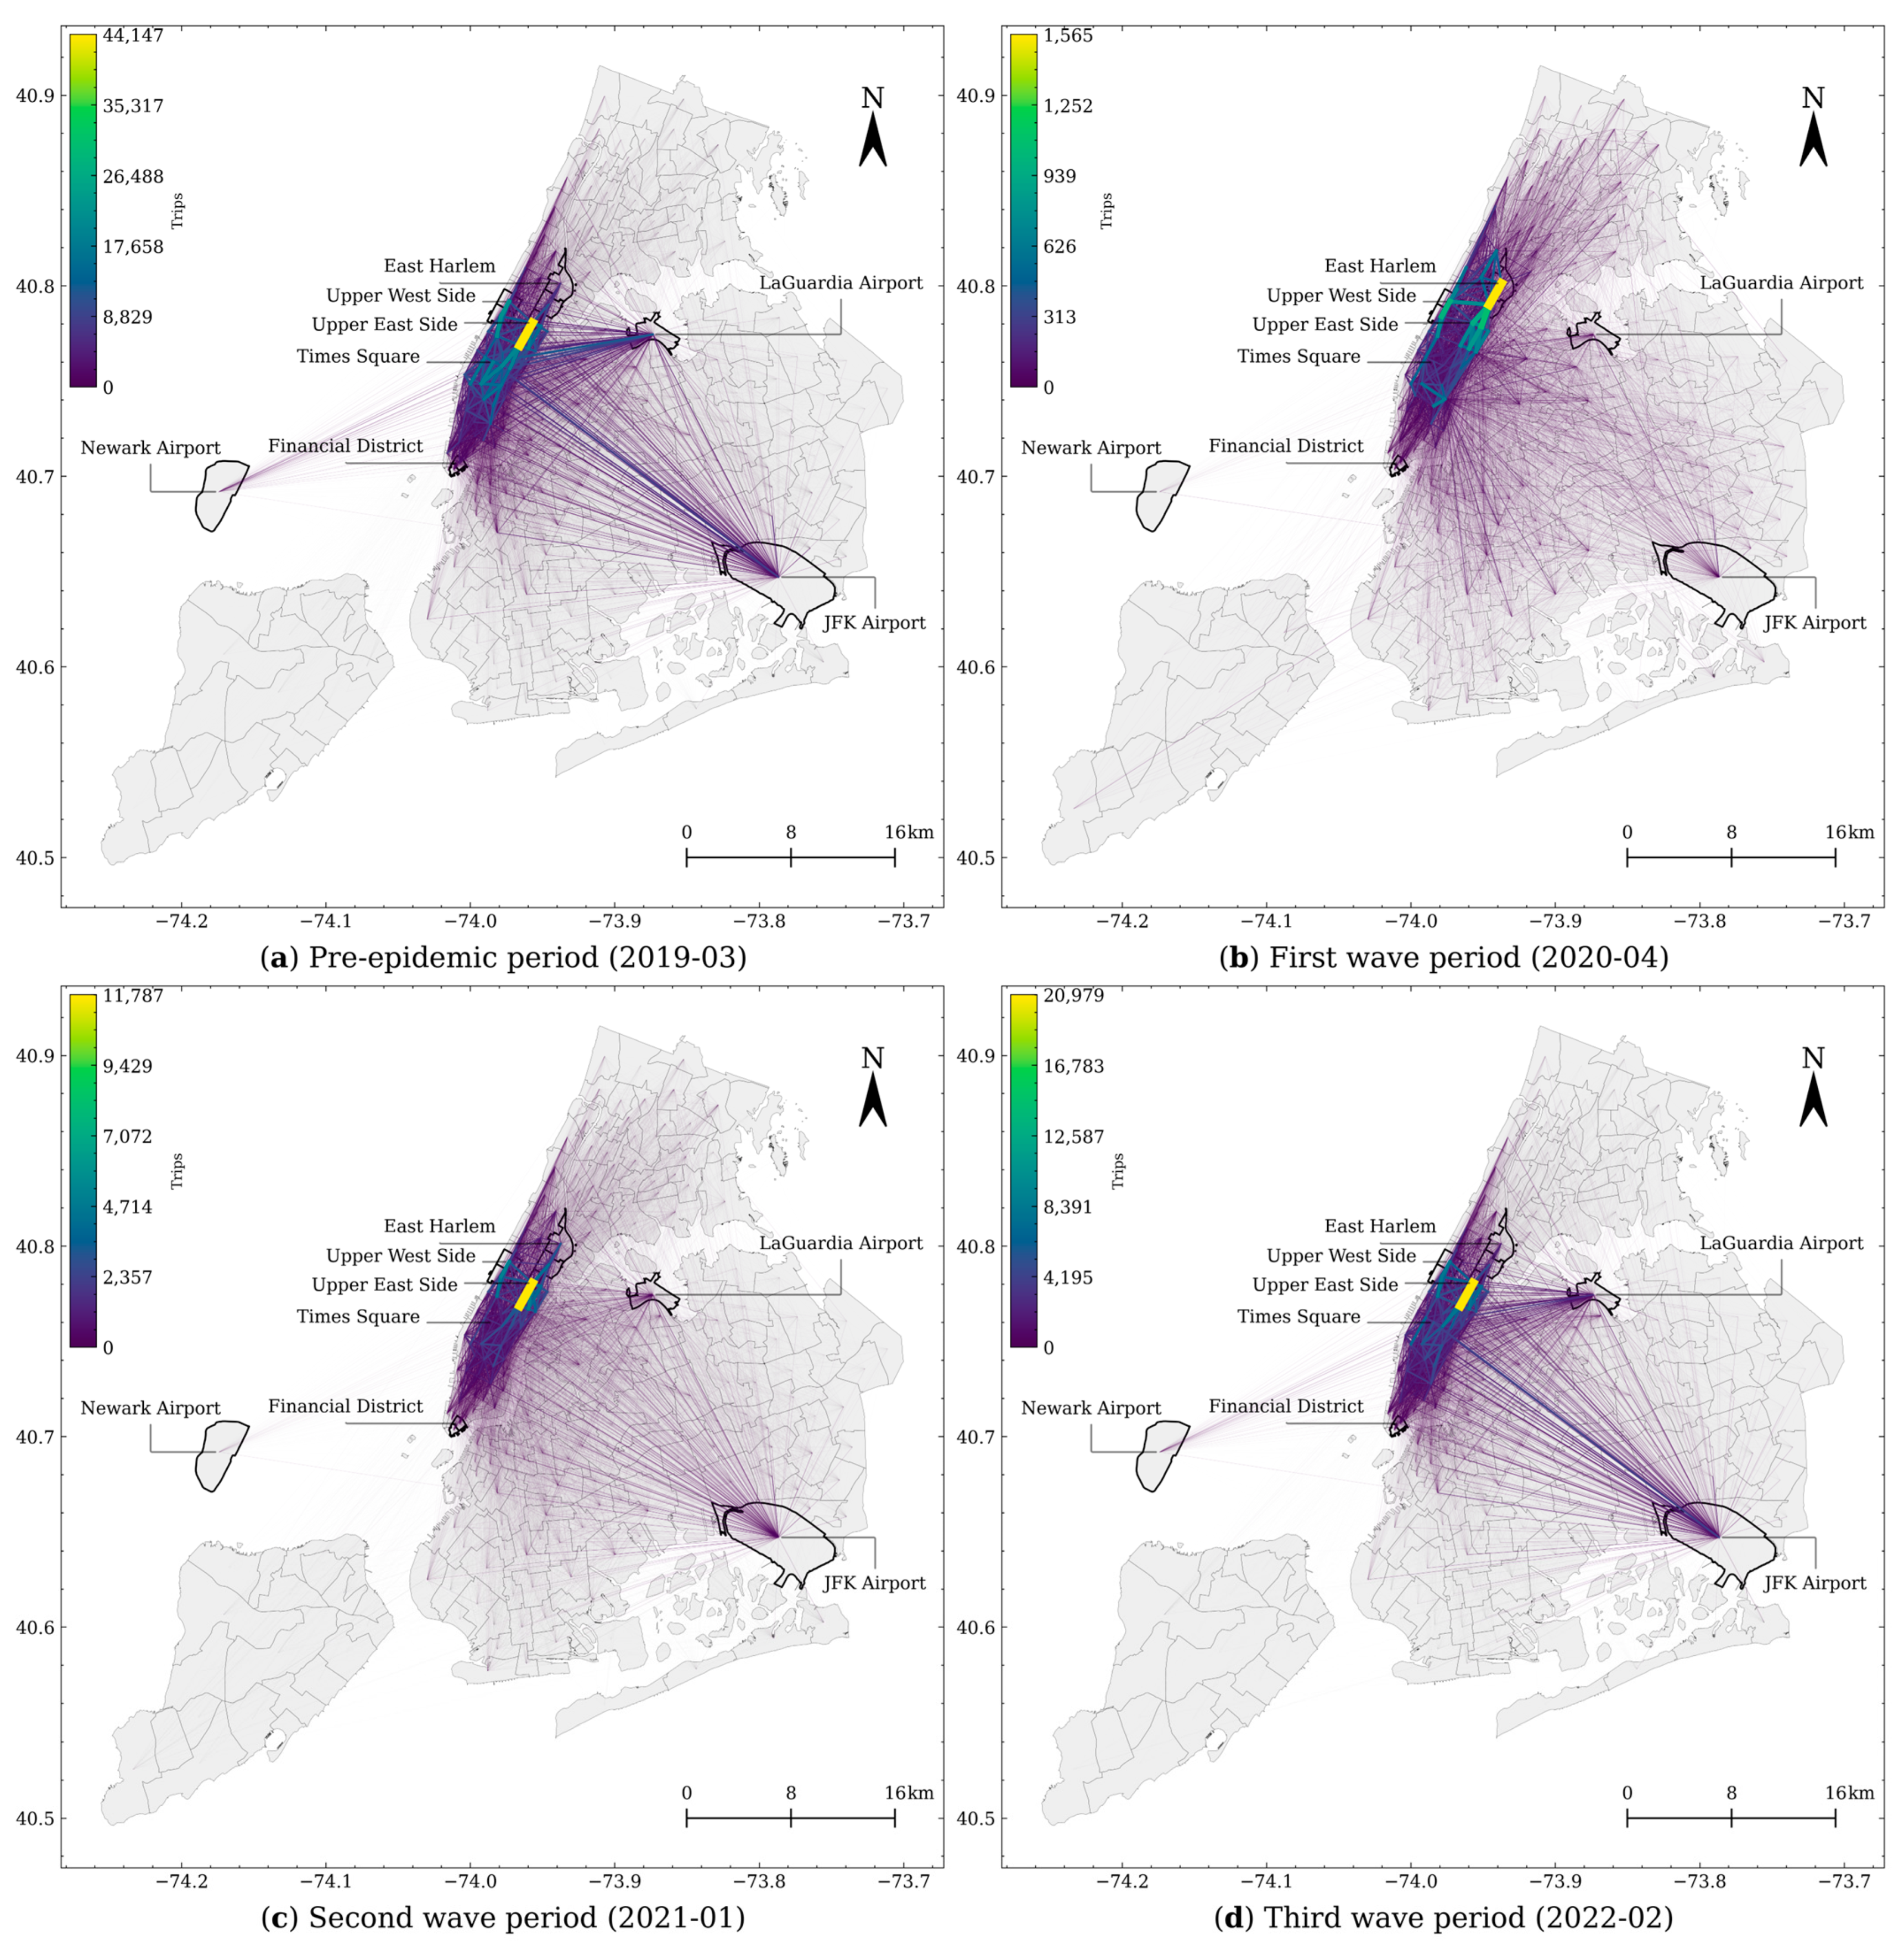
We further compared the three waves of the epidemic with the same period in a normal year, i.e., 2019 (
Figure 9). The 2019 OD distribution clearly showed that the most intensive taxi trips in New York City were concentrated in Manhattan, mostly the Upper East Side, Upper West Side, and Midtown. The Upper East Side was the most frequented area by taxi travel. It is the most affluent neighbourhood in New York City and is where the Museum Mile is located. Additionally, New York City’s three major central airports (JFK Airport, Newark Airport, and LaGuardia Airport) are tightly connected to Manhattan and its surrounding areas, with the strongest connection to Midtown, where Times Square is located.
Following the COVID-19 outbreak, in April 2020, the zone with the most frequented taxi trips was East Harlem. This neighbourhood includes one of the largest predominantly Hispanic communities in New York City. East Harlem has many social problems, such as high crime rates and the highest unemployment rate in New York City. COVID-19 hotspots are strongly associated with living conditions [
21], and housing quality is a strong predictor of living conditions [
22]. This shift in taxi use indicates discrepancies in responses to pandemic restrictions between high-income and low-income residents. The high-income group reduced frequency of travel in the early stages of the outbreak, whereas the low-income group only had a slight reduction in travel. Furthermore, the Financial District (including Wall Street) became sparsely populated, as restrictions to stay home were implemented. Post-epidemic restrictions and reduced willingness to travel have greatly influenced the tourism industry. Even Times Square (New York’s famous tourist attraction) had a sharp drop in travel and was no longer a taxi destination.
After the first wave of the epidemic slowed down, the taxi trip patterns began to return to pre-epidemic levels. In July 2020, as the reopening plan began, the most frequent taxi destinations reverted to the Upper East Side, with East Harlem gradually dropping in the rankings. After the second wave of the epidemic slowed down and restrictions were eased, the number of people travelling to and from airports began to increase significantly, and Midtown (containing Times Square) was reinstated as a destination of people from all three airports.
During the third wave of the epidemic, travel patterns continued to return to normal (before the epidemic). The liberal anti-epidemic policies during this period caused taxi travel in New York City to be almost identical to that in the pre-outbreak period (February 2022) after the third wave of the epidemic had subsided.
5. Discussion
This study found that the COVID-19 epidemic in New York City had three waves of large-scale outbreaks over the study period. The COVID-19 epidemic data we used were collected from March 2020 to March 2022, and the taxi trajectory data were obtained from January 2019 to March 2022. We explored the changes in taxi trips in New York City, as they were affected by the three different waves of the epidemic. Our analysis over a long-time scale used both time series and correlation analyses. What do our results mean for the sustainability of the city and society?
This study has several contributions. First, we identified a significant negative correlation between the number of confirmed cases and taxi trips during the three waves of the COVID-19 epidemic in New York. The synergistic impact of the three epidemic waves and the different levels of anti-epidemic policies on taxi trips varied significantly. The number of trips decreased sharply as the number of cases increased in the first wave and the epidemic infection rate increased, and remained low after the epidemic eased. This may be attributed to the strict travel restriction policies, a common scenario in many cities worldwide. At the beginning of the second wave, travel fluctuated significantly and declined slightly as the number of COVID-19 cases increased. This wave combined with a relaxation in anti-epidemic restrictions (including freedom to travel). With a reduction in the number of new confirmed cases, taxi travel increased, suggesting that in similar circumstances, a more relaxed epidemic policy would facilitate a rapid recovery in travel in New York, which aligns with the findings from many cities worldwide, including in China, which had implemented strict epidemic prevention measures [
7]. In New York, the number of confirmed cases in the third wave of the epidemic increased rapidly (almost six times the previous rates), and taxi trips were reduced to nearly half the normal rate but gradually increased after the infection peak. However, compared with the second wave, the third wave involved no restrictions on travel, and the minimum number of taxi trips remained twice as high as the minimum number in the second wave. This may be attributed to weakened perception of the epidemic risk, thus bolstering a greater willingness among people to travel. During the third wave, travel increased, despite the infection rate increased sharply, thereby suggesting that the impact of the pandemic on travel was gradually diminishing. This suggests that the combination of the pandemic and epidemic prevention and control measures has affected people’s willingness to travel. Each outbreak, combined with epidemic prevention policies, reduced traffic, and easing epidemic restrictions caused a rebound in taxi travel. The number of trips recovered quickly when the epidemic prevention policies became more relaxed, which may have contributed to increasing daily infection rates which were observed in many cities in the US [
23] and Europe [
4].
Second, the pandemic affected daily travel time patterns. Compared to the pre-epidemic period, during the first and second waves of the epidemic, weekday morning and evening peaks disappeared. The epidemic also caused a significant reduction in evening trips. Weekend night and early morning trips also fell sharply, with a change in nightlife travel habits. During the third wave of the epidemic, the weekday morning peak gradually recovered, and the evening peak significantly recovered. There was also a significant increase in the number of weekend trips, evenings, and nightlife travel peaks. This suggests that weekday travel and weekend leisure travel began to return to normal after epidemic restrictions. This observation is broadly similar in cities around the world where anti-epidemic policies were eased [
8,
13].
Third, the pandemic affected daily-travel spatial patterns. Spatial clustering analysis revealed the main travel destinations during the pandemic. Travel for leisure destinations (such as parks) decreased sharply in the early stages of the epidemic, owing to prevention policies, such as safe distancing. As the epidemic weakened, leisure travel recovered rapidly. The changes in spatial clustering patterns at the two airports suggest a decreased demand for long-distance travel, with the demand for taxi travel to the airports declining sharply but gradually recovering with the easing of epidemic restrictions. The changes clearly indicate that the epidemic profoundly altered the spatial pattern of taxi trips in New York City, thereby reflecting significant changes in taxi trip spatial patterns due to strict restriction policies. However, these changes were not long-lasting: as the epidemic continued and anti-epidemic restrictions were eased, trip spatial distributions almost returned to pre-epidemic patterns.
Fourth, changes in travel time and space during the pandemic suggest that different sectors and groups reacted differently to the pandemic. The changes in travel hotspots reflected socioeconomic variations in response to the pandemic, with lower-income earners taking greater risks than higher-income earners. Wall Street became less crowded, but the industry recovered quickly. Conversely, the reduction in footfall on Times Square reflects the impact of epidemic restrictions on local business and tourism, which gradually recovered after anti-epidemic restrictions were eased.
6. Conclusions
This study provides innovative perspectives on the recovery of a large city affected by the pandemic. Exploring the spatio–temporal characteristics of taxi trajectories during the three different waves of the COVID-19 epidemic in New York City enabled us to quantify the spatio–temporal changes in the number of taxi trips, destination clustering, and origin and destination points impacted by the epidemic. We discussed the combined impact of anti-epidemic policies with taxi data. In the early stage of the epidemic, people’s willingness to travel was relatively low because of the dual influence of the epidemic and anti-epidemic restrictions, with taxi journeys dropping by 95.3%. As the epidemic eased, travel was more influenced by an easing of the anti-epidemic travel restrictions, which had discouraged people to travel. This result reveals that the COVID-19 epidemic and anti-epidemic policies had a broad and profound impact on people’s willingness to travel (including the duration and destination). Moreover, it was found that as the epidemic eased, the impact of the epidemic on travel behaviour weakened and gradually recovered. For example, the new Omicron wave did not cause dramatic changes in taxi journeys.
To promote the sustainability of a society, we should focus on resolving the contradiction between the willingness to travel freely and epidemic prevention and control measures. Anti-epidemic restrictions and the epidemic itself had a double impact on travel patterns. Moreover, the temporal and spatial distribution of people’s willingness to travel changed significantly, with long-distance travel reducing significantly after the epidemic. Additionally, there were socioeconomic inequalities leading to different responses to the risk of infection among different citizens.
We propose the following recommendations from our research. First, scientific prevention and control of the epidemic should be adhered to, ensuring safety with adequate restrictions in public spaces. Society should consistently adopt effective scientific epidemic prevention and control measures, such as health QR codes and smart city projects [
24], to effectively curb the spread of the epidemic. Second, investment in the health sector should continue (human and material resources) and the public should be vaccinated continually to save more lives. Third, the government should consider subsidising the sectors most affected by catastrophic events (such as the transport sector and people living in hardship) to promote social equity [
25].
Our methodology can be applied to other cities or regions to explore the impact of pandemics. This approach is useful for future researchers to deepen our understanding of urban transport and socio-economic changes in response to pandemics and anti-epidemic policies. This research should promote the balance between sustainable traffic travel patterns and effective anti-epidemic policies.
Author Contributions
Writing—original draft preparation, S.L. and S.B.; visualisation, S.L. and C.Y.; supervision, S.B.; Writing—review and editing, L.Z. All authors have read and agreed to the published version of the manuscript.
Funding
This research was supported by the Key R&D Program of Guangzhou Sci-Tech Project (grant number 202103050001).
Institutional Review Board Statement
Not applicable.
Informed Consent Statement
Informed consent was obtained from all subjects involved in the study.
Data Availability Statement
The data presented in this study are available on request from the corresponding author
Acknowledgments
We would like to extend our sincere gratitude and appreciation to the editors and anonymous reviewers for their comments and suggestions. Also, we devoutly thank Biao Chen for his work about data collection and processing, who is from Center of R&D, Augur Intelligent Technology Co., Ltd.
Conflicts of Interest
The author declares no conflict of interest.
References
- WHO Coronavirus (COVID-19) Dashboard. Available online: https://covid19.who.int (accessed on 1 April 2022).
- Pantano, E.; Pizzi, G.; Scarpi, D.; Dennis, C. Competing during a Pandemic? Retailers’ Ups and Downs during the COVID-19 Outbreak. J. Bus. Res. 2020, 116, 209–213. [Google Scholar] [CrossRef]
- Tan, L.; Ma, C. Choice Behavior of Commuters’ Rail Transit Mode during the COVID-19 Pandemic Based on Logistic Model. J. Traffic Transp. Eng. Engl. Ed. 2021, 8, 186–195. [Google Scholar] [CrossRef]
- Eisenmann, C.; Nobis, C.; Kolarova, V.; Lenz, B.; Winkler, C. Transport Mode Use during the COVID-19 Lockdown Period in Germany: The Car Became More Important, Public Transport Lost Ground. Transp. Policy 2021, 103, 60–67. [Google Scholar] [CrossRef]
- Ferreira, N.; Poco, J.; Vo, H.T.; Freire, J.; Silva, C.T. Visual Exploration of Big Spatio-Temporal Urban Data: A Study of New York City Taxi Trips. IEEE Trans. Vis. Comput. Graph. 2013, 19, 2149–2158. [Google Scholar] [CrossRef]
- Hu, W.; Schweber, N.; Coronavirus Decimates, N.Y.C. Taxi Industry: ‘The Worst It’s Ever Been.’ The New York Times. 25 March 2020. Available online: https://www.nytimes.com/2020/03/25/nyregion/coronavirus-nyc-taxi-drivers.html (accessed on 1 April 2022).
- Yu, J.; Xie, N.; Zhu, J.; Qian, Y.; Zheng, S.; Chen, X. (Michael) Exploring Impacts of COVID-19 on City-Wide Taxi and Ride-Sourcing Markets: Evidence from Ningbo, China. Transp. Policy 2022, 115, 220–238. [Google Scholar] [CrossRef]
- Fernández Pozo, R.; Wilby, M.R.; Vinagre Díaz, J.J.; Rodríguez González, A.B. Data-Driven Analysis of the Impact of COVID-19 on Madrid’s Public Transport during Each Phase of the Pandemic. Cities 2022, 127, 103723. [Google Scholar] [CrossRef]
- Zheng, H.; Zhang, K.; Nie, Y. (Marco) Plunge and Rebound of a Taxi Market through COVID-19 Lockdown: Lessons Learned from Shenzhen, China. Transp. Res. A 2021, 150, 349–366. [Google Scholar] [CrossRef]
- Nian, G.; Peng, B.; Sun, D.; Ma, W.; Peng, B.; Huang, T. Impact of COVID-19 on Urban Mobility during Post-Epidemic Period in Megacities: From the Perspectives of Taxi Travel and Social Vitality. Sustainability 2020, 12, 7954. [Google Scholar] [CrossRef]
- Molloy, J.; Schatzmann, T.; Schoeman, B.; Tchervenkov, C.; Hintermann, B.; Axhausen, K.W. Observed Impacts of the Covid-19 First Wave on Travel Behaviour in Switzerland Based on a Large GPS Panel. Transp. Policy 2021, 104, 43–51. [Google Scholar] [CrossRef]
- Luan, S.; Yang, Q.; Jiang, Z.; Wang, W. Exploring the Impact of COVID-19 on Individual’s Travel Mode Choice in China. Transp. Policy 2021, 106, 271–280. [Google Scholar] [CrossRef]
- Hara, Y.; Yamaguchi, H. Japanese Travel Behavior Trends and Change under COVID-19 State-of-Emergency Declaration: Nationwide Observation by Mobile Phone Location Data. Transp. Res. Interdiscip. Perspect. 2021, 9, 100288. [Google Scholar] [CrossRef] [PubMed]
- Abdullah, M.; Dias, C.; Muley, D.; Shahin, M. Exploring the Impacts of COVID-19 on Travel Behavior and Mode Preferences. Transp. Res. Interdiscip. Perspect. 2020, 8, 100255. [Google Scholar] [CrossRef] [PubMed]
- Abdullah, M.; Ali, N.; Hussain, S.A.; Aslam, A.B.; Javid, M.A. Measuring Changes in Travel Behavior Pattern Due to COVID-19 in a Developing Country: A Case Study of Pakistan. Transp. Policy 2021, 108, 21–33. [Google Scholar] [CrossRef]
- Moran, P.A.P. Notes on continuous stochastic phenomena. Biometrika 1950, 37, 17–23. [Google Scholar] [CrossRef]
- Anselin, L. Local Indicators of Spatial Association—LISA. Geogr. Anal. 1995, 27, 93–115. [Google Scholar] [CrossRef]
- Anselin, L. A Local Indicator of Multivariate Spatial Association: Extending Geary’s c. Geogr. Anal. 2019, 51, 133–150. [Google Scholar] [CrossRef]
- Aral, N.; Bakir, H. Spatiotemporal Analysis of Covid-19 in Turkey. Sustain. Cities Soc. 2022, 76, 103421. [Google Scholar] [CrossRef] [PubMed]
- Barnard, A.; Schweber, N. Cooped-Up Children Lose Refuge as N.Y.C. Playgrounds Are Closed. The New York Times. 1 April 2020. Available online: https://www.nytimes.com/2020/04/01/nyregion/coronavirus-nyc-playgrounds-closed.html (accessed on 1 April 2022).
- Das, A.; Ghosh, S.; Das, K.; Basu, T.; Dutta, I.; Das, M. Living Environment Matters: Unravelling the Spatial Clustering of COVID-19 Hotspots in Kolkata Megacity, India. Sustain. Cities Soc. 2021, 65, 102577. [Google Scholar] [CrossRef]
- Hu, M.; Roberts, J.D.; Azevedo, G.P.; Milner, D. The Role of Built and Social Environmental Factors in Covid-19 Transmission: A Look at America’s Capital City. Sustain. Cities Soc. 2021, 65, 102580. [Google Scholar] [CrossRef]
- Liu, C.; Liu, Z.; Guan, C. The Impacts of the Built Environment on the Incidence Rate of COVID-19: A Case Study of King County, Washington. Sustain. Cities Soc. 2021, 74, 103144. [Google Scholar] [CrossRef]
- Yang, S.; Chong, Z. Smart City Projects against COVID-19: Quantitative Evidence from China. Sustain. Cities Soc. 2021, 70, 102897. [Google Scholar] [CrossRef]
- Gaisie, E.; Oppong-Yeboah, N.Y.; Cobbinah, P.B. Geographies of Infections: Built Environment and COVID-19 Pandemic in Metropolitan Melbourne. Sustain. Cities Soc. 2022, 81, 103838. [Google Scholar] [CrossRef]
| Publisher’s Note: MDPI stays neutral with regard to jurisdictional claims in published maps and institutional affiliations. |
© 2022 by the authors. Licensee MDPI, Basel, Switzerland. This article is an open access article distributed under the terms and conditions of the Creative Commons Attribution (CC BY) license (https://creativecommons.org/licenses/by/4.0/).


