Article

Are There Transit Deserts in Europe? A Study Focusing on Four European Cases through Publicly Available Data

Urban Information Lab, The School of Architecture, The University of Texas at Austin, Austin, TX 78705, USA
*
Author to whom correspondence should be addressed.
Sustainability 2022, 14(20), 13182; https://doi.org/10.3390/su142013182
Submission received: 3 August 2022 / Revised: 1 October 2022 / Accepted: 11 October 2022 / Published: 14 October 2022
(This article belongs to the Collection Transportation Planning and Public Transport)

Abstract

:
Public transit has been proven as an affordable travel method, while the inequitable distribution is a rising concern among practitioners and researchers. A transit desert, based on the demand and supply concept in measuring the mismatch in allocating the level of public transit service, has proved its ability to be applied in cases across countries. According to this concept, this study investigated transit deserts in four cases in Europe. Results indicate that the public transit system in Grand Paris and Madrid are superior due to a smaller population living in areas where public transit cannot meet the demand. Moreover, we noticed that the spatial distributions of transit deserts were significantly different, and the public transit accessibility of green spaces in Greater London and Madrid requires attention. These findings prove the potentials of the transit desert concept in generally evaluating and comparing the performance of different regional public transit systems which can guide the public transit investments by regional/cross-national agencies.

1. Introduction

Public transit has been proven affordable and sustainable and plays a significant role in Europe. According to a report, there are 60 billion passenger journeys annually through public transit [1], and the extensive usage of public transit can benefit traffic efficiency, economy, health, and sustainability [2]. Furthermore, public transit can provide a mobility option for the economically disadvantaged [3]. Given the advantages of public transit, policymakers have dedicated enormous investments in the public transit system during the post-pandemic stage [4].
Although public transit is critical, it is hard to identify the areas needing improvements in public transit services since there lacks a method that can be generally used. Although there is a large variability in the transit equity measurements, most studies are sensitive to empirical cases. Due to the limitations in methodology and data, they pay little attention to building a commonly usable framework to quantify public transit equity from the cross-case perspective [5,6]. For instance, some studies focused on using connectivity to measure transit equity [7,8], while others measured it based on demands [9]. These limitations cause barriers to exploring public transit equity from a macro and holistic perspective [10]. Hence, this research gap is critical in transportation planning since planners without this knowledge could not prioritize the budget for areas with high public transit demand and low public transit supply.
To solve this gap, we considered the transit desert concept in this study. It refers to areas with high transit demand but low transit supply [11]. As a comparative index, the transit desert index is calculated by measuring the transit demand and supply and subtracting the demand from the supply. Transit demand is a measurement of the transit-dependent population, including those who can travel alone but find difficulty in driving alone. The transit supply refers to public transit services covering public transit facilities and accessibility. The transit gap is the difference between transit supply and demand. Positive values of transit gap mean that local public transit services can meet residents’ demands; otherwise, the transit-dependent population is underserved. In general, residents living in transit deserts suffer from low levels of transit services, and these areas should be the priority areas for public transit investments. Moreover, this concept has proven its ability to be applied in cases in different nations [11,12].
Given the potential of the transit desert concept in comparing the performances of public transit and the potential of the transit desert concept, we applied it to provide a regional and comprehensive perspective on public transit equity in four European cases. We explored the relationship between these public transit equities and land use characteristics. This study has two research questions: (1) Where are the transit deserts in Grand Paris, Greater London, Madrid, and Milan? (2) What are the disparities in distribution and land-use characteristics of transit deserts between these regions/cities? By answering both questions, we compared the performances of public transit systems in general. In detail, we investigated the differences in the spatial distribution of transit deserts and pointed out which types of land use that gathered in transit deserts. Findings prove the potentials of the transit desert concept in comparing cases across countries and can be used by regional public transit agencies, such as the Directorate-General for Mobility and Transport. The layout of the remainder of this article is as follows. Section 2 presents a literature review of previous studies and research gaps. Section 3 describes the data, methodology, and analytic framework. Section 4 mentions the results of mapping and analysis of land use, and in Section 5, we discussed our findings and policy implications suggestions, and this study ends with a conclusion.

2. Literature Review

Previous studies regarded public transit equity based on riders’ attributes and connectivity [8,13,14,15,16]. First, as a method of directly collecting user attributes, surveys about riders’ attributes, including cost, frequency, accessibility, safety, and comfortability are commonly used in transit equity studies. For instance, Gao et al. surveyed bus riders and pointed out that passengers’ perceptions can be critical [13]. Li et al. monitored bus riders using a smartphone-based travel survey system. They pointed out that the frequency of public transit service was significant [14]. Second, connectivity was another important dimension in measuring transit equity. Some studies measured the difficulty of traveling through public transit based on publicly available datasets, such as General Transit Feed Specification (TransitFeeds) [8,15,16]. They claimed that the public transit routes, stops, walkability surrounding facilities, and built environment factors should be critical. Both measurements have been used in empirical studies, while they only present one perspective instead of a holistic view, lacking the ability to measure the inequitable distribution and mismatches of service, which should be critical in transit equity [6].
Researchers have applied gap analysis to measure transit equity to fix this limitation [6,11,17,18]. These studies considered the riders’ attributes as a demand measurement and the connectivity as a supply measurement. By calculating the difference between demand and supply, researchers can measure the inequitable distribution of services representing the issues in transit equity. In general, transit demand is defined as the populations who need public transit for traveling, containing children, teenagers, the old generation, and those who cannot access vehicles [17,19]. The transit supply represents the capacity of local public transit and accessibility, measured from criteria including transit facilities, infrastructure, and public transit service [20].
The concept of the transit desert is worth noting in the gap analysis measuring transit equity. It was introduced as the difference between transit supply and demand. According to its initial concept [11], transit supply refers to the z-scored sum of z-scores of four supply density factors, including the number of transit facilities, frequency of transit services, count of transit routes, and length of bike lanes accessing transit services. Transit demand contains teenagers, the population without vehicles, and the non-institutionalized population in multi-family properties. It is presented as the z-scored sum of teenagers, the population without vehicles, and squares of the non-institutionalized population. Then, the difference between transit demand and supply represents the transit gap. Residents who lived in areas with a positive transit gap experienced a higher transit service level and more satisfaction with public transit. Those who lived in areas with a negative transit gap were likely to experience a low public transit level and be underserved with public transit.
Based on the concept, there are studies involving transit deserts applied in U.S. cases. Most of them applied the travel demand from the initial concept while modifying the criteria in transit supply. There is a study applying the transit desert concept in three cases in Texas [21]. The authors kept the measurement of transit demand. They added intersections, sidewalks, and low-speed roads into the criteria of transit supply, resulting in seven-criteria transit supply measurement, which proves the effectiveness of the transit desert concept in comparing cities’ transit equality within the same region. In addition, a previous study investigated transit deserts in 52 major American cities [22]. They divided the frequency of transit service into total trips per day and average trips per hour and added total transit routes and road length to the criteria. Their findings suggested that transit supply gathered in downtown or central business districts (CBDs) of cities while transit demand had a scattered distribution. It can be the first study applying the transit desert concepts across regions. Moreover, a study that applied the transit desert concept through multiple domains is worth noting. Jomehpour and Smith-Colin focused on transit deserts in Dallas [17]. They comprehensively measured transit demand through two domains, socioeconomic factors (e.g., car ownership, emigration status, education, etc.) and mobility need factors (e.g., seniors, youths, the disabled, etc.). For the transit supply, they introduced spatial-temporal factors representing origin-connectivity, destination-connectivity, frequency, flexibility, and reliability. Their findings have proved the robustness of the transit desert framework and its potential for transportation practitioners.
Additionally, the transit desert concept has been applied in other international cases. Cai et al. focused on the transit deserts in Wuhan and added the capacity of transit service based on the seven-criteria measurement [23]. They claimed that transit infrastructure should be critical in modeling transit inequality. Vanderschuren et al. applied the transit desert concept in Cape Town [18]. Based on the seven criteria, they considered the ineligible drivers in transit demand and the impacts of bus rapid transit on the transit supply. Their results were consistent with the findings in U.S. transit deserts in the periphery of the city. Additionally, there was a study in Seoul measuring transit demand as the density of individuals without vehicles and considering land use and other transit modes (e.g., city buses and metro) in transit supply [24].
In terms of these studies, the generalizability of transit deserts in measuring transit inequality is worth noting. Given this advantage, we applied it in European cases to explore whether it can work in European cases, and there are different findings from the cases in other regions. Furthermore, we intended to compare the transit equity in these European cases and concluded practical suggestions such as where the next focal point of transit investment should be and used the seven criteria as the transit supply and residents without vehicles as the transit demand [21,24]. Although there are limitations, this study can contribute to public transit planning from a macro level in Europe. Moreover, this study can advise European researchers to work on cross-countries public transit studies by providing a macro-level method.

3. Materials and Methods
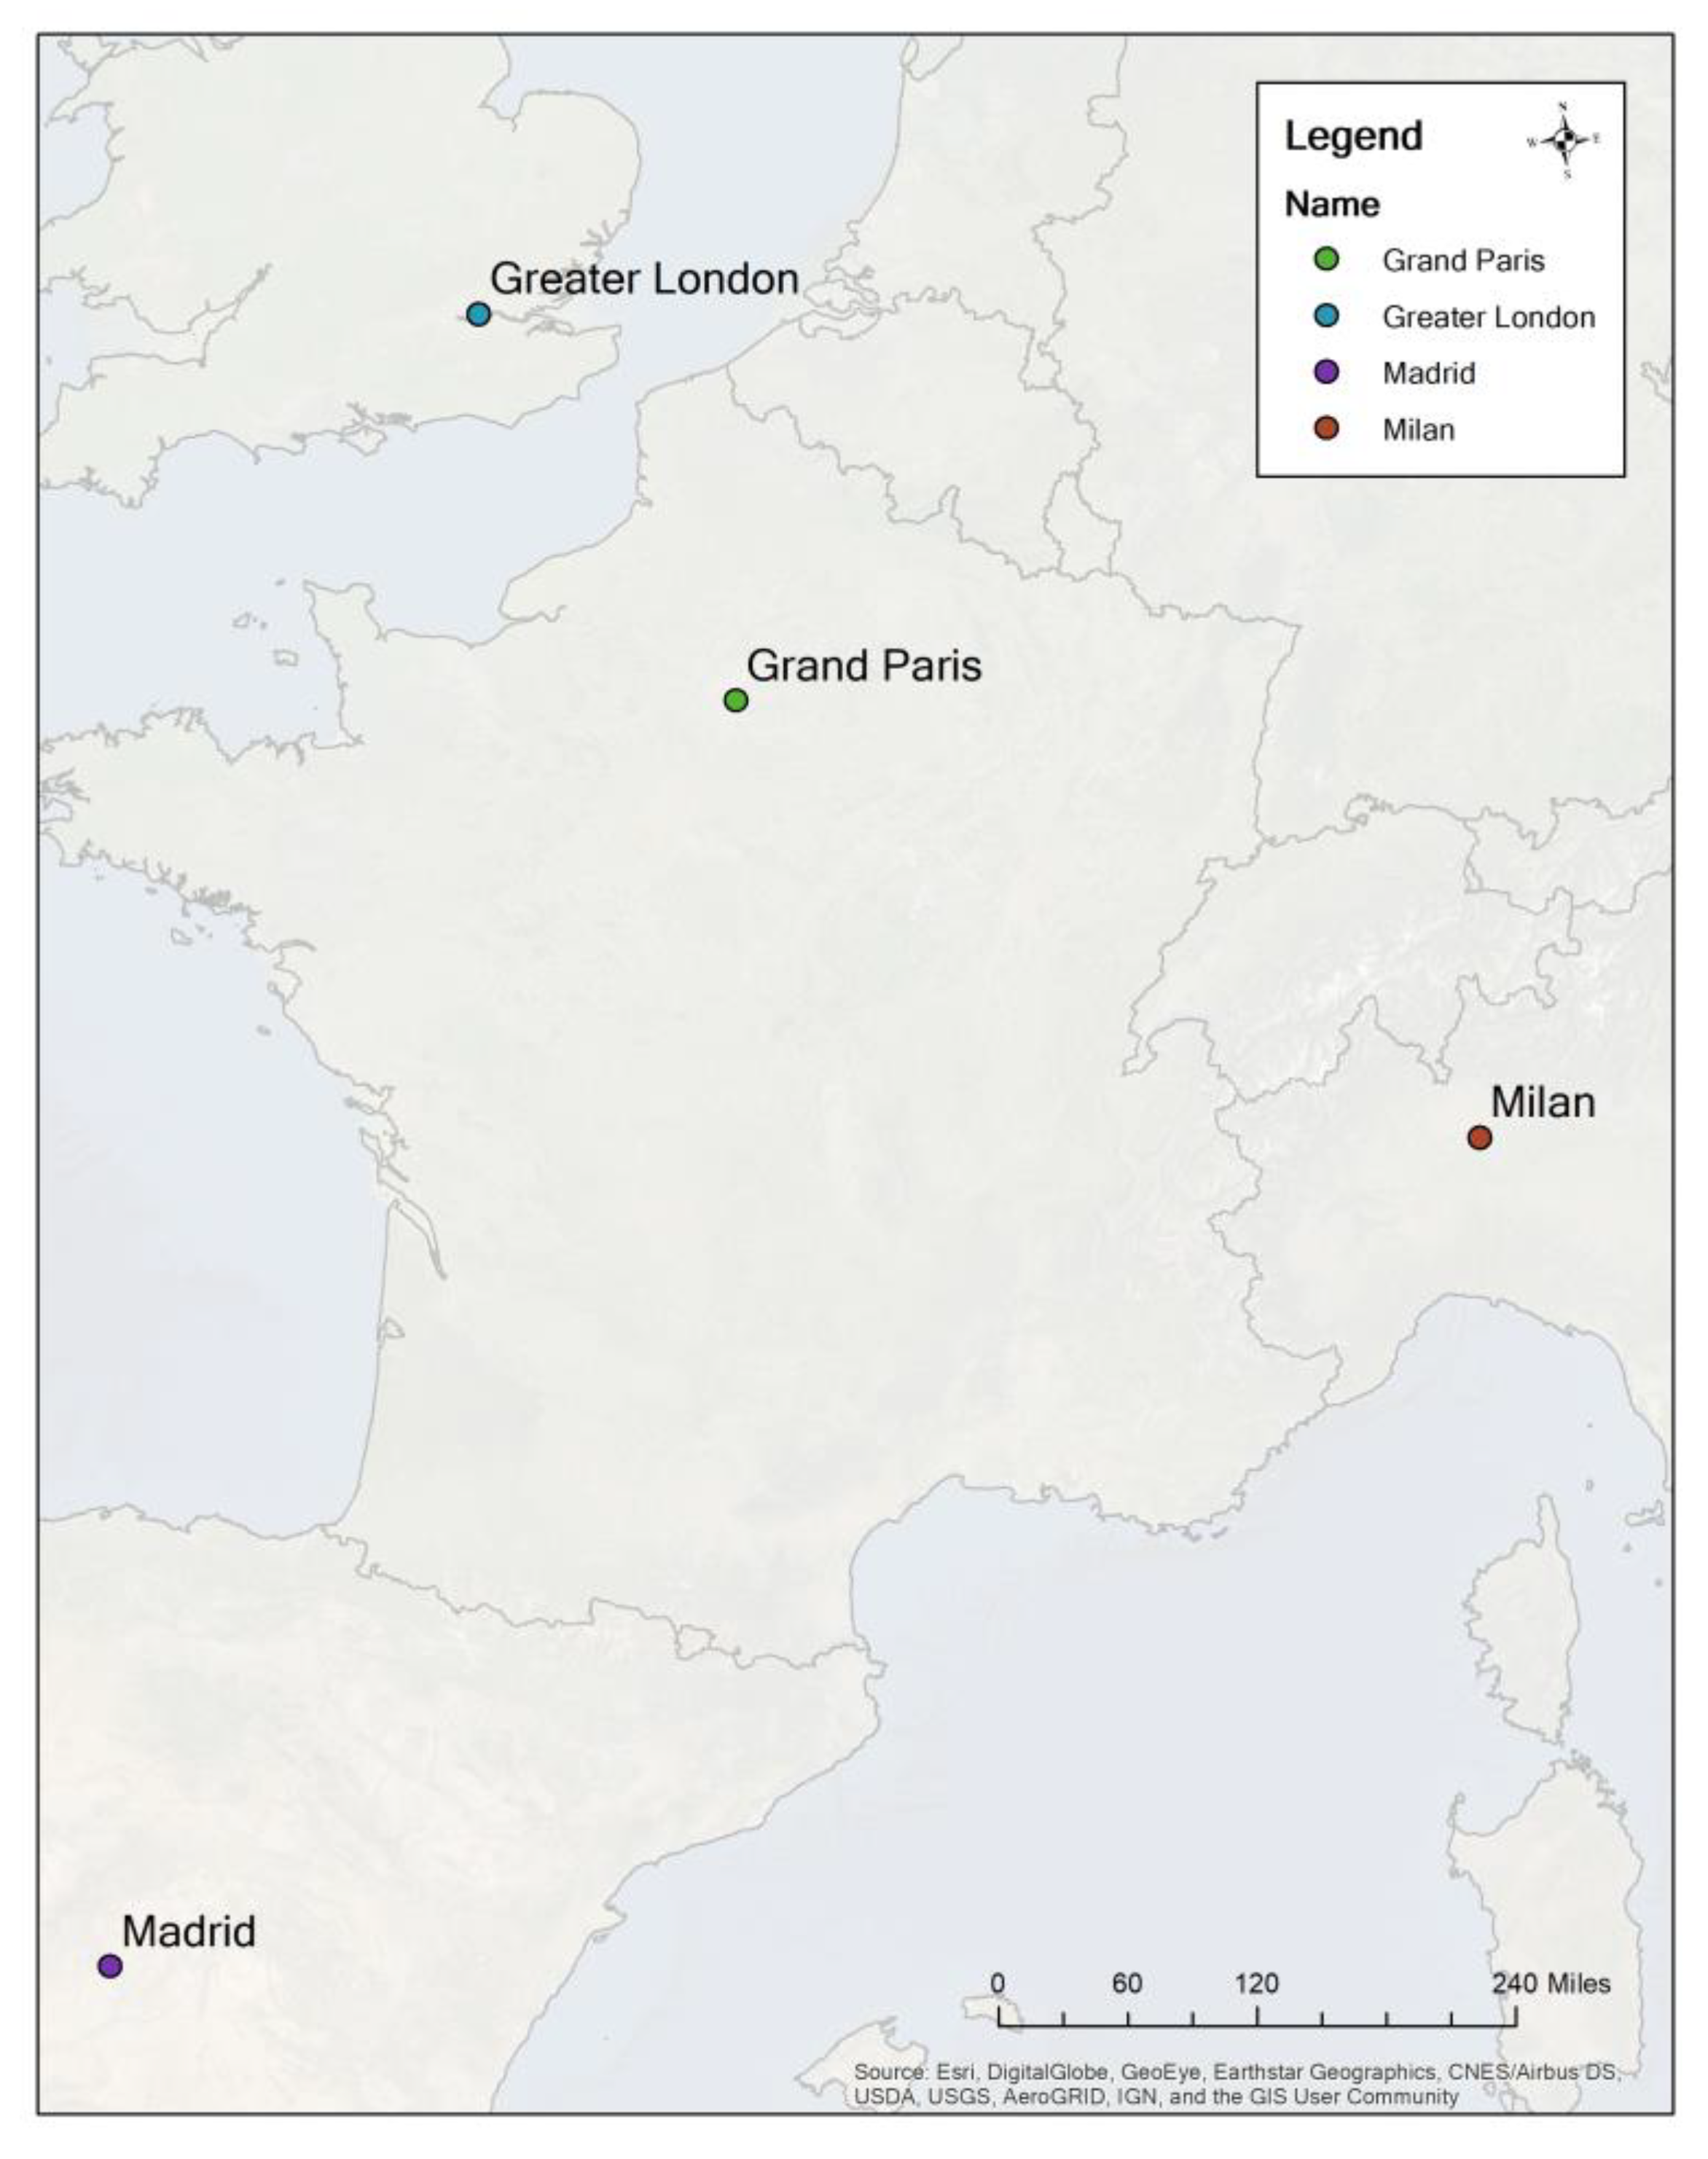
3.1. Study Area

The study areas include Grand Paris, Greater London, Madrid, and Milan (Figure 1). They are the major European political and economic centers with large populations, well-developed transportation systems, and representatives for geographic regions. In detail, we collected data from Grand Paris and Greater London as the representatives of the metropolitan statistical areas (MSAs). Furthermore, there were two, Madrid and Milan, at the city level, as shown in Table 1. The reason for this study design is we want to explore using the transit desert concept at different scales to test its generalizability.

3.2. Data and Measurements

To explore the generalizability of the transit desert concept, we focused on two groups of cases. Data is aggregated into census block group equivalences for Grand Paris and Greater London [25,26]. For the other group, Madrid versus Milan, data was aggregated into census block equivalences [27,28]. All data related to public transit were captured in 2019 to represent the public transit services before the pandemic, and the built environment data were downloaded on 20 July 2020, since it is the earliest historical data we have.
In measuring the transit deserts, first, we modified the transit-dependent population as the residents without access to personal vehicles. To quantify it, we introduced vehicle ownership rates of each region/city and calculated the non-vehicle persons by multiplying the non-vehicle rates and the number of residents referencing a published study [24]. Then, we calculated its density as transit demand. We acknowledged the limitations in the one variable measurement [6,17], but it is the most common variable in the study areas.
The transit supply is measured according to seven criteria shown in Table 2. Each factor is measured as the densities (i.e., per square kilometer) at the spatial units. We captured the facilities data from two publicly available datasets, OpenStreetMap and TransitFeeds. From OpenStreetMap [29], and we calculated the length of footways, living streets, residential streets, and pedestrian lanes as the sidewalk and intersections. The bike routes contain cycleways, residential streets, and tertiary roads as the sidewalks. We defined low-speed limit roads as roads with less than 50 km per hour (around 31.06 miles per hour). Intersections were based on intersections of a primary road, secondary road, motorway, sidewalk, and bike routes. We captured the number of public transit facilities, bus routes, and frequency (i.e., the total number of transit services) from the OpenMobilityData [30]. Notably, it provided a poor quality of TransitFeeds data in Greater London, so we collected the data from Transport of London as the alternative [31]. Furthermore, we considered the equal shares of the seven criteria according to the previous studies but acknowledged the limitations in this measure.
Additionally, we introduced land-use factors to investigate the distribution of transit deserts among land-use characteristics to answer the second research question. There are four land-use factors in this study based on the OpenStreetMap data. The commercial and retail include commercial areas and retail areas. Green spaces and recreational areas include forests, grass, park, and recreational ground. In addition, industrial areas and residential areas are based on the basic definitions [29].

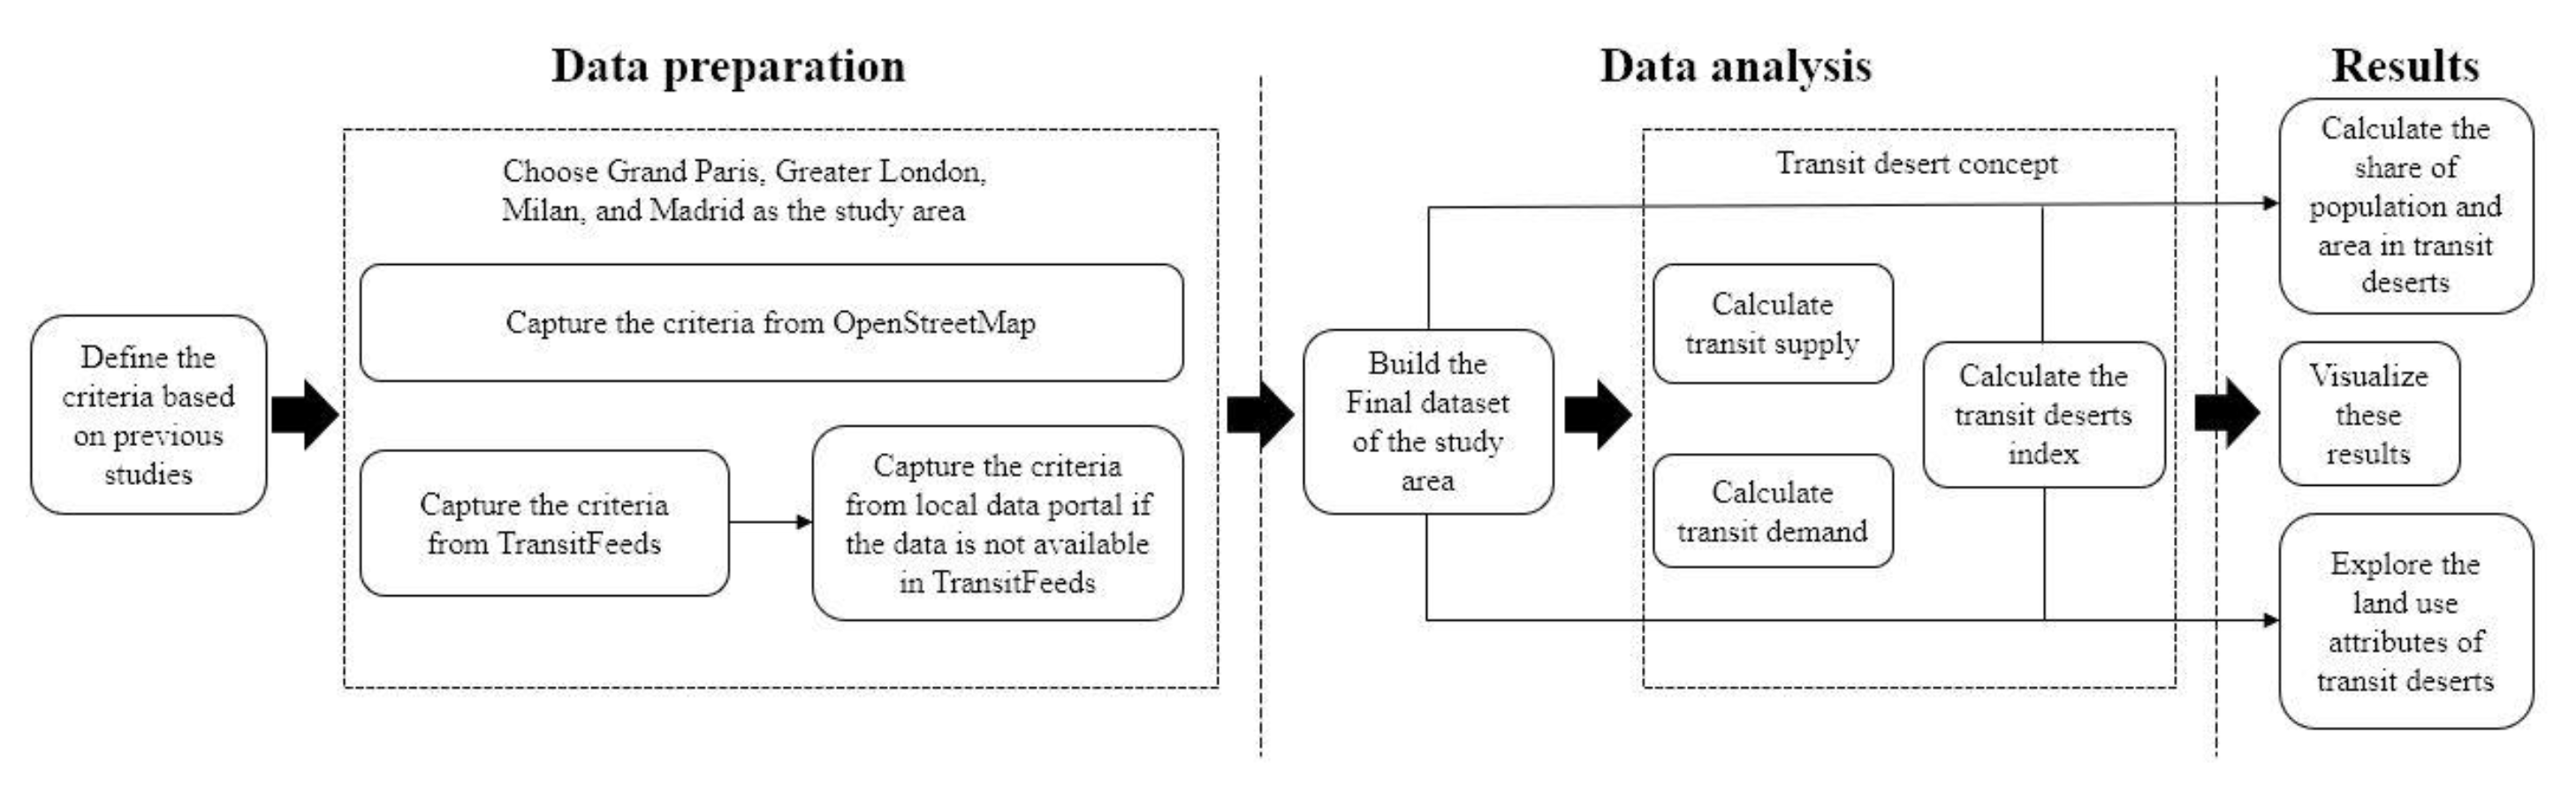
3.3. Analytic Framework

Figure 2 presents the workflow, and we processed data preparation, modeling, and visualizations in RStudio 2022.02.3, Excel by Microsoft, and ArcMap 10.8.1 by Esri. In detail, first, we downloaded and cleaned the data. Then, to transfer TransitFeeds data to shapefiles, we applied the TransitFeeds data to the Network Dataset Transit Sources function. If the data is not available, we turned to the data portal by local transportation authorities to capture related information. The final step of data collection is that we dropped those observations where population density is lower than 100 people per square mile in four cases.
After the data preparation, we applied z-scores to standardize transit demand and supply. There are three indexes calculated in this study: transit supply, transit demand, and transit deserts. As shown in Equation (1), in measuring the final transit supply, we first standardized the spatial density of seven criteria for transit supply and summed the standardized values. Then, we standardized the sum as the final transit supply scores. As shown in Equation (2), the z-scored transit-dependent population density was the final transit demand. The transit deserts index (Equation (3)) is the difference between final transit demand and supply scores. If the transit desert index is negative, the transit supply cannot satisfy the transit demand. The areas with negative indexes are transit deserts, and residents who live in transit deserts may face difficulties traveling by public transit [21].
Transit   supply   =   zscored zscored ( supply   factor   density i )
Transit   demand   =   zscored density   of   residents   without   vehicle
Transit   desert   index   =   Transit   supply Transit   demand
In the results, we defined the transit deserts in the study area and calculated the portion of transit deserts among regions/cities. Moreover, we compared the transit desert indexes among land-use factors to investigate the disparities in transit deserts among land-use characteristics. The portions of transit deserts across the four land-use factors were measured. At last, we visualized and summarized these results in the following section.

4. Results

4.1. Comparison between Areas and Population in Transit Deserts

Table 3 demonstrates the portions of area and population in transit deserts by regions/cities. This table also introduces the observations of four cases in this study. Before summarizing the results, we acknowledge the differences between these observations. The observations in both metropolitan-level cases are census tract level equivalence, while those in city-level cases are the census block group level (Madrid) and block level (Milan) equivalence. Although there are differences, it should be noted that these can affect the resolution of visualization while not significantly affecting the results.
First, focusing on the metropolitan-level cases, both portions of areas and the transit-dependent population in transit deserts in Greater London (58.8%, 54.5%) are larger than in Grand Paris (40.6%, 48.1%). This indicates that the inequitable distribution of public transit services in Greater London could be severe, which is consistent with research published before the pandemic [31,32]. Moreover, in the city-level group, the portion of areas such as transit deserts in Milan (33.0%) is lower than in Madrid (48.3%). In comparison, its portion of the transit-dependent population is larger (61.9% vs. 45.1%). This result indicates that the inequitable distribution in Madrid can be more critical, while the affected population in Milan should be much larger. Finally, we acknowledge the inappropriate cross-comparison between groups. Still, we observed that the portion of the transit-dependent population in Milan is significantly higher than in the other three cases, which can be evidence that the public transit distribution in this city requires attention [33].

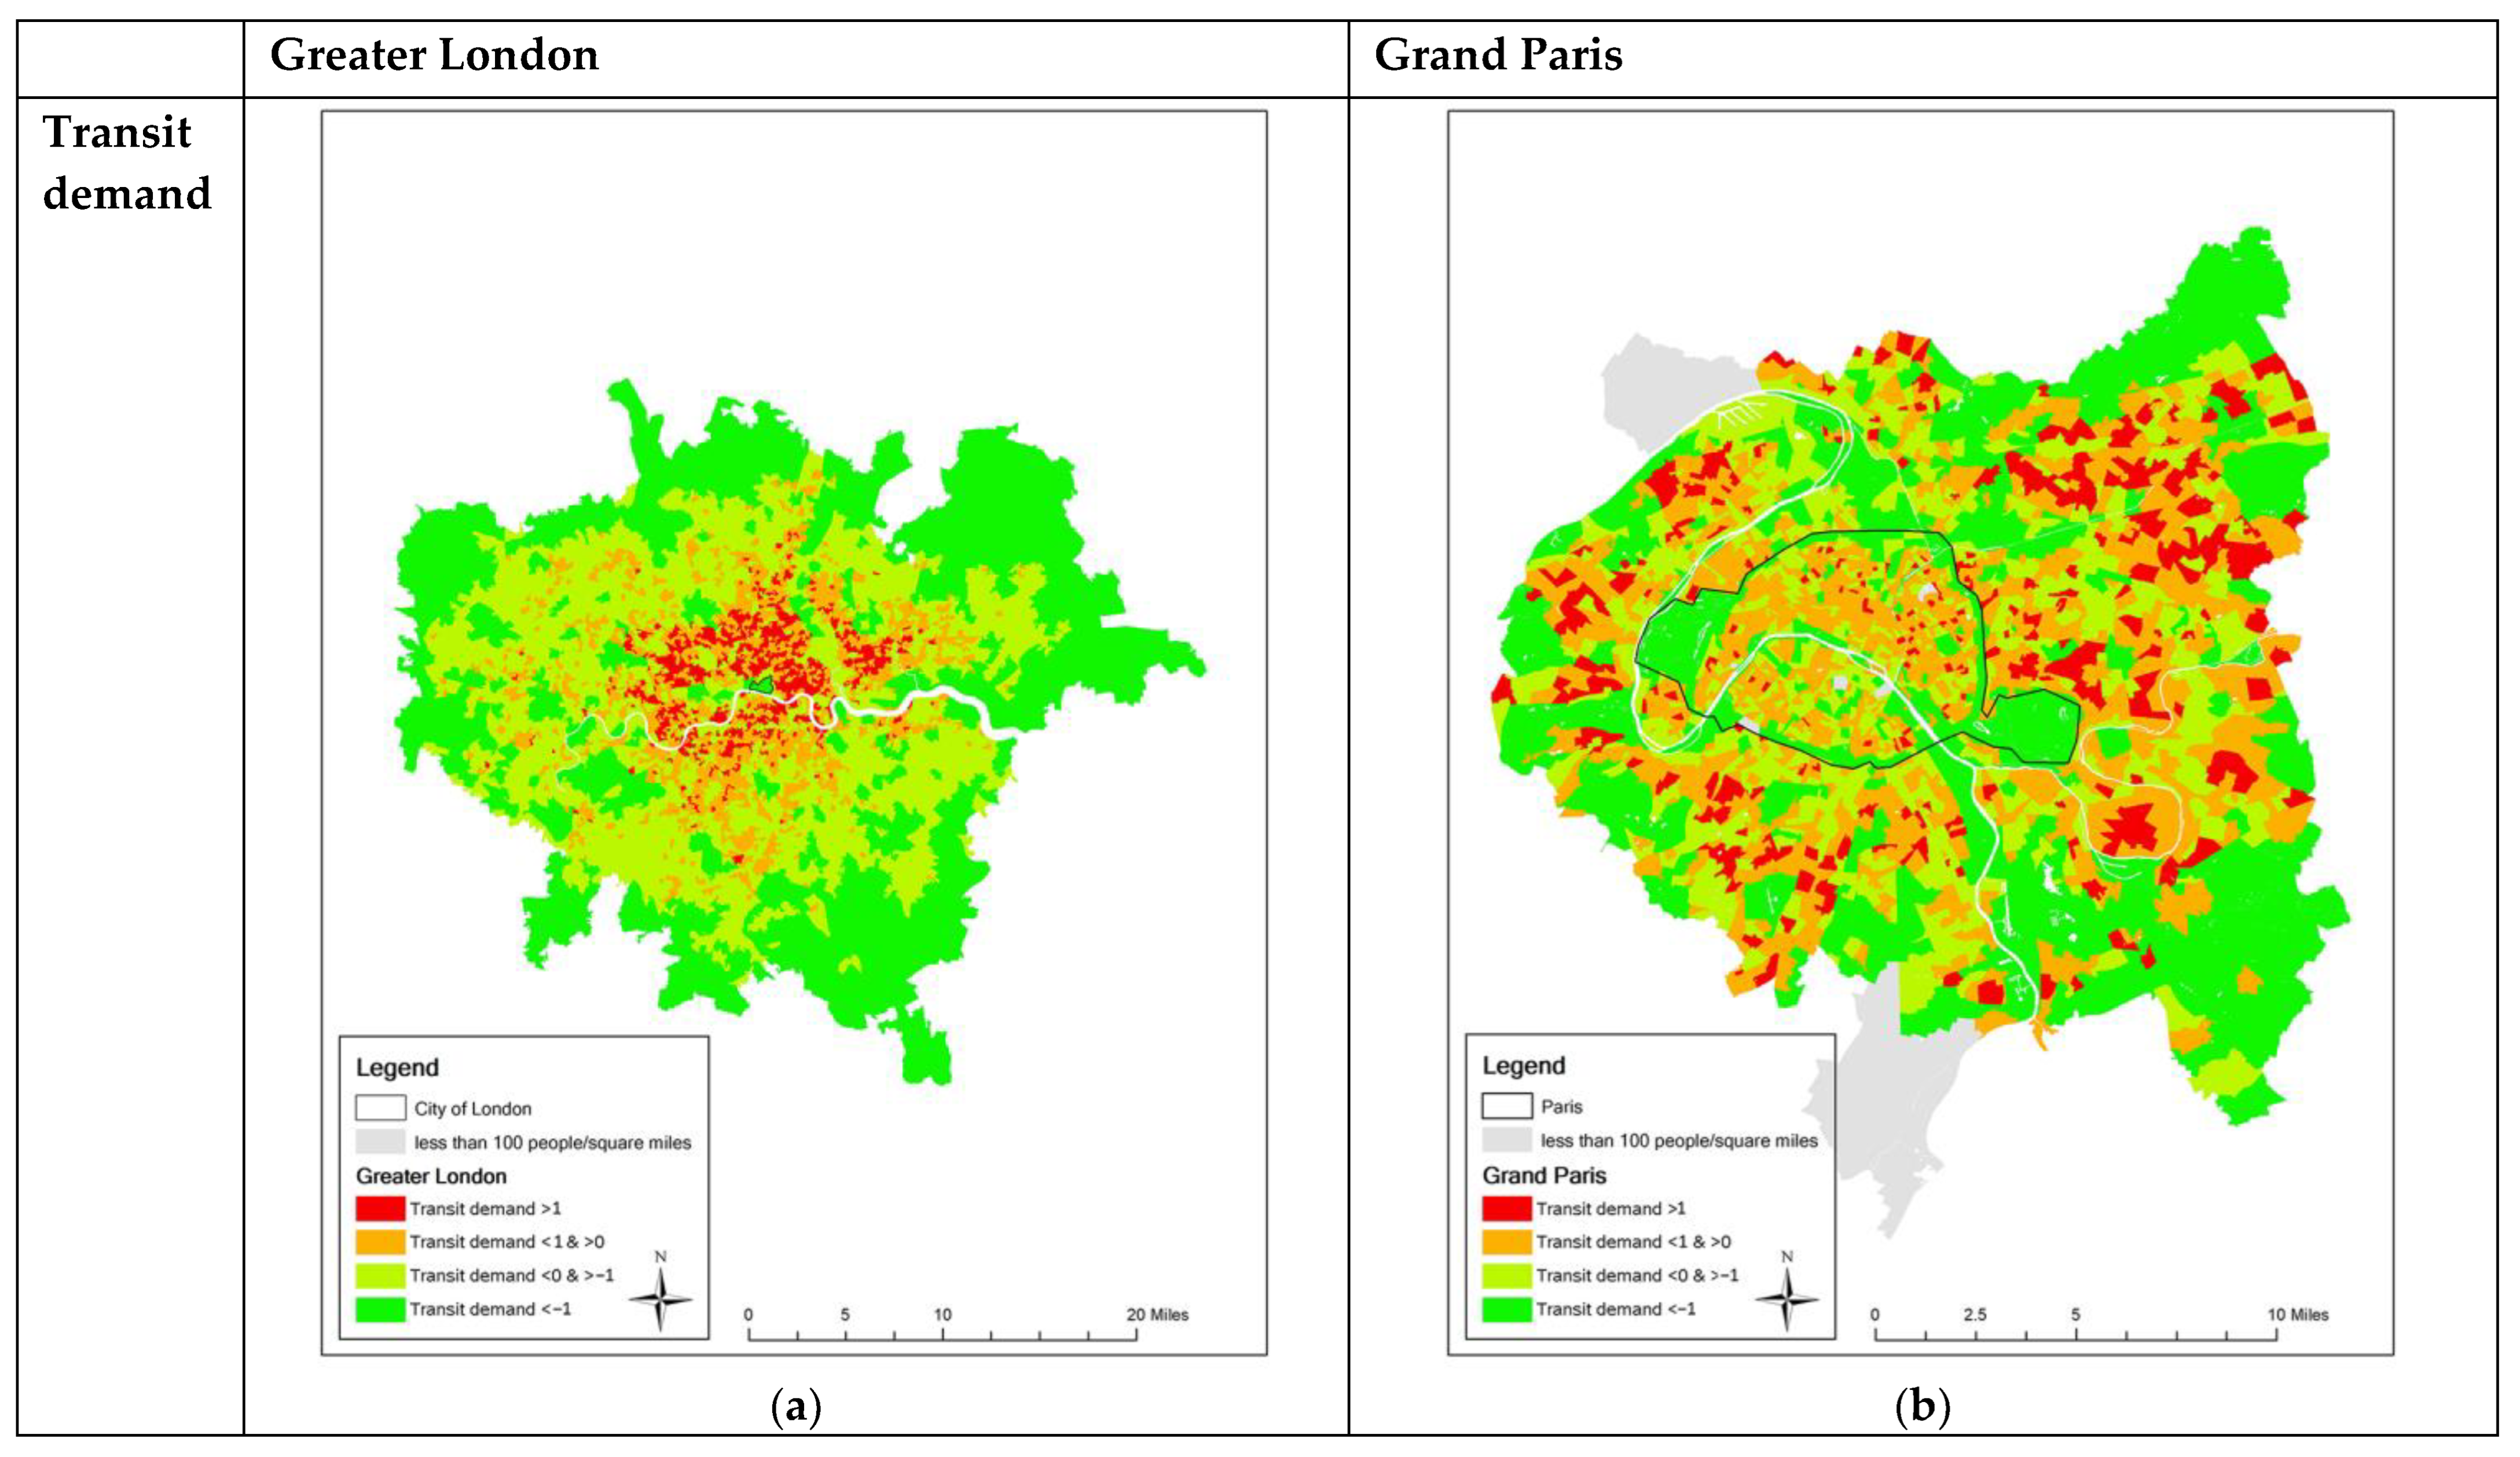
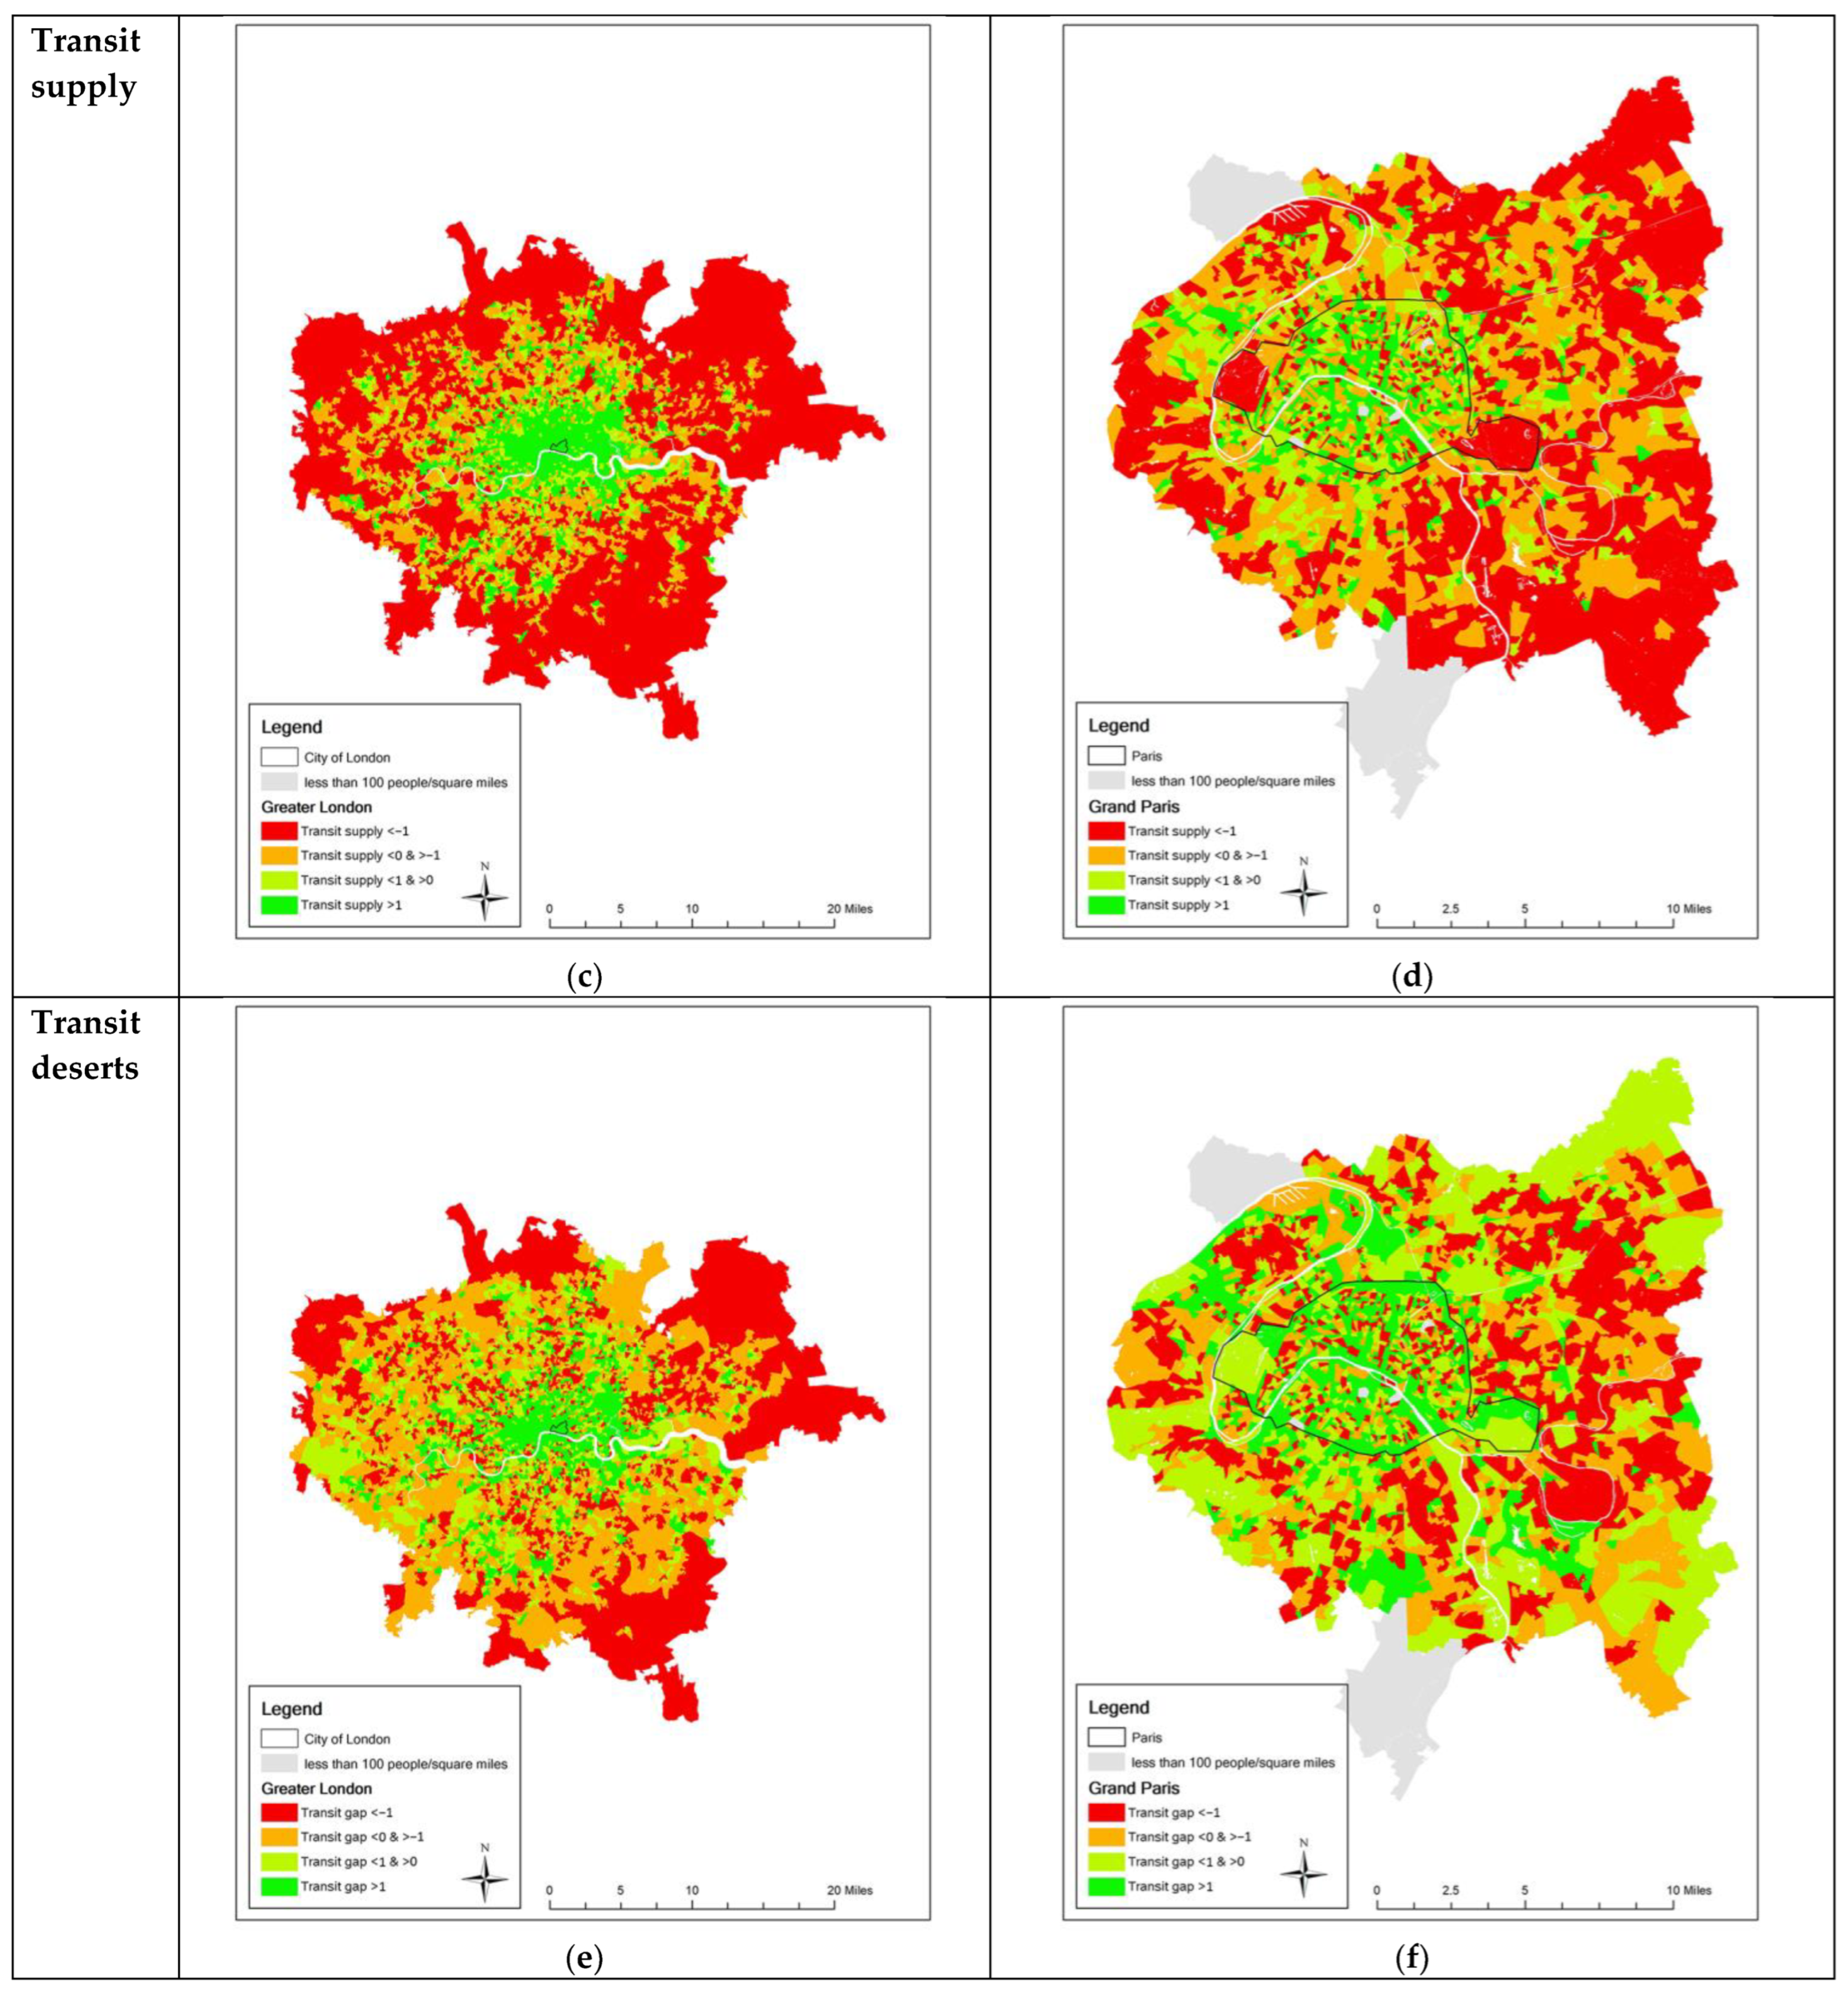
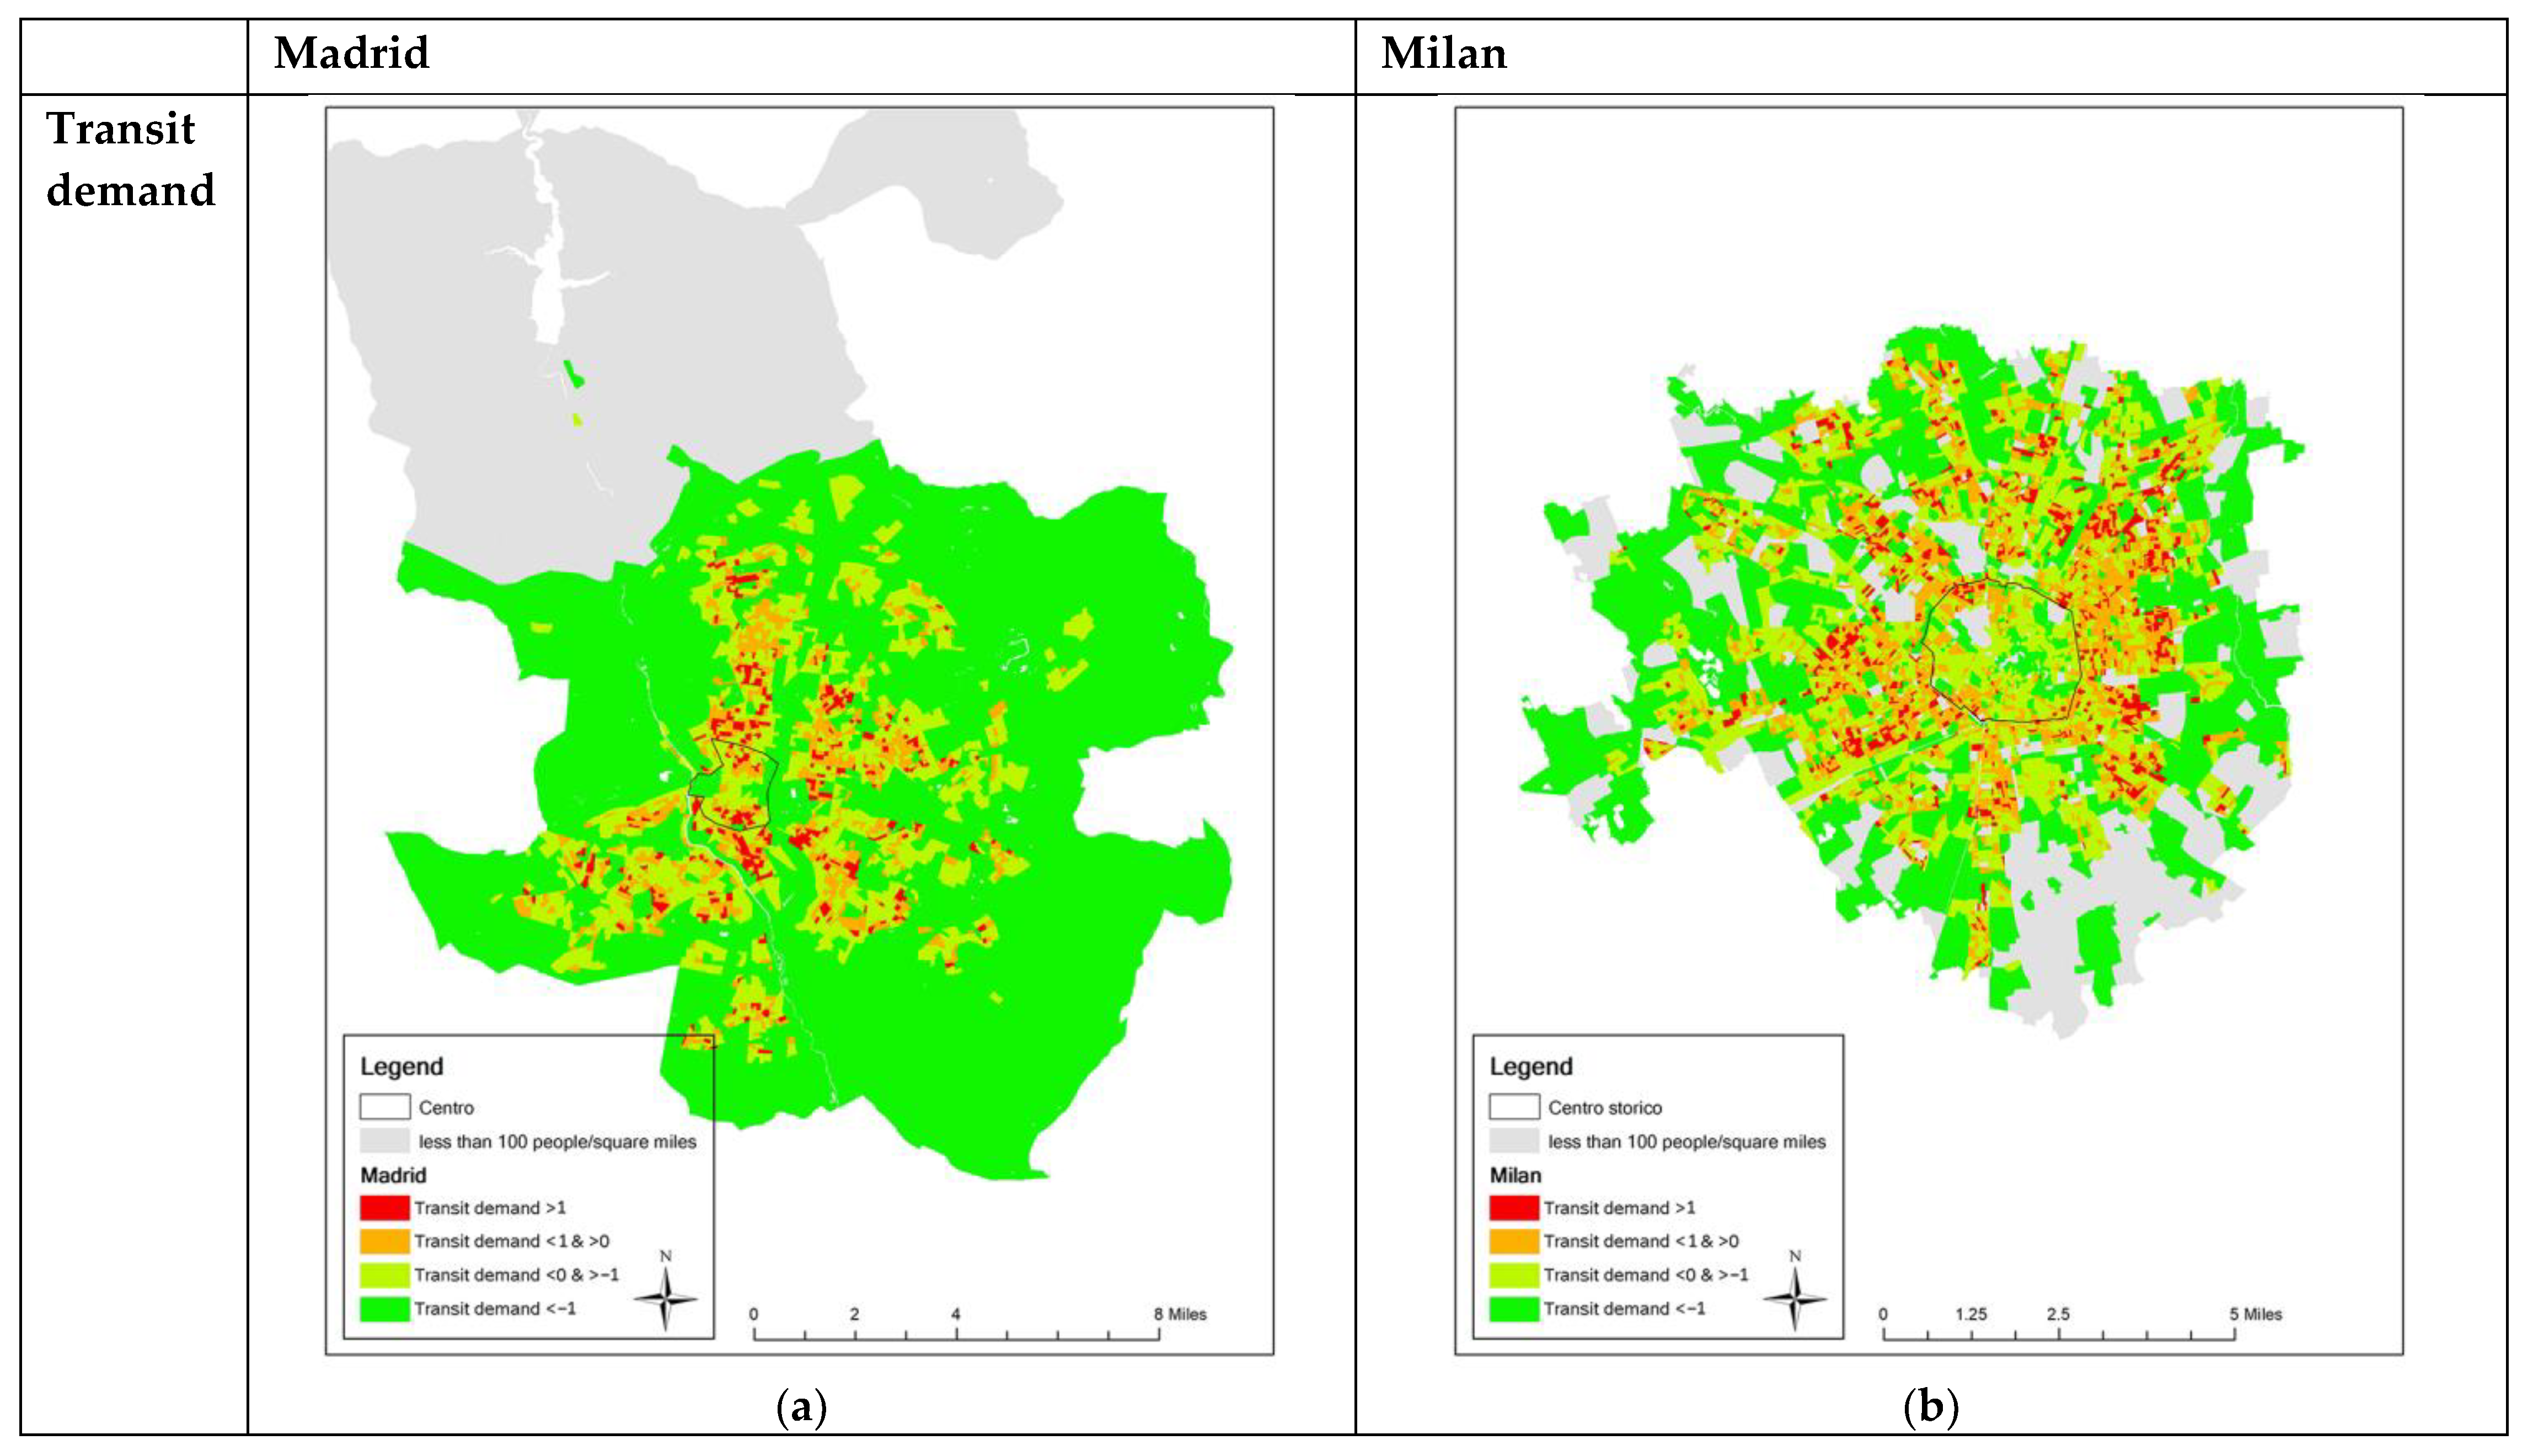
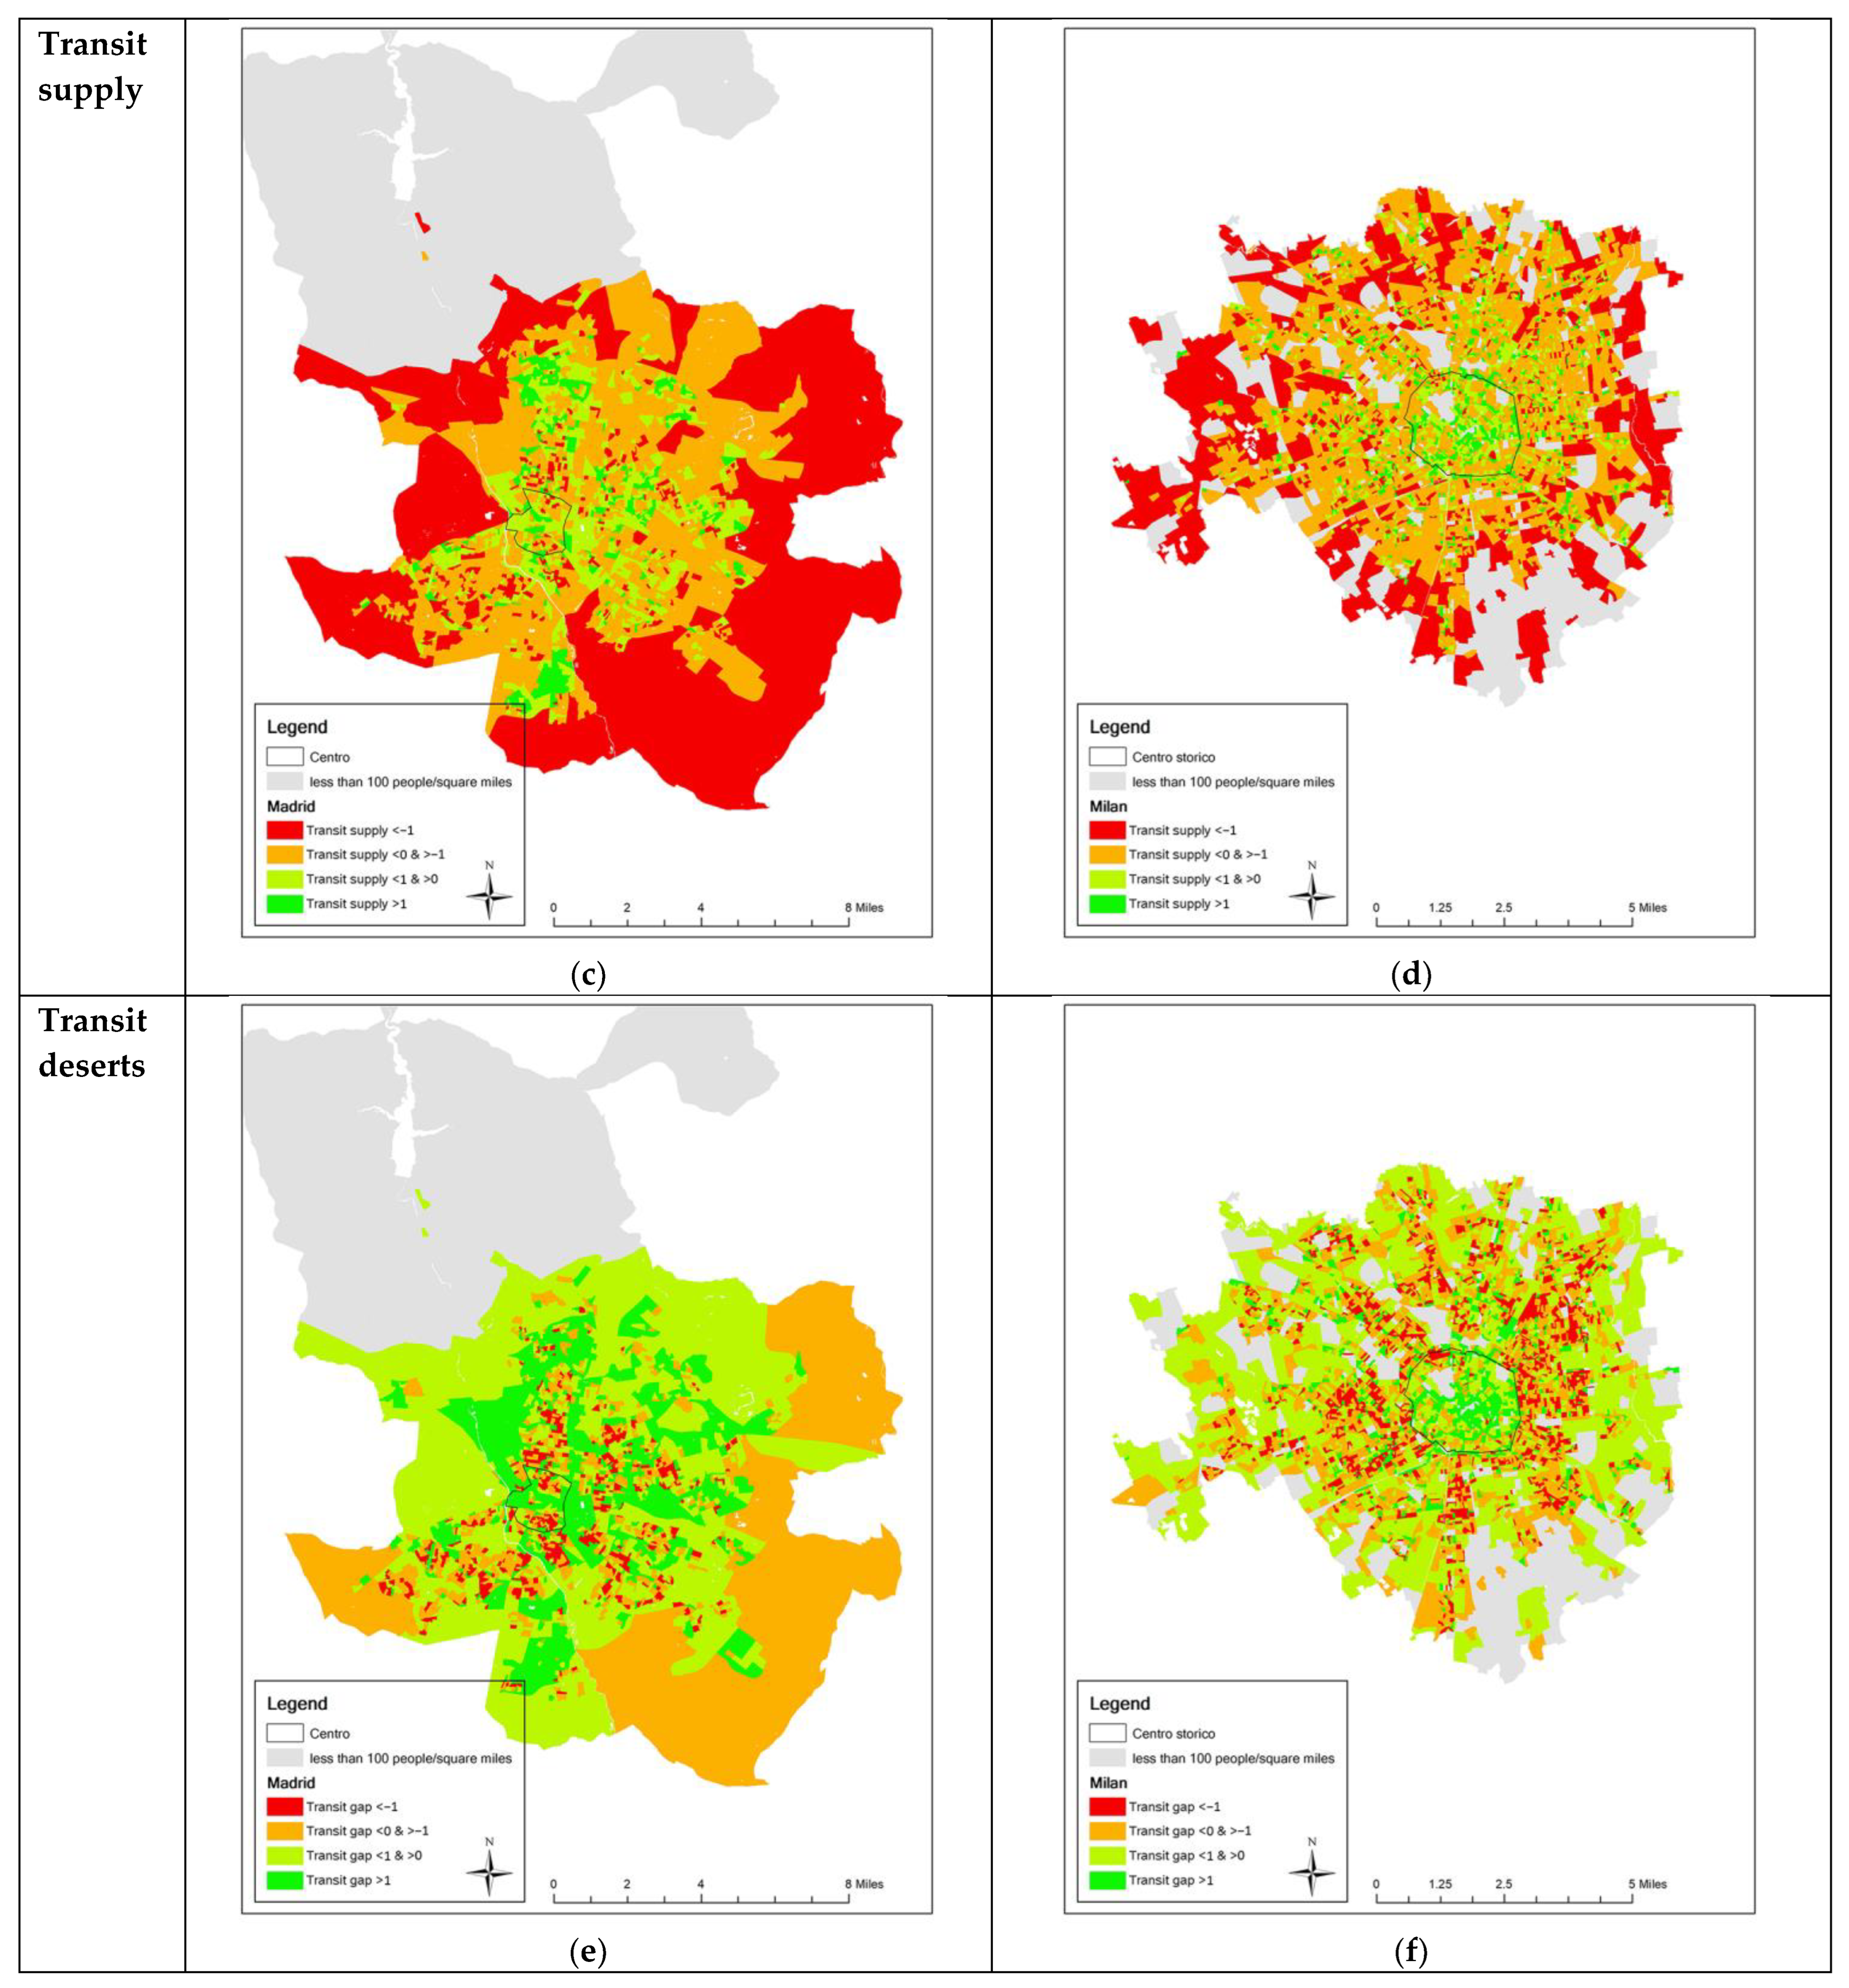
4.2. Comparison between Spatial Distributions of Transit Deserts

This section demonstrates the spatial distribution of transit desert indexes in the study area. For better visualization, we set the legend of transit demand as descending and the legend of transit supply and gap as ascending. Hence, the red means high transit demand, low public transit service, and high dissatisfaction. Additionally, we set four categories of these indexes, less than −1, between −1 and 0, between 0 and 1, and larger than 1, to represent the severality of transit demand, supply, and deserts [34]. In describing the spatial distributions, we referenced the principal distributions, uniform distribution, random distribution, and clumped destitution in geography to categorize the distributions of transit services in the study area [35].
Figure 3 shows these distributions of transit demand, transit supply, and transit desert index in Greater London and Grand Paris. In Greater London, all three distributions resemble clumped distribution. The transit-population density is relatively high surrounding the central areas and relatively low in the outer ring. Figure 3c shows the distribution of transit supply in Greater London. The distribution boundaries are clear. Areas with good public transit services gather in the inner circle, while the services are poor in the outer circle. As the difference between transit demand and supply, the transit deserts are shown in Figure 3e. It indicates that the areas surrounding downtown London have high public transit satisfaction, while the satisfaction is low in periphery areas such as Loughton and Barnet. These results are consistent with the public transport accessibility levels by Transport for London [31]. Moreover, given the results of transit supply (Figure 3c) distribution, we claimed that the overwhelming demand causes dissatisfaction with public transit service in periphery areas around the downtown.
The distribution in Grand Paris is worth noting. Figure 3b shows that the transit-population density is high in the central areas, a key difference from Greater London. Figure 3d presents the public transit supply distribution. The public transit service is relatively good in central areas, while the transit service is relatively deficient in outside areas. Figure 3f presents the transit desert index distribution in Grand Paris. There are no precise concentric circles of transit deserts in Grand Paris where distributions are close to random distribution. Furthermore, results indicate that allocating public transit facilities to meet public transit demand in Grand Paris can be better than in Greater London. The underserved public transit neighborhoods do not gather in general. It can be evidence that Grand Paris has a relatively minor inequitable transit distribution issue.
Figure 4 demonstrates the spatial distributions of transit demand, transit supply, and transit deserts in Madrid and Milan. In Madrid, the transit-dependent population gathers in the Centro neighborhood and surrounding areas as belts (Figure 4a). There are two “green” belts longitudinally (e.g., Paseo de la Castellana) and latitudinally (e.g., Avenida de la Ciudad de Barcelona) crossing the Centro neighborhood. Figure 4c shows the distribution of public transit supply, and Figure 4e presents the distribution of transit desert, similar to the distribution of transit supply. These results confirmed the success of transit corridor developments, showing that these developments promote the level of transit services along corridors [36]. Moreover, the areas with a high transit-dependent population have relatively high public transit supply. Finally, although there are transit deserts, the results show the efforts of governments to ease the public transit inequity [37].
Additionally, the situations in Milan are worth noting. Figure 4b shows the transit-dependent population in Milan. The distribution of transit demand in Milan resembles clumped distribution [38]. In central areas, the demand is low, while the areas from the central areas have a relatively high trans-dependent population. Figure 4d presents the transit supply distribution. In the central areas, the public transit services are high, while the public transit services outside are low. Hence, not surprisingly, the transit deserts follow the distribution of transit-dependent populations. Results may indicate that there could be significant mismatches in Milan. Transit demand in the center is low, while supply is high, which meets the requirement of Milan as a traveling hotspot since there are many attractions in the center. However, it also indicates that residents may not benefit from these services as expected since few live in the center. What’s more, the transit supply out of the center is relatively low, which can suggest the difficulty of residents living in the periphery areas around the downtown taking public transit.

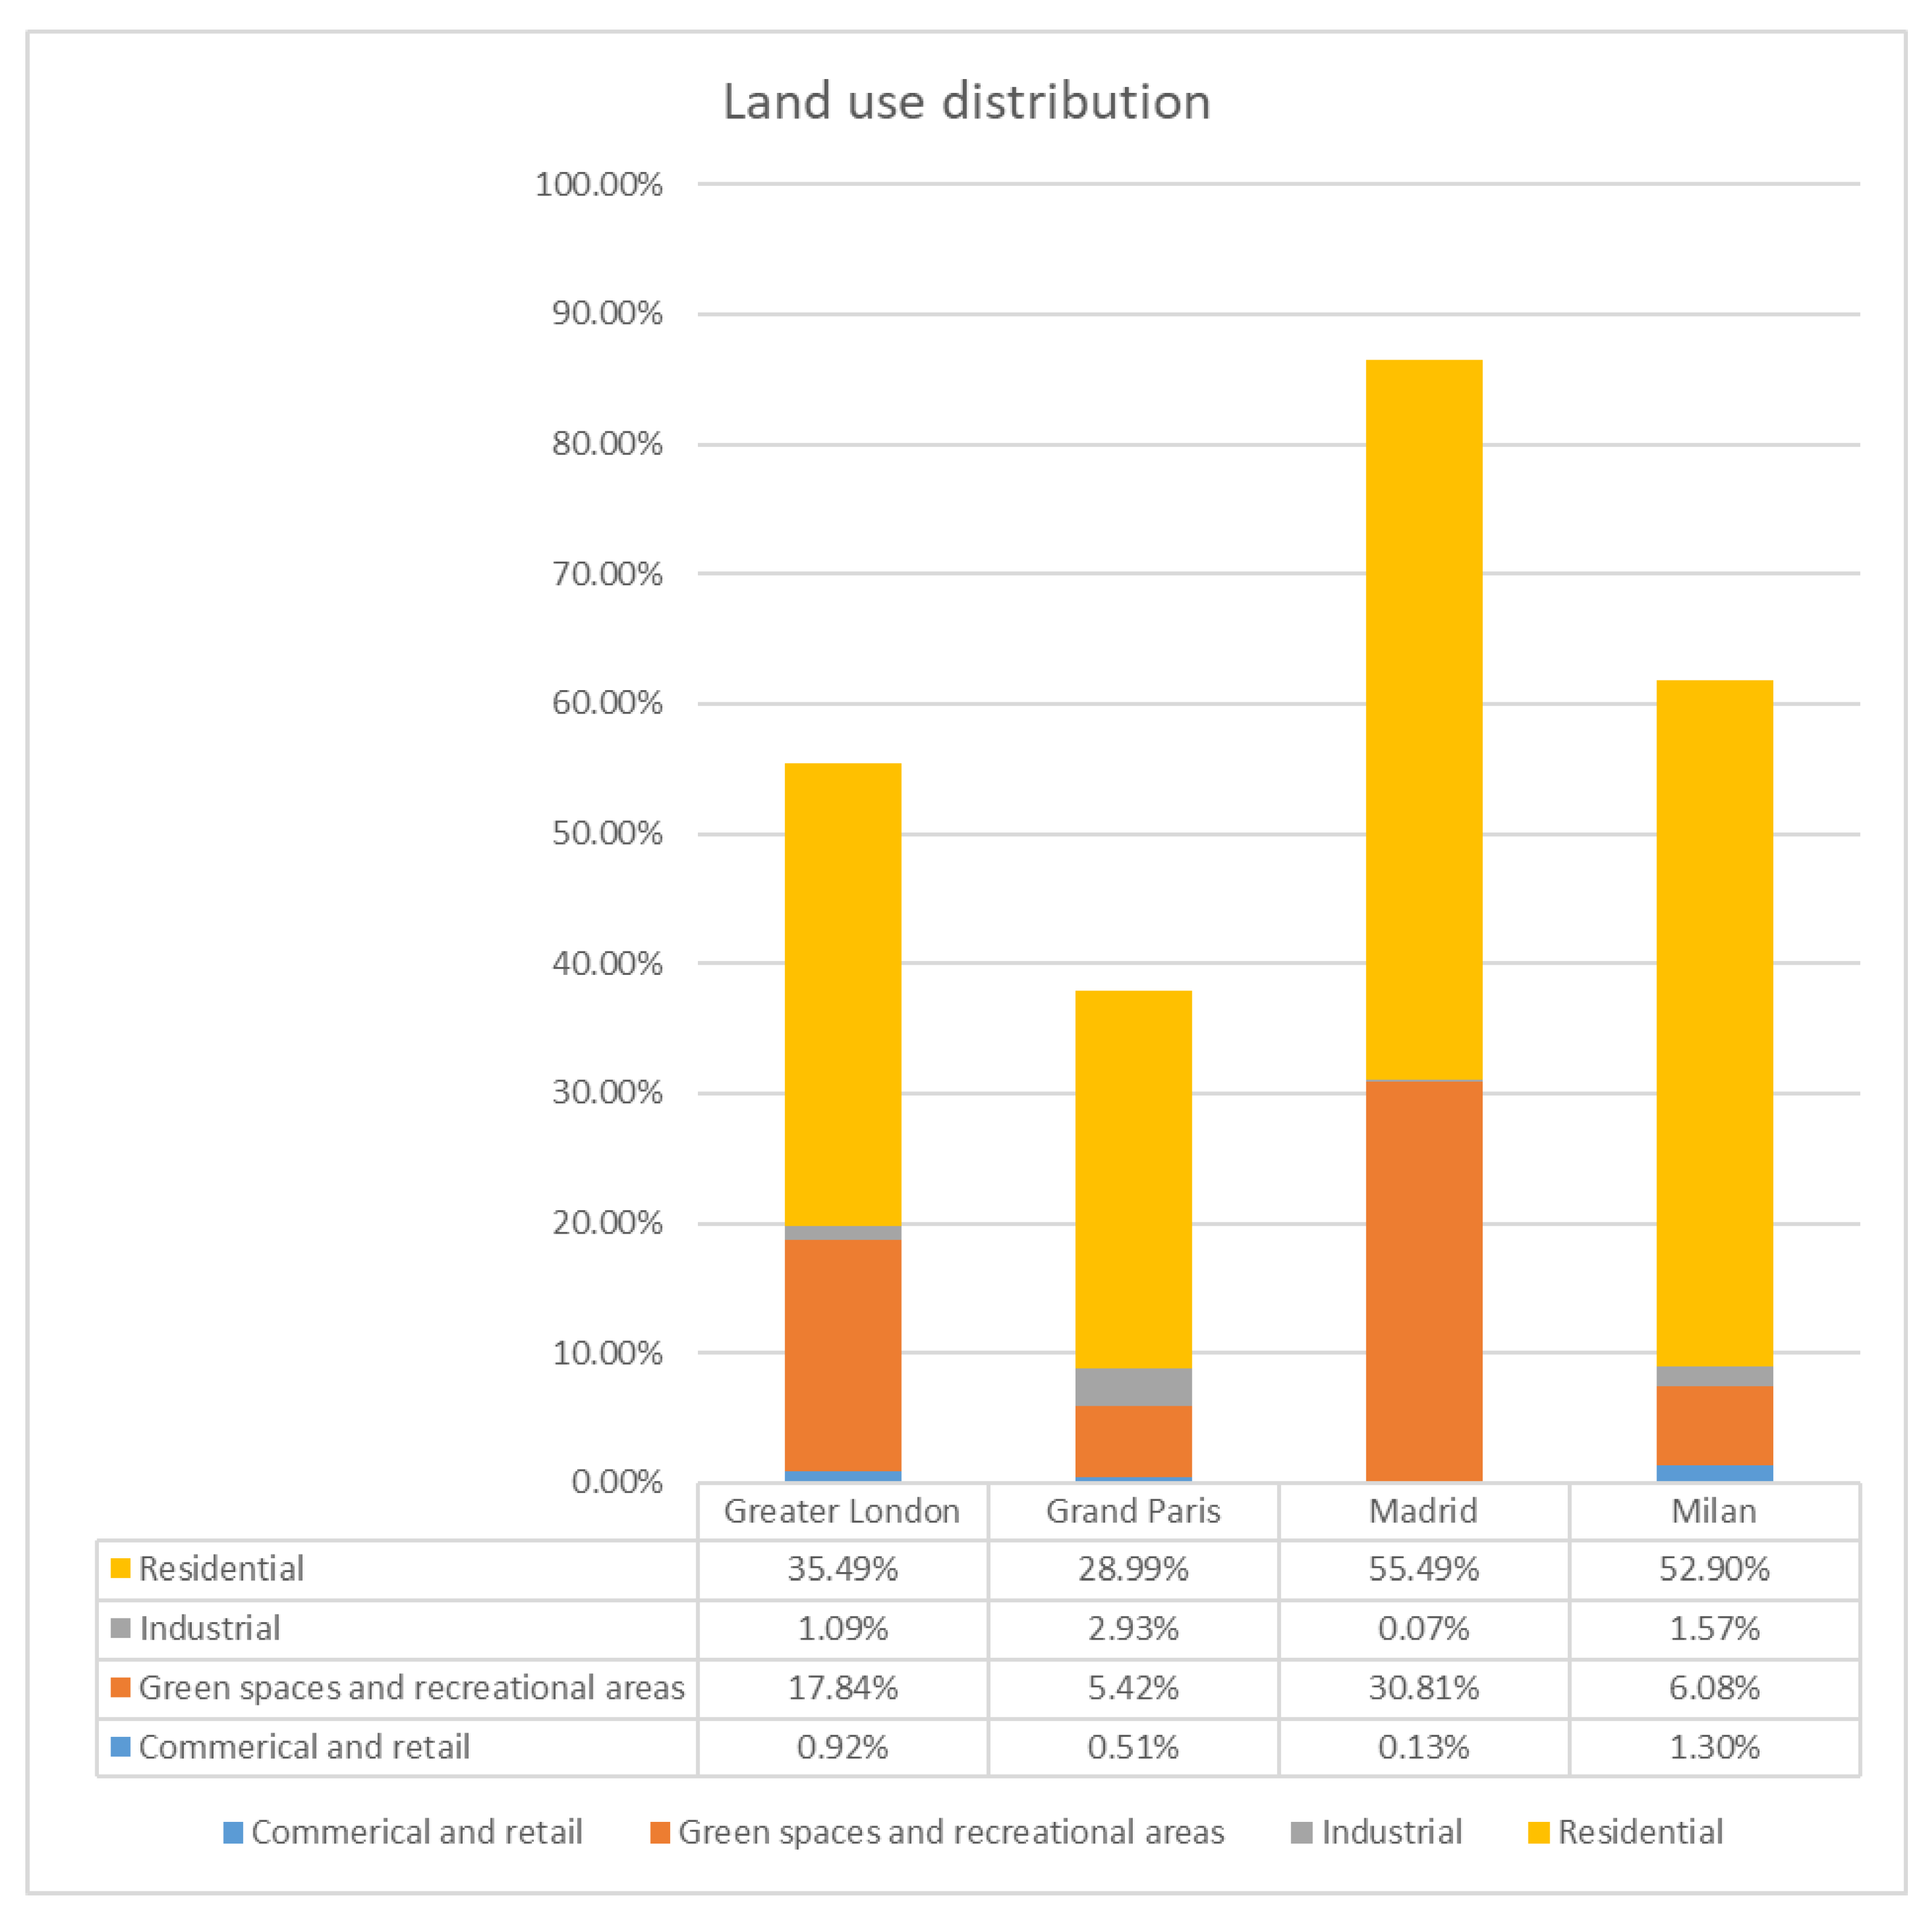
4.3. Comparison between Land Use Characteristics in Transit Deserts

Figure 5 presents the land-use factors in the transit desert. We noticed that residential areas are the most dominant land-use factors in transit deserts across the study area, followed by green spaces and recreational areas, which indicates that public transit access to and from these areas can be a general problem in European cases. Specifically, this result proves that it could be challenging for residents to travel from home to green spaces through public transit [39,40].
The land use distributions in different cases are worth noting. First, we found that portions of residential and greenspaces land use in transit deserts in Greater London (35.49%, 17.84%) are larger than in Grand Paris (28.99%, 5.42%). This is consistent with the findings in the last section, arguing that the inequitable distribution of public transit services in London is more severe than in Paris. Moreover, the Greater London government needs to put more effort into improving public transit accessibility in green spaces [39]; the level of public transit services surrounding green spaces in Grand Paris works well [41]. Second, we found that the portion of residential land use in transit deserts in Madrid (55.49%) and Milan (52.90%) are similar; however, the portion of green spaces in Madrid (30.81%) is much larger than in Milan (6.08%). This rate in Madrid is the highest among the cases. Although previous studies indicated that the green space accessibility in Madrid is better than in other cities [42], we claimed that public transit accessibility to green spaces could not be sufficient as expected.

5. Discussion

Public transit equity has been a rising concern recently due to the increases in living costs and gasoline prices. Government agencies are working on improving the public transit service and easing inequitable distributions. The transit desert concept can provide a regional and comparative perceptive for the regional transportation planning agencies. Based on the concept, this study evaluates public transit performance in four regions/cities and identifies underserved areas. Results identify the neighborhoods that need extra transit services, and the spatial distributions of transit underserved areas can be significantly different across cases. Then, we examined the land-use attributes within these underserved areas. We found that most of them are residential land use followed by green spaces.
The limitations are worth noting. First, this study is based on publicly available datasets. We acknowledged that the quality of the data across countries could be different. For instance, the TransitFeeds data in Grand Paris and Madrid were completed, while they missed public transit frequency in Milan and some facilities in Greater London. Although we fixed these issues by referencing local transportation agencies, it is worth noting this limitation and calling future studies to be aware of them. Second, as shown in Table 2, the bias in spatial units of observations can be significant. The census definitions in different countries are varied. We noticed these differences and converted them into the census equivalent definitions in the U.S. [43]. Future studies need to consider these differences and be aware of the modifiable area unit problem [44]. Third, we noticed the limitation in variables. In measuring transit supply, we applied seven criteria and considered them equally. Although it references the published studies, it would be better to give reasonable shares on this measurement [45]. Moreover, in measuring transit demand, we measured the transit-dependent population as the non-vehicle population, which can cause ignore demands from other vulnerable populations [6,17]. Hence, we called for future investigations on improvements in measuring transit demand (e.g., weight system according to empirical studies) and supply (e.g., teenagers and old generations) of non-vehicle populations.
Albeit the limitations, this study has several important research and policy implications. After several pandemic waves and increasing living costs, residents need an affordable travel mode to save on living costs, so public transit could be critical. To help transportation planners fulfill the essential travel needs, we summarize the takeaways from this study as the following.
First, implementation suggestions can be generated for Greater London and Milan with the severest transit inequitable distribution. The results suggest that more than half of the transit-dependent population in both cities live in areas where the existing public transit services cannot meet the demand. In Greater London, unsurprisingly, the transit agencies have noticed this issue. They applied interventions including improving the metro, buses, commuter train system (e.g., Docklands Light Railway), and overground light rail transit [46]. These improvements undoubtedly can increase the capability and satisfaction of the transit system; however, it may not solve the issues since our study argued that the main cause is overwhelming demand. In other words, neighborhoods with high rates of non-vehicle residents are gathering. Hence, we suggest London agencies identify these neighborhoods, given our results, and provide extra public transit services to them.
Additionally, the issue in Milan could be different. Our results suggest that the transit service is numerous in the center, where few transit-dependent residents live. This mismatch leads to concerns about transit equity in Milan. Furthermore, the Milan government announced an ambitious plan to reduce car use and improve transit facilities [47,48]. Local agencies claimed that this plan could dramatically decrease driving alone. These efforts are appreciated, but there are worries that the residents who need public transit to travel around may not benefit as expected since they face barriers to accessing high-quality transit services. Therefore, before launching ambitious transit planning, it is critical to implement a study to identify the neighborhoods that need further transit support to ensure transit service is equitably distributed.
Second, European transit agencies must focus on improving transit services to and from residential areas and green spaces. The results suggest that this underserved population should be a general issue among cases. The portions of residential areas and green spaces in transit deserts are higher than 25% and 5%. Although the later rate seems smaller, it is significantly higher than other land uses (i.e., commercial and retail, and industry). Hence, we call on local governments to work on improving transit connectivity in both types of areas. For instance, transit agencies can provide multi-module choices connecting significant residential places and green spaces [49]. Given our results, researchers and practitioners can apply other methods, such as social network analysis, to evaluate and optimize the transit services to and from these areas [50].
Third, the spatial distributions of transit deserts in the study areas differ across countries. According to previous studies, transit deserts are most likely located in the periphery or suburbs in low-density regions and downtown in high-density regions [12,22]. Our findings are consistent with this statement, suggesting that downtown areas have relatively high satisfaction with public transit, but the causes can be different. In Greater London, both transit demand and supply are high downtown. It is similar to the cases in China [12]. In comparison, the supply is high while demand is low in the other three cases, which is similar to the cases in the U.S. [22]. We assumed these phenomena are consistent with the land use regulations (e.g., Green Belt) [51] and historical building locations. Therefore, it is worth taking the next step by looking at the causes, which can be an exciting topic in the urban geography discipline.
Finally, the combination of the transit deserts concept and publicly available data has proven its ability to handle European cases. Given the studies in the U.S., China, and South Africa, it can be interesting to evaluate the transit system further internationally [12,18,22]. For instance, there can be a study evaluating the transit services in developing countries, so that international non-government organizations (e.g., World Bank) can allocate budgets to those who need transit to travel. When launching the analysis and given the barriers we faced in collecting data from agencies in different countries, we encourage researchers to pay attention when using publicly available datasets because the quality of these datasets cannot be as efficient as expected. Therefore, we suggest a platform integrating international planning data, such as combining OpenStreetMap and TransitFeeds, which can make the studies across different countries doable. What’s more, when setting the criteria of transit demand and supply, agencies need to be aware of shares based on empirical studies.

6. Conclusions

Due to the increases in living costs and gasoline prices, policymakers need to promote public transit systems as an alternative and sustainable choice for people who cannot afford to drive alone. Based on the transit desert concept, we evaluated the transit systems in four European cities and identified the underserved transit areas. Then, we examined the land use attributes within areas. Our findings identify the region/city facing severe transit inequitable distribution and point out the concerns about transit services to and from residential areas and green spaces. Moreover, these findings prove the potentials of the transit desert concept in international urban planning practice. Analysis and decision support methods based on the transit desert concept can contribute significantly to transit evaluation and underserved neighborhood identifications, which can help transit agencies promote sustainable and equitable public transit systems.

Author Contributions

Conceptualization, Y.C. and J.J.; methodology, Y.C.; software, Y.C.; validation, Y.C.; formal analysis, Y.C.; analysis, Y.C.; writing—original draft preparation, Y.C.; writing—review and editing, J.J.; visualization, Y.C.; supervision J.J.; project administration, J.J.; funding acquisition, J.J.. All authors have read and agreed to the published version of the manuscript.

Funding

The research was funded by the consortium of Cooperative Mobility for Competitive Megaregions and Good System at the University of Texas at Austin. The authors would also like to acknowledge the funding supports from NSF, UT Good Systems, and USDOT.

Institutional Review Board Statement

Not applicable.

Informed Consent Statement

Not applicable.

Data Availability Statement

Not applicable.

Conflicts of Interest

The authors declare no conflict of interest.

References

  1. UITP. Open Letter: CEOs and City Representatives Call for Public Transport to Be Key Sector in EU Recovery Plan. Available online: https://www.uitp.org/publications/open-letter-ceos-and-city-representatives-call-for-public-transport-to-be-key-sector-in-eu-recovery-plan/ (accessed on 10 April 2022).
  2. Kennedy, C.A. A Comparison of the Sustainability of Public and Private Transportation Systems: Study of the Greater Toronto Area. Transportation 2002, 29, 459–493. [Google Scholar] [CrossRef]
  3. Giuliano, G. Low Income, Public Transit, and Mobility. Transp. Res. Rec. 2005, 1927, 63–70. [Google Scholar] [CrossRef]
  4. Urban Transport Magazine. Relief for the Public Transport Sector? German Government Provides 2.5 Billion Euros for Public Transport-up to 100 Billion Europe-Wide? 5 June 2020. Available online: https://www.urban-transport-magazine.com/en/relief-for-the-public-transport-sector-german-government-provides-2-5-billion-euros-for-public-transport-up-to-100-billion-europe-wide/ (accessed on 5 December 2020).
  5. Wei, R.; Liu, X.; Mu, Y.; Wang, L.; Golub, A.; Farber, S. Evaluating Public Transit Services for Operational Efficiency and Access Equity. J. Transp. Geogr. 2017, 65, 70–79. [Google Scholar] [CrossRef]
  6. Carleton, P.R.; Porter, J.D. A Comparative Analysis of the Challenges in Measuring Transit Equity: Definitions, Interpretations, and Limitations. J. Transp. Geogr. 2018, 72, 64–75. [Google Scholar] [CrossRef]
  7. Welch, T.F.; Mishra, S. A Measure of Equity for Public Transit Connectivity. J. Transp. Geogr. 2013, 33, 29–41. [Google Scholar] [CrossRef]
  8. Karner, A. Assessing Public Transit Service Equity Using Route-Level Accessibility Measures and Public Data. J. Transp. Geogr. 2018, 67, 24–32. [Google Scholar] [CrossRef]
  9. Garrett, M.; Taylor, B. Reconsidering Social Equity in Public Transit. Berkeley Plan. J. 1999, 13, 6–27. [Google Scholar] [CrossRef] [Green Version]
  10. Sohrabi, S.; Khreis, H.; Lord, D. Impacts of Autonomous Vehicles on Public Health: A Conceptual Model and Policy Recommendations. Sustain. Cities Soc. 2020, 63, 102457. [Google Scholar] [CrossRef]
  11. Jiao, J.; Dillivan, M. Transit Deserts: The Gap between Demand and Supply. J. Public Transp. 2013, 16, 23–39. [Google Scholar] [CrossRef] [Green Version]
  12. Jiao, J.; Cai, M. Using Open Source Data to Identify Transit Deserts in Four Major Chinese Cities. ISPRS Int. J. Geo-Inf. 2020, 9, 100. [Google Scholar] [CrossRef]
  13. Gao, L.; Yu, Y.; Liang, W. Public Transit Customer Satisfaction Dimensions Discovery from Online Reviews. Urban Rail Transit 2016, 2, 146–152. [Google Scholar] [CrossRef] [Green Version]
  14. Li, C.; Zegras, P.C.; Zhao, F.; Qin, Z.; Shahid, A.; Ben-Akiva, M.; Pereira, F.; Zhao, J. Enabling Bus Transit Service Quality Co-Monitoring Through Smartphone-Based Platform. Transp. Res. Rec. 2017, 2649, 42–51. [Google Scholar] [CrossRef] [Green Version]
  15. Fan, W.D.; Li, Y. Using General Transit Feed Specification (GTFS) Data as a Basis for Evaluating and Improving Public Transit Equity; University of North Carolina at Charlotte: Charlotte, NC, USA, 2019. [Google Scholar]
  16. Munoz-Raskin, R. Walking Accessibility to Bus Rapid Transit: Does It Affect Property Values? The Case of Bogotá, Colombia. Transp. Policy 2010, 17, 72–84. [Google Scholar] [CrossRef]
  17. Jomehpour, J.; Smith-Colin, J. Transit Deserts: Equity Analysis of Public Transit Accessibility. J. Transp. Geogr. 2020, 89, 102869. [Google Scholar] [CrossRef]
  18. Vanderschuren, M.; Cameron, R.; Newlands, A.; Schalekamp, H. Geographical Modelling of Transit Deserts in Cape Town. Sustainability 2021, 13, 997. [Google Scholar] [CrossRef]
  19. Grengs, J. Does Public Transit Counteract the Segregation of Carless Households? Measuring Spatial Patterns of Accessibility. Transp. Res. Rec. 2001, 1753, 3–10. [Google Scholar] [CrossRef]
  20. Pucher, J.; Buehler, R. Integrating Bicycling and Public Transport in North America. J. Public Transp. 2009, 12, 79–104. [Google Scholar] [CrossRef] [Green Version]
  21. Jiao, J. Identifying Transit Deserts in Major Texas Cities Where the Supplies Missed the Demands. J. Transp. Land Use 2017, 10, 529–540. [Google Scholar] [CrossRef]
  22. Jiao, J.; Bischak, C. Understanding Transportation Related Infrastructure Access in 52 Major US Cities; Publication CM2-18; U.S. Department of transportation, Bureau of Transportation Statistics: Washington, DC, USA, 2019.
  23. Cai, M.; Jiao, J.; Luo, M.; Liu, Y. Identifying Transit Deserts for Low-Income Commuters in Wuhan Metropolitan Area, China. Transp. Res. Part D Transp. Environ. 2020, 82, 102292. [Google Scholar] [CrossRef]
  24. Lee, H.K.; Jiao, J.; Choi, S.J. Identifying Spatiotemporal Transit Deserts in Seoul, South Korea. J. Transp. Geogr. 2021, 95, 103145. [Google Scholar] [CrossRef]
  25. Apur. Recensement Iris Population. Available online: https://opendata.apur.org/datasets/recensement-iris-population?geometry=-0.232,48.512,4.995,49.144 (accessed on 17 May 2020).
  26. Office for National Statistics. Lower Layer Super Output Area (LSOA) Boundaries. Available online: https://data.gov.uk/dataset/fa883558-22fb-4a1a-8529-cffdee47d500/lower-layer-super-output-area-lsoa-boundaries (accessed on 20 July 2020).
  27. NISES. Demografía y Población-Ayuntamiento de Madrid. Available online: https://www.madrid.es/portales/munimadrid/es/Inicio/El-Ayuntamiento/Estadistica/Areas-de-informacion-estadistica/Demografia-y-poblacion/?vgnextfmt=default&vgnextchannel=4e77a4f094b74210VgnVCM2000000c205a0aRCRD (accessed on 26 July 2020).
  28. Milan. Territorio: Localizzazione delle sezioni di Censimento-Open Data-Comune di Milano. Available online: https://dati.comune.milano.it/dataset/ds98_infogeo_sezioni_censimento_localizzazione_2011c (accessed on 11 July 2020).
  29. OpenStreetMap. Geofabrik Download Server. Available online: https://download.geofabrik.de/ (accessed on 28 March 2021).
  30. OpenMobilityData. TransitFeeds Is Now OpenMobilityData-OpenMobilityData. Available online: https://transitfeeds.com/news/open-mobility-data (accessed on 12 April 2022).
  31. Transport for London. TfL Bus Stop Locations and Routes-London Datastore. Available online: https://data.london.gov.uk/dataset/tfl-bus-stop-locations-and-routes (accessed on 20 July 2020).
  32. Cao, M.; Hickman, R. Urban Transport and Social Inequities in Neighbourhoods near Underground Stations in Greater London. Transp. Plan. Technol. 2019, 42, 419–441. [Google Scholar] [CrossRef]
  33. Hooper, J. Calls for Racially Segregated Public Transport in Milan Sparks Row. The Guardian, 8 May 2009. [Google Scholar]
  34. Jiao, J. 4-Shared Mobility and Public Transit: A Love-Hate Story. In Shared Mobility; Jiao, J., Ed.; Elsevier: Amsterdam, The Netherlands, 2021; pp. 39–53. [Google Scholar]
  35. Walker, S. Density and Dispersion|Learn Science at Scitable. Available online: https://www.nature.com/scitable/knowledge/library/density-and-dispersion-19688035/ (accessed on 7 September 2022).
  36. Madrid. Top-Quality Infraestructures. Comunidad de Madrid. Available online: https://www.comunidad.madrid/en/inversion/madrid/infraestructuras-primer-nivel-0 (accessed on 5 September 2022).
  37. Vassallo, J.M.; de Villar, P.P.; Muñoz-Raskin, R.; Serebrisky, T. Public Transport Funding Policy in Madrid: Is There Room for Improvement? Transp. Rev. 2009, 29, 261–278. [Google Scholar] [CrossRef]
  38. Pathak, R.; Wyczalkowski, C.K.; Huang, X. Public Transit Access and the Changing Spatial Distribution of Poverty. Reg. Sci. Urban Econ. 2017, 66, 198–212. [Google Scholar] [CrossRef]
  39. Pinto, L.V.; Ferreira, C.S.S.; Inácio, M.; Pereira, P. Urban Green Spaces Accessibility in Two European Cities: Vilnius (Lithuania) and Coimbra (Portugal). Geogr. Sustain. 2022, 3, 74–84. [Google Scholar] [CrossRef]
  40. Silva, C.; Viegas, I.; Panagopoulos, Τ.; Bell, S. Environmental Justice in Accessibility to Green Infrastructure in Two European Cities. Land 2018, 7, 134. [Google Scholar] [CrossRef] [Green Version]
  41. Torp, J. Going Green: A Comparative Analysis of Green Urbanism in Paris and Shanghai. 2021. Available online: https://egrove.olemiss.edu/hon_thesis/1918/ (accessed on 8 November 2020).
  42. Verduras Dietl, M. Green Spaces in Cities? Analysis and Comparison of Green Spaces in Stockholm and Madrid. 2017. Available online: http://su.diva-portal.org/smash/record.jsf?pid=diva2%3A1104916&dswid=1403 (accessed on 12 November 2020).
  43. Bureau, U.C. Glossary. In Census.gov. Available online: https://www.census.gov/programs-surveys/geography/about/glossary.html (accessed on 6 September 2022).
  44. Dark, S.J.; Bram, D. The Modifiable Areal Unit Problem (MAUP) in Physical Geography. Prog. Phys. Geogr. Earth Environ. 2007, 31, 471–479. [Google Scholar] [CrossRef] [Green Version]
  45. Bertolaccini, K.; Lownes, N. Effects of Scale and Boundary Selection in Assessing Equity of Transit Supply Distribution. Transp. Res. Rec. J. Transp. Res. Board 2013, 2350, 58–64. [Google Scholar] [CrossRef]
  46. Transport for London. Improvements & Projects. Available online: https://www.tfl.gov.uk/travel-information/improvements-and-projects/ (accessed on 6 September 2022).
  47. Laker, L. Milan Announces Ambitious Scheme to Reduce Car Use after Lockdown. The Guardian, 21 April 2020. [Google Scholar]
  48. Milan. MilanoCard—The City Pass to Visit Milan top Attractions. Available online: https://www.milanocard.it/ (accessed on 6 September 2022).
  49. Johnson, E. All Aboard for Nature: Improving Outdoor Access Through Public Transportation. Available online: https://www.eesi.org/articles/view/all-aboard-for-nature-improving-outdoor-access-through-public-transportation (accessed on 6 September 2022).
  50. Chen, J.; Chang, Z. Rethinking Urban Green Space Accessibility: Evaluating and Optimizing Public Transportation System through Social Network Analysis in Megacities. Landsc. Urban Plan. 2015, 143, 150–159. [Google Scholar] [CrossRef]
  51. EuroNatur Foundation. Green Belt Europe: Europe’s Largest Nature Conservation Initiative. Available online: https://www.euronatur.org/en/what-we-do/european-green-belt (accessed on 21 July 2020).
Figure 1. The study areas.
Sustainability 14 13182 g001
Figure 2. Research framework.
Sustainability 14 13182 g002
Figure 3. Transit gaps between supplies and demands in Greater London and Grand Paris: (a,b) transit demand in Grand Paris and Greater London; (c,d) transit supply in Greater London and Grand Paris; (e,f) transit deserts and transit oasis in Greater London and Grand Paris.
Sustainability 14 13182 g003aSustainability 14 13182 g003b
Figure 4. Transit gaps between supplies and demands in Madrid and Milan: (a,b) transit demand in Madrid and Milan; (c,d) transit supply in Madrid and Milan; (e,f) transit deserts and transit oasis in Madrid and Milan.
Sustainability 14 13182 g004aSustainability 14 13182 g004b
Figure 5. Land use distributions in the study area.
Sustainability 14 13182 g005
Table 1. A comparison of population and area in four regions.
NamePopulation (Area)
MSAsGrand Paris7.02 million (314.62 square miles)
Greater London8.91 million (791.19 square miles)
CitiesMadrid3.18 million (232.38 square miles)
Milan1.30 million (70.18 square miles)
Table 2. Criteria of transit supply and demand.
Transit SupplyTransit Demand
Jiao & Dillivan, 2013 [11]Transit facilities, frequency, transit routes, and bike lanes Teenagers, the population without vehicles, and the non-institutionalized population
Jiao, 2017 [21]Public transit facilities, frequency, transit routes, sidewalks, bike routes, low-speed limit roads, and intersectionTeenagers, the population without vehicles, and the non-institutionalized population
Jiao & Bischak, 2019 [22]Public transit facilities, frequency, transit routes, sidewalks, bike routes, low-speed limit roads, and intersectionTeenagers, the population without vehicles, and the non-institutionalized population
Jomehpour & Smith-Colin, 2020 [17]Factors of origin connectivity, destination connectivity, frequency, flexibility, and reliability Socioeconomic and mobility need factors
Cai et al., 2020 [23]Public transit facilities, frequency, transit routes, sidewalks, bike routes, low-speed limit roads, intersections, and capacity of transit servicePublic transit riders and low-income population
Vanderschuren et al., 2021 [18]Public transit facilities, frequency, transit routes, sidewalks, bike routes, low-speed limit roads, and intersectionTeenagers, the population without vehicles, the non-institutionalized population, and ineligible drivers
Lee et al., 2021 [24]Public transit facilities, parking lot, bike lanes, ridershipResidents without vehicles
This studyPublic transit facilities, frequency, transit routes, sidewalks, bike routes, low-speed limit roads, and intersectionResidents without vehicles
Table 3. Portions of areas/people in transit deserts within four regions/cities.
Description (Number of Spatial Units)Portion of the Area in Transit DesertsPortion of the Transit-Dependent Population in Transit Deserts
Grand ParisIRIS represents the basic unit for distributing municipal data. (2841)40.6%48.1%
Greater LondonThe lower super output area is a hierarchical geographic structure used to improve statistical information reporting in a small area. (4969)58.8%54.5%
MadridThe census section has an operational character and must always be defined by fixed sizes. (2409)48.3%45.1%
MilanThe census section defines the minimum survey unit based on which the census survey is organized. (6079)33.0%61.9%
Publisher’s Note: MDPI stays neutral with regard to jurisdictional claims in published maps and institutional affiliations.

