Article

Economic Evaluation of Bioremediation of Hydrocarbon-Contaminated Urban Soils in Chile

1
Laboratorio de Microbiología Molecular y Biotecnología Ambiental, Departamento de Química & Centro de Biotecnología Daniel Alkalay-Lowitt, Universidad Técnica Federico Santa María, Avenida España 1680, Valparaíso 2390123, Chile
2
Laboratorio de Biología Celular y Ecofisiología Microbiana, Facultad de Ciencias Naturales y Exactas, Universidad de Playa Ancha, Leopoldo Carvallo 270, Valparaíso 2360001, Chile
3
HUB Ambiental, Universidad de Playa Ancha, Leopoldo Carvallo 270, Valparaíso 2360001, Chile
4
Escuela de Negocios Internacionales, Universidad de Valparaíso, Valparaíso 2572048, Chile
5
Instituto de Geografía, Pontificia Universidad Católica de Valparaíso, Valparaíso 2350026, Chile
6
Simbiosis, Valparaíso 2510117, Chile
*
Authors to whom correspondence should be addressed.
These authors contributed equally to this work.
Sustainability 2022, 14(19), 11854; https://doi.org/10.3390/su141911854
Submission received: 18 July 2022 / Revised: 27 August 2022 / Accepted: 29 August 2022 / Published: 21 September 2022
(This article belongs to the Special Issue Prospects and Challenges of Bioeconomy Sustainability Assessment)

Abstract

:
Technical advances have converted bioremediation into a large-scale ecosystem service suitable for the treatment of polluted soils worldwide; however, its application in Chile is scarce. The main hurdles that must be addressed include the capacities of such approaches for the treatment of polluted soils, the lack of knowledge about key factors affecting bioremediation costs and the lack of a legal framework to regulate this activity. In this study, the economic performance of the bioremediation of chronically hydrocarbon-polluted urban soils based on bioaugmentation, biostimulation or the combination of both approaches projected to an industrial scale was evaluated. The cost of bioremediation ranged between USD 50.7 and USD 310.4 per m3 of contaminated soil. In addition, the items and activities that had the most significant impacts on the final bioremediation cost, such as compost for biostimulation and bacterial growth media for bioaugmentation-based approaches, were identified. The projected costs were compared against an extensive database of 130 soil bioremediation projects. The bioremediation treatment costs fell within the top 60% of the more expensive projects, highlighting the high effort involved in bioremediation of chronically contaminated soils. This framework can facilitate the decision making of entrepreneurs, consultants, researchers and governmental authorities when launching initiatives to develop a local bioremediation industry capable of cleaning up a high number of polluted sites in Chile.

1. Introduction

Petroleum-derived hydrocarbons are the main hazardous compounds causing the contamination of extensive areas of soil and water. The pollution is more frequent at areas near to oil wells and sites devoted to the production, distribution, manipulation, disposal and especially storage of petroleum-derived products. Inadequate management, monitoring and maintenance have led to contaminated sites, generating a potentially permanent source of diffuse pollution that represents a significant health risk for neighboring communities. Historically, conventional techniques for restoring polluted soils have mainly consisted of excavation, removal and disposal of contaminated materials into waste-dumped or hazardous-waste landfills [1,2]. The volatility of the hydrocarbons during removal and management operations constitutes a health risk, especially for workers during excavation, handling and transportation. Microbial communities in soils possess metabolic and physiological flexibility for adaptation to environmental challenges [3]. The input of contaminants usually impacts the structure and function of the soil microbiome, reshaping microbial communities towards the selection of species that can survive and cope with the toxicity of the contaminants [4,5,6,7,8,9,10]. Emergent species within the disturbed communities usually share enhanced physiological and substrate degradation capabilities, oxidizing, transforming, immobilizing or binding the contaminants [11,12,13,14,15]. This metabolic flexibility of soil microbiota present in the environment provides a platform for microbial bioremediation as a valuable ecosystem service [16]. In addition, the biodegradable nature of hydrocarbons and the ubiquitous distribution of hydrocarbon-degrading microorganisms have underlined the efficacy of microbially driven bioprocesses for the restoration of polluted ecosystems [17,18,19,20,21]. Currently, there is an increasing need for alternatives in cleaning up contaminated sites worldwide. For instance, it has been estimated that there are 500,000 and 340,000 contaminated sites in the U.S. and Europe, respectively [22,23]. China has over two million hectares of abandoned sites in more than one hundred old industrial cities that require environmental restoration before redevelopment [24]. It is in this context that full-scale bioremediation projects have been successfully applied, mainly in Europe, North America and, more recently, China [25,26]. As a result, the global industry related to bioremediation services has systematically spread, becoming an industry worth USD 35 billion in 2009 [27]. The growth of the global bioremediation market has accelerated in recent years, reaching USD 91.0 billion in 2018, and it is expected to grow to USD 186.3 billion in 2023 [28].
The main sources of soil contamination in Chile are mining activities (30.9% of total sites), including deposition of metals and metalloids, and agro-industrial activities (30.1% of total sites), including petroleum products, pesticides, fertilizers and urban waste (24.2% of total sites) [29]. Regarding contamination by metals and metalloids, the geological evolution specifically associated with the Andes has resulted in an overwhelming proportion of metallic ore deposits being located in the northern part [30]. Chilean porphyry copper deposits have a low ore grade but exist in huge volumes and, together with the lack of regulations, this has encouraged several large-scale mining operations to leave a legacy of contaminated areas [31]. It has been previously reported that these polluted sites include 740 tailings, of which 23.3% are abandoned [32]. Soil contamination associated with agricultural and forestry production systems includes excessive utilization of fertilizers and pesticides, resulting in diffuse contamination across nearby areas [33,34]. The contamination of soils by other chemicals, such as petroleum derivatives and organochlorines, has mainly been associated with industrial activities outside the boundaries of cities. However, with the growth of the urban population, they have been absorbed by urban areas, such as in Valparaíso, Concepción and Santiago, and there are also cities with industrial activities, such as Quintero, Puchuncaví and Talcahuano [1,35,36,37,38,39]. Despite the urgent need for sustainable clean-up processes, applications of microbial bioremediation in Chile are scarce. Recently, the Chilean government evaluated 19 projects designed to restore metal and hydrocarbon-polluted soils, among which only 8 projects (42%) focused on bioremediation. Several factors may explain why bioremediation is not commonly used. Currently, Chile is the only Organization for Economic Co-operation and Development (OECD) country that does not have a soil protection regulation, which would regulate the maximum permissible concentrations of contaminants [40,41]. Bioremediation may entail higher costs in comparison to conventional techniques, such as the confinement of contaminants in authorized places. The high variability in the physical, chemical and microbiological properties of soils requires the design of site-tailored treatments [42,43]. In addition, the lack of directives, regulations, definitions of methodological tools, process standards and requirements for contaminated soils have hindered the application and development of a local bioremediation industry.
The aim of this study was to provide insights into the comparative costs of five approaches for bioremediation of long-term hydrocarbon-polluted urban soil, including biostimulation, bioaugmentation and the combination of both, highlighting the key factors that influence the costs associated with each approach. Since each contaminated soil has specific characteristics, this study is a guide to developing the cost assessments of bioremediation processes. This framework will facilitate the decision making of entrepreneurs and consultants when performing a risk–cost–benefit analysis. This study will help to trigger governmental authorities to generate environmental policies, regulations and standards for contaminated soils, as well as launching initiatives to develop an environmentally safe and robust local bioremediation industry capable of cleaning up different polluted sites in Chile.

2. Materials and Methods

Economic evaluation was based on treating chronically contaminated soil, taking the soil conditions of the Las Salinas site (Viña del Mar, Valparaiso Region, Chile) as a reference. The Las Salinas site is a contaminated brownfield that was subjected to petroleum industrial activity for more than eight decades. During this long period, the contamination pressure not only affected the diversity and community structure of soil, but also hampered the ecosystem function and its natural resilience. In such environments, the remaining contamination is often enriched with heavier and more structurally complex fractions of hydrocarbons, due to volatilization or solubilization of volatile fractions and the degradation of lighter alkanes [44]. The more recalcitrant compounds can also be sorbed to the soil matrix, decreasing their bioavailability and the biodegradation rate and extent [44,45,46,47].
In general, three main approaches have been widely used for restoring hydrocarbon-contaminated soils [1,48]. The first technology, called biostimulation, includes the enhancement of the metabolic activity of native microbial communities by providing limiting nutrients, such as phosphorous, nitrogen or oxygen, and further modification of environmental factors [1]. The second approach is based on the addition of hydrocarbon-degrading microorganisms, frequently applied when native microbial communities lack the metabolic capabilities or when their activity is unable to trigger significant biodegradation rates [49]. A third approach is based on the addition of stable organic amendments, such as compost, which has been applied with success across pilot- and full-scale applications [44,50,51]. The analysis presented here was based on the bioremediation of chronically contaminated soils, such as those currently present at Las Salinas, in which there is no evidence of persistent degradation processes over time. Therefore, the economic assessment was based on the addition of compost, the addition of hydrocarbon-degrading microorganisms as well as a mixture of both approaches, for which experimental results were previously published [52]. In this study, the bioremediation was addressed by five treatments. Briefly, the first two were based on bioaugmentation, with the addition of five hydrocarbonoclastic strains (named BA), and also the same treatment with the addition of permanent air venting (BAV). The selected hydrocarbonoclastic bacterial strains for bioaugmentation were Acinetobacter sp. DD78, Acinetobacter sp. AA64, Acinetobacter sp. AF53, Pseudomonas sp. DN36 and Pseudomonas sp. DN34. These strains were previously isolated from hydrocarbon-contaminated soil (Valparaíso, Chile) and possess the ability to degrade a wide range of hydrocarbons [53]. Acinetobacter sp. DD78 possess the ability to produce biosurfactants, which can help improve the bioavailability of the hydrocarbons for biodegradation [54]. The following two treatments were based on biostimulation with the addition of compost in two different ratios, 9:1 (v/v) and 3:2 (v/v), named BE1 and BE4, respectively. The fifth treatment considered was the combination of bioaugmentation and biostimulation, using a mixture of soil and compost with 3:2 (v/v) ratio (BAE).
To determine the feasibility of bioremediation as an industrial activity, an economic evaluation was made based on the results of the bioremediation strategies projected to industrial scale. The projection considered the implementation of an on-site hydrocarbon soil bioremediation process in a square one-hectare field with 10 biopiles of 100 m length each. The biopiles were designed to be trapezoidal with 2 m height, 5 m width (base) and 2.5 m width (top), with a 5 m space between each pile (Figure S1). A potential decrease in the bulk density was assumed to be 25% after construction. Each biopile has a total volume of 750 m3 of material that was covered with a High-Density Polyethylene (HDPE) membrane to conserve moisture, minimizing leachate production and gas emissions. It was projected that bioremediation process at an industrial scale would take 20 weeks, assuming one week of preparation and one week of dismantling the biopiles and associated materials, as previously observed (unpublished). An additional period of ten weeks was also considered for contingencies and maintenance. Therefore, each bioremediation cycle treats between 3750 and 6250 m3 of soil, depending on each strategy (Table S1). The proposed equipment and supplies required for the construction of biopiles and soil movement were two front shovel loaders with 2.5 m3 buckets each. Since water content is one of the most critical factors that regulates microbial activity during bioremediation, all treatments include a system for irrigation that uses one spray truck of 20 m3 that periodically moistens the soil.
To determine the initial capital for each treatment, we considered that bioaugmentation-based approaches required infrastructure with higher-technology equipment and cost-intensive installation efforts than those required by biostimulation-based approaches. Indeed, a set of bioreactors was included for bioaugmentation and air injection treatments covering two stages. An initial stage of preinoculation where sufficient biomass is grown for inoculating bigger reactors that contain the biomass to be incorporated into the soil. Five jacketed bioreactors of 0.3 m3 with blowers of 0.0075 m3 s−1 and six jacketed bioreactors of 15 m3 equipped with blowers of 0.4 m3 s−1 were considered for preinoculation and inoculation stages, respectively. Calculations for culture volume added for bioaugmentation was determined on the basis that each strain reaches a density of 106 CFU g−1, value that is 10-fold higher than those levels of cell density of hydrocarbon-degrading microorganisms at which bioremediation will be negligible [55]. Based on bacterial counts made in preliminary laboratory experiments [52], each strain requires one jacketed reactor, except for Acinetobacter sp. AA64, which requires two. On the other hand, biostimulation-based approaches require neither biomass reactors nor blowers. Instead, they need machinery to build biopiles, including a front shovel loader and a spray truck. A similar trend was observed when installation services costs were calculated. The cost of installation services was determined by adding the costs of installation of equipment, instrumentation and control, piping, electrical wiring, infrastructure, yard improvements, services, land, engineering and supervision, infrastructure expenses, contractors fees and contingencies (Table S2), and calculated according to suggested values [56].
The determination of operation costs included variable costs, fixed costs, indirect production costs and administrative and sales expenses. Variable and fixed costs enclosed direct raw materials and manpower, respectively. For treatments requiring bioaugmentation, all materials for preparation of Bushnell Haas (BH) medium and monitoring microbial grow were included. The BH broth medium contains (in grams per liter of Milli-Q water): KH2PO4, 1; K2HPO4, 1; NH4NO3, 1; MgSO4, 0.2; CaCl2, 0.020; FeCl3, 0.050. For biostimulation treatments, the supply was assumed to be compost. For every treatment there are several common costs, such as water, diesel and electricity.
The fixed costs considered remuneration for direct and indirect labor, building maintenance, publicity, machinery depreciation and many supplies and services. The incomes, as well as costs, were calculated based on the number of treatments instead of a time scale. Calculations of operating incomes of each treatment were estimated based on the breakeven–total-cost formula as (Fixed costs + Variable costs) = Total revenue = Breakeven, and (Quantity sold × Unit selling price) = Breakeven. Calculations of variable costs per unit produced and the unit selling price were estimated based in the following formula Profit = Unit Sales × (Unit Sales − Variable unit costs)—Total fixed costs. An estimation of contribution margin ratio was made based on ten years life expectancy of each equipment. As every treatment lasts twenty weeks, it was considered that 200 treatments were performed along life expectancy. Revenue estimations were made considering investment costs and the future return of investment in different time lapses (1 to 10 years).
In addition, an extensive cost analysis of 130 soil bioremediation projects was located, reviewed, and evaluated using a collection of peer-reviewed literature, federal and state agency reports (Table S3). This analysis included bioremediation with either hydrocarbons or a mixture of hydrocarbons and other contaminants, such as organic solvents, halogenated organic compounds and heavy metals. Projects were classified according to the bioremediation strategies, in the following categories, “bioventing”, “biostimulation”, “solvent vapor extraction”, “phytoremediation”, “thermal treatments”, and “bioaugmentation”. In addition, two extra categories were included. The category “various treatments” employs a combination of more than one treatment. The second category, “other”, is a treatment that was no included in the list.

3. Results

Economic assessment was made based on the results of bioremediation of five treatments to clean-up chronically hydrocarbon-contaminated soils, based on bioaugmentation, biostimulation or combination of both technologies [52]. The first approach was bioaugmentation, with the addition of five hydrocarbonoclastic strains (named as BA). The second technology was bioaugmentation with the addition of permanent air venting (BAV). The following two approaches were based on biostimulation with the addition of compost in two different ratios, 9:1 (v/v) and 3:2 (v/v), named BE1 and BE4, respectively. The fifth treatment was the combination of bioaugmentation and biostimulation, using a mixture of soil and compost with 3:2 (v/v) ratio (BAE). The analysis of the start-up capital, defined as the resources required to acquire the assets needed for each bioremediation approach, resulted in a high difference between bioaugmentation and biostimulation treatments. Among all five treatments, bioaugmentation-based approaches were those with the highest start-up capital. The complete start-up capital of BAE and BA was USD 1,822,159, whereas the capital of BAV was USD2,150,961 (Table S2). In contrast, the complete start-up capital required for biostimulation-based approaches, BE1 and BE4, was an order of magnitude lower than those technologies with bioaugmentation, due to the fact that there is no requirement for equipment, such as reactors and blowers, decreasing costs of installation.
The estimated cost of the bioremediation of chronically hydrocarbon-contaminated soils, assuming that the investment is recovered after five years of operation, ranged between USD 50.7 and USD 310.4 per m3 of contaminated soil (Table 1). Biostimulation with 10% compost (BE1) was the treatment strategy with the lowest cost (USD 50.7 per m3), followed by biostimulation with 40% compost (BE4, USD 131.7 per m3). The estimated costs for treatment per m3 of soil of both strategies that exclusively involved addition of bacterial cultures, BA and BAV, were USD 141.8 and USD 153.9, respectively. BAE was evaluated as the most expensive technology (USD 310.4 per m3 of contaminated soil) due to the high technological level required to provide the bacteria to ensure the bioaugmentation of only 3375 m3 of soil per bioremediation cycle (Figure 1). The analysis encompassed the estimation of product costs, period costs, liabilities and obligations. Projections showed that product costs represent the largest cost for all treatments, reflecting the importance of the selection of raw materials, such as compost and bacterial growth media for biostimulation and bioaugmentation-based approaches (Table S4). The largest item of product cost was the direct material that ranged from USD 17.5 to USD 174 per m3 of bioremediated soil, contributing to 35% and 56% of total costs of BE1 and BAE, respectively (Figure 1). The direct material cost, mainly based on compost, was USD 12.3 and USD 74.1 for biostimulation with 10% and 40% of compost, respectively (Table 1). Each cycle using biostimulation with 10% was more cost effective due to lower compost addition and the treatment of 5625 m3 of contaminated soil, whereas biostimulation with 40% of compost applied higher compost concentration (four-fold) and treated only 3750 m3 per bioremediation cycle (Figure 1). For biostimulation approaches, manufacturing overhead cost was the second largest contribution to the total costs. In contrast, in bioaugmentation approaches, provision and covering assets were the second and the third largest item costs, suggesting that the technological level of bioaugmentation has a significant impact on its economic performance. The provision cost of bioaugmentation treatments is almost two-fold higher than the provision cost of biostimulation, mainly due to an increase in monitoring and quality control. In addition, there is a high level of costs for equipment and machinery for the culture of microbial strains (Tables S2, S4 and S5).
Furthermore, different scenarios for recovery assets were simulated. When the time length of the start-up investment recovery increased to ten years, the cost per m3 of treated soil decreased more significantly for the bioaugmentation treatments than for the biostimulation treatments (Table S6). All these aspects have unequal impacts on the economic performance of the different bioremediation technologies, highlighting the relevance of this analysis, especially for evaluating profitability under incipient market conditions, such as those for bioremediation in Chile.

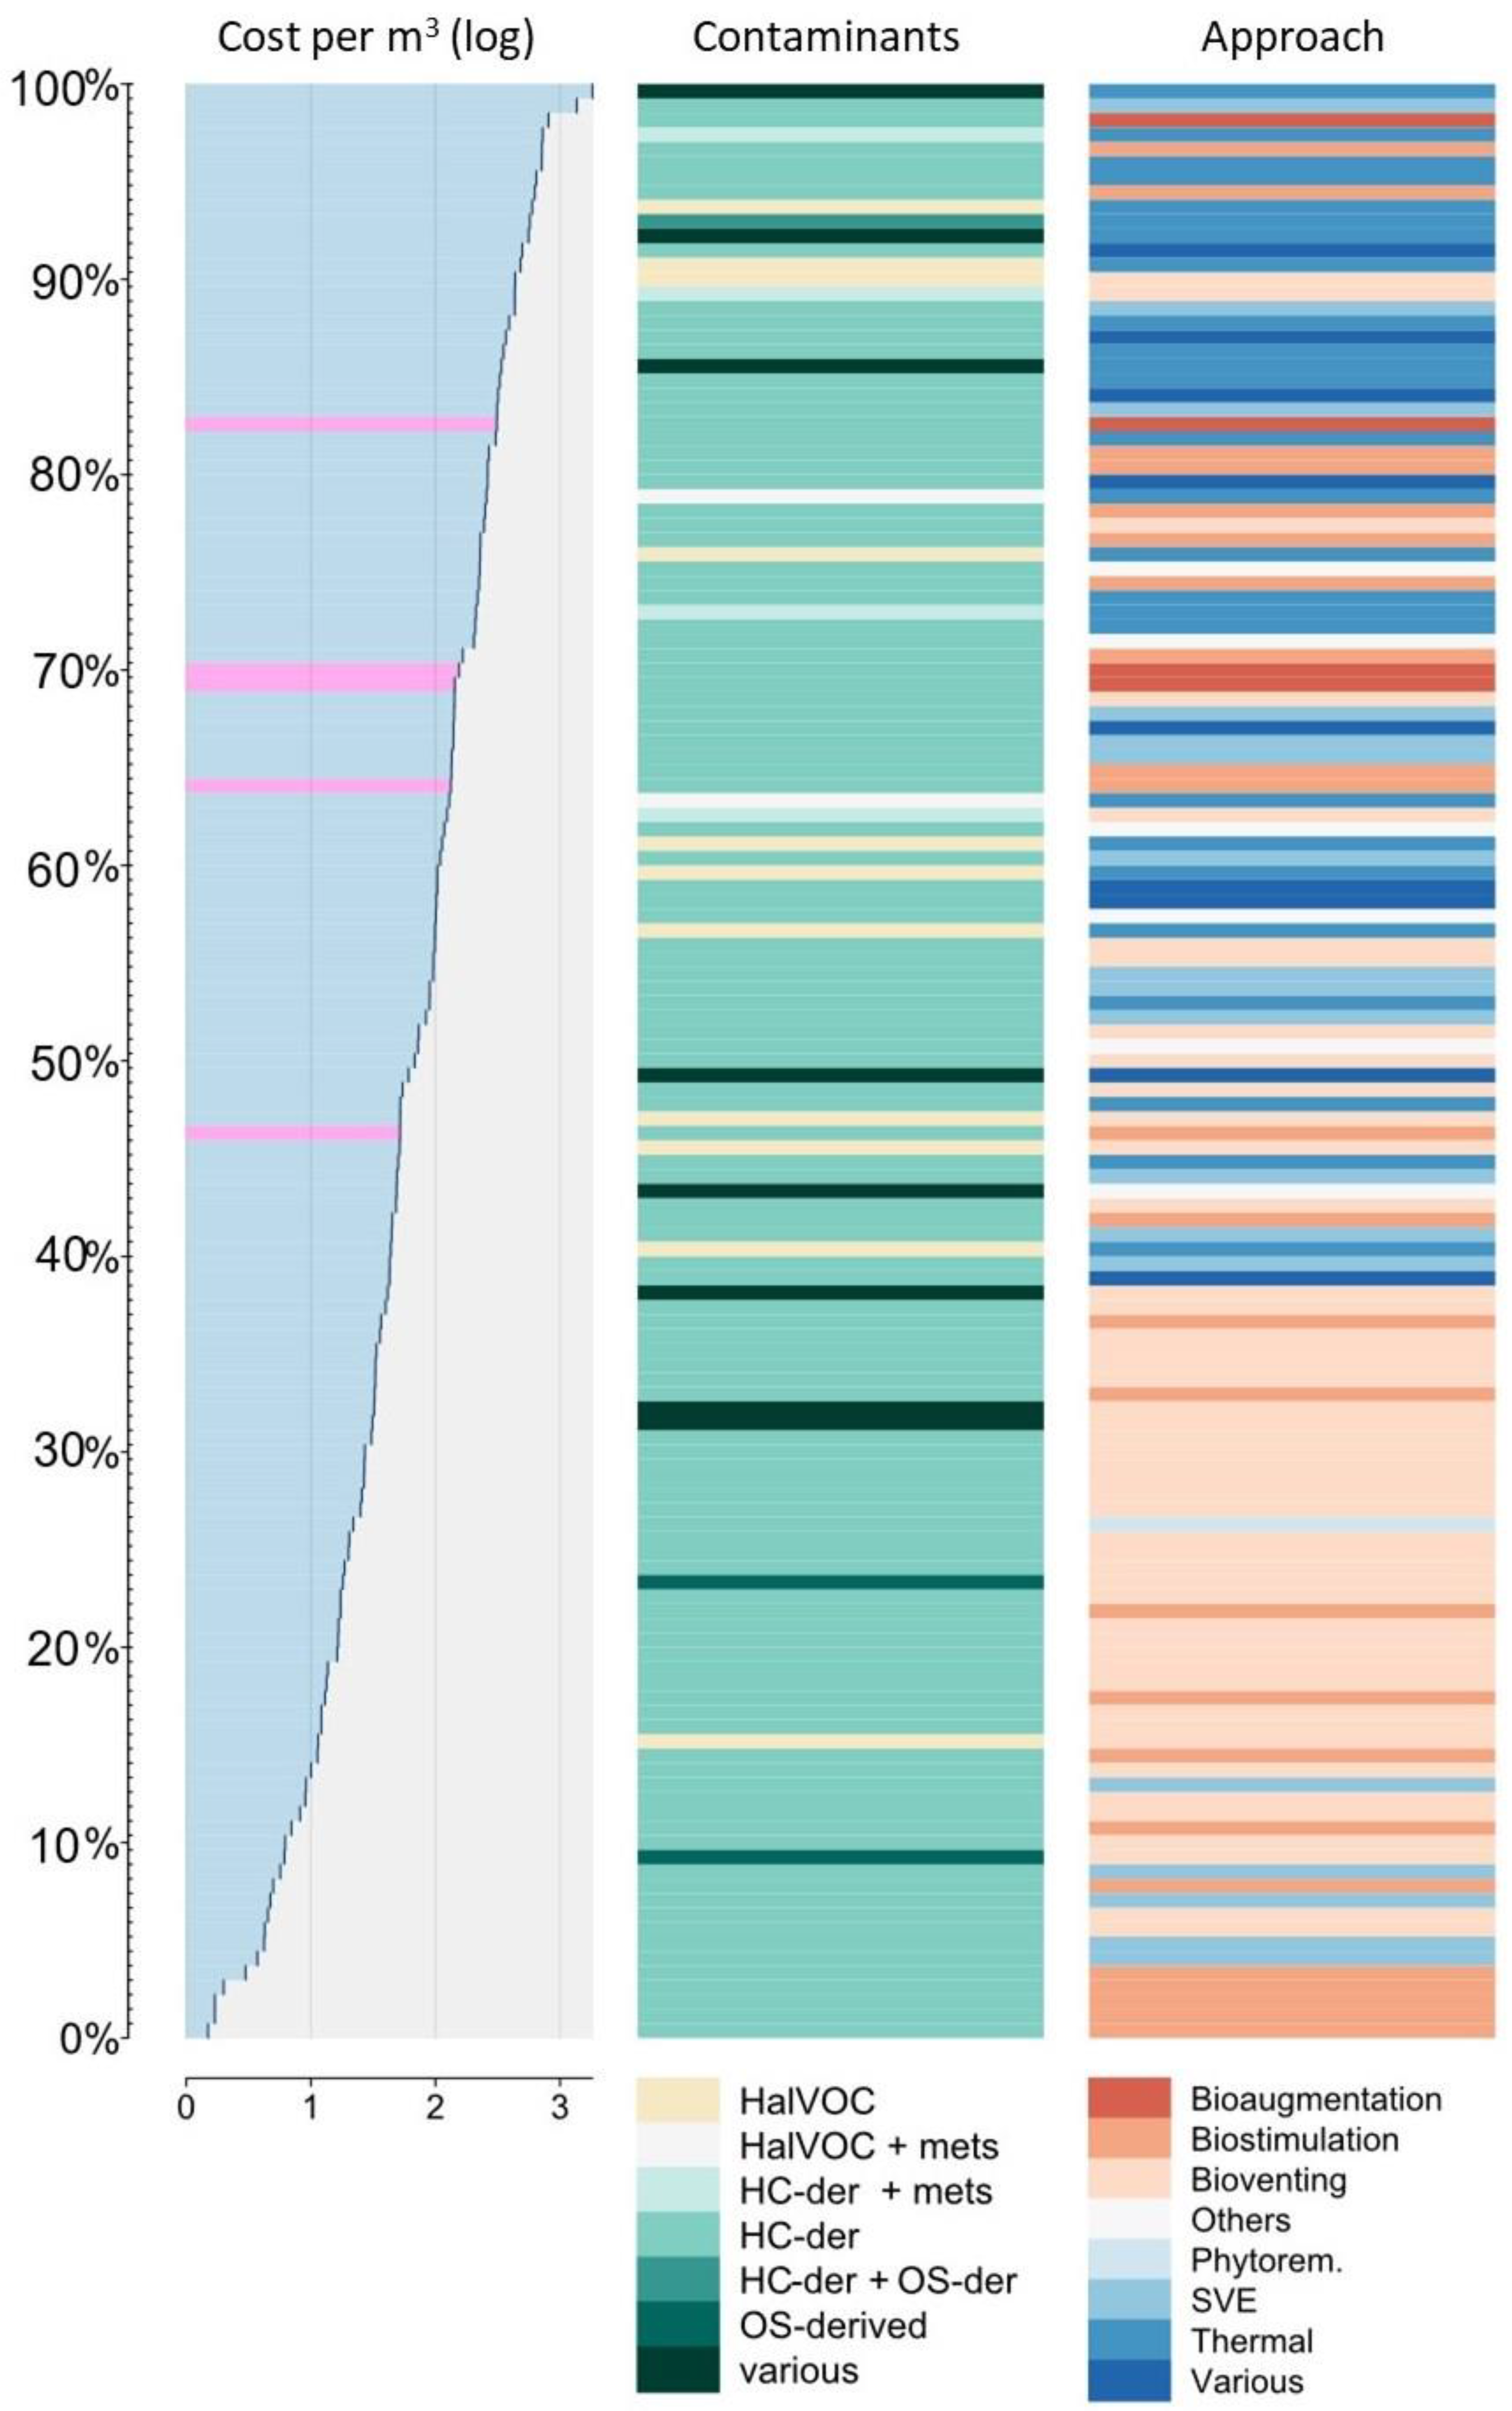
Cost of Bioremediation in Chile and Other Countries

Our results were calculated using average costs in Chile; therefore, they may be highly influenced by domestic dynamics of unrelated sectors rather than those sectors related to the nature of bioremediation. In order to compare our results to worldwide bioremediation operations, we reconstructed an extensive analysis of 130 bioremediation projects of contaminated soils. The analysis included different types of contaminants (e.g., hydrocarbons, organic solvents, halogenated organic compounds, heavy metals), as well as diverse remediation approaches including biostimulation, bioventing, bioaugmentation, solvent vapor extraction and thermal treatments (Table S3).
We determined that the cost of bioremediation was highly variable and ranged between USD 0.5 and USD 1820 per m3 of treated soil. All the projects that registered costs of < USD 2 per m3 of treated soil were associated with treatments based exclusively on biostimulation, and these treatments only removed 50% of hydrocarbons (Table S3). In contrast, projects that reported costs higher than USD 700 per m3 of treated soil involved treatments of a diversity of contaminants, such as BTEX, VOC, PAHs and heavy metals, using a variety of approaches, including biostimulation, bioaugmentation and thermal treatments (Table S3). The distribution of costs of the projects seems to be more influenced by the type of remediation treatment than the type of contaminants in the soil. The 40% of those projects with lower cost (36) were based on bioventing (20), biostimulation (10), solvent vapor extraction (5) and phytoremediation (1). The 60% of projects with higher costs (94) involved approaches such as bioventing (27), thermal (26), solvent vapor extraction (13), biostimulation (12), bioaugmentation (1), other (6) and combined (9) treatments. Costs calculated in our projections fall within this last group, highlighting the important effort involved in bioremediation of chronically contaminated soils (Figure 2). In general, this effort requires reshaping the soil microbiota and dramatically strengthing their biodegradation capabilities towards the most recalcitrant and less bioavailable fractions. In contrast, several projects belonging to the 40% of lower cost are based on bioventing and biostimulation, mainly oriented to metabolize more easily biodegradable pollutants. The cost of our more expensive treatment, BAE (bioaugmentation and biostimulation), was within the top 20% more expensive projects of the dataset, which are enriched by physicochemical aggressive techniques, such as thermal treatments and solvent vapor extraction (Figure 2).

4. Discussion

Far from being a silver bullet, there is not a single bioremediation approach that is useful in all hydrocarbon-contaminated sites [57]. Thus, appropriate characterization of the polluted soils and the adaptation of bioremediation techniques on a case-by-case basis are essential [58]. Adjustments should consider several factors, including technology-specific components, contaminants (type, concentration, aging and distribution), and the physicochemical properties of the soil. As a result of the variability, the design and implementation of bioremediation projects have a direct impact on their capability to evaluate the economic performance, converting this into a daunting task [43]. An initial guide for the evaluation of costs of different bioremediation approaches, such as the one presented here, is relevant not only to compare these alternatives to projects based on excavation and disposal, which is rather easy to grasp, but to integrate this information through management practices to ensure the technical and economic feasibility of bioremediation projects, where the decision making is empirical rather than knowledge based.
This study indicated the cost of bioremediation of chronically hydrocarbon-contaminated soils by different approaches in a country with neither developed environmental remediation industry, nor economic policies that help to determine the treatments costs. The cost of the bioremediation of chronically hydrocarbon-contaminated soils was estimated to be between USD 50.7 and USD 310.4 per m3 of soil. Among those, biostimulation with 10% of compost (BE1) was found to be the most cost-effective treatment. Except for BE1, all other bioremediation costs ranged on values that have been previously reported for biopile bioremediation of hydrocarbon-contaminated soils [59]. Our results showed that biostimulation-based treatments have lower costs than their counterparts using bioaugmentation. Specifically, the comparison between all bioaugmented treatments and BE1 revealed that the last treatment, though effective in hydrocarbon biodegradation [52], showed a significant reduction in direct material costs, provision and covering assets. This highlights the properties of compost, which is the mature product of composting, a bioprocess that transform solid organic substrates into relatively stable, organic-rich material via microbial communities [60]. Amendments with compost are considered a blend between the addition of nutrients and microorganisms with enzymatic composition and metabolic capabilities to biodegrade persistent compounds [50]. The first production of compost based on organic urban waste was dated as early as about 6000 years ago, when humans transitioned from being gatherers and hunters to breeders and farmers before establishing themselves in urban settlements [61]. Since then, compost has been widely applied in agricultural fields as a source of limiting nutrients for crops, such as nitrogen and phosphorus [62,63,64,65], amendments to reducing soil-borne crop diseases [66,67], and as a way of enhancing soil fertility by increasing natural nutrient cycling [68] in both conventional and organic agriculture [69]. The applications of compost have expanded to other fields, such as control of soil erosion [70], carbon sequestration [71], greenhouse gases biofiltration [72] and enhanced bioremediation [46,73]. Indeed, their application in bioremediation of organic contaminants has exponentially increased over the years [74,75]. However, in Chile, compost currently maintains a low price, since it does not compete with alternative uses besides turf/grass industries and organic-based agriculture. Therefore, the potential impact of higher demand for compost on the cost of biostimulation-based bioremediation remain to be examined in further detail. In contrast, the requirements of equipment and supplies for cultivation of high volumes of microbial biomass, as well as monitoring and quality controls converts bioaugmentation to a more expensive process. These results should be analyzed cautiously as a higher control level of remediation, including addressing the level of success of bioaugmentation and/or biostimulation in supplying hydrocarbon-degrading microorganisms, which may increase the efficiency of the process, but also may raise the bioremediation costs. Further analysis towards analyzing the impact of critical variables on the efficiency and efficacy of bioremediation are beyond the scope of the current work, however, they remain to be examined in future.
The economic evaluation of microbial bioremediation of chronically contaminated soils presented in this study will contribute to improvements in the understanding of how costs vary for each bioremediation approach, and therefore, they may be used as an input for risk–cost–benefit analysis. This is especially relevant in an industry that focuses its efforts on facing environmental remediation liabilities that occurred in the past instead of producing new products or rewarding shareholders [43]. As a whole, the absence of regulation and laws governing the maximum permissible concentrations of contaminants in soils converts the traditional “the polluter pays” to the predominant paradigm in Chile, preventing the advent of alternative paradigms that integrate ecosystem services, such as microbial bioremediation, as a valuable input to support ecological restoration. Furthermore, this framework will help to address similar challenges that other productive sectors have historically faced in Chile, where the controversial tradeoff between economic growth and environmental pollution is still rather frequent [76]. As with many other current sustainability challenges [77], it becomes relevant to establish a debate about regulations and incentive policies to encourage the implementation of local bioremediation industry capable to clean up a high number of polluted sites. Undoubtedly, the technical and scientific dimensions of the debate will have a positive impact on the recent Framework Law for Soils (Ley Marco de Suelos) that, after twenty years of discussion, has advanced to the discussion of several issues, including climate change, land management, land degradation and the prevention of soil contamination [41].

5. Conclusions

During the last few decades, the use of microbial bioremediation as a technology to restore polluted sites has been increasingly applied worldwide. Despite its several technical advances, and the growing need for improved technologies to effectively restore contaminated environments, bioremediation has been scarcely used in Chile. In the present study, the cost of five different bioremediation strategies based on biostimulation and/or bioaugmentation for removing hydrocarbons from chronically contaminated soils in an industrial projected scenario were estimated. The results identified compost and bacterial culture media as the items with the highest cost for biostimulation and bioaugmentation-based approaches, respectively. The comparison of the projected costs with an extensive database of 130 soil bioremediation projects indicate that the treatment costs fall within 60% of the more expensive projects, highlighting the high effort involved in bioremediation of chronically contaminated soils. An initial guide for the evaluation of costs of different bioremediation approaches, such as the one presented here, is relevant not only to compare these alternatives to projects based on excavation and disposal, which is rather easy to grasp, but to integrate this information through management practices to ensure the technical and economic feasibility of bioremediation projects, where the decision making is empirical rather than knowledge based. This framework will also facilitate a debate about regulations and incentive policies to encourage the implementation of local bioremediation industry capable of cleaning up a high number of polluted sites, as well as to improve the decision making of entrepreneurs and consultants, and may help to trigger government-generated environmental policies, regulations and standards for contaminated soils.

Supplementary Materials

The following supporting information can be downloaded at: https://www.mdpi.com/article/10.3390/su141911854/s1, Figure S1: Dimensions of projected soil biopiles for bioremediation; Table S1: Soil volume per hectare treated during each bioremediation cycle; Table S2: Total initial capital of the different bioremediation treatments; Table S3: Cost of 130 bioremediation projects worldwide; Table S4: Products and period costs of the different bioremediation approaches; Table S5: Total machinery depreciation of the different bioremediation treatments; Table S6: Recovery assets of the bioremediation treatments after initial investment recovery. Refs. [44,78,79,80,81,82,83,84,85,86,87,88,89,90,91,92,93,94,95,96,97,98,99,100,101,102,103,104,105,106,107,108,109,110,111,112,113,114,115,116,117,118,119,120,121,122,123,124,125,126,127,128,129,130,131,132,133,134,135,136,137,138,139,140] are cited in supplementary materials.

Author Contributions

Conceptualization, R.O., A.C. and M.S.; methodology, R.O., A.A., S.D., P.P.-G. and M.S.; formal analysis, A.C., S.D., C.R., C.S., P.C., G.A., F.C., F.S., M.G., P.S., J.A.-H. and M.M.; investigation, A.C., S.D., C.R., C.S., P.C., G.A., F.C., F.S., M.G., P.S., J.A.-H. and M.M.; resources, R.O. and M.S.; data curation, A.C., S.D. and A.A.; writing—original draft preparation, R.O., A.C., A.A., S.D. and M.S.; writing—review and editing, R.O., A.A., S.D. and M.S.; visualization, R.O., A.A. and M.S.; funding acquisition, R.O. and M.S. All authors have read and agreed to the published version of the manuscript.

Funding

This research was funded by Conicyt Programa de Inserción a la Academia “Fortalecimiento de la Investigación y la Docencia en las Áreas de Microbiología Ambiental y Bioinformática de la Universidad de Playa Ancha” grant PAI79170091 (R.O.), “Apoyo a la Formación de Redes Internacionales para Investigadores en Etapa Inicial” grant 170600 (R.O., M.S.), ANID PIA Ring GAMBIO Genomics and Applied Microbiology for Biodegradation and Bioproducts” grant ACT172128 Chile (MS), Fondecyt grants 11190863 (R.O.) and 1200756 (M.S.), and Inmobiliaria Las Salinas grant (M.S.), Beca de Doctorado ANID 21191625 and Programa de Incentivos a la Iniciación Científica, UTFSM (A.C.).

Institutional Review Board Statement

Not applicable.

Conflicts of Interest

The authors declare no conflict of interest.

References

  1. Fuentes, S.; Méndez, V.; Aguila, P.; Seeger, M. Bioremediation of petroleum hydrocarbons: Catabolic genes, microbial communities, and applications. Appl. Microbiol. Biotechnol. 2014, 98, 4781–4794. [Google Scholar] [CrossRef] [PubMed]
  2. Wartell, B.; Boufadel, M.; Rodriguez-Freire, L. An effort to understand and improve the anaerobic biodegradation of petroleum hydrocarbons: A literature review. Int. Biodeterior. Biodegrad. 2021, 157, 105156. [Google Scholar] [CrossRef]
  3. Orellana, R.; Macaya, C.; Bravo, G.; Dorochesi, F.; Cumsille, A.; Valencia, R.; Rojas, C.; Seeger, M. Living at the Frontiers of Life: Extremophiles in Chile and Their Potential for Bioremediation. Front. Microbiol. 2018, 9, 2309. [Google Scholar] [CrossRef] [PubMed]
  4. Fuentes, S.; Barra, B.; Caporaso, J.G.; Seeger, M. From Rare to Dominant: A Fine-Tuned Soil Bacterial Bloom during Petroleum Hydrocarbon Bioremediation. Appl. Environ. Microbiol. 2016, 82, 888–896. [Google Scholar] [CrossRef]
  5. Yergeau, E.; Sanschagrin, S.; Beaumier, D.; Greer, C.W. Metagenomic Analysis of the Bioremediation of Diesel-Contaminated Canadian High Arctic Soils. PLoS ONE 2012, 7, e30058. [Google Scholar] [CrossRef]
  6. Atlas, R.M.; Hazen, T.C. Oil Biodegradation and Bioremediation: A Tale of the Two Worst Spills in U.S. History. Environ. Sci. Technol. 2011, 45, 6709–6715. [Google Scholar] [CrossRef]
  7. Hamamura, N.; Ward, D.M.; Inskeep, W.P. Effects of petroleum mixture types on soil bacterial population dynamics associated with the biodegradation of hydrocarbons in soil environments. FEMS Microbiol. Ecol. 2013, 85, 168–178. [Google Scholar] [CrossRef]
  8. Zheng, J.; Feng, J.-Q.; Zhou, L.; Mbadinga, S.M.; Gu, J.-D.; Mu, B.-Z. Characterization of bacterial composition and diversity in a long-term petroleum contaminated soil and isolation of high-efficiency alkane-degrading strains using an improved medium. World J. Microbiol. Biotechnol. 2018, 34, 34. [Google Scholar] [CrossRef]
  9. Apul, O.G.; Arrowsmith, S.; Hall, C.A.; Miranda, E.M.; Alam, F.; Dahlen, P.; Sra, K.; Kamath, R.; McMillen, S.J.; Sihota, N.; et al. Biodegradation of petroleum hydrocarbons in a weathered, unsaturated soil is inhibited by peroxide oxidants. J. Hazard. Mater. 2022, 433, 128770. [Google Scholar] [CrossRef]
  10. Mohapatra, B.; Dhamale, T.; Saha, B.K.; Phale, P.S. Chapter 18—Microbial degradation of aromatic pollutants: Metabolic routes, pathway diversity, and strategies for bioremediation. In Microbial Biodegradation and Bioremediation, 2nd ed.; Das, S., Dash, H.R., Eds.; Elsevier: Amsterdam, The Netherlands, 2022; pp. 365–394. [Google Scholar]
  11. Lovley, D.R. Cleaning up with genomics: Applying molecular biology to bioremediation. Nat. Rev. Microbiol. 2003, 1, 35–44. [Google Scholar] [CrossRef]
  12. Guermouche M’rassi, A.; Bensalah, F.; Gury, J.; Duran, R. Isolation and characterization of different bacterial strains for bioremediation of n-alkanes and polycyclic aromatic hydrocarbons. Environ. Sci. Pollut. Res. 2015, 22, 15332–15346. [Google Scholar] [CrossRef] [PubMed]
  13. Ehis-Eriakha, C.B.; Chikere, C.B.; Akaranta, O. Functional Gene Diversity of Selected Indigenous Hydrocarbon-Degrading Bacteria in Aged Crude Oil. Int. J. Microbiol. 2020, 2020, 2141209. [Google Scholar] [CrossRef] [PubMed]
  14. Wu, B.; Deng, J.; Niu, H.; Liang, J.; Arslan, M.; Gamal El-Din, M.; Wang, Q.; Guo, S.; Chen, C. Establishing and Optimizing a Bacterial Consortia for Effective Biodegradation of Petroleum Contaminants: Advancing Classical Microbiology via Experimental and Mathematical Approach. Water 2021, 13, 3311. [Google Scholar] [CrossRef]
  15. Mangimbulude, J.C.; Lembang, R.K. Biostimulation and Bioaugmentation: An Alternative Strategy for Bioremediation of Ground Water Contaminated Mixed Landfill Leachate and Sea Water in Low Income ASEAN Countries. In Handbook of Environmental Materials Management; Hussain, C.M., Ed.; Springer International Publishing: Cham, Switzerland, 2019; pp. 515–533. [Google Scholar]
  16. Dominati, E.; Patterson, M.; Mackay, A. A framework for classifying and quantifying the natural capital and ecosystem services of soils. Ecol. Econ. 2010, 69, 1858–1868. [Google Scholar] [CrossRef]
  17. Prince, R.C.; Drake, E.N. Transformation and Fate of Polycyclic Aromatic Hydrocarbons in Soil. In Bioremediation of Contaminated Soils; American Society of Agronomy, Inc.: Madison, WI, USA, 1999; pp. 89–110. [Google Scholar]
  18. Abed, R.M.M. Interaction between cyanobacteria and aerobic heterotrophic bacteria in the degradation of hydrocarbons. Int. Biodeterior. Biodegrad. 2010, 64, 58–64. [Google Scholar] [CrossRef]
  19. Almansoory, A.F.; Hasan, H.A.; Abdullah, S.R.S.; Idris, M.; Anuar, N.; Al-Adiwish, W.M. Biosurfactant produced by the hydrocarbon-degrading bacteria: Characterization, activity and applications in removing TPH from contaminated soil. Environ. Technol. Innov. 2019, 14, 100347. [Google Scholar] [CrossRef]
  20. Prince, R.C.; Amande, T.J.; McGenity, T.J. Prokaryotic Hydrocarbon Degraders. In Taxonomy, Genomics and Ecophysiology of Hydrocarbon-Degrading Microbes; McGenity, T.J., Ed.; Springer International Publishing: Cham, Switzerland, 2019; pp. 1–39. [Google Scholar]
  21. Hashmat, A.J.; Afzal, M.; Fatima, K.; Anwar-ul-Haq, M.; Khan, Q.M.; Arias, C.A.; Brix, H. Characterization of Hydrocarbon-Degrading Bacteria in Constructed Wetland Microcosms Used to Treat Crude Oil Polluted Water. Bull. Environ. Contam. Toxicol. 2019, 102, 358–364. [Google Scholar] [CrossRef]
  22. Zvomuya, F.; Murata, A.P. Soil Contamination and Remediation. In Encyclopedia of Environmetrics; John Wiley & Sons: Hoboken, NJ, USA, 2001. [Google Scholar]
  23. Van Liedekerke, M.; Prokop, G.; Rabl-Berger, S.; Kibblewhite, M.; Louwagie, G. Progress in the Management of Contaminated Sites in Europe; Publications Office of the European Union: Luxembourg, 2014. [Google Scholar]
  24. The State Council of the People’s Republic of China. National Plan for Adjustment and Reconstruction of Old Industrial Bases (2013–2022); The State Council of the People’s Republic of China: Beijing, China, 2013.
  25. Koshlaf, E.; Ball, A.S. Soil bioremediation approaches for petroleum hydrocarbon polluted environments. AIMS Microbiol. 2017, 3, 25–49. [Google Scholar] [CrossRef]
  26. Li, X.N.; Jiao, W.T.; Xiao, R.B.; Chen, W.P.; Chang, A.C. Soil pollution and site remediation policies in China: A review. Environ. Rev. 2015, 23, 263–274. [Google Scholar] [CrossRef]
  27. Singh, A.; Kuhad, R.C.; Ward, O.P. Biological Remediation of Soil: An Overview of Global Market and Available Technologies. In Advances in Applied Bioremediation; Singh, A., Kuhad, R.C., Ward, O.P., Eds.; Springer: Berlin/Heidelberg, Germany, 2009; pp. 1–19. [Google Scholar]
  28. BCC Bioremediation: Global Markets and Technologies to 2023. Available online: https://www.bccresearch.com/market-research/environment/bioremediation.html#:~:text=The%20global%20bioremediation%20market%20should,15.4%25%20from%202018%20through%202023 (accessed on 5 October 2021).
  29. Ministerio del Medio Ambiente. Quinto Reporte del Estado del Medio Ambiente; Ministerio del Medio Ambiente: Puente Alto, Chile, 2019; p. 269.
  30. Oyarzún, J.; Oyarzún, R. Sustainable development threats, inter-sector conflicts and environmental policy requirements in the arid, mining rich, northern Chile territory. Sustain. Dev. 2011, 19, 263–274. [Google Scholar] [CrossRef]
  31. Tapia, J.S.; Valdés, J.; Orrego, R.; Tchernitchin, A.; Dorador, C.; Bolados, A.; Harrod, C. Geologic and anthropogenic sources of contamination in settled dust of a historic mining port city in northern Chile: Health risk implications. PeerJ 2018, 6, e4699. [Google Scholar] [CrossRef] [PubMed]
  32. Lam, E.J.; Montofré, I.L.; Álvarez, F.A.; Gaete, N.F.; Poblete, D.A.; Rojas, R.J. Methodology to Prioritize Chilean Tailings Selection, According to Their Potential Risks. Int. J. Environ. Res. Public Health 2020, 17, 3948. [Google Scholar] [CrossRef] [PubMed]
  33. Donoso, G.; Cancino, J.; Magri, A. Effects of agricultural activities on water pollution with nitrates and pesticides in the Central Valley of Chile. Water Sci. Technol. 1999, 39, 49–60. [Google Scholar] [CrossRef]
  34. Melo, O.; Quiñones, N.B.; Acuña, D. Towards Sustainable Agriculture in Chile, Reflections on the Role of Public Policy. Int. J. Agric. Nat. Resour. 2021, 48, 186–209. [Google Scholar] [CrossRef]
  35. Henriquez, M.; Becerra, J.; Barra, R.; Rojas, J. Hydrocarbons and organochlorine pesticides in soils of the Urban ecosystem of Chillán and Chillán Viejo, Chile. J. Chil. Chem. Soc. 2006, 51, 938–944. [Google Scholar] [CrossRef]
  36. Barra, R.; Quiroz, R.; Saez, K.; Araneda, A.; Urrutia, R.; Popp, P. Sources of polycyclic aromatic hydrocarbons (PAHs) in sediment of the Biobio River in south central Chile. Environ. Chem. Lett. 2008, 7, 133–139. [Google Scholar] [CrossRef]
  37. Deelaman, W.; Pongpiachan, S.; Tipmanee, D.; Choochuay, C.; Iadtem, N.; Suttinun, O.; Wang, Q.; Xing, L.; Li, G.; Han, Y.; et al. Source identification of polycyclic aromatic hydrocarbons in terrestrial soils in Chile. J. S. Am. Earth Sci. 2020, 99, 102514. [Google Scholar] [CrossRef]
  38. Oyarzo-Miranda, C.; Latorre, N.; Meynard, A.; Rivas, J.; Bulboa, C.; Contreras-Porcia, L. Coastal pollution from the industrial park Quintero bay of central Chile: Effects on abundance, morphology, and development of the kelp Lessonia spicata (Phaeophyceae). PLoS ONE 2020, 15, e0240581. [Google Scholar] [CrossRef]
  39. Fundacion Chile. Guía Metodológica para la Gestión de Suelos con Potencial Presencia de Contaminantes; Fundacion Chile: Santiago, Chile, 2015; p. 127. [Google Scholar]
  40. Neaman, A.; Valenzuela, P.; Tapia-Gatica, J.; Selles, I.; Novoselov, A.A.; Dovletyarova, E.A.; Yáñez, C.; Krutyakov, Y.A.; Stuckey, J.W. Chilean regulations on metal-polluted soils: The need to advance from adapting foreign laws towards developing sovereign legislation. Environ. Res. 2020, 185, 109429. [Google Scholar] [CrossRef]
  41. Salazar, O.; Casanova, M.; Fuentes, J.P.; Galleguillos, M.; Nájera, F.; Perez-Quezada, J.F.; Pfeiffer, M.; Renwick, L.L.R.; Seguel, O.; Tapia, Y. Soil research, management, and policy priorities in Chile. Geoderma Reg. 2022, 29, e00502. [Google Scholar] [CrossRef]
  42. Bartke, S. Valuation of market uncertainties for contaminated land. Int. J. Strateg. Prop. Manag. 2011, 15, 356–378. [Google Scholar] [CrossRef]
  43. Steffan, R.J. Developing Bioremediation Technologies for Commercial Application: An Insider’s View. In Consequences of Microbial Interactions with Hydrocarbons, Oils, and Lipids: Biodegradation and Bioremediation; Steffan, R.J., Ed.; Springer International Publishing: Cham, Switzerland, 2019; pp. 21–32. [Google Scholar]
  44. Brown, D.M.; Okoro, S.; van Gils, J.; van Spanning, R.; Bonte, M.; Hutchings, T.; Linden, O.; Egbuche, U.; Bruun, K.B.; Smith, J.W.N. Comparison of landfarming amendments to improve bioremediation of petroleum hydrocarbons in Niger Delta soils. Sci Total Environ. 2017, 596–597, 284–292. [Google Scholar] [CrossRef]
  45. Brassington, K.J.; Pollard, S.J.T.; Coulon, F. Weathered Hydrocarbon Biotransformation: Implications for Bioremediation, Analysis, and Risk Assessment. In Handbook of Hydrocarbon and Lipid Microbiology; Timmis, K.N., Ed.; Springer: Berlin/Heidelberg, Germany, 2010; pp. 2487–2499. [Google Scholar]
  46. Semple, K.T.; Reid, B.J.; Fermor, T.R. Impact of composting strategies on the treatment of soils contaminated with organic pollutants. Environ. Pollut. 2001, 112, 269–283. [Google Scholar] [CrossRef]
  47. Trindade, P.V.O.; Sobral, L.G.; Rizzo, A.C.L.; Leite, S.G.F.; Soriano, A.U. Bioremediation of a weathered and a recently oil-contaminated soils from Brazil: A comparison study. Chemosphere 2005, 58, 515–522. [Google Scholar] [CrossRef] [PubMed]
  48. Dias, R.L.; Ruberto, L.; Calabró, A.; Balbo, A.L.; Del Panno, M.T.; Mac Cormack, W.P. Hydrocarbon removal and bacterial community structure in on-site biostimulated biopile systems designed for bioremediation of diesel-contaminated Antarctic soil. Polar Biol. 2015, 38, 677–687. [Google Scholar] [CrossRef]
  49. Gentry, T.; Rensing, C.; Pepper, I.A.N. New Approaches for Bioaugmentation as a Remediation Technology. Crit. Rev. Environ. Sci. Technol. 2004, 34, 447–494. [Google Scholar] [CrossRef]
  50. Kästner, M.; Miltner, A. Application of compost for effective bioremediation of organic contaminants and pollutants in soil. Appl. Microbiol. Biotechnol. 2016, 100, 3433–3449. [Google Scholar] [CrossRef]
  51. Antizar-Ladislao, B.; Lopez-Real, J.; Beck, A. Bioremediation of Polycyclic Aromatic Hydrocarbon (PAH)-Contaminated Waste Using Composting Approaches. Crit. Rev. Environ. Sci. Technol. 2004, 34, 249–289. [Google Scholar] [CrossRef]
  52. Orellana, R.; Cumsille, A.; Rojas, C.; Cabrera, P.; Seeger, M.; Cárdenas, F.; Stuardo, C.; González, M. Assessing technical and economic feasibility of complete bioremediation for soils chronically polluted with petroleum hydrocarbons. J. Bioremediat. Biodegrad. 2017, 8, 396. [Google Scholar] [CrossRef]
  53. Méndez, V.; Fuentes, S.; Morgante, V.; Hernández, M.; González, M.; Moore, E.; Seeger, M. Novel hydrocarbonoclastic metal-tolerant Acinetobacter and Pseudomonas strains from Aconcagua river oil-polluted soil. J. Soil Sci. Plant Nutr. 2017, 17, 1074–1087. [Google Scholar] [CrossRef] [Green Version]
  54. Macaya, C.C.; Méndez, V.; Durán, R.E.; Aguila-Torres, P.; Salvà-Serra, F.; Jaén-Luchoro, D.; Moore, E.R.B.; Seeger, M. Complete Genome Sequence of Hydrocarbon-Degrading Halotolerant Acinetobacter radioresistens DD78, Isolated from the Aconcagua River Mouth in Central Chile. Microbiol. Resour. Announc. 2019, 8, e00601-19. [Google Scholar] [CrossRef] [PubMed]
  55. Forsyth, J.V.; Tsao, Y.M.; Bleam, R.D. Bioremediation: When Is Augmentation Needed? Battelle Press: Columbus, OH, USA, 1995; pp. 1–14. [Google Scholar]
  56. Peters, M.; Timmerhaus, K.; West, R. Plant Design and Economics for Chemical Engineers; McGraw-Hill: New York, NY, USA, 1991; pp. 150–215. [Google Scholar]
  57. Azubuike, C.C.; Chikere, C.B.; Okpokwasili, G.C. Bioremediation techniques–classification based on site of application: Principles, advantages, limitations and prospects. World J. Microbiol. Biotechnol. 2016, 32, 180. [Google Scholar] [CrossRef] [PubMed]
  58. Sales da Silva, I.G.; Gomes de Almeida, F.C.; Padilha da Rocha e Silva, N.M.; Casazza, A.A.; Converti, A.; Asfora Sarubbo, L. Soil Bioremediation: Overview of Technologies and Trends. Energies 2020, 13, 4664. [Google Scholar] [CrossRef]
  59. Nagkirti, P.; Shaikh, A.; Vasudevan, G.; Paliwal, V.; Dhakephalkar, P. Bioremediation of Terrestrial Oil Spills: Feasibility Assessment. In Optimization and Applicability of Bioprocesses; Purohit, H.J., Kalia, V.C., Vaidya, A.N., Khardenavis, A.A., Eds.; Springer: Singapore, 2017; pp. 141–173. [Google Scholar]
  60. Loick, N.; Hobbs, P.J.; Hale, M.D.C.; Jones, D.L. Bioremediation of Poly-Aromatic Hydrocarbon (PAH)-Contaminated Soil by Composting. Crit. Rev. Environ. Sci. Technol. 2009, 39, 271–332. [Google Scholar] [CrossRef]
  61. Diaz, L.F.; de Bertoldi, M. History of composting. In Waste Management Series; Diaz, L.F., de Bertoldi, M., Bidlingmaier, W., Stentiford, E., Eds.; Elsevier: Amsterdam, The Netherlands, 2007; Volume 8, pp. 7–24. [Google Scholar]
  62. Shrestha, P.; Small, G.E.; Kay, A. Quantifying nutrient recovery efficiency and loss from compost-based urban agriculture. PLoS ONE 2020, 15, e0230996. [Google Scholar] [CrossRef]
  63. Erhart, E.; Hartl, W.; Putz, B. Biowaste compost affects yield, nitrogen supply during the vegetation period and crop quality of agricultural crops. Eur. J. Agron. 2005, 23, 305–314. [Google Scholar] [CrossRef]
  64. Ahmad, R.; Naveed, M.; Aslam, M.; Zahir, Z.A.; Arshad, M.; Jilani, G. Economizing the use of nitrogen fertilizer in wheat production through enriched compost. Renew. Agric. Food Syst. 2008, 23, 243–249. [Google Scholar] [CrossRef]
  65. Machado, R.M.A.; Alves-Pereira, I.; Faty, Y.; Perdigão, S.; Ferreira, R. Influence of Nitrogen Sources Applied by Fertigation to an Enriched Soil with Organic Compost on Growth, Mineral Nutrition, and Phytochemicals Content of Coriander (Coriandrum sativum L.) in Two Successive Harvests. Plants 2021, 11, 22. [Google Scholar] [CrossRef]
  66. Mehta, C.M.; Palni, U.; Franke-Whittle, I.H.; Sharma, A.K. Compost: Its role, mechanism and impact on reducing soil-borne plant diseases. Waste Manag. 2014, 34, 607–622. [Google Scholar] [CrossRef]
  67. Litterick, A.M.; Harrier, L.; Wallace, P.; Watson, C.A.; Wood, M. The Role of Uncomposted Materials, Composts, Manures, and Compost Extracts in Reducing Pest and Disease Incidence and Severity in Sustainable Temperate Agricultural and Horticultural Crop Production—A Review. Crit. Rev. Plant Sci. 2004, 23, 453–479. [Google Scholar] [CrossRef]
  68. Sánchez-Monedero, M.A.; Cayuela, M.L.; Sánchez-García, M.; Vandecasteele, B.; D’Hose, T.; López, G.; Martínez-Gaitán, C.; Kuikman, P.J.; Sinicco, T.; Mondini, C. Agronomic Evaluation of Biochar, Compost and Biochar-Blended Compost across Different Cropping Systems: Perspective from the European Project FERTIPLUS. Agronomy 2019, 9, 225. [Google Scholar] [CrossRef]
  69. Dsouza, A.; Price, G.W.; Dixon, M.; Graham, T. A Conceptual Framework for Incorporation of Composting in Closed-Loop Urban Controlled Environment Agriculture. Sustainability 2021, 13, 2471. [Google Scholar] [CrossRef]
  70. Adugna, G. A review on impact of compost on soil properties, water use and crop productivity. Agric. Sci. Res. J. 2018, 4, 93–104. [Google Scholar]
  71. Hill, M.J.; Braaten, R.; McKeon, G.M. A scenario calculator for effects of grazing land management on carbon stocks in Australian rangelands. Environ. Model. Softw. 2003, 18, 627–644. [Google Scholar] [CrossRef]
  72. Nikiema, J.; Brzezinski, R.; Heitz, M. Elimination of methane generated from landfills by biofiltration: A review. Rev. Environ. Sci. Bio/Technol. 2007, 6, 261–284. [Google Scholar] [CrossRef]
  73. Lu, Y.; Zheng, G.; Zhou, W.; Wang, J.; Zhou, L. Bioleaching conditioning increased the bioavailability of polycyclic aromatic hydrocarbons to promote their removal during co-composting of industrial and municipal sewage sludges. Sci. Total Environ. 2019, 665, 1073–1082. [Google Scholar] [CrossRef] [PubMed]
  74. Lin, C.; Cheruiyot, N.K.; Bui, X.-T.; Ngo, H.H. Composting and its application in bioremediation of organic contaminants. Bioengineered 2022, 13, 1073–1089. [Google Scholar] [CrossRef]
  75. Cai, Q.-Y.; Mo, C.-H.; Wu, Q.-T.; Zeng, Q.-Y.; Katsoyiannis, A.; Férard, J.-F. Bioremediation of polycyclic aromatic hydrocarbons (PAHs)-contaminated sewage sludge by different composting processes. J. Hazard. Mater. 2007, 142, 535–542. [Google Scholar] [CrossRef]
  76. Reyes-Bozo, L.; Godoy-Faundez, A.; Herrera-Urbina, R.; Higueras, P.; Salazar Navarrete, J.L.; Valdés-González, H.; Vyhmeister, E.; Antizar-Ladislao, B. Greening Chilean copper mining operations through industrial ecology strategies. J. Clean. Prod. 2014, 84, 671. [Google Scholar] [CrossRef]
  77. D’Adamo, I.; Gastaldi, M.; Morone, P.; Rosa, P.; Sassanelli, C.; Settembre-Blundo, D.; Shen, Y. Bioeconomy of Sustainability: Drivers, Opportunities and Policy Implications. Sustainability 2022, 14, 200. [Google Scholar] [CrossRef]
  78. EPA (United States Environmental Protection Agency). Remediation Technology Cost Compendium [Electronic Resource]: Year 2000; Office of Solid Waste and Emergency Response, Technology Innovation Office: Washington, DC, USA, 2001. [Google Scholar]
  79. EPA (United States Environmental Protection Agency). Soil Vapor Extraction at the Hastings Groundwater Contamination Superfund Site, Well Number 3 Subsite, Hastings, Nebraska. Cost and Performance Report. 1995. Available online: https://frtr.gov/costperformance/profile.cfm?ID=104&CaseID=104 (accessed on 17 July 2022).
  80. Leeson, A.P.; Graves, M.; Kramer, J. Site-Specific Technical Report for Bioslurper Testing at Site ST-04, K.I. Sawyer AFB; Battelle: Columbus, OH, USA, 1996. [Google Scholar]
  81. EPA (United States Environmental Protection Agency). Bioremediation Field Evaluation of Hill Air Force Base, Utah; EPA: Washington, DC, USA, 1997. [Google Scholar]
  82. EPA (United States Environmental Protection Agency). Cost and Performance Summary Report Soil Vapor Extraction at the Intersil/Siemens Superfund Site Cupertino, California; EPA: Washington, DC, USA, 1998. [Google Scholar]
  83. EPA (United States Environmental Protection Agency). Remediation Case Studies: In Situ Soil Treatment Technologies, (Soil Vapor Extraction, Thermal Processes) Volume 8; EPA: Cincinatti, OH, USA, 1998. [Google Scholar]
  84. EPA (United States Environmental Protection Agency). Installation Restoration Program. LF-036 Groundwater Surface Water and Sediments; Record of Decision Plattsburgh Air Force Base; EPA: Washington, DC, USA, 1995. [Google Scholar]
  85. Baxter, L.; Dossey, R.; Eastty, B.; Lamb, R.E.; Lush, A.; McCain, S.; Myers, C.; Nowick, M.; Smith, S.; Stetson, J. Final Environmental Assessment Addressing Construction of a Fitness Center at Beale Air Force Base, California; HDR Environmental, Operations and Construction Inc.: Englewood, CO, USA, 2009. [Google Scholar]
  86. Engineering Science, Inc. Part 1: Bioventing Pilot Test Work Plan for Installation Restoration Program Site 3, Fire Training Area, Battle Creek ANGB, Michigan. PART II: Draft Interim Pilot Test Results Report for Installation Restoration Program Site 3, Fire Training Area, Battle Creek ANGB, Michigan. 1992. Available online: https://apps.dtic.mil/sti/pdfs/ADA385759.pdf (accessed on 10 July 2022).
  87. EPA (United States Environmental Protection Agency). Soil Vapor Extraction at the Rocky Mountain Arsenal Superfund Site, Motor Pool Area (OU 18), Commerce City, Colorado; EPA: Washington, DC, USA, 1995. [Google Scholar]
  88. Wan, X.; Lei, M.; Chen, T. Cost–benefit calculation of phytoremediation technology for heavy-metal-contaminated soil. Sci. Total Environ. 2016, 563–564, 796–802. [Google Scholar] [CrossRef] [PubMed]
  89. Line, M.A.; Garland, C.D.; Crowley, M. Evaluation of landfarm remediation of hydrocarbon-contaminated soil at the inveresk railyard, Launceston, Australia. Waste Manag. 1996, 16, 567–570. [Google Scholar] [CrossRef]
  90. Parsons Engineering Science Inc. Natural Attenuation of Chlorinated Solvents Performance and Cosr Results from Multiple Air Force Demonstration Sites; Parsons Engineering Science Inc.: Denver, CO, USA, 1999. [Google Scholar]
  91. Hinchee, R.; Downey, D.; Slaughter, J.; Selby, D.; Westray, M.; Long, G. Enhanced Bioreclamation of Jet Fuels: A Full-Scale Test at Eglin AFB, Florida. 1989, p. 164. Available online: https://www.researchgate.net/publication/235176012_Enhanced_Bioreclamation_of_Jet_Fuels_A_Full-Scale_Test_at_Eglin_AFB_Florida (accessed on 17 July 2022).
  92. EPA (United States Environmental Protection Agency). Use of Bioremediation at Superfund Sites; EPA: Washington, DC, USA, 2001. [Google Scholar]
  93. Wendell, S.J.; Johnson, K.; Sawyer, M.; Kelly, L.; Hellauer, K.; Schneider, R.L.; Gomez, C.; Perry, A.; Bates, S. Final Cannon AFB Housing Privatization Environmental Assessment; Geo-Marine Inc.: Plano, TX, USA, 2009. [Google Scholar]
  94. Parsons Engineering Science Inc. Intrinsic Remediation Engineering Evaluation/Cost Analysis for the Former Car Care Center, Bolling Air Force Base, Washington, District of Columbia; Parsons Engineering Science Inc.: Denver, CO, USA, 1997. [Google Scholar]
  95. EPA (United States Environmental Protection Agency). Application, Performance, and Cost of Biotreatment Technologies for Contaminated Soils; EPA: Washington, DC, USA, 2002. [Google Scholar]
  96. UNITED STATES AIR FORCE. Joint Base Elmendorf-Richardson Community Involvenment Plan. 2011. Available online: https://www.jber.jb.mil/Portals/144/Services-Resources/environmental/restoration/Enviornmental-JBER-Community-Involvement-Plan-(2011).pdf (accessed on 10 July 2022).
  97. EPA (United States Environmental Protection Agency). In Situ Bioremediation at Vandenberg Air Force Base, Lompoc, California; EPA: Washington, DC, USA, 2000. [Google Scholar]
  98. EPA (United States Environmental Protection Agency). Cleanup Activities Hanscom Field/Hanscom Air Force Base Bedford, MA; EPA: Washington, DC, USA, 2009. [Google Scholar]
  99. Department of the Air Force. Final Decision Document for no Further Action at B-58 Hustler Burial Site (Area of Concern 8). 2002. Available online: https://semspub.epa.gov/work/05/281571.pdf (accessed on 17 July 2022).
  100. EPA (United States Environmental Protection Agency). Remedial Action Plan for the Risk-Based. Air Force Center for Environmental Excellence Technology Transfer Division Brooks Air Force Base San Antonio, Texas; EPA: Washington, DC, USA, 1996. [Google Scholar]
  101. ESTCP. Electronically induced Redox Barriers for Treatment of Groundwater at F.E. Warren Air Force Base, Wyoming; ESTCP: Arlington, VA, USA, 2006. [Google Scholar]
  102. State of Hawaii, Department of Health. Hazard Evaluation and Emergency Response Office Fiscal Year 1998 Activities (7/1/97-6/30/98). 1999. Available online: https://health.hawaii.gov/heer/ (accessed on 17 July 2022).
  103. Parsons Engineering Science, Inc. Confirmation Sampling and Analysis Plan for Installation Restoration Program Site ST35 Ordnance Testing Laboratory Oil Leak, Air Force Plant PJKS, Colorado; Parsons Engineering Science Inc.: Denver, CO, USA, 1996. [Google Scholar]
  104. Constantino, J.; Dominador, D. Analysis of Camp Pendleton California Medical Treatment Facility Budget and Execution Process; Naval Postgraduate School: Monterey, CA, USA, 2008. [Google Scholar]
  105. Air Force Occupational and Environmental Health Laboratory. Hazardous Waste Staff Assistance Survey, Patrick AFB and Cape Canaveral AFS, Florida. 1997. Available online: https://www.osti.gov/biblio/6425972 (accessed on 17 July 2022).
  106. Cost and Performance Report: Solar-Powered Remediation and pH Control. 2017. Available online: https://apps.dtic.mil/sti/citations/AD1036540 (accessed on 17 July 2022).
  107. Parsons Engineering Science, Inc. Bioventing Performance and Cost Results from Multiple Air Force Test Sites; Parsons Engineering Science Inc.: Denver, CO, USA, 1996. [Google Scholar]
  108. Density-Driven Groundwater Sparging at Amcor Precast Ogden, Utah. 1994. Available online: https://frtr.gov/costperformance/pdf/AmcorPrecastGWSparging.pdf (accessed on 17 July 2022).
  109. Board, T.R.; National Academies of Sciences, Engineering, and Medicine. Use and Potential Impacts of AFFF Containing PFASs at Airports; The National Academies Press: Washington, DC, USA, 2017; p. 222. [Google Scholar]
  110. Division of Environmental Remediation New York State Department of Environmental Conservation. Proposed Remedial Action Plan Fort Drum-Waste Disposal Areas. 2016. Available online: https://www.dec.ny.gov/data/DecDocs/623008/PRAP.HW.623008.2016-02-24.fianl%20PRAP%20PCE%20Plume.pdf (accessed on 17 July 2022).
  111. Day, S.J.; Morse, G.K.; Lester, J.N. The cost effectiveness of contaminated land remediation stategies. Sci. Total Environ. 1997, 201, 125–136. [Google Scholar] [CrossRef]
  112. EPA (United States Environmental Protection Agency). Superfund Explanation of Significant Differences for the Record of Decision: Fairchild Air Force Base, Craig Road Landfill, WA 12/5/1994; EPA: Washington, DC, USA, 1995. [Google Scholar]
  113. EPA (United States Environmental Protection Agency). Aerobic Degradation at Site 19, Edwards Air Force Base, California; EPA: Washington, DC, USA, 2000. [Google Scholar]
  114. EPA (United States Environmental Protection Agency). Remediation Case Studies: Ex Situ Soil Treatment Technologies (Bioremediation, Solvent Extraction, Thermal Desorption) Volumen 7; EPA: Cincinatti, OH, USA, 1998. [Google Scholar]
  115. Parsons Engineering Science Inc. Natural Attenuation of Fuel Hydrocarbons Performance and Cost Results from Multiple Air Force Demonstration Sites; Parsons Engineering Science Inc.: Denver, CO, USA, 1999. [Google Scholar]
  116. Carlton, G.N.; Smith, L.B. Exposures to Jet Fuel and Benzene During Aircraft Fuel Tank Repair in the U.S. Air Force. Appl. Occup. Environ. Hyg. 2000, 15, 485–491. [Google Scholar] [CrossRef] [PubMed]
  117. EPA (United States Environmental Protection Agency). Soil Vapor Extraction at the Verona Well Field Superfund Site, Thomas Solvent Raymond Road (OU-1), Battle Creek, Michigan: Cost and Performance Report; EPA: Washington, DC, USA, 1995. [Google Scholar]
  118. EPA (United States Environmental Protection Agency). Cost and Performance Report Sand Creek Industrial Superfund Site, O.U. 1; EPA: Washington, DC, USA, 1989. [Google Scholar]
  119. Parsons Engineering Science, Inc. Corrective Action Plan for Expanded Bioventing System Site SS-41, Former Building 93 (Fuel Pumping Station Number 3), Charleston Air Force Base, South Carolina; Parsons Engineering Science Inc.: Denver, CO, USA, 1997. [Google Scholar]
  120. Low Temperature Thermal Desorption at Longhorn Army Ammunition Plant. Burning Ground No. 3 Karnack, Texas; Cost and Performance Report; Karnack, Texas. 1999. Available online: https://frtr.gov/costperformance/profile.cfm?ID=138&CaseID=138 (accessed on 17 July 2022).
  121. EPA (United States Environmental Protection Agency). Vacuum-Enhanced, Low-Temperature Thermal Desorption at the FCX Washington Superfund Site Washington, North Carolina. Cost and Performance Report; EPA: Washington, DC, USA, 2009. [Google Scholar]
  122. EPA (United States Environmental Protection Agency). Cost and Performance Report: Thermal Desorption at the T H Agriculture & Nutrition Company Superfund Site Albany, Georgia; EPA: Washington, DC, USA, 1995. [Google Scholar]
  123. EPA (United States Environmental Protection Agency). Soil Vapor Extraction at the Fairchild Semiconductor Corporation Superfund Site San Jose, California. Cost and Performance Report; EPA/Office of Solid Waste and Emergency Response, Technology Innovation Office: Washington, DC, USA, 1995. [Google Scholar]
  124. EPA (United States Environmental Protection Agency). Report of the Remediation System Evaluation, Site Visit Conducted at the Commencement Bay/South Tacoma Channel Well 12A Superfund Site; EPA: Washington, DC, USA, 2001. [Google Scholar]
  125. Parsons Engineering Science, Inc. Intrinsic Remediation Treatibilidity Study for Site St-29 Patrick Air Force Base Florida; Parsons Engineering Science Inc.: Denver, CO, USA, 1995. [Google Scholar]
  126. EPA (United States Environmental Protection Agency). Thermal Desorption at the Sand Creek Industrial Superfund Site, OU 5 Commerce City, Colorado; EPA: Washington, DC, USA, 1999. [Google Scholar]
  127. EPA (United States Environmental Protection Agency). Thermal Desorption at the Metaltec Superfund Site, Franklin Borough, New Jersey; EPA: Washington, DC, USA, 2000. [Google Scholar]
  128. EPA (United States Environmental Protection Agency). Thermal Desorption at the Sarney Farm Superfund Site, Amenia, New York; EPA: Washington, DC, USA, 2001. [Google Scholar]
  129. EPA (United States Environmental Protection Agency). Superfund Record of Decision Garden State Cleaners, NJ. First Remedial Action; EPA: Washington, DC, USA, 1991. [Google Scholar]
  130. EPA (United States Environmental Protection Agency). Cost and Performance Report: Thermal Desorption at the McKin Company Superfund Site Gray, Maine. Available online: https://clu-in.org/products/costperf/THRMDESP/Mckin.htm (accessed on 17 July 2022).
  131. Acharya, P.; Ives, P. Incineration at Bayou Bounfouca remediation project. Waste Manag. 1994, 14, 13–26. [Google Scholar] [CrossRef]
  132. EPA (United States Environmental Protection Agency). Remediation System Evaluation SMS Instruments Deer Park, New York; EPA: Washington, DC, USA, 2003. [Google Scholar]
  133. Parsons Engineering Science, Inc. Site-Specific Technical Report for the Evaluation of Thermatrix GS Series Flameless Thermal Oxidizer for Off-Gas Treatment of Trichloroethene Vapors at Air Force Plant 4, Fort Worth, Texas; Parsons Engineering Science Inc.: Denver, CO, USA, 1996. [Google Scholar]
  134. EPA (United States Environmental Protection Agency). Cost and Performance Report: Thermal Desorption at the Outboard Marine Corporation Superfund Site Waukegan, Illinois. Available online: https://clu-in.org/products/costperf/THRMDESP/Omc.htm (accessed on 17 July 2022).
  135. EPA (United States Environmental Protection Agency). Final Record of Decision Operable Unit 1 Former Nebraska Ordnance Plant Site Mead, Nebraska; EPA: Washington, DC, USA, 1995. [Google Scholar]
  136. EEPA (United States Environmental Protection Agency). On-Site Incineration at the Celanese Corporation Shelby Fiber Operations Superfund Site Shelby, North Carolina; EPA: Washington, DC, USA, 1997. [Google Scholar]
  137. EPA (United States Environmental Protection Agency). Cost and Performance Report: Thermal Desorption/Dehalogenation at the Wide Beach Development Superfund Site Brant, New York. Available online: https://clu-in.org/products/costperf/THRMDESP/Widebch.htm (accessed on 17 July 2022).
  138. EPA (United States Environmental Protection Agency). Thermal Desorption at Port Moller Radio Relay Station Port Moller, Alaska. Cost and Performance Report. Available online: https://frtr.gov/costperformance/pdf/Port%20Moller.pdf (accessed on 17 July 2022).
  139. EPA (United States Environmental Protection Agency). Cost and Performance Summary Report Thermal Desorption at the Waldick Aerospace Devices Site Wall Township, New Jersey; EPA: Washington, DC, USA, 1998. [Google Scholar]
  140. EPA (United States Environmental Protection Agency). Incineration at the MOTCO Superfund Site Texas City, Texas; EPA: Washington, DC, USA, 1997. [Google Scholar]
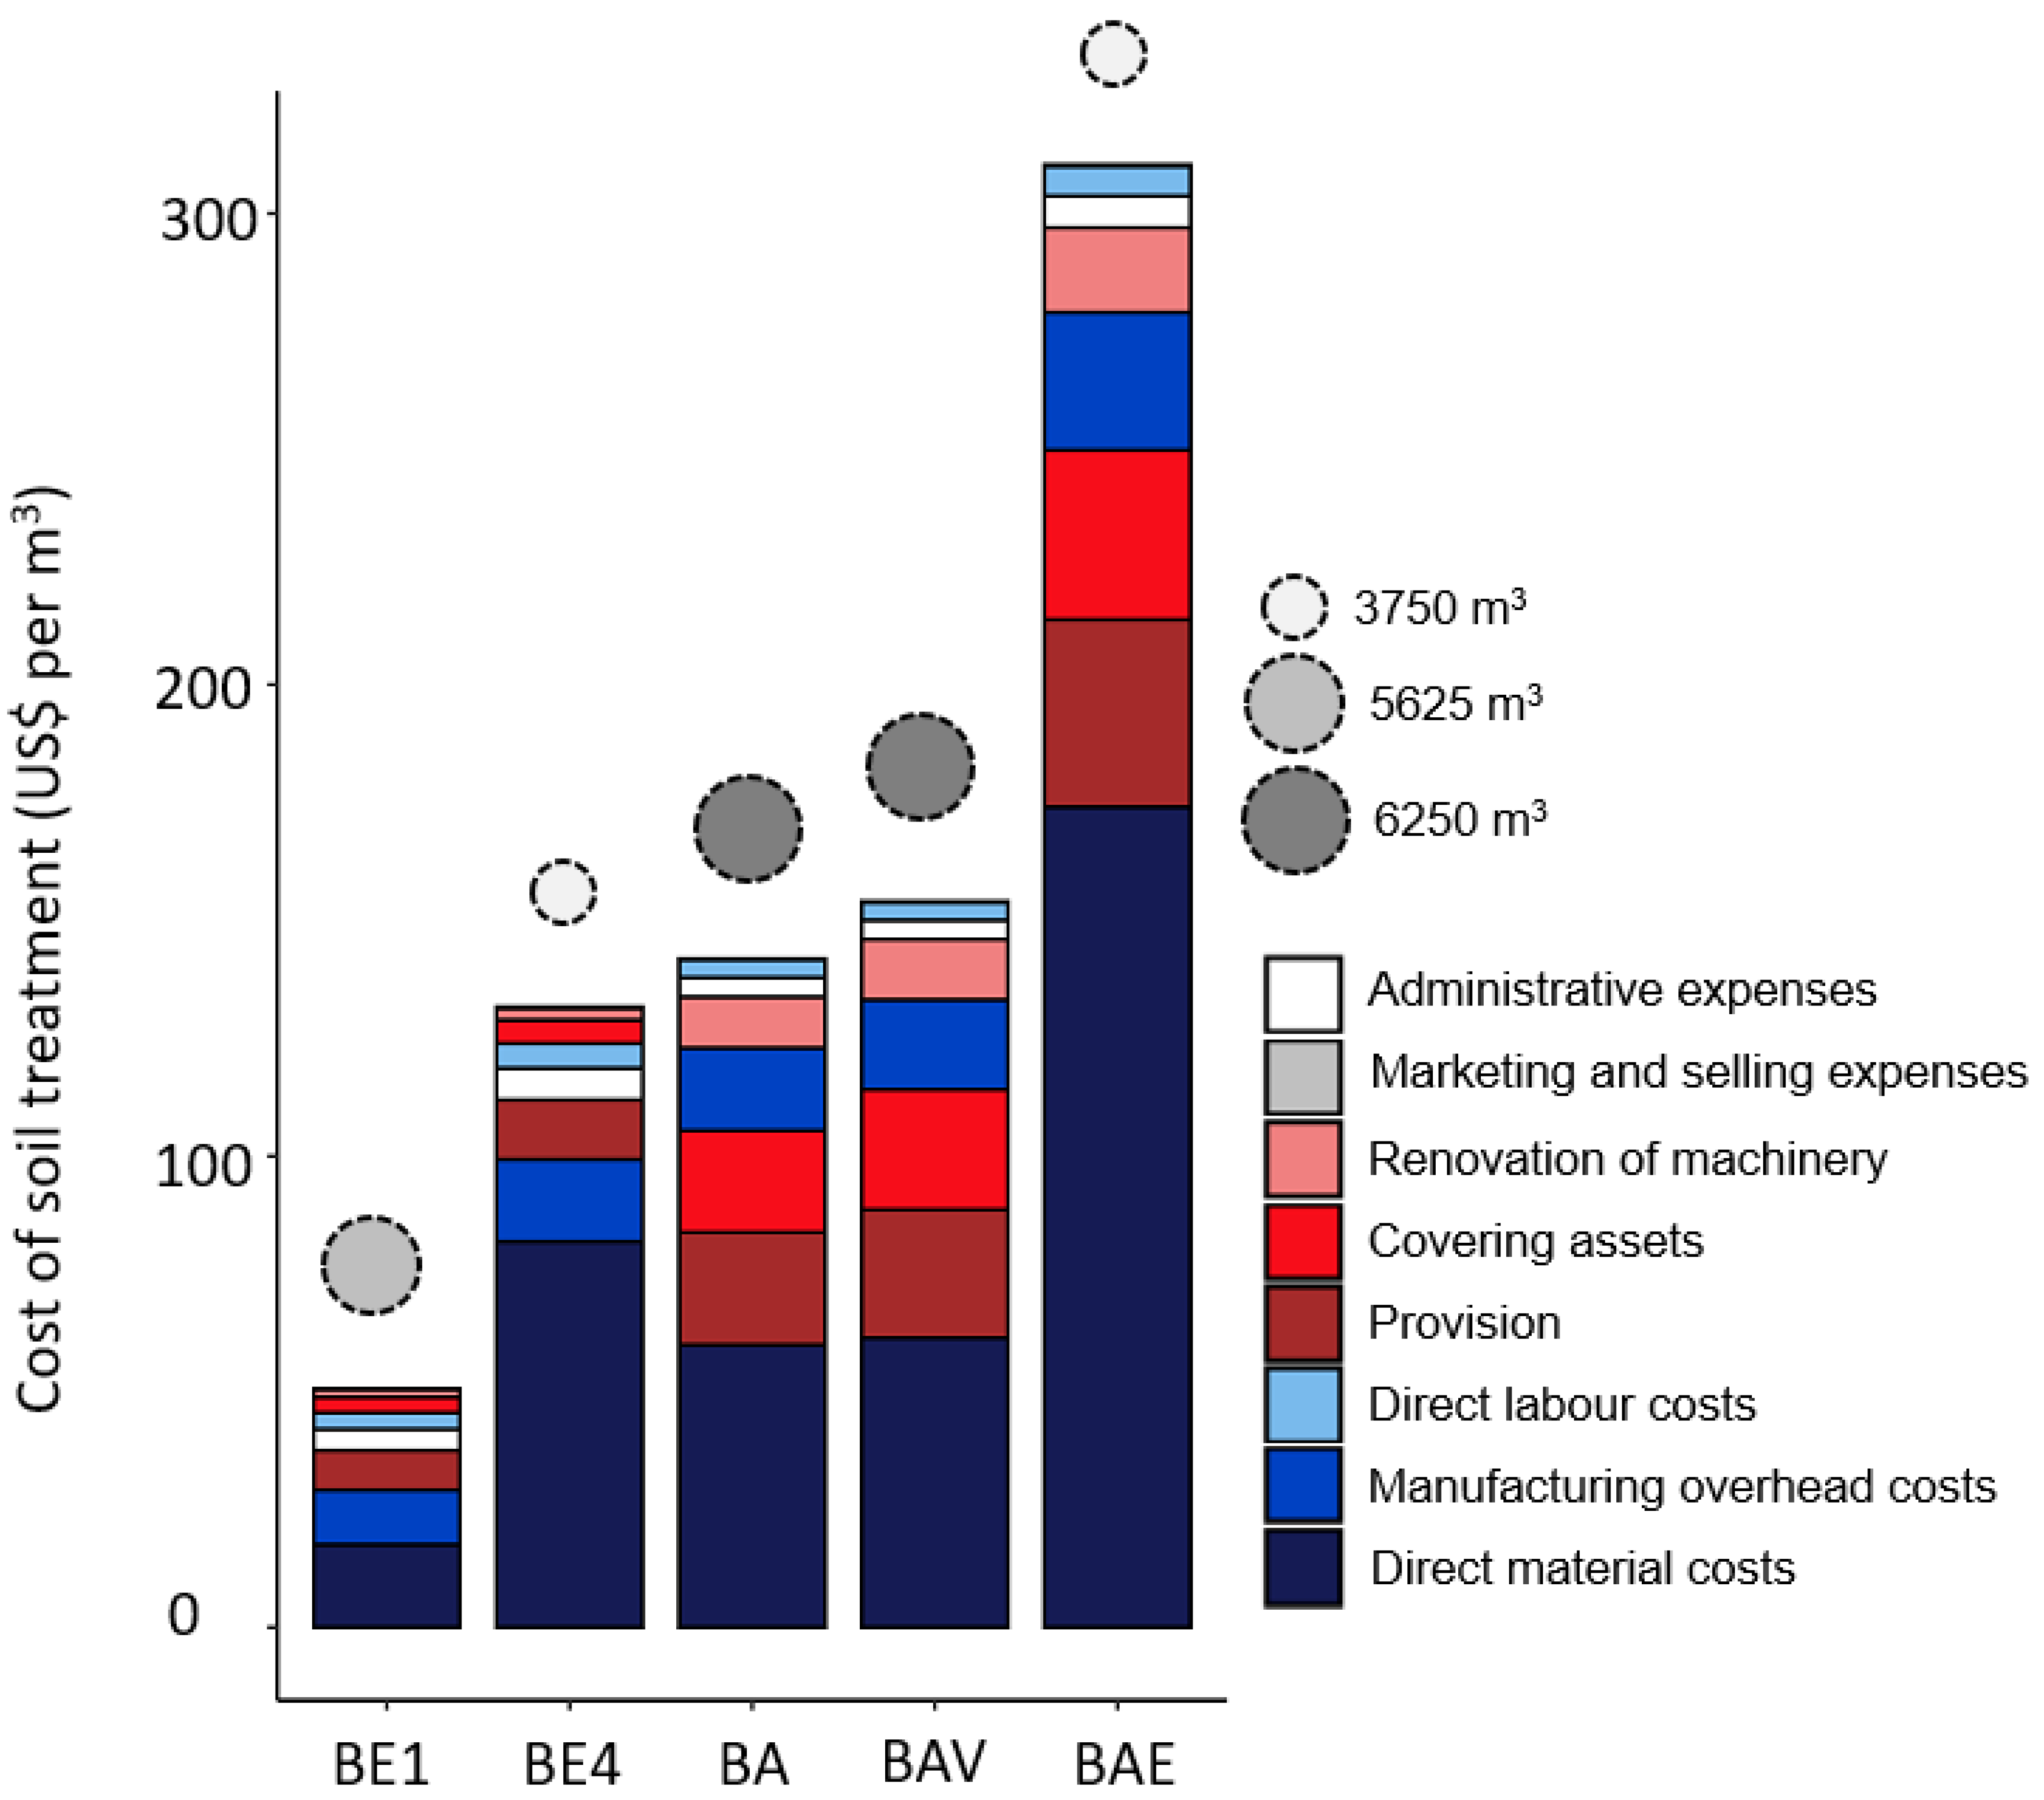
Figure 1. Estimated cost for bioremediation of chronically contaminated soils using different strategies projected to industrial scale. Colors indicate type of cost contributing to the total bioremediation cost. Blue tones show products’ costs. Direct material costs are shown in navy blue, manufacturing overhead costs in blue and direct labor costs in light blue. Red tones indicate items included in liabilities and obligations as follows: Marron shows provision, red shows covering assets, and salmon shows renovation of machinery. Marketing and selling expenses are shown in gray. Administrative expenses are shown in white. Dotted line circles shown the quantity (in m3) of soil treated per 10 biopiles of each treatment.
Sustainability 14 11854 g001
Figure 2. Distribution of the cost of bioremediation across a set of 135 projects around the world. The bar chart in the left shows costs of bioremediation sorted from the cheapest (0%) to the most expensive (100%), and the cost for bioremediation is expressed in USD per m3 of contaminated soils in logarithmic scale. The contaminants column indicates the type of contaminants in the treated soil as the following. “HC-der” indicates soils contaminated with hydrocarbons-derived compounds; “HalVOC” indicates soils contaminated with halogenated volatile organic compounds; “mets” indicates soils contaminated with metals; “OS-der” indicates soils contaminated with organic solvent compounds. The approach column indicates the technique used for soil bioremediation. Abbreviations: Phytorem—phytoremediation; SVE—solvent vapor extraction; Thermal—thermal treatments.
Sustainability 14 11854 g002
Table 1. Estimated costs per m3 of contaminated soil treated by different bioremediation approaches.
Items BE1BE4BAEBABAV
Products’ costsDirect material costsUSD 17.5USD 81.9USD 174.0USD 59.9USD 61.4
Direct labor costsUSD 3.5USD 5.3USD 6.3USD 3.8USD 3.8
Manufacturing overhead costsUSD 11.6USD 17.4USD 29.2USD 17.5USD 19.0
Period costsAdministrative expensesUSD 4.5USD 6.7USD 6.7USD 4.0USD 4.0
Marketing and selling expensesUSD 0.2USD 0.4USD 0.4USD 0.2USD 0.2
Liabilities and obligationsCovering assetsUSD 3.3USD 4.9USD 36.0USD 21.6USD 25.5
ProvisionUSD 8.4USD 12.6USD 39.8USD 23.9USD 27.2
Renewal machineryUSD 1.6USD 2.5USD 18.0USD 10.8USD 12.7
TotalUSD 50.7USD 131.7USD 310.4USD 141.8USD 153.9
Publisher’s Note: MDPI stays neutral with regard to jurisdictional claims in published maps and institutional affiliations.

