

Chemo-Sonic Pretreatment Approach on Marine Macroalgae for Energy Efficient Biohydrogen Production


Abstract
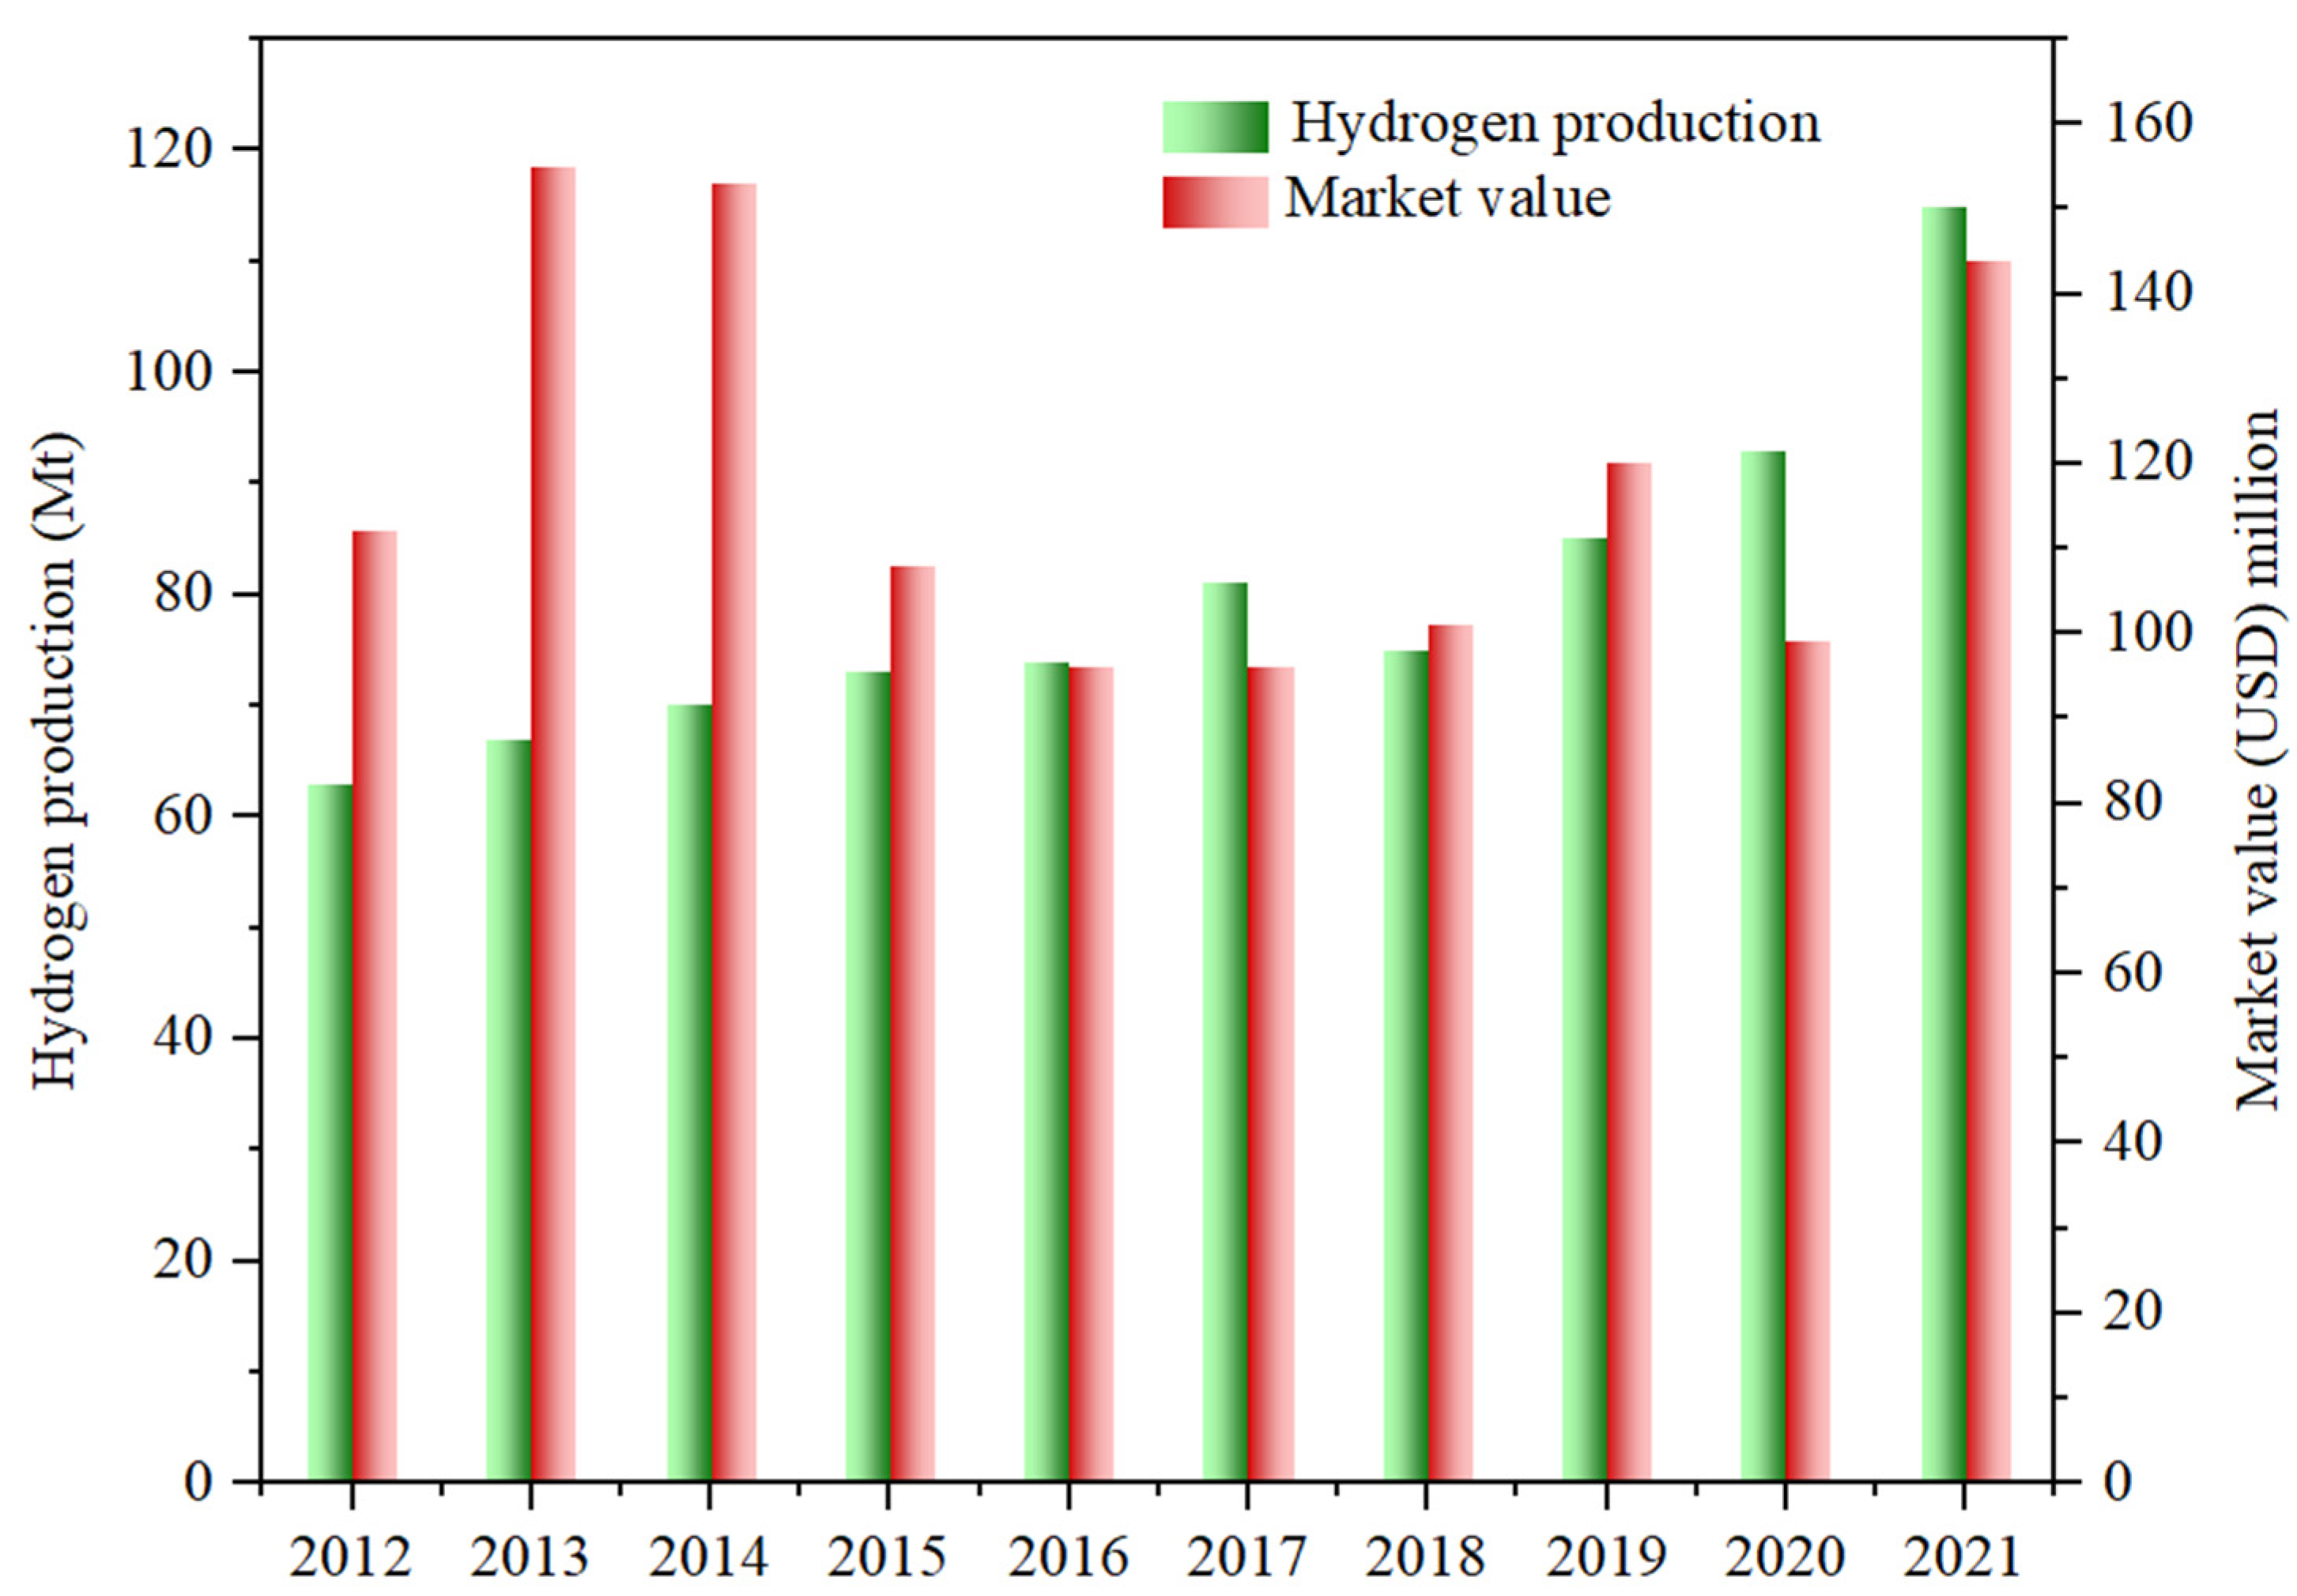
:1. Introduction
2. Materials and Methods
2.1. Marine Macroalgae Sample
2.2. Biomass Pretreatment
2.2.1. Sonic Solubilization (SS)
2.2.2. Sonic Alkali Solubilization (SAS)
2.3. Anaerobic Fermentation Study
2.4. Biohydrogen Potential Assessment (BPA)
2.5. Analytical Methods
2.6. Statistical Analysis
2.7. Specific Energy for Sonication (SES)
2.8. Energy Analysis
3. Results and Discussion
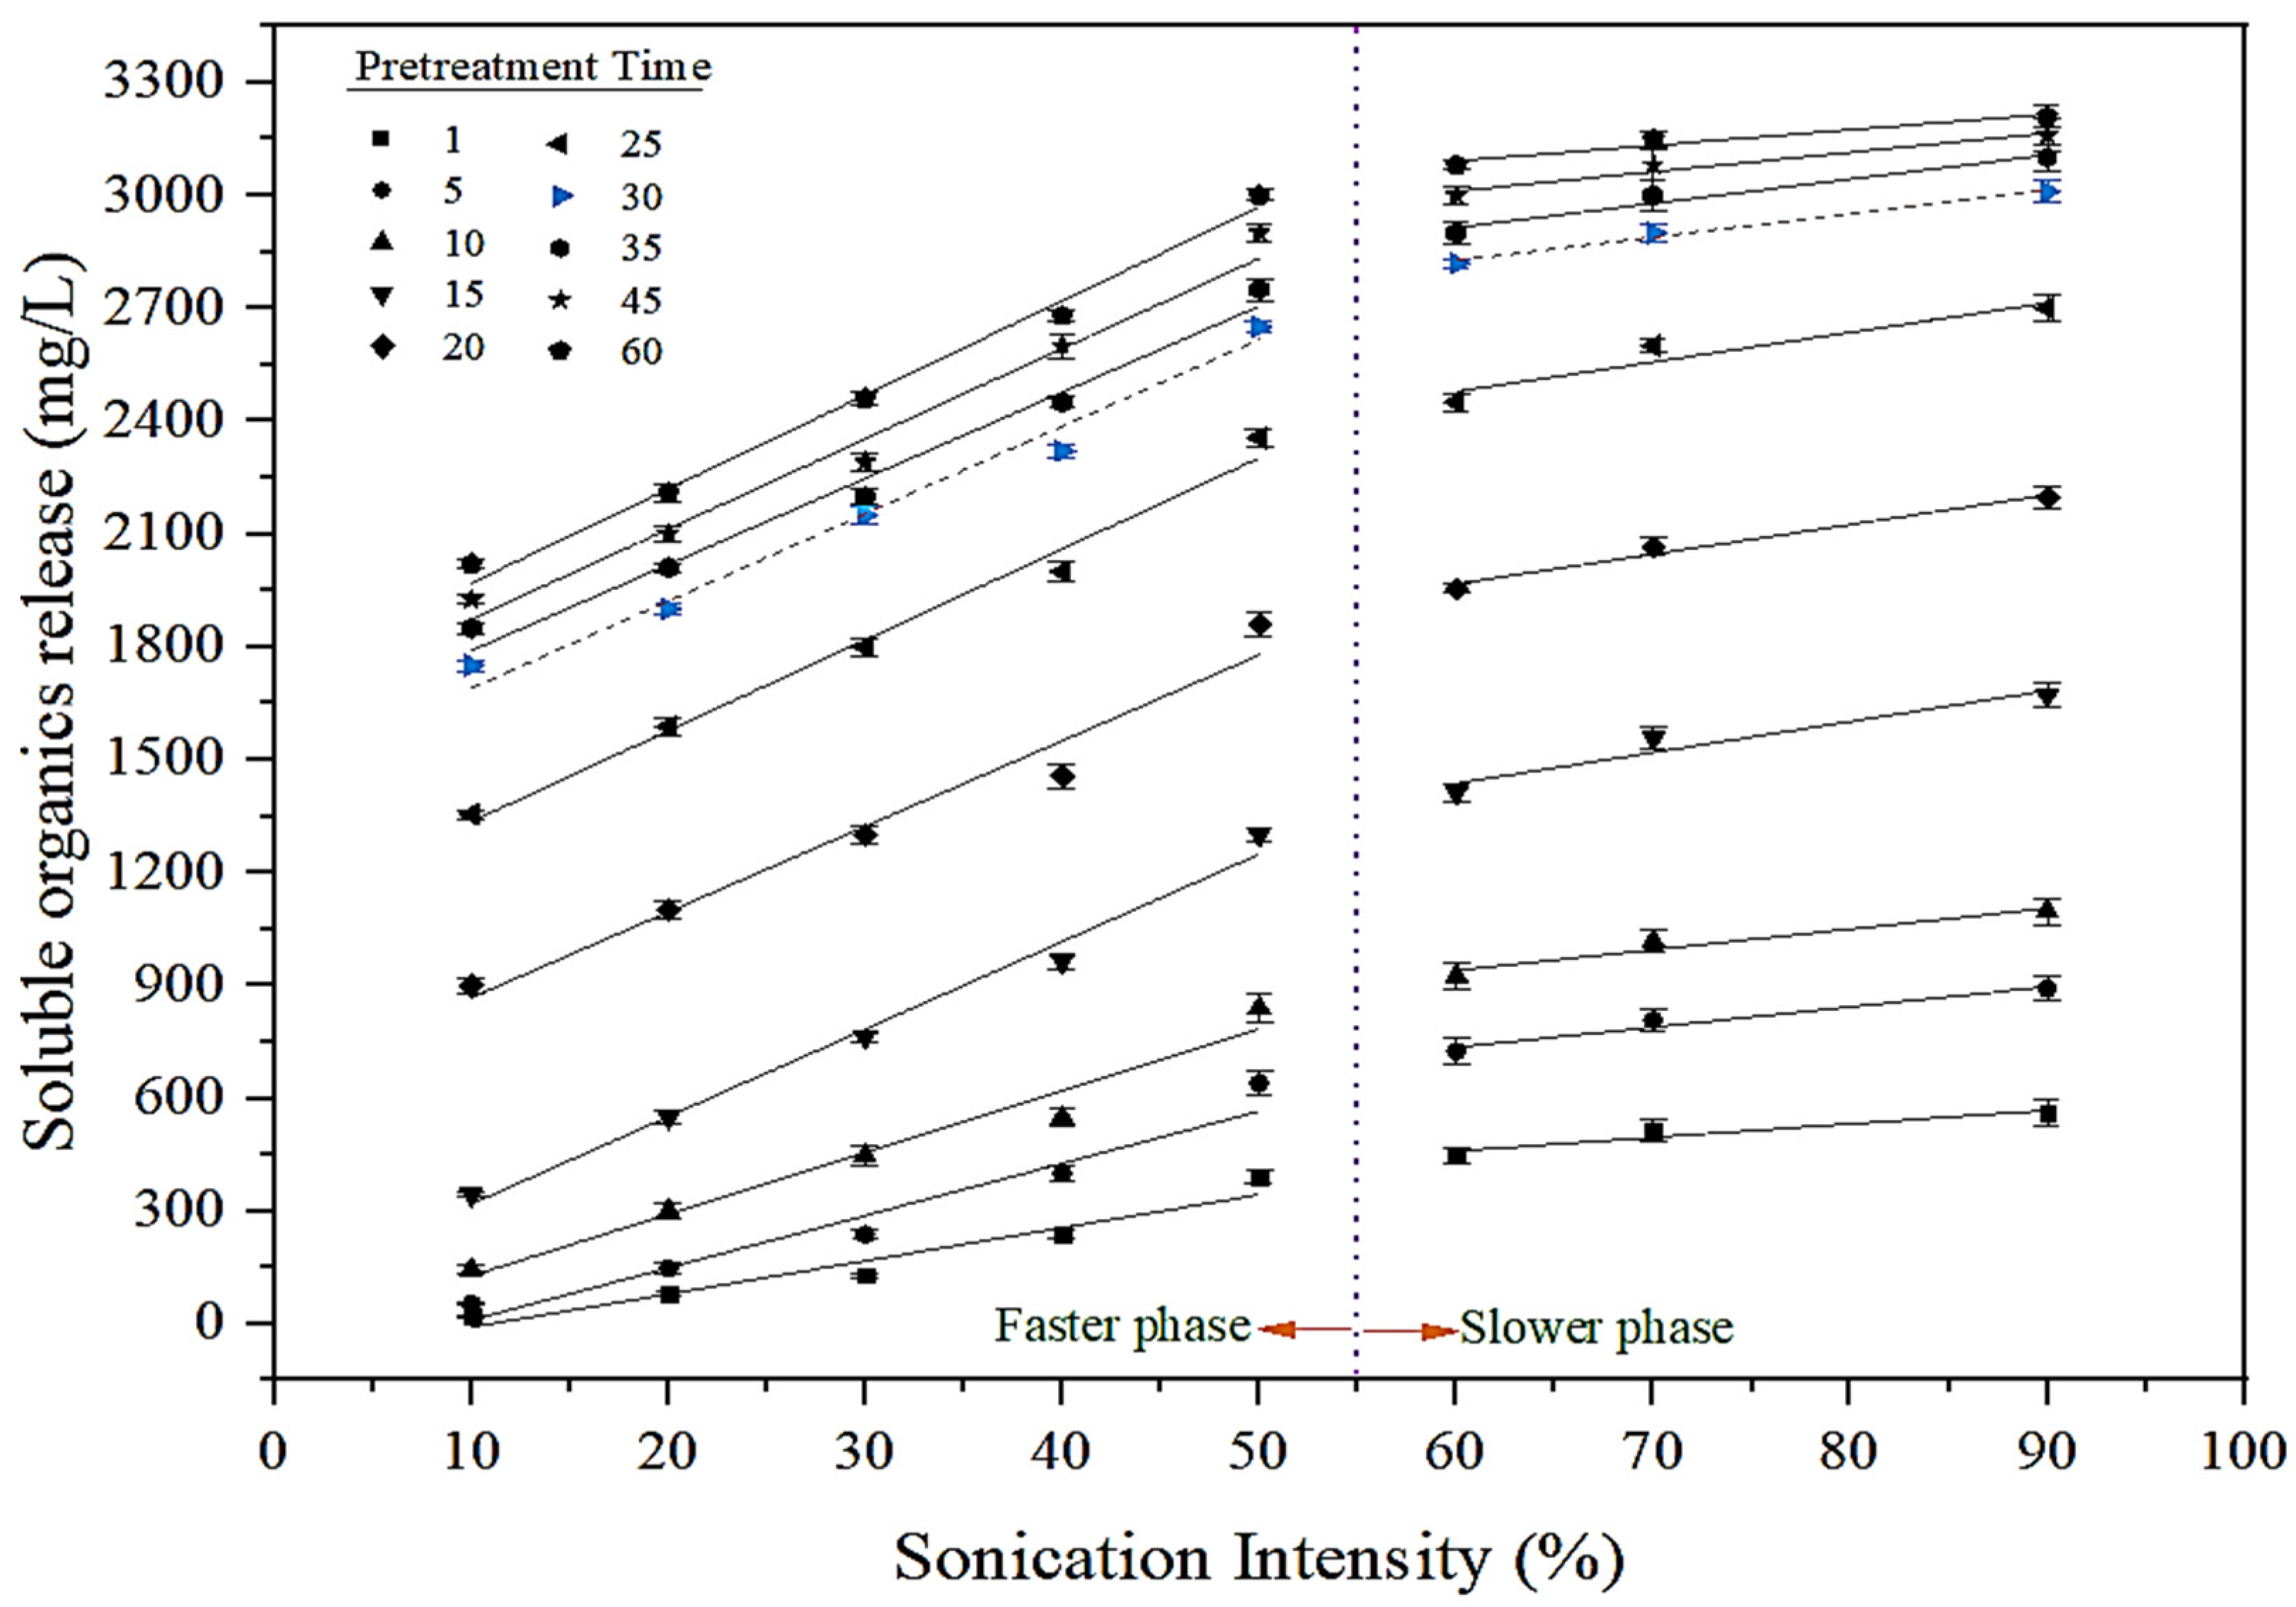
3.1. Sequel of SS in the Liberation of Soluble Organics Release
3.2. Response of SE over COD Solubilization
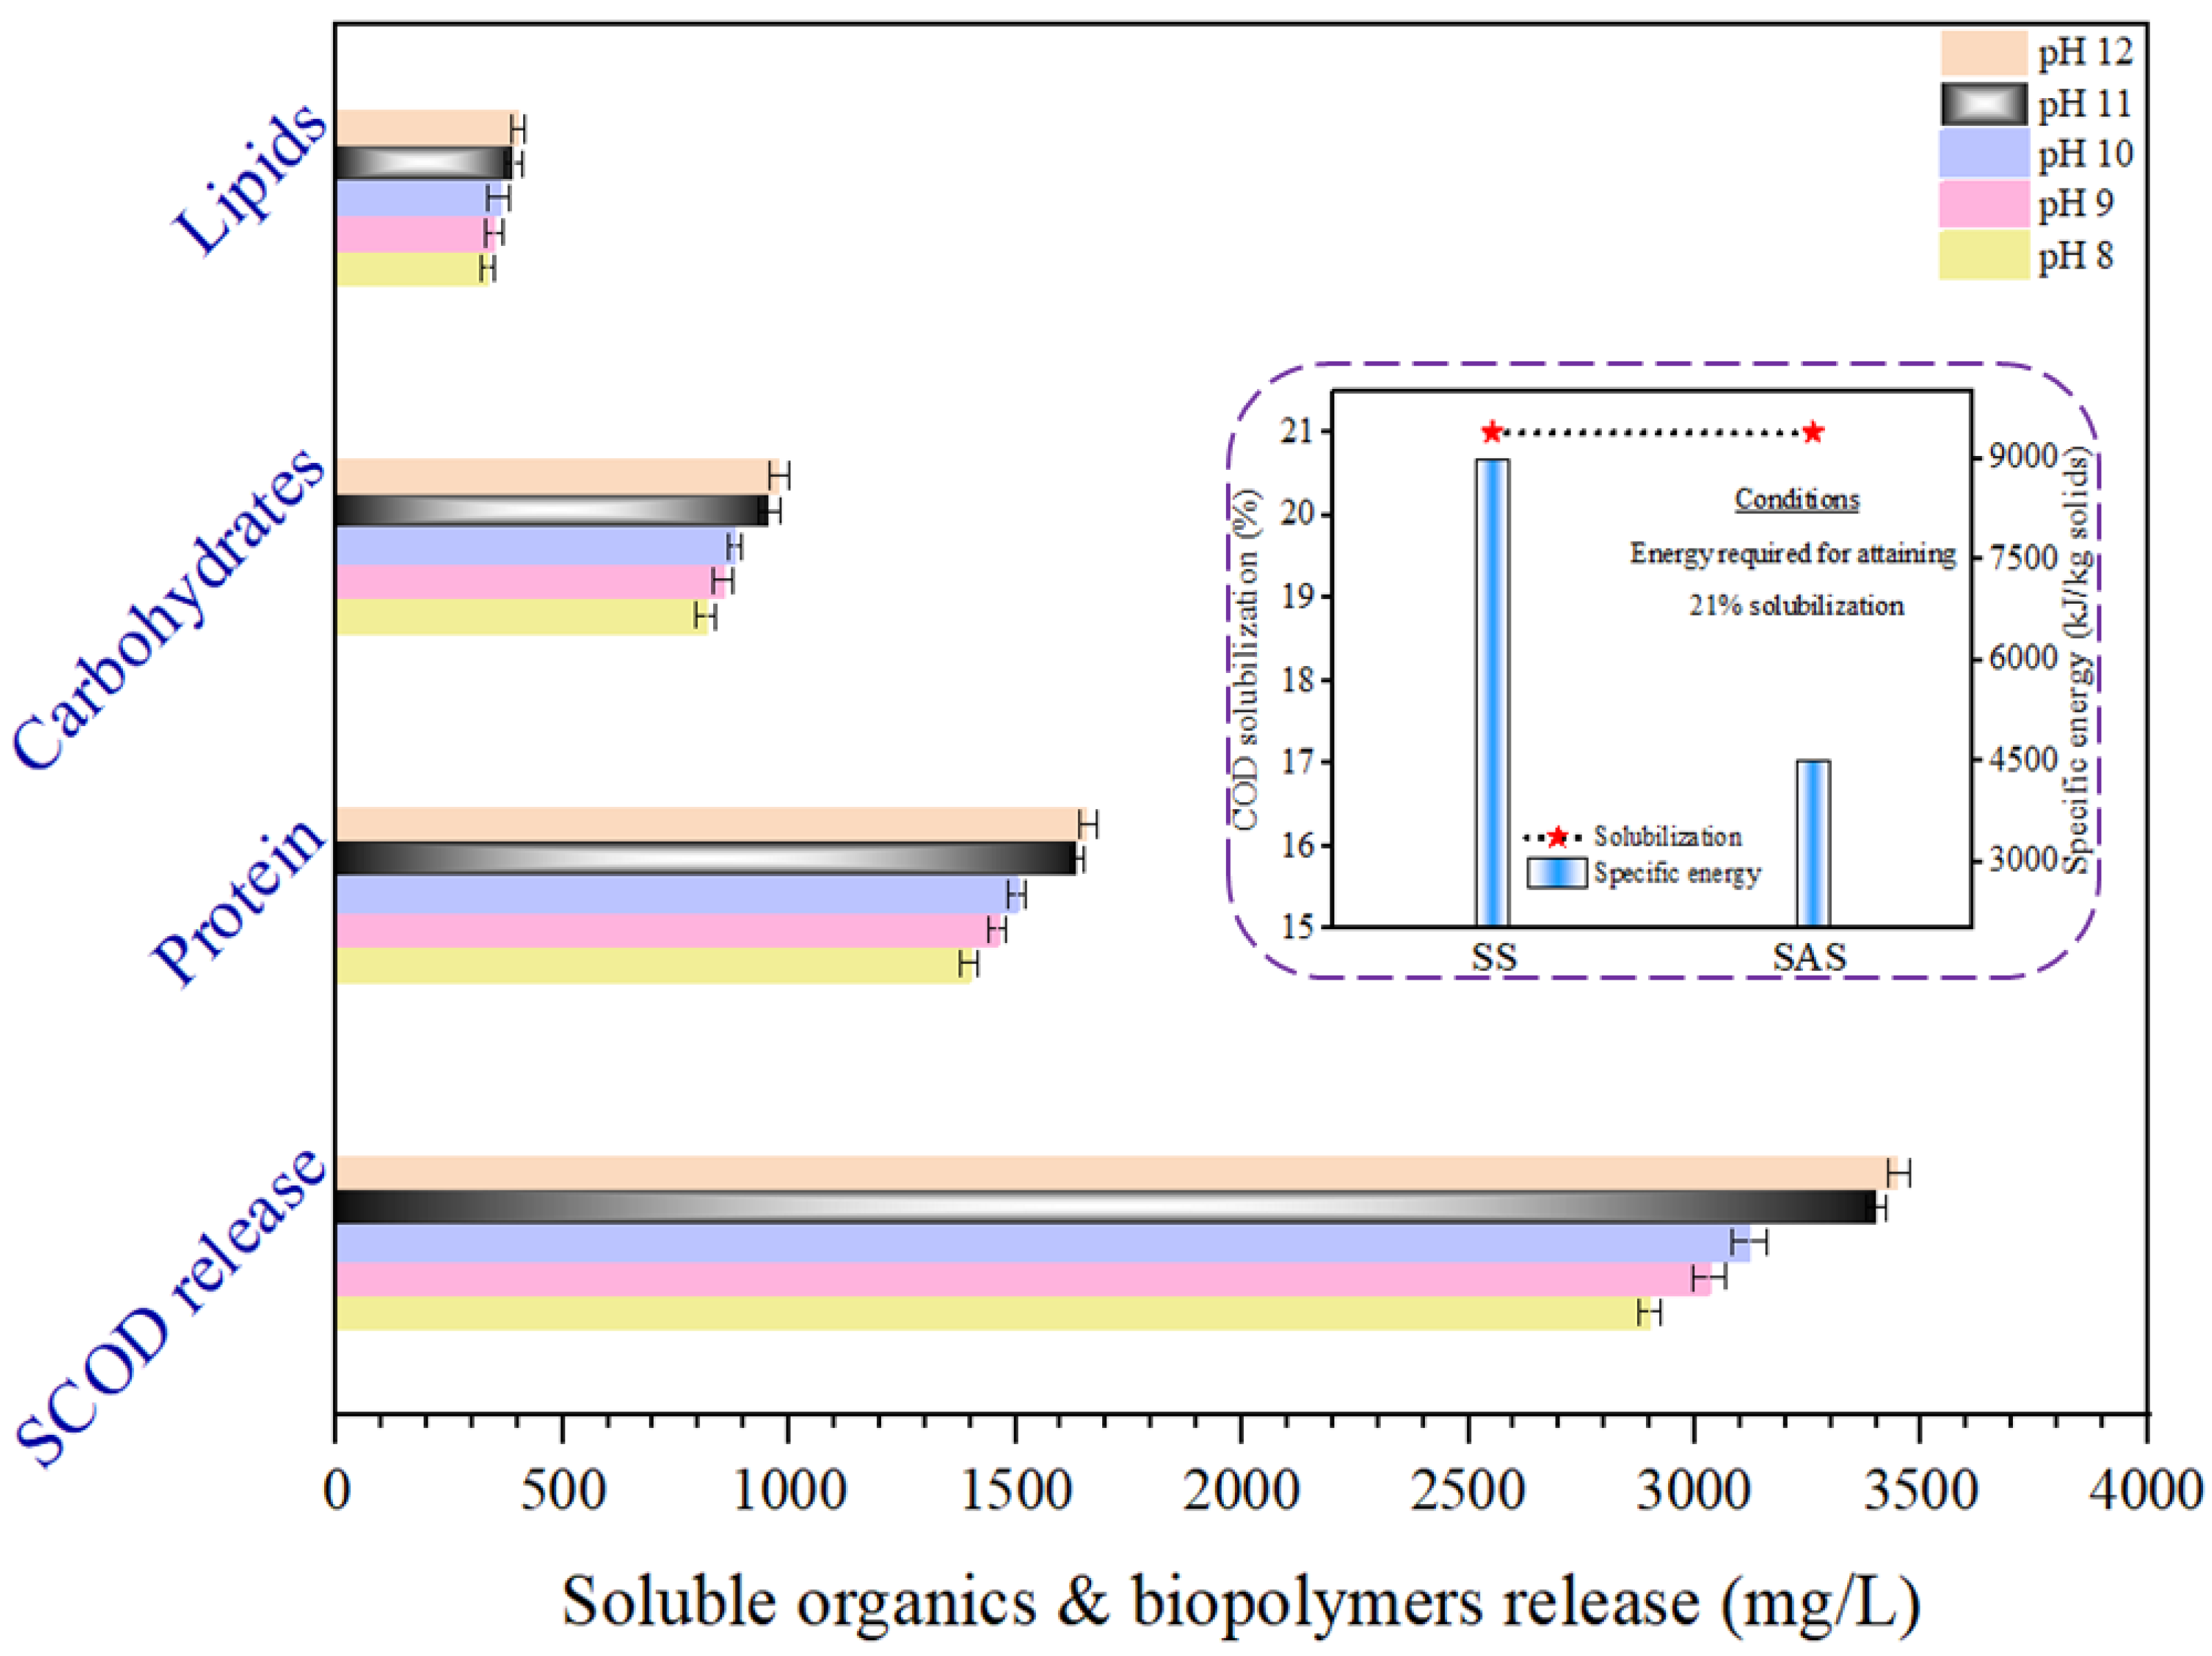
3.3. Impact of SAS in the Discharge of Organic Biopolymers
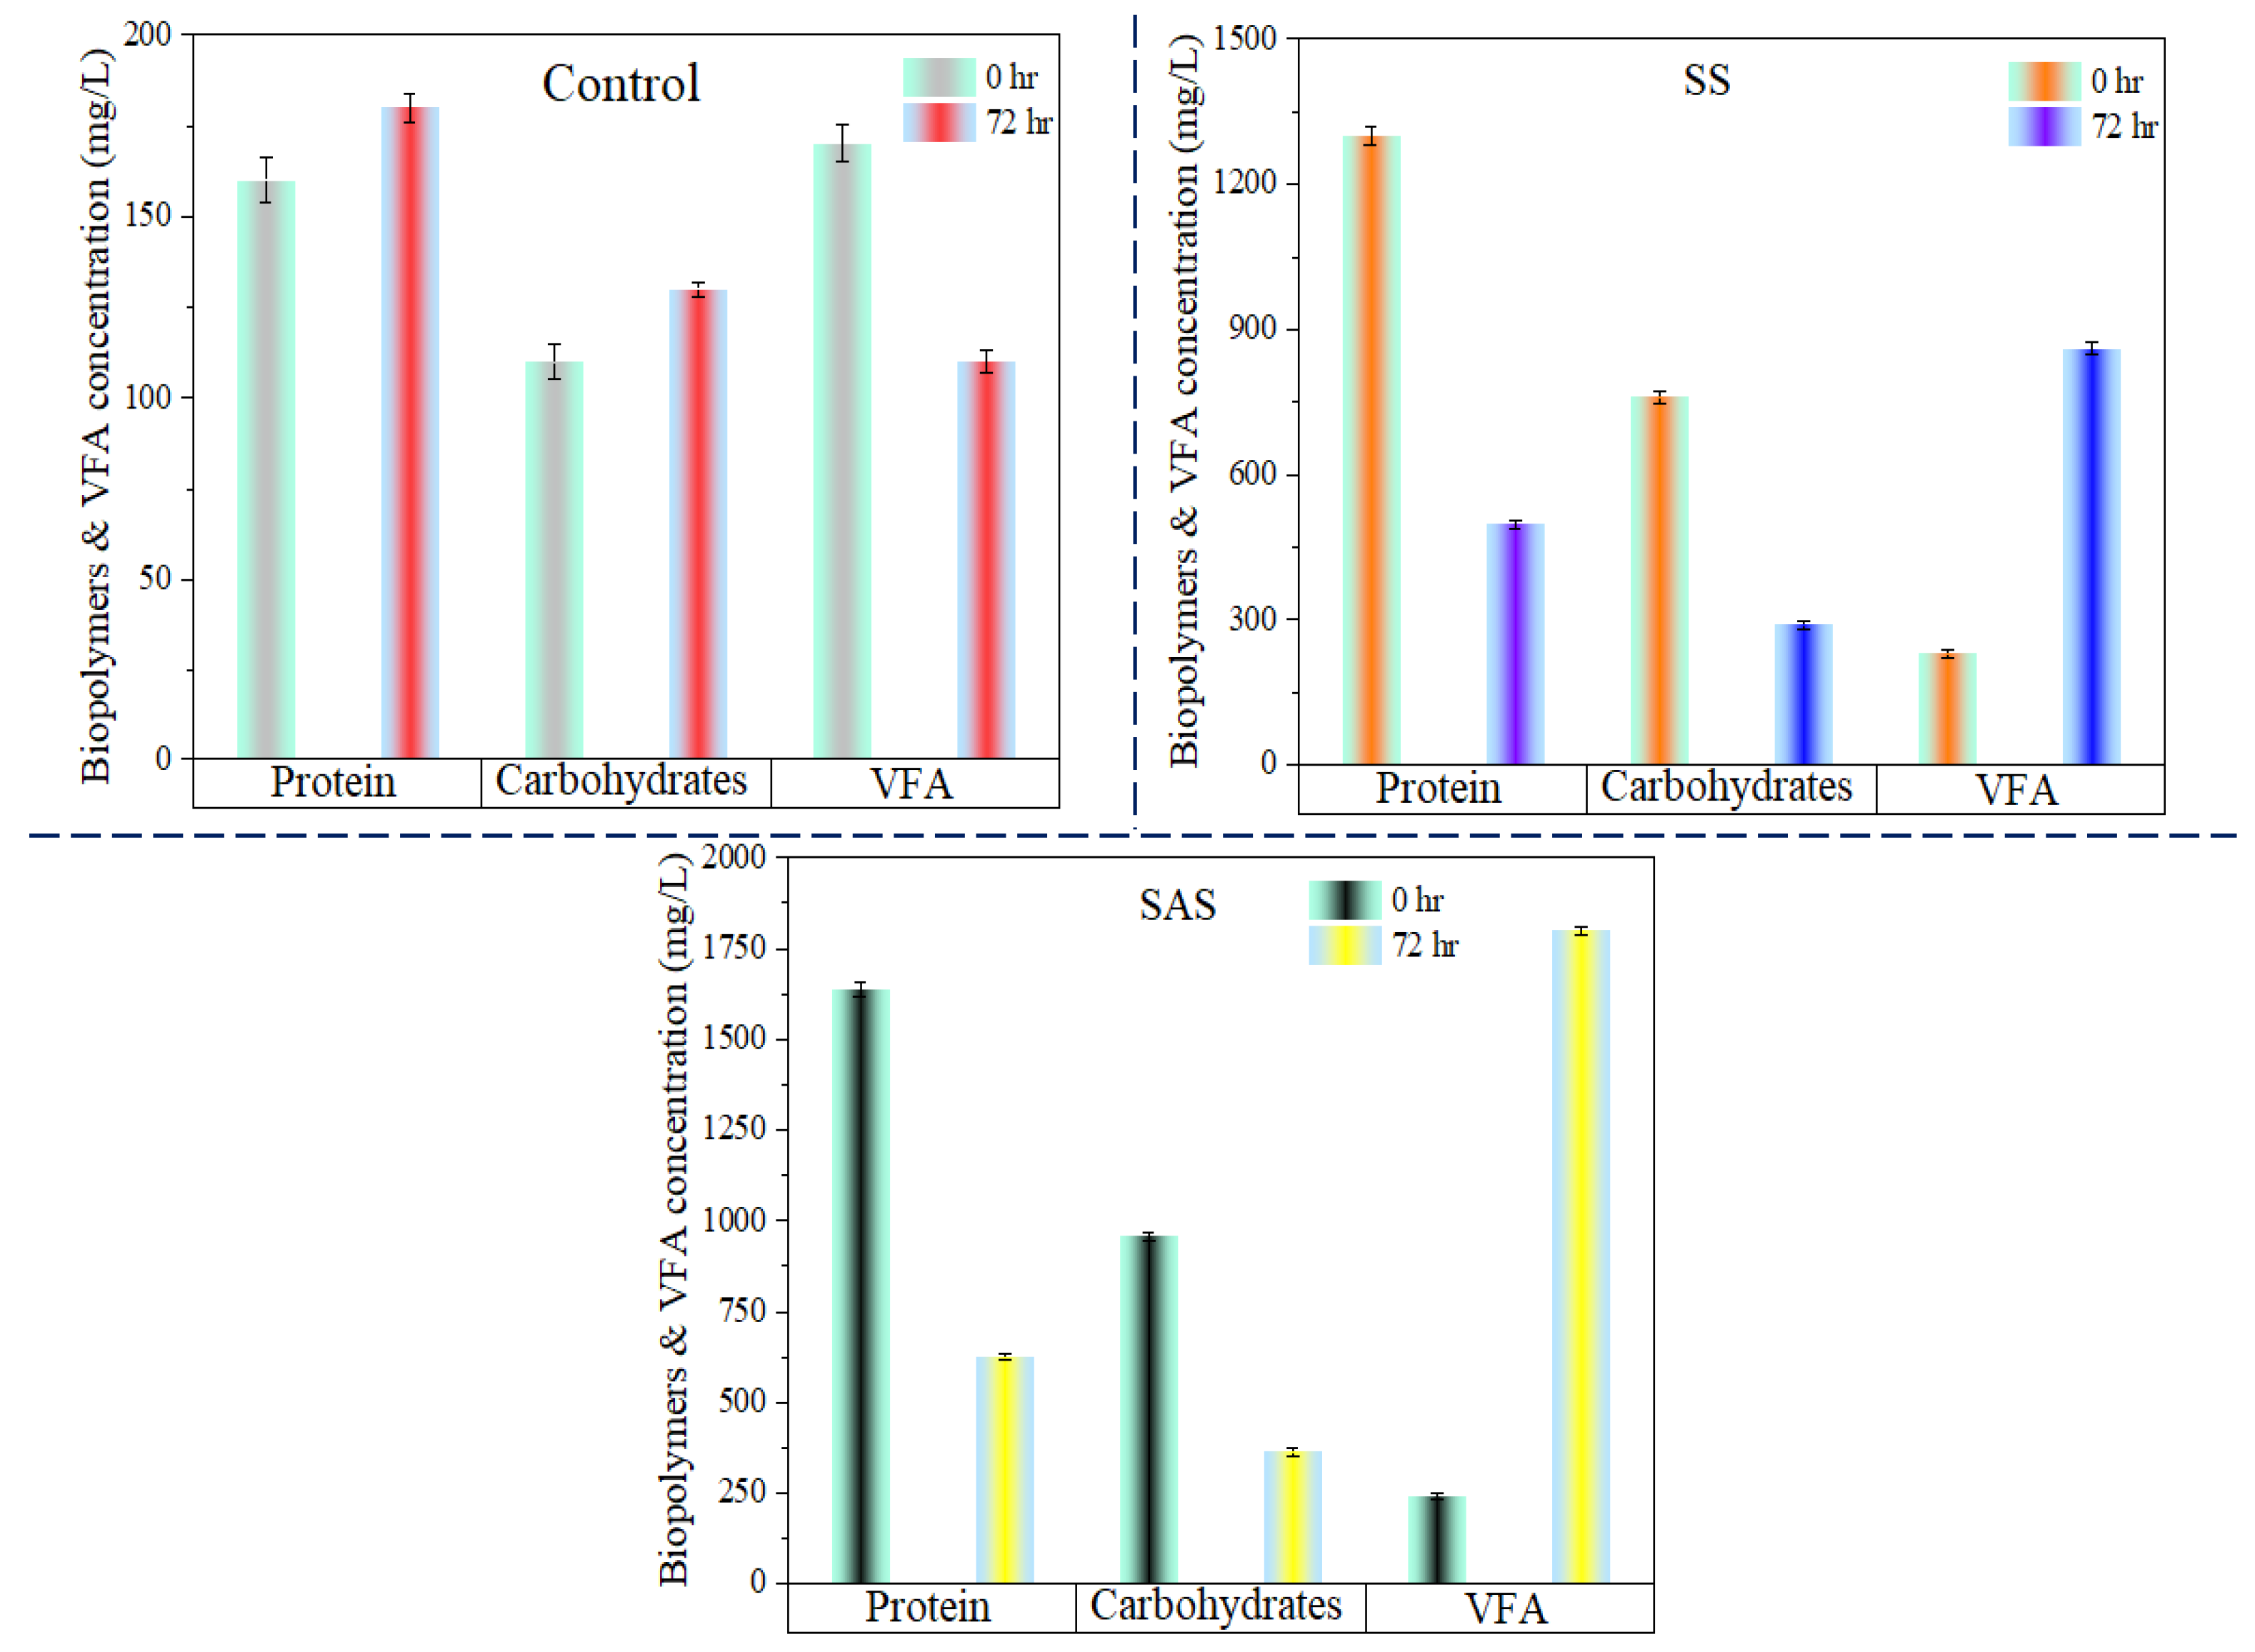
3.4. VFA Production in SS and SAS
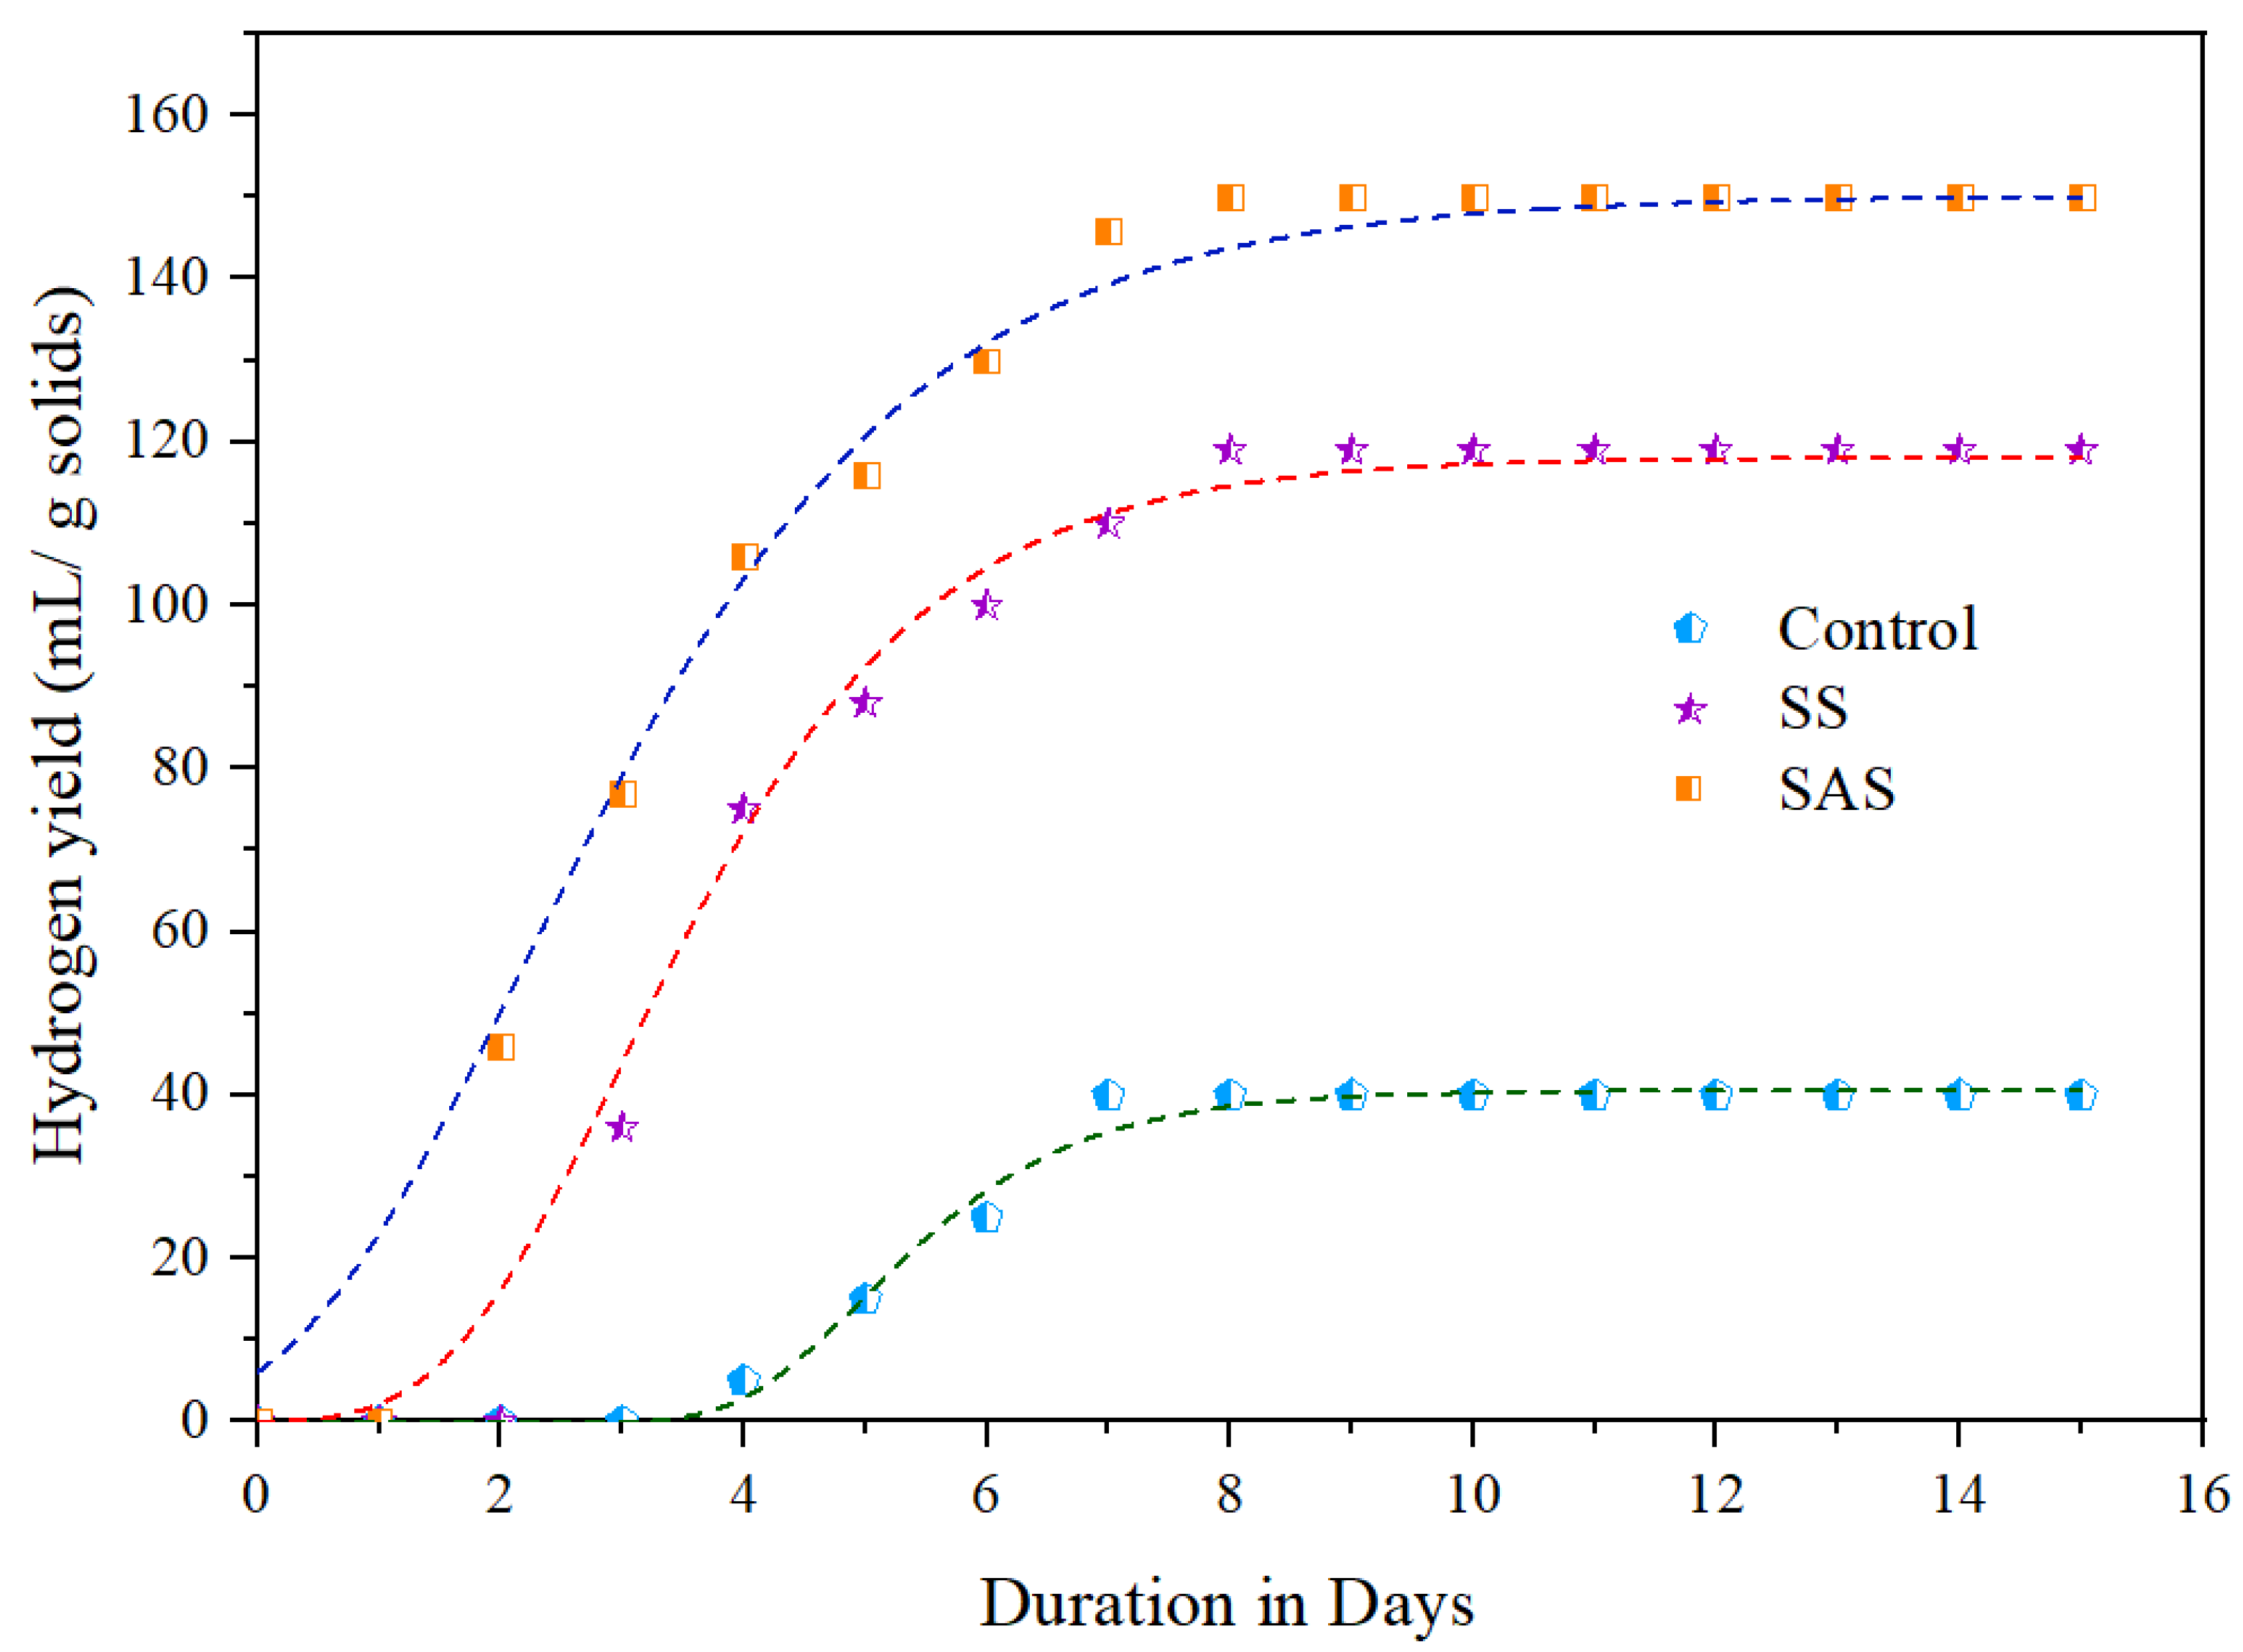
3.5. Biohydrogen Potential Assay (BPA)
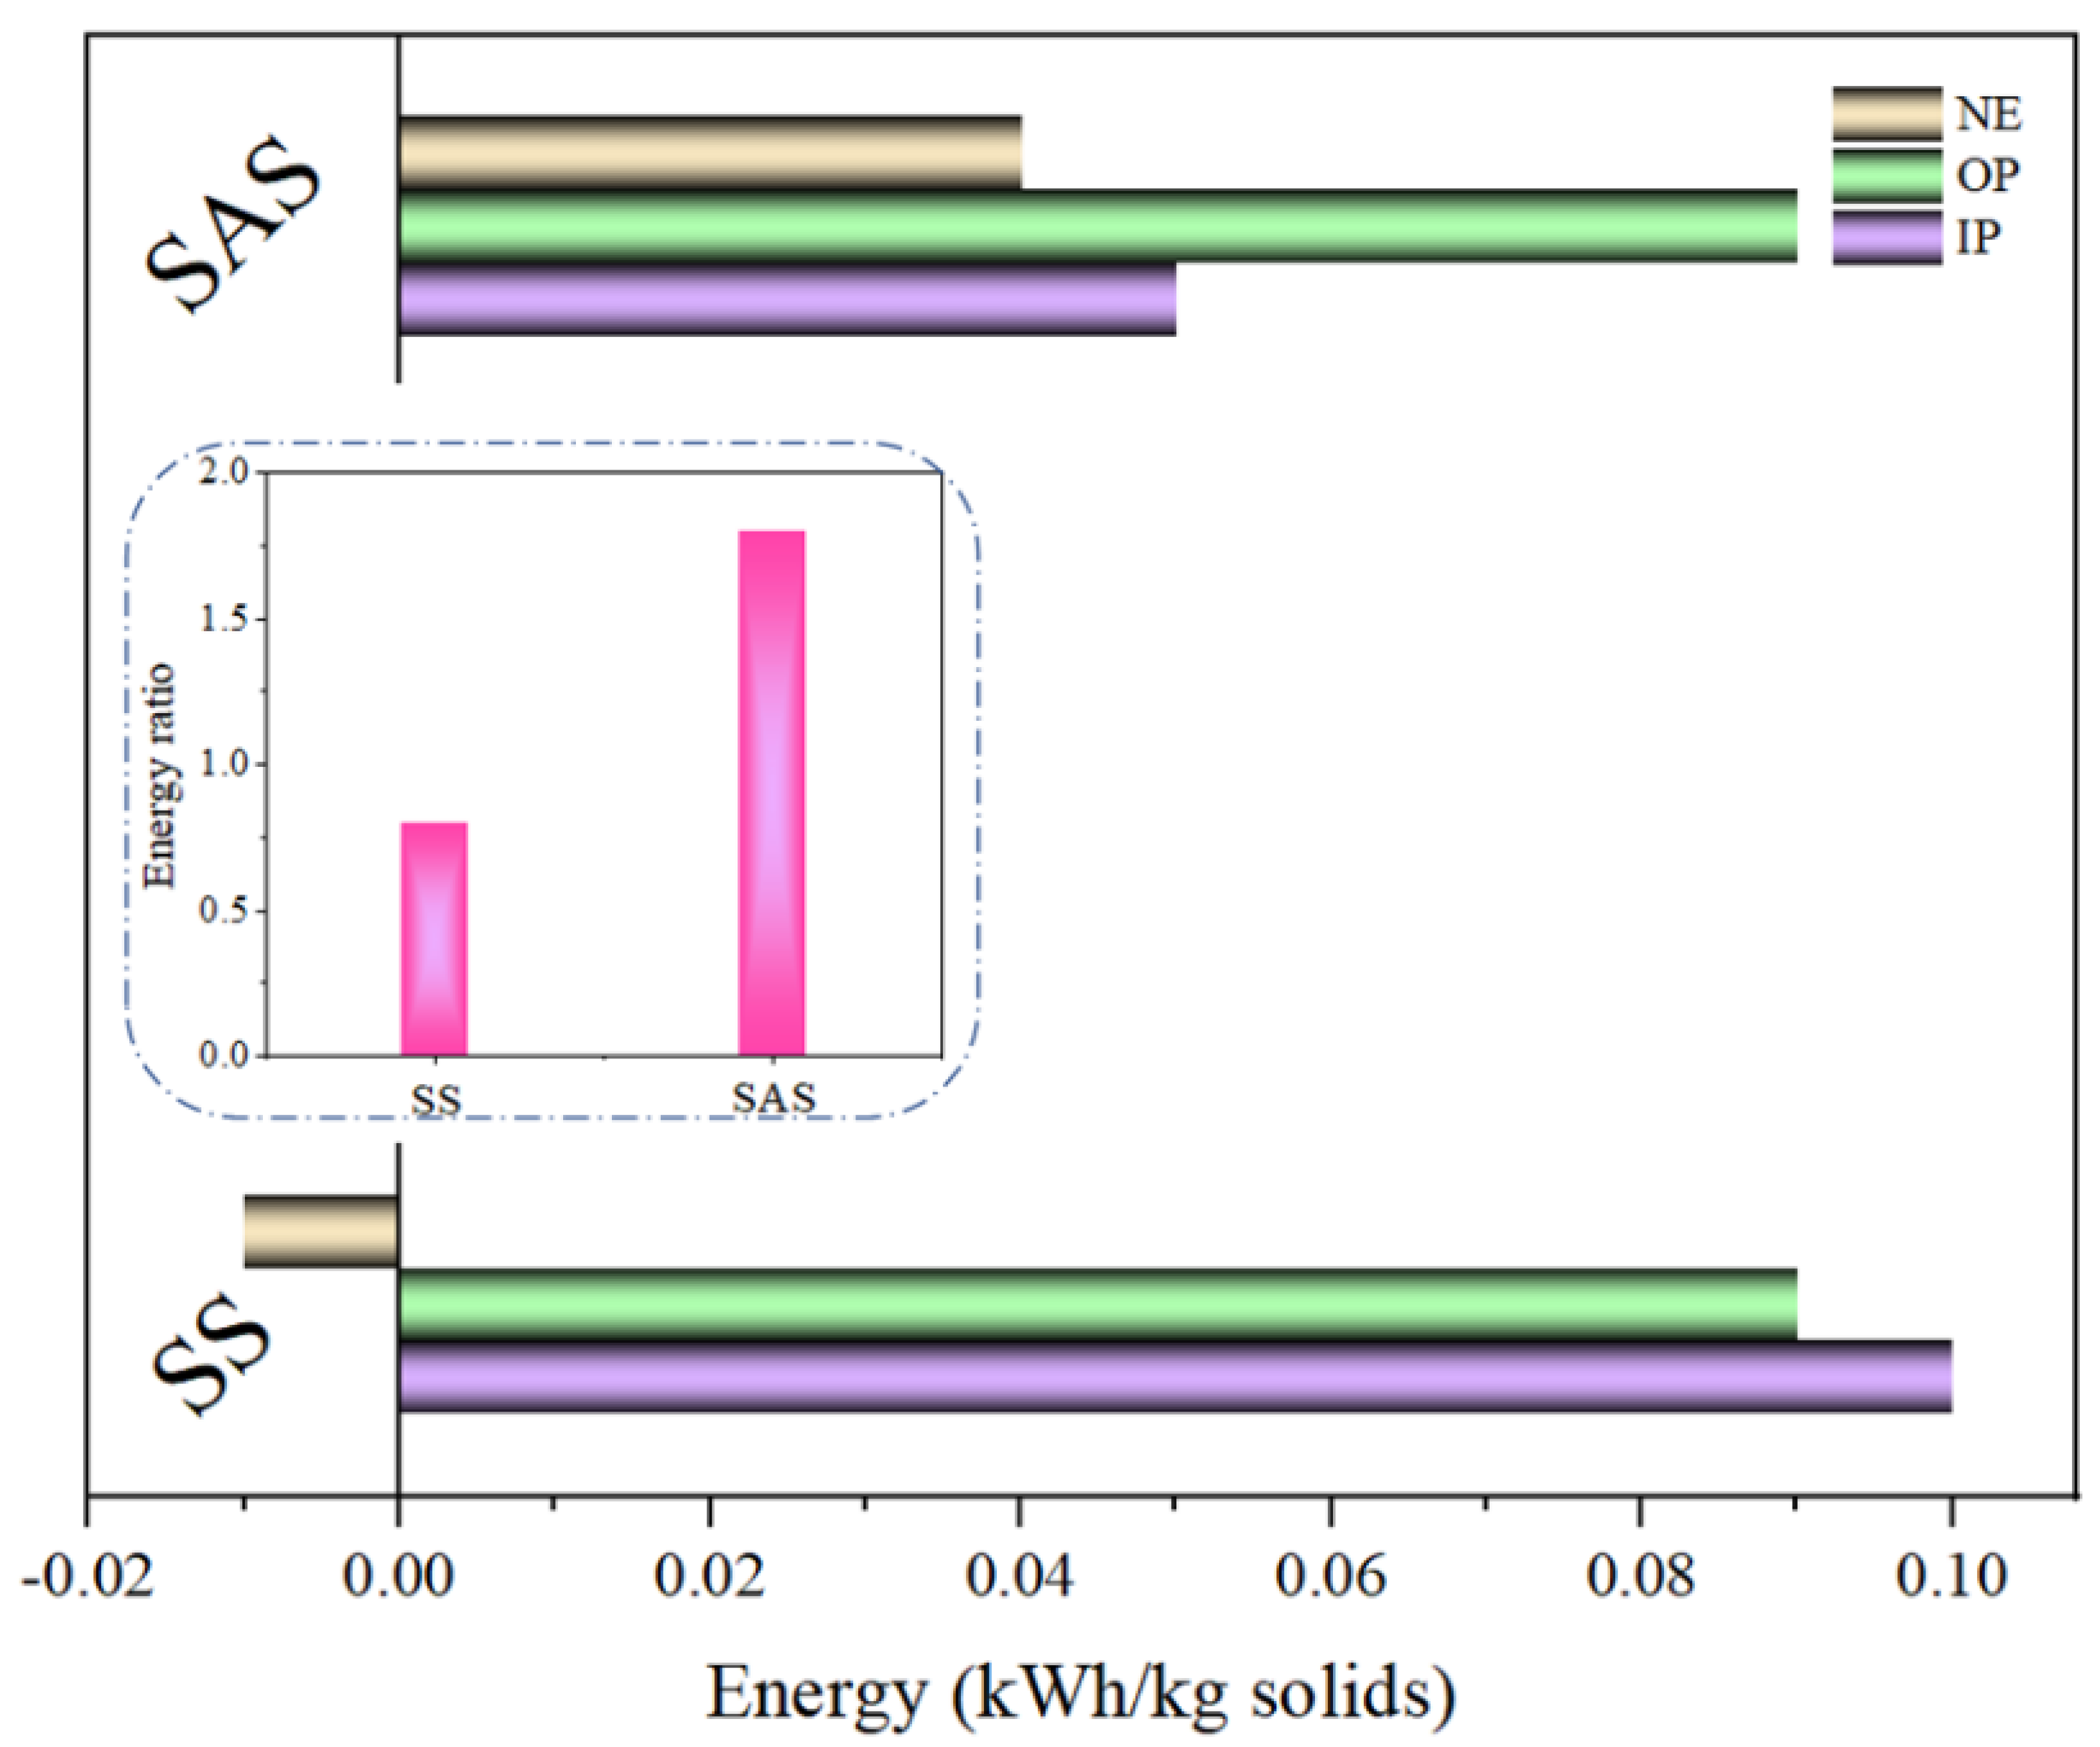
3.6. Energy Interpretation
4. Conclusions and Future Areas of Research
Author Contributions
Funding
Institutional Review Board Statement
Informed Consent Statement
Data Availability Statement
Conflicts of Interest
References
- Banu, J.R.; Kavitha, S.; Kannah, R.Y.; Usman, T.M.; Kumar, G. Application of chemo thermal coupled sonic homogenization of marine macroalgal biomass for energy efficient volatile fatty acid recovery. Bioresour. Technol. 2020, 303, 122951. [Google Scholar] [CrossRef] [PubMed]
- Kumar, D.; Eswari, A.P.; Park, J.-H.; Adishkumar, S.; Banu, J.R. Biohydrogen Generation from Macroalgal Biomass, Chaetomorpha antennina Through Surfactant Aided Microwave Disintegration. Front. Energy Res. 2019, 7, 78. [Google Scholar] [CrossRef] [Green Version]
- Praseptiangga, D. Development of Seaweed-based Biopolymers for Edible Films and Lectins. IOP Conf. Ser. Mater. Sci. Eng. 2017, 193, 012003. [Google Scholar] [CrossRef]
- Wahlström, N.; Edlund, U.; Pavia, H.; Toth, G.; Jaworski, A.; Pell, A.J.; Choong, F.X.; Shirani, H.; Nilsson, K.P.R.; Richter-Dahlfors, A. Cellulose from the green macroalgae Ulva lactuca: Isolation, characterization, optotracing, and production of cellulose nanofibrils. Cellulose 2020, 27, 3707–3725. [Google Scholar] [CrossRef] [Green Version]
- Naik Kishore, K.; Naik Prarameshwara, T. Preparation and Characterisation of Biodiesel from Marine Macro-algae Chaetomorpha spp. Int. J. Res. Appl. Sci. Biotechnol. 2020, 7, 242–247. [Google Scholar] [CrossRef]
- Lindfors, A.; Feiz, R.; Eklund, M.; Ammenberg, J. Assessing the Potential, Performance and Feasibility of Urban Solutions: Methodological Considerations and Learnings from Biogas Solutions. Sustainability 2019, 11, 3756. [Google Scholar] [CrossRef] [Green Version]
- Baena-Moreno, F.; Malico, I.; Marques, I. Promoting Sustainability: Wastewater Treatment Plants as a Source of Biomethane in Regions Far from a High-Pressure Grid. A Real Portuguese Case Study. Sustainability 2021, 13, 8933. [Google Scholar] [CrossRef]
- Milledge, J.J.; Nielsen, B.V.; Maneein, S.; Harvey, P.J. A Brief Review of Anaerobic Digestion of Algae for Bioenergy. Energies 2019, 12, 1166. [Google Scholar] [CrossRef] [Green Version]
- Rahman, S.; Masdar, M.; Rosli, M.; Majlan, E.; Husaini, T.; Kamarudin, S.; Daud, W. Overview biohydrogen technologies and application in fuel cell technology. Renew. Sustain. Energy Rev. 2016, 66, 137–162. [Google Scholar] [CrossRef]
- Global Hydrogen Review 2021. Available online: https://www.iea.org/reports/global-hydrogen-review-2021 (accessed on 18 September 2022).
- Sekoai, P.T.; Awosusi, A.; Yoro, K.O.; Singo, M.; Oloye, O.; Ayeni, A.O.; Bodunrin, M.O.; Daramola, M. Microbial cell immobilization in biohydrogen production: A short overview. Crit. Rev. Biotechnol. 2017, 38, 157–171. [Google Scholar] [CrossRef] [PubMed]
- Sarangi, P.K.; Nanda, S. Biohydrogen production through dark fermentation. Chem. Eng. Technol. 2020, 43, 601–612. [Google Scholar] [CrossRef]
- Gawel, E.; Pannicke, N.; Hagemann, N. A Path Transition Towards a Bioeconomy—The Crucial Role of Sustainability. Sustainability 2019, 11, 3005. [Google Scholar] [CrossRef] [Green Version]
- D’Adamo, I.; Gastaldi, M.; Morone, P.; Rosa, P.; Sassanelli, C.; Settembre-Blundo, D.; Shen, Y. Bioeconomy of Sustainability: Drivers, Opportunities and Policy Implications. Sustainability 2022, 14, 200. [Google Scholar] [CrossRef]
- Majer, S.; Wurster, S.; Moosmann, D.; Ladu, L.; Sumfleth, B.; Thrän, D. Gaps and Research Demand for Sustainability Certification and Standardisation in a Sustainable Bio-Based Economy in the EU. Sustainability 2018, 10, 2455. [Google Scholar] [CrossRef] [Green Version]
- D’Adamo, I.; Gastaldi, M.; Imbriani, C.; Morone, P. Assessing regional performance for the Sustainable Development Goals in Italy. Sci. Rep. 2021, 11, 24117. [Google Scholar] [CrossRef]
- Kucharska, K.; Rybarczyk, P.; Hołowacz, I.; Łukajtis, R.; Glinka, M.; Kamiński, M. Pretreatment of Lignocellulosic Materials as Substrates for Fermentation Processes. Molecules 2018, 23, 2937. [Google Scholar] [CrossRef] [Green Version]
- Kumar, A.K.; Sharma, S. Recent updates on different methods of pretreatment of lignocellulosic feedstocks: A review. Bioresour. Bioprocess. 2017, 4, 7. [Google Scholar] [CrossRef] [Green Version]
- Aarthy, A.; Kumari, S.; Turkar, P.; Subramanian, S. An insight on algal cell disruption for biodiesel production. Asian J. Pharm. Clin. Res. 2018, 11, 21–26. [Google Scholar] [CrossRef] [Green Version]
- Naveena, B.; Armshaw, P.; Pembroke, J.T. Ultrasonic intensification as a tool for enhanced microbial biofuel yields. Biotechnol. Biofuels 2015, 8, 140. [Google Scholar] [CrossRef] [PubMed] [Green Version]
- SriBala, G.; Chennuru, R.; Mahapatra, S.; Vinu, R. Effect of alkaline ultrasonic pretreatment on crystalline morphology and enzymatic hydrolysis of cellulose. Cellulose 2016, 23, 1725–1740. [Google Scholar] [CrossRef]
- Mamvura, T.A.; Iyuke, S.E.; Paterson, A.E. Energy changes during use of high-power ultrasound on food grade surfaces. South Afr. J. Chem. Eng. 2018, 25, 62–73. [Google Scholar] [CrossRef]
- Wahid, R.; Romero-Guiza, M.; Moset, V.; Møller, H.B.; Fernández, B. Improved anaerobic biodegradability of wheat straw, solid cattle manure and solid slaughterhouse by alkali, ultrasonic and alkali-ultrasonic pre-treatment. Environ. Technol. 2020, 41, 997–1006. [Google Scholar] [CrossRef]
- Tamilarasan, K.; Banu, J.R.; Kumar, M.D.; Sakthinathan, G.; Park, J.-H. Influence of Mild-Ozone Assisted Disperser Pretreatment on the Enhanced Biogas Generation and Biodegradability of Green Marine Macroalgae. Front. Energy Res. 2019, 7, 89. [Google Scholar] [CrossRef]
- Kumar, A.; Kamra, D.; Agarwal, N.; Chaudhary, L. Effect of Graded Levels of Bromoethanesulfonic Acid Supplementation on Methane Production, Rumen Microbial Diversity and Fermentation Characteristics. Anim. Nutr. Feed Technol. 2019, 19, 15. [Google Scholar] [CrossRef]
- Vasiliadou, I.; Berná, A.; Manchon, C.; Melero, J.A.; Martinez, F.; Esteve-Nuñez, A.; Puyol, D. Biological and Bioelectrochemical Systems for Hydrogen Production and Carbon Fixation Using Purple Phototrophic Bacteria. Front. Energy Res. 2018, 6, 107. [Google Scholar] [CrossRef] [Green Version]
- Woo, H.C.; Kim, Y.H. Eco-efficient recovery of bio-based volatile C2–6 fatty acids. Biotechnol. Biofuels 2019, 12, 92. [Google Scholar] [CrossRef] [Green Version]
- Kumar, M.D.; Kaliappan, S.; Gopikumar, S.; Zhen, G.; Banu, J.R. Synergetic pretreatment of algal biomass through H2O2 induced microwave in acidic condition for biohydrogen production. Fuel 2019, 253, 833–839. [Google Scholar] [CrossRef]
- Magrini, F.E.; de Almeida, G.M.; Soares, D.D.M.; Fuentes, L.; Ecthebehere, C.; Beal, L.L.; da Silveira, M.M.; Paesi, S. Effect of different heat treatments of inoculum on the production of hydrogen and volatile fatty acids by dark fermentation of sugarcane vinasse. Biomass Convers. Biorefinery 2020, 11, 2443–2456. [Google Scholar] [CrossRef]
- Kumar, M.D.; Tamilarasan, K.; Kaliappan, S.; Banu, J.R.; Rajkumar, M.; Kim, S.H. Surfactant assisted disperser pretreatment on the liquefaction of Ulva reticulata and evaluation of biodegradability for energy efficient biofuel production through nonlinear regression modelling. Bioresour. Technol. 2018, 255, 116–122. [Google Scholar] [CrossRef]
- Weijun, Y. Analytical accuracy of hydrogen measurement using gas chromatography with thermal conductivity detection. J. Sep. Sci. 2015, 38, 2640–2646. [Google Scholar] [CrossRef]
- Kavitha, S.; Banu, J.R.; Subitha, G.; Ushani, U.; Yeom, I.T. Impact of thermo-chemo-sonic pretreatment in solubilizing waste activated sludge for biogas production: Energetic analysis and economic assessment. Bioresour. Technol. 2016, 219, 479–486. [Google Scholar] [CrossRef]
- APHA; AWWA. WEF, Standard Methods for the Examination of Water and Wastewater, 21st ed.; American Public Health Association/American Water Works Association/Water Environment Federation: Washington, DC, USA, 2005. [Google Scholar]
- Banu, J.R.; Tamilarasan, K.; Rani, R.U.; Gunasekaran, M.; Cho, S.-K.; Al-Muhtaseb, A.H.; Kumar, G. Dispersion aided tenside disintegration of seagrass Syringodium isoetifolium: Towards biomethanation, kinetics, energy exploration and evaluation. Bioresour. Technol. 2019, 277, 62–67. [Google Scholar] [CrossRef]
- Karlsson, H.; Ahlgren, S.; Sandgren, M.; Passoth, V.; Wallberg, O.; Hansson, P.-A. A systems analysis of biodiesel production from wheat straw using oleaginous yeast: Process design, mass and energy balances. Biotechnol. Biofuels 2016, 9, 229. [Google Scholar] [CrossRef] [Green Version]
- Shojaeiarani, J.; Bajwa, D.; Holt, G. Sonication amplitude and processing time influence the cellulose nanocrystals morphology and dispersion. Nanocomposites 2020, 6, 41–46. [Google Scholar] [CrossRef] [Green Version]
- Karray, R.; Hamza, M.; Sayadi, S. Evaluation of ultrasonic, acid, thermo-alkaline and enzymatic pre-treatments on anaerobic digestion of Ulva rigida for biogas production. Bioresour. Technol. 2015, 187, 205–213. [Google Scholar] [CrossRef]
- Soontornchaiboon, W.; Kim, S.M.; Pawongrat, R. Effects of alkaline combined with ultrasonic pretreatment and en zymatic hydrolysis of agricultural wastes for high reducing sugar production. Sains Malays. 2016, 45, 955–962. [Google Scholar]
- Jákói, Z.; Lemmer, B.; Hodúr, C.; Beszédes, S. Microwave and Ultrasound Based Methods in Sludge Treatment: A Review. Appl. Sci. 2021, 11, 7067. [Google Scholar] [CrossRef]
- Kumar, G.; Sivagurunathan, P.; Zhen, G.; Kobayashi, T.; Kim, S.-H.; Xu, K. Combined pretreatment of electrolysis and ultra-sonication towards enhancing solubilization and methane production from mixed microalgae biomass. Bioresour. Technol. 2017, 245, 196–200. [Google Scholar] [CrossRef]
- Li, W.; Leong, T.S.H.; Ashokkumar, M.; Martin, G.J.O. A study of the effectiveness and energy efficiency of ultrasonic emulsification. Phys. Chem. Chem. Phys. 2018, 20, 86–96. [Google Scholar] [CrossRef]
- Yin, Y.; Wang, J. Isolation and characterization of a novel strain Clostridium butyricum INET1 for fermentative hydrogen production. Int. J. Hydrogen Energy 2017, 42, 12173–12180. [Google Scholar] [CrossRef]
- Sambusiti, C.; Bellucci, M.; Zabaniotou, A.; Beneduce, L.; Monlau, F. Algae as promising feedstocks for fermentative biohydrogen production according to a biorefinery approach: A comprehensive review. Renew. Sustain. Energy Rev. 2015, 44, 20–36. [Google Scholar] [CrossRef]
- Tamilarasan, K.; Kavitha, S.; Banu, J.R.; Arulazhagan, P.; Yeom, I.T. Energy-efficient methane production from macroalgal biomass through chemo disperser liquefaction. Bioresour. Technol. 2017, 228, 156–163. [Google Scholar] [CrossRef]
- Yin, Y.; Wang, J. Pretreatment of macroalgal Laminaria japonica by combined microwave-acid method for biohydrogen production. Bioresour. Technol. 2018, 268, 52–59. [Google Scholar] [CrossRef]
- Yang, G.; Wang, J. Pretreatment of grass waste using combined ionizing radiation-acid treatment for enhancing fermentative hydrogen production. Bioresour. Technol. 2018, 255, 7–15. [Google Scholar] [CrossRef]
- Xia, A.; Jacob, A.; Tabassum, M.R.; Herrmann, C.; Murphy, J.D. Production of hydrogen, ethanol and volatile fatty acids through co-fermentation of macro- and micro-algae. Bioresour. Technol. 2016, 205, 118–125. [Google Scholar] [CrossRef]
- Hatamoto, M.; Kaneko, T.; Takimoto, Y.; Ito, T.; Miyazato, N.; Maki, S.; Yamaguchi, T.; Aoi, T. Microbial Community Structure and Enumeration of Bacillus species in Activated Sludge. J. Water Environ. Technol. 2017, 15, 233–240. [Google Scholar] [CrossRef] [Green Version]
- Kannah, R.Y.; Kavitha, S.; Sivashanmugham, P.; Kumar, G.; Nguyen, D.D.; Chang, S.W.; Banu, J.R. Biohydrogen production from rice straw: Effect of combinative pretreatment, modelling assessment and energy balance consideration. Int. J. Hydrogen Energy 2019, 44, 2203–2215. [Google Scholar] [CrossRef]
- Tamilarasan, K.; Arulazhagan, P.; Rani, R.U.; Kaliappan, S.; Banu, J.R. Synergistic impact of sonic-tenside on biomass disintegration potential: Acidogenic and methane potential studies, kinetics and cost analytics. Bioresour. Technol. 2018, 253, 256–261. [Google Scholar] [CrossRef]
- Liu, H.; Wang, G. Fermentative hydrogen production from macro-algae Laminaria japonica using anaerobic mixed bacteria. Int. J. Hydrogen Energy 2014, 39, 9012–9017. [Google Scholar] [CrossRef]
- Jung, K.-W.; Kim, D.-H.; Shin, H.-S. Fermentative hydrogen production from Laminaria japonica and optimization of thermal pretreatment conditions. Bioresour. Technol. 2011, 102, 2745–2750. [Google Scholar] [CrossRef]
- Radha, M.; Murugesan, A. Enhanced dark fermentative biohydrogen production from marine macroalgae Padina tetrastromatica by different pretreatment processes. Biofuel Res. J. 2017, 4, 551–558. [Google Scholar] [CrossRef]
- Sharmila, V.G.; Tamilarasan, K.; Kumar, M.D.; Kumar, G.; Varjani, S.; Kumar, S.A.; Banu, J.R. Trends in dark biohydrogen production strategy and linkages with transition towards low carbon economy: An outlook, cost-effectiveness, bottlenecks and future scope. Int. J. Hydrogen Energy 2022, 47, 15309–15332. [Google Scholar] [CrossRef]
- 55. Banu, J.R.; Tamilarasan, T.; Kavitha, S.; Gunasekaran, M.; Gopalakrishnankumar; Al-Muhtaseb, A.H. Energetically feasible biohydrogen production from sea eelgrass via homogenization through a surfactant, sodium tripolyphosphate. Int. J. Hydrogen Energy 2020, 45, 5900–5910. [Google Scholar] [CrossRef]


| Variation Source | Sum of Squares | Degrees of Freedom | Mean Square | F Value | p-Value Prob > F | Results |
|---|---|---|---|---|---|---|
| 10–40% | 56,512 | 3 | 977,011 | 0.5 | 0.46 | Not significant |
| 40–50% | 52,040,402 | 1 | 6,900,710 | 7.5 | 0.013 | Significant |
| 50–90% | 40,951 | 3 | 1,052,333 | 0.031 | 0.84 | Not significant |
| S. No. | Samples | K (mL/d) | HP (mL) | Hl (days) | R2 |
|---|---|---|---|---|---|
| 1 | SAS | 0.99 | 150.1 | 1.5 | 0.995 |
| 2 | SS | 0.67 | 119 | 2.6 | 0.986 |
| 3 | Control | 0.47 | 40 | 3.7 | 0.983 |
| S.no | Marine Macroalgae Species | Pretreatment | Operational Parameters | Hydrogen Yield | Reference |
|---|---|---|---|---|---|
| 1 | Ulva reticulata | Surfactant coupled with disperser pretreatment | Disperser—10,000 rpm, time—30 min, Surfactant—80 dosage (21.6 mg/L) | ∆Y: 63 mL H2/g COD | [30] |
| Acidic-hydrogen peroxide coupled with microwave pretreatment | Microwave power—40%, time—10 min, pH—5, H2O2 concentration—0.024 g/g TS, | ∆Y: 63 mL H2/g COD | [28] | ||
| 2 | Laminania Japonica | Heat pretreatment using autoclave | Temperature—121 °C, Duration—30 min | ∆Y: 83.45 ± 96 mL/g | [51] |
| Sonication pretreatment | Frequency—20Khz | ∆Y: 23.56 ± 4.56 mL/g | [51] | ||
| Thermal pretreatment | Temperature—170 °C Duration—20 min | ∆Y: 109.6 mL/g | [52] | ||
| Microwave combined with acidic pretreatment | Temperature—140 °C, Duration—15 min, H2SO4—1% | ∆Y: 28 mL/g | [45] | ||
| 3 | Padina tetrastromatica | Acidic pretreatment | Sulphuric acid— 1% v/v of H2SO4 | ∆Y: 78 ± 2.9 mL/0.05 gVS | [53] |
| 4 | Chaetomorpha antennina | Surfactant coupled with microwave pretreatment | Microwave power- 0.36 KW, Duration—15 min, Surfactant dosage—0.0035 g /g TS | ∆Y: 74.5 mL H2/g COD | [2] |
| Alkali (NaOH) combined with sonication pretreatment | Sonication intensity—50%, Duration—30 min, pH—11 | ∆Y: 150 mL H2/g COD | This study |
Publisher’s Note: MDPI stays neutral with regard to jurisdictional claims in published maps and institutional affiliations. |
© 2022 by the authors. Licensee MDPI, Basel, Switzerland. This article is an open access article distributed under the terms and conditions of the Creative Commons Attribution (CC BY) license (https://creativecommons.org/licenses/by/4.0/).
Share and Cite
Shankaran, S.; Karuppiah, T.; Jeyakumar, R.B. Chemo-Sonic Pretreatment Approach on Marine Macroalgae for Energy Efficient Biohydrogen Production. Sustainability 2022, 14, 12849. https://doi.org/10.3390/su141912849
Shankaran S, Karuppiah T, Jeyakumar RB. Chemo-Sonic Pretreatment Approach on Marine Macroalgae for Energy Efficient Biohydrogen Production. Sustainability. 2022; 14(19):12849. https://doi.org/10.3390/su141912849
Chicago/Turabian StyleShankaran, Shabarish, Tamilarasan Karuppiah, and Rajesh Banu Jeyakumar. 2022. "Chemo-Sonic Pretreatment Approach on Marine Macroalgae for Energy Efficient Biohydrogen Production" Sustainability 14, no. 19: 12849. https://doi.org/10.3390/su141912849