

Understanding the Role of Nature in Urban-Rural Linkages: Identifying the Potential Role of Rural Nature-Based Attractive Clusters That Serve Human Well-Being
 , , ,
, , ,
Abstract
:1. Introduction
2. Materials and Method
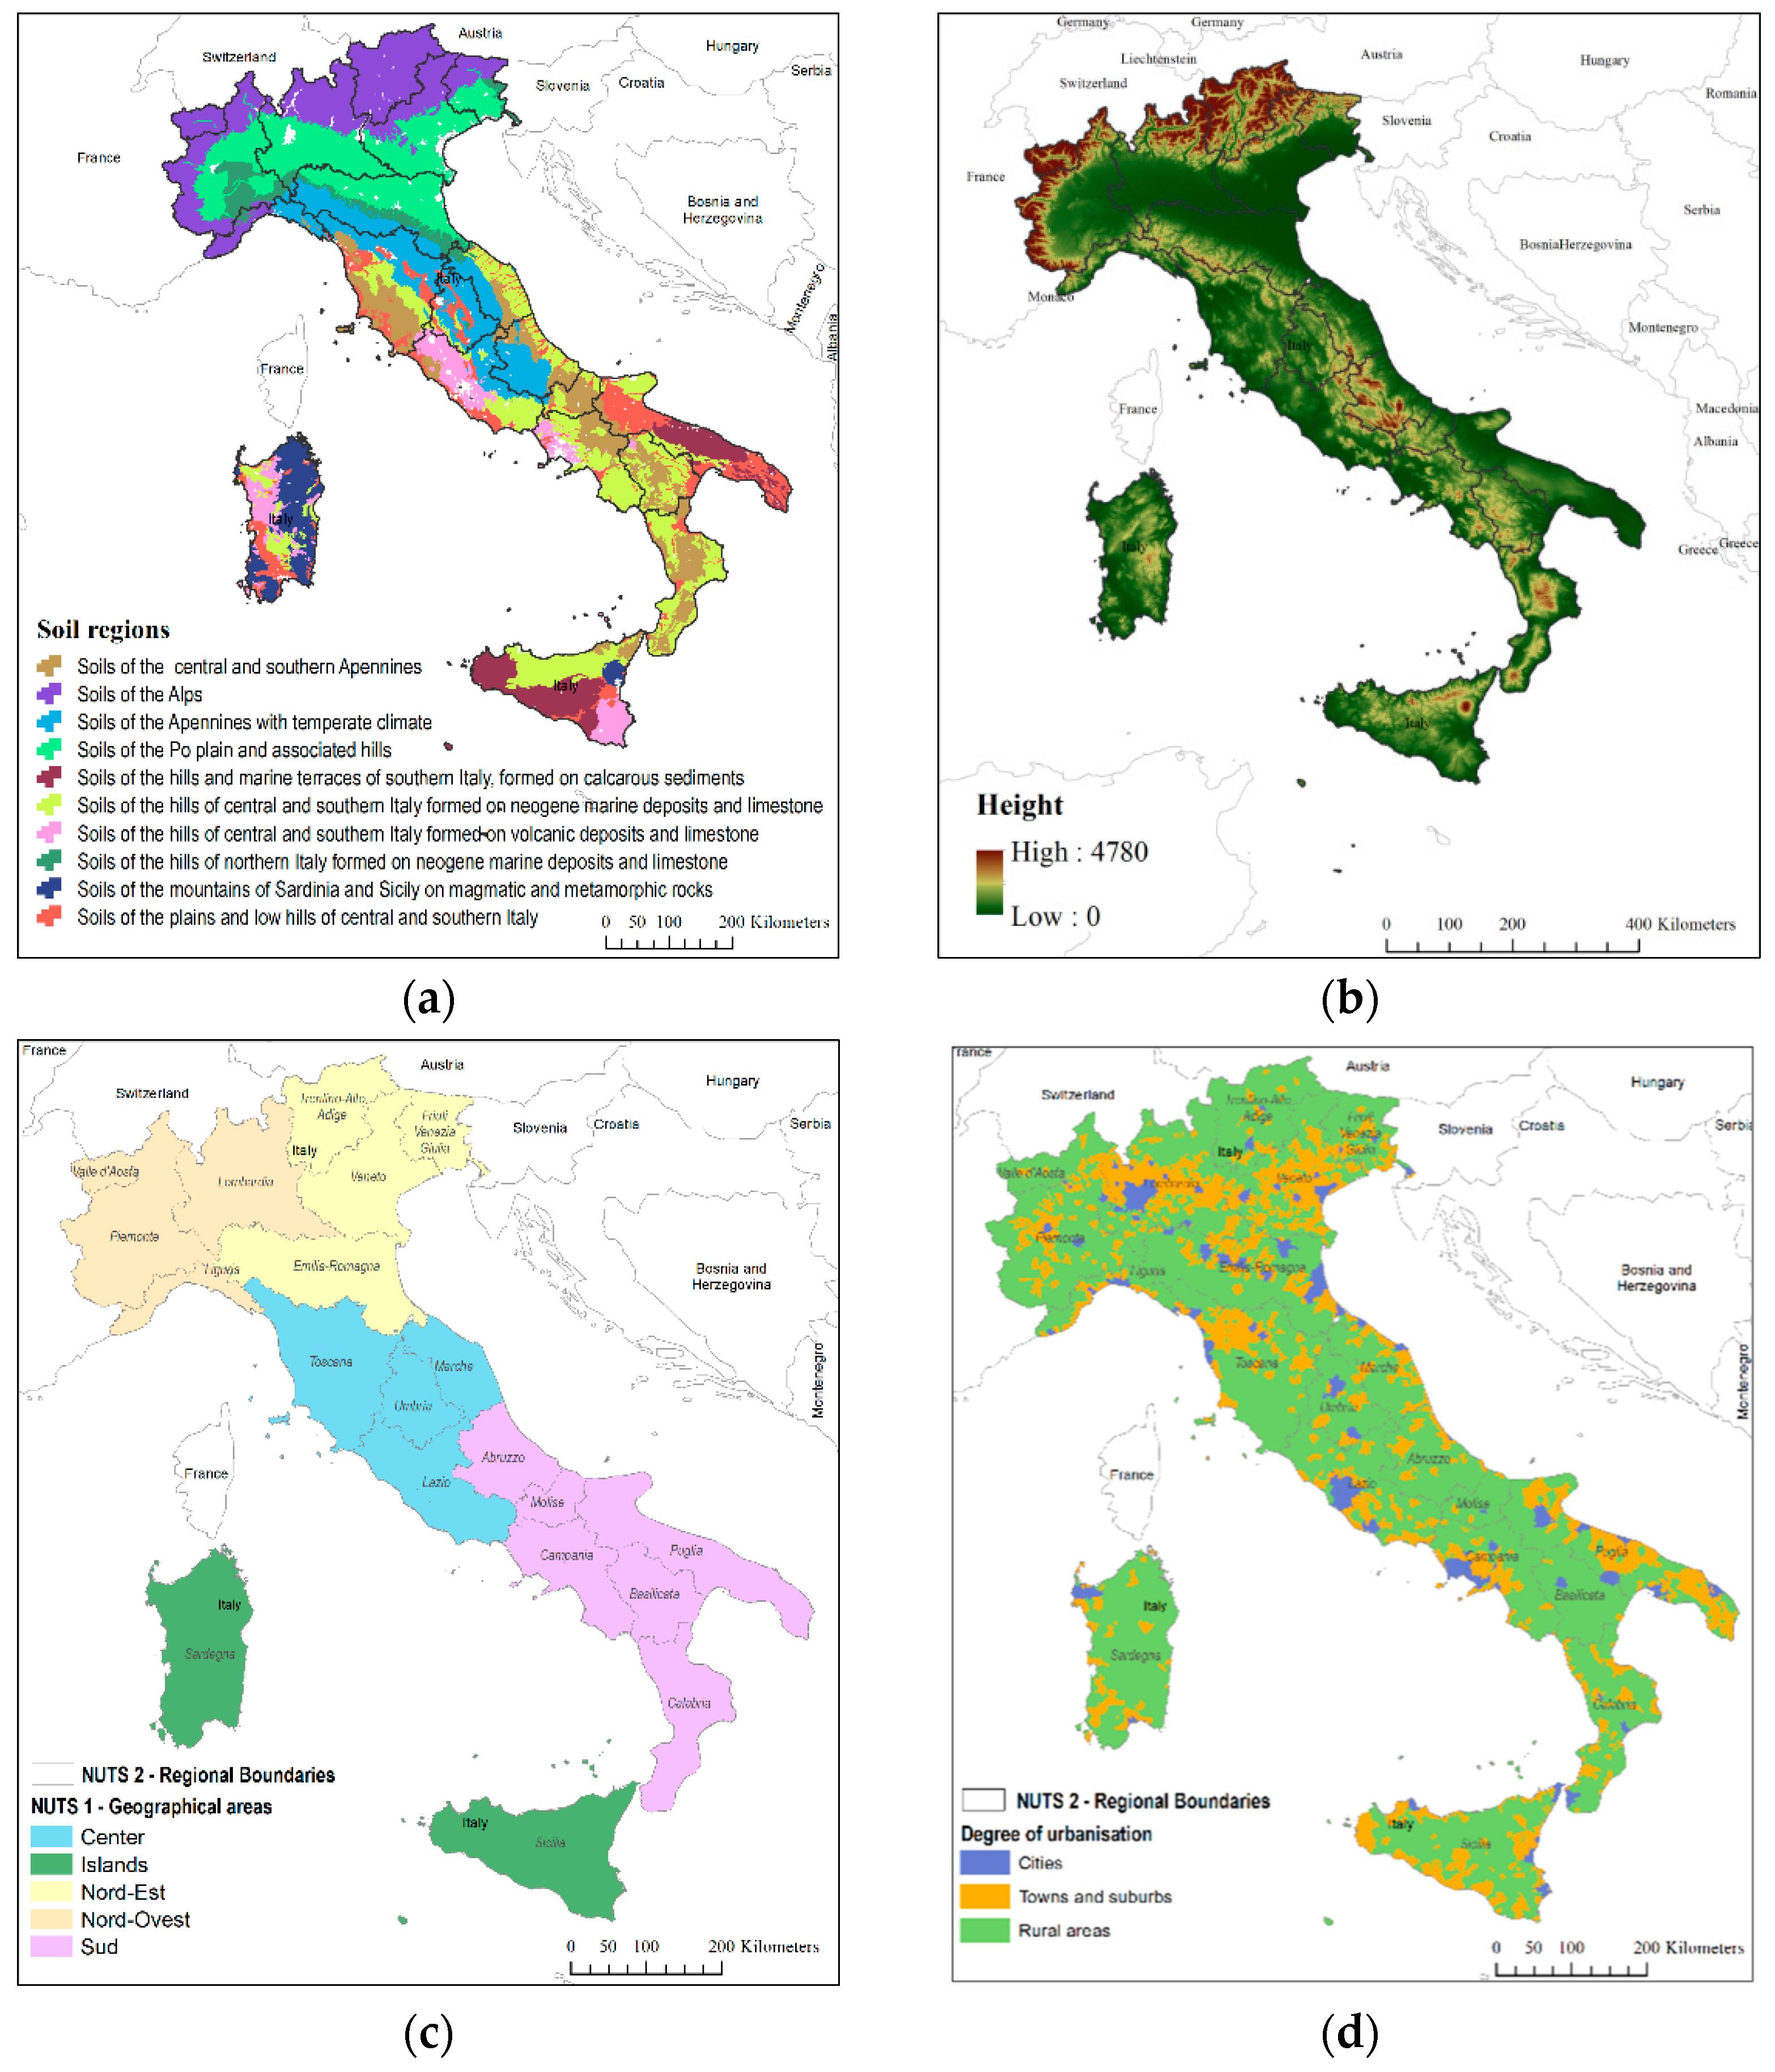
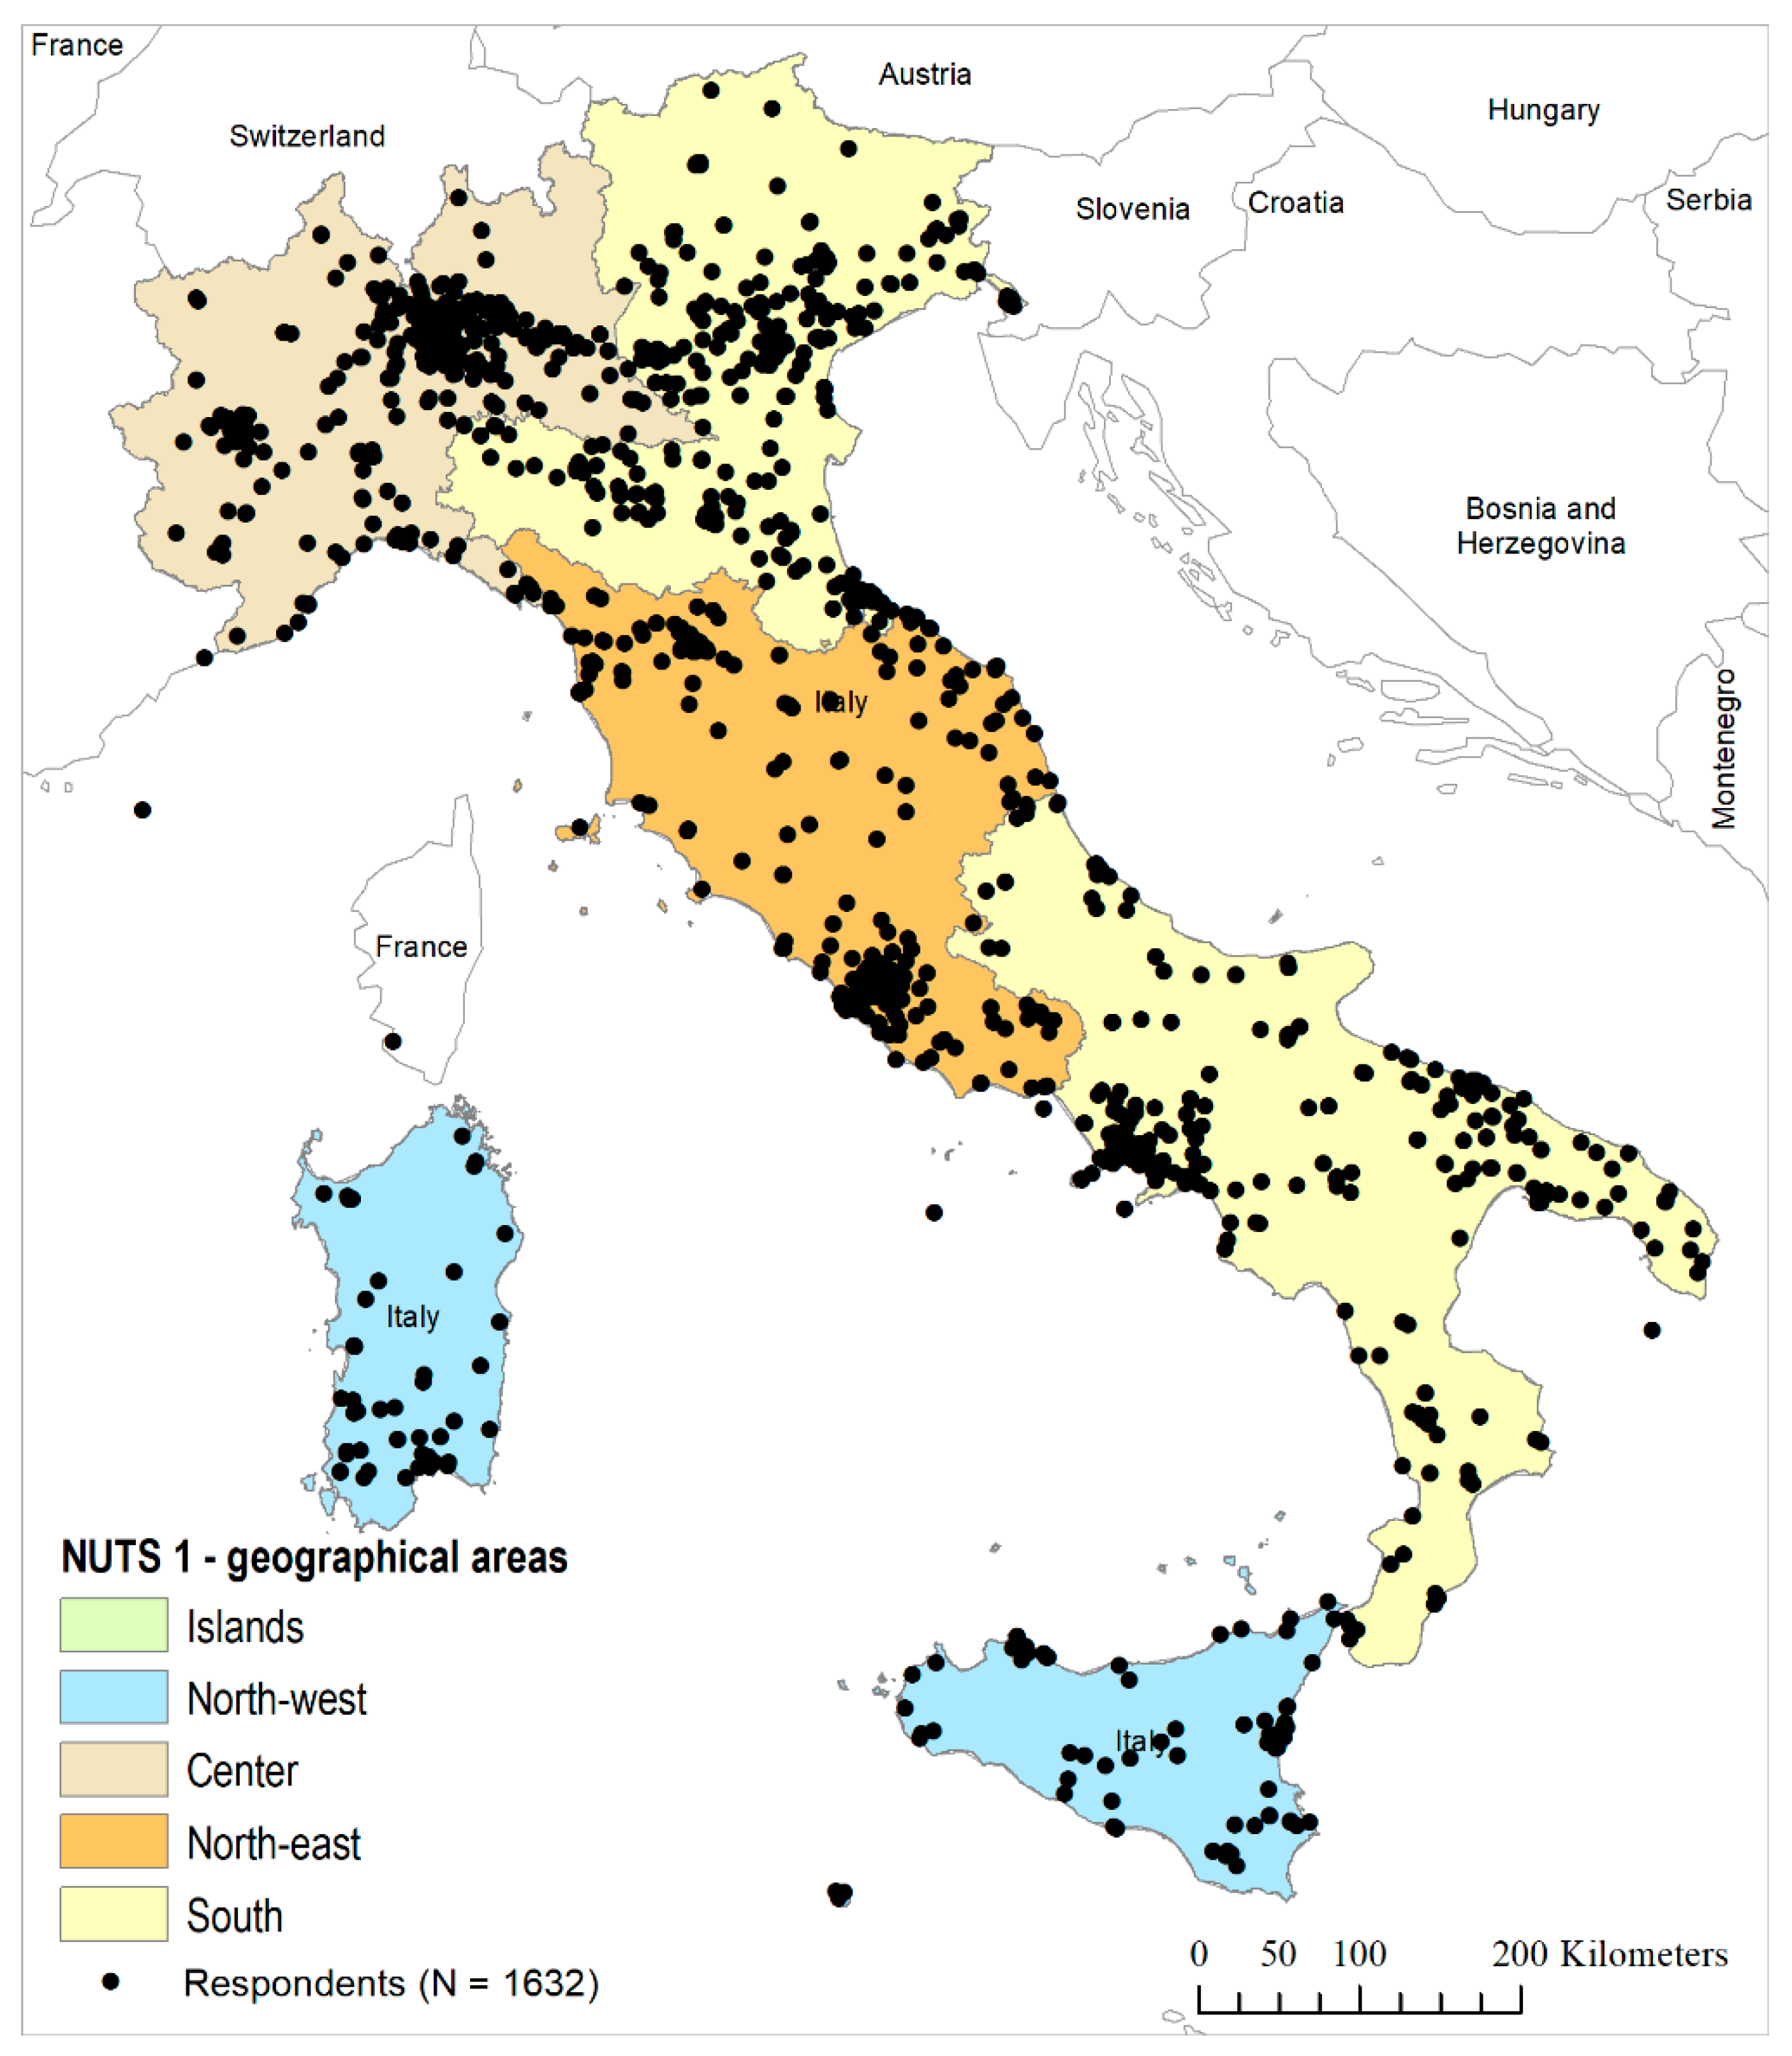
2.1. Study Area
2.2. Data Collection: Greenmapper Survey
- -
- level I—“Neighbourhood”: a circle with a radius of 2 km from home;
- -
- level II—“Living area”: a circle with a radius of 20 km from home;
- -
- level III—“Country”: the whole nation;
- -
- level IV—“Worldwide”: the world.
2.3. Nature-Based Attractive Clusters
- -
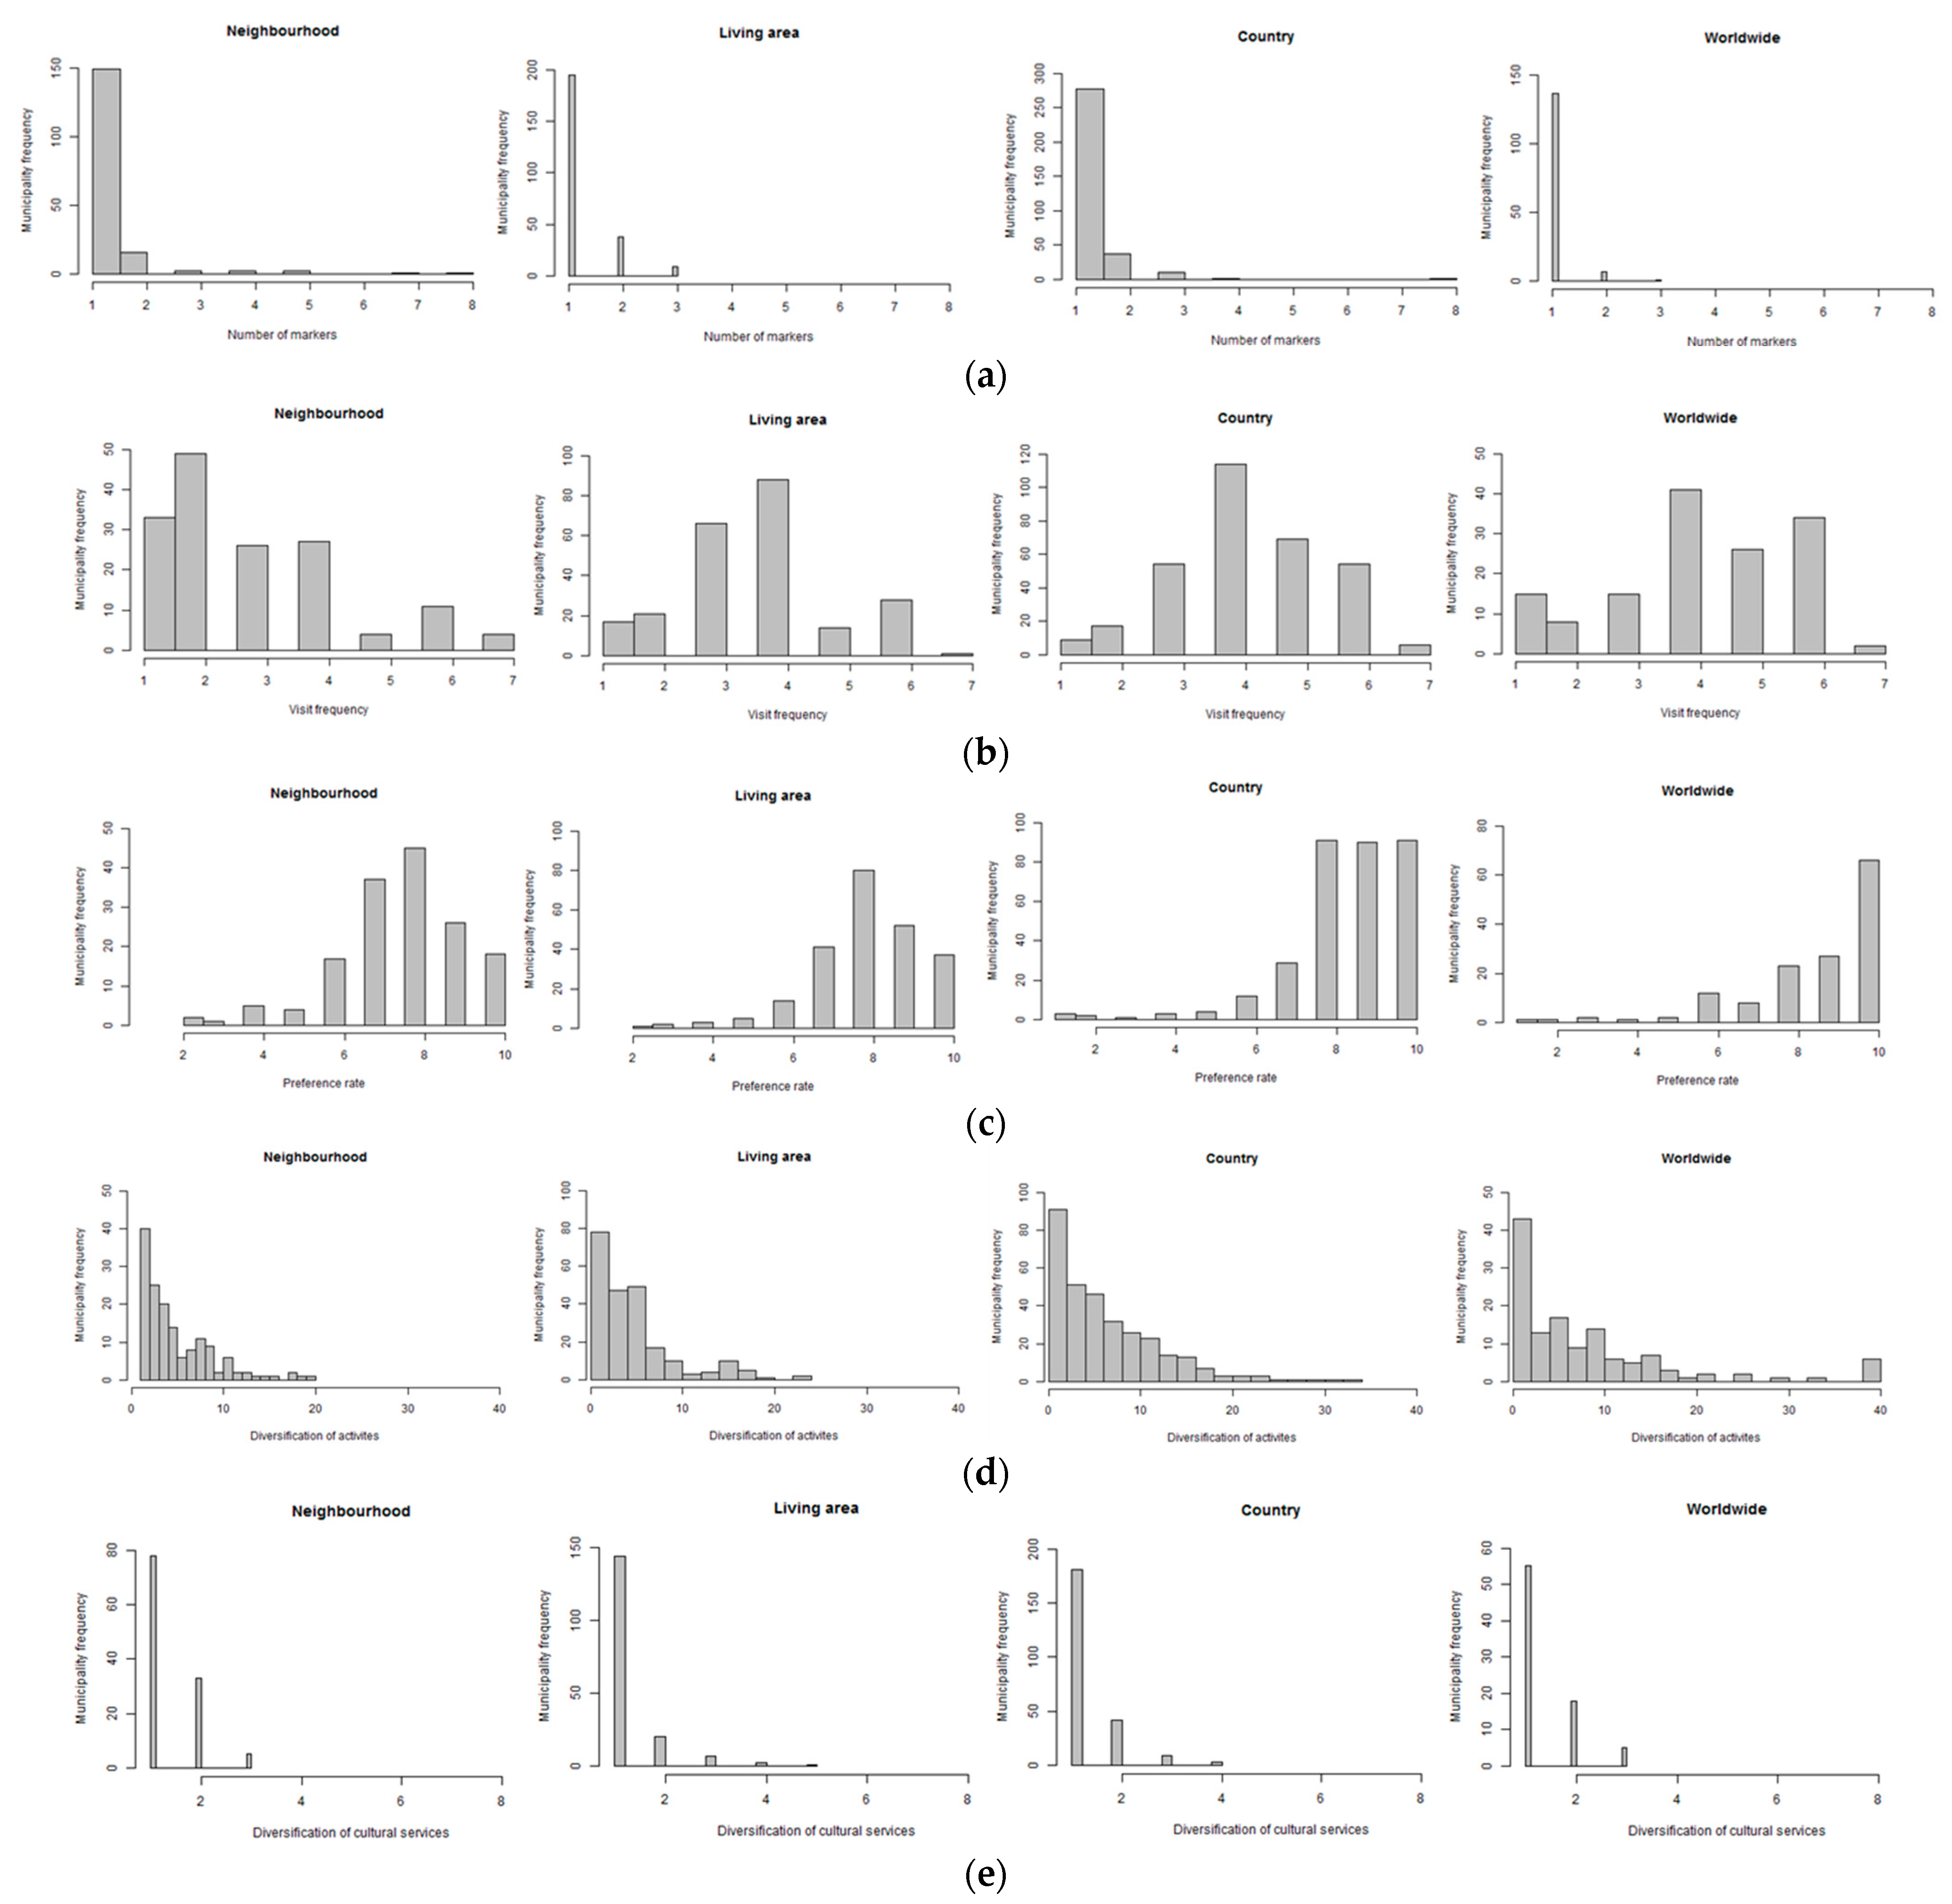
- the number of markers that fall in each municipality;
- -
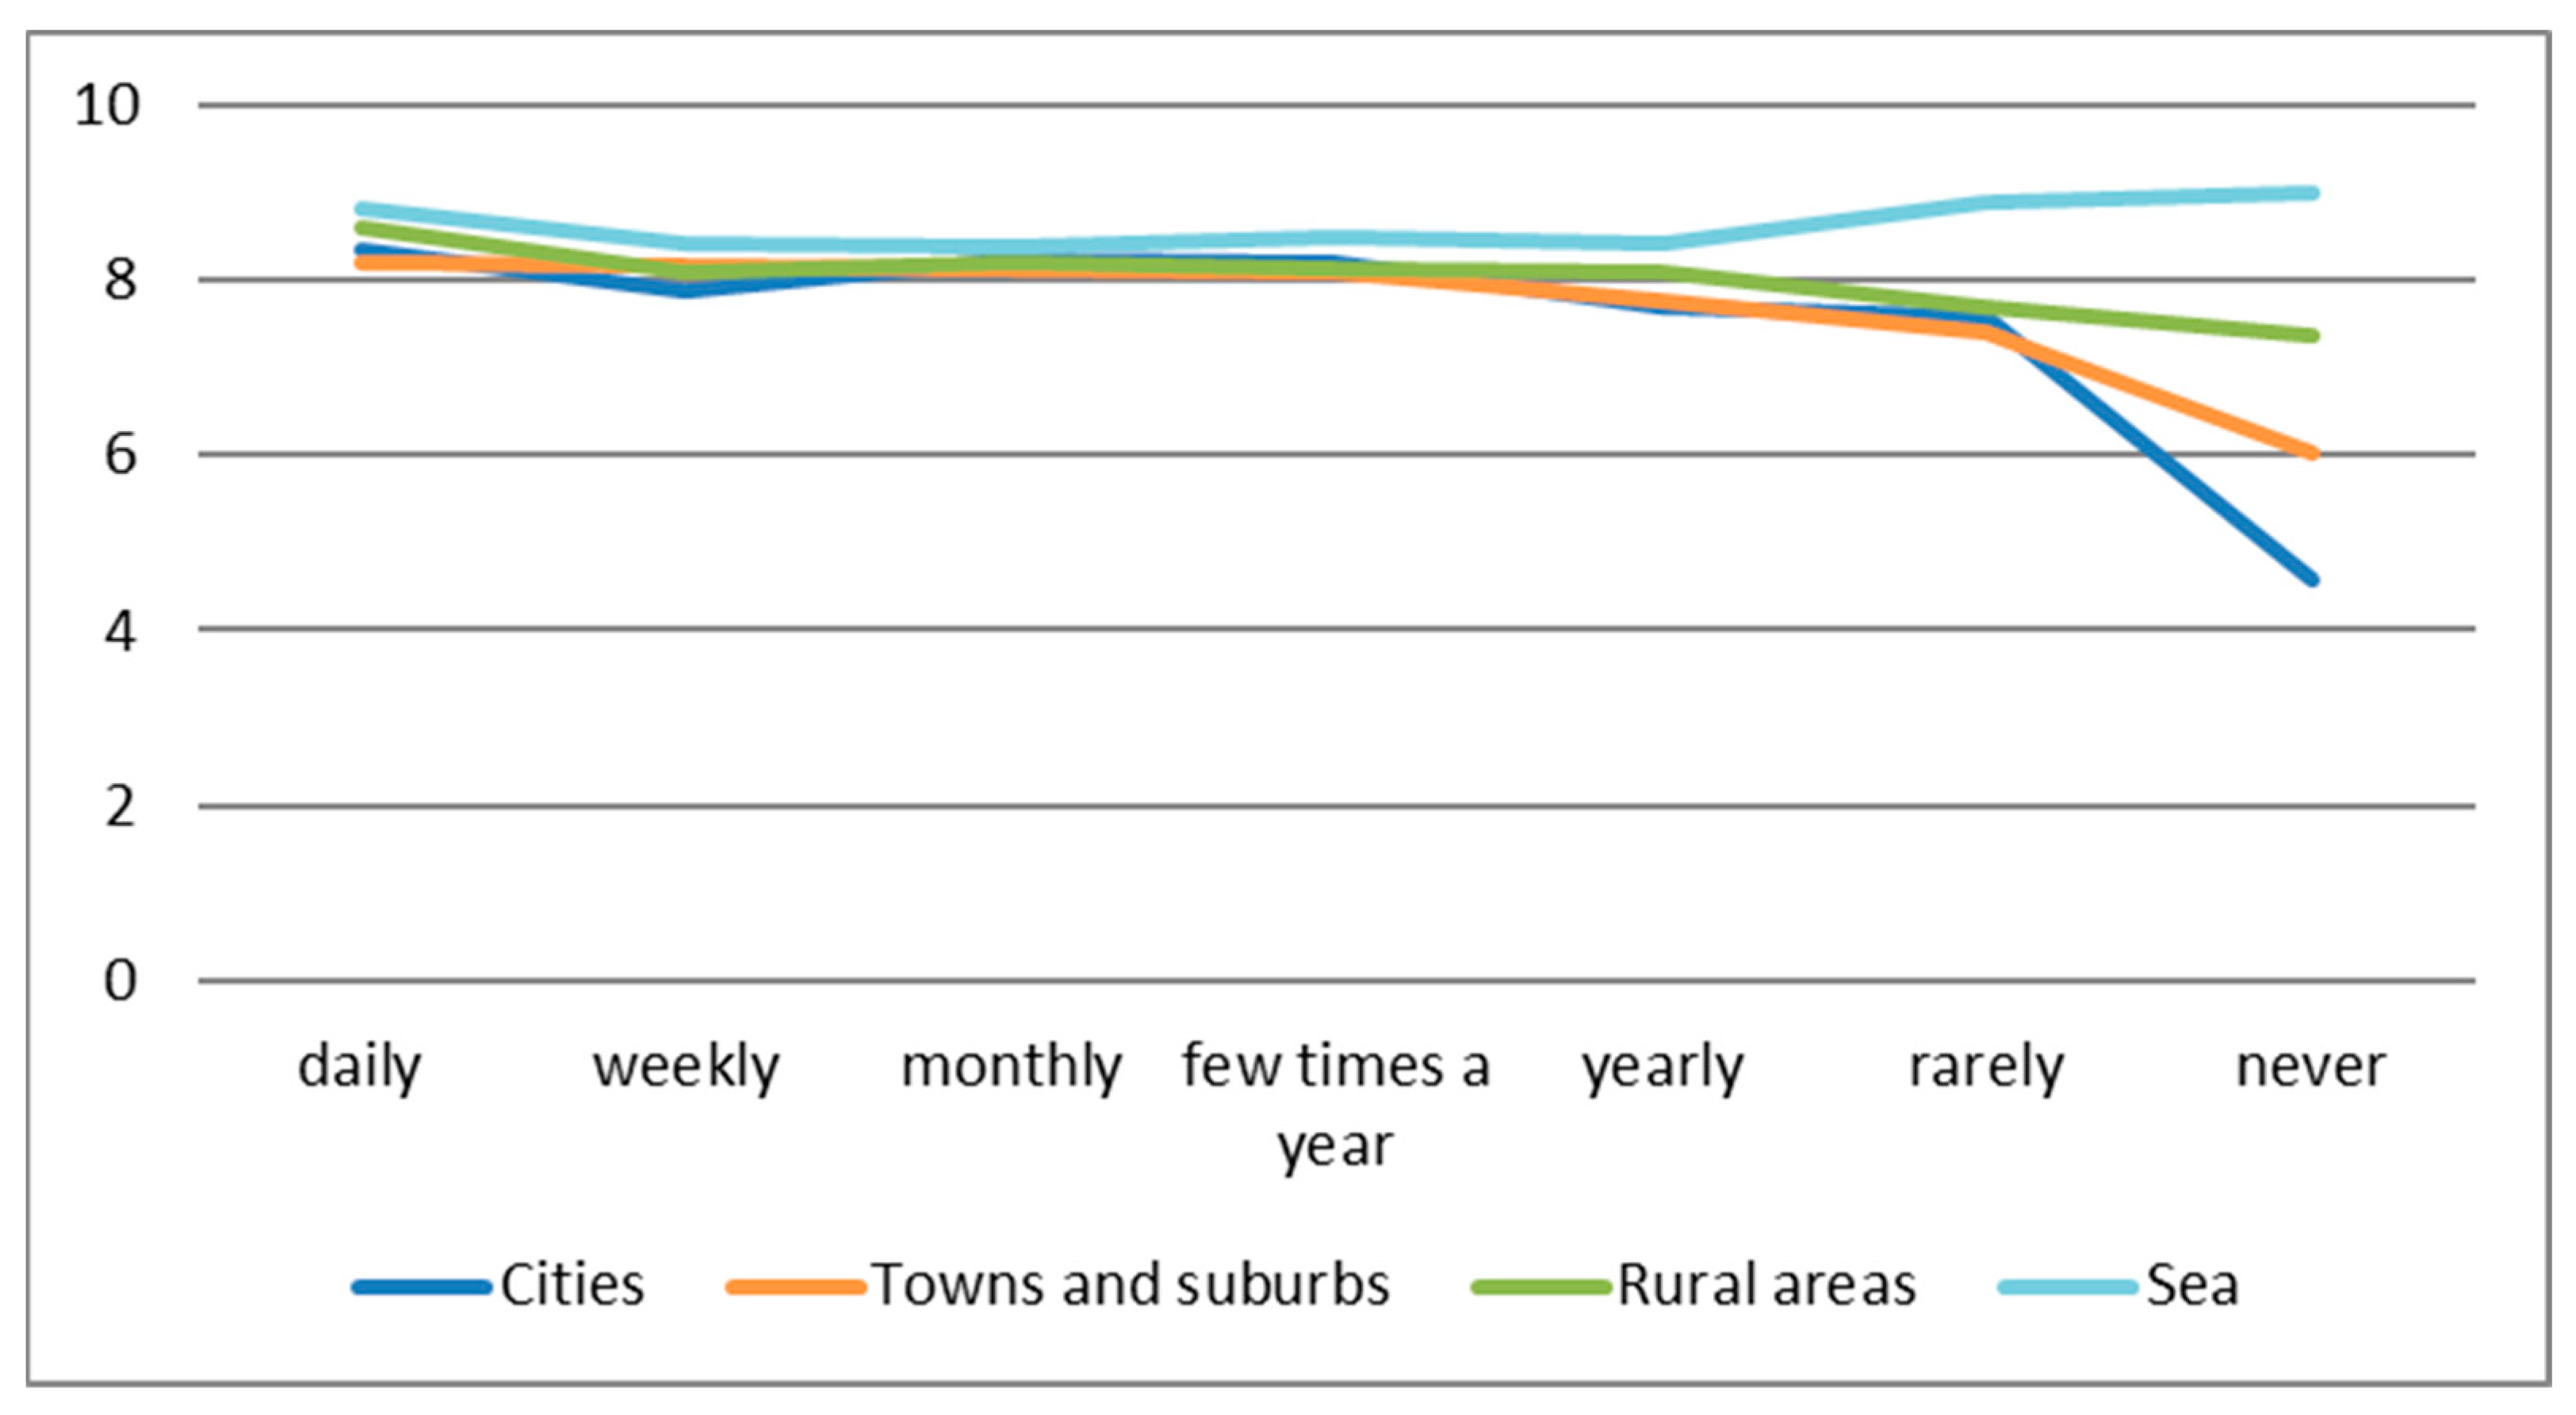
- the visit frequency of the marked places, since it allows us to discriminate the direct and indirect value linked to the preferences and if and how much the visit frequency and the preference rate are related. The visit frequency is divided into 7 classes; each class has been assigned a progressive number value: daily = “1”, weekly = “2”, monthly = “3”, few times a year = “4”, year = “5”, rarely = “6”, never = “7”;
- -
- the preference rate gives a measure of the satisfaction degree of places; it is expressed on a scale from 1 to 10 (1 as extremely unattractive and 10 as perfect);
- -
- the diversification of activities ranges between 1 and 39. It indirectly gives a measure of the offer of attraction in the different territories;
- -
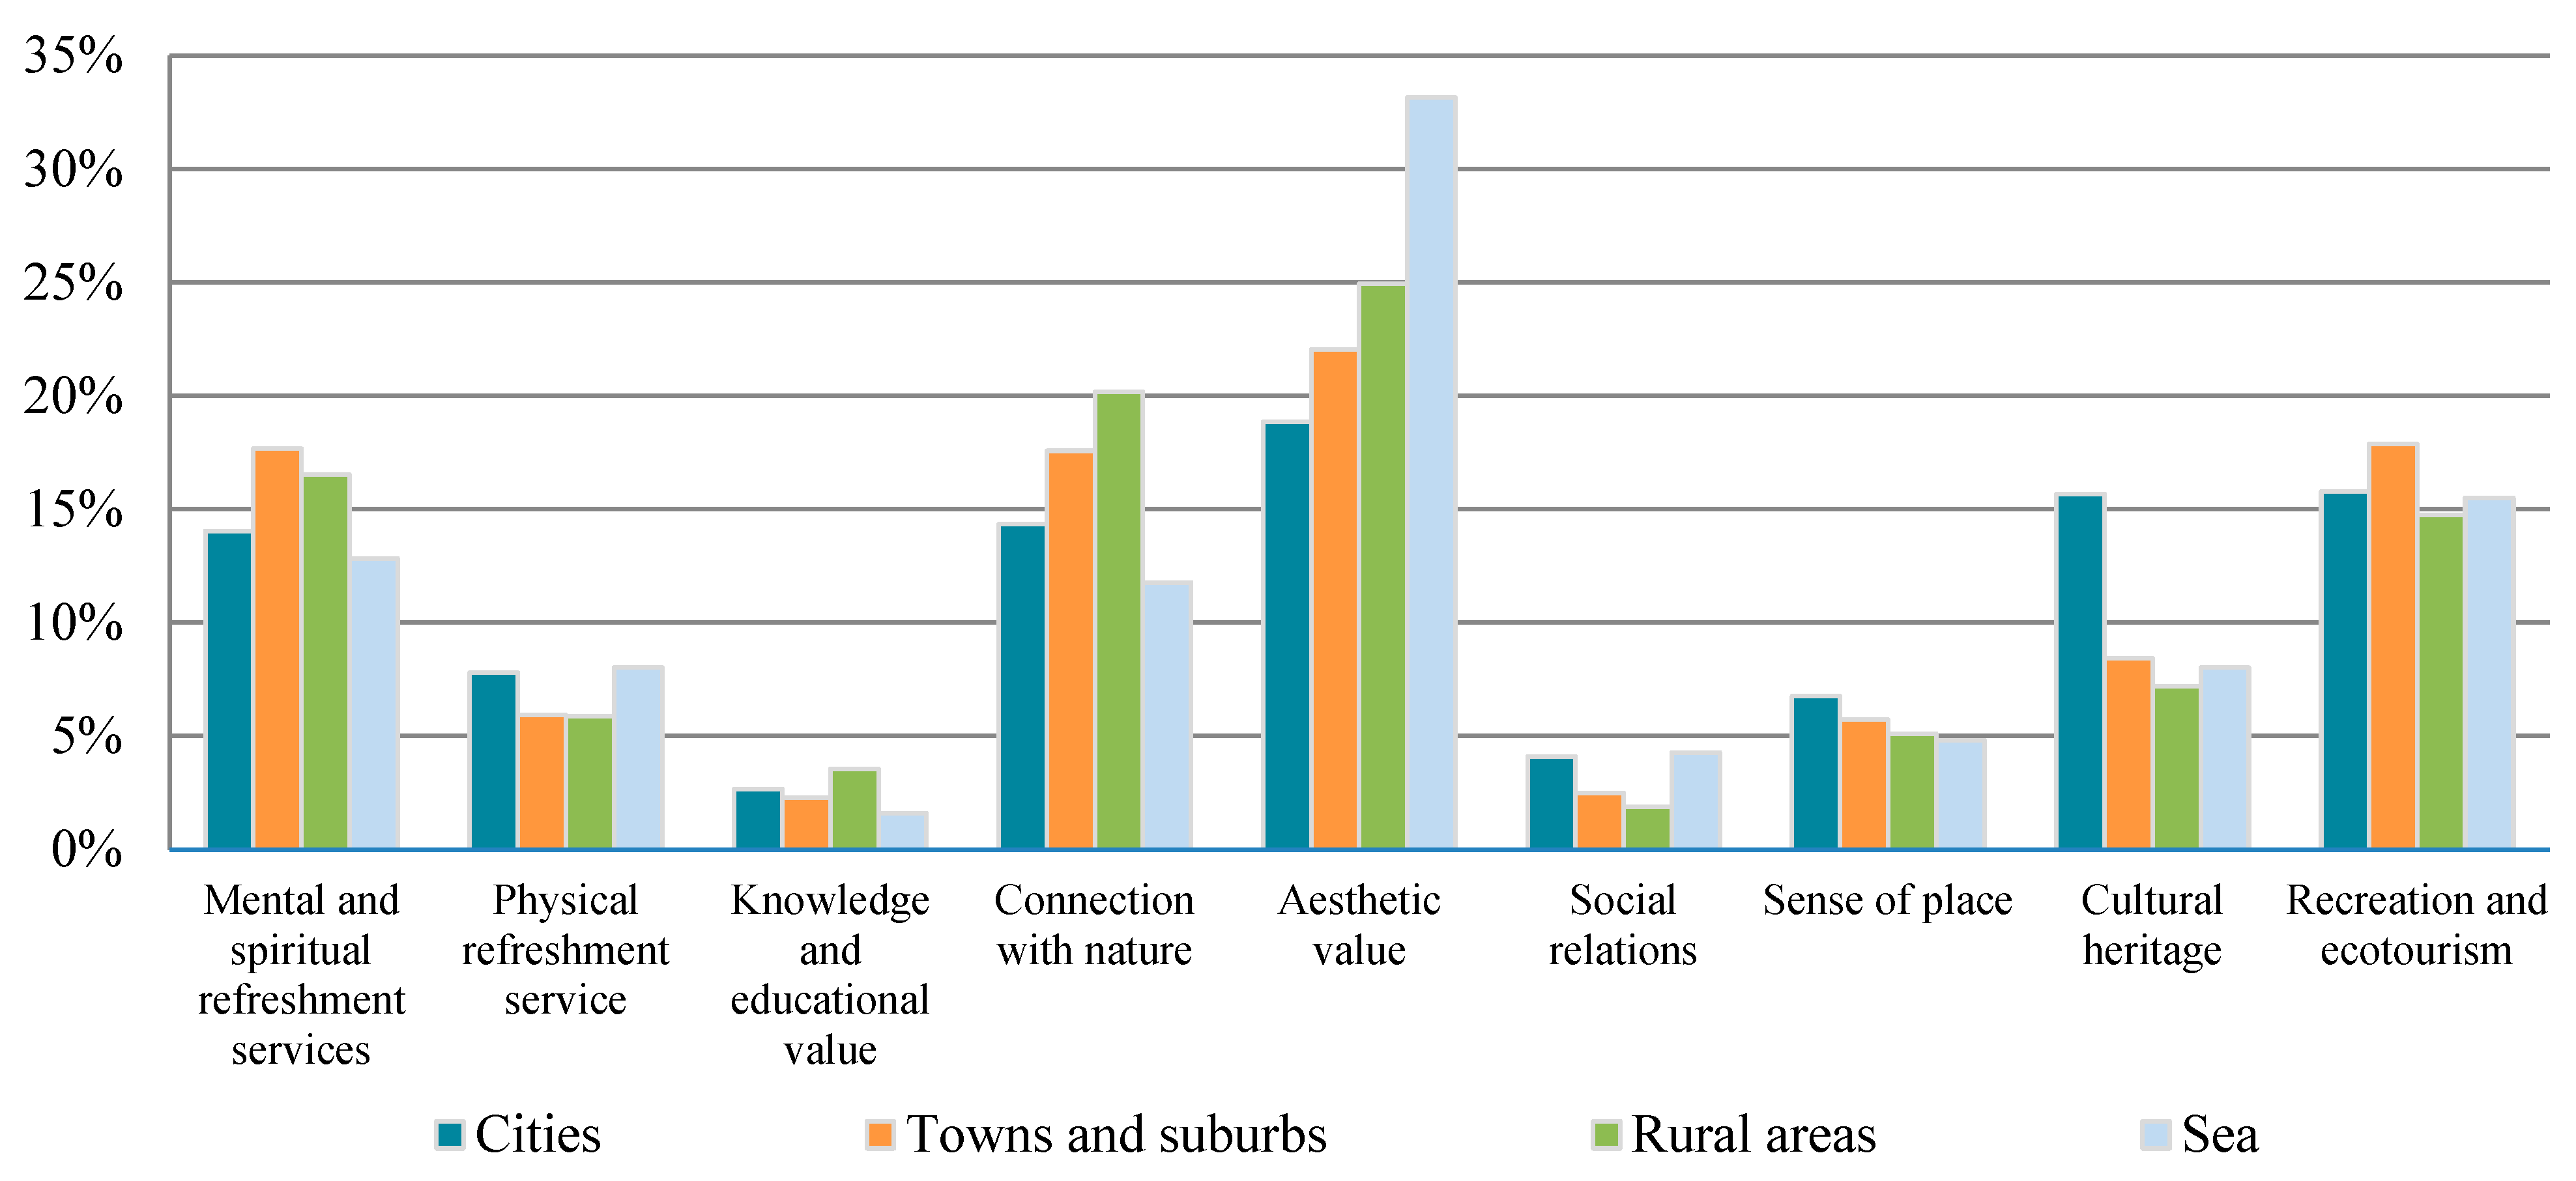
- the diversification of cultural services gives a measure of Cultural Ecosystem Services (CES) categories linked to the most attractive natural areas. We have coded the expressions of the open section on the basis of the categories proposed by the international classification systems (they include the Millennium Ecosystem Assessment, the Economics of Ecosystems and Biodiversity and the Common International Classification of Ecosystem Services). Table 1 shows the 9 ecosystem services components marked by an acronym, a description and an example of a typical answer for that category.
3. Results
3.1. Quantitative and Qualitative Analysis
3.2. Nature-Based Attractive Clusters within Rural Areas
3.2.1. Frequency Distribution of Indicators
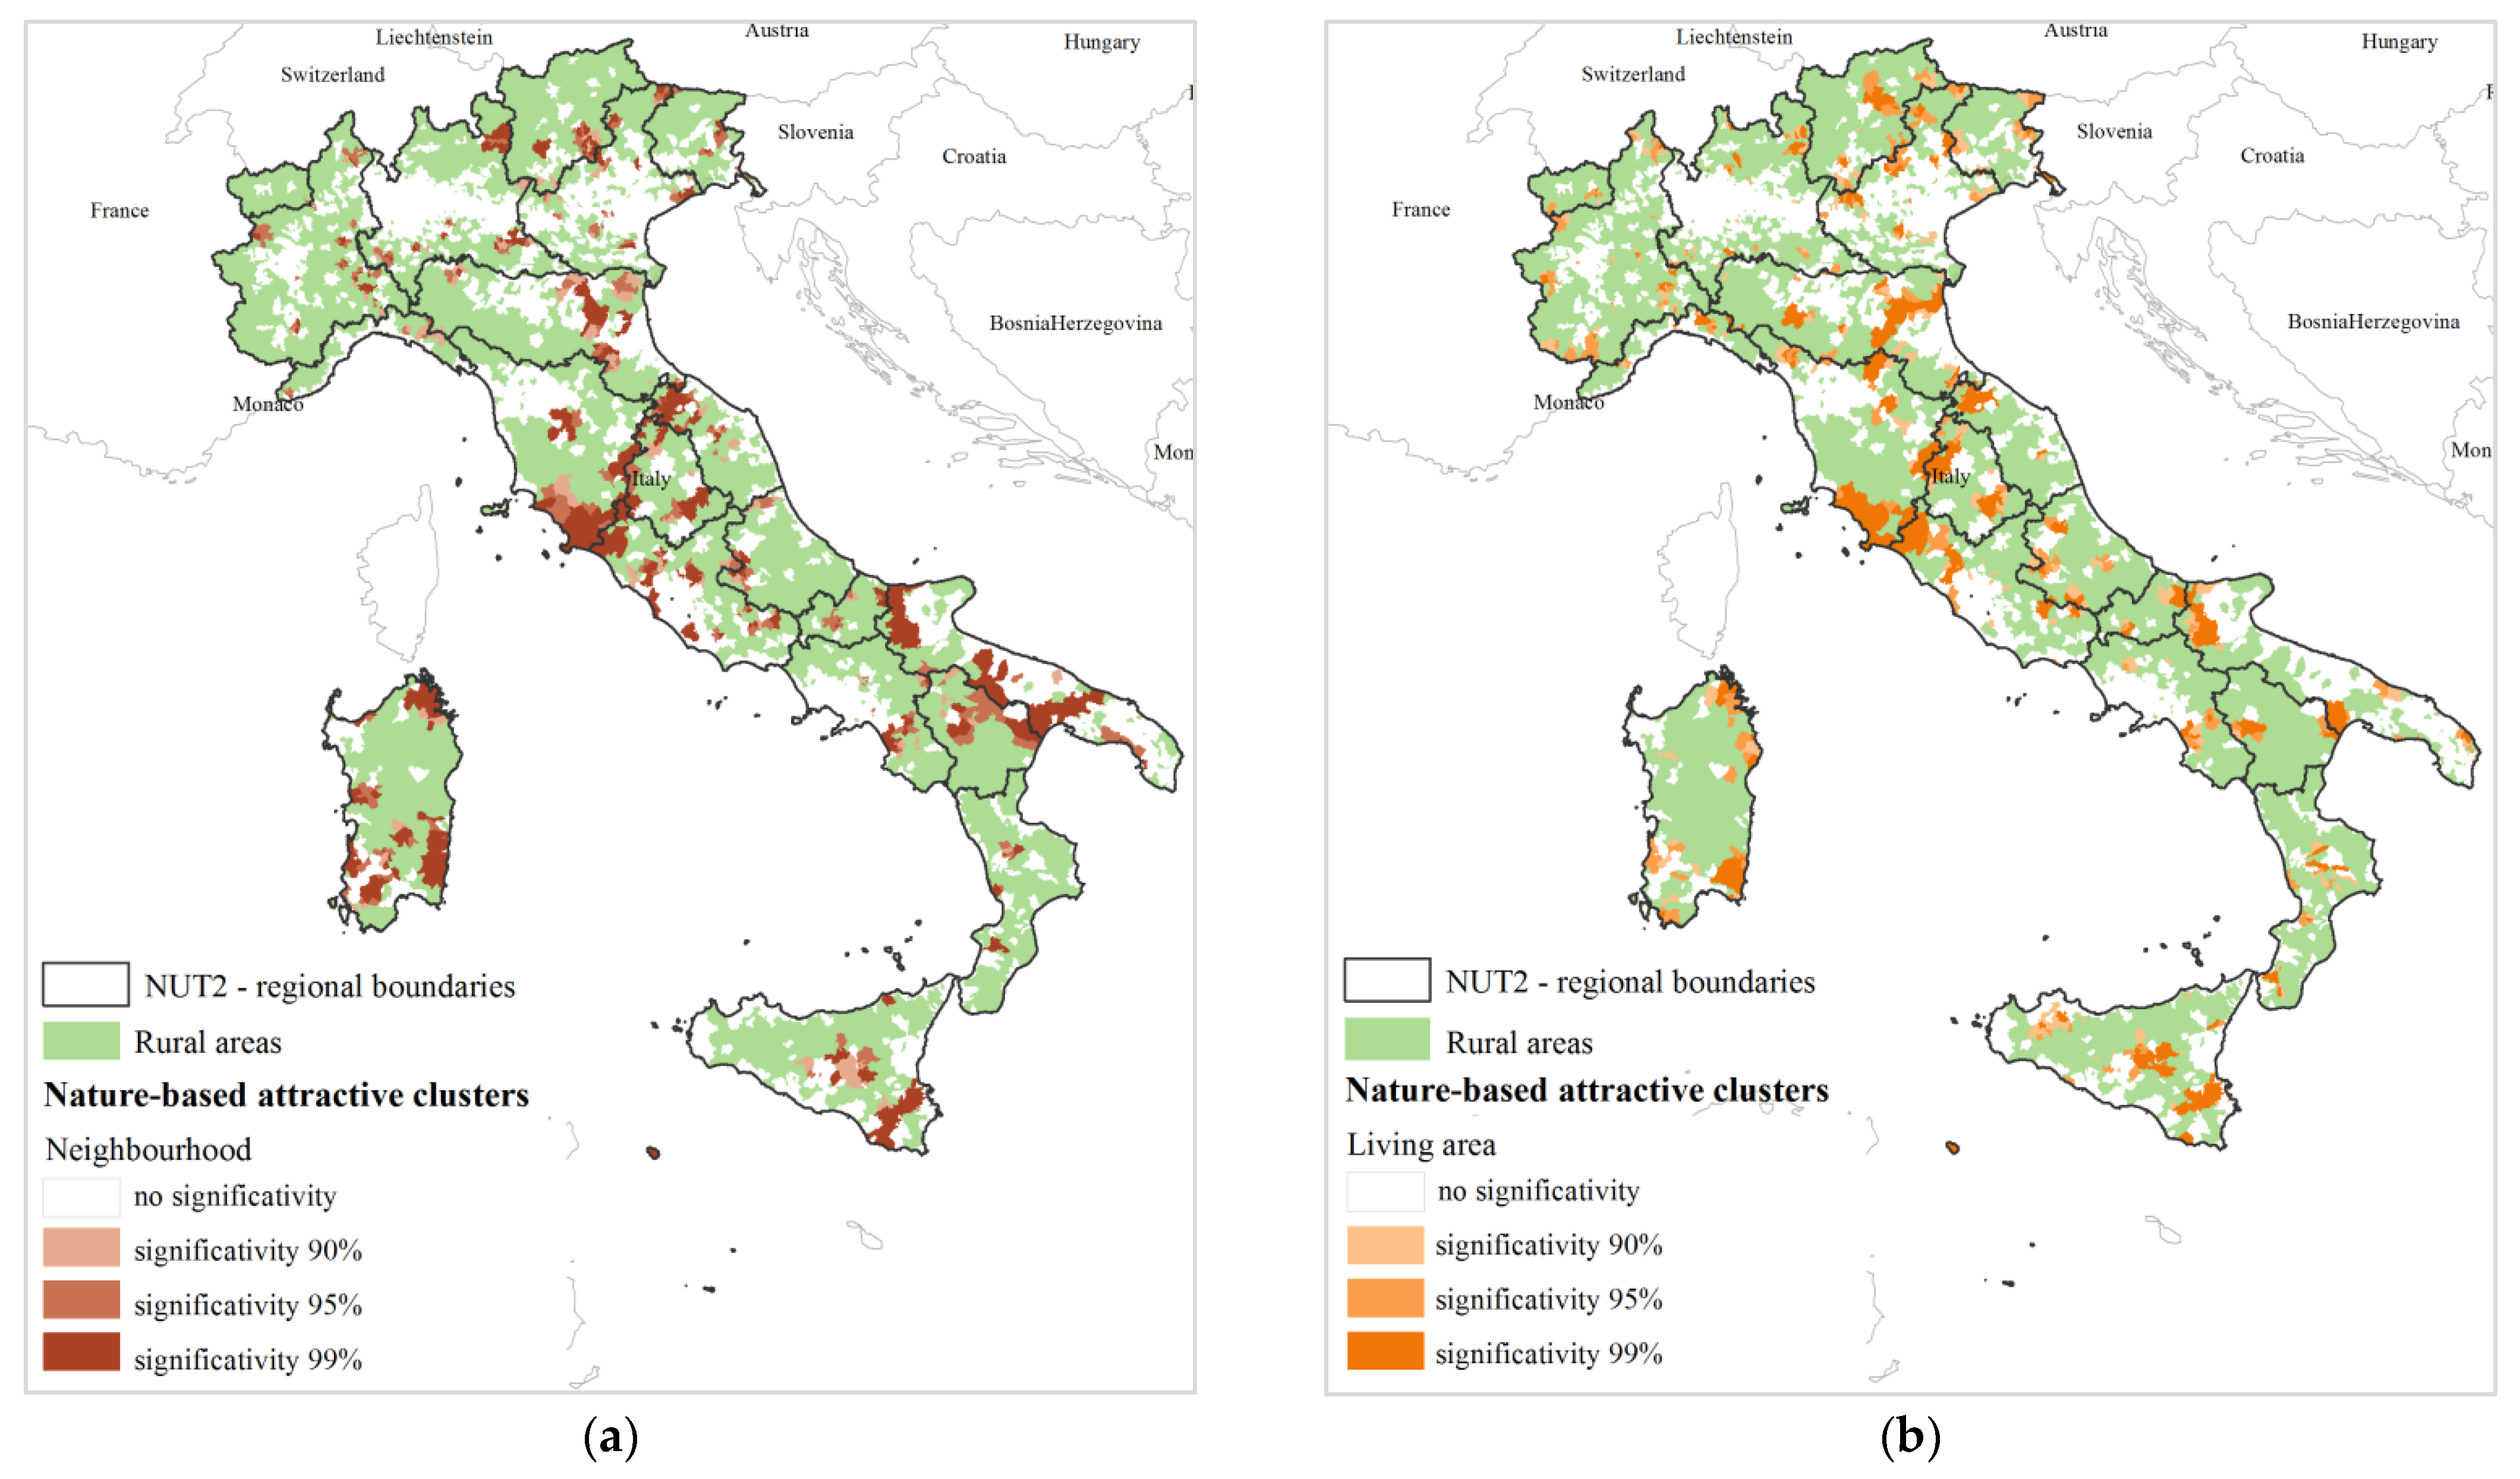
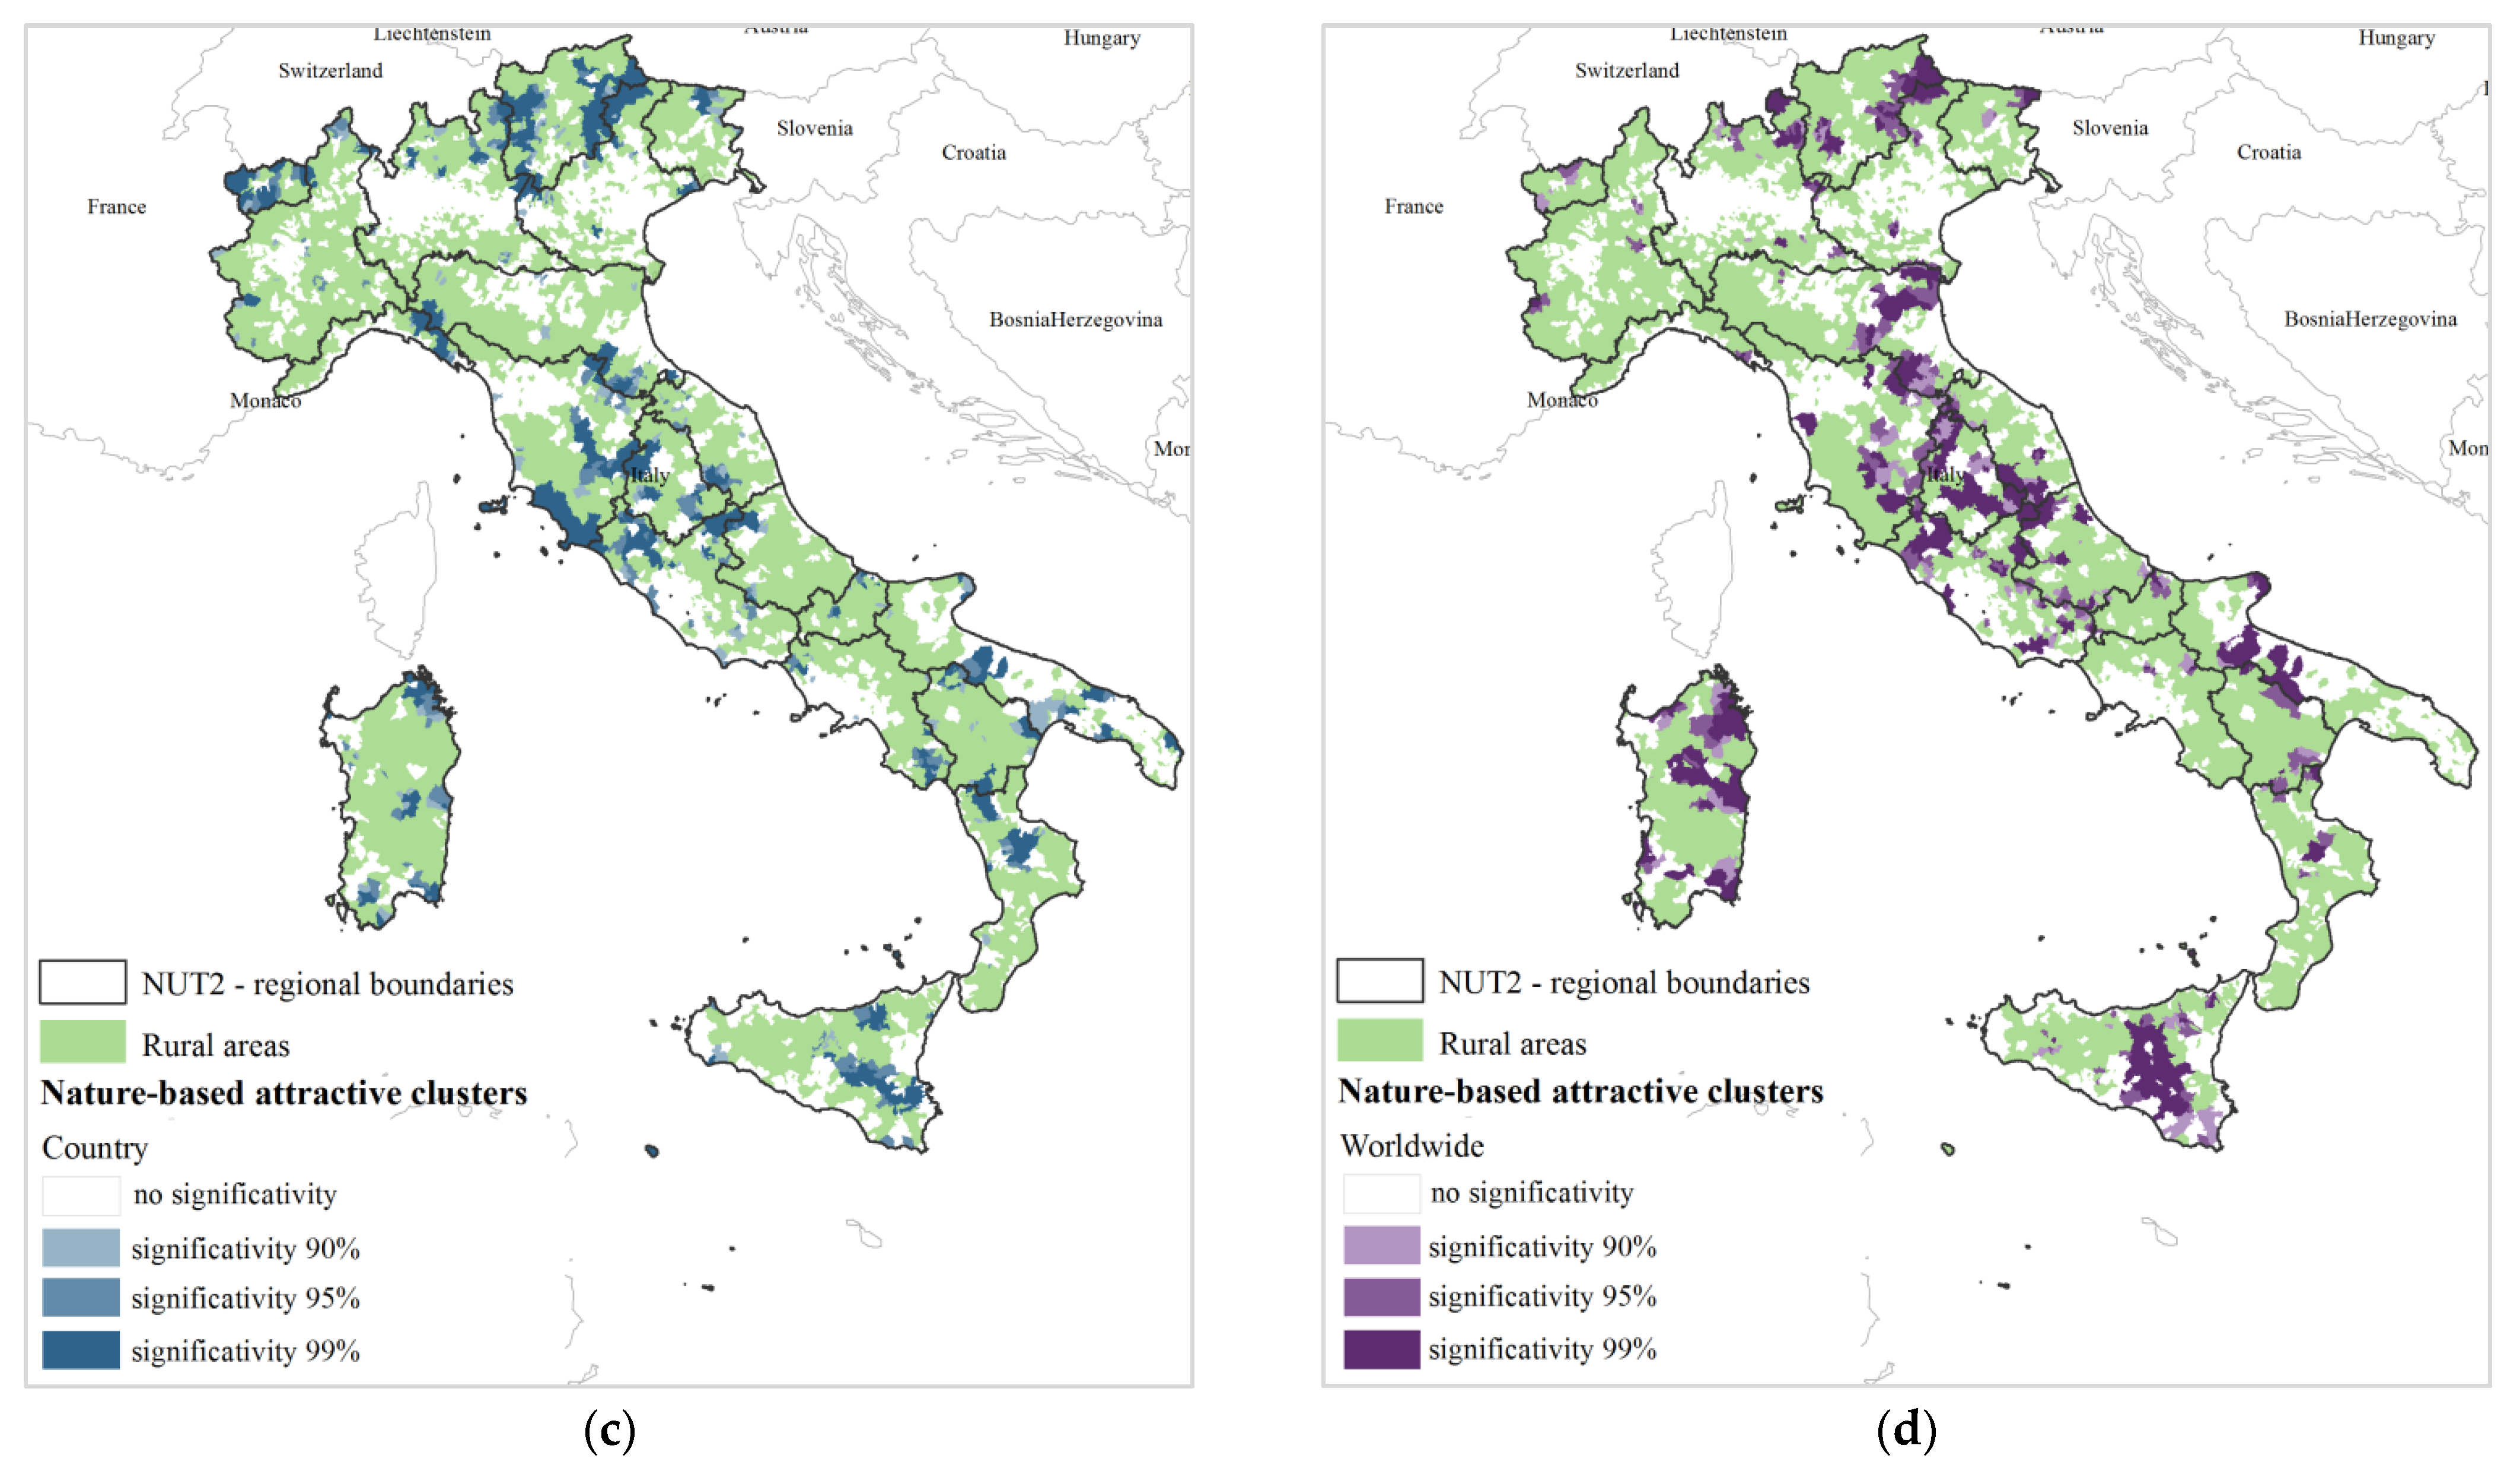
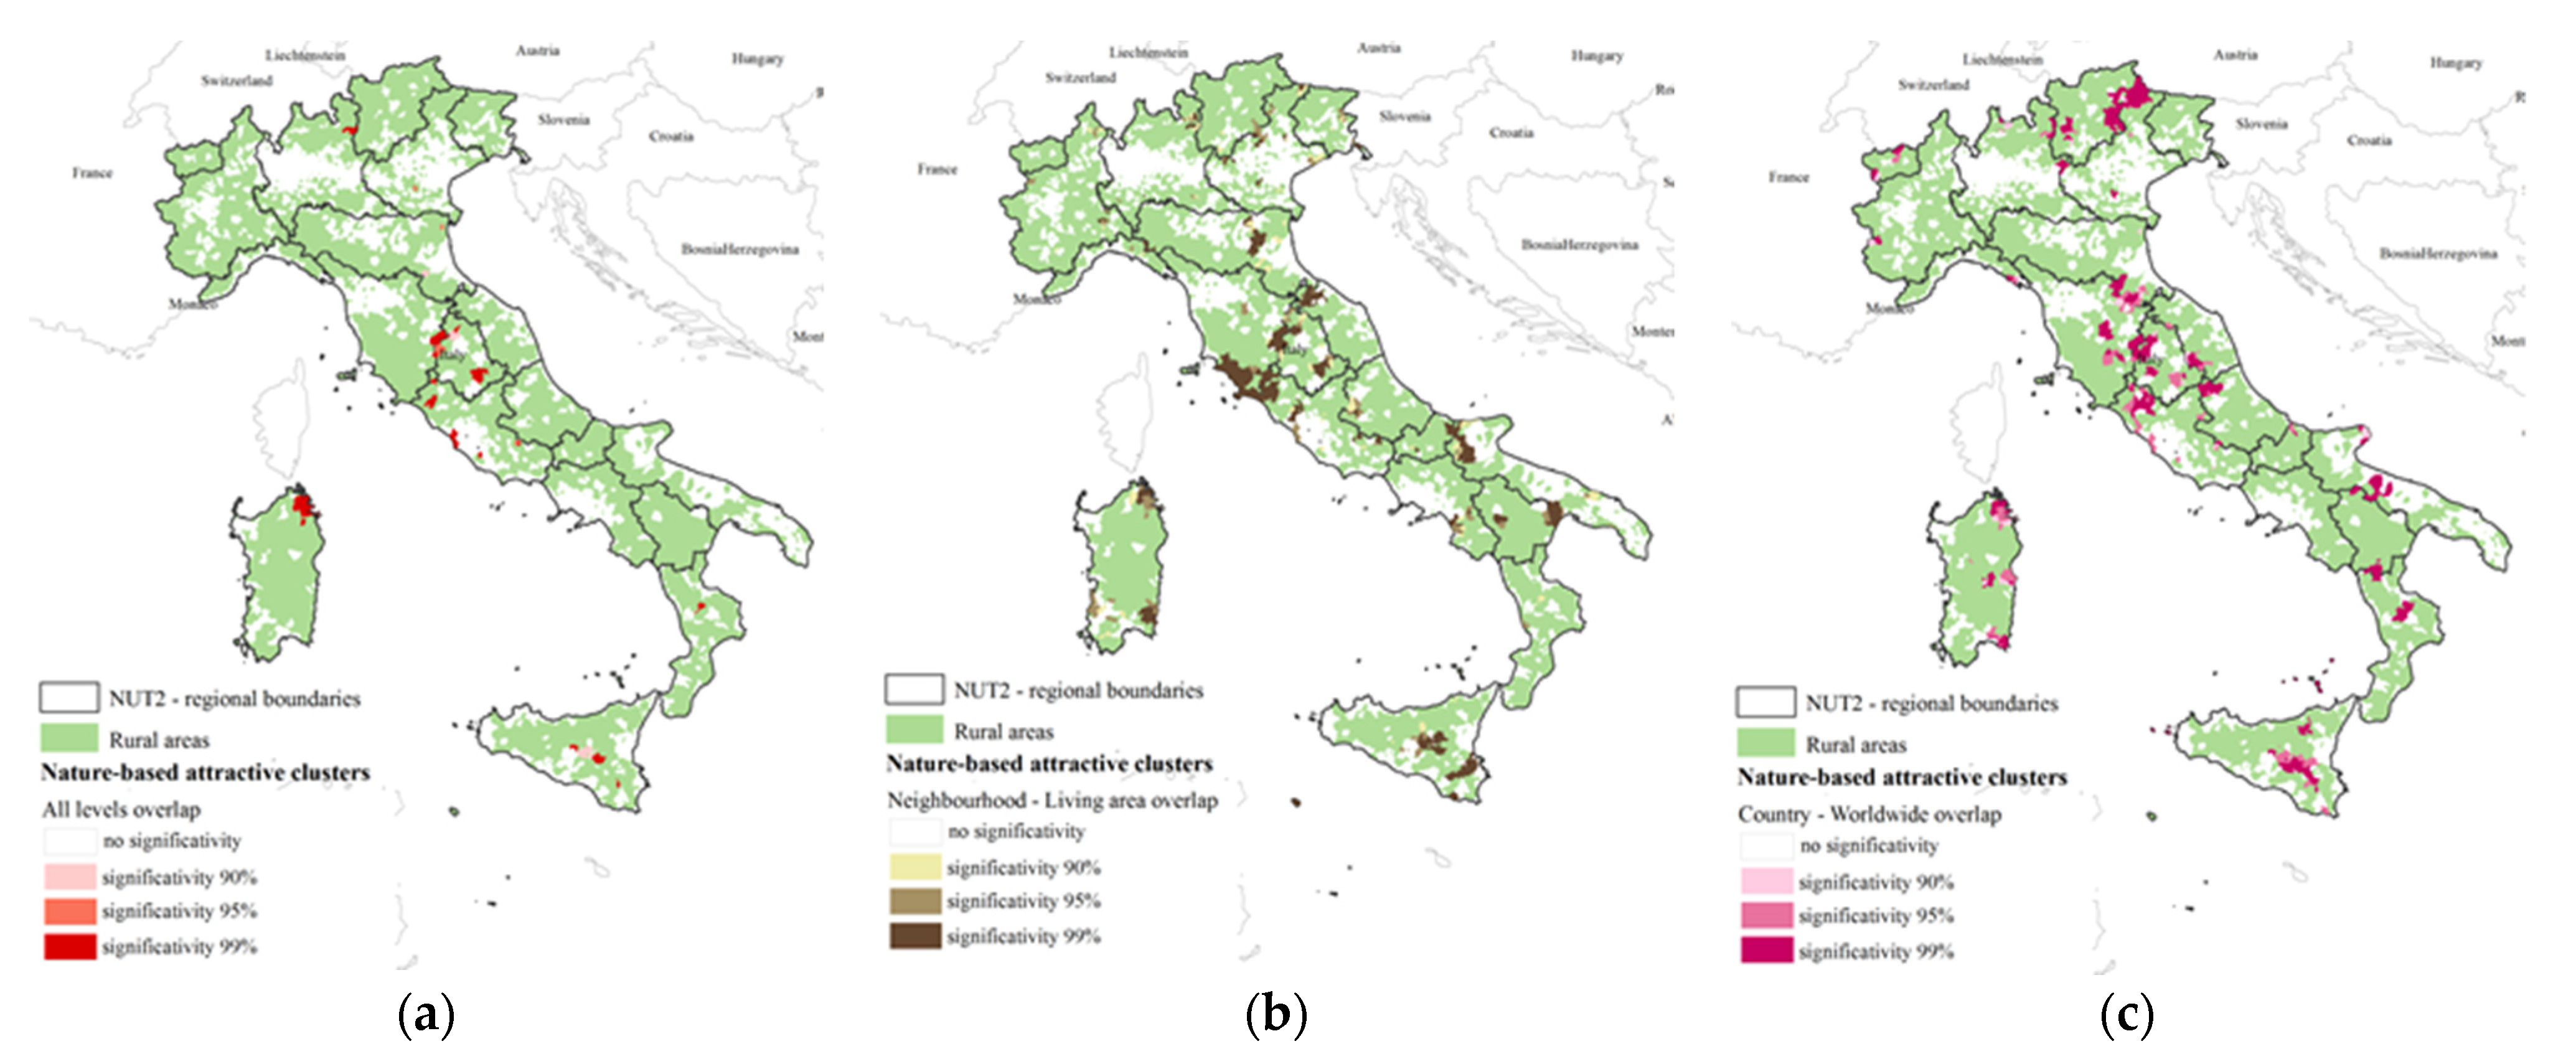
3.2.2. Spatial Distribution of Nature-Based Attractive Municipalities and Clusters
4. Discussion
5. Conclusions
Author Contributions
Funding
Institutional Review Board Statement
Informed Consent Statement
Data Availability Statement
Conflicts of Interest
Appendix A

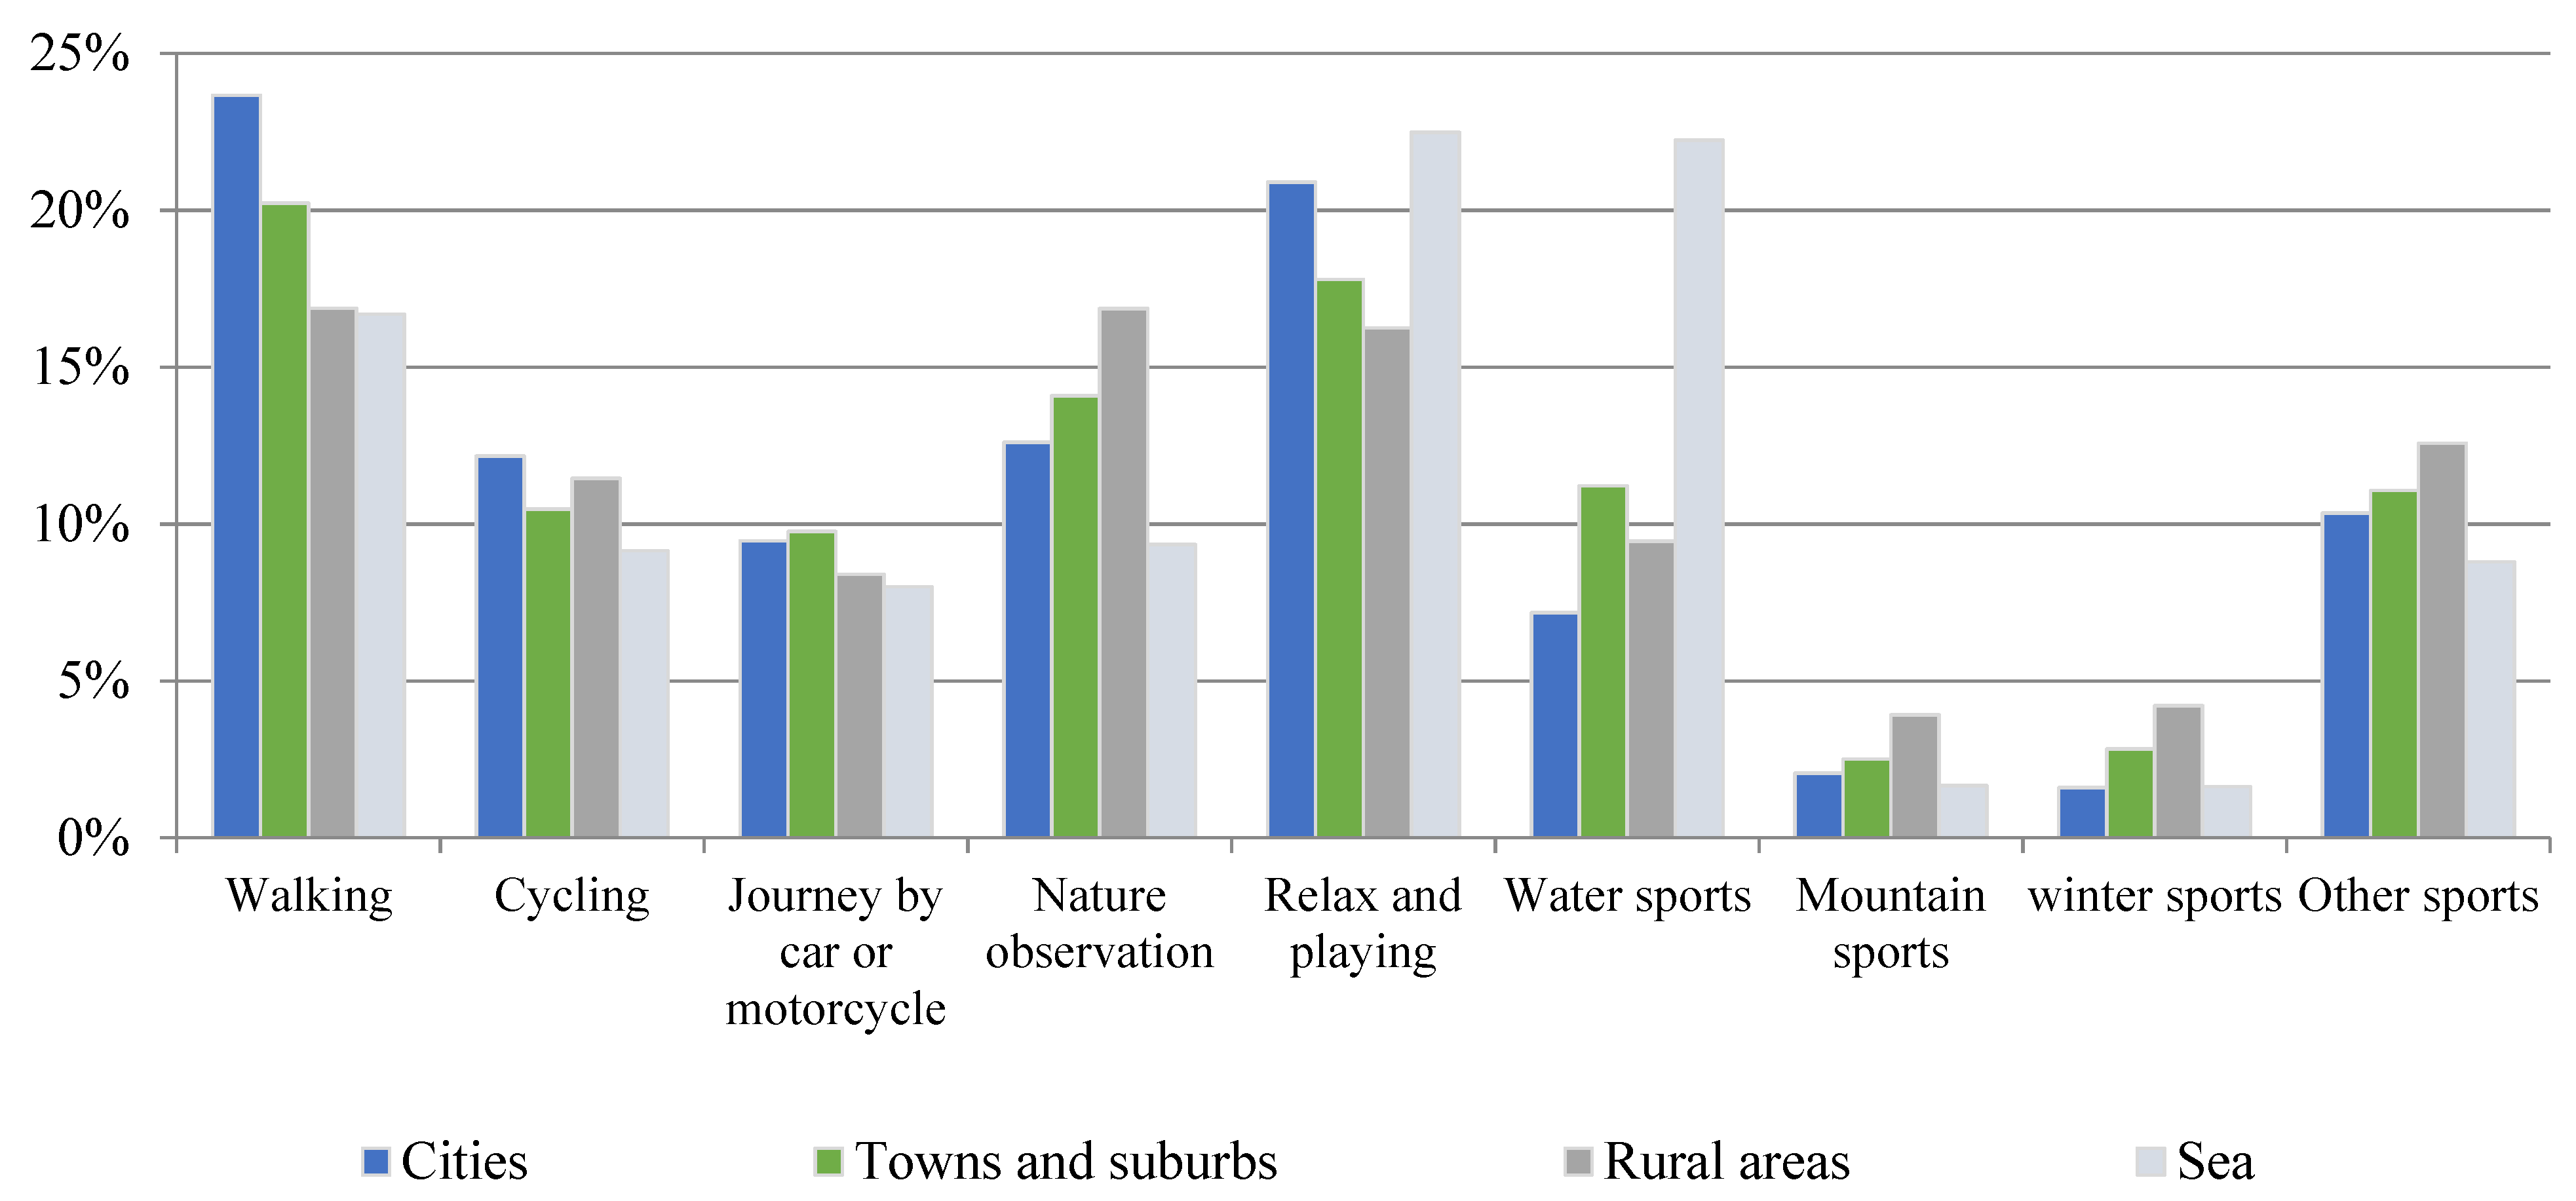
| Walking | Cycling | Journey by Car or Motorcycle | Nature Observation | Relax and Playing |
| Running | Cycling | Journey by car | Animal observation | Cafè/terrace |
| Walking | Drive/cycle | Journey by motorbike | Bird-watching | Picnic/BBQ |
| Walking the dog | Mountain biking | Nature observation | Playing | |
| Road racing | Plants observation | Sunbathing | ||
| Watersports | Mountain sports | Winter sports | Other sports | |
| Canoeing | Hiking | Crosscountry skiing | Sport fishing | |
| Golf surfin | Mountaineering | Ice skating | Geocaching | |
| Kitesurfing | Powerboating | Horseback riding | ||
| Rafting | Skiing | Rollerskating | ||
| Sailing | Sledding | Hunting | ||
| Scuba diving | Meditation | |||
| Swimming | Mushroom picking | |||
| Photo shooting |
| Age | Italian Sample (n. Respondents) | Italian Sample (% of Respondents) | Italian Population (n.) | Italian Population (%) | ||||
|---|---|---|---|---|---|---|---|---|
| male | female | male | female | male | female | male | female | |
| 18–30 | 166 | 187 | 21.0% | 22.2% | 3,536,272 | 3,338,048 | 19.5% | 18.2% |
| 31–45 | 286 | 290 | 36.2% | 34.4% | 6,042,858 | 6,032,116 | 33.3% | 32.8% |
| 46–55 | 184 | 206 | 23.3% | 24,5% | 4,794,119 | 4,933,107 | 26.4% | 26.8% |
| 56–65 | 154 | 159 | 19.5% | 18.9% | 3,794,554 | 4,069,703 | 20.9% | 22.2% |
| Total | 790 | 842 | 100.0% | 100,00% | 18,167,803 | 18,372,974 | 100,00% | 100,00% |
| Geographical Area (NUTS 1) | Italian Sample (n. Respondents) | Italian Sample (% of Respondents) | Italian Population (n.) | Italian Population (%) |
|---|---|---|---|---|
| North-west | 408 | 26.2% | 16,095,306 | 26.6% |
| North-east | 320 | 19.0% | 11,640,852 | 19.6% |
| Center | 369 | 19.8% | 12,050,054 | 19.9% |
| South | 353 | 23.7% | 14,022,596 | 23.2% |
| Islands | 182 | 11.3% | 6,675,165 | 11.0% |
| Total | 1632 | 100.0% | 60,483,973 | 100.0% |
| Neighbourhood Level Attractive Nature | Living Area Level Attractive Nature | Country Level Attractive Nature | Worldwide Level Attractive Nature | Total | ||||||
|---|---|---|---|---|---|---|---|---|---|---|
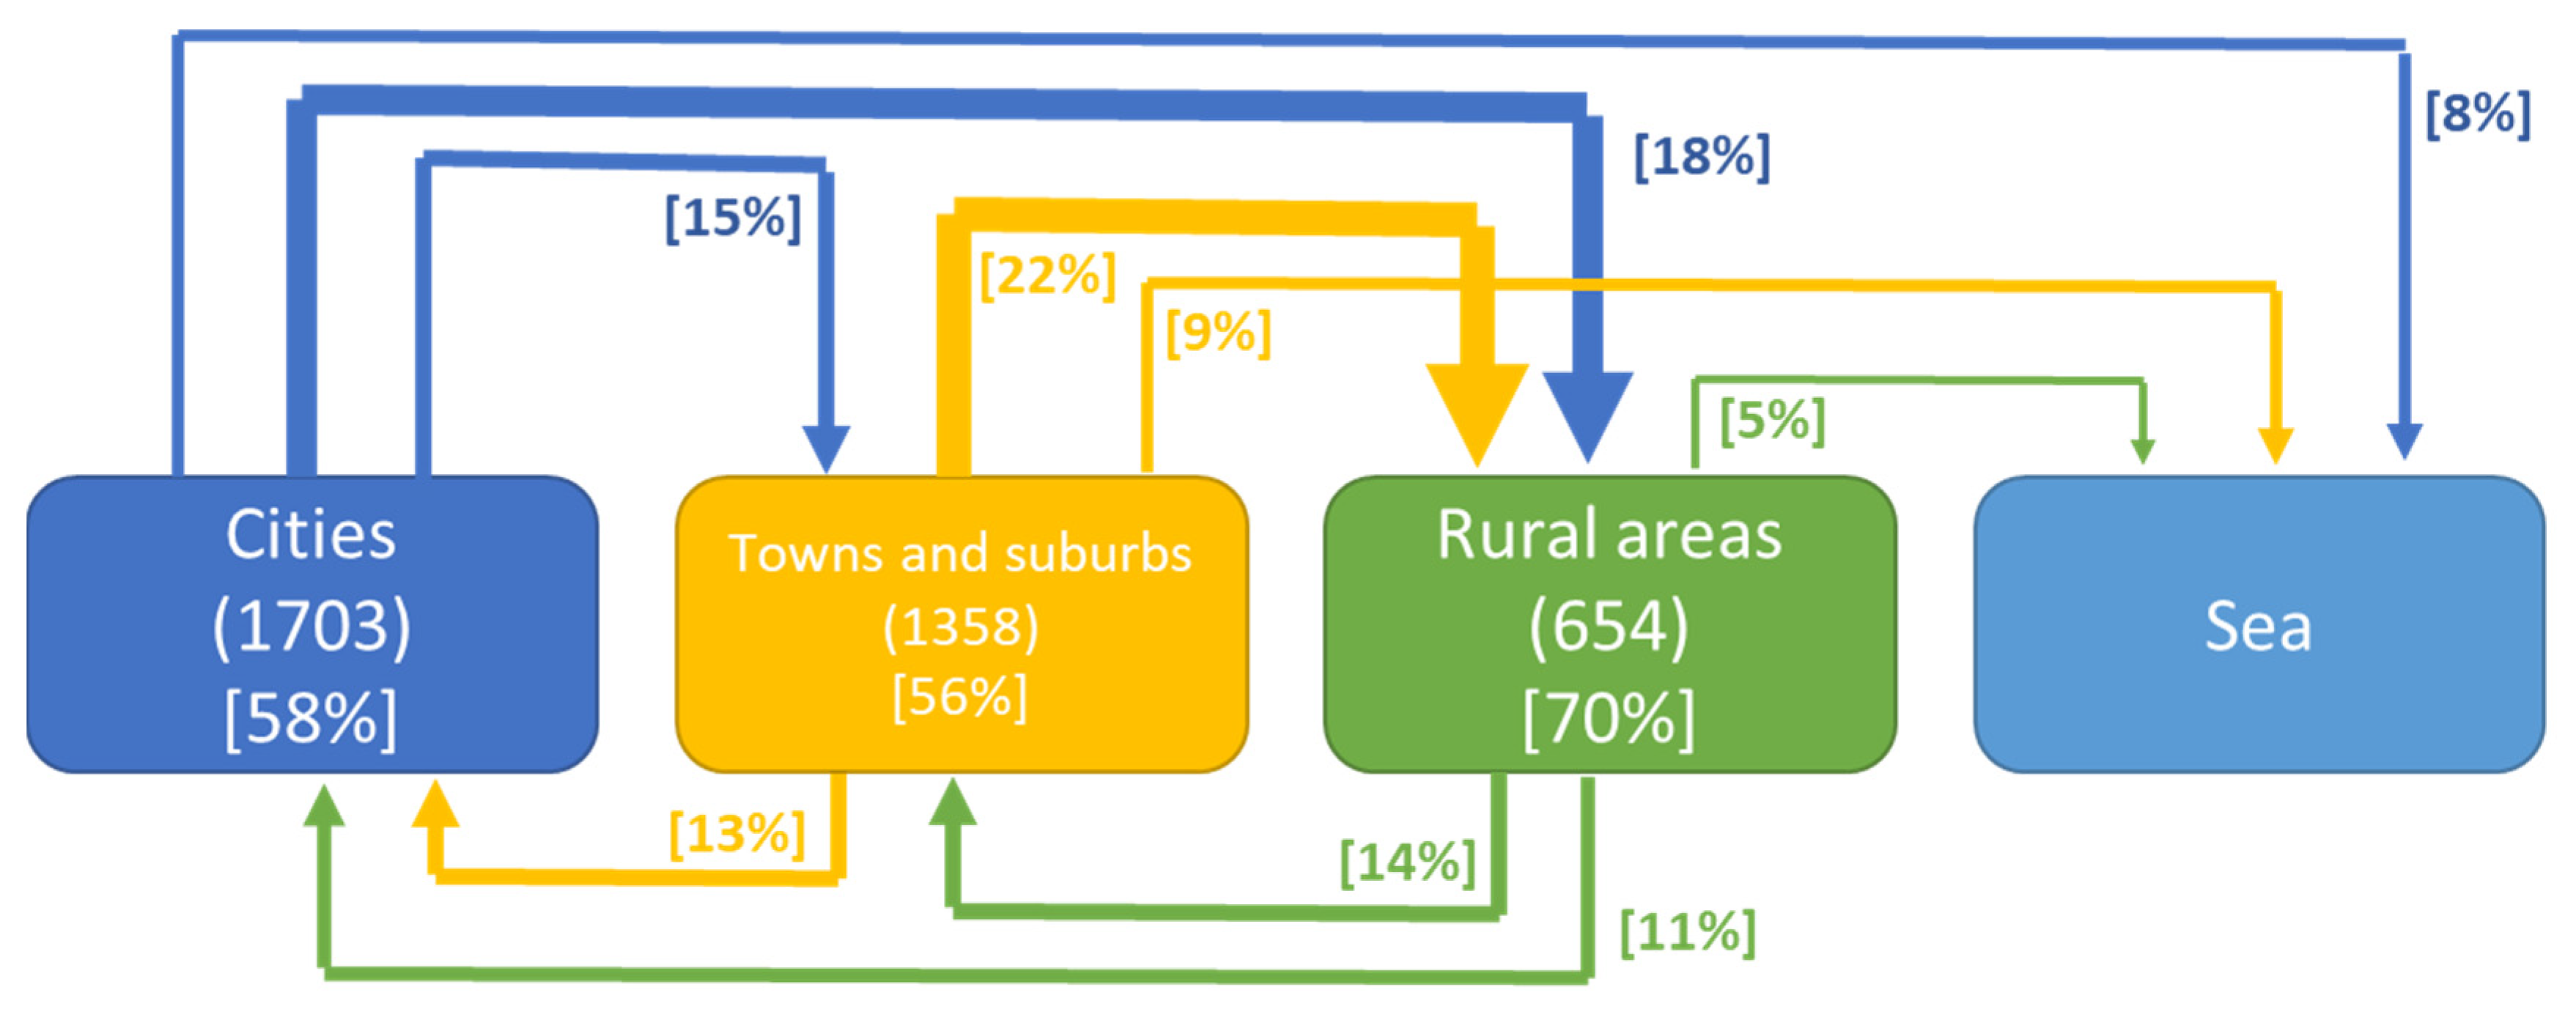
| Cities to cities | 535 | 94% | 278 | 54% | 160 | 33% | 18 | 14% | 991 | 58% |
| Cities to towns and suburbs | 16 | 3% | 132 | 25% | 95 | 20% | 14 | 11% | 257 | 15% |
| Cities to rural areas | 3 | 1% | 67 | 13% | 174 | 36% | 62 | 49% | 306 | 18% |
| Cities to sea | 17 | 3% | 42 | 8% | 58 | 12% | 32 | 25% | 149 | 9% |
| Subtotal | 571 | 100% | 519 | 100% | 487 | 100% | 126 | 100% | 1703 | 100% |
| Towns and suburbs to cities | 10 | 2% | 68 | 17% | 86 | 23% | 13 | 10% | 177 | 13% |
| Towns and suburbs to towns and suburbs | 427 | 93% | 201 | 51% | 107 | 29% | 24 | 19% | 759 | 56% |
| Towns and suburbs to rural areas | 13 | 3% | 105 | 26% | 134 | 36% | 53 | 42% | 305 | 22% |
| Towns and suburbs to sea | 9 | 2% | 24 | 6% | 48 | 13% | 36 | 29% | 117 | 9% |
| Subtotal | 459 | 100% | 398 | 100% | 375 | 100% | 126 | 100% | 1358 | 100% |
| Rural areas to cities | 0 | 0% | 23 | 12% | 44 | 25% | 5 | 7% | 72 | 11% |
| Rural areas to towns and suburbs | 14 | 6% | 43 | 22% | 25 | 14% | 8 | 12% | 90 | 14% |
| Rural areas to rural areas | 203 | 93% | 126 | 65% | 90 | 52% | 37 | 55% | 456 | 70% |
| Rural areas to sea | 2 | 1% | 2 | 1% | 15 | 9% | 17 | 25% | 36 | 5% |
| Subtotal | 219 | 100% | 194 | 100% | 174 | 100% | 67 | 100% | 654 | 100% |
| Total | 1249 | 1111 | 1036 | 319 | 3715 | |||||
References
- Egal, F.; Forster, T. Biodiversity, food systems and urban-rural linkages. In Biodiversity, Food and Nutrition: A New Agenda for Sustainable Food Systems; Routledge: London, UK, 2020; pp. 189–205. [Google Scholar] [CrossRef]
- Hugo, G.; Champion, A.; Lattes, A. Toward a New Conceptualization of Settlements for Demography. Popul. Dev. Rev. 2003, 29, 277–297. [Google Scholar] [CrossRef]
- Woods, M. Rural geography: Blurring boundaries and making connections. Prog. Hum. Geogr. 2009, 33, 849–858. [Google Scholar] [CrossRef]
- Rosenqvist, O. Deconstruction and hermeneutical space as keys to understanding the rural. J. Rural Stud. 2020, 75, 132–142. [Google Scholar] [CrossRef]
- Midgley, J.; Ward, N.; Atterton, J. City Regions and Rural Areas in the North East of England; Centre for Rural Economy: Newcastle, UK, 2005; Available online: https://www.ncl.ac.uk/media/wwwnclacuk/centreforruraleconomy/files/city-regions-full.pdf (accessed on 10 May 2022).
- OECD Rural-Urban Partnerships. An Integrated Approach to Economic Development; OECD Publishing: Berlin, Germany, 2013. [Google Scholar] [CrossRef]
- Nasir, J.; Khan, M. Redefining Urban; A Case for Multi-Criteria Definition of Urban Areas in Pakistan. In 2 Urban; The Urban Unit: Lahore, Pakistan, 2018. [Google Scholar] [CrossRef]
- Prete, C.; Cozzi, M.; Viccaro, M.; Romano, S.; Ventura, G. Well-being and rurality: A spatial tool for rural development programs evaluation. Ital. Rev. Agric. Econ. 2017, 72, 267–287. [Google Scholar] [CrossRef]
- Fondazione IFEL. I Comuni della Strategia Nazionale Aree Interne. 2015. Available online: http://www.fondazioneifel.it/studi-ricerche-ifel/item/3110-i-comuni-della-strategia-nazionale-aree-interne (accessed on 10 January 2022).
- Dijkstra, L.; Poelman, H.; Veneri, P. The EU-OECD Definition of a Functional Urban Area; OECD Regional Development Working Papers, No. 2019/11; OECD Publishing: Paris, France, 2019. [Google Scholar] [CrossRef]
- Baumeister, C.F.; Gerstenberg, T.; Plieninger, T.; Schraml, U. Exploring cultural ecosystem service hotspots: Linking multiple urban forest features with public participation mapping data. Urban. For. Urban. Green. 2019, 48, 126561. [Google Scholar] [CrossRef]
- Hartig, T.; Mitchell, R.; de Vries, S.; Frumkin, H. Nature and Health. Annu. Rev. Public Health 2014, 35, 207–228. [Google Scholar] [CrossRef] [PubMed] [Green Version]
- Keniger, L.E.; Gaston, K.J.; Irvine, K.N.; Fuller, R.A. What are the Benefits of Interacting with Nature? Int. J. Environ. Res. Public Health 2013, 10, 913–935. [Google Scholar] [CrossRef]
- Viccaro, M.; Romano, S.; Prete, C.; Cozzi, M. Rural planning? An integrated dynamic model for assessing quality of life at a local scale. Land Use Policy 2021, 111, 105742. [Google Scholar] [CrossRef]
- Hartig, T.; Evans, G.W.; Jamner, L.D.; Davis, D.S.; Gärling, T. Tracking restoration in natural and urban field settings. J. Environ. Psychol. 2003, 23, 109–123. [Google Scholar] [CrossRef]
- Pasanen, T.P.; Neuvonen, M.; Korpela, K.M. The Psychology of Recent Nature Visits: (How) Are Motives and Attentional Focus Related to Post-Visit Restorative Experiences, Creativity, and Emotional Well-Being? Environ. Behav. 2017, 50, 913–944. [Google Scholar] [CrossRef]
- Staats, H.; Hartig, T. Alone or with a friend: A social context for psychological restoration and environmental preferences. J. Environ. Psychol. 2004, 24, 199–211. [Google Scholar] [CrossRef]
- Schnorr-Bäcker, S. Well-being in urban and rural areas in the european union: Challenges, policies, monitoring, and some practical examples. In The European Union: Policies, Perspectives and Politics; Moldovan, L., Ed.; Nova Science: Hauppauge, NY, USA, 2020; pp. 153–185. [Google Scholar]
- Gasser, K.; Kaufmann-Hayoz, R. Wald und Volksgesundheit (Woods, Trees and Human Health & Well-Being); Literatur und Projekte aus der Schweiz; Interfakultäre Koordinationsstelle für Allgemeine Okologie (IKAO): Bern, Switzerland, 2004. [Google Scholar]
- Pretty, J.; Peacock, J.; Sellens, M.; Griffin, M. The mental and physical health outcomes of green exercise. Int. J. Environ. Health Res. 2005, 15, 319–337. [Google Scholar] [CrossRef] [PubMed]
- Frumkin, H. Healthy Places: Exploring the Evidence. Am. J. Public Health 2003, 93, 1451–1456. [Google Scholar] [CrossRef] [PubMed]
- Fredrickson, L.M.; Anderson, D.H. A Qualitative Exploration of the Wilderness Experience as A Source of Spiritual Inspiration. J. Environ. Psychol. 1999, 19, 21–39. [Google Scholar] [CrossRef]
- Sharpe, E.K. Delivering Communitas: Wilderness Adventure and the Making of Community. J. Leis. Res. 2005, 37, 255–280. [Google Scholar] [CrossRef]
- Kytta, M.; Broberg, A.; Tzoulas, T.; Snabb, K. Towards contextually sensitive urban densification: Location-based softGIS knowledge revealing perceived residential environmental quality. Landsc. Urban. Plan. 2013, 113, 30–46. [Google Scholar] [CrossRef]
- Brown, G.; Kyttä, M. Key issues and priorities in participatory mapping: Toward integration or increased specialization? Appl. Geogr. 2018, 95, 1–8. [Google Scholar] [CrossRef]
- Brown, G.; Reed, P.; Raymond, C.M. Mapping place values: 10 lessons from two decades of public participation GIS empirical research. Appl. Geogr. 2020, 116, 102156. [Google Scholar] [CrossRef]
- Bijker, R.A.; Sijtsma, F.J. A portfolio of natural places: Using a participatory GIS tool to compare the appreciation and use of green spaces inside and outside urban areas by urban residents. Landsc. Urban. Plan. 2017, 158, 155–165. [Google Scholar] [CrossRef]
- Daams, M.N.; Sijtsma, F.J.; Veneri, P. Mixed monetary and non-monetary valuation of attractive urban green space: A case study using Amsterdam house prices. Ecol. Econ. 2019, 166, 106430. [Google Scholar] [CrossRef]
- Daams, M.N.; Veneri, P. Living Near to Attractive Nature? A Well-Being Indicator for Ranking Dutch, Danish, and German Functional Urban Areas. Soc. Indic. Res. 2016, 133, 501–526. [Google Scholar] [CrossRef] [PubMed]
- Scholte, S.S.; Daams, M.; Farjon, H.; Sijtsma, F.J.; van Teeffelen, A.J.; Verburg, P.H. Mapping recreation as an ecosystem service: Considering scale, interregional differences and the influence of physical attributes. Landsc. Urban. Plan. 2018, 175, 149–160. [Google Scholar] [CrossRef]
- Getis, A.; Ord, K. The Analysis of Spatial Association by Use of Distance Statistics. Geogr. Anal. 1992, 24, 189–206. [Google Scholar] [CrossRef]
- Carroll, M.C.; Reid, N.; Smith, B.W. Location quotients versus spatial autocorrelation in identifying potential cluster regions. Ann. Reg. Sci. 2007, 42, 449–463. [Google Scholar] [CrossRef]
- Rossi, F.; Becker, G. Creating forest management units with Hot Spot Analysis (Getis-Ord Gi*) over a forest affected by mixed-severity fires. Aust. For. 2019, 82, 166–175. [Google Scholar] [CrossRef]
- Mitra, R.; Buliung, R.N.; Faulkner, G.E. Spatial clustering and the temporal mobility of walking school trips in the Greater Toronto Area, Canada. Health Place 2010, 16, 646–655. [Google Scholar] [CrossRef]
- Brachert, M.; Titze, M.; Kubis, A. Identifying industrial clusters from a multidimensional perspective: Methodical aspects with an application to Germany. Pap. Reg. Sci. 2011, 90, 419–439. [Google Scholar] [CrossRef]
- Prasannakumar, V.; Vijith, H.; Charutha, R.; Geetha, N. Spatio-temporal clustering of road accidents: GIS based analysis and assessment. Procedia. Soc. Behav. Sci. 2011, 21, 317–325. [Google Scholar] [CrossRef]
- Hazaymeh, K.; Almagbile, A.; Alomari, A.H. Spatiotemporal Analysis of Traffic Accidents Hotspots Based on Geospatial Techniques. ISPRS Int. J. Geo-Inf. 2022, 11, 260. [Google Scholar] [CrossRef]
- Hendry, C.; Brown, J. Dynamics of clustering and performance in the UK opto-electronics industry. Reg. Stud. 2006, 40, 707–725. [Google Scholar] [CrossRef]
- Miller, P.; Botham, R.; Martin, R.; Moore, B. Business Clusters in the UK: A First Assessment. Report for the Department of Trade and Industry, A Consortium Led by Trends Business Research; Department of Trade and Industry: London, UK, 2001.
- Korpela, K.; Hartig, T. Restorative Qualities of Favorite Places. J. Environ. Psychol. 1996, 16, 221–233. [Google Scholar] [CrossRef]
- Sijtsma, F.J.; de Vries, S.; van Hinsberg, A.; Diederiks, J. Does ‘grey’ urban living lead to more ‘green’ holiday nights? A Netherlands Case Study. Landsc. Urban. Plan. 2012, 105, 250–257. [Google Scholar] [CrossRef]
- Žlender, V.; Thompson, C.W. Accessibility and use of peri-urban green space for inner-city dwellers: A comparative study. Landsc. Urban. Plan. 2017, 165, 193–205. [Google Scholar] [CrossRef]
- Boll, T.; von Haaren, C.; von Ruschkowski, E. The preference and actual use of different types of rural recreation areas by urban dwellers—The Hamburg Case Study. PLoS ONE 2014, 9, e108638. [Google Scholar] [CrossRef]
- Hasse, J.E.; Lathrop, R.G. Land resource impact indicators of urban sprawl. Appl. Geogr. 2003, 23, 159–175. [Google Scholar] [CrossRef]
- Cattivelli, V. Defining periurban areas: La previsione di questi territori negli strumenti urbanistici di alcune regioni italiane. Aestimum 2014, 64, 79–93. [Google Scholar] [CrossRef]
- Bell, S.; Tyrväinen, L.; Sievänen, T.; Pröbstl, U.; Simpson, M. Outdoor Recreation and Nature Tourism: A European Perspective. Living Rev. Landsc. Res. 2007, 1, 1–46. [Google Scholar] [CrossRef]
- Winter, P.L.; Selin, S.; Cerveny, L.; Bricker, K. Outdoor recreation, nature-based tourism, and sustainability. Sustainability 2019, 12, 81. [Google Scholar] [CrossRef]
- Kataya, A. The Impact of Rural Tourism on the Development of Regional Communities. J. East. Eur. Res. Bus. Econ. 2021, 1–10. [Google Scholar] [CrossRef]
- Balmford, A.; Beresford, J.; Green, J.; Naidoo, R.; Walpole, M.; Manica, A. A Global Perspective on Trends in Nature-Based Tourism. PLoS Biol. 2009, 7, e1000144. [Google Scholar] [CrossRef]
- World Bank Group. Banking on Protected Areas: Promoting Sustainable Protected Area Tourism to Benefit Local Economies; World Bank Group: Washington, DC, USA, 2021; Available online: https://openknowledge.worldbank.org/bitstream/handle/10986/35737/Banking-on-Protected-Areas-Promoting-Sustainable-Protected-Area-Tourism-to-Benefit-Local-Economies.pdf?sequence=5&isAllowed=y (accessed on 10 February 2022).
- Prete, C.; Cozzi, M.; Viccaro, M.; Romano, S. Quality of Life and Social Inclusion of Inland Areas: A Multidimensional Approach to Performance Policies and Planning Assessment. In Proceedings of the Computational Science and Its Applications—ICCSA 2017, Trieste, Italy, 3–6 July 2017; pp. 485–500. [Google Scholar] [CrossRef]
- Cozzi, M.; Prete, C.; Viccaro, M.; Riccioli, F.; Fagarazzi, C.; Romano, S. Towards sustainable and inclusive communities: An integrated approach to assess sustainability in rural areas. Aestimum 2021, 81–102. [Google Scholar] [CrossRef]
- Commission of the European Communities. Green Paper on Territorial Cohesion Turning Territorial Diversity into Strength; communication from the commission to the council, the European Parliament, the committee of the regions and the european economic and social committee. Available online: http://eur-lex.europa.eu/LexUriServ/LexUriServ.do?uri=COM:2008:0616:FIN:EN:PDF (accessed on 10 February 2022).
- Barca, F.; McCann, P.; Rodríguez-Pose, A. The Case for Regional Development Intervention: Place-Based Versus Place-Neutral Approaches. J. Reg. Sci. 2012, 52, 134–152. [Google Scholar] [CrossRef]


| Services | Acronym | Description | Expressions |
|---|---|---|---|
| 1. Mental and spiritual refreshment services | MS | Sites of spirituality, religious or other relax forms | E.g., “Makes me relax”, “relax”, “free oneself with the mind from the city chaos”, “tranquillity”, “peace”, “serenity”. |
| 2. Physical refreshment service | PS | Sites which favour regeneration in pure air, away from noise, making movement | E.g., “Green lung of the city”, “…far from the noise”, “clean air”, “Making movement”, “There are the spas important for health”. |
| 3. Knowledge and educational value | KE | Sites which favour knowledge of animal and plant species | E.g., “I am pleased to discover different species of animals”, “the diversity and abundance of species that make them”, “A municipal park that still preserves rare trees such as the cedar of Lebanon”. |
| 4. Connection with nature | N | Sites that simply influence an emotional feeling with nature | E.g., “nature”, “green”, “I like trees and flowers”. |
| 5. Aesthetic value | A | Sites of particular beauty | E.g., “Beautiful”, “beautiful landscape”, “panorama”, “breath-taking landscape”, “breath-taking panorama”. |
| 6. Social relations | SR | Sites of meeting points with friends | E.g., “there are courses for my age”, “children can play”, “social life”, “sociability”, “company”. |
| 7. Sense of place | SP | Sites which feed a sense of authentic attachment and identity | E.g., “It makes me feel at home”, “I grew up”. |
| 8. Cultural heritage | CH | Sites relevant to local history and culture | E.g., “a journey in the art”, “place of historical interest”, “very representative of the area”. |
| 9. Recreation and ecotourism | RE | Sites used for recreational activities (walks, walks with dogs, horseback riding, swimming, gathering wild food, sport fishing, hunting, etc.) | E.g., “equipped to play sports”, “It is an ideal place to do outdoor activities, such as cycling, running or walking, being in contact with nature while remaining close to the town” |
| Nature-Based Attractive Index | Nature-Based Attractive Clusters | ||||||||||||||||
|---|---|---|---|---|---|---|---|---|---|---|---|---|---|---|---|---|---|
| Neighbourhood (Range 0.1–0.70) | Living Area (Range 0.1–0.78) | Country (Range 0.1–0.66) | Worldwide (Range 0.1–0.80) | Neighbourhood (Gi* >1, p < 0.1) | Living Area (Gi* >1, p < 0.1) | Country (Gi* >1, p < 0.1) | Worldwide (Gi* >1, p < 0.1) | ||||||||||
| Italian Regions | N. Rural Municipalities | N. Municipalities | % | N. Municipalities | % | N. Municipalities | % | N. Municipalities | % | N. Municipalities | % | N. Municipalities | % | N. Municipalities | % | N. Municipalities | % |
| Piemonte | 957 | 13 | 1.4% | 23 | 2.4% | 21 | 2.2% | 3 | 0.3% | 62 | 6.5% | 74 | 7.7% | 42 | 4.4% | 19 | 2.0% |
| Valle D’ Aosta | 64 | 0 | 0 | 2 | 3.1% | 12 | 18.8% | 2 | 3.1% | 1 | 1.6% | 8 | 12.5% | 26 | 40.6% | 9 | 14.1% |
| Lombardia | 666 | 13 | 20.3% | 20 | 3.0% | 22 | 3.3% | 11 | 1.7% | 70 | 10.5% | 63 | 9.5% | 61 | 9.2% | 53 | 8.0% |
| Trentino-Alto Adige | 244 | 5 | 0.8% | 11 | 4.5% | 32 | 13.1% | 8 | 3.3% | 24 | 9.8% | 36 | 14.8% | 81 | 33.2% | 48 | 19.7% |
| Veneto | 288 | 15 | 6.1% | 23 | 8.0% | 22 | 7.6% | 3 | 1.0% | 40 | 13.9% | 65 | 22.6% | 40 | 13.9% | 25 | 8.7% |
| Friuli Venezia Giulia | 153 | 3 | 1.0% | 6 | 3.9% | 5 | 3.3% | 2 | 1.3% | 14 | 9.2% | 23 | 15.0% | 16 | 10.5% | 8 | 5.2% |
| Liguria | 151 | 4 | 2.6% | 7 | 4.6% | 9 | 6.0% | 2 | 1.3% | 16 | 10.6% | 26 | 17.2% | 23 | 15.2% | 7 | 4.6% |
| Emilia-Romagna | 234 | 14 | 9.3% | 24 | 10.3% | 15 | 6.4% | 12 | 5.1% | 49 | 20.9% | 52 | 22.2% | 26 | 11.1% | 49 | 20.9% |
| Toscana | 177 | 6 | 2.6% | 15 | 8.5% | 24 | 13.6% | 9 | 5.1% | 28 | 15.8% | 40 | 22.6% | 45 | 25.4% | 43 | 24.3% |
| Umbria | 80 | 5 | 2.8% | 6 | 7.5% | 12 | 15.0% | 10 | 12.5% | 23 | 28.8% | 25 | 31.3% | 24 | 30.0% | 36 | 45.0% |
| Marche | 177 | 8 | 10.0% | 5 | 2.8% | 7 | 4.0% | 5 | 2.8% | 37 | 20.9% | 21 | 11.9% | 20 | 11.3% | 35 | 19.8% |
| Lazio | 300 | 19 | 10.7% | 28 | 9.3% | 31 | 10.3% | 18 | 6.0% | 68 | 22.7% | 56 | 18.7% | 60 | 20.0% | 90 | 30.0% |
| Abruzzo | 273 | 4 | 1.3% | 6 | 2.2% | 11 | 4.0% | 8 | 2.9% | 12 | 4.4% | 29 | 10.6% | 14 | 5.1% | 43 | 15.8% |
| Molise | 131 | 3 | 1.1% | 5 | 3.8% | 5 | 3.8% | 1 | 0.8% | 17 | 13.0% | 18 | 13.7% | 12 | 9.2% | 11 | 8.4% |
| Campania | 294 | 8 | 6.1% | 5 | 1.7% | 15 | 5.1% | 2 | 0.7% | 26 | 8.8% | 23 | 7.8% | 28 | 9.5% | 10 | 3.4% |
| Puglia | 115 | 14 | 4.8% | 11 | 9.6% | 15 | 13.0% | 5 | 4.3% | 37 | 32.2% | 30 | 26.1% | 25 | 21.7% | 17 | 14.8% |
| Basilicata | 127 | 6 | 5.2% | 4 | 3.1% | 8 | 6.3% | 3 | 2.4% | 26 | 20.5% | 12 | 9.4% | 24 | 18.9% | 16 | 12.6% |
| Calabria | 334 | 4 | 3.1% | 8 | 2.4% | 16 | 4.8% | 3 | 0.9% | 17 | 5.1% | 35 | 10.5% | 32 | 9.6% | 17 | 5.1% |
| Sicilia | 243 | 14 | 4.2% | 19 | 7.8% | 24 | 9.9% | 18 | 7.4% | 35 | 14.4% | 47 | 19.3% | 45 | 18.5% | 57 | 23.5% |
| Sardegna | 337 | 15 | 6.2% | 14 | 4.2% | 22 | 6.5% | 19 | 5.6% | 70 | 20.8% | 44 | 13.1% | 44 | 13.1% | 80 | 23.7% |
| Total | 5,345 | 173 | 3.2% | 242 | 4.5% | 328 | 6.1% | 144 | 2.7% | 672 | 12.6% | 727 | 13.5% | 688 | 12.9% | 673 | 12.6% |
Publisher’s Note: MDPI stays neutral with regard to jurisdictional claims in published maps and institutional affiliations. |
© 2022 by the authors. Licensee MDPI, Basel, Switzerland. This article is an open access article distributed under the terms and conditions of the Creative Commons Attribution (CC BY) license (https://creativecommons.org/licenses/by/4.0/).
Share and Cite
Cozzi, M.; Prete, C.; Viccaro, M.; Sijtsma, F.; Veneri, P.; Romano, S. Understanding the Role of Nature in Urban-Rural Linkages: Identifying the Potential Role of Rural Nature-Based Attractive Clusters That Serve Human Well-Being. Sustainability 2022, 14, 11856. https://doi.org/10.3390/su141911856
Cozzi M, Prete C, Viccaro M, Sijtsma F, Veneri P, Romano S. Understanding the Role of Nature in Urban-Rural Linkages: Identifying the Potential Role of Rural Nature-Based Attractive Clusters That Serve Human Well-Being. Sustainability. 2022; 14(19):11856. https://doi.org/10.3390/su141911856
Chicago/Turabian StyleCozzi, Mario, Carmelina Prete, Mauro Viccaro, Frans Sijtsma, Paolo Veneri, and Severino Romano. 2022. "Understanding the Role of Nature in Urban-Rural Linkages: Identifying the Potential Role of Rural Nature-Based Attractive Clusters That Serve Human Well-Being" Sustainability 14, no. 19: 11856. https://doi.org/10.3390/su141911856