Article

Lean Six Sigma with Value Stream Mapping in Industry 4.0 for Human-Centered Workstation Design

1
Department of Industrial Management, National Taiwan University of Science and Technology, Taipei City 106335, Taiwan
2
Thermo King Ireland Limited, D02 Dh60 Dublin, Ireland
*
Author to whom correspondence should be addressed.
Sustainability 2022, 14(17), 11020; https://doi.org/10.3390/su141711020
Submission received: 22 June 2022 / Revised: 17 August 2022 / Accepted: 30 August 2022 / Published: 3 September 2022
(This article belongs to the Collection New Frontiers in Production Engineering)

Abstract

:
Many industries have successfully implemented the define-measure-analyze-improve-control (DMAIC) method of Lean Six Sigma to improve their production activities. Value stream mapping (VSM) for Industry 4.0 allows us to understand the current state of operations in order to plan future improvements. In this study, we propose an improvement model based on DMAIC with VSM 4.0 for a truck cooler manufacturer to improve the picking workstation design with a human-centered approach. We use the DMAIC method to analyze the project step by step. After identifying the root cause, we identified countermeasures to improve the productivity. To reduce human error, the project team adopted a human-centered approach and applied lean tools, such as visual management, error prevention, and waste analysis. As a result of this case study, the yield rate was improved from 98% to 100%, and the direct savings of the project amounted to EUR 3180, mainly due to the freeing up of space. A human-centered LSS framework is also presented as a novel contribution of this study.

1. Introduction

Smart workstation design is critical for creating a healthy, comfortable, and productive workplace [1]. In response to disruptions in the global supply chains, automated workstations have been designed to replace labor and shorten working hours [2]. Lean Six Sigma (LSS) is a common strategy for improving operational excellence in manufacturing [3,4]. Lean emphasizes speed and waste, often referred to as efficiency, while Six Sigma emphasizes process variation reduction, often referred to as effectiveness [5]. LSS uses data and statistical analysis to identify the causes of fluctuations that lead to insufficient process outputs [6]. There are many examples of the LSS method’s implementation in the manufacturing industry, including the roles of key personnel in all areas of business, such as production, finance, marketing, and even personal management. Chiarini [7] surveyed five European motorcycle part manufacturing companies using various lean tools and found that lean methods reduced waste and had positive environmental impacts. Singh and Rathi [8] conducted a comprehensive analysis of the barriers to LSS’s implementation in small and medium-sized enterprises. Lean practices have not been implemented in various sectors in India [9]. However, some businesses have implemented and observed positive benefits of this method, mainly in terms of waste reduction and quality improvement. According to Jasti and Kodali [10], researchers should focus on building and testing novel ideas, including case studies and surveys that analyze academic findings from research on lean practices. Recently, it was found that 63.82% of empirical studies in the LSS literature use real data, and the process can be regulated and validated [11]. The majority of LSS applications in the industry are concentrated in manufacturing, healthcare, automotives, and electronics. Additionally, several articles focus on testing tools, obtaining benefits, and understanding success factors [12,13]. Several authors have discussed the analysis and exploration of key success factors of LSS in order to achieve effective quality management, organizational goals, objectives, and performance in industry [14,15,16]. Define-Measure-Analyze-Improve-Control (DMAIC) is the problem-solving approach that drives LSS. It is a five-phase method for addressing existing process problems based on a scientific method. In any work environment, continuous improvement can be correlated with the individual performing the activities in order to adapt the improvements to their needs [17]. It has recently been suggested that a human-centered approach can be integrated with the LSS principles [18].
Psomas [19] conducted a systematic literature review of lean manufacturing using a total of 214 articles and discussed a plethora of future research methods. Lobo Mesquita et al. [20] identified forms of integration between lean, Industry 4.0, and environmental sustainability, and showed how these three structures relate to the building of a framework that can help to manage industrial production processes. VSM is often regarded as the starting point for lean projects in the search for opportunities to optimize value and eliminate waste in the manufacturing process. A study by Jasti and Sharma [21] showed that the implementation of VSM had positive impacts in a lean manufacturing environment. VSM 4.0 is a recently developed, collaborative value stream tool for lean management in the context of Industry 4.0. Mapping, design and validate value streams are used to digitally plan improvement actions in order to reduce coordination times within the company. VSM 4.0 is a tool that enables company executives to engage in a series of structured discussions and executive decisions that enable continuous improvement. Numerous authors have provided particular strategies for certain businesses, despite the fact that this strategy is wide and versatile, spanning many industries [22,23].
In this article, we present a method combining the DMAIC approach in LSS and VSM 4.0 to design a human-centered workstation to support workers with intellectual disabilities. A case study is used to illustrate the application of the proposed method, which aims to enable the design of human-centered manufacturing workstations. Section 2 describes a review of VSM 4.0. Section 3 presents the LSS improvement model using VSM 4.0. Section 4 describes the current and future states of operational excellence in the case study company. The last section provides conclusions.

2. Literature Review
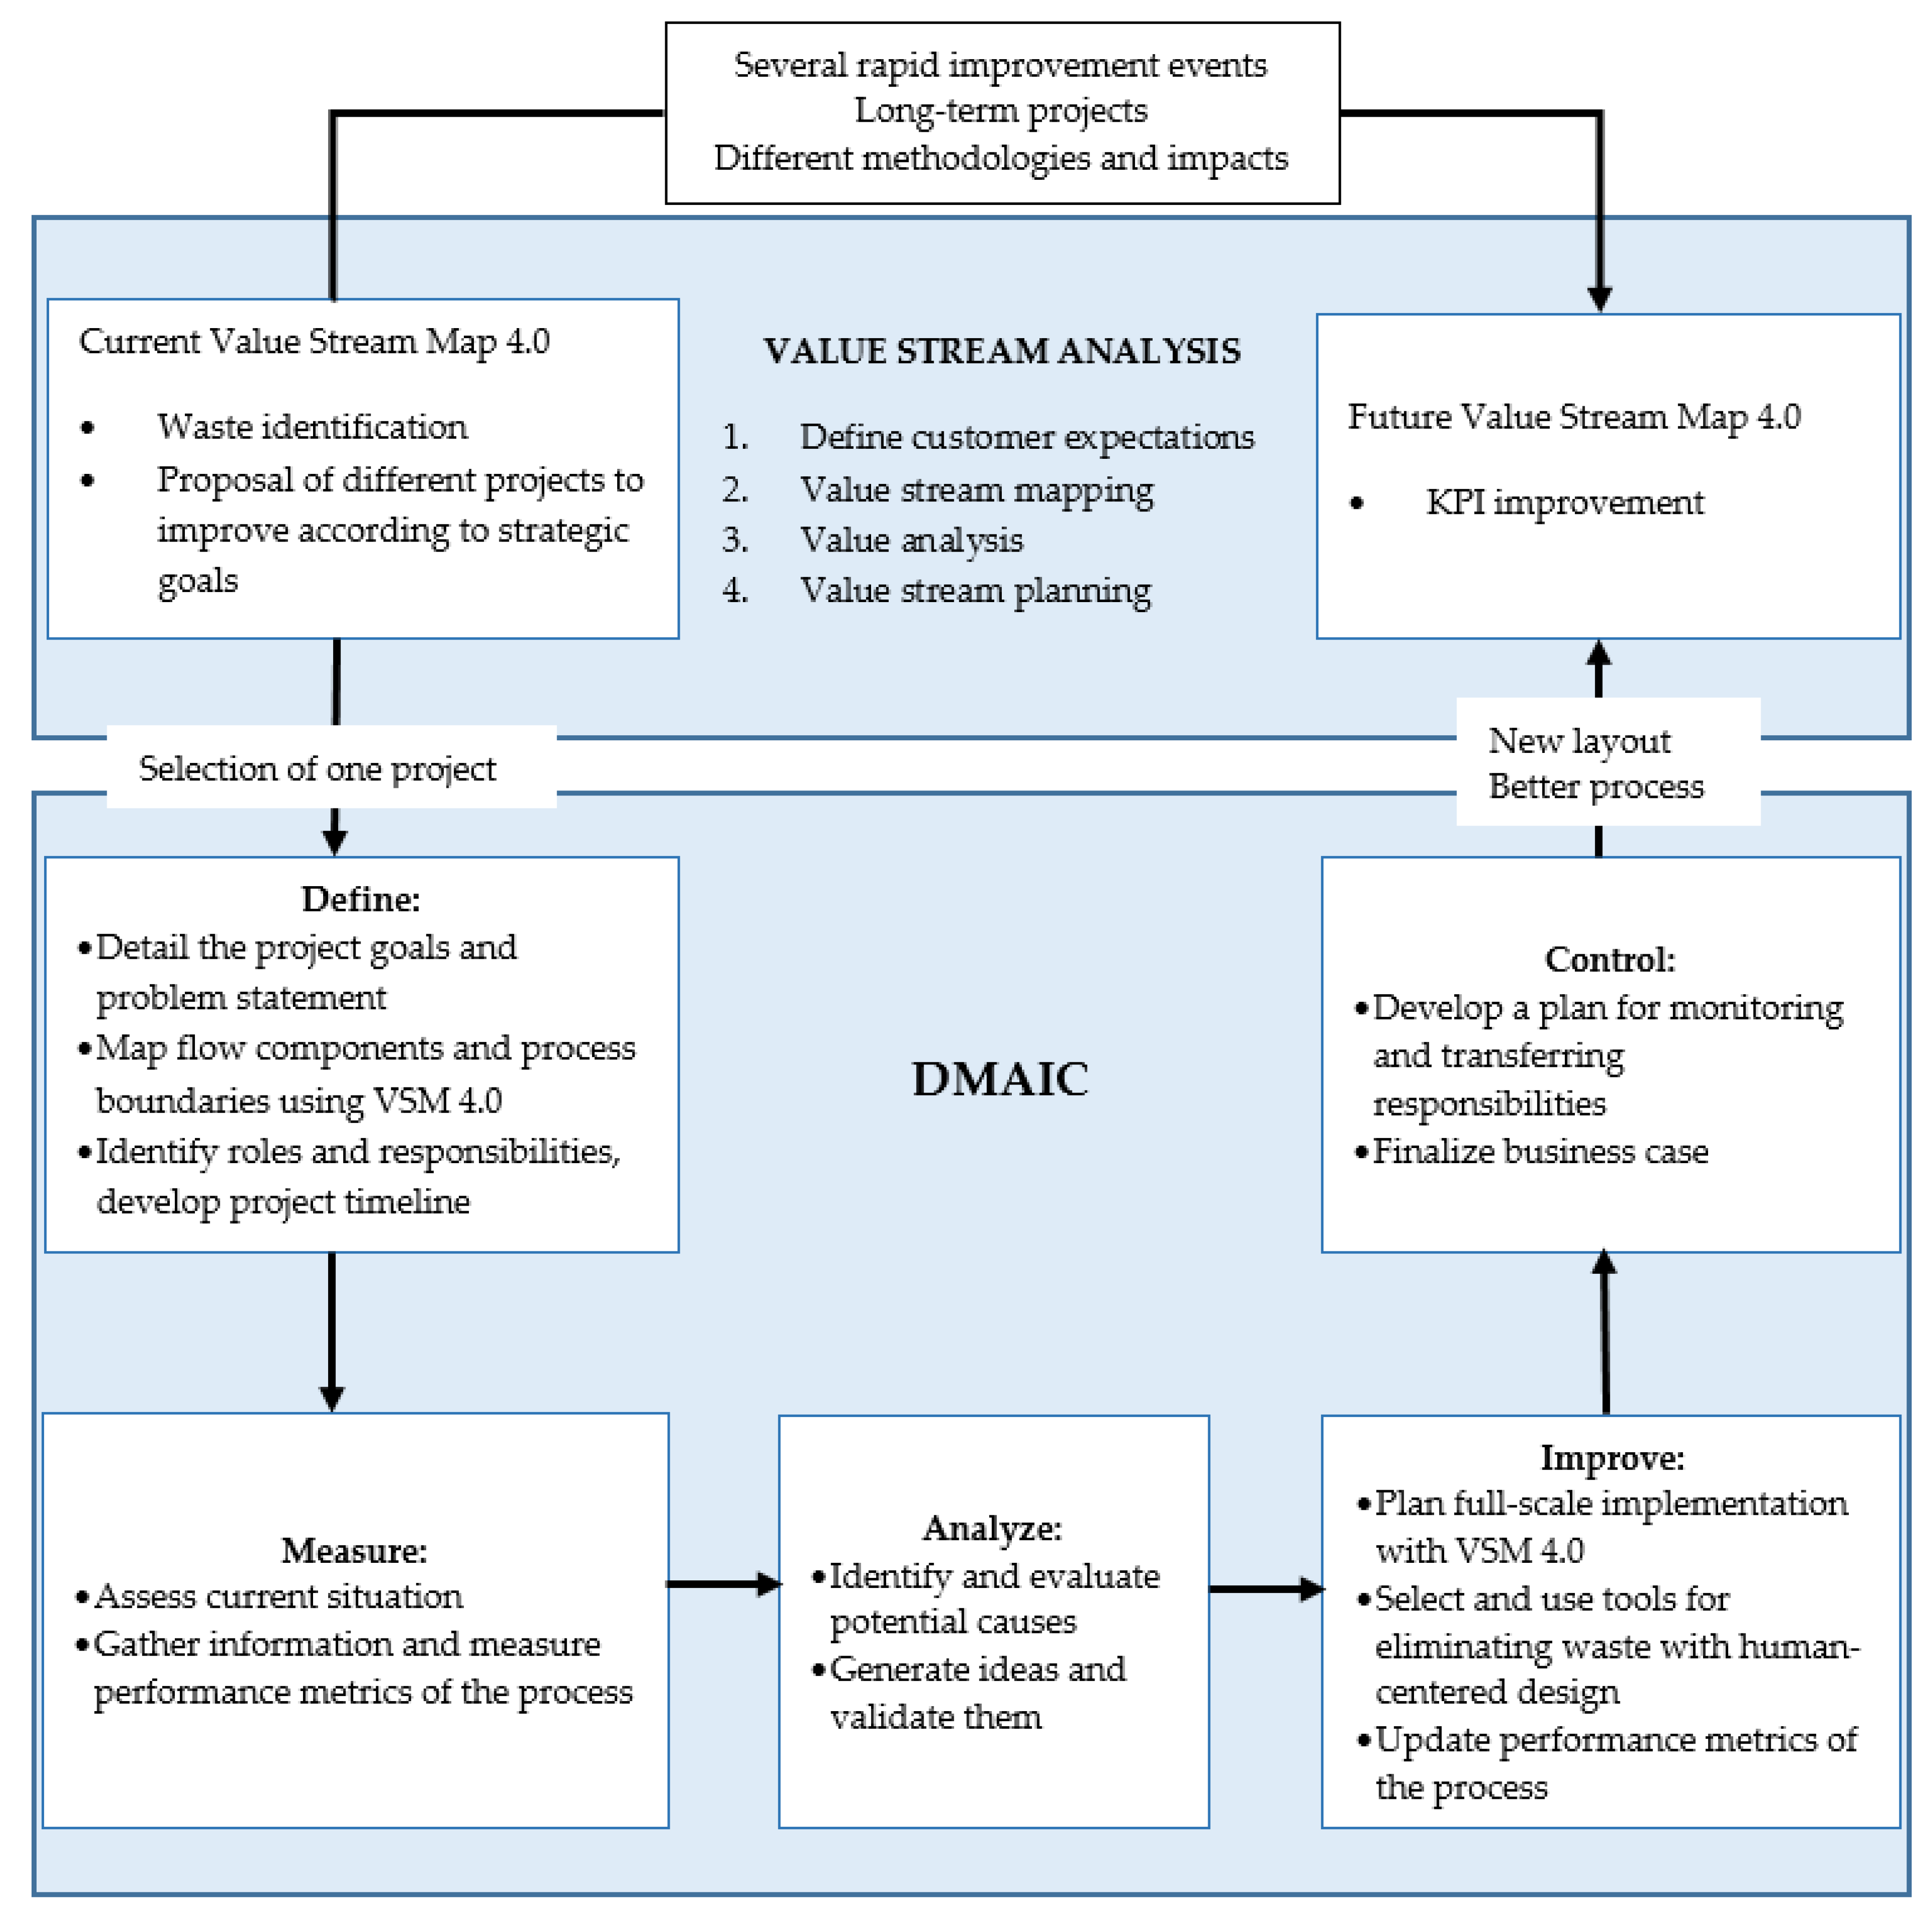
VSM creates product lines, records current states, envisions future states, integrates project pipelines, and transforms industrial activities. The map also allows users to focus on materials and information flows [24]. Traditional VSM is mainly used in a series of production lines that produce a single product or a single series of products. It now faces challenges in the big data environments that perform real-time data processing, visualization, and decision assistance. Therefore, it is not suitable for production sites with many products, unstable batches, and frequent line changes [25].
Recently, VSM was combined with Industry 4.0 technology to improve the traditional VSM. Both VSM 4.0 and Dynamic VSM (DVSM) can demonstrate the manufacturing performance of the entire process in real time through a data acquisition system. Meudt et al. [26] applied VSM 4.0 to detect waste and loss in information flows. Hartmann et al. [27] provided steps for designing VSM 4.0 and a new understanding of the information in the value stream. DVSM is based on the integration of traditional VSM and Industry 4.0 technology, connecting production factors such as equipment, workers, and materials. Ramadan et al. [28] combined RFID technology with VSM and proposed a DVSM implementation framework to track and visualize the development cost of a single product. Huang et al. [29] proposed a multi-layer DVSM that combines traditional VSM with a multi-agent system based on cyber-physical system (CPS) technology. An agent can automatically collect data near the site in order to display changes in key metrics related to materials and information flows in a multi-stage production process, either in real time or near-real time. Balaji et al. [25] introduced an integrated model of the internet of things (IoT) and VSM to collect shop floor data and monitor on-site status in real time, helping managers to quickly carry out improvement activities based on experience. Schoeman et al. [30] applied VSM to visualize and analyze waste flows of an iron and steel company in order to achieve an environmentally responsible zero-waste environment. Qin and Liu [31] used VSM to improve the entire e-commerce supply chain process for an amazon retailer.
Guo et al. [32] proposed a hybrid approach combining VSM and DMAIC to overcome the practical implementation of a VSM diagnostic tools and verify the performance throughout an air conditioner assembly line. Salah and Rahim [33] identified waste in the current VSM in the DMAIC program and improved and developed it into the future VSM. DMAIC is a framework suitable for integrating lean practices because it is a problem-structuring tool, providing empirical results that can be used to eliminate waste in structured and semi-structured cases [34]. According to Gupta and Jain [35], every lean tool plays a unique role in specific problems. We must use each tool to understand when, where, why, and how to produce a successful DMAIC process. Most lean tools belong to the improvement and control phases of DMAIC, but once an opportunity has been identified, there is no reason not to use them immediately [36]. Thus, more studies based on the integration of LSS and VSM 4.0 are required.
The potential to improve productivity by implementing LSS and VSM 4.0 using a human-centered approach is worth exploring. An essential aspect of continuous improvement is the inclusion of a human-centered design, as traditional LSS interventions, while attempting to maximize productivity by minimizing resources, often ignore human constraints and needs. When humans are integrated into continuous improvement activities, they provide a whole new dimension in the improvement process and a new perspective on its design [37]. Therefore, to ensure increased productivity and improved working conditions, a continuous improvement process should be implemented whilst simultaneously using a human-centered LSS approach. To achieve this, a comprehensive methodological framework is required.

3. Research Method

Lean and Six Sigma are two compatible problem-solving methods [38]. Lean typically starts by developing an understanding of the customer’s added value and then uses VSM to examine the process in detail. When VSM identifies criticalities in process steps [22], Six Sigma provides a data-driven analytical approach to define and quantify the error types. LSS specifies an improvement process called DMAIC. Figure 1 depicts the LSS improvement model using VSM 4.0.
In the DMAIC process, VSM 4.0 is used in the define and improve phases. First, in the define phase, team members write a project charter detailing the project goals and problem statement and use VSM 4.0 to map the process components and process boundaries. In addition, a project management team is assigned to determine the roles and responsibilities and develop the project timeline. Next, in the measure phase, the project team members assess the current situation in order to gather information. Before entering the analyze phase, we must measure the performance metrics of the process.
During the analyze phase, the project team members identify potential causes and evaluate them through hypothesis testing and other explanatory analyses. Some ideas are also generated and must be validated before they can be used in the improve phase. For the next phase of improve, team members plan how they will use VSM 4.0 for a full implementation, select and use tools to eliminate waste, and update the performance metrics of the process as needed. Finally, in the control phase, the team members develop a plan for monitoring and transferring responsibilities to ensure continued success. Additionally, the team finalizes the business case using risk and financial analyses. At each of these phases, tools are used to ensure the correct execution of the picking workstation design, as shown in Table 1.

4. Case Study

The case company, called Company T (TC), is located in Spain. It is a world leader with operations on all continents and authorized distribution in 75 countries. TC manufactures truck coolers to ensure world-class quality and promote a diverse culture. The company’s managers found, using the annual value stream analysis (VSA), that they needed to respond faster in order to deliver higher quality products to customers, and they identified certain gaps in the manufacturing process. Among the three parallel picking stations at the ends of the three assembly lines, one of the gaps was related to the preparation of bags with distinct sets of electrical components in the style of a typical picking station. Managers found that there was a lot of waste in the process, a lack of inventory management, and frequent customer complaints. Thus, they devised the idea of combining three workstations into one so that they could hire a full-time employee to prepare the small bags with the electronics. Furthermore, because of their strong dedication to diversity, the company seized the opportunity to integrate people with intellectual disabilities into the new workstations. Therefore, the entire workstation had to be designed with great attention to detail, visual cues, and intuitive operation.
The VSA developed certain management agreements, including specific goals and KPIs for the next 12 months, in order to improve the process. These metrics are linked to the six performance indicators listed in Table 2 (safety, quality, delivery, inventory, employee engagement, and growth), as well as statuses and their projects. After reviewing the VSM, the managers identified several contingencies for identifying opportunities for the improvement of the process. A striking highlight was the kit preparation workstation. The cooling unit has three assembly lines, each with a picking station. Each unit takes less than a minute to run. The workers at this workstation pack electronic components into small plastic bags. These components can be used to install cooling units in the customers’ trucks. The workstation is subject to the following issues, including the triple inventory points. Since the amount of work required is less than one cycle time, workers must constantly switch between workstations, and they perform other work at the same time. Some customers complained that the components were inefficient for installing the equipment and that the process was inefficient due to inappropriate workstations that are poorly designed for the material flow, ergonomics, and 5S systems. It was determined that combining three workstations into one would provide benefits such as providing a sufficient workload for the 4–5 h shifts, reducing the total inventory, because there is only one point of operation, freeing up more space in the production line, increasing production, and ensuring a calmer environment. At the beginning of the line, to optimize the flow, and because there is no need to change the workstations to the same cell in the line, the overall performance of the line workers was improved.
After the VSA, several project ideas can emerge. Using the DMAIC process is useful for running select projects, as it provides a clear roadmap. This case study explains the DMAIC problem-solving process and all the important aspects of designing this unique workstation. The selected project included a person with an intellectual disability because TC’s culture emphasizes community and sustainable development. The company has negotiated an arrangement with AUR, a non-profit organization that helps people with mild intellectual disabilities to find work. Now is the perfect time to build a new picking station, including people with intellectual disabilities, because the labor is simple, safe, and not positioned in the assembly line. As a result, a prospective employee was invited in, a contract with TC was signed, and work began on a new workstation design. This work has to be based on a human-centered strategy based on lean principles; therefore, it starts with attempts to gain a good understanding of people’s abilities, speeds of work, and aspirations. Since the prospective employee was due to start work in 21 days, this became the deadline for the project. The DMAIC flow in this case study is shown below.

4.1. Define

At the end of each assembly line, there are three picking stations for the preparation of bags with the electronic components (kits). These stations take up a lot of space and have many stock outages. Moreover, workers underperformed due to having to fact that they had to change between activities and the picking workstation waste, which only required 1/10 of their cycle time. Defects related to misidentification occurred frequently, and the missing parts could lead to unforeseen downtime. Figure 2 depicts the current VSM 4.0. If the space and waste of the three production lines were used more efficiently, the factory would save time and space, improve the quality, and reduce the inventory. This time and space could be used to add more workers to the assembly line and create more units. The project timeline was 21 days and included all stages of the DMAIC process (see Figure 3). The project began when the company chose to start the DMAIC process to build a new workstation and ended when the workers started work. The control phase lasted significantly longer, at least three months, to ensure that the quality standards were met. Furthermore, the learning process had to be tracked according to the self-interests of the workers.

4.2. Measure

During this phase, the current situation was assessed, and waste was identified and defined. The team first determined what information needed to be gathered and realized that defects were not a quality issue, because the installer had the relevant references; thus, they were fixed within less than a week. However, defects have an impact on delivery, as the customer is not able to utilize the equipment until the installation is complete. Therefore, any defect in the kit had to be considered a delivery issue. The team obtained data by analyzing the last 3000 shipments and found that 97.8% of the defective kits occurred due to missing parts (76%), misidentification (18%), and defective parts (6%). Each production line was assigned a worker who was responsible for the kit preparation. Certain jobs were assigned by this worker to units five or six meters away from the picking station. After completing the mission, the process started with the verification of the unit name and extended to the time when the kit was brought to the unit. Table 3 describes the process and the averages for the types and times of four different workers. Specifically, the process was affected by the following four types of waste:
(1)
The worker uses hand movements (1,7) to travel from their current workplace to the picking workstation and back. However, because the worker is continually changing jobs, this mobility wastes time and reduces productivity and concentration.
(2)
Picking up (4) parts is inefficient, since workers are continually comparing the panel to the materials.
(3)
Mislabeling (6) is common due to the presence of tags from several kits on the table. As a result, the worker must pay close attention to picking up the correct one and comparing it to the unit.
(4)
Movement due to an insufficient inventory (8) occurs with every 200 kits, or every two production days. The worker has to leave the line for about two minutes to gather extra material for the kits when the boxes containing parts run out of material.

4.3. Analyze

After considering the measurements and data gathered, the team proceeded to investigate each defect and determine the root cause. At this stage, a hypothesis is developed to identify the sources of different error types, bottlenecks, and sources of variation. To evaluate the hypothesis, we used five “why” analyses and a quick test. The five main problems observed during the measure phase and their five “why” analyses are summarized, together with the suggested solutions, in Table 4.

4.4. Improve

This phase allows us to test the implementation of the idea and the realization of the project. Because it covers all aspects of the workstation design, installation, and worker participation, the improvement phase is the most thorough. Since LSS is a human-centered approach, it aims to reduce human error by involving workers in the process [39]. Therefore, considering their intellectual disability, it was necessary to focus on the workers’ needs and test the ideas for improvement in participation with them. In this study, an improvement phase using VSM 4.0 was implemented for the following reasons:
(1)
The ability of the worker. Project team members concluded that, if the process was well-structured, simplified, and predictable, workers would be able to complete the work. Therefore, the team established a path that is fully integrated with the workers. The path is designed to last for two months, starting and ending every day for 3 and 6 h successively.
(2)
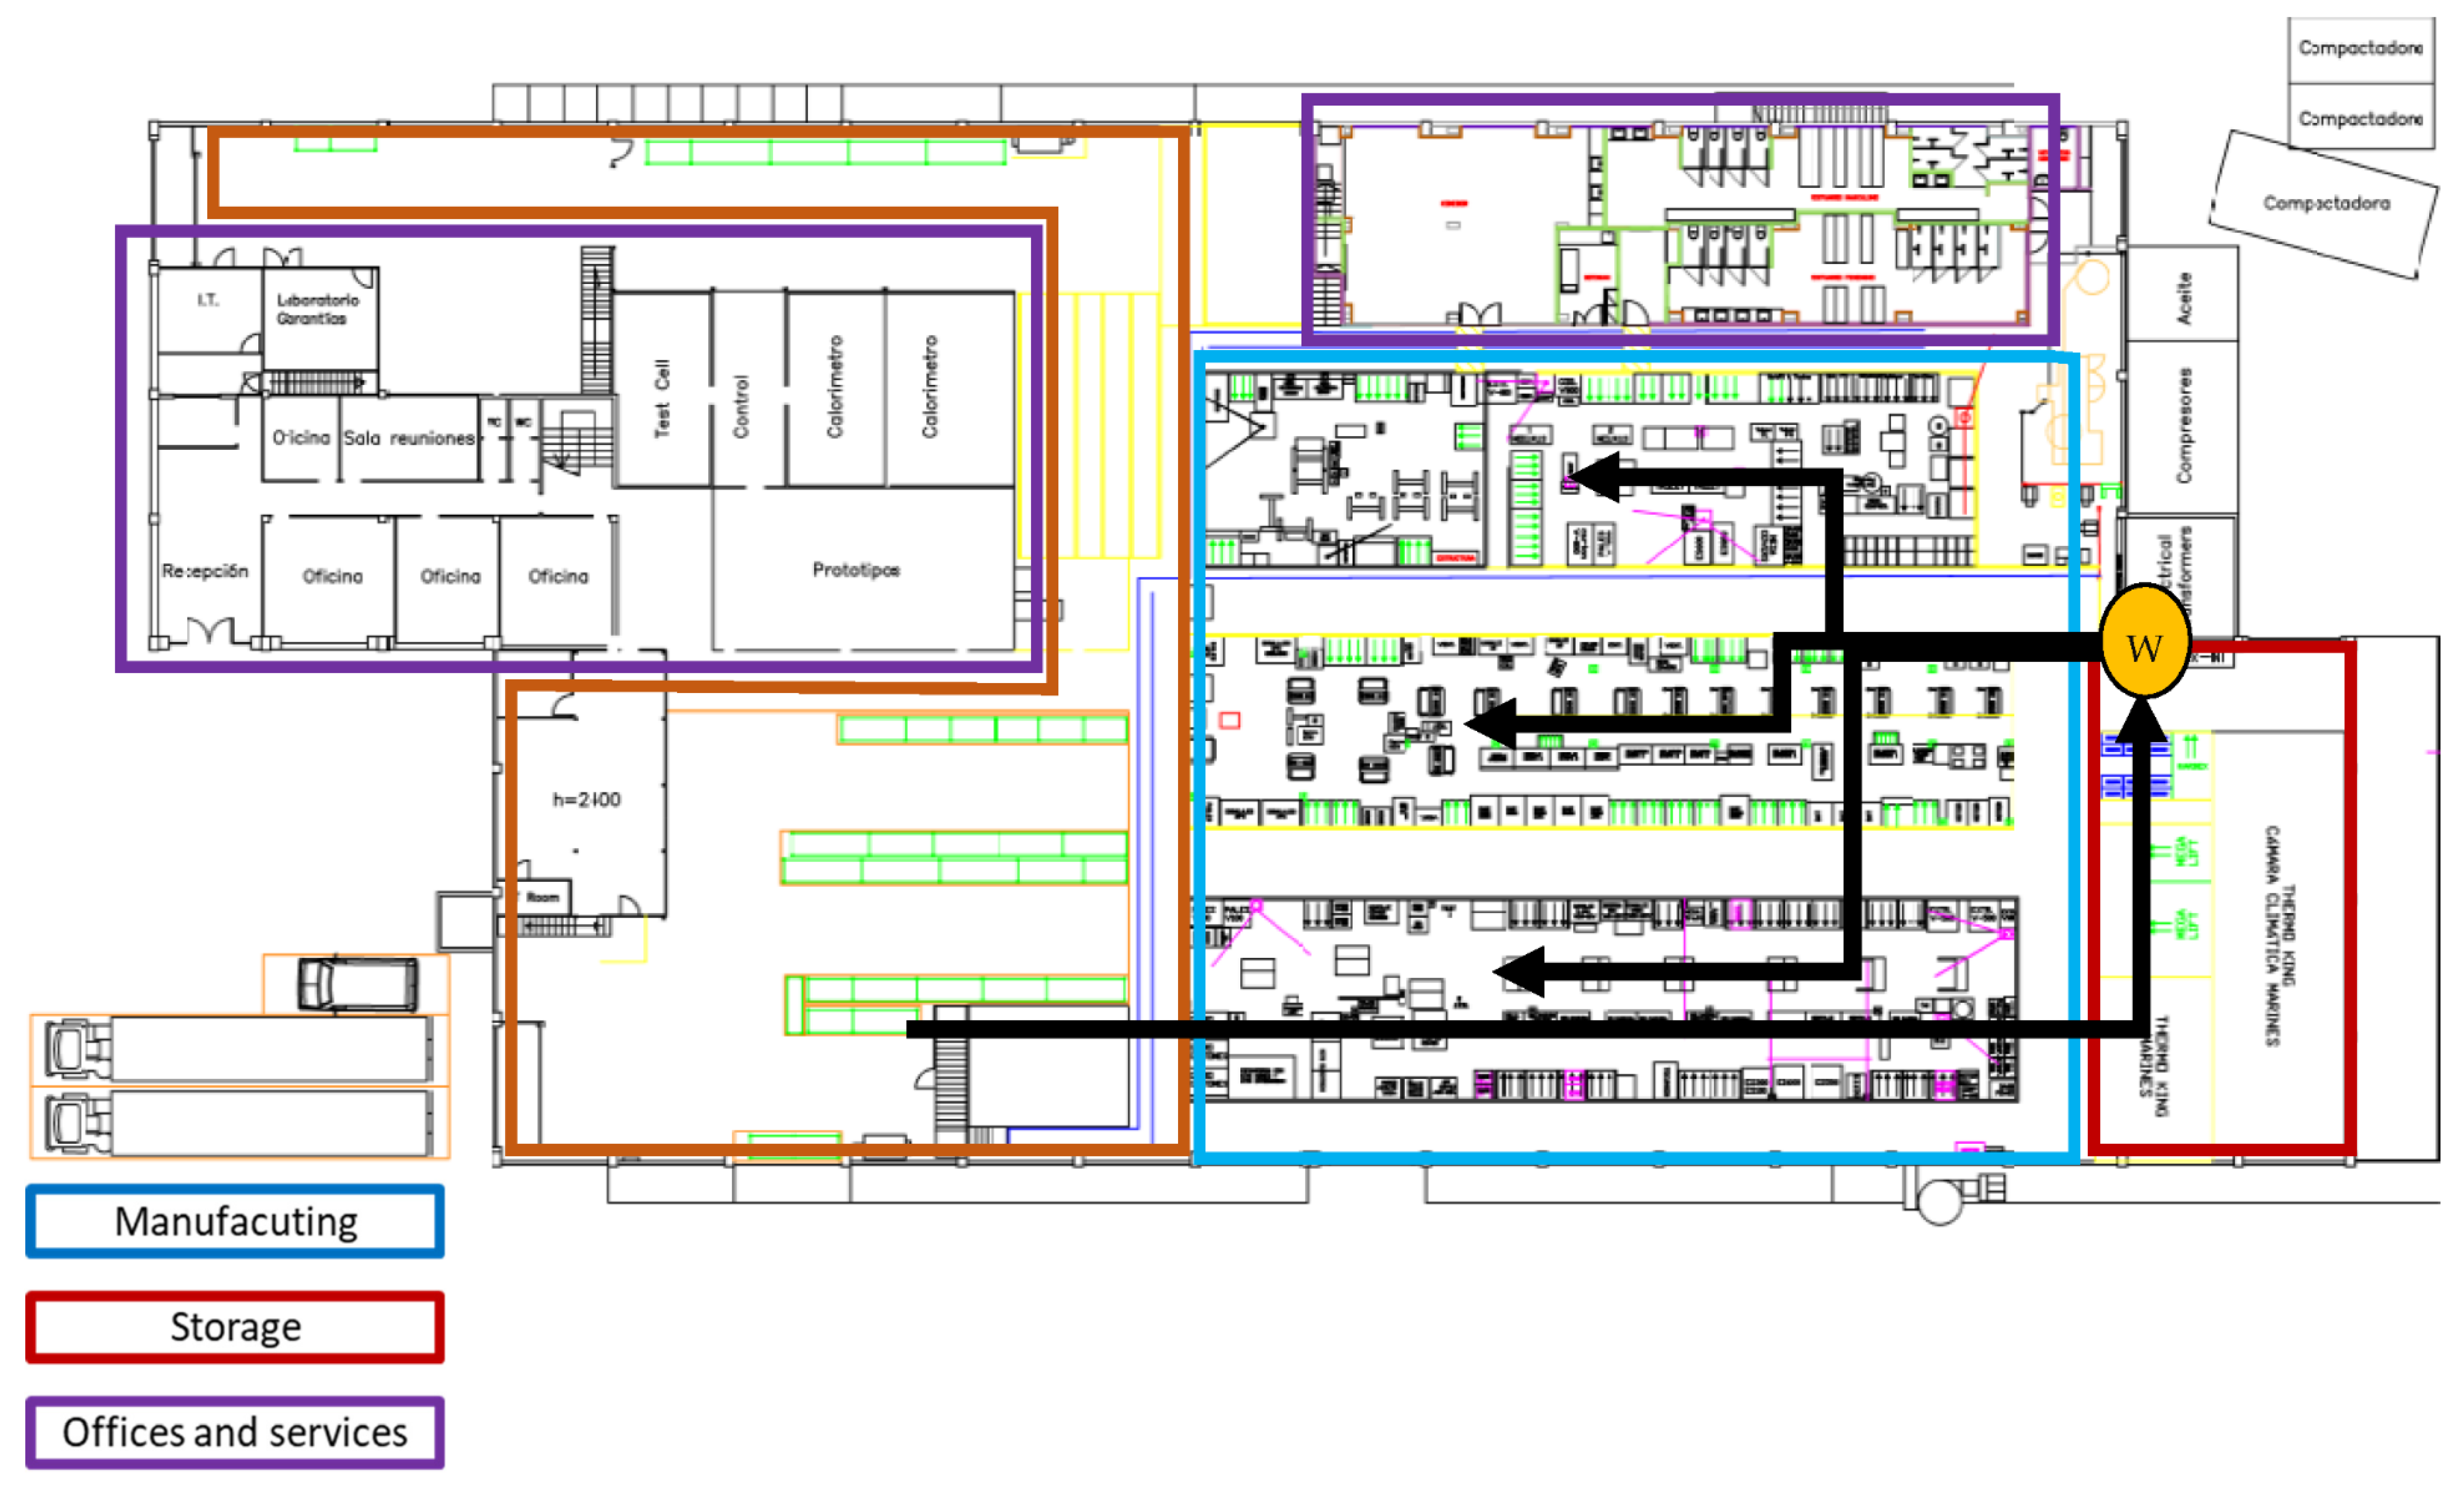
The workstation location. In addition to safety managers and work instructors, the team opted to move the workstations further from the production line, simplifying the material flow. Four types of waste identified in the measure phase were taken into consideration when rearranging the location. The location is at the beginning of the line and the kit is to remain with the structure. The new locations marked with w in the factory layout (Figure 4) illustrate how the workers can be placed at the beginning and center of the production lines in order to distribute the kits to the ends of the three assembly lines. The black arrows in Figure 4 show the incoming and outgoing material flows.
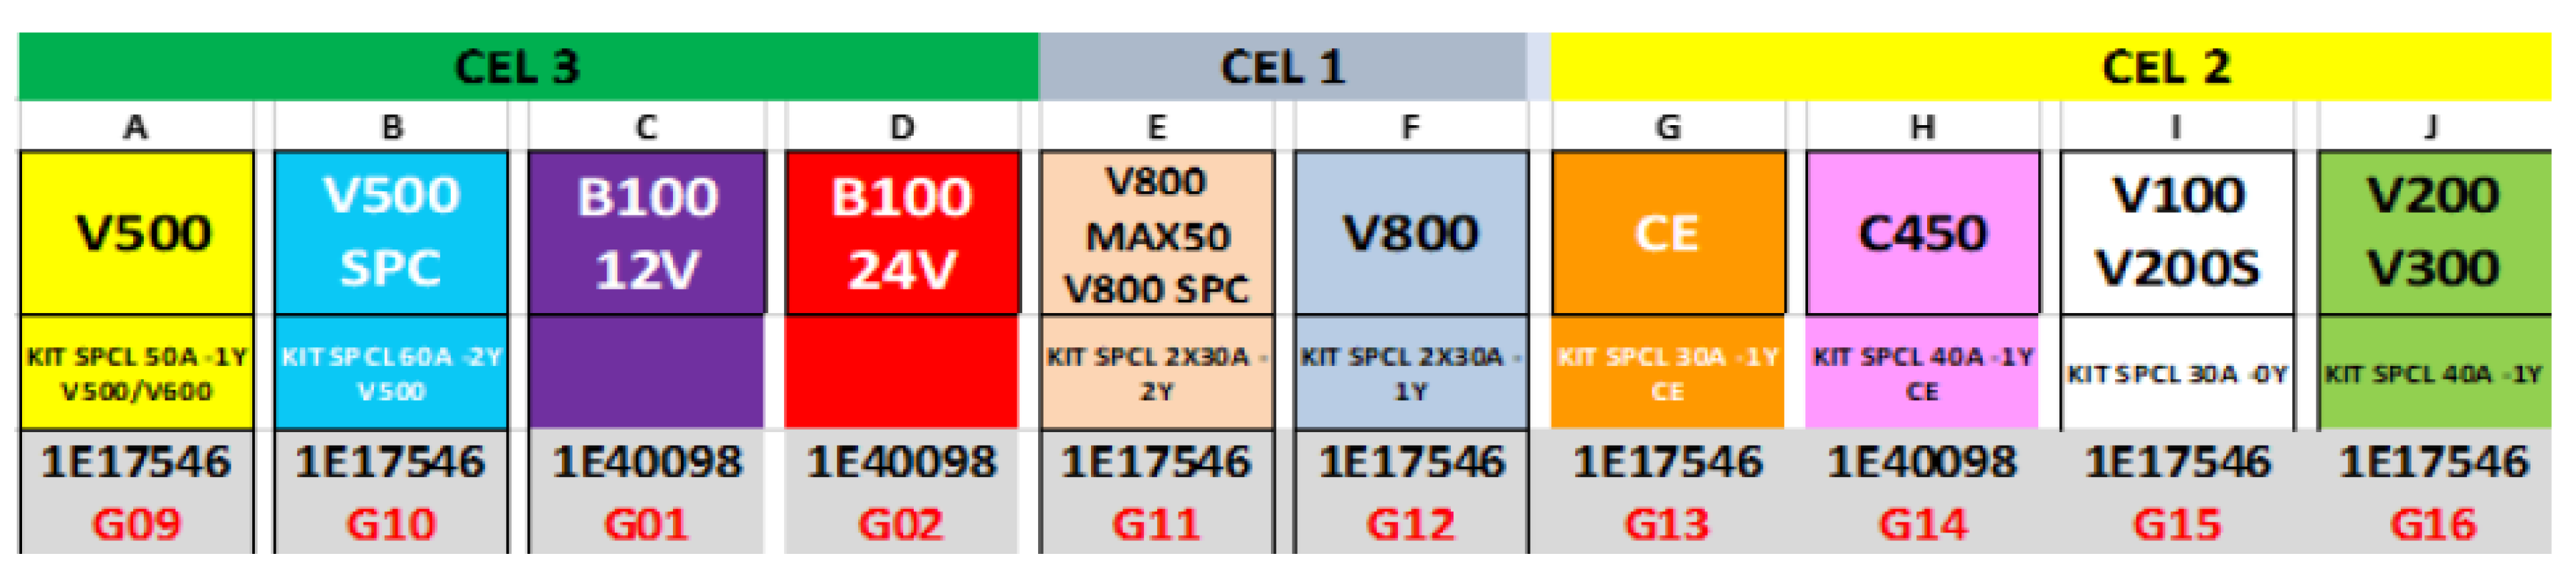
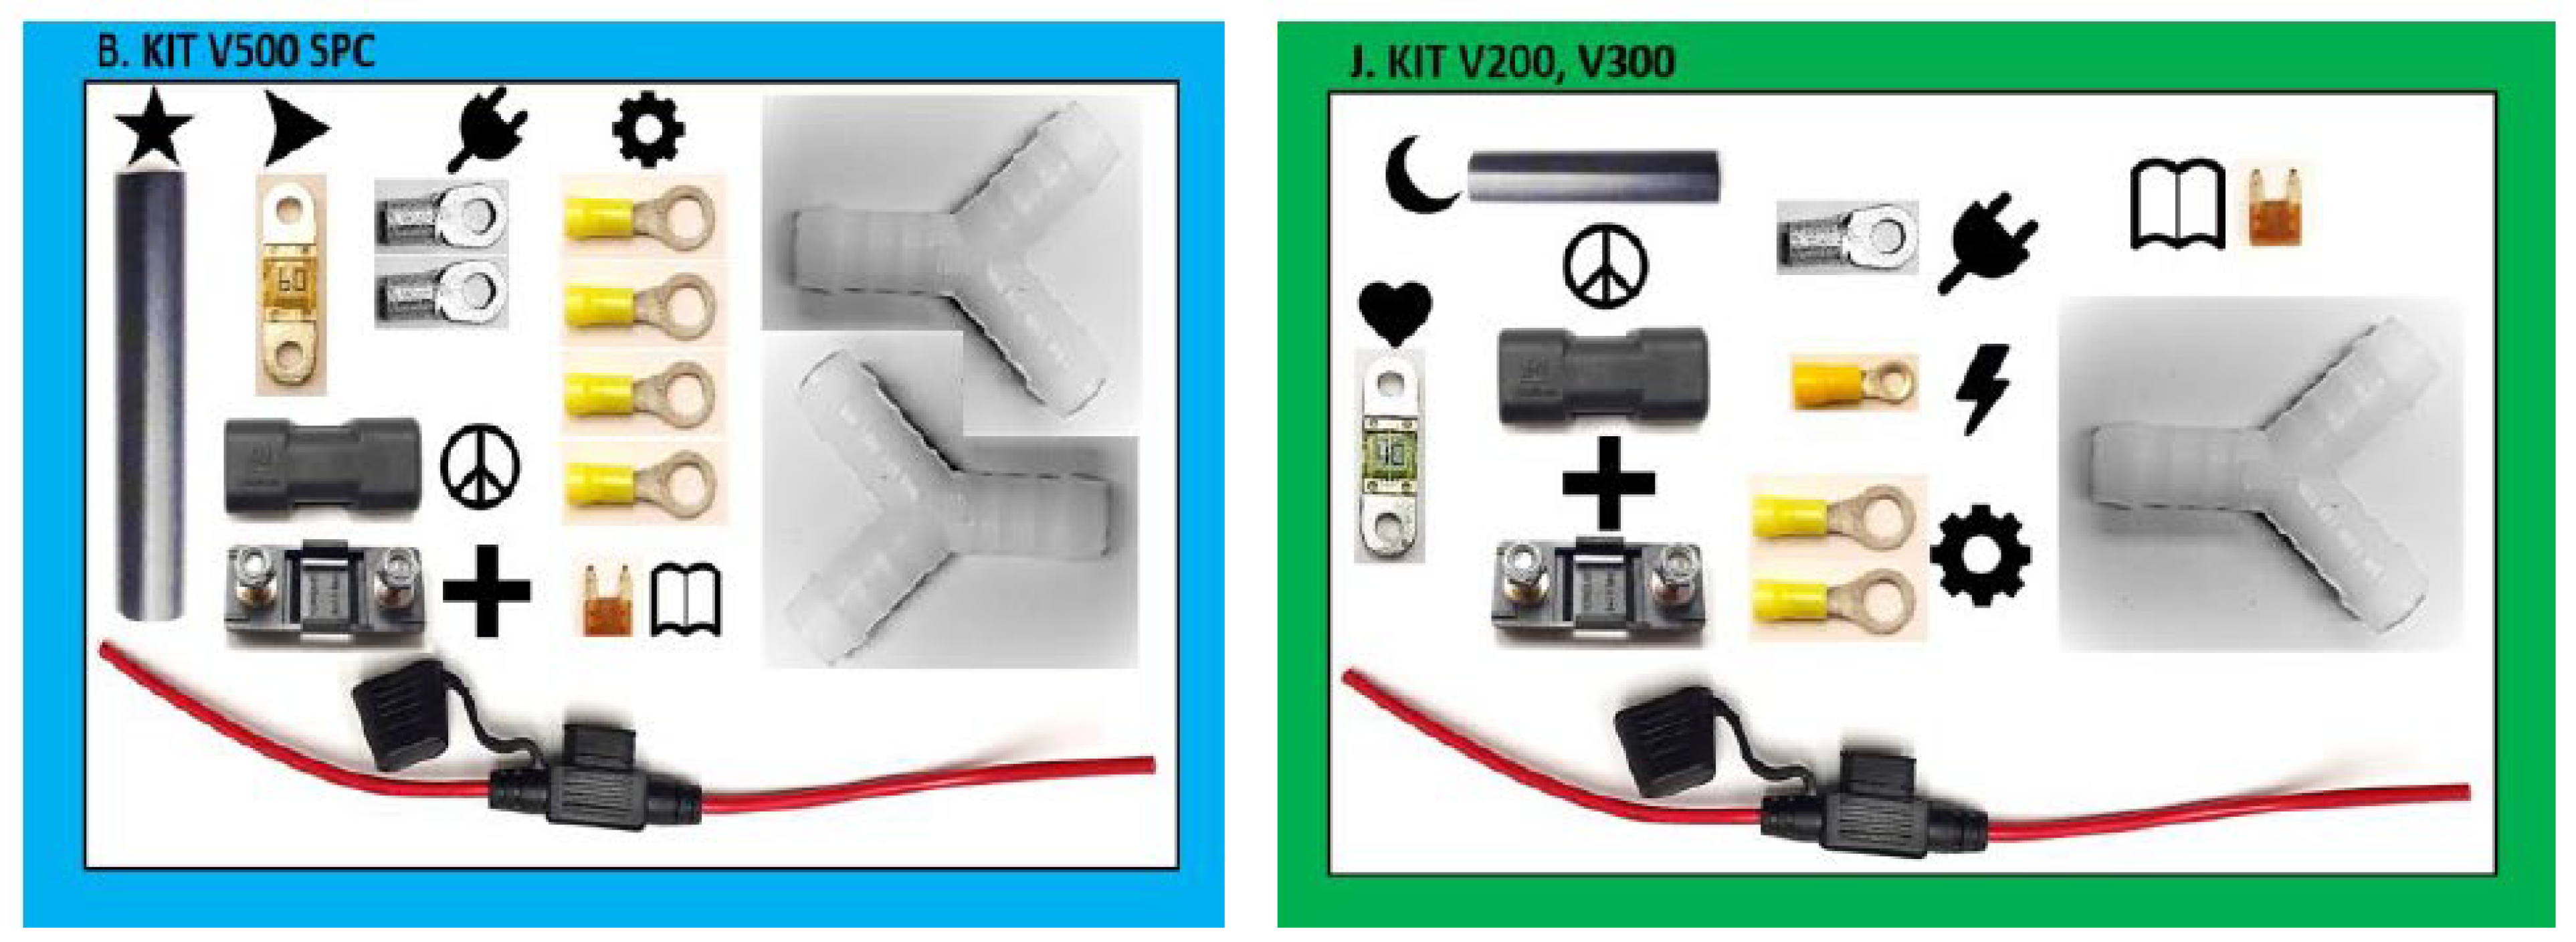
(3)
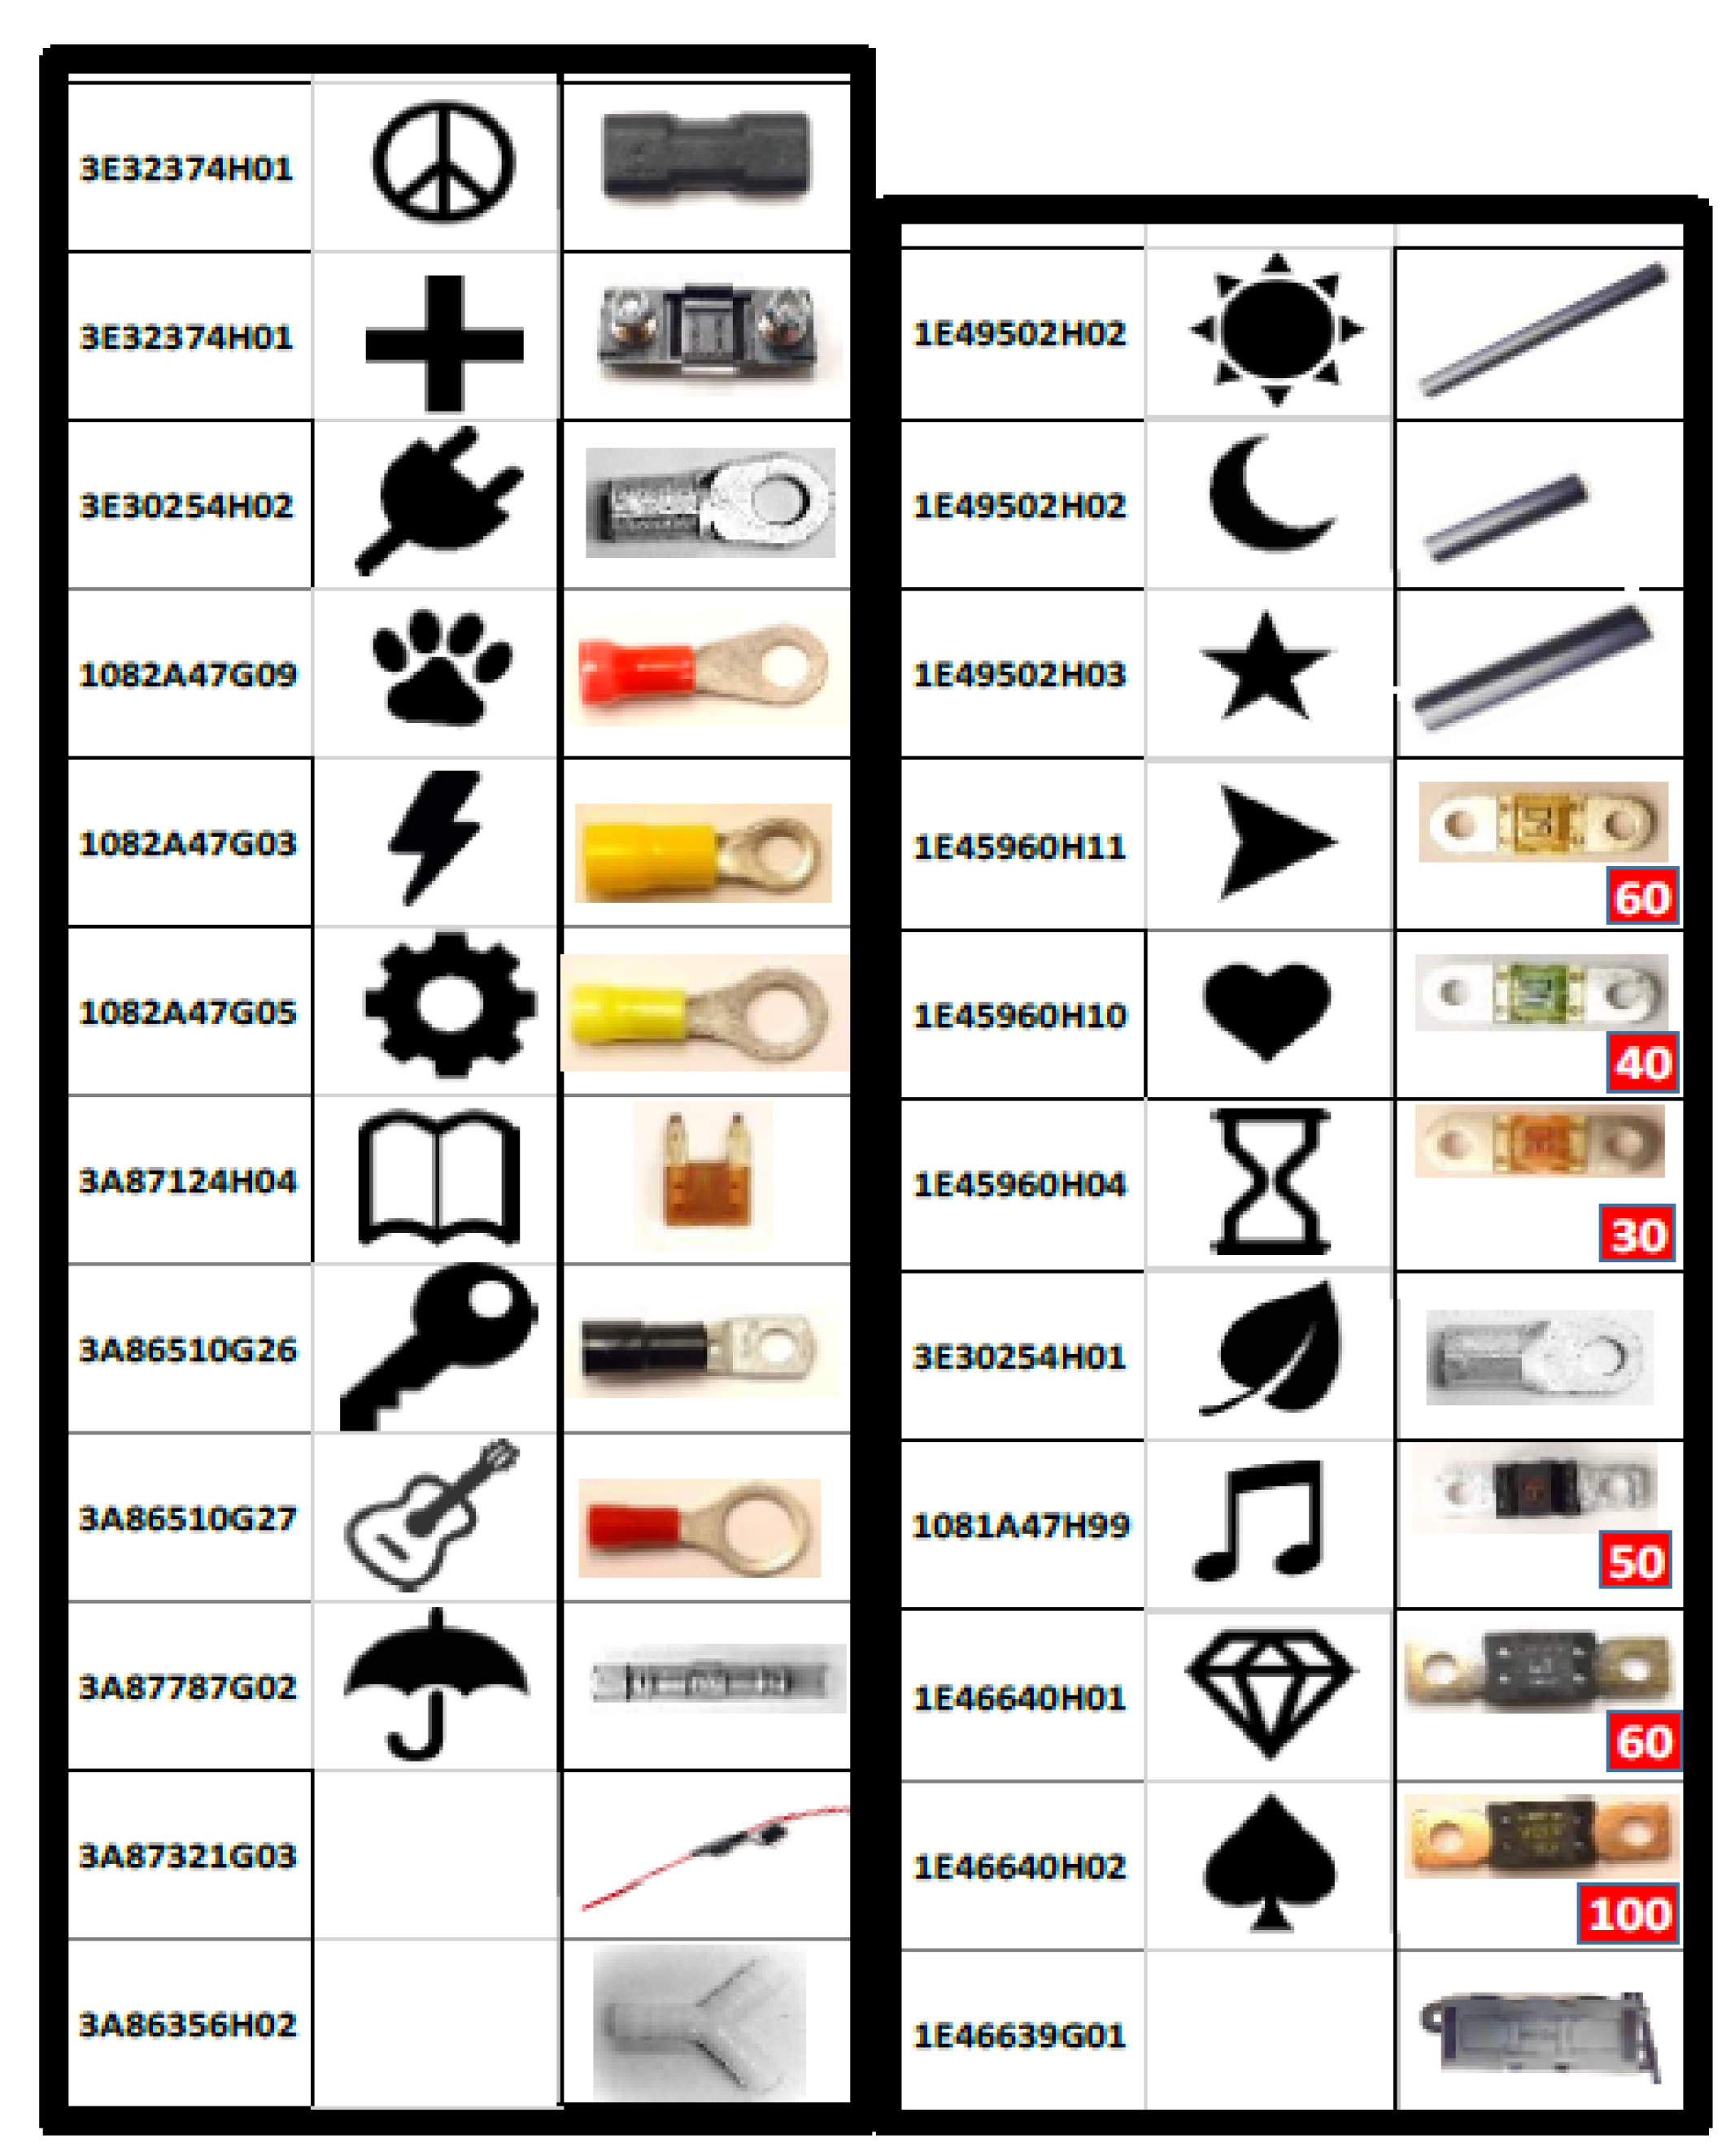
Part and kit codes. To speed up the picking process, all parts and kits required simple coding. The team chose to use symbols to code the parts (Figure 5) and colors to code the kits (Figure 6). Since some parts are already easily identifiable, they do not have any associated symbols. A symbol with an alternate reference number is placed next to the part image. The kits are color-coded and have letters to name them. With this simplification of the parts and kits, templates and tags could be designed effectively.
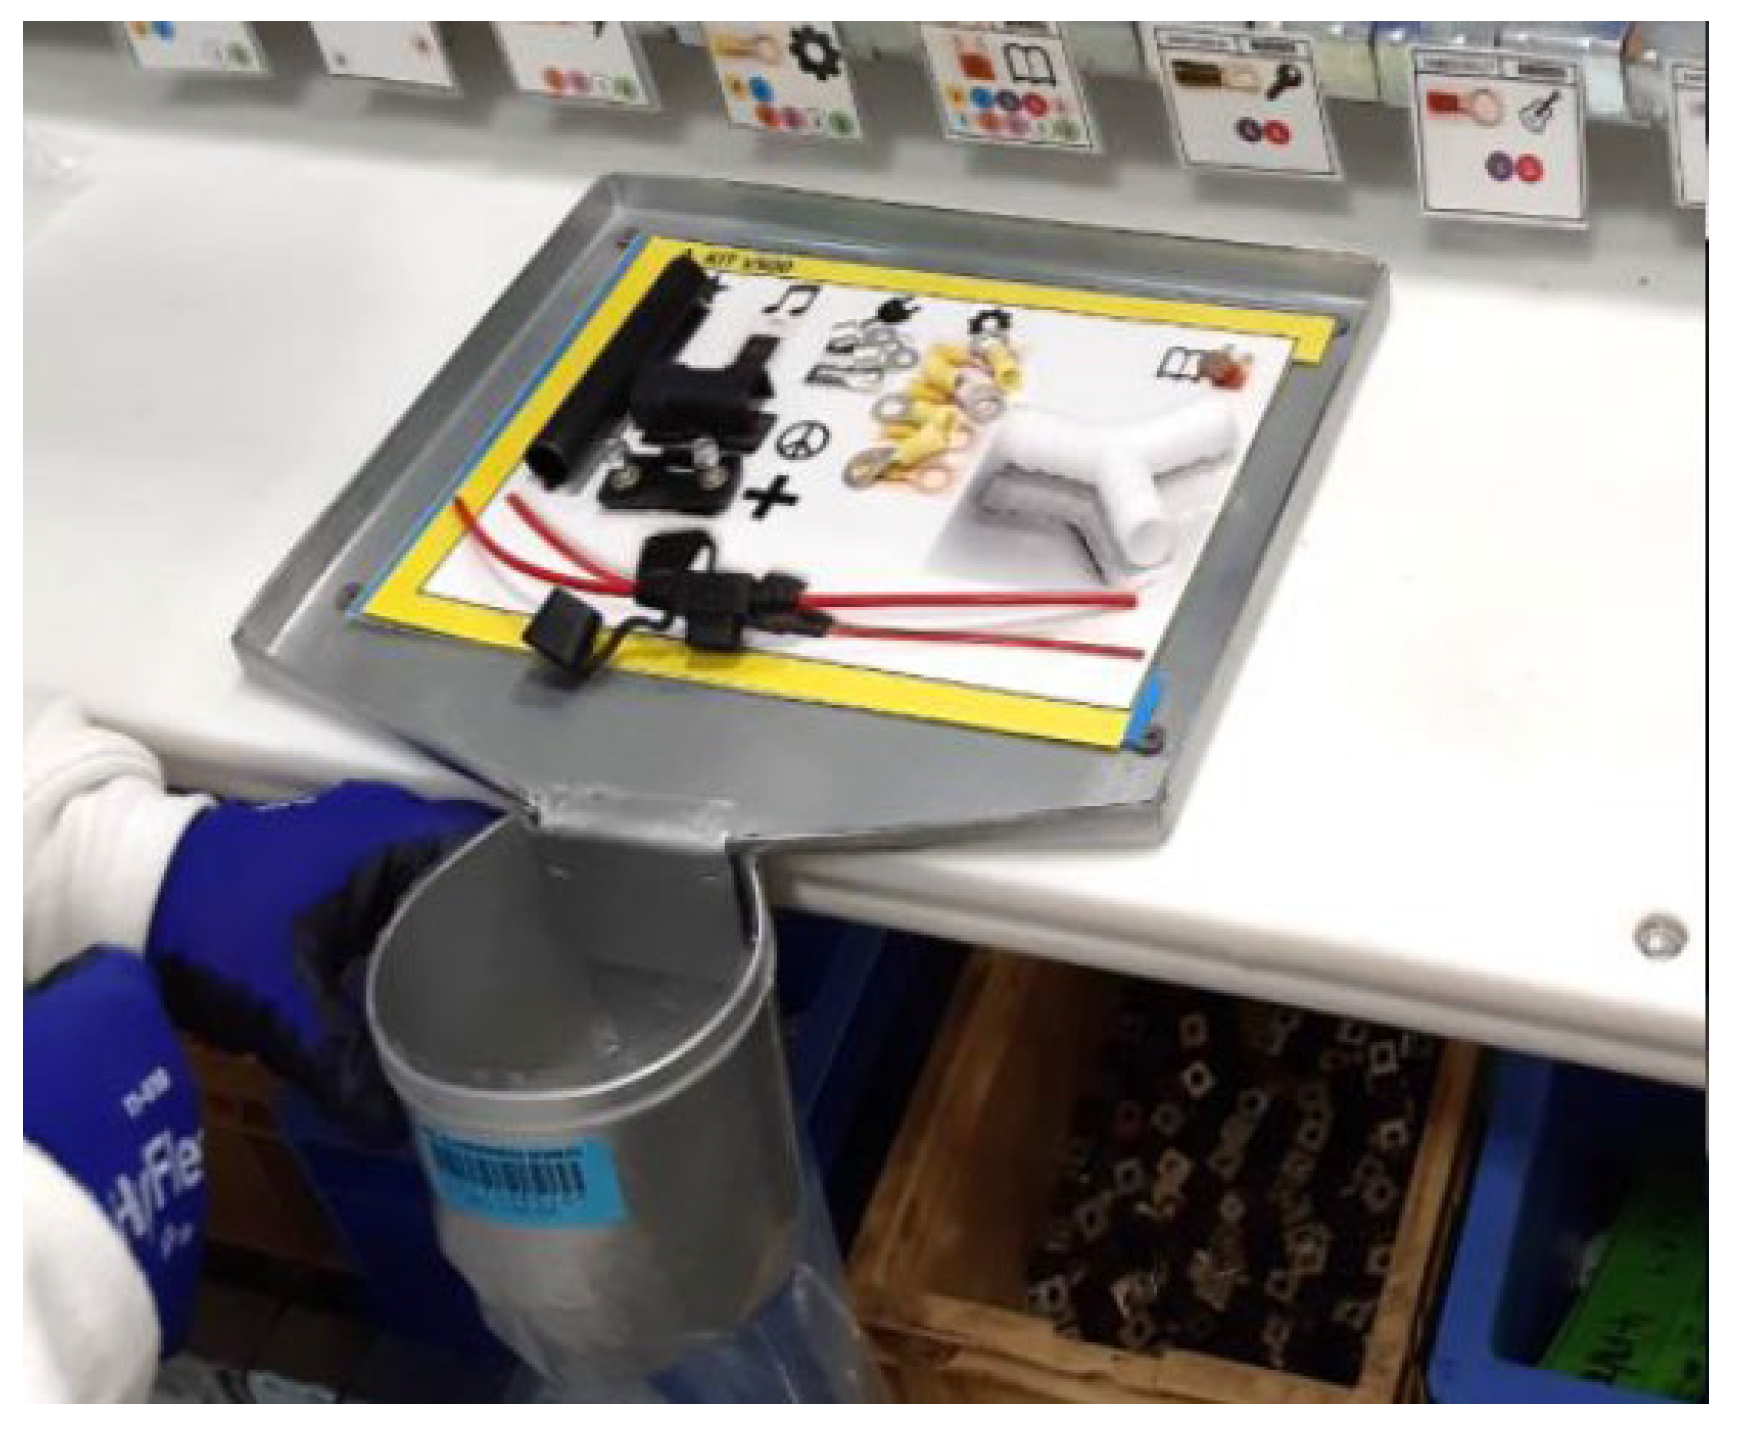
(4)
Templates and trays. The template in Figure 7 depicts the actual dimensions used to identify the surrounding colors of the kit and provide an image of the part, so that workers can easily view the part on the top of the picture. There are tapes behind the template for fixing the metal tray. Figure 8 shows a tray with a funnel placed below it at a low height to prevent parts from falling out of the tray.
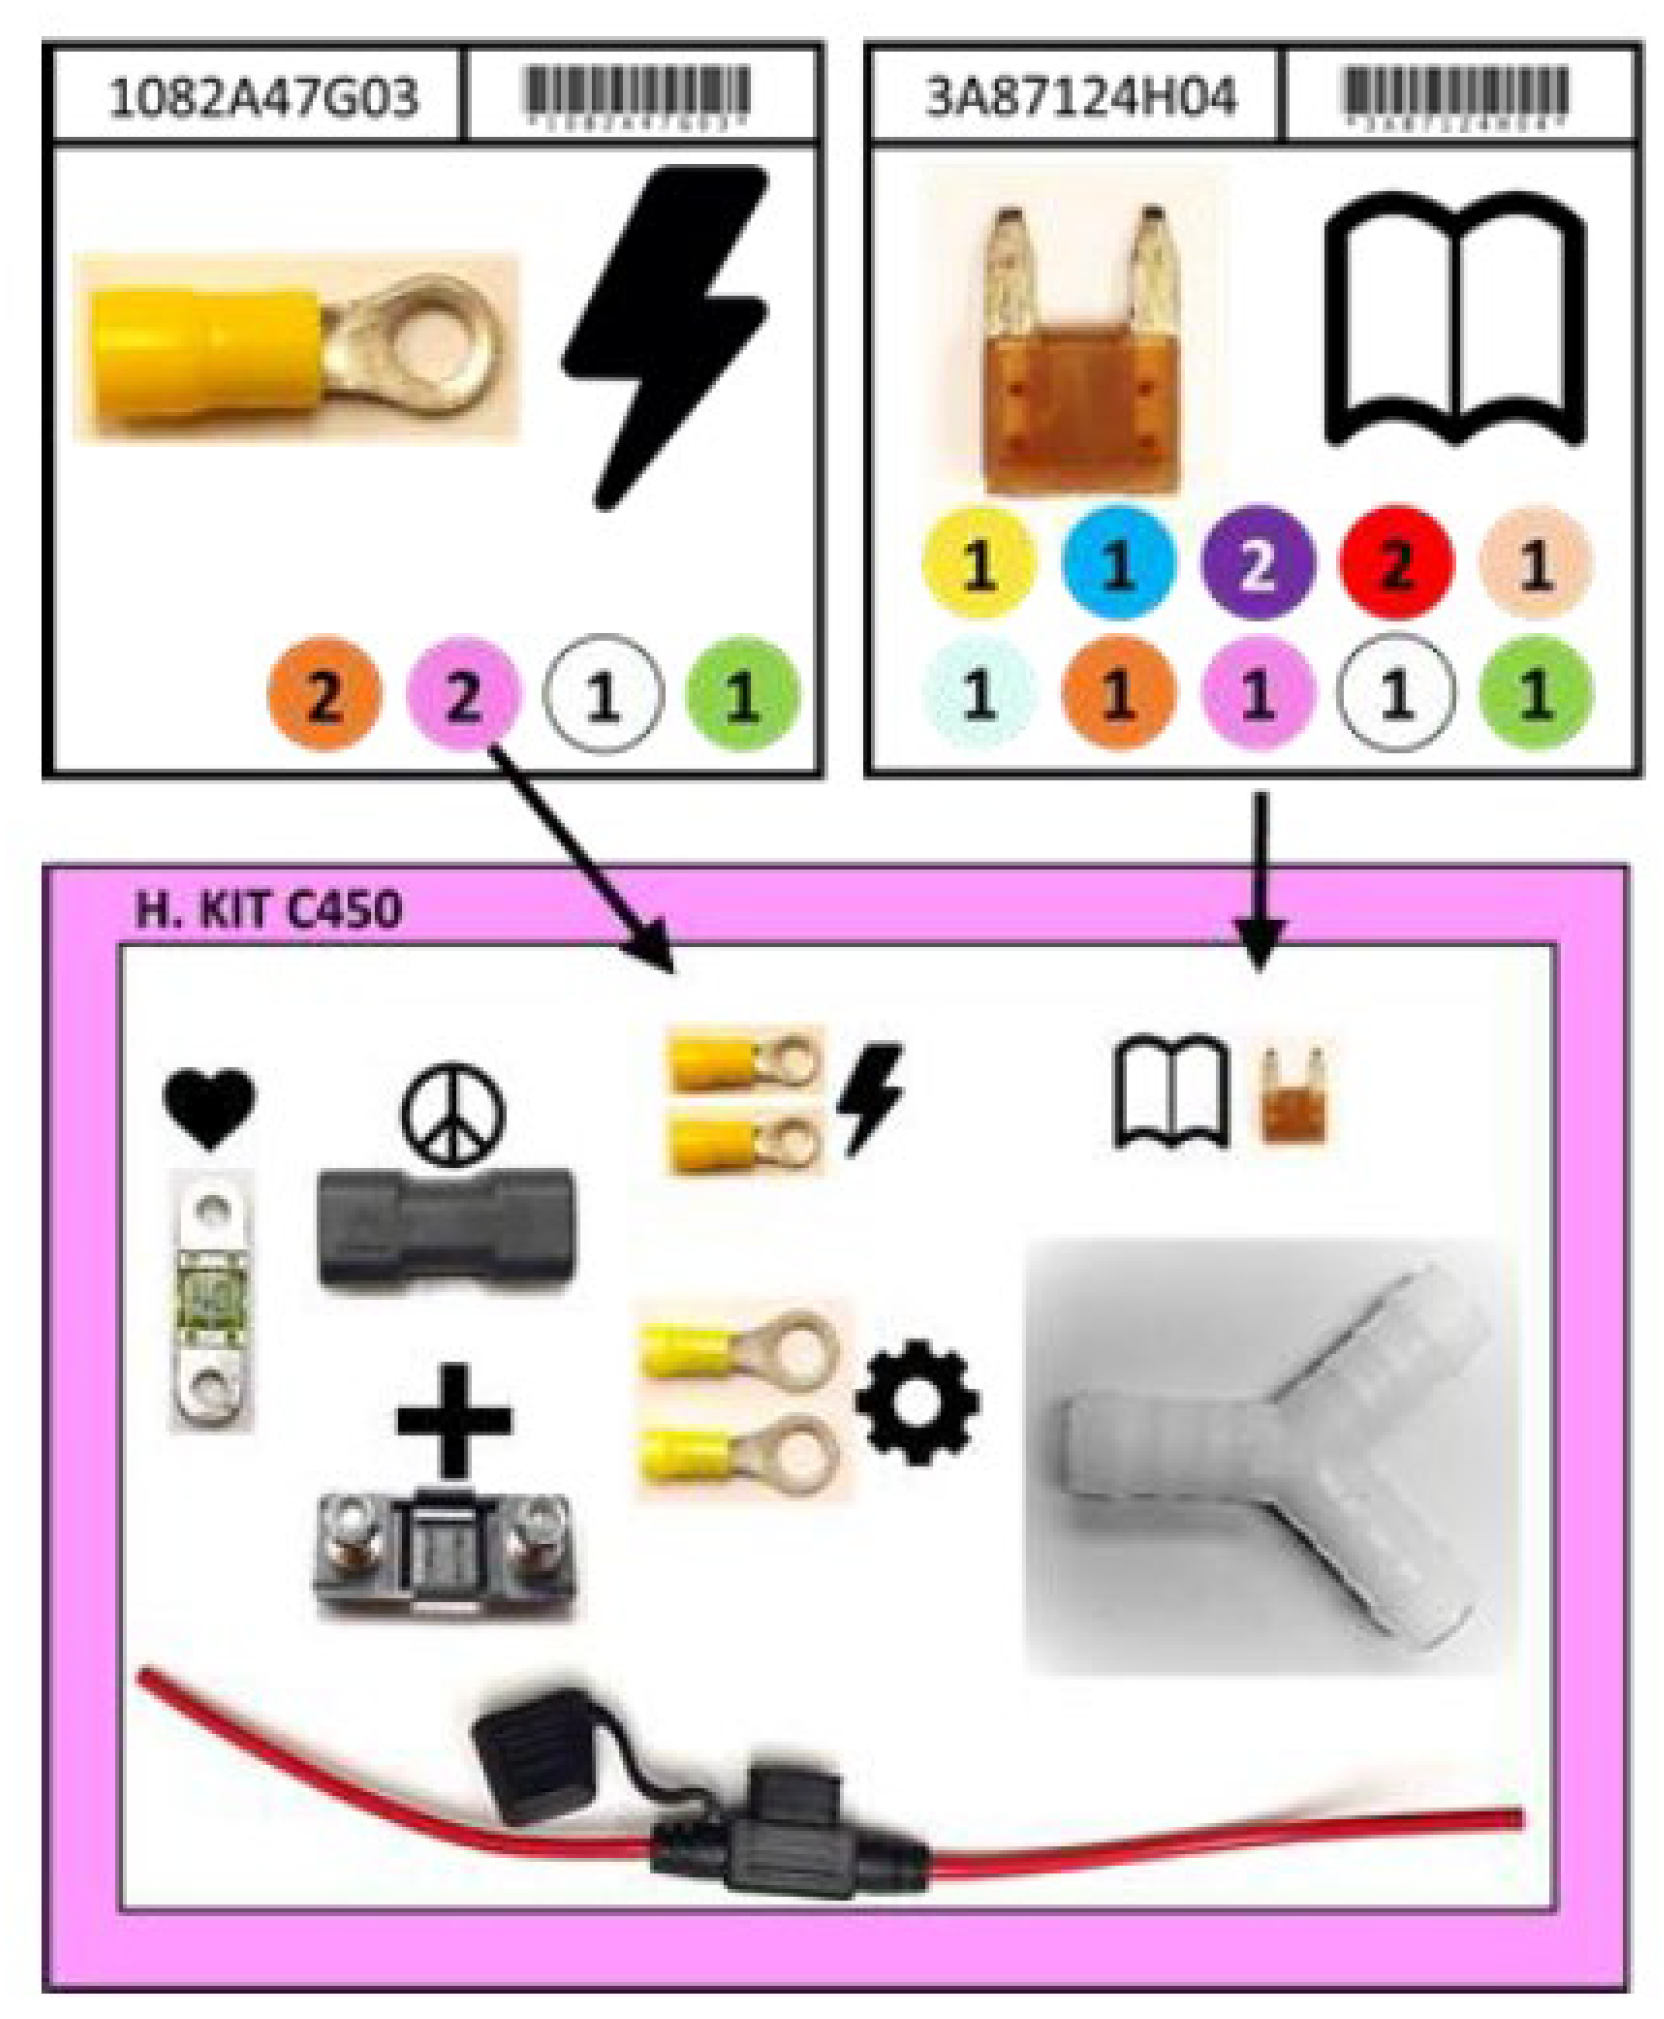
(5)
Identification card. The appearance of the card allows for quick viewing for the selection of parts. It was deemed that the cards should have a visible picture of the parts and symbols and include colors and quantities to indicate to the workers which kit they correspond to. Figure 9 illustrates how the templates and cards work together.
(6)
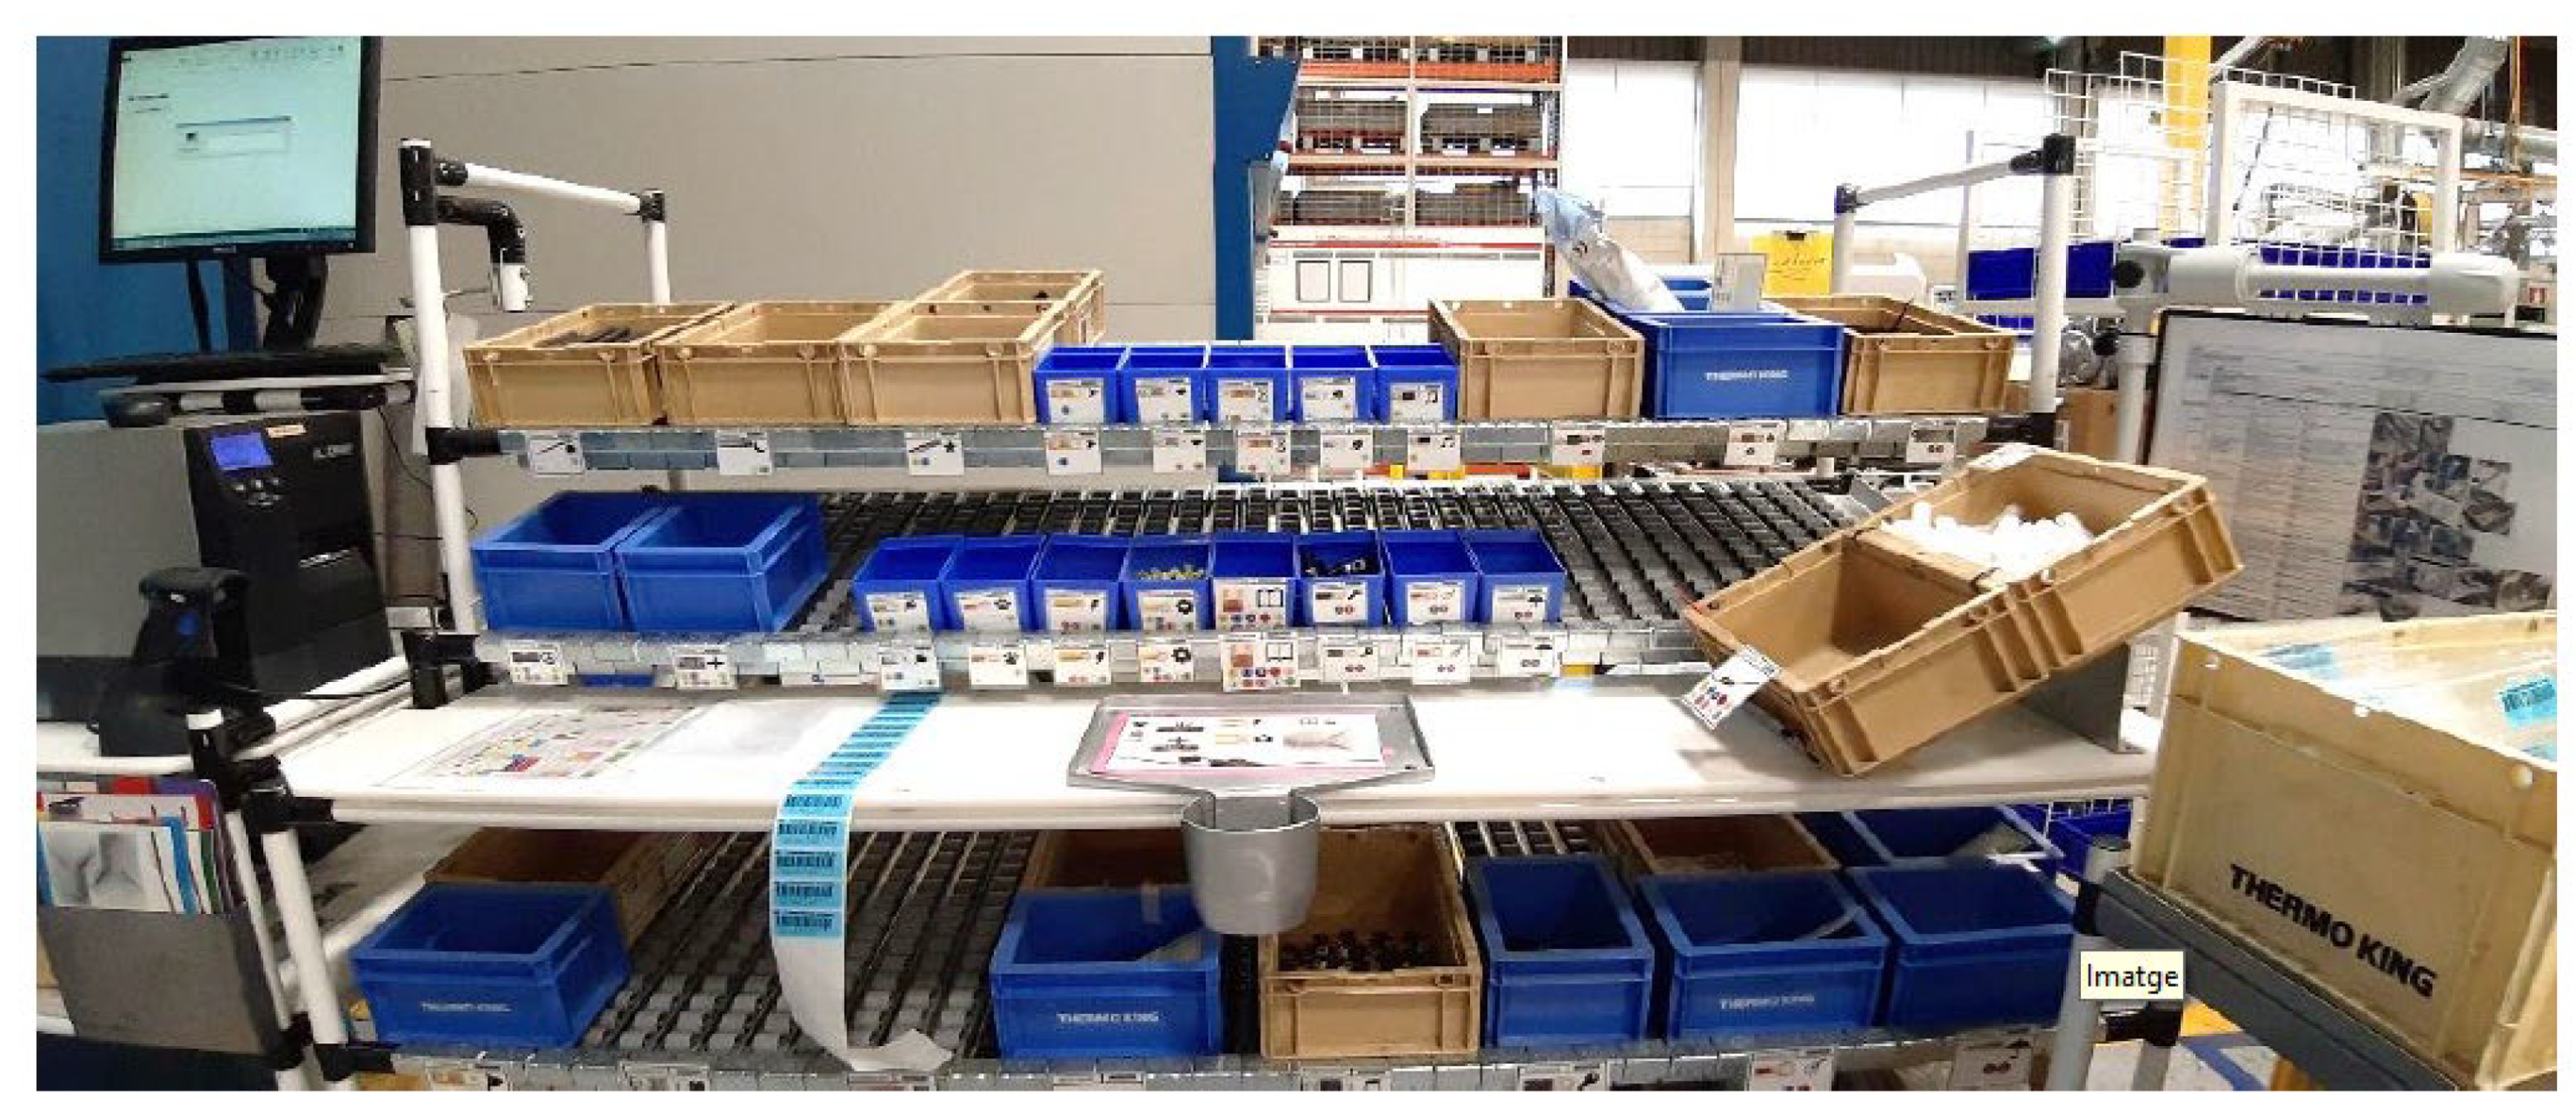
Box location and size. All parts are divided into three sizes of box: small, medium, and large. The locations of the boxes are sorted according to the frequency of their replenishment: very frequent, common, and rare. Other important considerations are that all boxes must be within reach of the worker (no walking required) and that boxes containing more frequently used items should be in the center. A complete image of the workstation is shown in Figure 10.
(7)
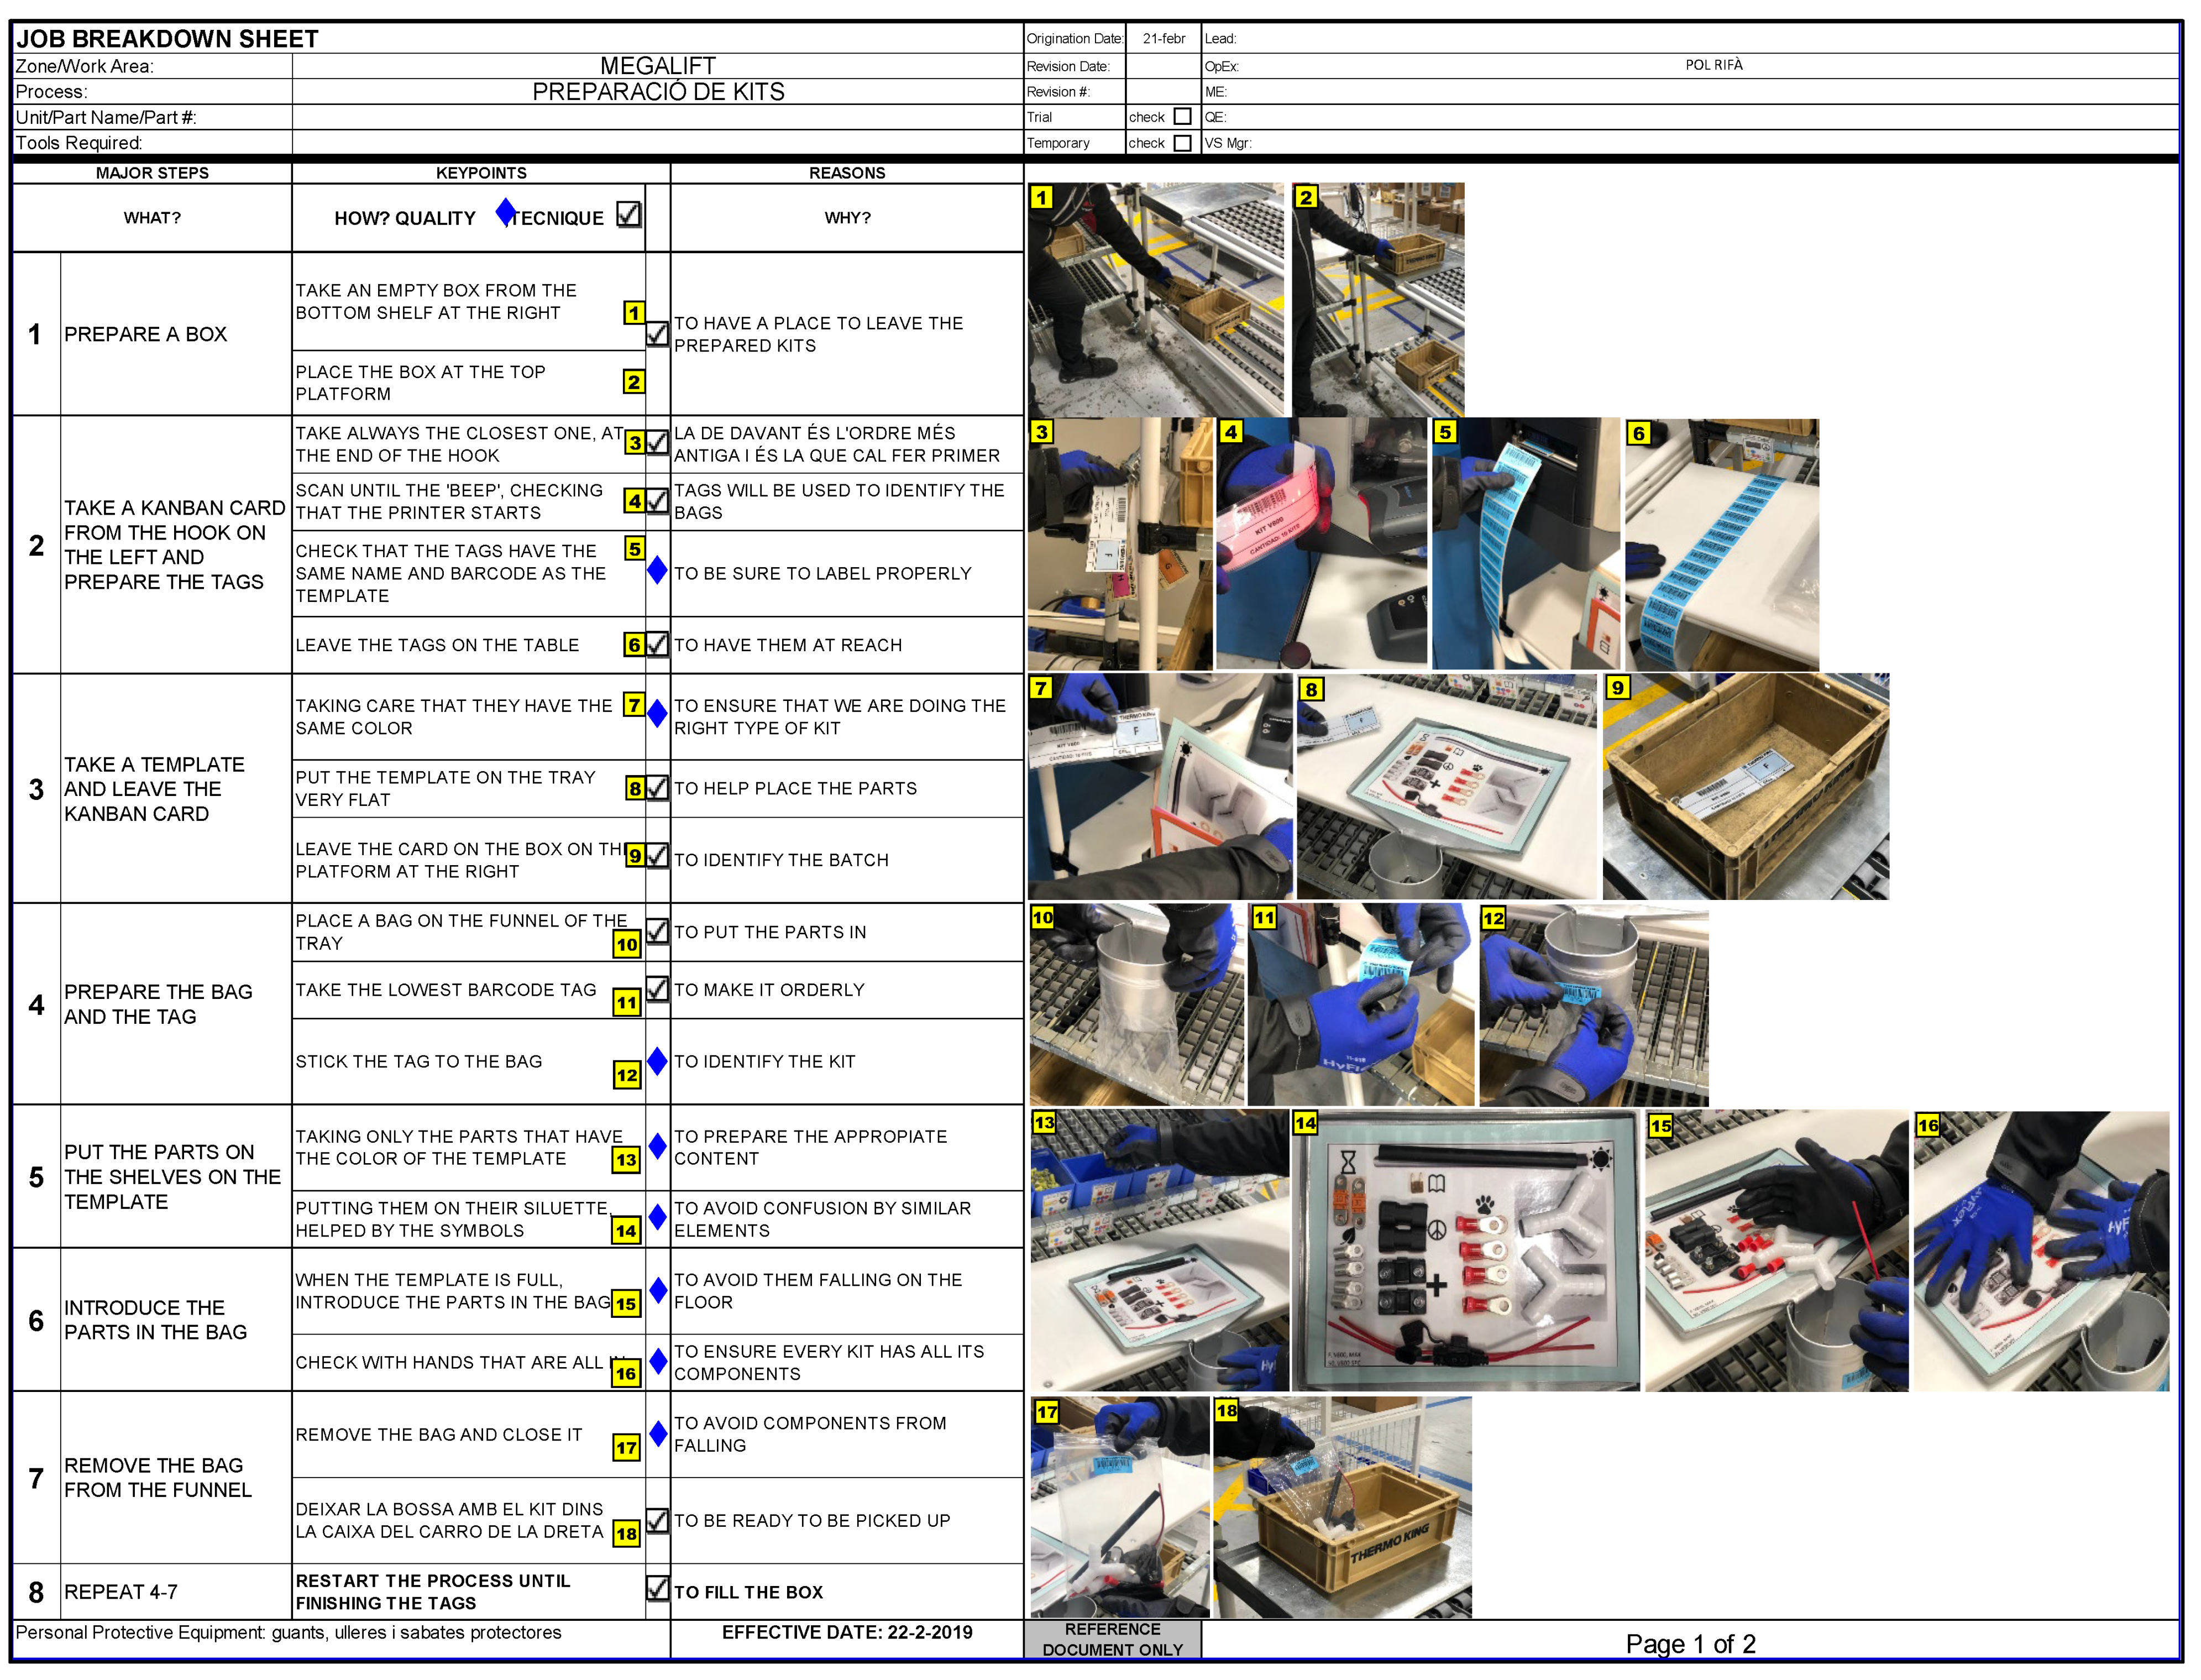
Kanban and first-in, first-out (FIFO) order tracking. The team decided to implement a FIFO rail, where the production manager hung Kanban cards according to the production needs. In addition, barcodes on the Kanban cards are to be scanned to identify the bags and boxes where the kits are to be stored in the production line.
(8)
Scan and print barcode tags on site. After the worker picked up the Kanban card, they scanned the barcode on the Kanban card to obtain the tag for the automatic printer. The purpose of this process is to avoid mislabeling, as Poka-Yoke prevents workers from making mistakes. Workers fill the bag with the appropriate pieces until all tags are used up, after the tags are created and placed next to the tray in the preparation kit. When all the tags in a batch are used up, workers place a box of kits into the outbox, remove the next Kanban card, and start a new batch.
(9)
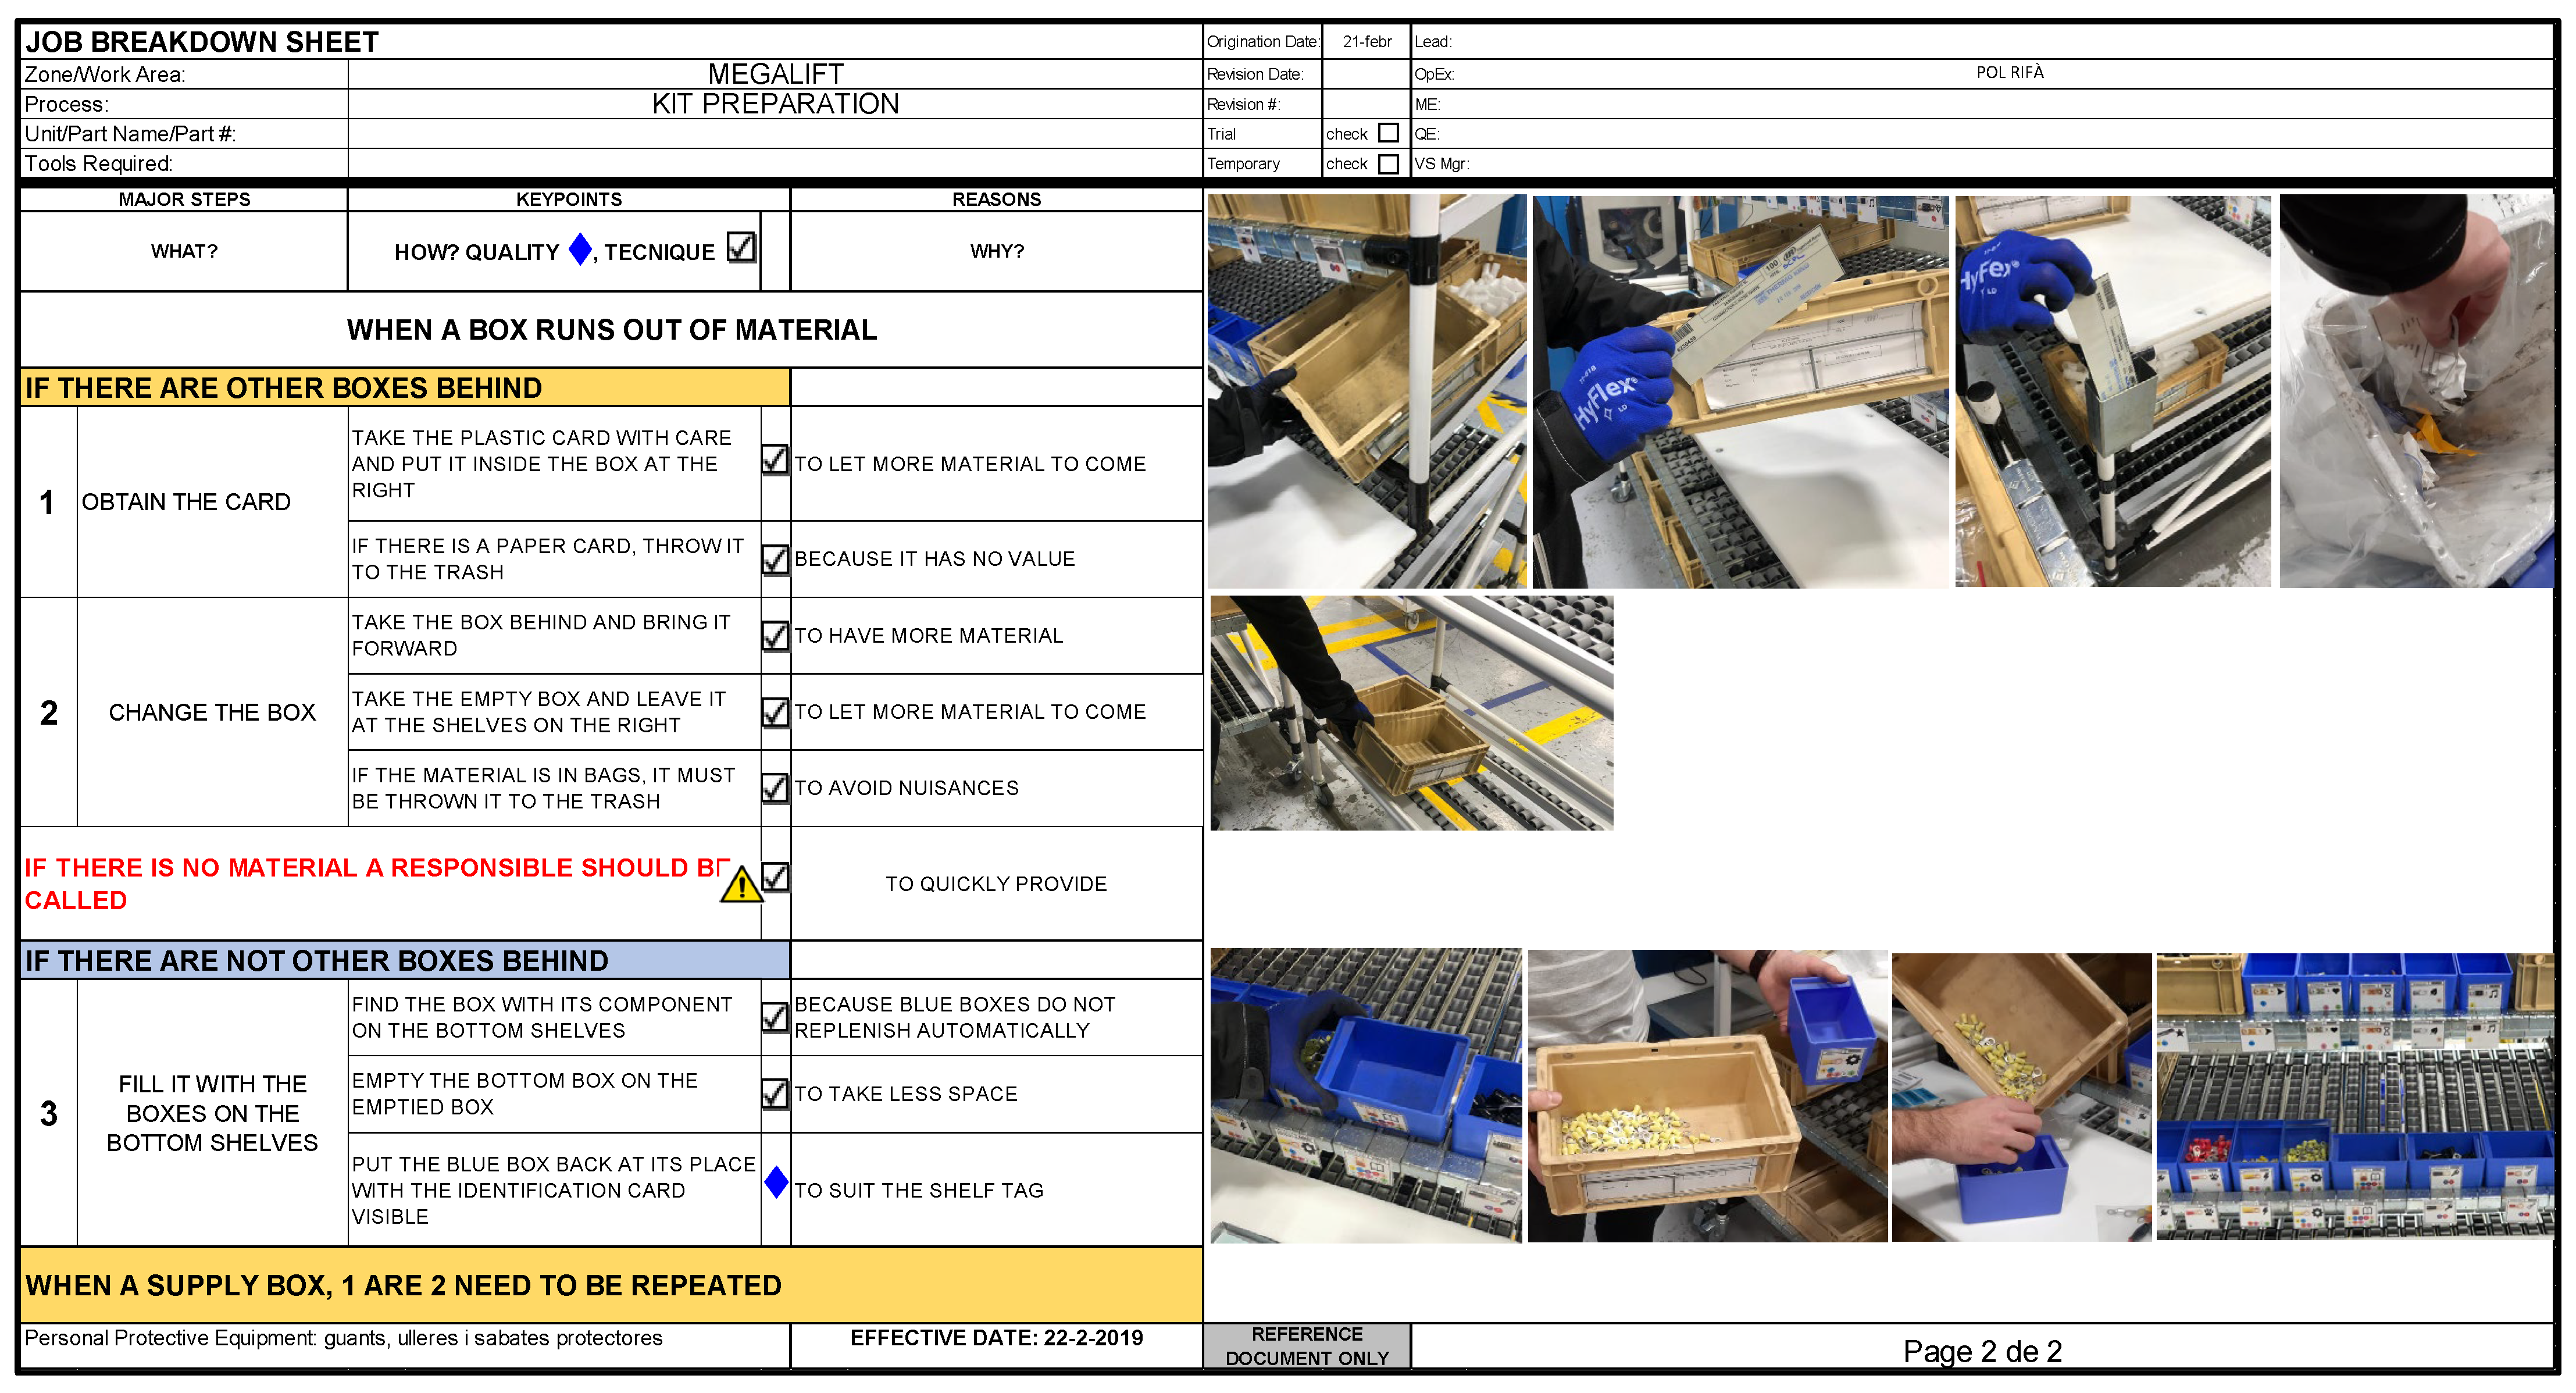
Outbox. Workers can find boxes with batches of kits on the right side of the map. Replenishers deliver full boxes to the line every hour. Inside the box, there is a level surface and a ramp to place the finished boxes on, and there is space for storing the next batch of empty boxes.
(10)
Work breakdown sheet. The team created a work breakdown sheet detailing all the functions of the workstation, as shown in Figure 11 and Figure 12. These two sheets refer to the kit preparation and material replenishment processes, which are required by the picking station.

4.5. Control

In this phase, the team assessed the workstation’s effectiveness, as well as the workers’ learning paths and progress. Three templates had errors identified within the first week. A control plan enables quality control and ensures that defect-free kits reach the customers. Workers can complete batches on the same day because the templates are easily recreated. As shown in Table 5, some risks and countermeasures for their avoidance were observed during the first month of implementation. The team developed an adaptation plan before the workers started work, but the plan was adjusted based on performance. Workers worked three hours per day and three days per week for the first two weeks, which was not enough to supply all he factories with a kit. After evaluating the efficiency, the company expanded the working hours to 4 h per day and 4 days per week in order to complete all the required kits. Table 6 shows the adjusted planned and actual production kit quantities. In the first two weeks, the kit only had defects related to external issues, such as labeling confusion, misplaced items, and insufficient materials. Once all the issues are corrected, no errors were logged for the next four months, which means that the first pass yield (FPY) of the improved workstation increased from 98% to 100%. In the end, the team decided to hire full-time staff (6 h per day, 5 days per week) and schedule another future project to increase the workload of the workstations and other similar tasks.

4.6. Financial Effect

The cost analysis of the project is detailed in Table 7. The most relevant suggestion is the addition of another person to the workforce, but the new incorporation of the technology is cheaper than another salaried employee. As the goal was not a cost reduction, this project made some resources available to increase the production, mainly in terms of space and time.
The impacts of the process can be seen by observing the following indicators:
  • Space: free up 8 m2, transitioning from 11 m2 in three different locations to 3 m2 in one location.
  • Productivity: a 63 s bottleneck for three production lines, enabling increased production.
  • Quality: increase the yield rate from 98% to 100%.
  • Inventory: transition from three places to one place, so that the volume is reduced by 40%. Initial cost: EUR 2200.
The direct savings of the project amounted to EUR 3180, mainly due to the freeing up of space (see Table 8). In the long term, the time saved (at 2.000 units/month) and quality claims (6 claims/month) were estimated to save EUR 100/month. It is difficult to estimate these costs, but the most relevant impacts of the project relate to inclusiveness, space, and predictability.

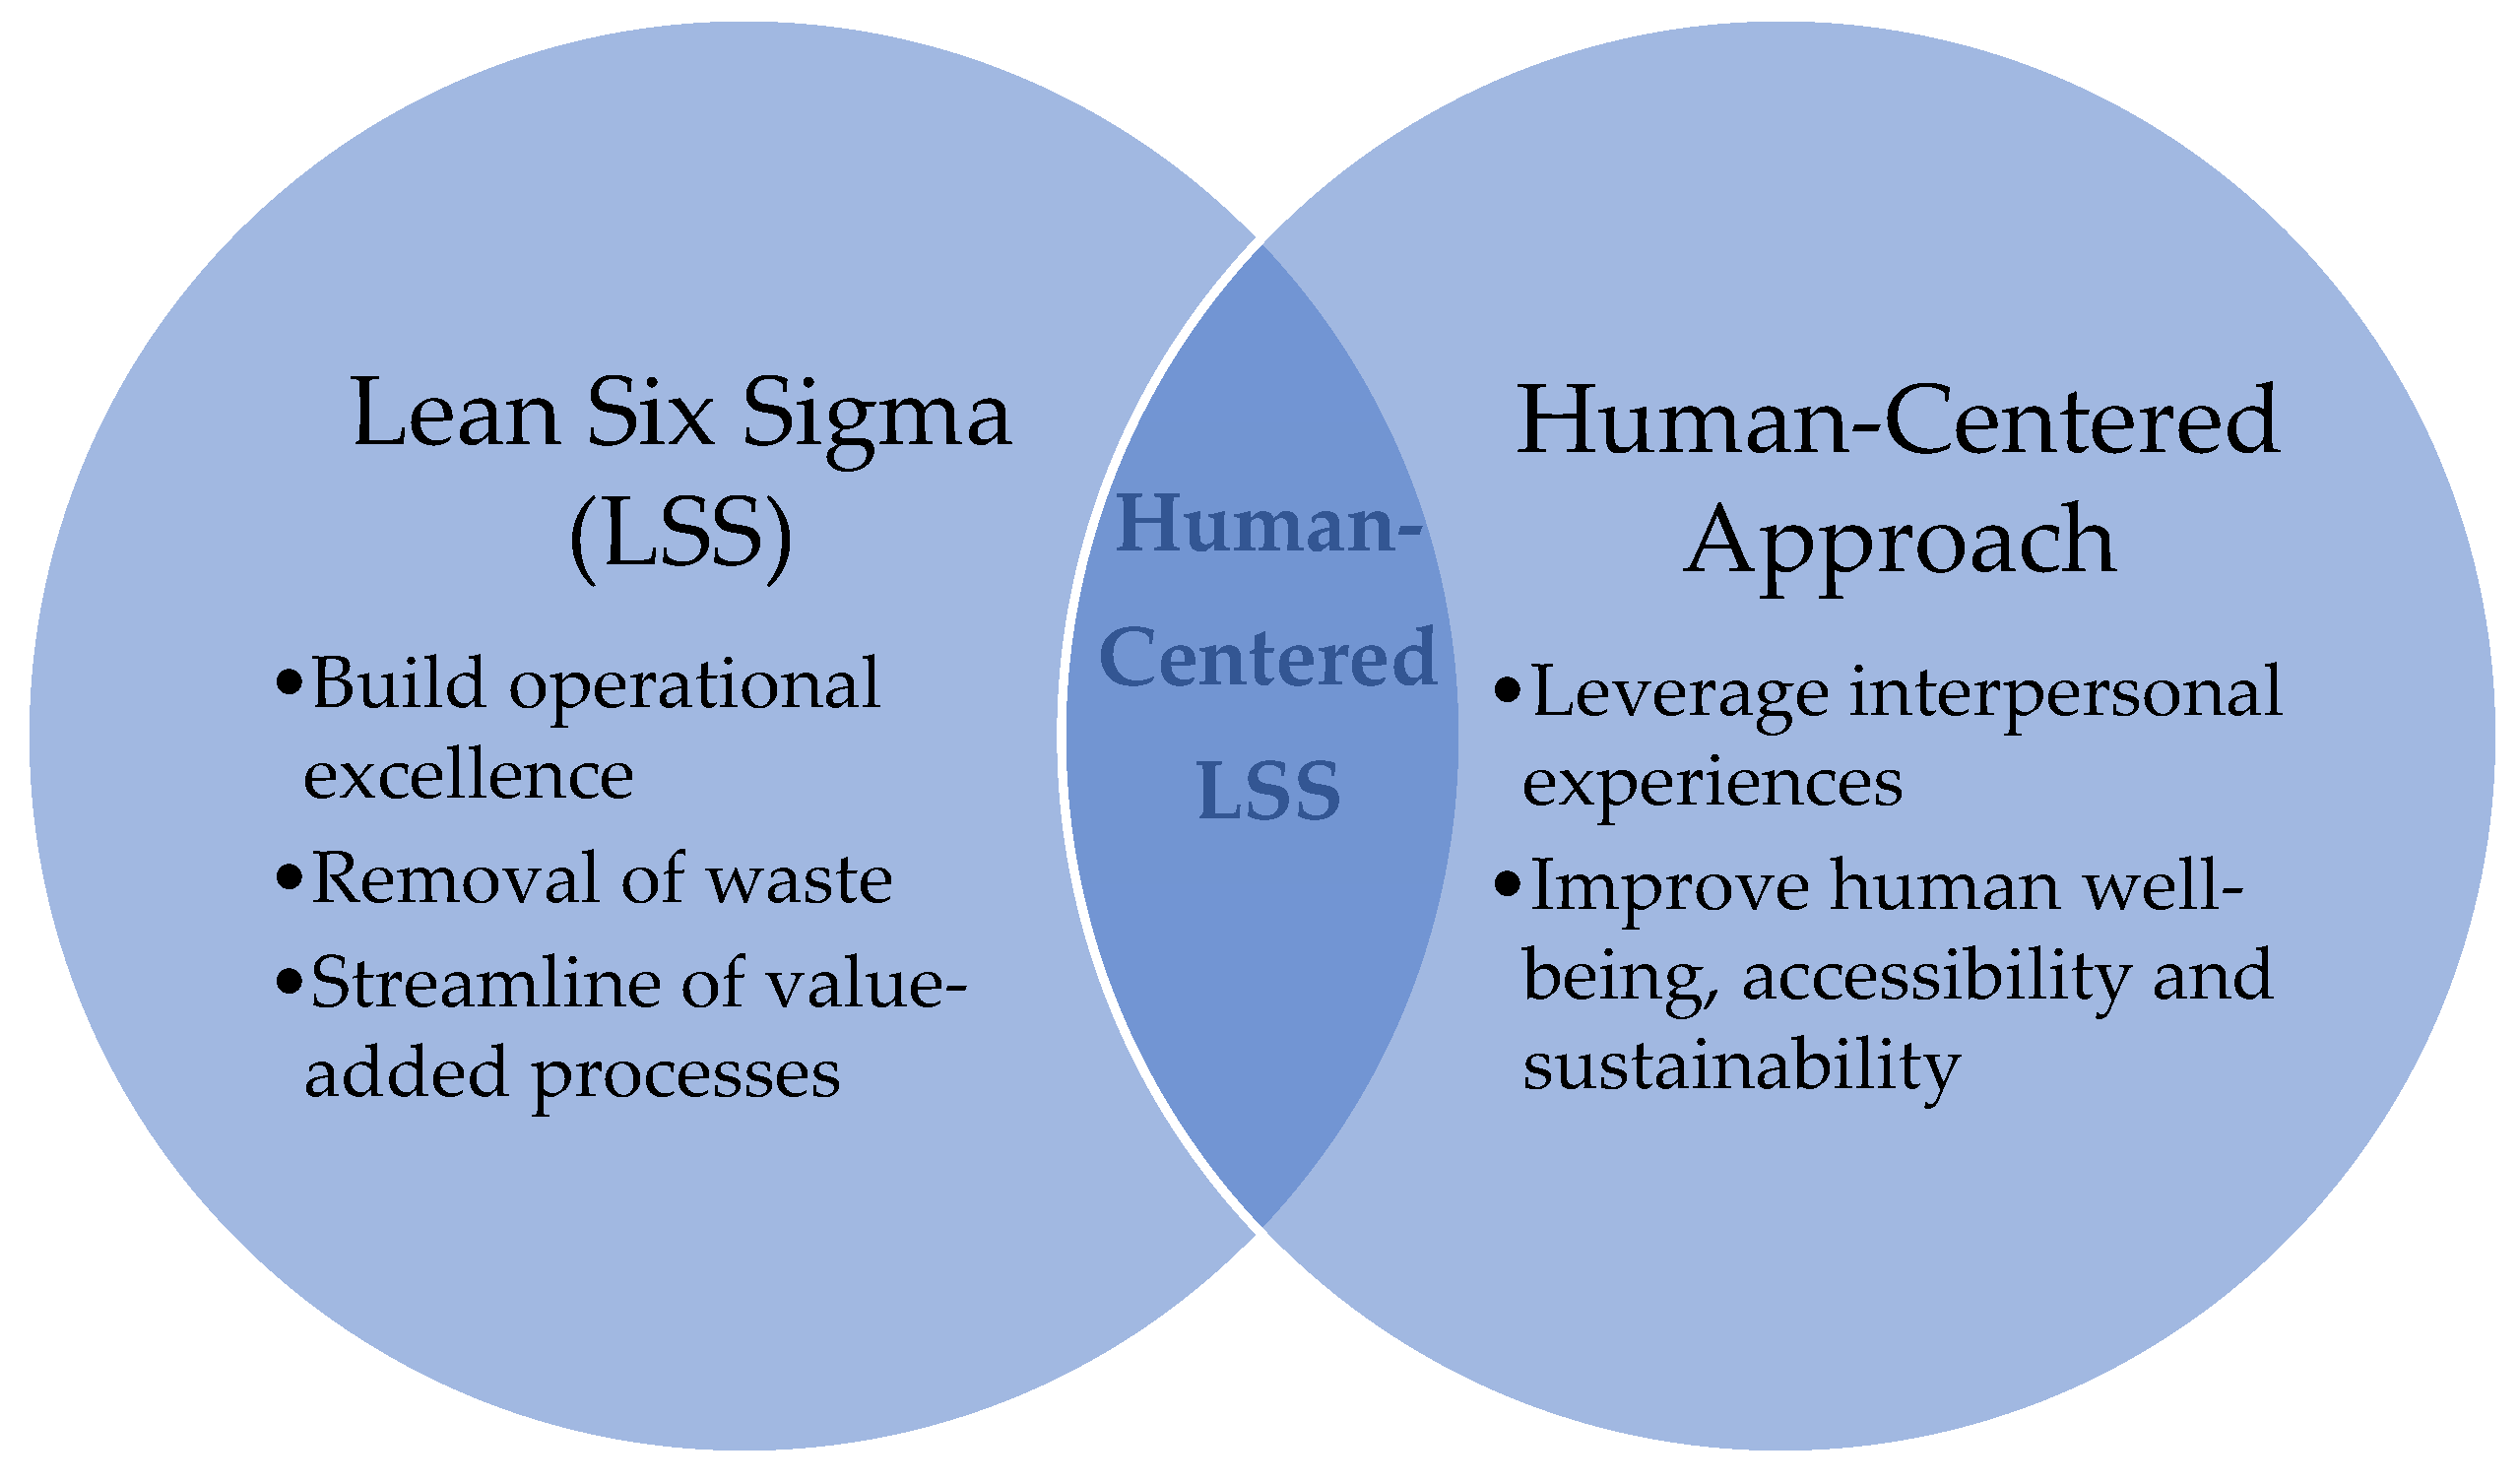
4.7. Human-Centered LSS Framework

For organizations today, LSS is the most popular methodology for streamlining operations and improving customer satisfaction. Although LSS has many expected benefits, it has one major unintended consequence. Due to its focus on process simplification, employees often feel marginalized. By combining the powerful tools and techniques of LSS with those available using a human-centered approach, as shown in Figure 13, the raised issues can be addressed. This integration enables organizations to engage all different types of employees, partners, and customers in a more effective and productive manner. Integrating LSS tools and technology with a human-centered design and management involves: (1) utilizing VSM to create a more powerful and insightful tool for better understanding current frictions with customers, business partners, or employees; (2) using the customer voice to develop the customer mental model; and (3) developing an employee mental model for each key employee role in the re-engineering business process. This will ensure that the process guides them on a journey that leads to a new business process. In doing so, the employees will be ready, willing, and able to serve customers and business partners as needed. LSS adopts the perspective that any effort to improve systems, processes, products, or services must begin with the customer and the people performing the work. The tools and mindset of a human-centered approach can support performance improvements and take them to the next level in order to understand ambiguous challenges and develop innovative solutions to address them.

5. Conclusions

Adopting a complementary LSS approach expands the toolbox and offers the prospect of continuous improvement for many industries that have already implemented lean principles. Using VSM 4.0 as a tool, managers can focus on value and develop appropriately, and changes in the production processes can be quickly detected and planned. LSS’s DMAIC strategy is a holistic approach that ensures a thorough understanding of potential problems and continuous improvement. We proposed an improvement model based on DMAIC and VSM 4.0 for a truck cooler manufacturer to improve the picking workstation design with a human-centered approach.
The case study provided a step-by-step process framework for, and in-depth analysis of, the implementation of our proposed improvement model. This model allows the company to generate available space on the assembly lines, thereby enhancing the ability to assemble more units and, of course, productivity. In addition, the electrical kit used for the installation achieved 100% FPY, successfully enabling the participation of mentally handicapped workers and raising the company’s standards to provide better workstations. The direct savings of the project amounted to EUR 3180, mainly due to the freeing up of space. After the project was completed, not only was the financial performance satisfactory, but the planning capabilities and employee engagement were also improved, and the quality complaints, costs, and deliveries were reduced.
The presented paper is based on a single case study, and the results are limited to this company only. However, the approach of this paper offers a generic learning perspective. Through the effective application of LSS quality initiatives, the means by which the direct savings of the project could be obtained have been demonstrated. Thus, this paper could serve as a unique roadmap for practitioners and academics to improve the material productivity in terms of both product and process.

Author Contributions

Conceptualization, F.-K.W.; formal analysis, P.R.R.; investigation, P.R.R.; methodology, F.-K.W. and B.R.; project administration, B.R.; resources, P.R.R.; supervision, F.-K.W.; validation, F.-K.W. and P.R.R.; visualization, B.R.; writing—original draft, B.R.; writing—review & editing, F.-K.W. All authors have read and agreed to the published version of the manuscript.

Funding

This research received no external funding.

Institutional Review Board Statement

Not applicable.

Informed Consent Statement

Not applicable.

Data Availability Statement

No data are available.

Conflicts of Interest

The authors declare no conflict of interest.

References

  1. Turk, M.; Pipan, M.; Simic, M.; Herakovic, N. A Smart Algorithm for Personalizing the Workstation in the Assembly Process. Appl. Sci. 2020, 10, 8624. [Google Scholar] [CrossRef]
  2. Piccinini, P.; Gamberini, R.; Prati, A.; Rimini, B.; Cucchiara, R. An Automated Picking Workstation for Healthcare Applications. Comput. Ind. Eng. 2013, 64, 653–668. [Google Scholar] [CrossRef]
  3. Albliwi, S.A.; Antony, J.; Lim, S.A.H. A Systematic Review of Lean Six Sigma for the Manufacturing Industry. Bus. Process Manag. J. 2015, 21, 665–691. [Google Scholar] [CrossRef]
  4. Timans, W.; Ahaus, K.; van Solingen, R.; Kumar, M.; Antony, J. Implementation of Continuous Improvement Based on Lean Six Sigma in Small- and Medium-Sized Enterprises. Total Qual. Manag. Bus. Excell. 2016, 27, 309–324. [Google Scholar] [CrossRef]
  5. Raval, S.J.; Kant, R. Study on Lean Six Sigma Frameworks: A Critical Literature Review. Int. J. Lean Six Sigma 2017, 8, 275–334. [Google Scholar] [CrossRef]
  6. Gupta, V.; Acharya, P.; Patwardhan, M. A Strategic and Operational Approach to Assess the Lean Performance in Radial Tyre Manufacturing in India. Int. J. Product. Perform. Manag. 2013, 62, 634–651. [Google Scholar] [CrossRef]
  7. Chiarini, A. Sustainable Manufacturing-Greening Processes Using Specific Lean Production Tools: An Empirical Observation from European Motorcycle Component Manufacturers. J. Clean. Prod. 2014, 85, 226–233. [Google Scholar] [CrossRef]
  8. Singh, M.; Rathi, R. Investigation and Modeling of Lean Six Sigma Barriers in Small and Medium-Sized Industries Using Hybrid ISM-SEM Approach. Int. J. Lean Six Sigma 2021, 12, 1115–1145. [Google Scholar] [CrossRef]
  9. Panwar, A.; Jain, R.; Rathore, A.P.S. Lean Implementation in Indian Process Industries—Some Empirical Evidence. J. Manuf. Technol. Manag. 2015, 26, 131–160. [Google Scholar] [CrossRef]
  10. Jasti, N.V.K.; Kodali, R. Lean Production: Literature Review and Trends. Int. J. Prod. Res. 2015, 53, 867–885. [Google Scholar] [CrossRef]
  11. Thomas, A.J.; Ringwald, K.; Parfitt, S.; Davies, A.; John, E. An Empirical Analysis of Lean Six Sigma Implementation in SMEs—A Migratory Perspective. Int. J. Qual. Reliab. Manag. 2014, 31, 888–905. [Google Scholar] [CrossRef]
  12. Shokri, A. Quantitative Analysis of Six Sigma, Lean and Lean Six Sigma Research Publications in Last Two Decades. Int. J. Qual. Reliab. Manag. 2017, 34, 598–625. [Google Scholar] [CrossRef]
  13. Swarnakar, V.; Singh, A.R.; Antony, J.; Tiwari, A.K.; Cudney, E.; Furterer, S. A Multiple Integrated Approach for Modelling Critical Success Factors in Sustainable LSS Implementation. Comput. Ind. Eng. 2020, 150, 106865. [Google Scholar] [CrossRef]
  14. Habidin, N.F.; Mohd Yusof, S. Critical Success Factors of Lean Six Sigma for the Malaysian Automotive Industry. Int. J. Lean Six Sigma 2013, 4, 60–82. [Google Scholar] [CrossRef]
  15. Kornfeld, B.; Kara, S. Selection of Lean and Six Sigma Projects in Industry. Int. J. Lean Six Sigma 2013, 4, 4–16. [Google Scholar] [CrossRef]
  16. Laureani, A.; Antony, J. Critical Success Factors for the Effective Implementation of Lean Sigma: Results from an Empirical Study and Agenda for Future Research. Int. J. Lean Six Sigma 2012, 3, 274–283. [Google Scholar] [CrossRef]
  17. Dos Santos, Z.G.; Vieira, L.; Balbinotti, G. Lean Manufacturing and Ergonomic Working Conditions in the Automotive Industry. Procedia Manuf. 2015, 3, 5947–5954. [Google Scholar] [CrossRef]
  18. Nunes, I.L. Integration of Ergonomics and Lean Six Sigma: A Model Proposal. Procedia Manuf. 2015, 3, 890–897. [Google Scholar] [CrossRef]
  19. Psomas, E. Future Research Methodologies of Lean Manufacturing: A Systematic Literature Review. Int. J. Lean Six Sigma 2021, 12, 1146–1183. [Google Scholar] [CrossRef]
  20. Lobo Mesquita, L.; Lizarelli, F.L.; Duarte, S.; Oprime, P.C. Exploring Relationships for Integrating Lean, Environmental Sustainability and Industry 4.0. Int. J. Lean Six Sigma 2022, 13, 863–896. [Google Scholar] [CrossRef]
  21. Jasti, N.V.K.; Sharma, A. Lean Manufacturing Implementation Using Value Stream Mapping as a Tool: A Case Study from Auto Components Industry. Int. J. Lean Six Sigma 2014, 5, 89–116. [Google Scholar] [CrossRef]
  22. Cavone, G.; Epicoco, N.; Dotoli, M. Process Re-engineering Based on Colored Petri Nets: The Case of an Italian Textile Company. In Proceedings of the 2020 28th Mediterranean Conference on Control and Automation (MED), Saint-Raphael, France, 15–18 September 2020; pp. 856–861. [Google Scholar]
  23. Tresca, G.; Cavone, G.; Carli, R.; Cerviotti, A.; Dotoli, M. Automated Bin Packing: A Layer Building Matheuristics for Cost Effective Logistics. IEEE Trans. Autom. Sci. Eng. 2022, 19, 1599–1613. [Google Scholar] [CrossRef]
  24. Pinto, C.M.A.; Mendonça, J.; Babo, L.; Silva, F.J.G.; Fernandes, J.L.R. Analyzing the Implementation of Lean Methodologies and Practices in the Portuguese Industry: A Survey. Sustainability 2022, 14, 1929. [Google Scholar] [CrossRef]
  25. Balaji, V.; Venkumar, P.; Sabitha, M.S.; Amuthaguka, D. DVSMS: Dynamic Value Stream Mapping Solution by Applying IIoT. Sādhanā 2020, 45, 38. [Google Scholar] [CrossRef]
  26. Meudt, T.; Metternich, J.; Abele, E. Value Stream Mapping 4.0: Holistic Examination of Value Stream and Information Logistics in Production. CIRP Ann. Manuf. Technol. 2017, 66, 413–416. [Google Scholar] [CrossRef]
  27. Hartmann, L.; Meudt, T.; Seifermann, S. Value Stream Method 4.0: Holistic Method to Analyse and Design Value Streams in the Digital Age. Procedia CIRP 2018, 78, 249–254. [Google Scholar] [CrossRef]
  28. Ramadan, M.; Salah, B.; Othman, M. Industry 4.0-Based Real-Time Scheduling and Dispatching in Lean Manufacturing Systems. Sustainability 2020, 12, 2272. [Google Scholar] [CrossRef]
  29. Huang, Z.Y.; Kim, J.; Sadri, A. Industry 4.0: Development of a Multi-Agent System for Dynamic Value Stream Mapping in SMEs. J. Manuf. Syst. 2019, 52, 1–12. [Google Scholar] [CrossRef]
  30. Schoeman, Y.; Oberholster, P.; Somerset, V. Value Stream Mapping as a Support Management Tool to Identify the Flow of Industrial Waste: A Case Study. Sustainability 2021, 13, 91. [Google Scholar] [CrossRef]
  31. Qin, Y.; Liu, H. Application of Value Stream Mapping in E-Commerce: A Case Study on an Amazon Retailer. Sustainability 2022, 14, 713. [Google Scholar] [CrossRef]
  32. Guo, W.; Jiang, P.; Xu, L.; Peng, G. Integration of Value Stream Mapping with DMAIC for Concurrent Lean-Kaizen: A Case Study on an Air-Conditioner Assembly Line. Adv. Mech. Eng. 2019, 11, 1–17. [Google Scholar] [CrossRef]
  33. Salah, S.; Rahim, A. An Integrated Company-Wide Management System; Springer: Berlin/Heidelberg, Germany, 2018. [Google Scholar]
  34. De Mast, J.; Lokkerbol, J. An Analysis of the Six Sigma DMAIC Method from the Perspective of Problem Solving. Int. J. Prod. Econ. 2012, 139, 604–614. [Google Scholar] [CrossRef]
  35. Gupta, S.; Jain, S.K. A Literature Review of Lean Manufacturing. Int. J. Manag. Sci. Eng. Manag. 2013, 8, 241–249. [Google Scholar] [CrossRef]
  36. Marques, P.A.; Carvalho, A.M.; Santos, J.O. Improving Operational and Sustainability Performance in a Retail Fresh Food Market Using Lean: A Portuguese Case Study. Sustainability 2022, 14, 403. [Google Scholar] [CrossRef]
  37. Monroe, K.; Fick, F.; Joshi, M. Successful Integration of Ergonomics into Continuous Improvement Initiatives. Work 2012, 41, 1622–1624. [Google Scholar] [CrossRef]
  38. Montgomery, D.C. Lean Six Sigma and Promoting Innovation. Qual. Reliab. Eng. Int. 2014, 30, 1. [Google Scholar] [CrossRef]
  39. Hannola, L.; Richter, A.; Richter, S.; Stocker, A. Empowering Production Workers with Digitally Facilitated Knowledge Processes—A Conceptual Framework. Int. J. Prod. Res. 2018, 56, 4729–4743. [Google Scholar] [CrossRef] [Green Version]
Figure 1. An improvement model of LSS with VSM 4.0.
Sustainability 14 11020 g001
Figure 2. Current VSM 4.0.
Sustainability 14 11020 g002
Figure 3. Project timeline.
Sustainability 14 11020 g003
Figure 4. New location for the kit preparation workstation.
Sustainability 14 11020 g004
Figure 5. Relation of references, symbols, and parts.
Sustainability 14 11020 g005
Figure 6. Relationship between references, colors, and kits.
Sustainability 14 11020 g006
Figure 7. Templates with colors, objects, and symbols.
Sustainability 14 11020 g007
Figure 8. Place the magnetic template on a metal tray.
Sustainability 14 11020 g008
Figure 9. Correspondence between the identification cards and templates.
Sustainability 14 11020 g009
Figure 10. Picking workstation.
Sustainability 14 11020 g010
Figure 11. Work breakdown sheet of the kit preparation.
Sustainability 14 11020 g011
Figure 12. Work breakdown sheet of the material replenishment.
Sustainability 14 11020 g012
Figure 13. Human-centered LSS framework.
Sustainability 14 11020 g013
Table 1. DMAIC approach for the picking workstation design.
PhaseToolsActivities
DefineVSM 4.0 (current state)
  • Establish team
Project charter
2.
Assign specific role
SIPOC diagram
3.
Create project timeline
Gemba
MeasureKey performance indicator (KPI)
  • Describe process
Data visualization
2.
Collect data
Analyze5 WhysIdentify problem and solution
ImproveKaizen events
  • Relocate workstation
VSM 4.0 (future state)
2.
Codify parts and kits
3.
Design identification cards, templates, and trays
4.
Create job breakdown sheets
ControlBrainstorming the risks and countermeasures
  • Risk analysis
2.
Financial analysis
SIPOC stands for suppliers, inputs, process, outputs, customers.
Table 2. Performance metric review.
IndicatorSafetyQualityDeliveryInventoriesEmployee EngagementGrowth
Current stateNo accident in the past 10 yearsThere is no systematic categorizing of problemsA total of 2–3 days in Southern Europe, 1 week in Northern Europe, 3 weeks in the Middle East, 4 weeks in AmericaMore than 75% of the references had a delivery time of less than three daysRecently, there has been a decrease in employee engagementAround 30% of the weeks show operation at full capacity
KPINumber of workdays missed due to working accidentsThe number of warrantee requests received within the first six months after deliveryPercentage of units delivered on timePercentage of the cost of inventories reduced from the current levelEmployees’ average satisfaction ratingsMaximum capacity
ProjectsKeep track of minor bolt and screw inventoriesCreate an effective diagnosis and classification systemImprove assembly line capability and design a workstation efficientlyUnify workstations and sites along the line where materials are heldImprove line balance and the ability to react and adjust production levels quicklyRestructure the lines and unify some identical workstations in each line
Table 3. Details of the process description.
No.Action NameTypeRounded Time (s)
1Going to the workstation after leaving the unitMovement (5 m)10
2Verifying the name of the unit that is being preparedVisual inspection2
3Finding barcodesHand movement4
4Picking an empty bagHand movement2
5Finding appropriate objectsHand movement × 103 × 10
6Tagging the bagHand movement5
7Return to the unit with the kitMovement (5 m)10
TOTAL63
8 *Going to a different place to search for missing componentsMovement120
* is not a part of the process; it occurs when there is a shortage of materials.
Table 4. Five whys analysis of the observed problems.
WasteMovement to and from the Picking WorkstationSlow Pick-Up ProcessMislabelingMissing PartsThe Movement Caused by the Inventory Break
ProblemChanging workstations wastes a lot of time for the workerPicking up materials is a time-consuming and wasteful activityThe barcode stickers on the kits do not identify them wellMany of the kits are incompleteThe worker must leave the line in order to obtain more material
1st WhyA worker must prepare a kit every time a machine is due to be packagedThe worker must keep an eye on the panel at all timesA worker inserts an incorrect barcodeThey were not placed inside the bag by the workerOne of the components was depleted
2nd WhyThe main assembly process is serially integrated with the kitsThere is no easy way to tell what is in each kitThere are many barcodes on the table, and they all look the sameThe worker forgot to bring a specific itemThe material levels are insufficient for allowing for frequent replenishment
3rd WhyOne-piece flow is the production method used In the boxes, there are no visual aidsWorkers have already printed many of themThe worker has no means of knowing if the object was already insideEvery part has three distinct points, and there is not enough room in the workstation for an additional secondary box with parts
4th Why The boxes come from the resupply, which is not visually alteredThe printer is a long distance away, and employees rarely visit itThe worker arranges the items one by one
5th Why They have no place to be visualized
SolutionRemove the process off the mainline and work in batches. The process will become more agile with repetitionVisual identifications on boxes should be visible without having to look at the panelTags with various barcodes should not coexist on the table. The printer should be placed close to the table, and only the necessary documents should be printed Before placing items in the bag, they should all be arranged on a tray to ensure that none are missingCombine the three inventory points and make room for more component boxes next to the current ones
Table 5. Risks and countermeasures in the first month of implementation.
RiskCountermeasure
The workstation does not include all of the factory’s kitsOther picking workstations continue to operate as usual
The template and cards are most likely incorrectDuring the first week, small quantities of all the different kits are used and another worker double-checks the quality of the kits
Any discomfort experienced by the worker as a result of the workstation improvementsThe worker’s motions are studied in real time by the safety department in order to detect any weariness or potentially harmful movements
Replenishers are not assigned to the new material locationsA regular reminder to monitor the workstation is issued over the first two weeks
The worker is not able to deliver satisfactory resultsDuring the first month, the worker keeps track of the number and type of kits created
Table 6. Plan for the first month of adaptation.
StateHours/DayWeek1 2 3 4 5
Day123456789101112131415161718
Taught by instructor3 5675
Surveillance at work3 70839590
Working alone, quality checks4 133145140135152142135137
Normal workload4 160153158140
Total201268553566611
Kits/hour192523283230333635343836343440384035
Table 7. Cost analysis of the project.
DescriptionItemCost (EUR)
Cost of the materials for the workstation designBench, computer, printer4.000
Salaried employees cost of project execution60 h (EUR 30/h)1.800
Cost of additional employee (within the inclusion plan)Part-time contract1.200/month
Table 8. Benefits and savings of the project.
ImpactItemSavings (EUR)
Space8 m2 freed8.000
Assembly time in the line63 s/unit0.4/unit
Inventory reduction40% of EUR 2200880
Quality claims by missing parts5 claims/month500/month
Publisher’s Note: MDPI stays neutral with regard to jurisdictional claims in published maps and institutional affiliations.

