
The Development of an Excellence Model Integrating the Shingo Model and Sustainability

 ,
, 
 , , , and
Abstract
:1. Introduction
2. Literature Review
2.1. Lean Philosophy
2.2. Six Sigma
- Define: The identification of the problem, the determination of objectives and the appropriation of the relevance of the objectives.
- Measure: The translation of the problem in a measurable way through the observation and research of knowledge.
- Analysis: Making a diagnosis by identifying the factors and causes of influence that determine certain behaviors, and using the aggregated data in the Measurement phase.
- Improve: Implementation of measures that have been designed to improve performance and achieve the desirable state.
- Control: Adjustments to process management and system control; therefore, the results are sustainable.
2.3. Lean Six Sigma
2.4. The Shingo Model
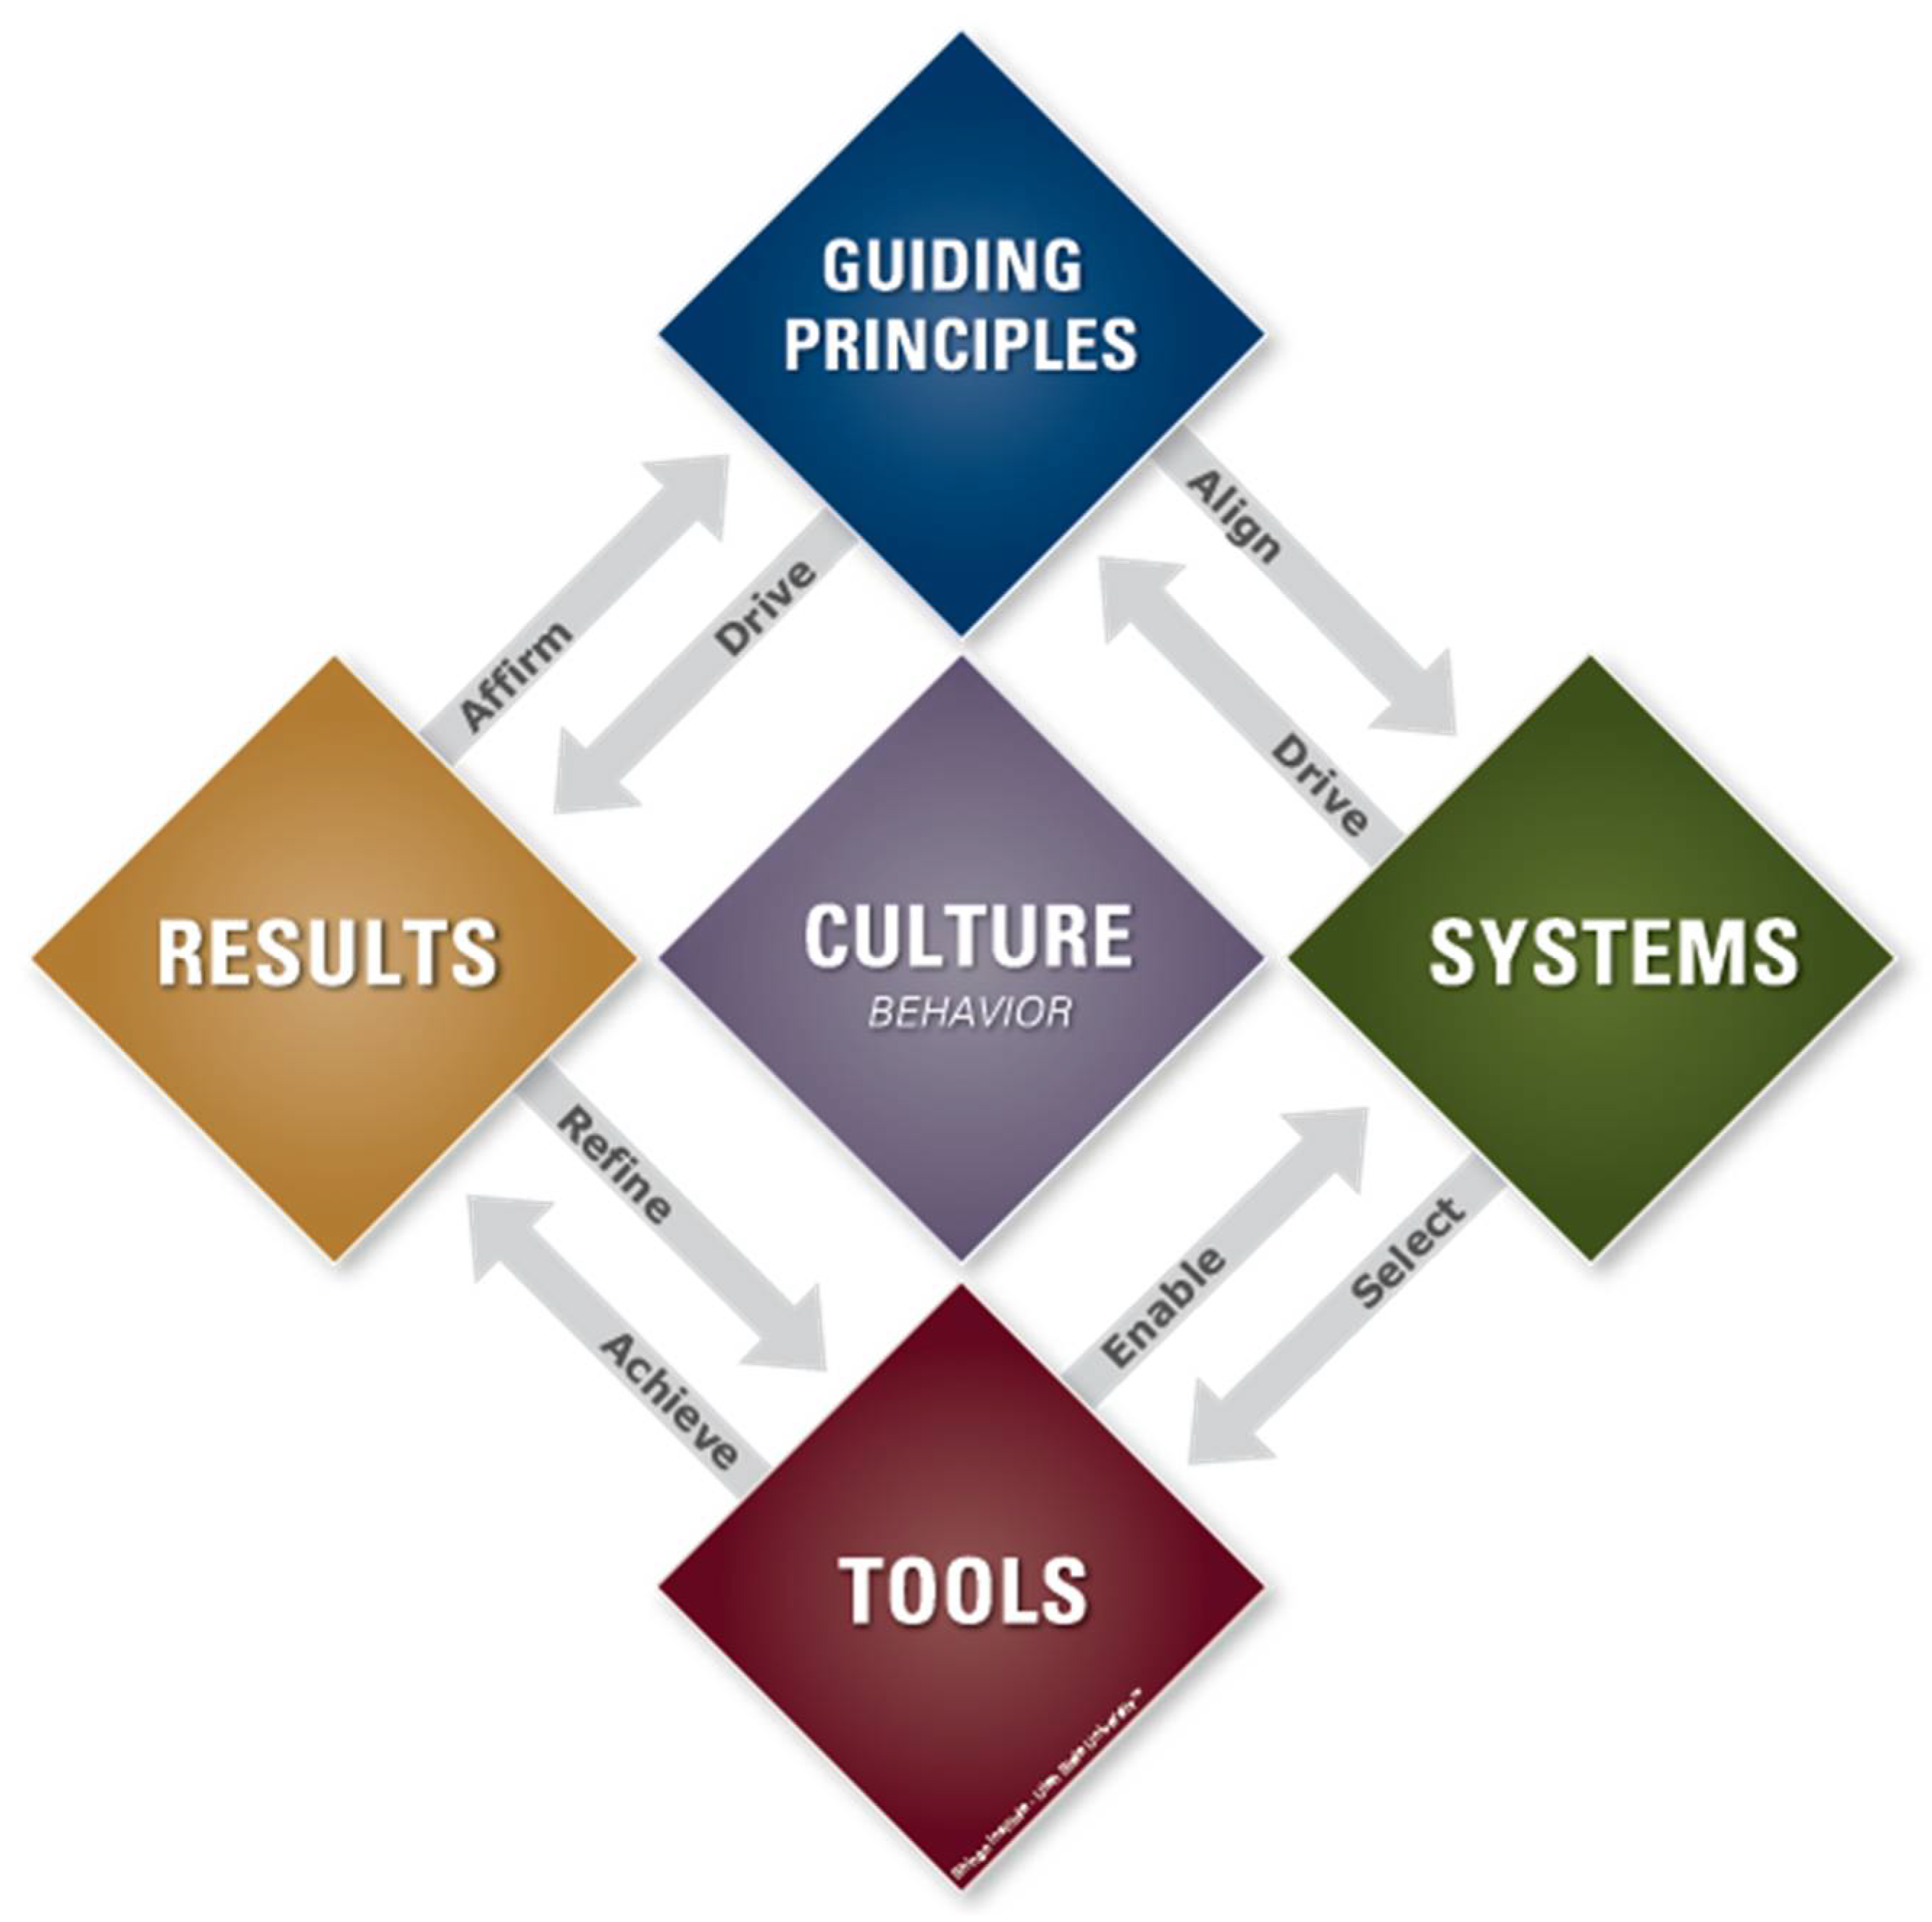
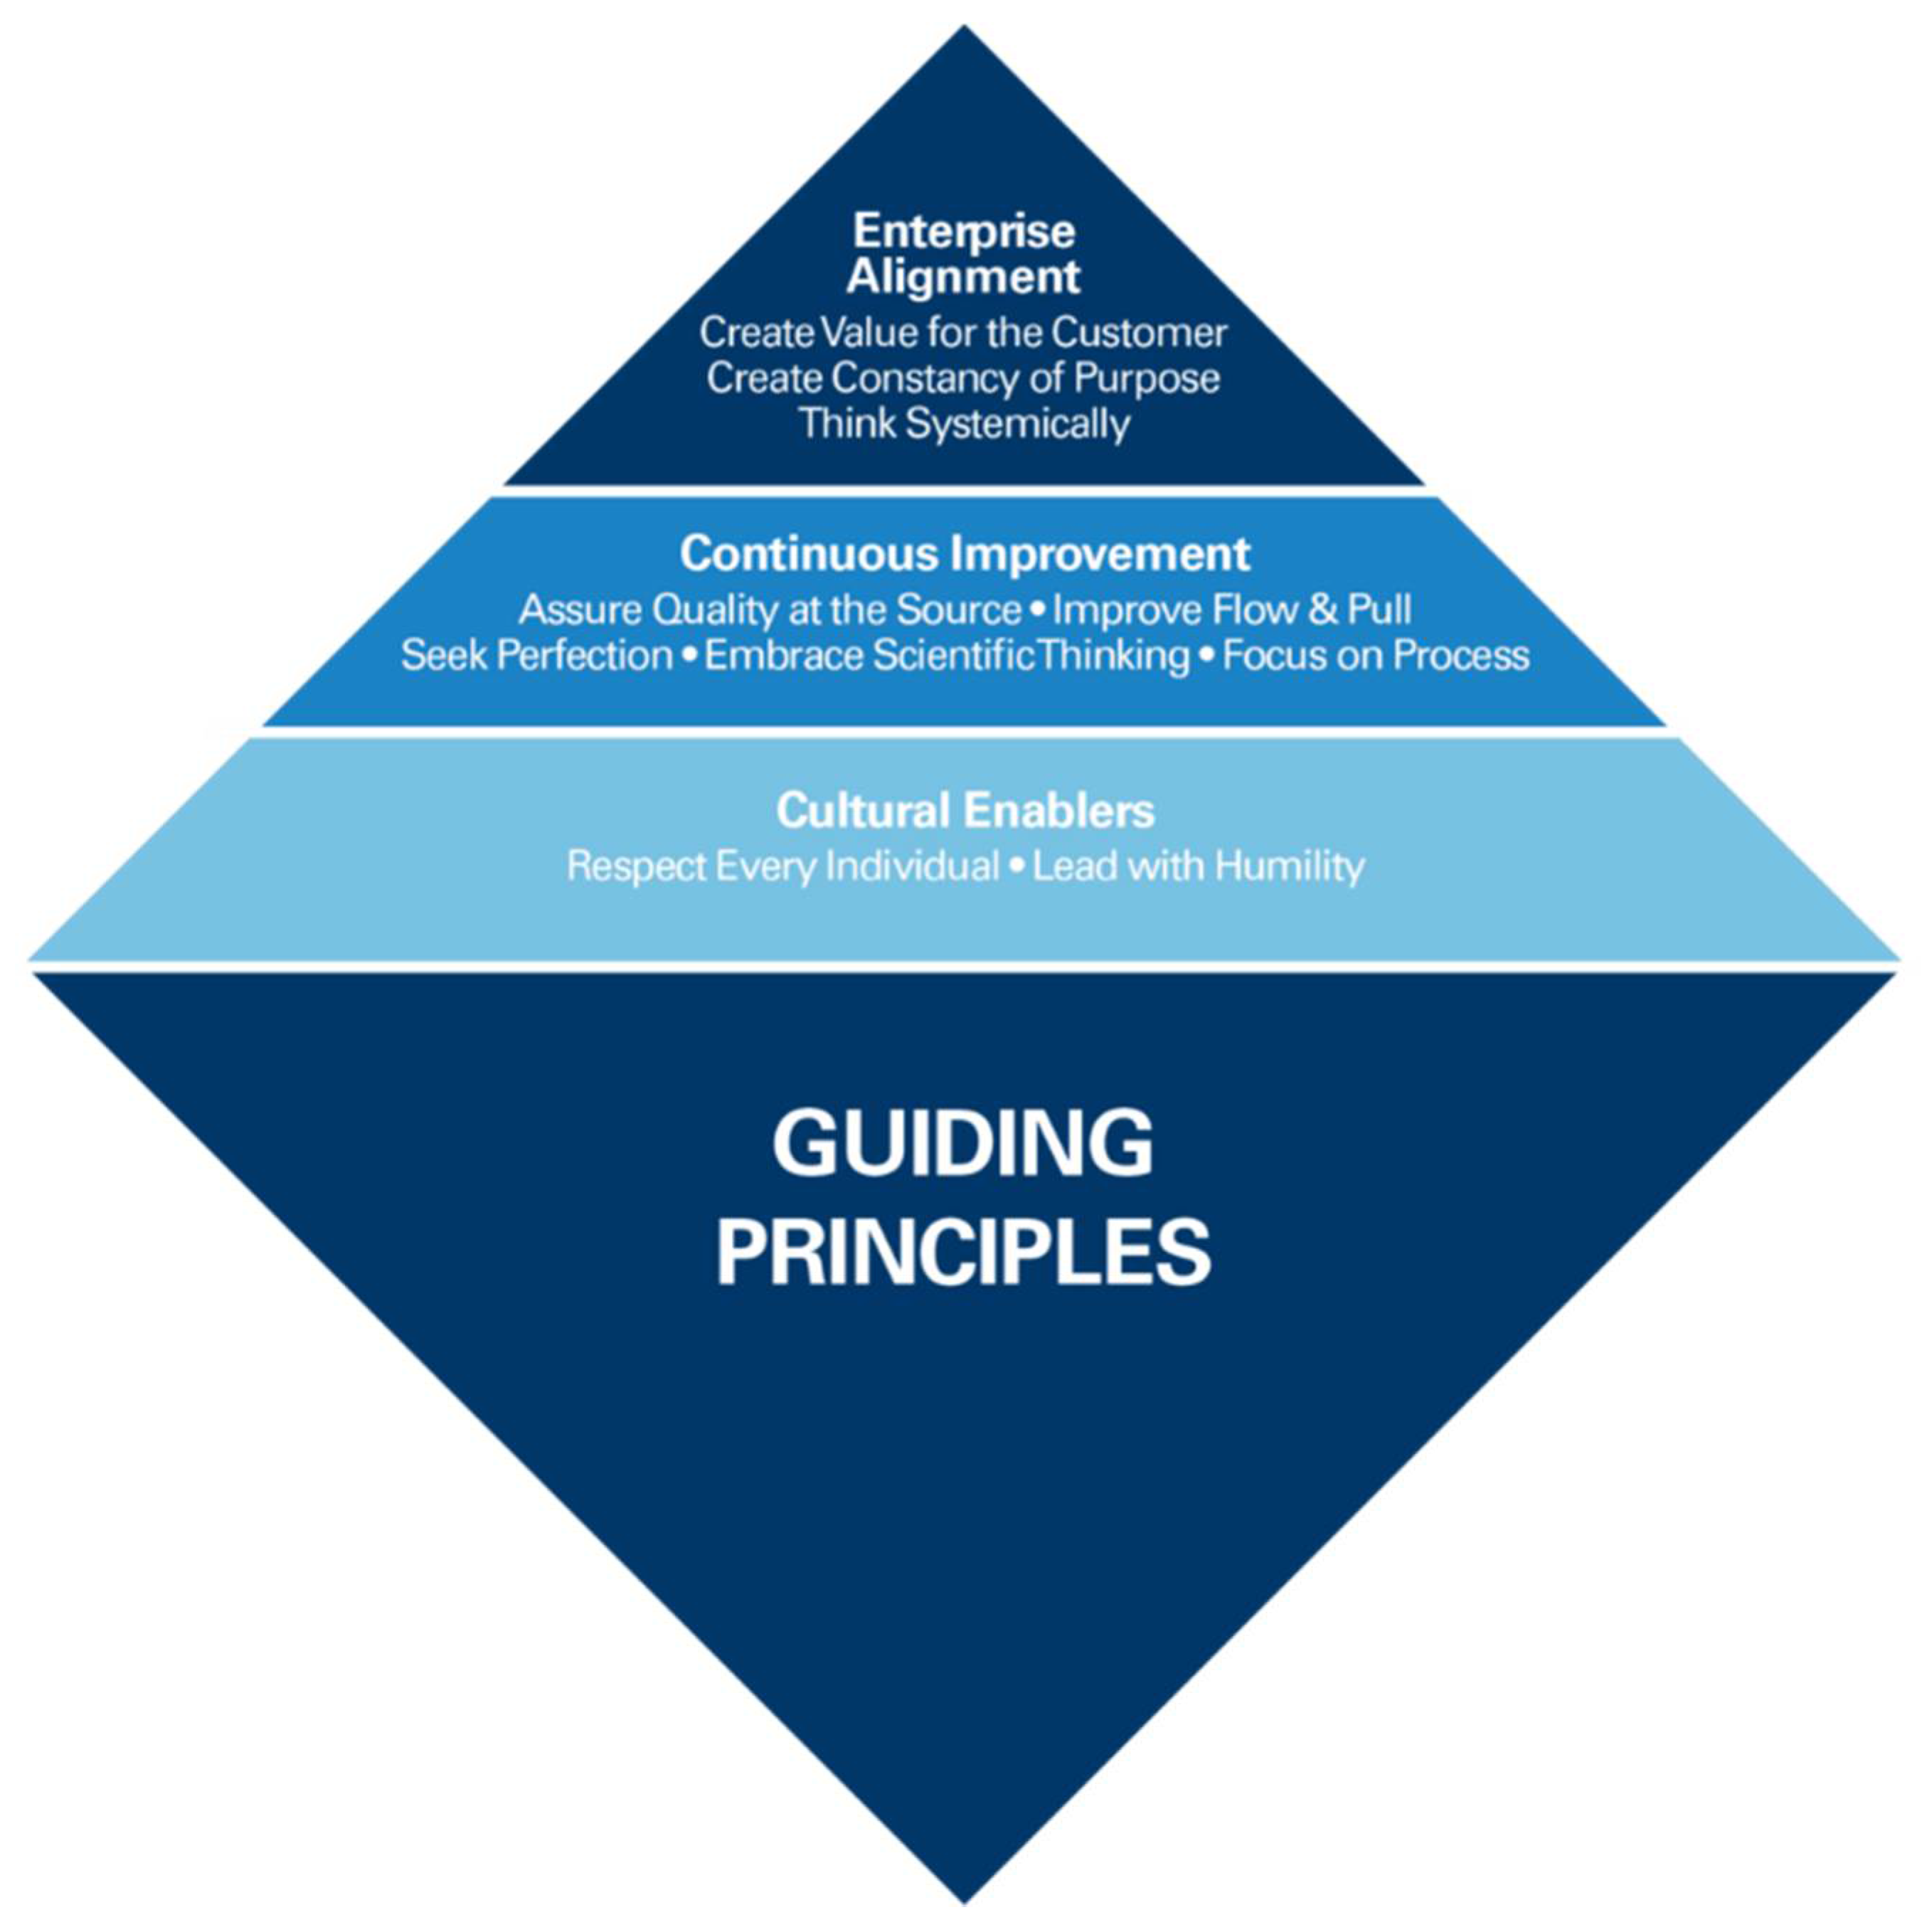
- Guiding Principles: Shingo’s guiding principles are the basis for a sustainable organizational culture of excellence. They indicate rules that enable the understanding of the consequences of behaviors and, therefore, enable decision making to be conscious and to meet the ideal results;
- Tools: Tools that allow operational execution to be carried out in order to achieve the purpose of the system. Therefore, they must be carefully selected in order for the tools to be aligned with the system;
- Systems: These are sets of processes, persons or procedures that are interconnected and allow the realization of guiding principles;
- Results: The consequence of leadership capacity, behaviors and routines. Ideal results are all those that are sustainable in the long term and that require leadership capacity to create cultures in which behaviors and routines are practiced;
- Culture: The center of the Shingo model, which represents the manifestation of the behaviors and actions of the organization’s elements;
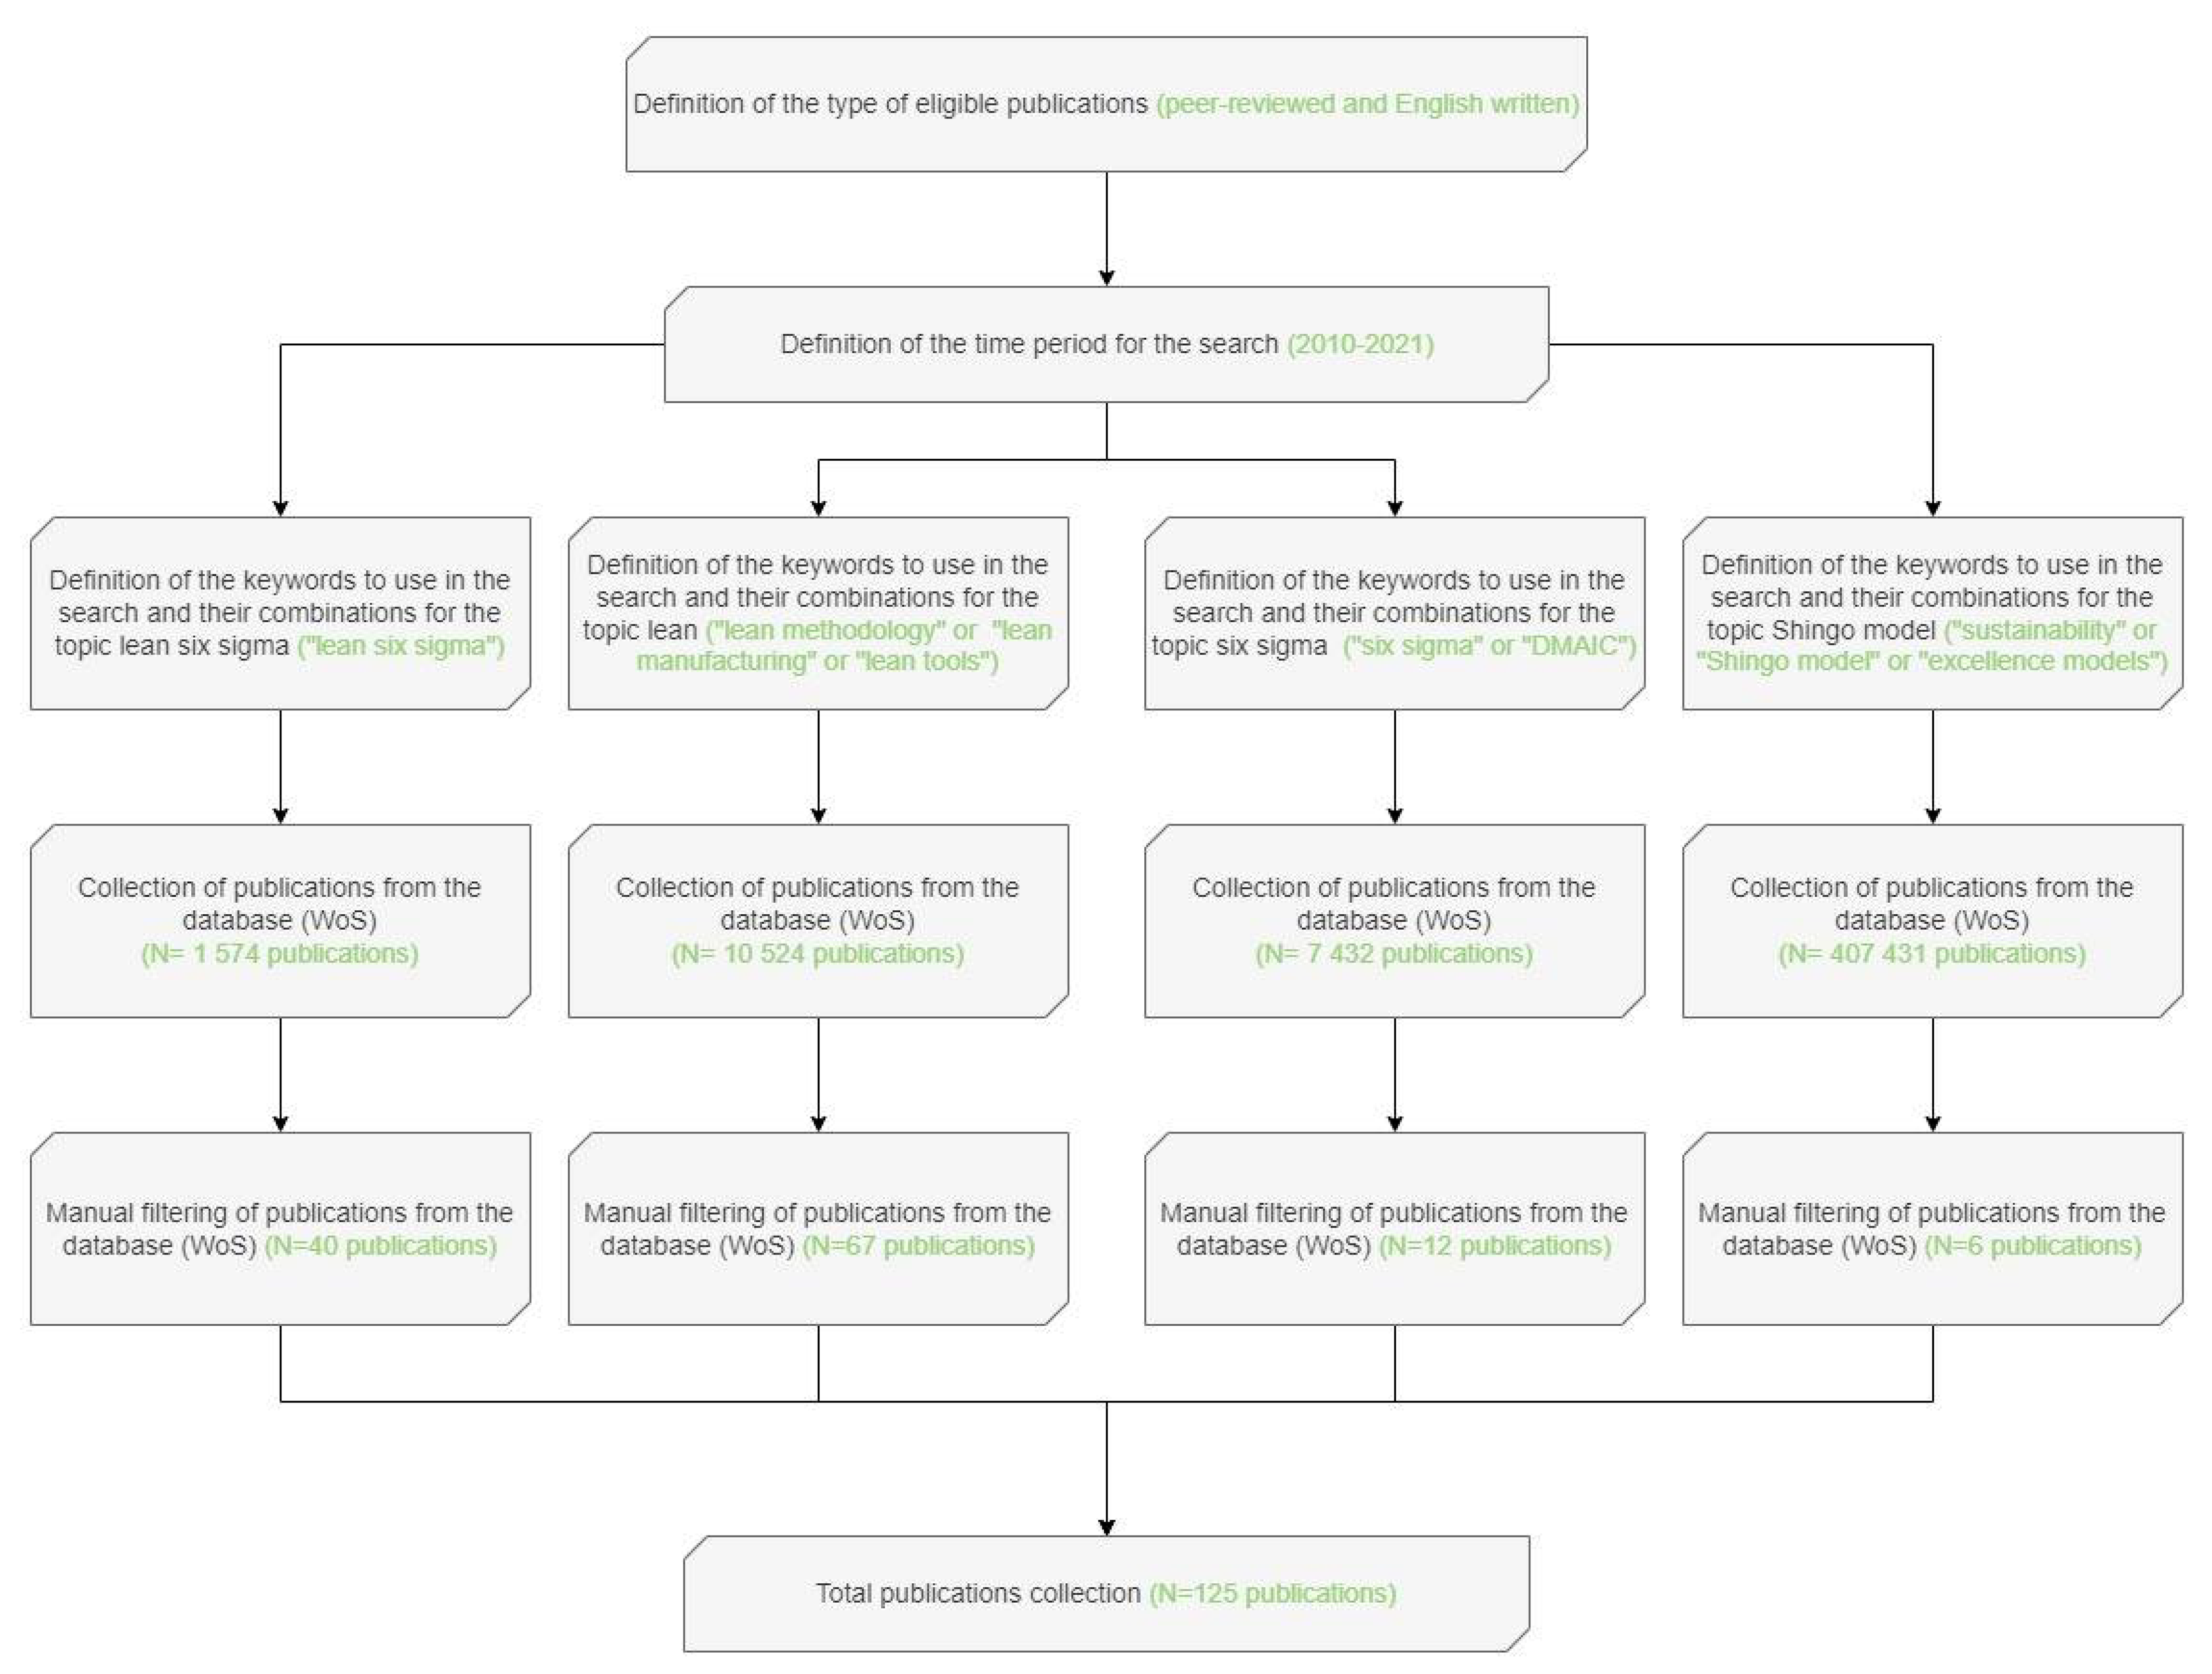
3. Methodology
3.1. Database Selection
3.2. Publication Search Criteria
3.3. Bibliometric Analysis
4. Results of the Bibliometric Analysis
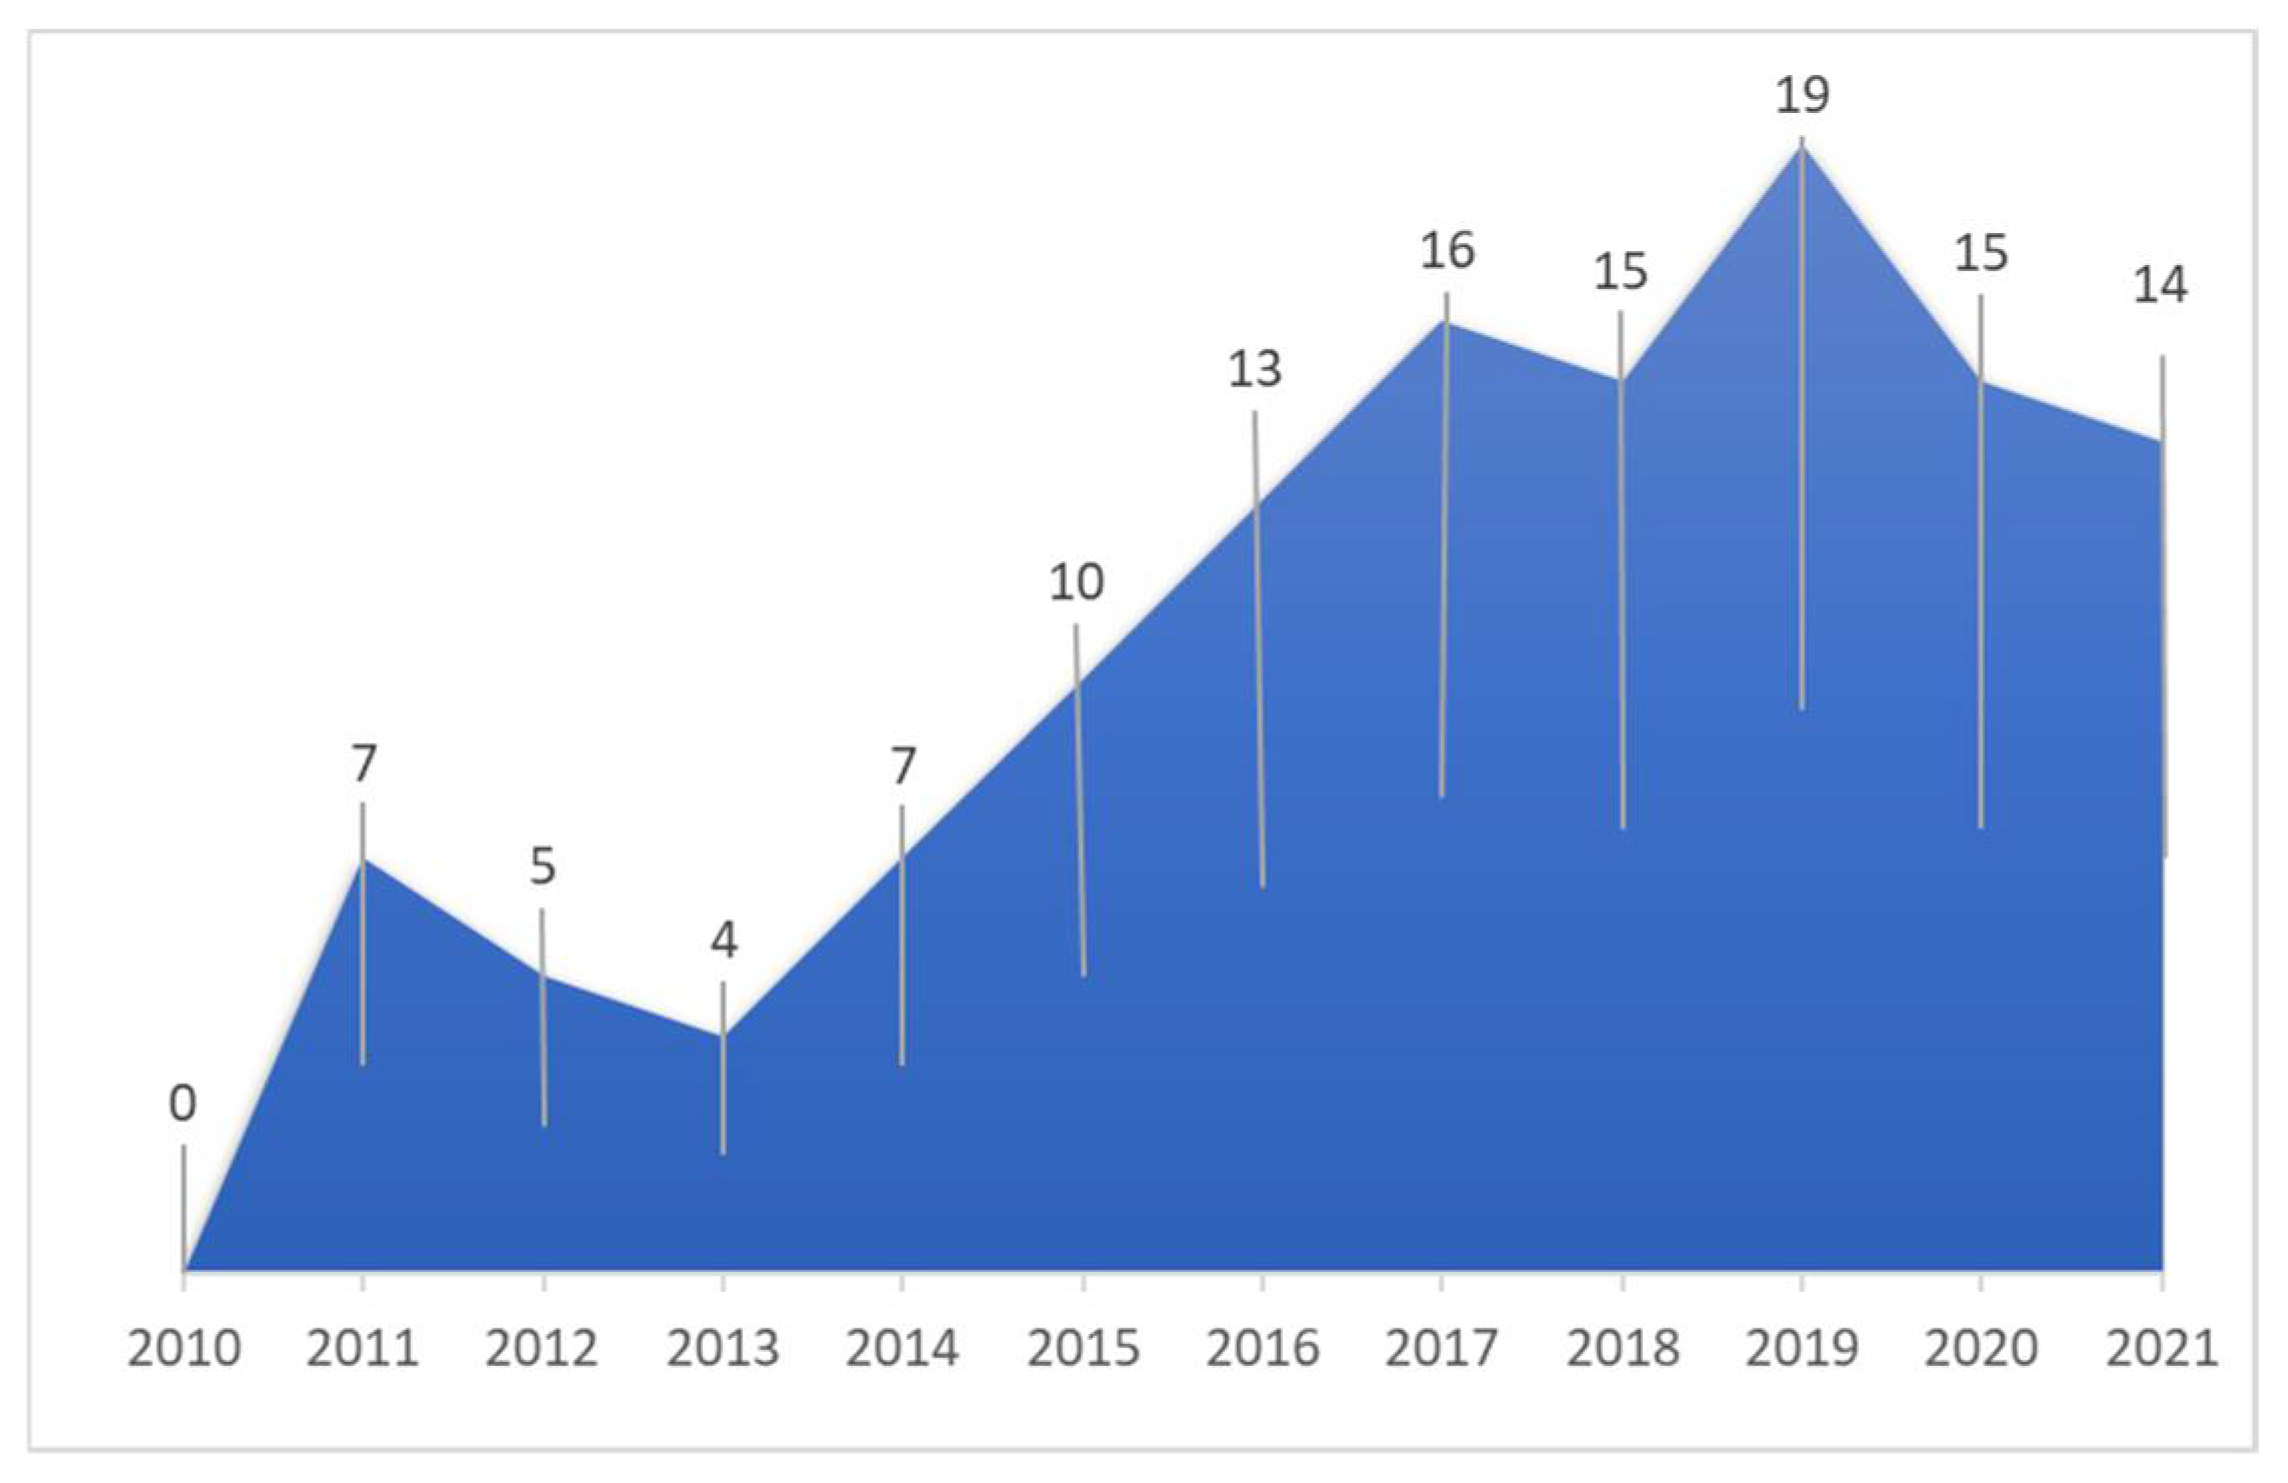
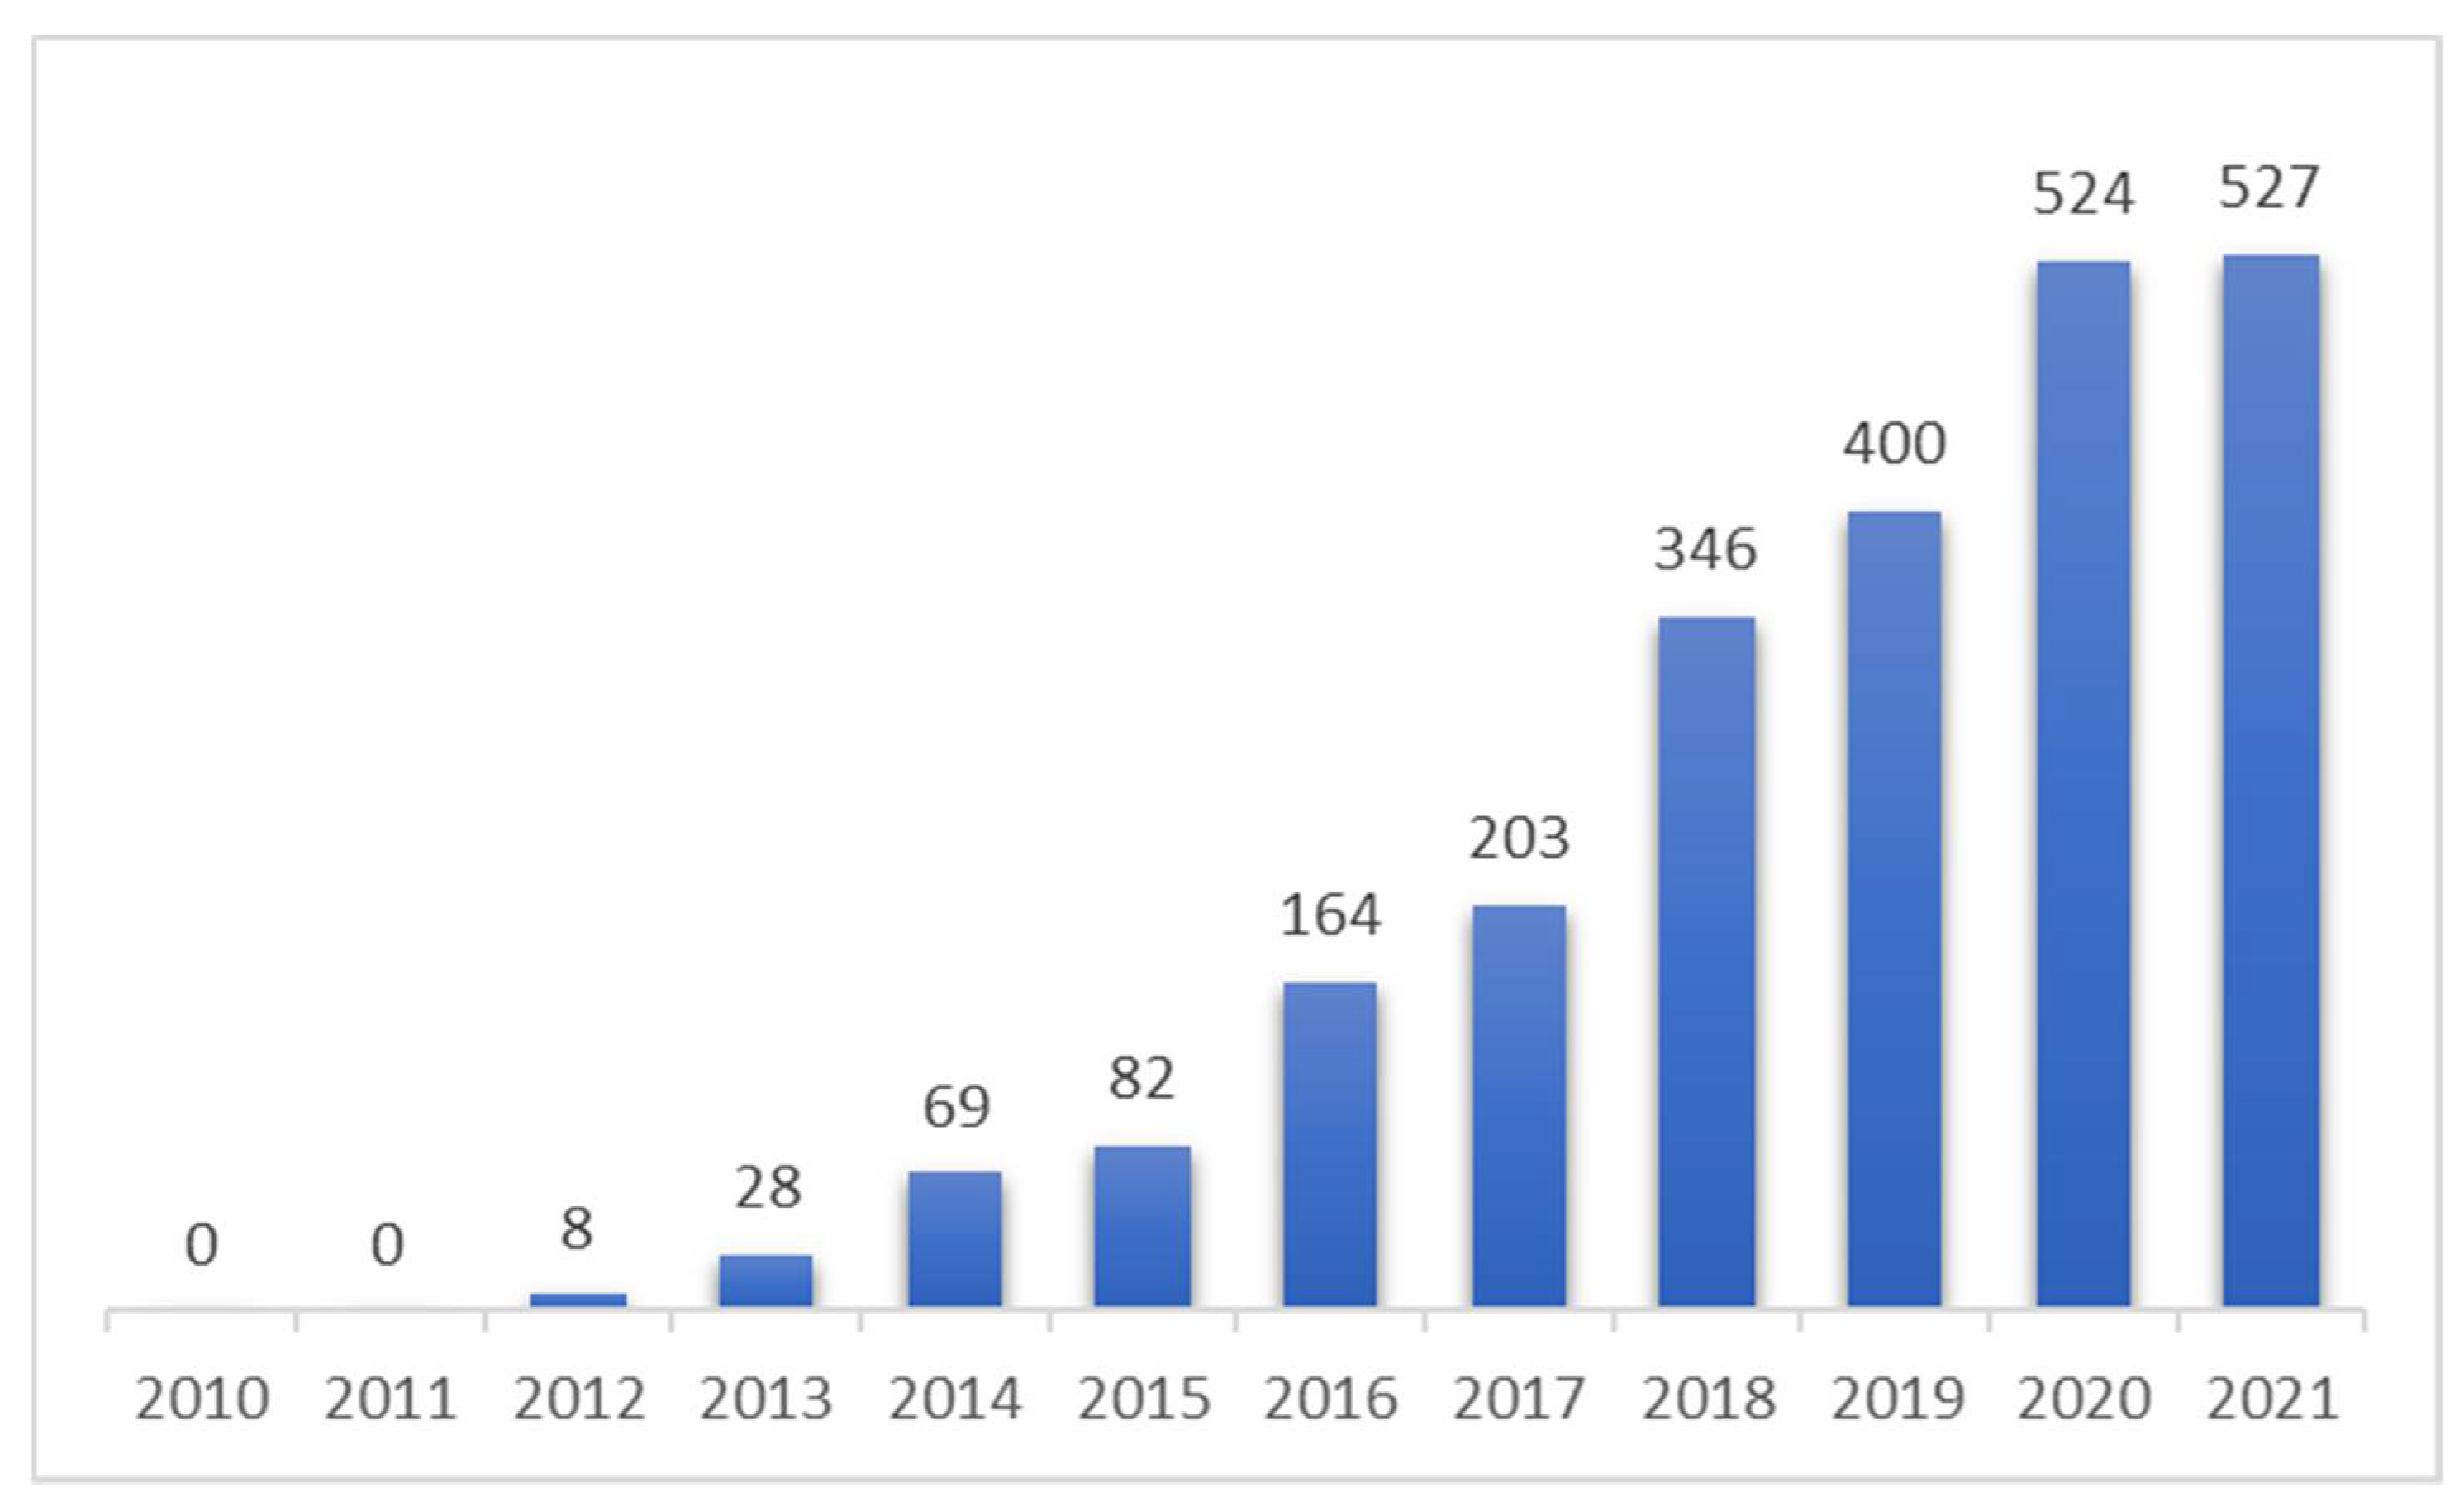
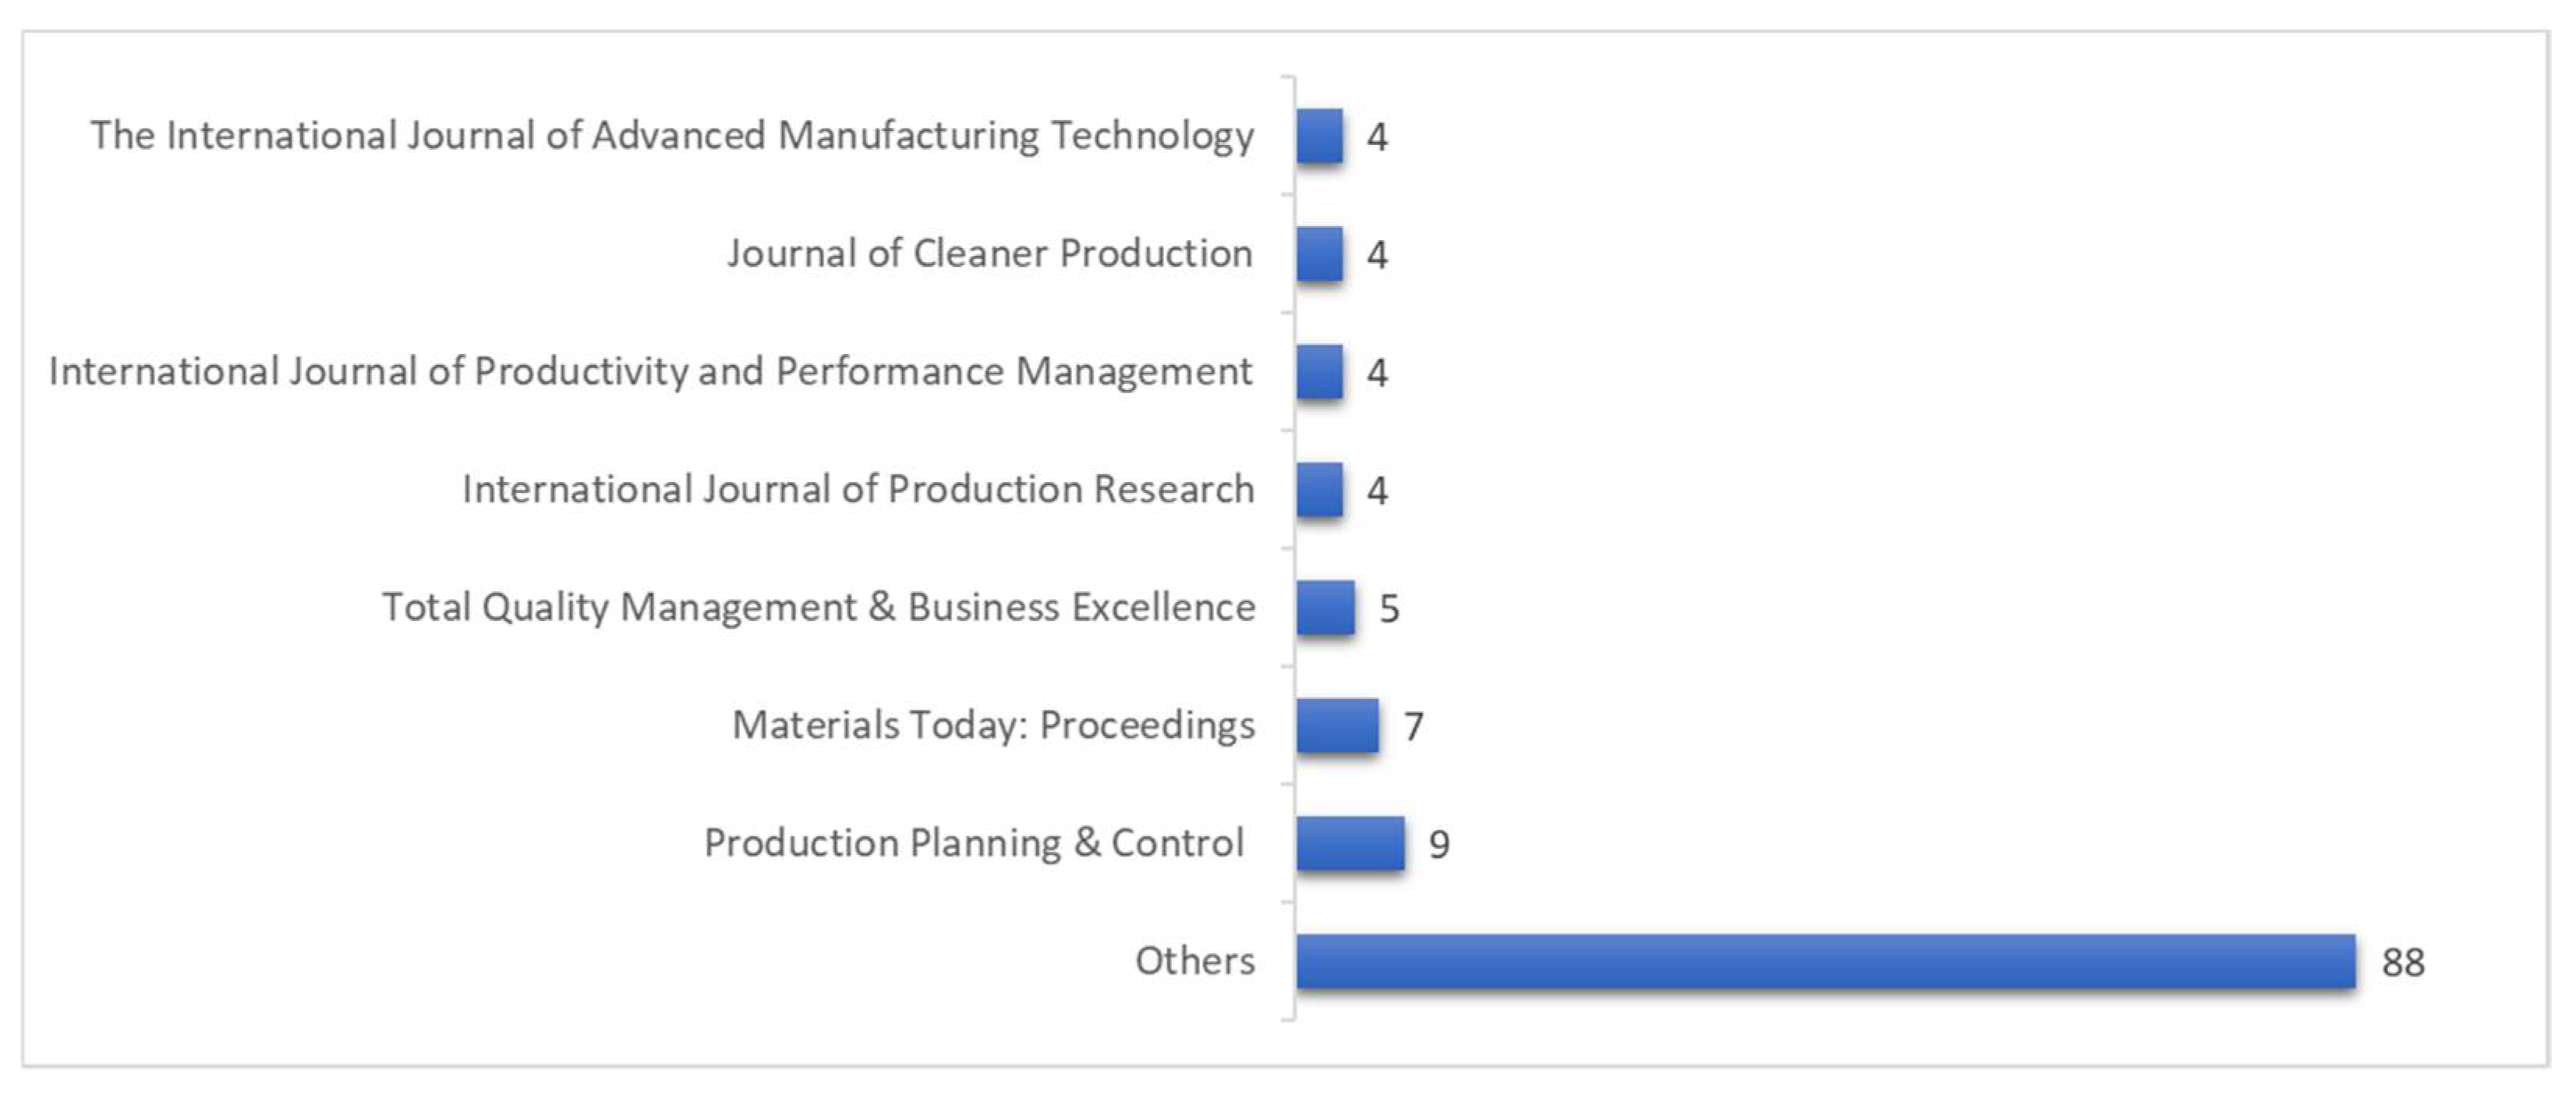
4.1. Distribution of Publications
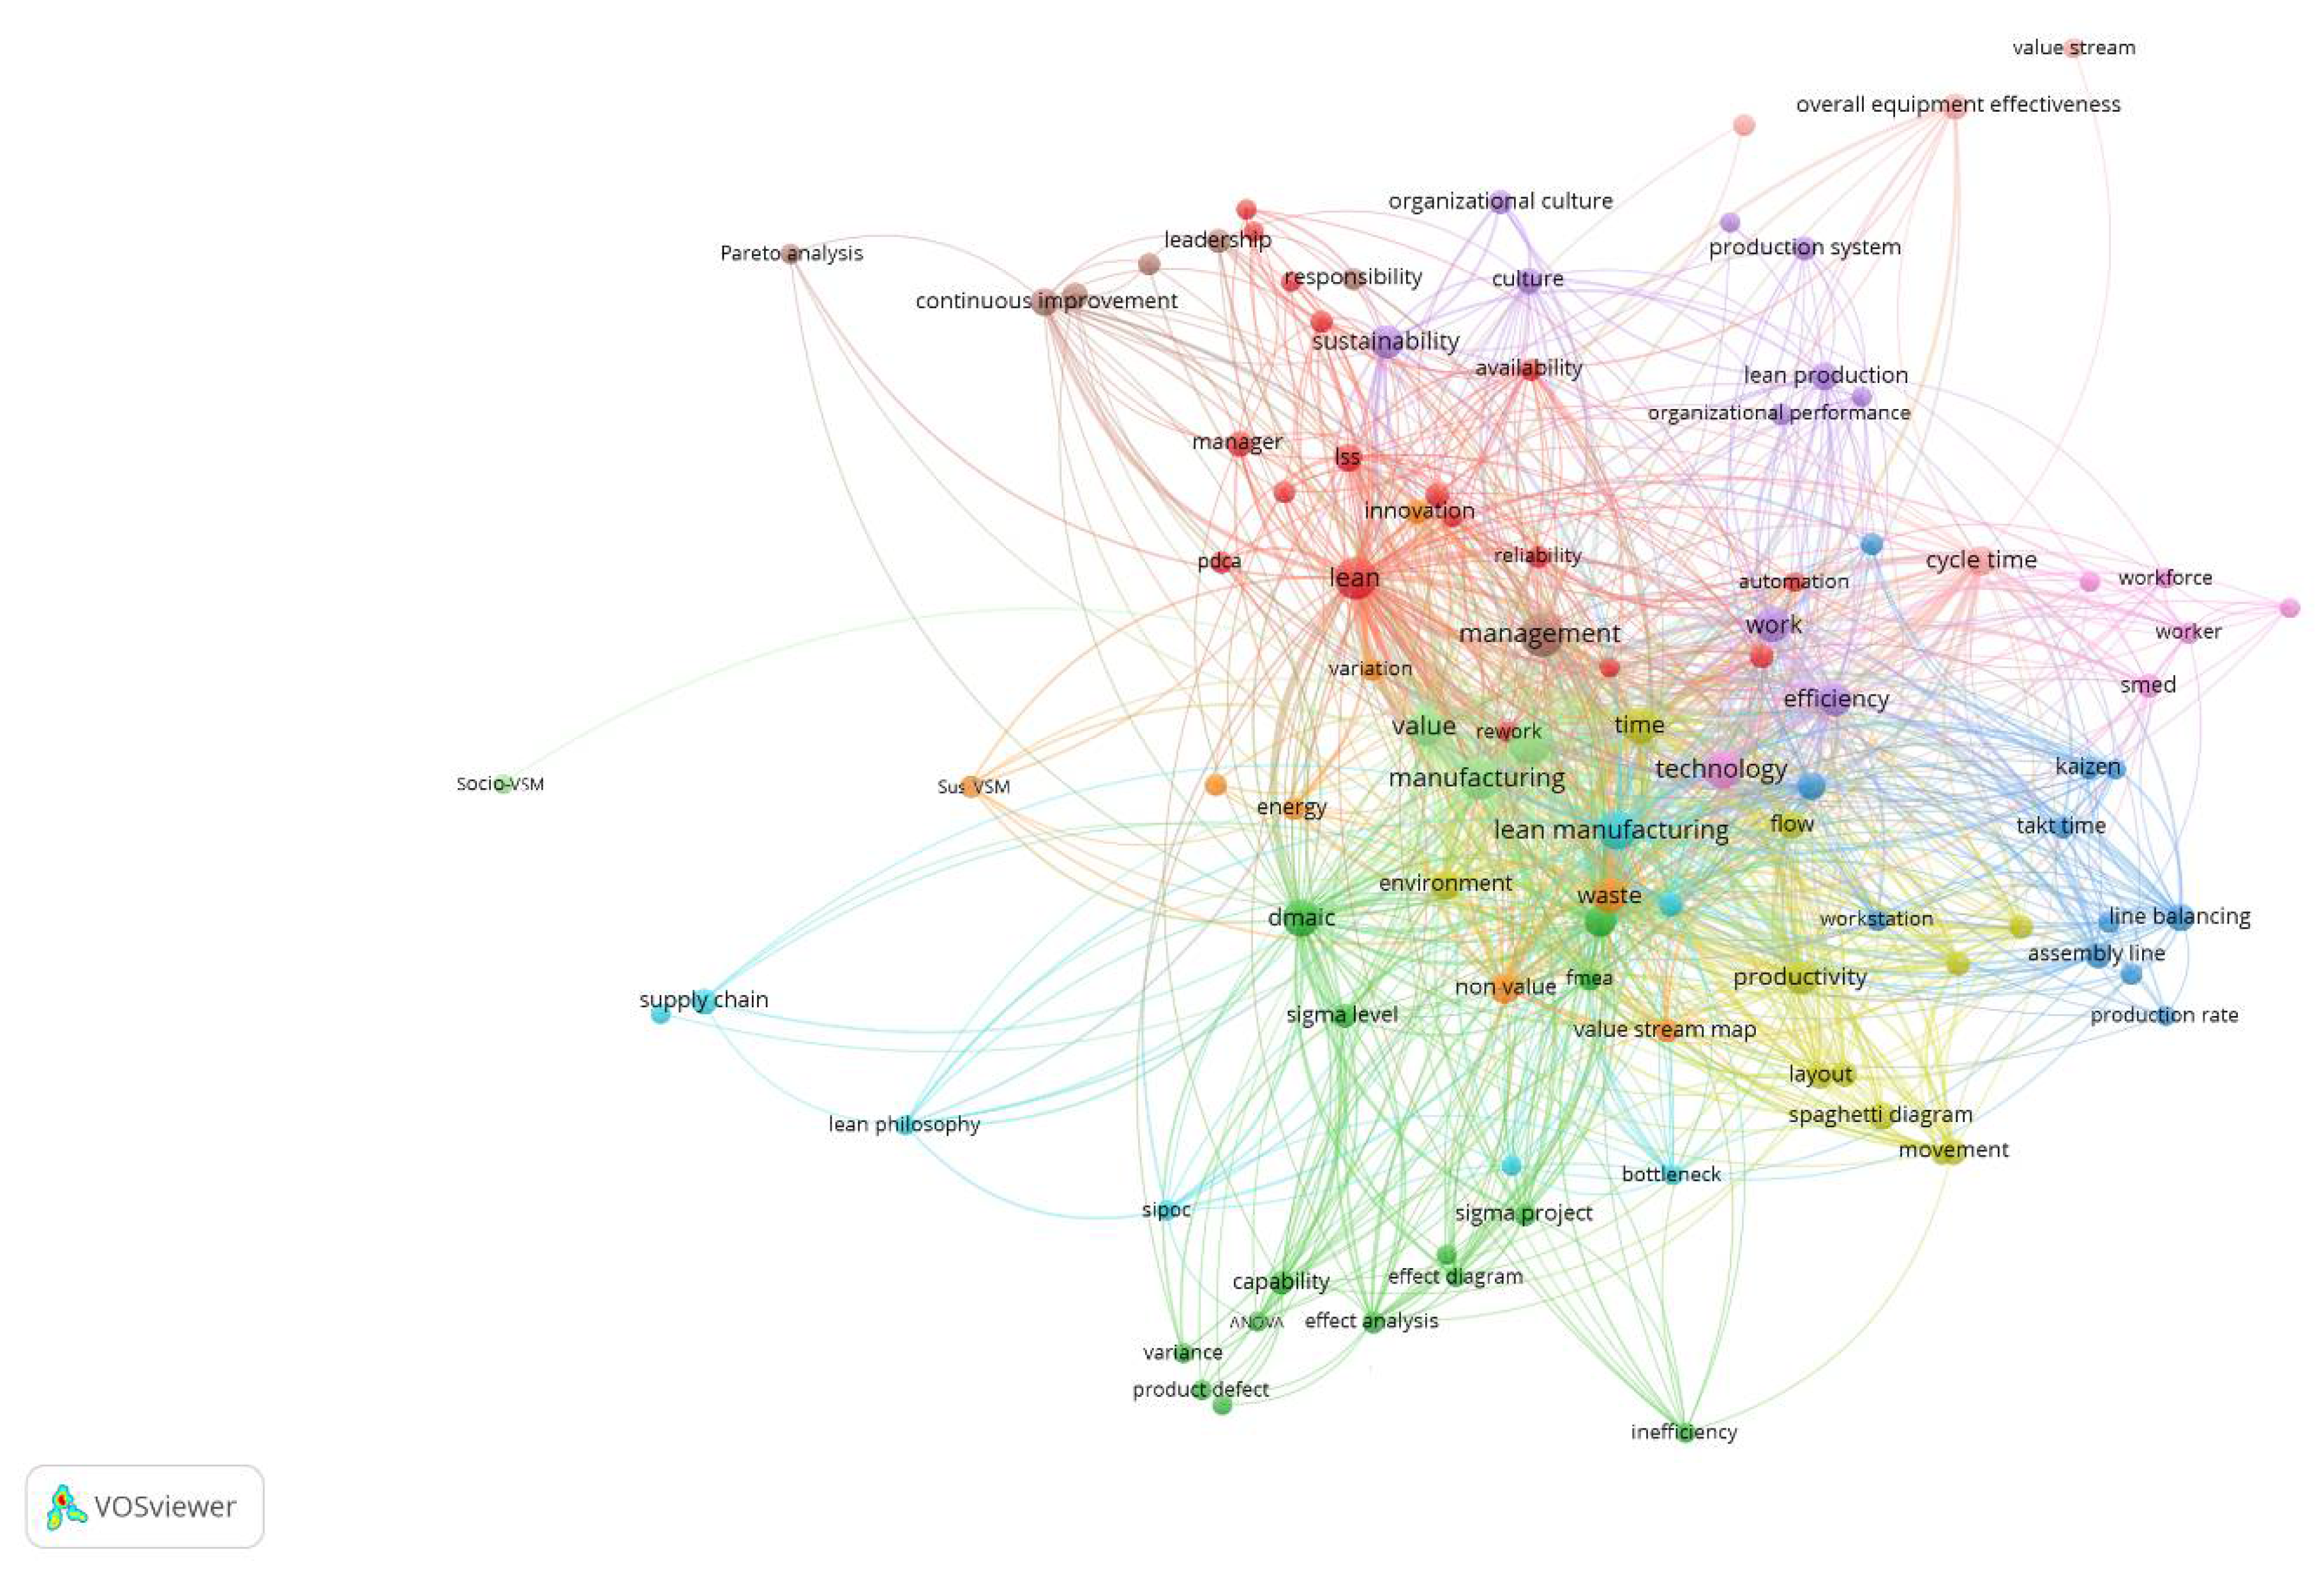
4.2. Cluster Identification
5. Structural Analysis
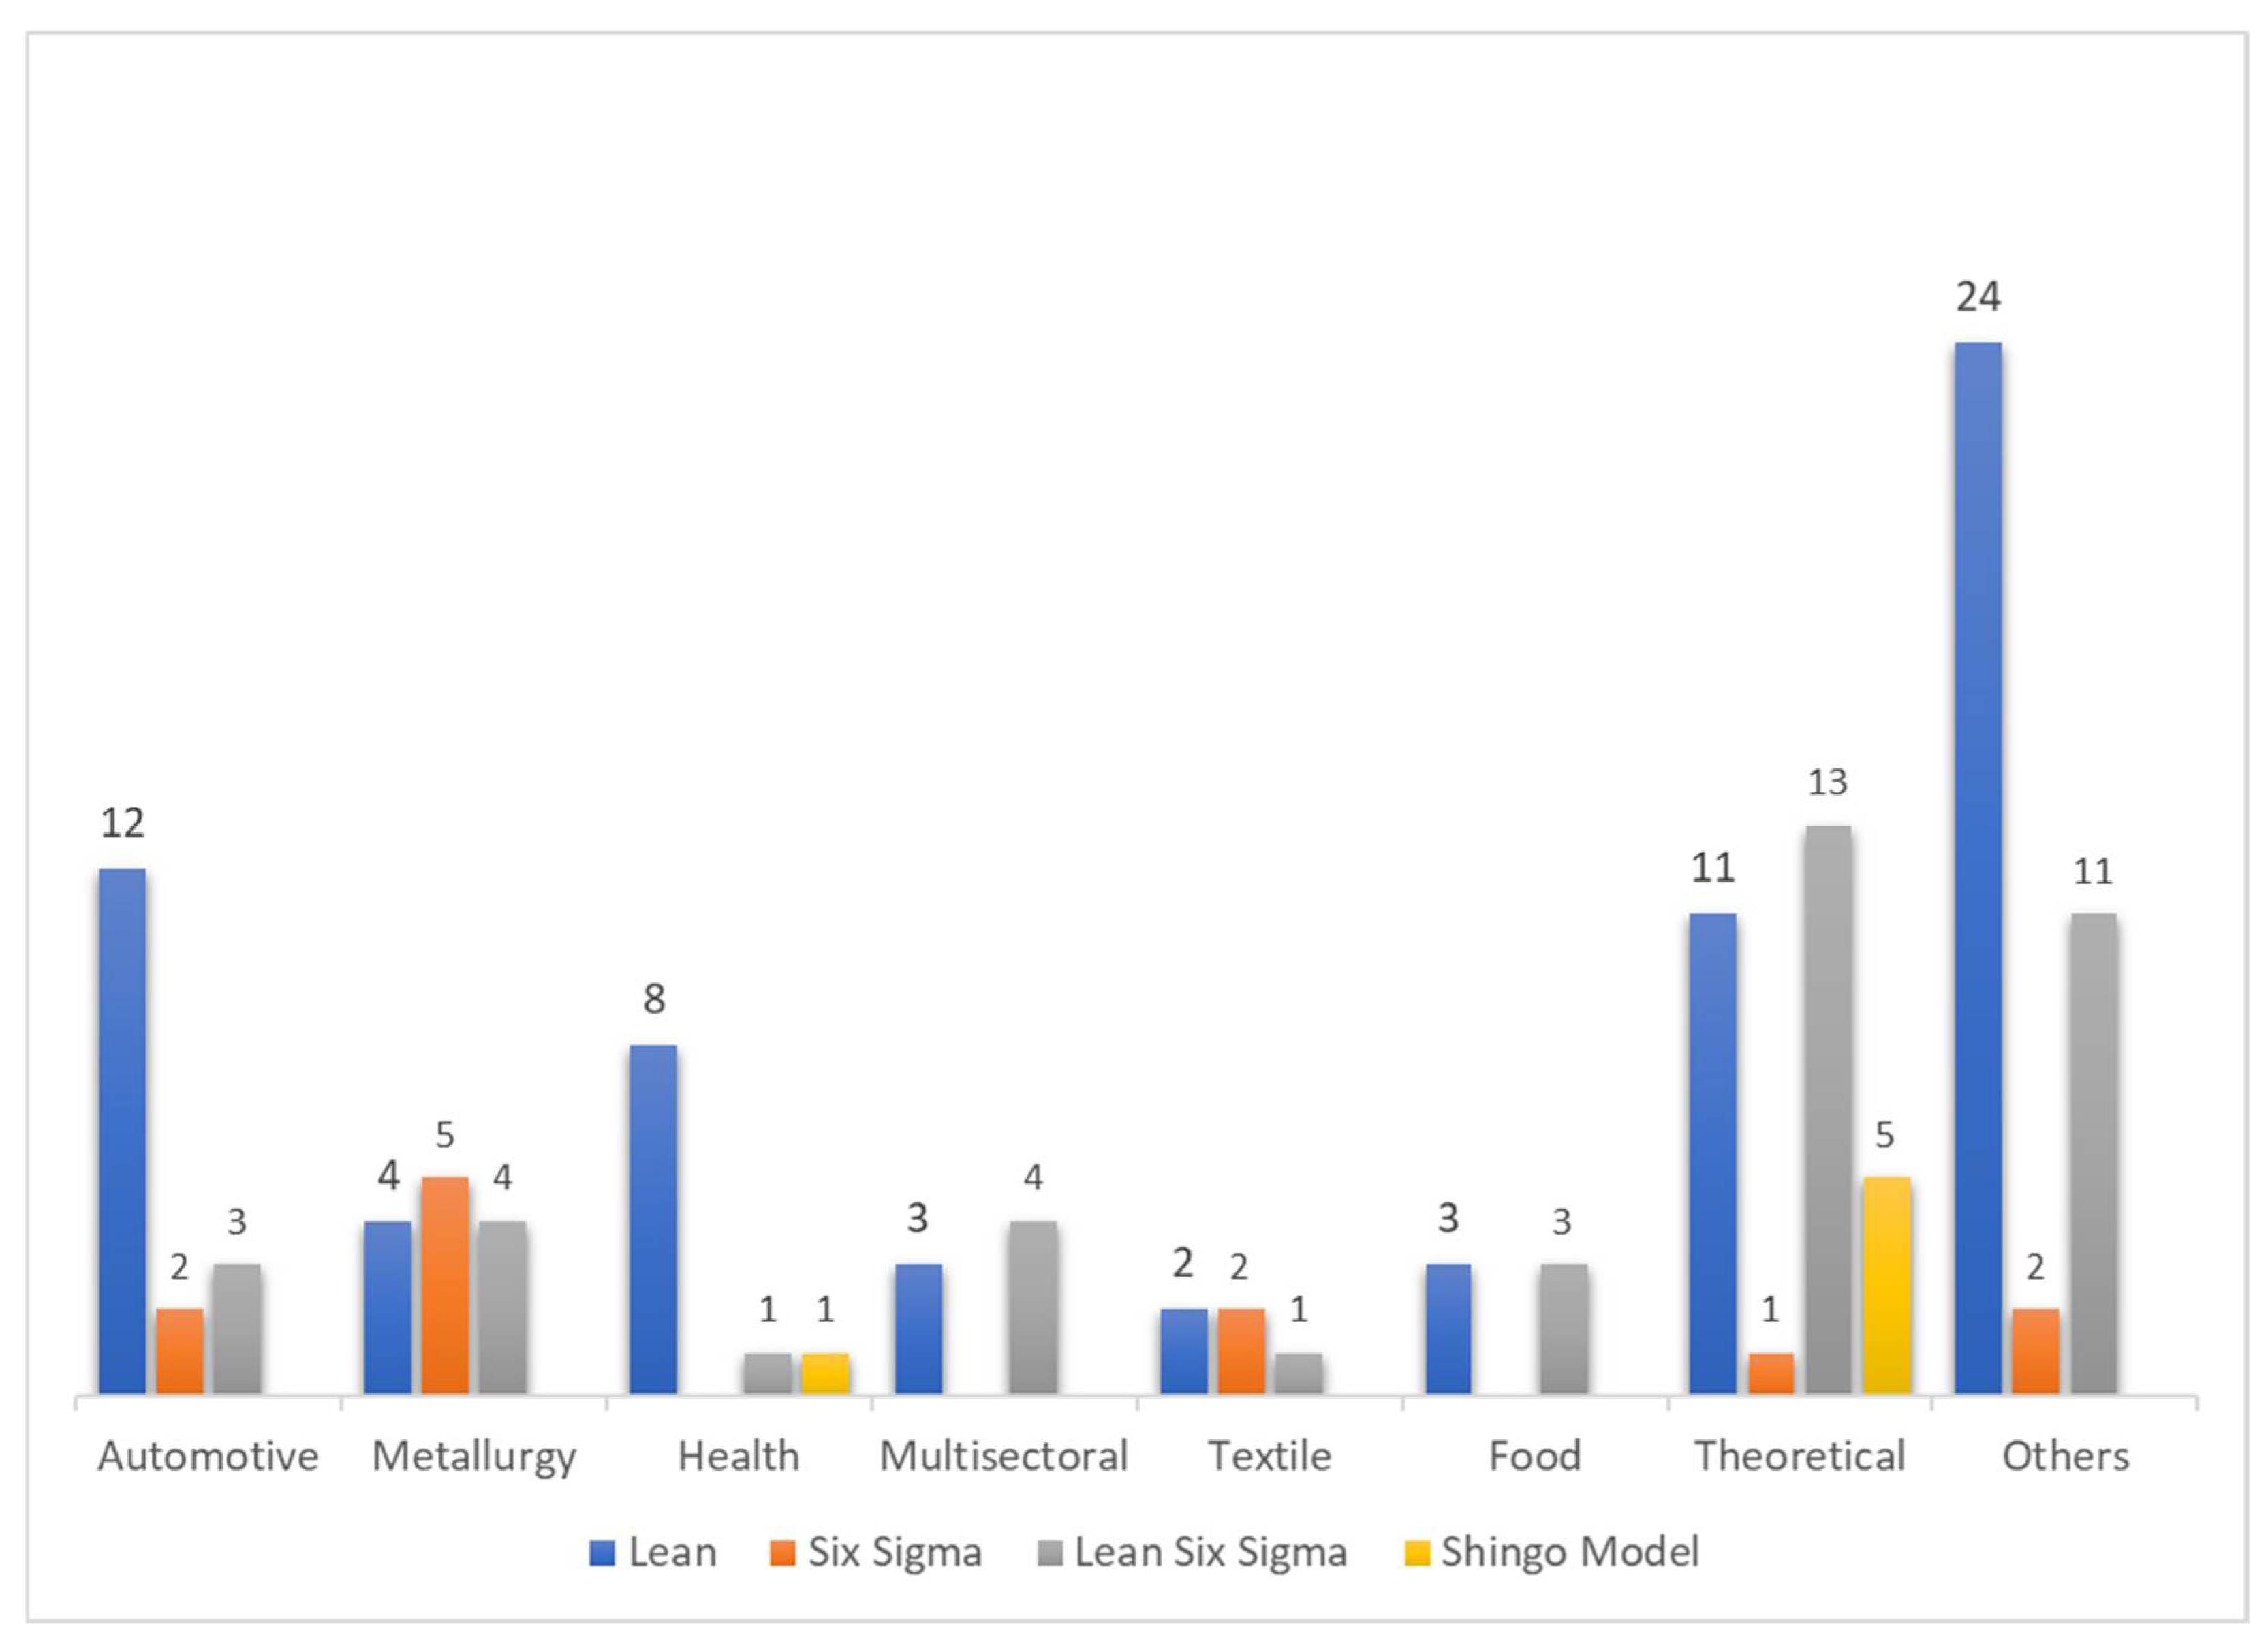
5.1. Distribution of Publications by Search Topic and Application Area
5.2. Presentation of Case Studies
5.3. Tool Effects
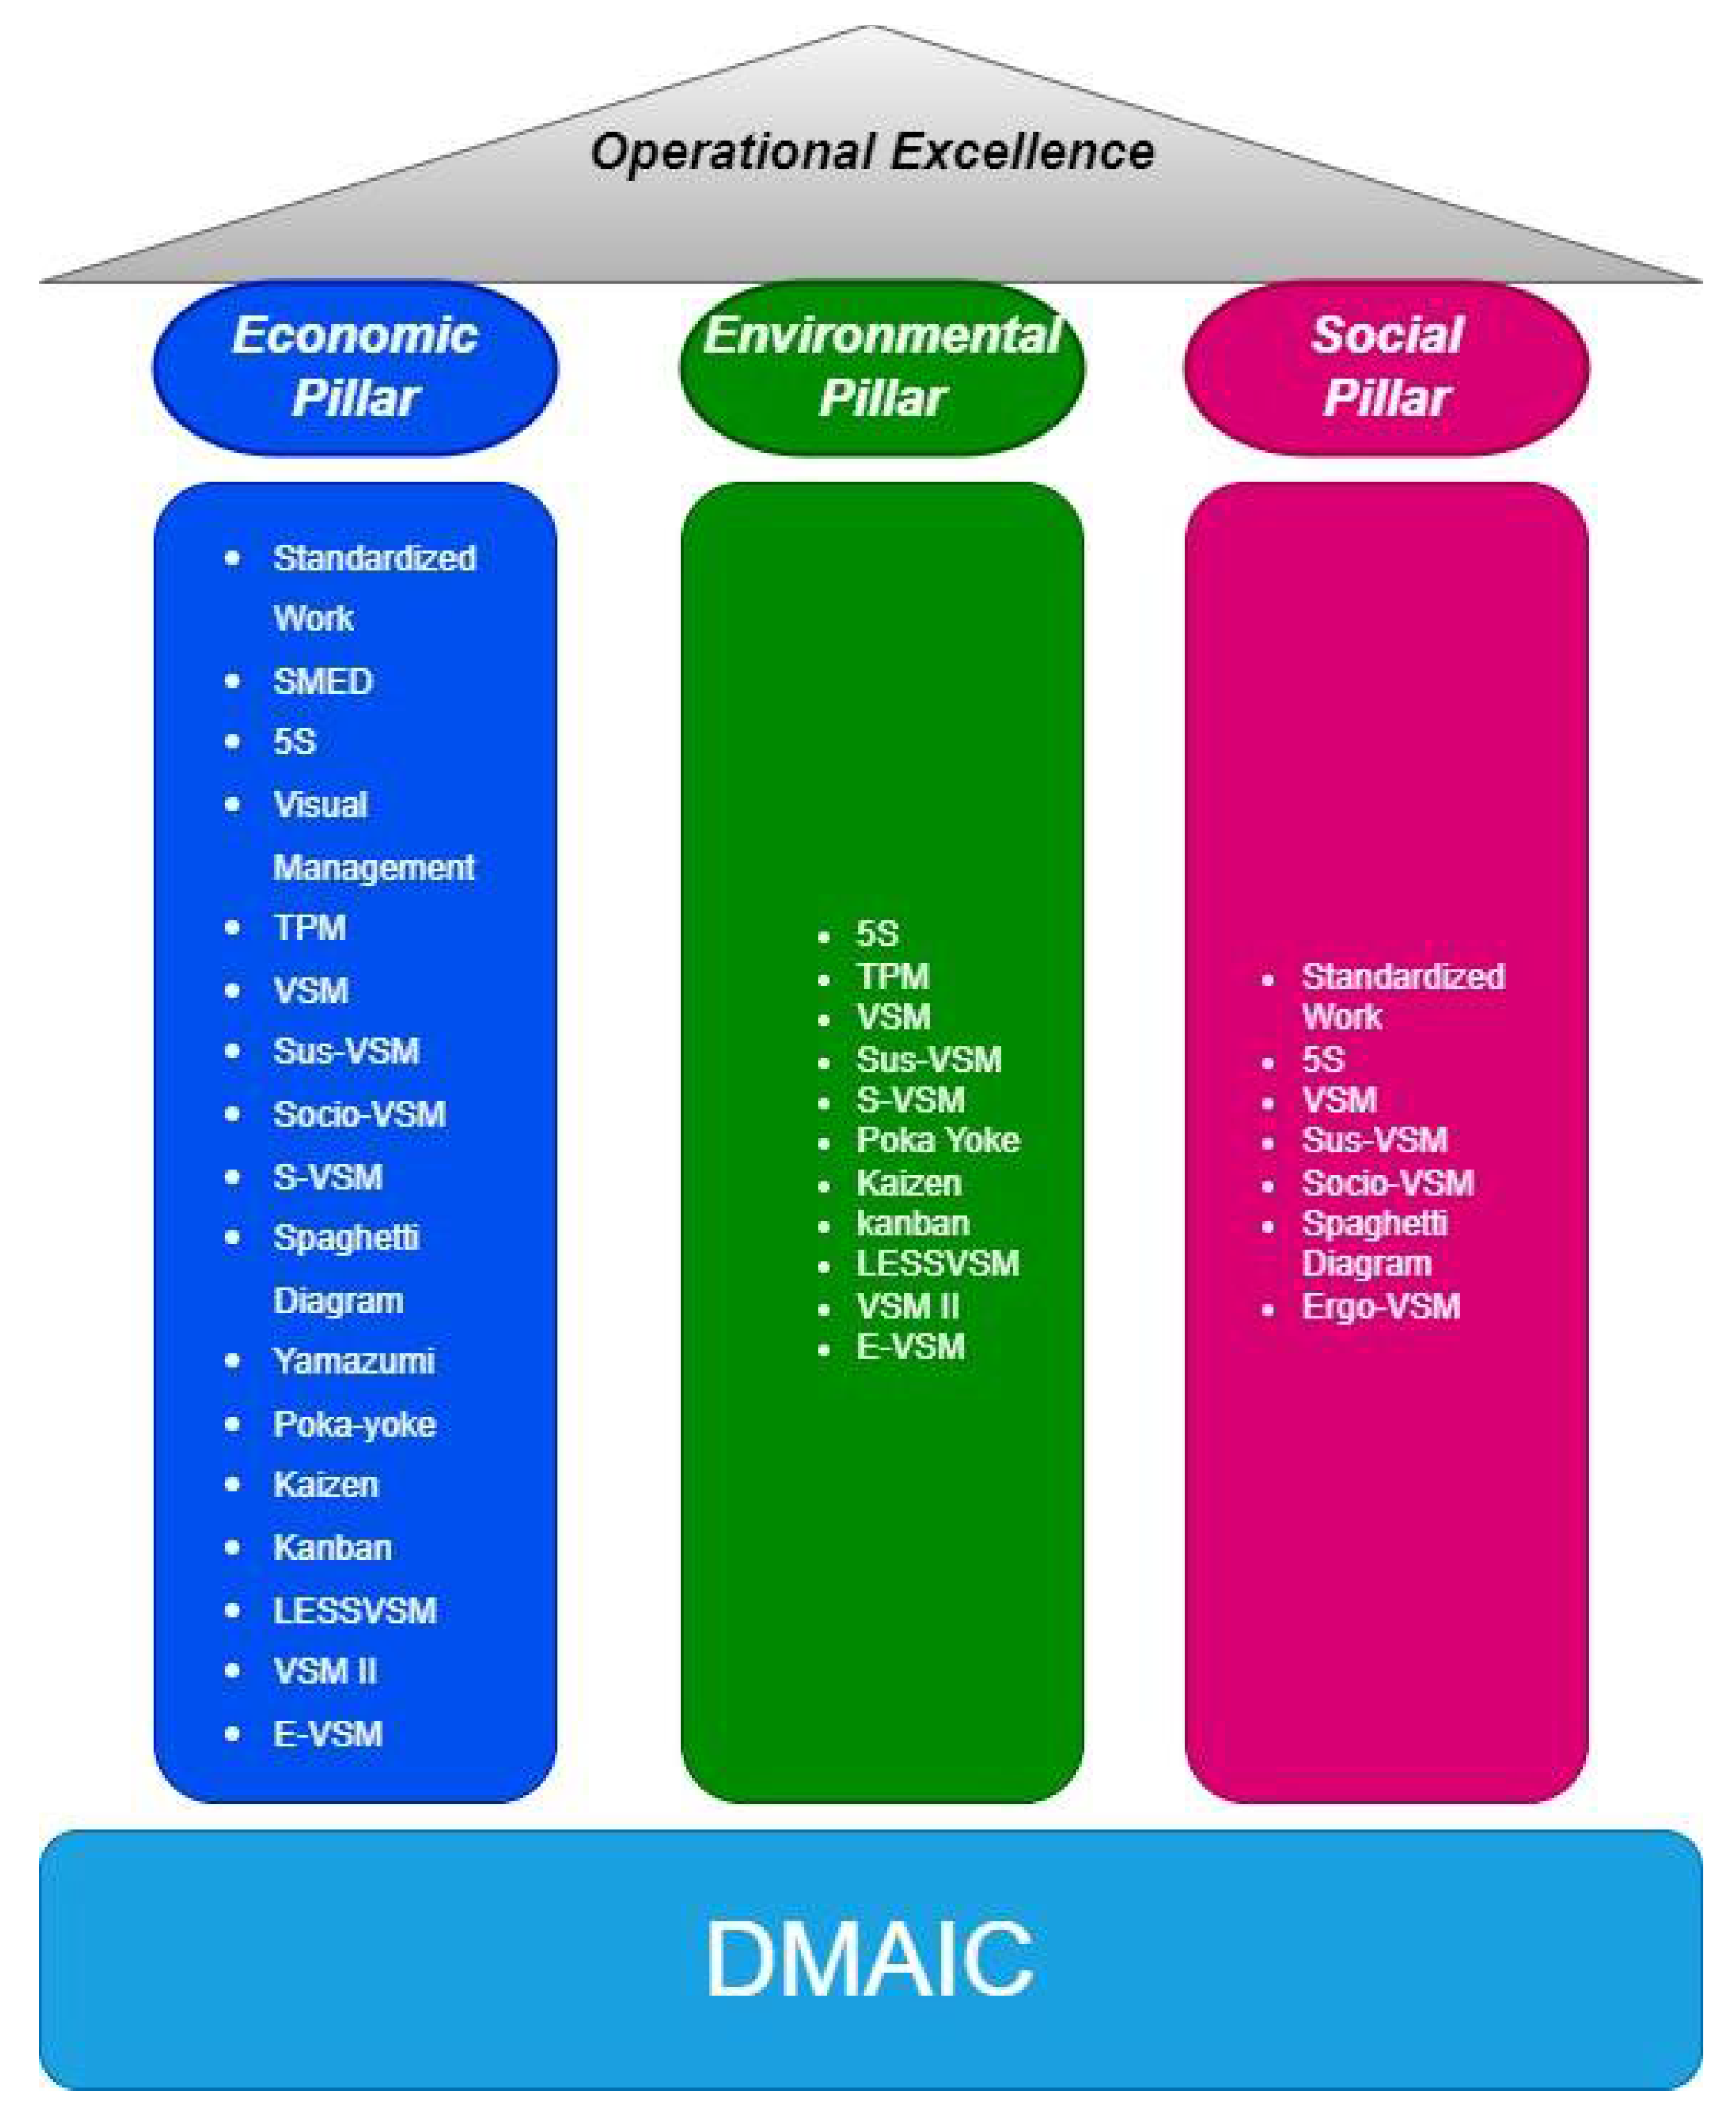
5.4. Conceptual Model
6. Discussion
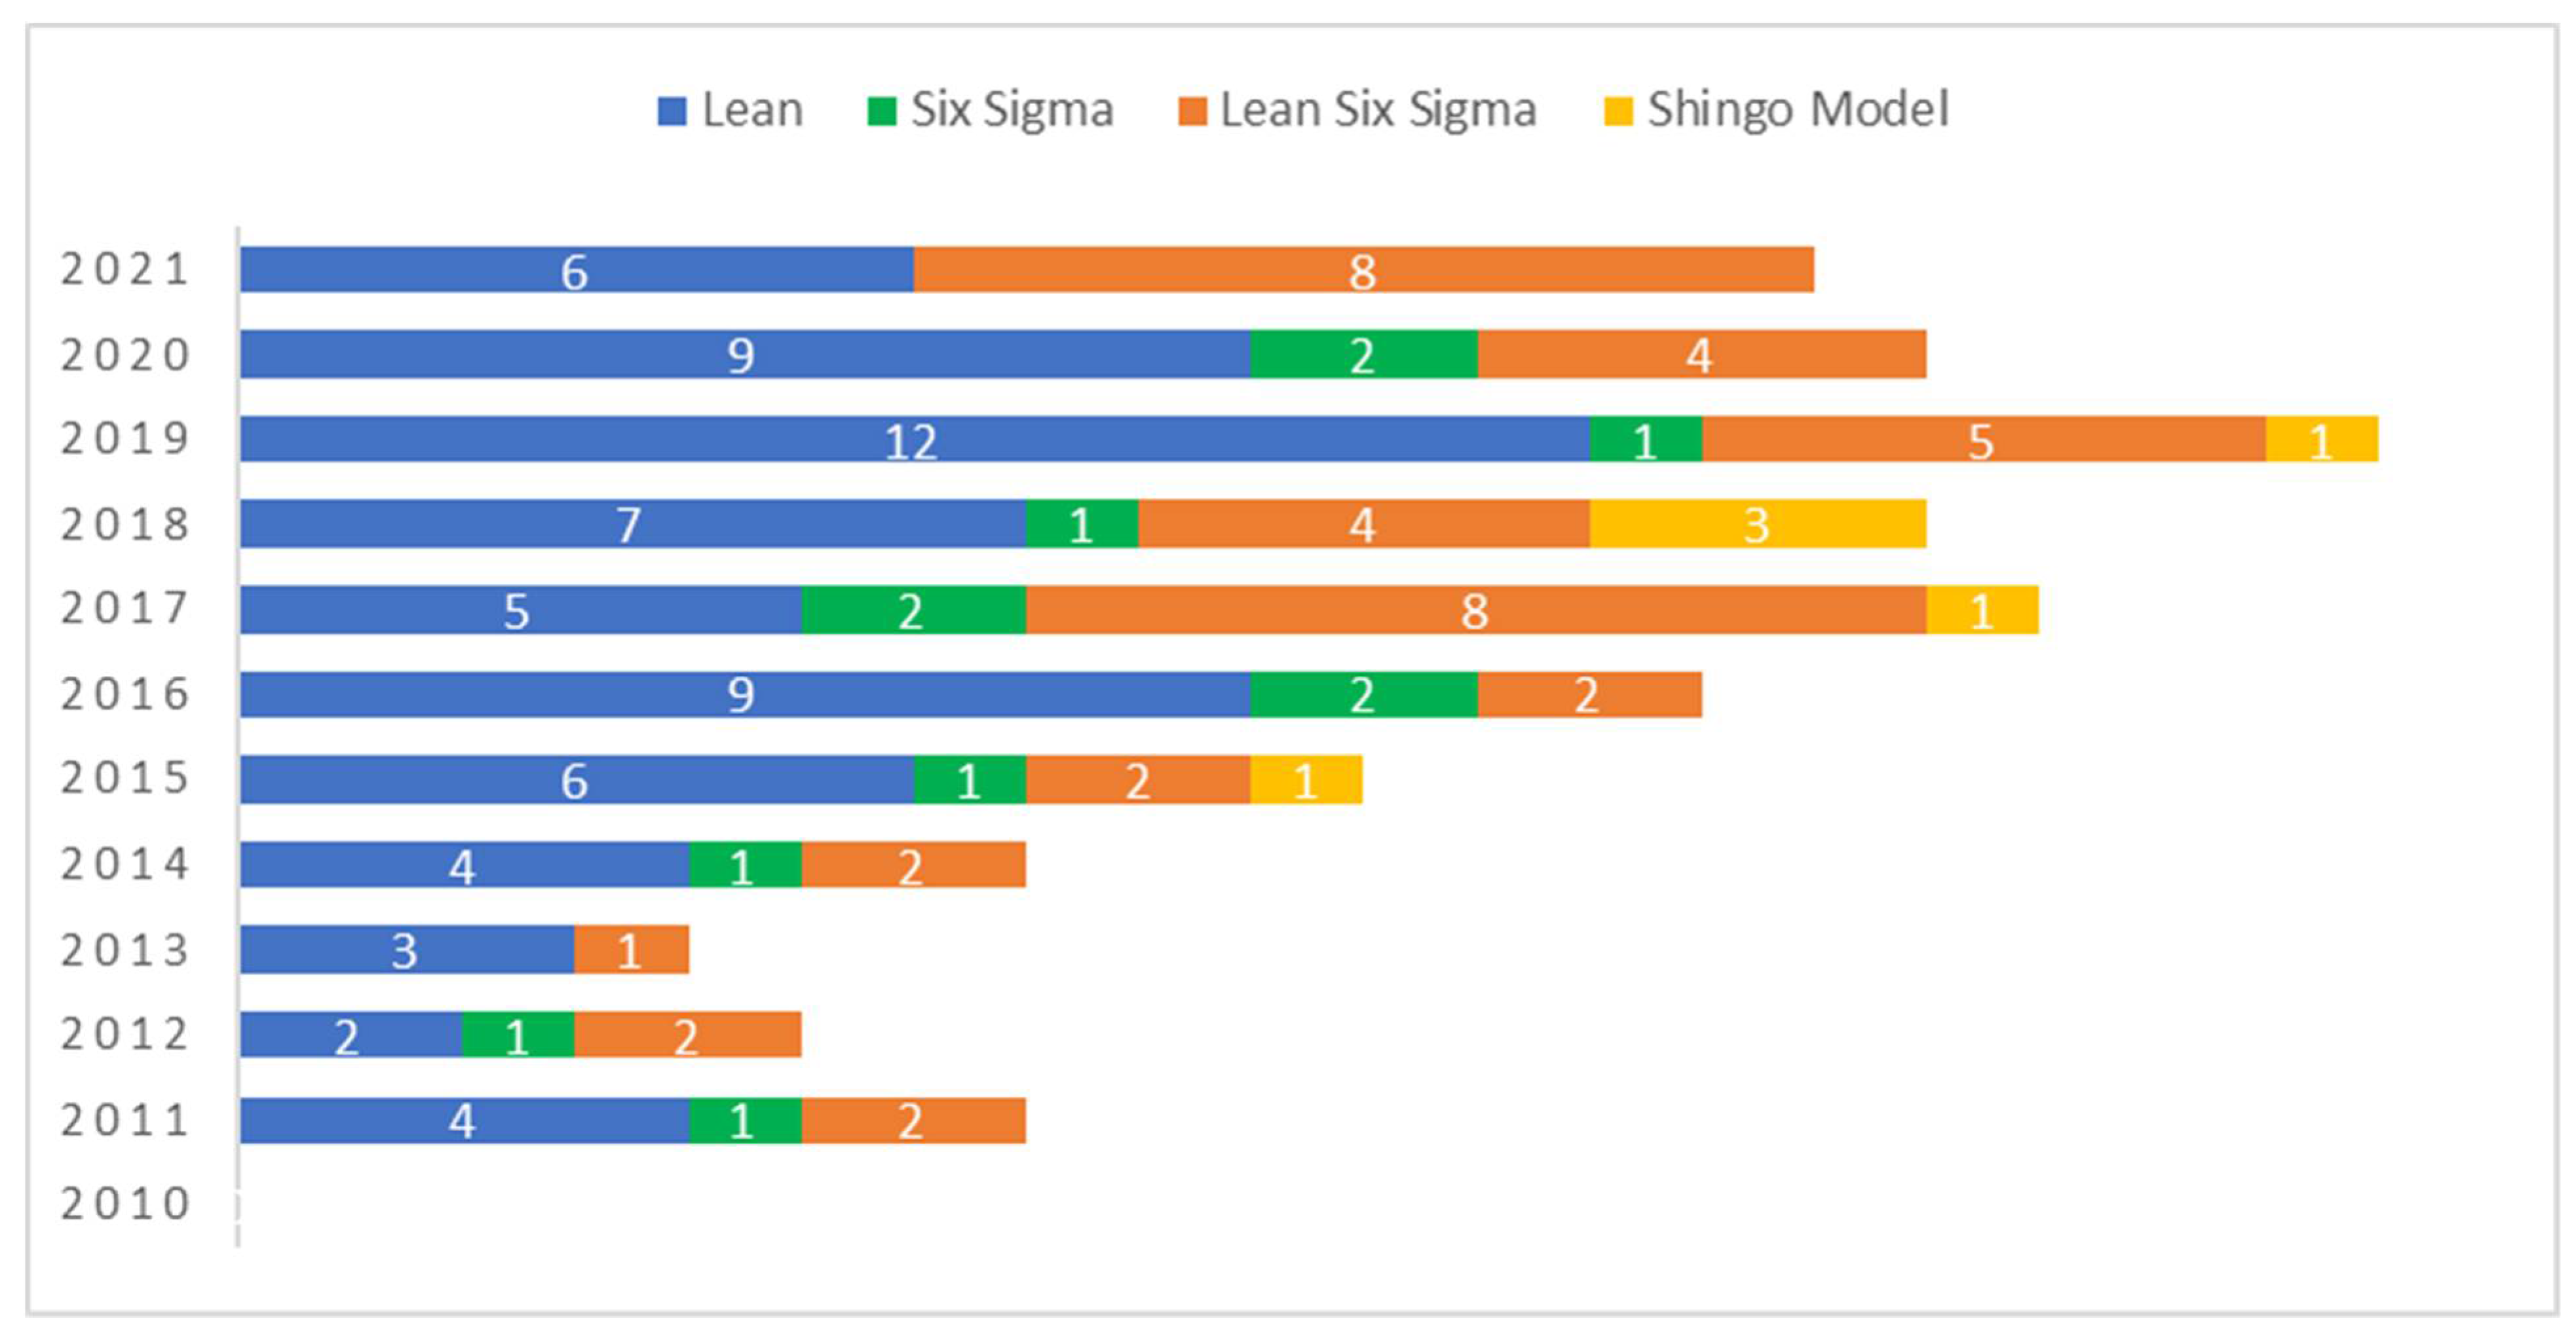
6.1. Evolution of Publications
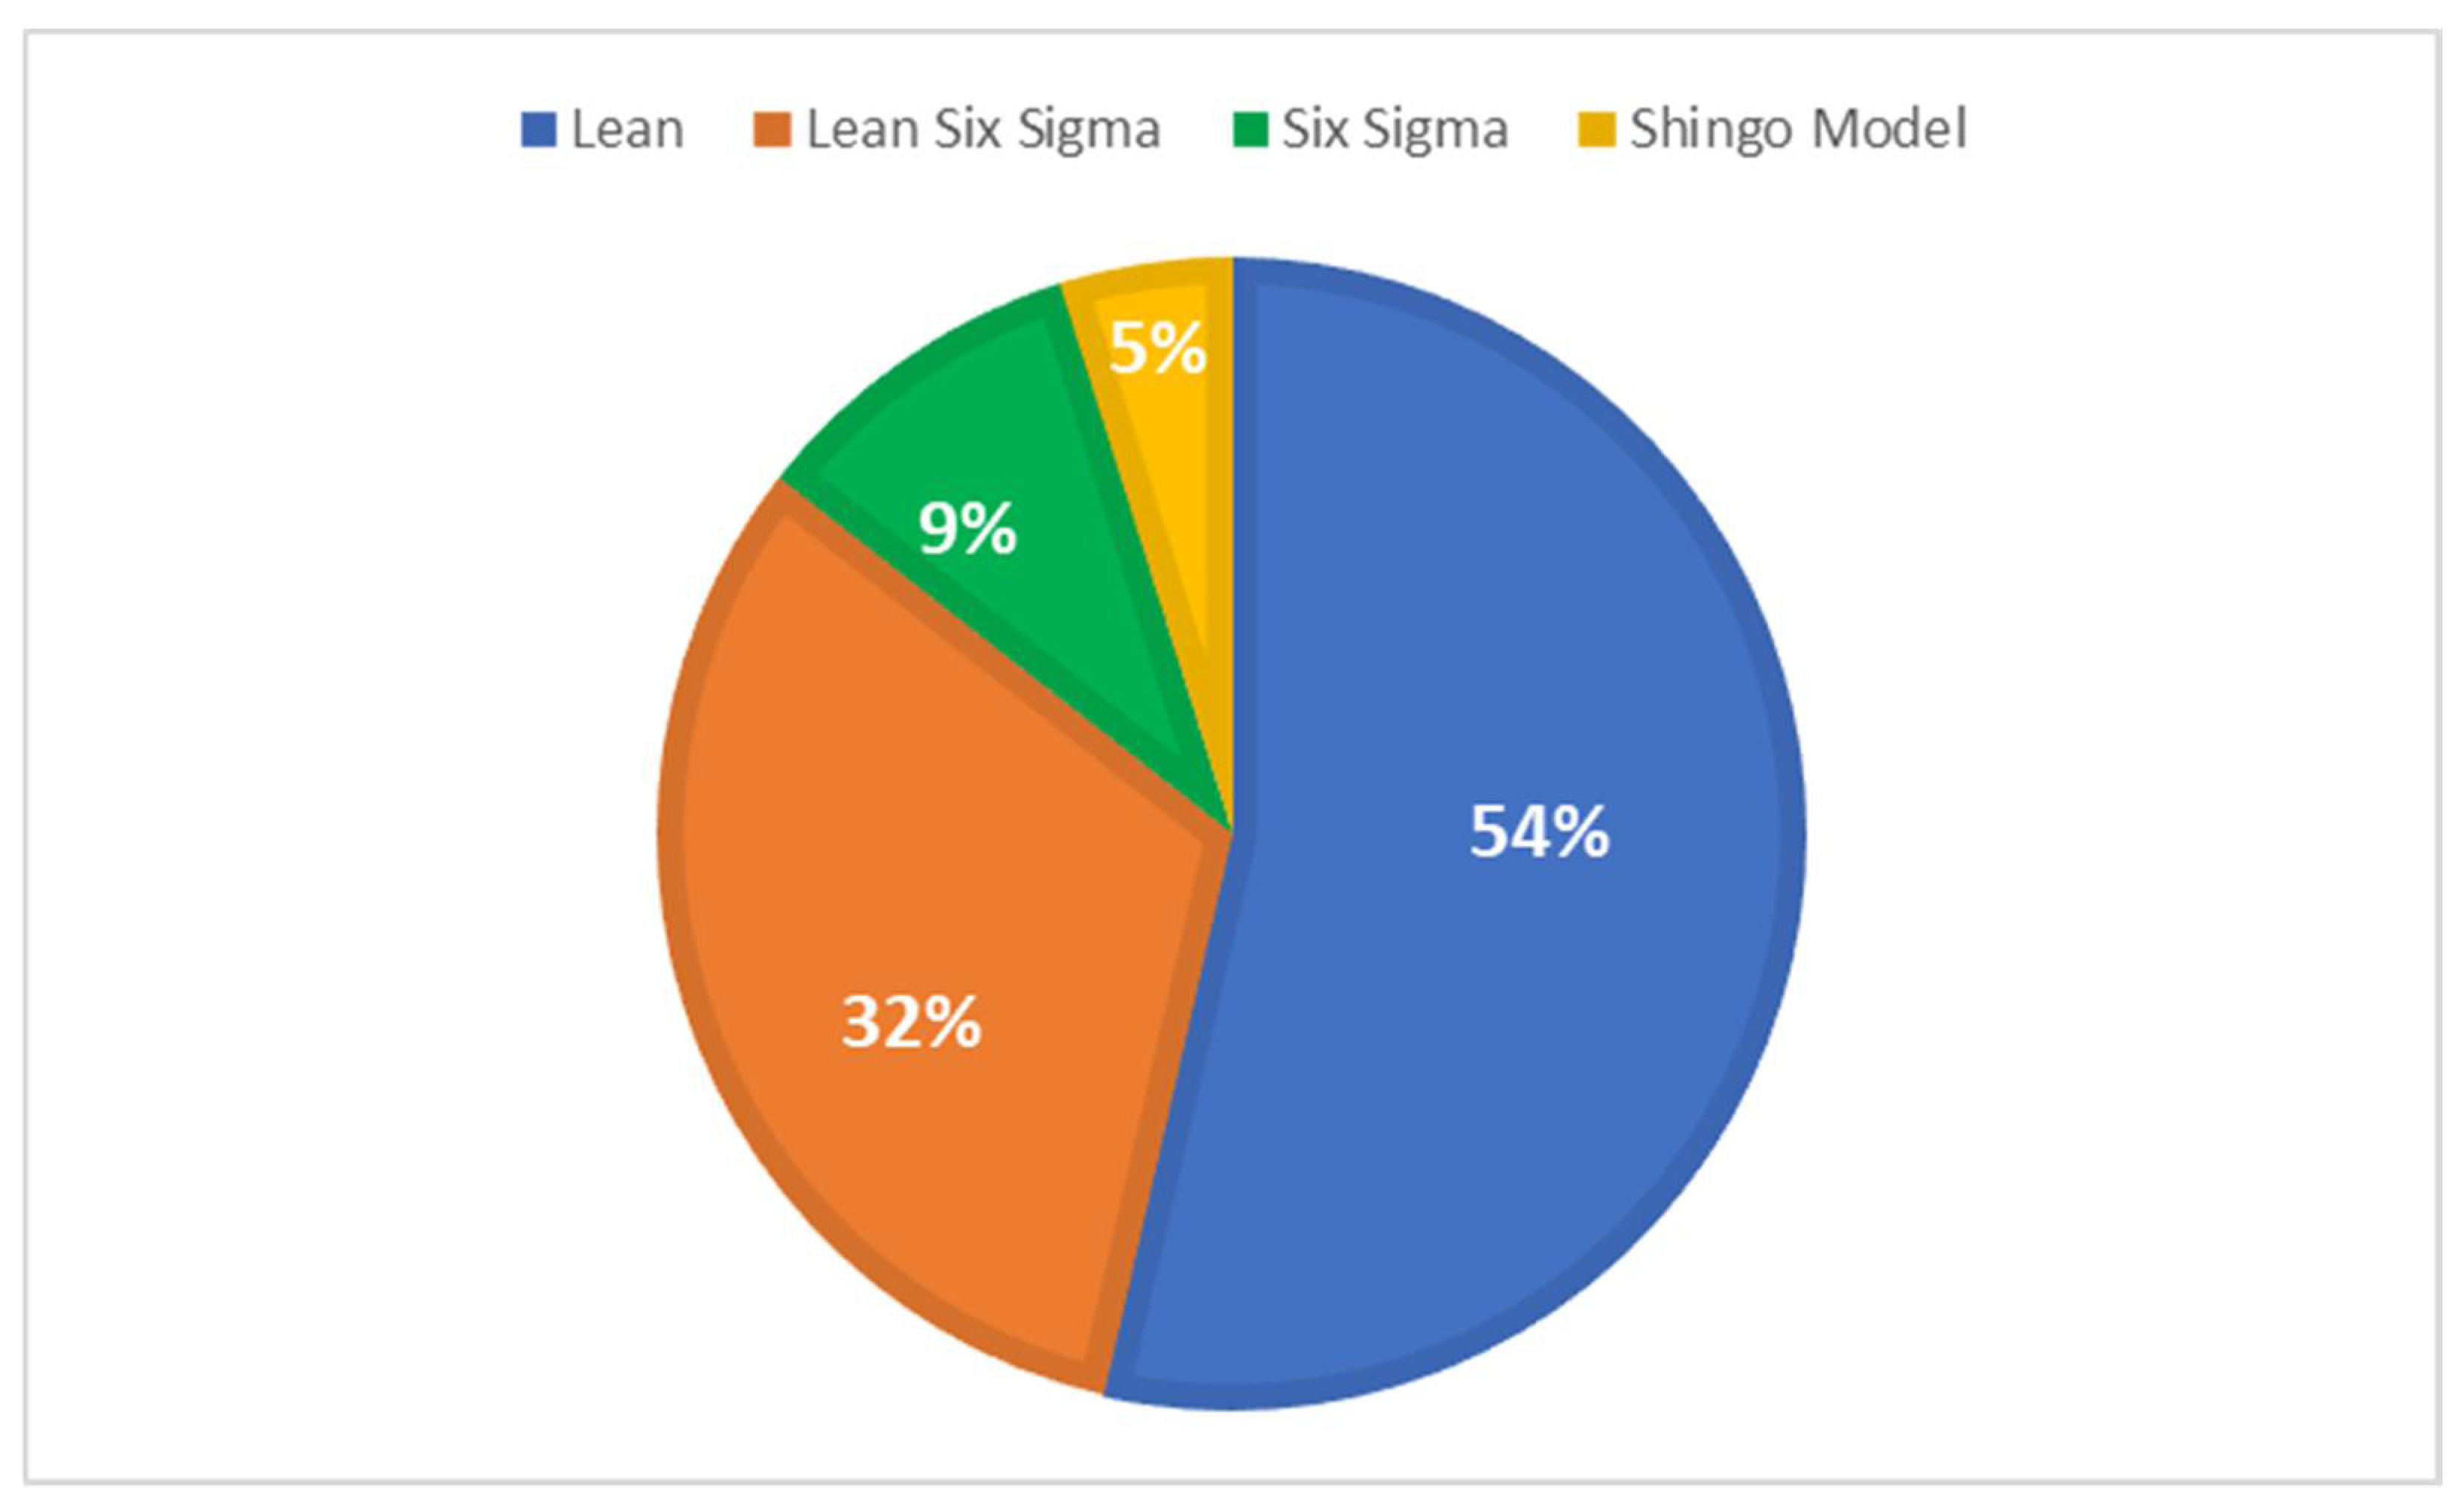
6.2. Relationship between Lean, Six Sigma, Lean Six Sigma and the Shingo Model
- For the lean topic, the automotive industry is the most debated area, also being compatible with six sigma through lean six sigma;
- For the lean six sigma topic, the theoretical area is the most debated area, despite the growing importance in the automotive and metallurgical industry that relates lean and six sigma concepts;
- For the six sigma topic, the metallurgical area is the most debated, which relates lean concepts through lean six sigma;
- For the Shingo’s model topic, the theoretical area is the most debated, demonstrating a weak relationship of this topic with practical areas, with only one publication with this topic in a practical area (health);
- In the “Other” area, the presence of Lean is highlighted in several areas of which there is a tendency for the adoption of these concepts [135], involving areas such as logistics, aerospace, agriculture and pharmaceuticals, among others.
7. Conclusions
7.1. Contributions
- The identification of the most and least discussed items related to lean, six sigma, lean six sigma and the Shingo’s model;
- The categorization of the literature according to the four topics (lean, six sigma, lean six sigma and the Shingo’s model), including its distribution by area of application and reporting its main conclusions;
- Highlighting the main effects of the tools identified in the literature and their relationship with the objectives of sustainable development;
- Proposing a conceptual model based on sustainability in order to achieve operational excellence.
7.2. Limitations
- Research was restricted to peer-reviewed publications;
- Publications came from scientific journals, discarding other sources of information such as dissertations, reports and theses;
- The Web of Science was the only data collection platform in this research, thus rejecting publications from this field of study that are on other platforms and that may have had a significant impact on data representation;
- The conceptual model was not subjected to empirical validation in a real case study.
7.3. Recommendations for Future Research
Author Contributions
Funding
Institutional Review Board Statement
Informed Consent Statement
Data Availability Statement
Acknowledgments
Conflicts of Interest
References
- Nandakumar, N.; Saleeshya, P.G.; Harikumar, P. Bottleneck identification and process improvement by lean six sigma DMAIC Methodology. Mater. Today Proc. 2020, 24, 1217–1224. [Google Scholar] [CrossRef]
- Garre, P.; Bharadwaj, V.V.S.N.; Shashank, P.S.; Harish, M.; Dheeraj, M.S. Applying lean in aerospace manufacturing. Mater. Today Proc. 2017, 4, 8439–8446. [Google Scholar] [CrossRef]
- Srinivasan, K.; Muthu, S.; Devadasan, S.R.; Sugumaran, C. Enhancement of sigma level in the manufacturing of furnace nozzle through DMAIC approach of Six Sigma: A case study. Prod. Plan. Control 2016, 27, 810–822. [Google Scholar] [CrossRef]
- Fercoq, A.; Lamouri, S.; Carbone, V. Lean/Green integration focused on waste reduction techniques. J. Clean. Prod. 2016, 137, 567–578. [Google Scholar] [CrossRef]
- Ruben, R.B.; Vinodh, S.; Asokan, P. Lean Six Sigma with environmental focus: Review and framework. Int. J. Adv. Manuf. Technol. 2018, 94, 4023–4037. [Google Scholar] [CrossRef]
- Teixeira, P.; Sá, J.C.; Silva, F.J.G.; Ferreira, L.P.; Santos, G.; Fontoura, P. Connecting lean and green with sustainability towards a conceptual model. J. Clean. Prod. 2021, 322, 129047. [Google Scholar] [CrossRef]
- Teixeira, P.; Sá, J.C.; Silva, F.J.; Santos, G.; Fontoura, P.; Coelho, A. Lean Contribution to the Companies’ Sustainability. IFIP Adv. Inf. Commun. Technol. 2021, 610, 400–408. [Google Scholar] [CrossRef]
- Silva, V.; Lima, V.; Sá, J.C.; Fonseca, L.; Santos, G. B Impact assessment as a sustainable tool: Analysis of the Certification Model. Sustainability 2022, 6, 5590. [Google Scholar] [CrossRef]
- Silva, F.J.G.; Sá, J.C.; Ferreira, L.P.; Santos, G.; Nogueira, M.C. The three pillars of sustainability and agile project management: How do they influence each other. Corp. Soc. Responsib. Environ. Manag. 2020, 19, 1–18. [Google Scholar] [CrossRef]
- Silva, F.J.G.; Gouveia, R.M. Cleaner Production—Toward a Better Future; Springer Nature Switzerland: Cham, Switzerland, 2020; ISBN 978-3-030-23164-4. [Google Scholar]
- Fonseca, L.; Silva, V.; Carlos, S.J.; Lima, V.; Santos, G.; Silva, R. B Corp versus ISO 9001 and 14001 certifications: Aligned, or alternative paths, towards sustainable development? Corp. Soc. Responsib. Environ. Manag. 2021, 29, 1–13. [Google Scholar] [CrossRef]
- Sreedharan, V.R.; Raju, R.; Rajkanth, R.; Nagaraj, M. An empirical assessment of Lean Six Sigma Awareness in manufacturing industries: Construct development and validation. Total Qual. Manag. Bus. Excell. 2018, 29, 686–703. [Google Scholar] [CrossRef]
- Kaswan, M.S.; Rathi, R.; Garza-Reyes, J.A.; Antony, J. Green lean six sigma sustainability—Oriented project selection and implementation framework for manufacturing industry sigma. Int. J. Lean Six Sigma 2022. [Google Scholar] [CrossRef]
- Yadav, V.; Gahlot, P.; Rathi, R.; Yadav, G.; Kumar, A.; Kaswan, M.S. Integral measures and framework for green lean six sigma implementation in manufacturing environment. Int. J. Sustain. Eng. 2021, 14, 1319–1331. [Google Scholar] [CrossRef]
- Jordan, E.; Kušar, J.; Rihar, L.; Berlec, T. Portfolio analysis of a Lean Six Sigma production process. Cent. Eur. J. Oper. Res. 2019, 27, 797–813. [Google Scholar] [CrossRef]
- Vinodh, S.; Arvind, K.R.; Somanaathan, M. Tools and techniques for enabling sustainability through lean initiatives. Clean Technol. Environ. Policy 2011, 13, 469–479. [Google Scholar] [CrossRef]
- Azevedo, J.; Sá, J.C.; Ferreira, L.P.; Santos, G.; Cruz, F.M.; Jimenez, G.; Silva, F.J.G. Improvement of production line in the automotive industry through lean philosophy. Procedia Manuf. 2019, 41, 1023–1030. [Google Scholar] [CrossRef]
- Rodrigues, J.; Sá, J.C.V.; Ferreira, L.P.; Silva, F.; Santos, G. Lean MANAGEMENT “Quick-Wins”: Results of Implementation. A case study. Qual. Innov. Prosper. 2019, 23, 3–21. [Google Scholar] [CrossRef] [Green Version]
- Dinis-Carvalho, J.; Monteiro, M.; Macedo, H. Continuous Improvement System: Team Members’ Perceptions; Springer: Berlin/Heidelberg, Germany, 2020; Volume 122. [Google Scholar]
- Dinis-Carvalho, J.; Moreira, F.; Bragança, S.; Costa, E.; Alves, A.; Sousa, R. Waste identification diagrams. Prod. Plan. Control 2015, 26, 1–13. [Google Scholar] [CrossRef]
- Arunagiri, P.; Gnanavelbabu, A. Identification of high impact lean production tools in automobile industries using weighted average method. Procedia Eng. 2014, 97, 2072–2080. [Google Scholar] [CrossRef] [Green Version]
- Balamurugan, R.; Kirubagharan, R.; Ramesh, C. Implementation of lean tools and techniques in a connecting rod manufacturing industry. Mater. Today Proc. 2020, 33, 3108–3113. [Google Scholar] [CrossRef]
- Salem, R.; Musharavati, F.; Hamouda, A.M.; Al-Khalifa, K.N. An empirical study on lean awareness and potential for lean implementations in Qatar industries. Int. J. Adv. Manuf. Technol. 2016, 82, 1607–1625. [Google Scholar] [CrossRef]
- Neves, P.; Silva, F.J.G.; Ferreira, L.P.; Pereira, T.; Gouveia, A.; Pimentel, C. Implementing lean tools in the manufacturing process of trimmings products. Procedia Manuf. 2018, 17, 696–704. [Google Scholar] [CrossRef]
- Shokri, A. Quantitative analysis of Six Sigma, Lean and Lean Six Sigma research publications in last two decades. Int. J. Qual. Reliab. Manag. 2017, 34, 598–625. [Google Scholar] [CrossRef]
- Satolo, E.G.; Hiraga, L.E.d.; Goes, G.A.; Lourenzani, W.L. Lean production in agribusiness organizations: Multiple case studies in a developing country. Int. J. Lean Six Sigma 2017, 8, 335–358. [Google Scholar] [CrossRef] [Green Version]
- Gomes, A.M.; Senna, P.; Monteiro, A.; Pinha, D. Study on techniques and tools used in lean healthcare implementation: A literature review. Braz. J. Oper. Prod. Manag. 2016, 13, 406–420. [Google Scholar] [CrossRef]
- Sivaraman, P.; Nithyanandhan, T.; Lakshminarasimhan, S.; Manikandan, S.; Saifudheen, M. Productivity enhancement in engine assembly using lean tools and techniques. Mater. Today Proc. 2020, 33, 201–207. [Google Scholar] [CrossRef]
- Vinodh, S.; Kumar, S.V.; Vimal, K.E.K. Implementing lean sigma in an Indian rotary switches manufacturing organization. Prod. Plan. Control 2014, 25, 288–302. [Google Scholar] [CrossRef]
- Peruchi, R.S.; Junior, P.R.; Brito, T.G.; Paiva, A.P.; Balestrassi, P.P.; Araujo, L.M.M. Integrating multivariate statistical analysis into six sigma DMAIC projects: A case study on AISI 52100 hardened steel turning. IEEE Access 2020, 8, 34246–34255. [Google Scholar] [CrossRef]
- Rahman, A.; Shaju, S.U.C.; Sarkar, S.K.; Hashem, M.Z.; Hasan, S.M.K.; Mandal, R.; Islam, U. A case study of six sigma define-measure-analyze-improve-control (DMAIC) methodology in garment sector. Indep. J. Manag. Prod. 2017, 8, 1309. [Google Scholar] [CrossRef] [Green Version]
- Yu, K.T.; Ueng, R.G. Enhancing teaching effectiveness by using the Six-Sigma DMAIC model. Assess. Eval. High. Educ. 2012, 37, 949–961. [Google Scholar] [CrossRef]
- Pereira, M.T.; Bento, M.I.; Ferreira, L.P.; Sá, J.C.; Silva, F.J.G. Using six sigma to analyse customer satisfaction at the product design and development stage. Procedia Manuf. 2019, 38, 1608–1614. [Google Scholar] [CrossRef]
- Baptista, A.; Silva, F.J.G.; Campilho, R.D.S.G.; Ferreira, S.; Pinto, G. Applying DMADV on the industrialization of updated components in the automotive sector: A case study. Procedia Manuf. 2020, 51, 1332–1339. [Google Scholar] [CrossRef]
- Stanivuk, T.; Gvozdenovic, T.; Mikulicic, J.Z.; Lukovac, V. Application of six sigma model on efficient use of vehicle fleet. Symmetry 2020, 12, 857. [Google Scholar] [CrossRef]
- Costa, T.; Silva, F.J.G.; Ferreira, L.P. Improve the extrusion process in tire production using Six Sigma methodology. Procedia Manuf. 2017, 13, 1104–1111. [Google Scholar] [CrossRef]
- Tenera, A.; Pinto, L.C. A Lean Six Sigma (LSS) project management improvement model. Sel. Pap. 27th Ipma Int. Proj. Manag. Assoc. 2014, 119, 912–920. [Google Scholar] [CrossRef] [Green Version]
- Cheng, C.Y.; Chang, P.Y. Implementation of the Lean Six Sigma framework in non-profit organisations: A case study. Total Qual. Manag. Bus. Excell. 2012, 23, 431–447. [Google Scholar] [CrossRef]
- Cabrita, M.d.R.; Domingues, J.P.; Requeijo, J. Application of Lean Six-Sigma methodology to reducing production costs: Case study of a Portuguese bolts manufacturer. Int. J. Manag. Sci. Eng. Manag. 2016, 11, 222–230. [Google Scholar] [CrossRef]
- de Mast, J.; Lokkerbol, J. An analysis of the Six Sigma DMAIC method from the perspective of problem solving. Int. J. Prod. Econ. 2012, 139, 604–614. [Google Scholar] [CrossRef]
- Girmanova, L.; Solc, M.; Kliment, J.; Divokova, A.; Miklos, V. Application of six sigma using DMAIC methodology in the process of product quality control in metallurgical operation. ACTA Technol. Agric. 2017, 20, 104–109. [Google Scholar] [CrossRef] [Green Version]
- Costa, L.B.M.; Filho, M.G.; Fredendall, L.D.; Paredes, F.J.G. Lean, six sigma and lean six sigma in the food industry: A systematic literature review. Trends Food Sci. Technol. 2018, 82, 122–133. [Google Scholar] [CrossRef]
- Indrawati, S.; Ridwansyah, M. Manufacturing continuous improvement using lean six sigma: An iron ores industry case application. Procedia Manuf. 2015, 4, 528–534. [Google Scholar] [CrossRef] [Green Version]
- Swarnakar, V.; Singh, A.R.; Tiwari, A.K. Evaluating importance of Critical Success Factors in successful implementation of Lean Six Sigma Framework. In Proceedings of the International Conference on Advances in Mechanical Engineering and Nanotechnology (ICAMEN), Manipal, Jaipur, India, 8–9 March 2019; Volume 2148. [Google Scholar] [CrossRef]
- da Silva, O.R.; Rosini, A.M.; Guevara, A.J.H.; Palmisano, A.; Venanzi, D. Lean six sigma: Multiple case study. Risus-J. Innov. Sustain. 2018, 9, 74–84. [Google Scholar] [CrossRef] [Green Version]
- Alexander, P.; Antony, J.; Cudney, E. A novel and practical conceptual framework to support Lean Six Sigma deployment in manufacturing SMEs. Total Qual. Manag. Bus. Excell. 2021, 1–31. [Google Scholar] [CrossRef]
- Alhuraish, I.; Robledo, C.; Kobi, A. A comparative exploration of lean manufacturing and six sigma in terms of their critical success factors. J. Clean. Prod. 2017, 164, 325–337. [Google Scholar] [CrossRef]
- Venanzi, D.; Faustino, D.L.; Silva, O.R.; Hasegawa, H.L. Lean Six Sigma—Multiple case study. Rev. Gestão Inov. Tecnol. 2017, 7, 4059–4073. [Google Scholar] [CrossRef] [Green Version]
- Gleeson, F.; Coughlan, P.; Goodman, L.; Newell, A.; Hargaden, V. Improving manufacturing productivity by combining cognitive engineering and lean-six sigma methods. Procedia CIRP 2019, 81, 641–646. [Google Scholar] [CrossRef]
- Kumar, P.; Singh, M.; Phull, G.S. Production lessening analysis of manufacturing unit in India: Lean Six Sigma perspective. J. Proj. Manag. 2019, 4, 281–290. [Google Scholar] [CrossRef]
- Toma, S.-G.; Marinescu, P. Business excellence models: A comparison. Proc. Int. Conf. Bus. Excell. 2018, 12, 966–974. [Google Scholar] [CrossRef] [Green Version]
- Wolniak, R. The level of maturity of quality management systems in Poland-Results of empirical research. Sustainability 2019, 11, 4239. [Google Scholar] [CrossRef] [Green Version]
- The Shingo Model—Shingo Institute—Home of the Shingo Prize. Available online: https://shingo.org/ (accessed on 27 June 2022).
- Kelly, S.; Hines, P. Discreetly embedding the Shingo principles of enterprise excellence at Abbott Diagnostics manufacturing facility in Longford Ireland. Total Qual. Manag. Bus. Excell. 2019, 30, 1235–1256. [Google Scholar] [CrossRef]
- Pakdil, F.; Leonard, K.M. The effect of organizational culture on implementing and sustaining lean processes. J. Manuf. Technol. Manag. 2015, 26, 725–743. [Google Scholar] [CrossRef]
- Edgeman, R. Routinizing peak performance and impacts via virtuous cycles. Meas. Bus. Excell. 2017, 21, 261–271. [Google Scholar] [CrossRef]
- Edgeman, R. Excellence models as complex management systems: An examination of the Shingo operational excellence model. Bus. Process Manag. J. 2018, 24, 1321–1338. [Google Scholar] [CrossRef]
- Leksic, I.; Stefanic, N.; Veza, I. The impact of using different lean manufacturing tools on waste reduction. Adv. Prod. Eng. Manag. 2020, 15, 81–92. [Google Scholar] [CrossRef] [Green Version]
- Palange, A.; Dhatrak, P. Lean manufacturing a vital tool to enhance productivity in manufacturing. Mater. Today Proc. 2021, 46, 729–736. [Google Scholar] [CrossRef]
- Rahani, A.R.; Al-Ashraf, M. Production flow analysis through Value Stream Mapping: A lean manufacturing process case study. In Procedia Engineering; Elsevier: Amsterdam, The Netherlands, 2012. [Google Scholar] [CrossRef] [Green Version]
- Wahab, A.N.A.; Mukhtar, M.; Sulaiman, R. A conceptual model of lean manufacturing dimensions. Procedia Technol. 2013, 11, 1292–1298. [Google Scholar] [CrossRef] [Green Version]
- Hodge, G.L.; Ross, K.G.; Joines, J.A.; Thoney, K. Adapting lean manufacturing principles to the textile industry. Prod. Plan. Control 2011, 237–247. [Google Scholar] [CrossRef]
- Panwar, A.; Nepal, B.P.; Jain, R.; Rathore, A.P.S. On the adoption of lean manufacturing principles in process industries. Prod. Plan. Control 2015, 26, 564–587. [Google Scholar] [CrossRef]
- Dănuţ-Sorin, I.R.; Opran, C.G.; Lamanna, G. Lean 4.0 dynamic tools for polymeric products manufacturing in Industry 4.0. Macromol. Symp. 2021, 396, 3–5. [Google Scholar] [CrossRef]
- Ramakrishnan, V.; Jayaprakash, J.; Elanchezhian, C.; Ramnath, B.V. Implementation of lean manufacturing in Indian SMEs-A case study. Mater. Today Proc. 2019, 16, 1244–1250. [Google Scholar] [CrossRef]
- Lu, J.C.; Yang, T. Implementing lean standard work to solve a low work-in-process buffer problem in a highly automated manufacturing environment. Int. J. Prod. Res. 2015, 53, 2285–2305. [Google Scholar] [CrossRef]
- Nallusamy, S.; Saravanan, V. Enhancement of overall output in a small scale industry through VSM, line balancing and work standardization. Int. J. Eng. Res. Africa 2016, 26, 176–183. [Google Scholar] [CrossRef]
- Dresch, A.; Veit, D.R.; de Lima, P.N.; Lacerda, D.P.; Collatto, D.C. Inducing Brazilian manufacturing SMEs productivity with Lean tools. Int. J. Product. Perform. Manag. 2019, 68, 69–87. [Google Scholar] [CrossRef]
- Poves-Calderno, I.G.; Ramirez-Mendoza, J.A.; Nunez-Ponce, V.H.; Alvarez-Merino, J.C. Application of lean manufacturing techniques in a Peruvian plastic company. In Proceedings of the 2019 IEEE International Conference on Industrial Engineering and Engineering Management (IEEM), Macao, China, 15–18 December 2019; pp. 546–550. [Google Scholar] [CrossRef]
- Mor, R.S.; Bhardwaj, A.; Singh, S.; Sachdeva, A. Productivity gains through standardization-of-work in a manufacturing company. J. Manuf. Technol. Manag. 2019, 30, 899–919. [Google Scholar] [CrossRef]
- Realyvásquez-Vargas, A.; Flor-Moltalvo, F.J.; Blanco-Fernández, J.; Sandoval-Quintanilla, J.D.; Jiménez-Macías, E.; García-Alcaraz, J.L. Implementation of production process standardization—A case study of a publishing company from the SMEs Sector. Processes 2019, 7, 2019. [Google Scholar]
- Wolak, E.; Jones, C.; Leeman, J.; Madigan, C. Improving throughput for patients admitted from the emergency department: Implementation of a standardized report process. J. Nurs. Care Qual. 2020, 35, 380–385. [Google Scholar] [CrossRef]
- Cantini, A.; de Carlo, F.; Tucci, M. Towards forklift safety in a warehouse: An approach based on the automatic analysis of resource flows. Sustainability 2020, 12, 8949. [Google Scholar] [CrossRef]
- Gladysz, B.; Santarek, K.; Lysiak, C. Dynamic spaghetti diagrams. A case study of pilot RTLS implementation. Adv. Intell. Syst. Comput. 2018, 637, 238–248. [Google Scholar] [CrossRef]
- Frosini, F.; Miniati, R.; Cecconi, G.; Dori, F.; Iadanza, E.; Vezzosi, S.; Mechi, M.T.; Belardinelli, A. Lean thinking in hospital: Case study at the pathology laboratory. IFMBE Proc. 2015, 45, 613–616. [Google Scholar] [CrossRef]
- Burroni, L.; Bianciardi, C.; Romagnolo, C.; Cottignoli, C.; Palucci, A.; Fringuelli, F.M.; Biscontini, G. Jacopo Guercini Lean approach to improving performance and efficiency in a nuclear medicine department. Clin. Transl. Imaging 2021, 9, 129–139. [Google Scholar] [CrossRef]
- Jessome, R. Improving patient flow in diagnostic imaging: A case report. J. Med. Imaging Radiat. Sci. 2020, 51, 678–688. [Google Scholar] [CrossRef] [PubMed]
- Pitapurapu, R.; Gupta, A.; Maly, K.; Nadeem, T. Dead reckoning with smartphone. Sensors 2015, 1, 206–217. [Google Scholar] [CrossRef]
- Mahajan, M.; Chistopher, K.B.; Harshan; Prasad, H.C.S. Implementation of lean techniques for sustainable workflow process in Indian motor manufacturing unit. Procedia Manuf. 2019, 35, 1196–1204. [Google Scholar] [CrossRef]
- Yang, J.X.; Hunt, T.D.; Ting, H.H.; Henderson, D.; Finkelstein, J.; Davidson, K.W. Improving value-add work and satisfaction in medical residents training: A Resident-Led quality improvement project employing the lean method to improve hospital supply usage. Postgrad. Med. J. 2017, 93, 193–197. [Google Scholar] [CrossRef]
- Tanco, M.; Santos, J.; Rodriguez, J.L.; Reich, J. Applying lean techniques to nougat fabrication: A seasonal case study. Int. J. Adv. Manuf. Technol. 2013, 68, 1639–1654. [Google Scholar] [CrossRef]
- Alfraih, M.M. Productivity and performance improvement in the medical records department of a hospital an application of Lean Six Sigma. Electron. Libr. 2016, 34, 1–5. [Google Scholar]
- Rekha, R.S.; Periyasamy, P.; Nallusamy, S. An optimized model for reduction of cycle time using value stream mapping in a small scale industry. Int. J. Eng. Res. Africa 2016, 27, 179–189. [Google Scholar] [CrossRef]
- Skeldon, S.C.; Simmons, A.; Hersey, K.; Finelli, A.; Jewett, M.A.; Zlotta, A.R.; Fleshner, N.E. Lean methodology improves efficiency in outpatient academic uro-oncology clinics. Urology 2014, 83, 992–998. [Google Scholar] [CrossRef]
- Cheah, C.K.; Prakash, J.; Ong, K.S. An integrated OEE framework for structured productivity improvement in a semiconductor manufacturing facility. Int. J. Product. Perform. Manag. 2020, 69, 1081–1105. [Google Scholar] [CrossRef]
- Pacheco, D.A.D.; Heidrich, G.D.G. Revitalising the setup reduction activities in Operations Management. Prod. Plan. Control 2021. [Google Scholar] [CrossRef]
- Pereira, A.M.H.; Silva, M.R.; Domingues, M.A.G.; Sá, J.C. Lean six sigma approach to improve the production process in the mould industry: A case study. Qual. Innov. Prosper. 2019, 23, 103–121. [Google Scholar] [CrossRef] [Green Version]
- Domingo, R.; Aguado, S. Overall environmental equipment effectiveness as a metric of a lean and green manufacturing system. Sustainability 2015, 7, 9031–9047. [Google Scholar] [CrossRef] [Green Version]
- Sharma, R.K.; Sharma, R.G. Integrating six sigma culture and TPM framework to improve manufacturing performance in SMEs. Qual. Reliab. Eng. Int. 2014, 30, 745–765. [Google Scholar] [CrossRef]
- Gregorio, J.O.R. A case study of an integrated manufacturing performance measurement and meeting system. J. Manuf. Technol. Manag. 2015, 26, 515–535. [Google Scholar]
- Sabadka, D.; Molnar, V.; Fedorko, G.; Jachowicz, T. Optimization of production processes using the Yamazumi Method. Adv. Sci. Technol. Res. J. 2017, 11, 175–182. [Google Scholar] [CrossRef] [Green Version]
- Cannas, V.G.; Pero, M.; Pozzi, R.; Rossi, T. Complexity reduction and kaizen events to balance manual assembly lines: An application in the field. Int. J. Prod. Res. 2018, 56, 3914–3931. [Google Scholar] [CrossRef]
- Czifra, G.; Szabó, P.; Mĺkva, M.; Vaňová, J. Lean principles application in the automotive industry. Acta Polytech. Hung. 2019, 16, 43–62. [Google Scholar] [CrossRef]
- Yılmaz, F.; Demirel, F.; Zaim, S.; Sevim, S. Assembly line balancing by using axiomatic design principles: An application from cooler manufacturing industry. Int. J. Prod. Manag. Eng. 2020, 8, 3143. [Google Scholar] [CrossRef]
- Kumar, D.V.; Mohan, G.M.; Mohanasundaram, K.M. Lean tool implementation in the garment industry. Fibres Text. East. Eur. 2019, 27, 19–23. [Google Scholar] [CrossRef]
- Chan, C.O.; Tay, H.L. Combining lean tools application in kaizen: A field study on the printing industry. Int. J. Product. Perform. Manag. 2018, 67, 45–65. [Google Scholar] [CrossRef]
- Salonitis, K.; Tsinopoulos, C. Drivers and barriers of lean implementation in the Greek manufacturing sector. Procedia CIRP 2016, 57, 189–194. [Google Scholar] [CrossRef] [Green Version]
- Kafuku, J.M. Factors for effective implementation of lean manufacturing practice in selected industries in Tanzania. Procedia Manuf. 2019, 33, 351–358. [Google Scholar] [CrossRef]
- Eswaramoorthi, M.; Kathiresan, G.R.; Prasad, P.S.S.; Mohanram, P.V. A survey on lean practices in Indian machine tool industries. Int. J. Adv. Manuf. Technol. 2011, 52, 1091–1101. [Google Scholar] [CrossRef]
- Maalouf, M.M.; Zaduminska, M. A case study of VSM and SMED in the food processing industry. Manag. Prod. Eng. Rev. 2019, 10, 60–68. [Google Scholar] [CrossRef]
- Jiménez, E.; Tejeda, A.; Pérez, M.; Blanco, J.; Martínez, E. Applicability of lean production with VSM to the Rioja wine sector. Int. J. Prod. Res. 2012, 50, 1890–1904. [Google Scholar] [CrossRef] [Green Version]
- Acero, R.; Torralba, M.; Pérez-Moya, R.; Pozo, J.A. Value stream analysis in military logistics: The improvement in order processing procedure. Appl. Sci. 2020, 10, 106. [Google Scholar] [CrossRef] [Green Version]
- Singh, J.; Singh, H. Application of lean manufacturing in automotive manufacturing unit. Int. J. Lean Six Sigma 2020, 11, 171–210. [Google Scholar] [CrossRef]
- Cavdur, F.; Yagmahan, B.; Oguzcan, E.; Arslan, N.; Sahan, N. Lean service system design: A simulation-based VSM case study. Bus. Process Manag. J. 2019, 25, 1802–1821. [Google Scholar] [CrossRef]
- Garza-Reyes, J.A.; Romero, J.T.; Govindan, K.; Cherrafi, A.; Ramanathan, U. A PDCA-based approach to Environmental Value Stream Mapping (E-VSM). J. Clean. Prod. 2018, 180, 335–348. [Google Scholar] [CrossRef]
- Dominguez-Alfaro, D.; Mendoza-Muñoz, I.; Montoya-Reyes, M.I.; Navarro-González, C.R.; Cruz-Sotelo, S.E.; Vargas-Bernal, O.Y. Ergovsm: A new tool that integrates ergonomics and productivity. J. Ind. Eng. Manag. 2021, 14, 552–569. [Google Scholar] [CrossRef]
- Salvador, R.; Barros, M.V.; Santos, G.E.T.D.; van Mierlo, K.G.; Piekarski, C.M.; de Francisco, A.C. Towards a green and fast production system: Integrating life cycle assessment and value stream mapping for decision making. Environ. Impact Assess. Rev. 2021, 87, 106519. [Google Scholar] [CrossRef]
- Alvandi, S.; Li, W.; Schönemann, M.; Kara, S.; Herrmann, C. Economic and environmental value stream map (E2VSM) simulation for multi-product manufacturing systems. Int. J. Sustain. Eng. 2016, 9, 354–362. [Google Scholar] [CrossRef]
- Brown, A.; Amundson, J.; Badurdeen, F. Sustainable value stream mapping (Sus-VSM) in different manufacturing system configurations: Application case studies. J. Clean. Prod. 2014, 85, 164–179. [Google Scholar] [CrossRef]
- Santos, D.L.d.; Giglio, R.; Helleno, A.L.; Campos, L.M.S. Environmental aspects in VSM: A study about barriers and drivers. Prod. Plan. Control 2019, 30, 1239–1249. [Google Scholar] [CrossRef]
- Gholami, H.; Jamil, N.; Zakuan, N.; Saman, M.Z.M.; Sharif, S.; Awang, S.R.; Sulaiman, Z. Social Value Stream Mapping (Socio-VSM): Methodology to Societal Sustainability Visualization and Assessment in the Manufacturing System. IEEE Access 2019, 7, 131638–131648. [Google Scholar] [CrossRef]
- Carmignani, G. Scrap value stream mapping (S-VSM): A new approach to improve the supply scrap management process. Int. J. Prod. Res. 2017, 55, 3559–3576. [Google Scholar] [CrossRef]
- Gupta, A.; Sharma, P.; Malik, S.C.; Agarwal, N.; Jha, P.C. Productivity improvement in the chassis preparation stage of the amplifier production process: A DMAIC six sigma methodology. Int. J. Reliab. Qual. Saf. Eng. 2016, 23, 1–14. [Google Scholar] [CrossRef]
- Gandhi, S.K.; Sachdeva, A.; Gupta, A. Reduction of rejection of cylinder blocks in a casting unit: A six sigma DMAIC perspective. J. Proj. Manag. 2019, 4, 81–96. [Google Scholar] [CrossRef]
- Lucato, W.C.; Vieira, M.; Santos, J.C.D. Eco-Six Sigma: Integration of environmental variables into the Six Sigma technique. Prod. Plan. Control 2015, 26, 605–616. [Google Scholar] [CrossRef]
- Rahman, A.; Shaju, S.U.C.; Sarkar, S.K. Application of Six-Sigma using define measure analyze improve control (DMAIC) methodology in garment sector. Indep. J. Manag. Prod. 2018, 9, 810–826. [Google Scholar] [CrossRef] [Green Version]
- Antony, J.; Scheumann, T.; Sunder, V.M.; Cudney, E.; Rodgers, B.; Grigg, N.P. Using Six Sigma DMAIC for Lean project management in education: A case study in a German kindergarten. Total Qual. Manag. Bus. Excell. 2021. [Google Scholar] [CrossRef]
- Yadrifil, A.A.; Septyanti, A.M.; Rus, M. Implementation of lean-DMAIC method for reducing packing defect in a flour company. AIP Conf. Proc. 2020, 2227, 040014. [Google Scholar] [CrossRef]
- Kansal, J.; Singhal, S. Application and validation of DMAIC Six-Sigma tool for enhancing customer satisfaction in a government R&D organization. Int. J. Qual. Res. 2017, 11, 931–944. [Google Scholar] [CrossRef]
- De Pinto, J.; Schuwarten, L.A.; de Junior, G.C.; Novaski, O. Proposal the application of DMAIC tools and Value Stream Mapping under the perspective of the Lean phylosophy for process improvement: A case study. Braz. J. Oper. Prod. Manag. 2017, 14, 556–566. [Google Scholar] [CrossRef] [Green Version]
- Tampubolon, S.; Purba, H.H. Lean six sigma implementation, a systematic literature review. Int. J. Prod. Manag. Eng. 2021, 9, 125–139. [Google Scholar] [CrossRef]
- Chiarini, A.; Bracci, E. Implementing Lean Six Sigma in healthcare: Issues from Italy. Public Money Manag. 2013, 33, 361–368. [Google Scholar] [CrossRef]
- Leite, D.G.; Montesco, R.A.E.; Sakuraba, C.S. Increasing a gas distributor net profit through Lean Six Sigma. Qual. Eng. 2018, 30, 359–370. [Google Scholar] [CrossRef]
- Vinodh, S.; Gautham, S.G.; Ramiya, R.A. Implementing lean sigma framework in an Indian automotive valves manufacturing organisation: A case study. Prod. Plan. Control 2011, 22, 708–722. [Google Scholar] [CrossRef]
- Tran, T.-A.; Luu-Nhan, K.; Ghabour, R.; Daroczi, M. The use of Lean Six-Sigma tools in the improvement of a manufacturing company—Case study. Prod. Eng. Arch. 2020, 26, 30–35. [Google Scholar] [CrossRef]
- Nedra, A.; Nejib, S.; Yassine, C.; Morched, C. A new Lean Six Sigma hybrid method based on the combination of PDCA and the DMAIC to improve process performance: Application to clothing SME. Ind. Text. 2019, 70, 447–456. [Google Scholar] [CrossRef]
- Hardy, D.L.; Kundu, S.; Latif, M. Productivity and process performance in a manual trimming cell exploiting Lean Six Sigma (LSS) DMAIC—A case study in laminated panel production. Int. J. Qual. Reliab. Manag. 2021, 38, 1861–1879. [Google Scholar] [CrossRef]
- Verma, N.; Sharma, V.; Badar, M.A. Entropy-based lean, energy and six sigma approach to achieve sustainability in manufacturing system. Arab. J. Sci. Eng. 2021, 46, 8105–8117. [Google Scholar] [CrossRef] [PubMed]
- Kaswan, M.S.; Rathi, R. Investigating the enablers associated with implementation of Green Lean Six Sigma in manufacturing sector using Best Worst Method. Clean Technol. Environ. Policy 2020, 22, 865–876. [Google Scholar] [CrossRef]
- Alhuraish, I.; Robledo, C.; Kobi, A. Assessment of lean manufacturing and six sigma operation with decision making based on the analytic hierarchy process. IFAC-PapersOnLine 2016, 49, 59–64. [Google Scholar] [CrossRef]
- Alnadi, M.; McLaughlin, P. Critical success factors of Lean Six Sigma from leaders’ perspective. Int. J. Lean Six Sigma 2021. [Google Scholar] [CrossRef]
- Timans, W.; Antony, J.; Ahaus, K.; van Solingen, R. Implementation of Lean Six Sigma in small- and medium-sized manufacturing enterprises in the Netherlands. J. Oper. Res. Soc. 2012. [Google Scholar] [CrossRef]
- Stankalla, R.; Koval, O.; Chromjakova, F. A review of critical success factors for the successful implementation of Lean Six Sigma and Six Sigma in manufacturing small and medium sized enterprises. Qual. Eng. 2018, 30, 453–468. [Google Scholar] [CrossRef]
- Gnanaraj, S.M.; Devadasan, S.R.; Murugesh, R.; Sreenivasa, C.G. Sensitisation of SMEs towards the implementation of Lean Six Sigma-an initialisation in a cylinder frames manufacturing Indian SME. Prod. Plan. Control 2012, 23, 599–608. [Google Scholar] [CrossRef]
- Silva, F.J.G.; Ferreira, L.P. Lean Manufacturing: Implementation, Opportunities and Challenges; Nova Science Publishers: New York, NY, USA, 2019; ISBN 978-1-53615-725-3. [Google Scholar]
- Silva, S.; Sá, J.C.; Silva, F.J.G.; Ferreira, L.P.; Santos, G. Lean Green—The importance of integrating environment into lean philosophy—A case study. Lect. Notes Netw. Syst. 2020, 122, 211–219. [Google Scholar] [CrossRef]
- Teixeira, P.; Coelho, A.; Fontoura, P.; Sá, J.C.; Silva, F.J.G.; Santos, G.; Ferreira, L.P. Combining lean and green practices to achieve a superior performance: The contribution for a sustainable development and competitiveness—An empirical study on the Portuguese context. Corp. Soc. Responsib. Environ. Manag. 2022, 1–17. [Google Scholar] [CrossRef]


| Dimensions | Guiding Principles |
|---|---|
| Cultural Enablers | Respect each individual |
| Lead with humility | |
| Continuous Improvement | Seek perfection |
| Adopt scientific thinking | |
| Focus on processes | |
| Ensuring quality at the source | |
| Improve flow and pull | |
| Enterprise Alignment | Thinking systematically |
| Create continuity of purpose | |
| Create value for the customer |
| Clusters | Items |
|---|---|
| Cluster 1 (17 items) | Automation, availability, competitive advantage, green lean, infrastructure, lean, lean six sigma, maintenance, manager, SMEs, operational excellence, PDCA, production cost, reliability, rework, commitment of top management, training; |
| Cluster 2 (14 items) | ANOVA, “Capability”, cost, DMAIC, effect analysis, effect diagram, FMEA, inefficiencies, product defect, product quality control, sigma level, sigma method, sigma design, variance; |
| Cluster 3 (11 items) | Production line, kaizen, kanban, lead time, line balancing, production rate, takt time, waste reduction techniques, labor standardization, workstation, yamazumi; |
| Cluster 4 (11 items) | Environment, flow, inventory, layout, lean principle, lean thinking, movements, productivity, spaghetti, staff, time; |
| Cluster 5 (10 items) | Culture, efficiency, environmental management, lean production, lean production system, organizational culture, organizational performance, production system, sustainability, work; |
| Cluster 6 (8 items) | Bottleneck, customer satisfaction, inventory management, lean manufacturing, lean philosophy, OEE, SIPOC, logistics chain; |
| Cluster 7 (8 items) | Energy, innovation, non-value, Sus-VSM, sustainable manufacturing, VSM, variation, waste; |
| Cluster 8 (7 items) | Business excellence, continuous improvement, leadership, management, Pareto analysis, quality management, responsibility; |
| Cluster 9 (6 items) | Time set-up, human factor, SMED, technology, worker, workforce; |
| Cluster 10 (4 items) | Cycle time, OEE, project management, value chain; |
| Cluster 11 (4 items) | Industry, manufacturing, Socio-VSM, value; |
| Topic | Publications | Total |
|---|---|---|
| Lean | [2,4,16,17,18,21,22,23,26,27,28,58,59,60,61,62,63,64,65,66,67,68,69,70,71,72,73,74,75,76,77,78,79,80,81,82,83,84,85,86,87,88,89,90,91,92,93,94,95,96,97,98,99,100,101,102,103,104,105,106,107,108,109,110,111,112] | 67; 54% |
| Six Sigma | [3,30,31,32,33,35,40,41,113,114,115,116] | 12; 9% |
| Lean Six Sigma | [1,5,12,14,15,24,25,29,34,36,37,38,39,42,43,44,45,46,47,48,49,50,117,118,119,120,121,122,123,124,125,126,127,128,129,130,131,132,133,134] | 40; 32% |
| Shingo Model | [51,52,54,55,56,57] | 6; 5% |
| Authors | Application Area | Description |
|---|---|---|
| [66] | Manufacturing | In this work, the focus was on the implementation of the Work Standardization tool on a production line. The implementation of the tool resulted in a 37.5% decrease in work at one of the workstations and an increase of 304.7% for the daily income at the workstation that was the bottleneck of the production line. |
| [67] | Car industry | Labor Standardization was applied in several operations of the production line, resulting in a decrease in cycle time by 350 s and reducing setup time by 1500 s. Working procedures were built and placed on all machines in the line; therefore, they were easily accessible to all operators. |
| [70] | Manufacturing | In this work, the focus was on the Standardization of the Work of a manufacturing company in India, resulting in a decrease of 31.6 s in product cycle time and a production increase to 58 parts that initially floated around 45–50 parts in a 7 h shift. It should be noted that production improvements were achieved without the need for investment in machines or tools by the company. |
| [71] | Printing Shop | In this work, the focus was on optimizing resources in a small printing shop in order to be able to satisfy requests. To this end, a study was conducted on the times of the processes, the movements of the operators and the respective layout of the production process, identifying sources of waste and opportunities for improvement. Finally, Work Standardization occurred with the help of Process Charts and visual help of the execution of operations, allowing for a reduction in unnecessary movements by 66%, and the standard time on the workstation decreased from 244 to 199 s for each product, increasing the production rate by 63.2% as well. |
| [72] | Health | In this work, the focus was on improving the processing efficiency of patients in a hospital’s emergency department. In order to reduce patient waiting times, two tools were developed that allowed for the standardization of the admission processes of patients in the hospital. After the implementation of the tools, the admission time decreased from 154 to 144 min, although it did not significantly improve the time of admission, but it improved the patients’ transfer times (from 30.5 to 21.7 min) and the time required to receive or deliver medical reports (from 3.8 to 2.8 min). Thus, there was a significant improvement in the flow of patients. |
| [68] | Manufacturing | In this work, the focus was on the implementation of a methodology developed by the author for micro and small enterprises that allowed for the improvement of the OEE index of an operation. After an initial analysis, a set of lean tools was recommended to correct inefficiencies. The practical case presented demonstrated that, after observing the data, availability was the main cause of overall efficiency loss. When applying the Pareto diagram, it was observed that the change in tools was the highest stopping time. The application of SMED was suggested, and, after its implementation, a significant increase in the availability of the machine was observed, increasing the OEE from a range between 70% to 75% to an interval between 81% to 85%. |
| [69] | Plastic Extrusion | In this work, the focus was to increase the efficiency of an extrusion process of a company in the plastic industry. After the collection and analysis of the process data, it was found that the main cause of the low OEE indicator was the long downtime without producing. To this end, an innovative proposal was developed that involved the use of SMED and preventive maintenance techniques. For the validation of this model, arena simulation software was used to analyze what results this model may lead to, showing that the proposals could result in a reduction in non-productive times by 36.67% and an improvement in the OEE by 9.02%. |
| [85] | Semiconductor industry | In this work, the author developed an innovative model that allows for a systematic approach to improve the OEE of a system, a framework that incorporates the advantages of OEE with conventional improvement models. It was validated with a 38-week study case by a semiconductor company in Malaysia. The production system had a low OEE of 73.4%, caused by the loss of availability (76.5%). The application of the model developed by the author resulted in an improvement of the OEE and availability to 76.5% and 80%, respectively. In financial terms, it resulted in savings of about 565,000 USD for each conversion of the production line. It should be noted that this model was subject to a single case study. Therefore, it is necessary to test it in different scenarios to prove its robustness. |
| [86] | Manufacturing | The authors developed a method capable of combining SMED with preset systems (tool anticipation or device adjustments) in order to improve the productivity of production systems. It was validated with a study case in the industry that allowed the following results to be recorded: an 87% reduction in the setup times of the bottleneck resource (labelling machine), a 33.8% increase in the OEE of the labelling machine, a 17% increase in the OEE of the production line and a 45% reduction in lot size. |
| [87] | Machining | In this work, the objective was to improve the OEE of the CNC machines of a company of the mold industry in Portugal. Initially, they had an OEE value of about 50%. Through the application of tools such as 5S, SMED, Visual Management and Work Standardization, it was possible to improve the performance of the machines. Overall, the OEE was improved by about 20%. |
| [88] | Pipe Manufacturing | In this work, the authors highlighted the importance of a new indicator capable of combining OEE and Sustainability. This new indicator was designated as Overall Environmental Equipment Effectiveness (OEEE). In order to assess its impact, the authors conducted a case study at a pipe manufacturing company. By analyzing the application of this indicator on a production line, it concluded that the raw material of the product analyzed would have to be replaced by another one in order to comply with the sustainability requirements. Other modifications were also performed, such as the elimination of excessive stocks of raw materials and increased flexibility of the production line (from 2301 to 685 s for the production time of the first part in the line) in order to respond in a timely manner to the customer’s needs. With these changes, the cost of production decreased by 6.2%, highlighting the company’s increased competitiveness with respect to price, flexibility and sustainability. |
| [89] | Cellulose | The authors developed an integrated model based on six sigma and TPM in order to improve the performance indicators of the production systems. The model was applied in a manufacturing cell consisting of two machines from a pulp company. The goal of the study was achieved with the application of multiple tools, such as Brainstorming Sessions, Pareto Diagram, Ishikawa Diagram, histograms, FMEA and control charts, among others. At the end of the project, there was a significant improvement in the OEE, which was in a range between 50% and 54% for a range between 76% to 83%, also reducing rework from 22% to 10% and the defect rate from 24.82% to 5%, leading to financial savings of around 2 million USD per year. |
| [90] | Car industry | In this work, the focus was on the integration of the production teams linked to an assembly system with the measuring system performance indicators in real time. The validation of this system took place in a factory of the automotive industry in Spain. The goal of this system was to focus the organization on value chains and to improve their performance based on the OEE. The system provided real-time OEE values from value chains and allowed production teams to use meetings to discuss and improve the provided indicators. Thus, greater relevance was directed to key points that had a critical impact on production volume. The solution presented allowed for a significant improvement of OEE values in general between 5 and 10% from January 2009 to January 2012 in the case study. It should be noted that this model has been validated with only one practical case. It is necessary to test it in different scenarios to prove its veracity. |
| [100] | Food industry | In this work, there was a lean implementation in a food company with the help of two tools (SMED and VSM). VSM allowed for the identification of the different wastes associated with the production line (84% of the total production). Then, with the help of SMED, it was possible to reduce setup times by 34% and to promote an increase in line productivity by 11%, allowing the company to avoid the use of temporary workers in periods of high demand. |
| [101] | Food industry | In this work, there was a lean implementation in a set of companies in the wine sector. VSM was used as the main tool for the determination of waste and points of improvement for the production process. From the VSM information, some tools were selected that were capable of solving the problems found. In the end, it was possible to reduce the lead time between 50% and 65% and to induce a reduction in raw materials between 8% and 16%. |
| [102] | Logistics | In this work, the focus was on improving the logistics processes of a military unit. VSM and VSD (Value Stream Design) served as the basic tools for improving the processing of item orders, allowing for eliminating or reducing activities that did not add value and improved order processing procedures. The results that were obtained in a simulation showed that the “future state map” could allow for increases in activities that add value, from 44% to 70%, and a reduction in lead time of 69.6% was achieved. |
| [103] | Car industry | In this work, the focus was on improving the productivity of a production line of an automobile company. For this, VSM and the simulation approach were adopted to validate the improvements. It was observed that it was possible to reduce cycle time by 87.59%, to reduce WIP inventories by 76.47%, to reduce lead time by 95.41%, to reduce the number of operators by 57.14% and to reduce setup times by 70.67%. |
| [104] | Services | In this work, the focus was on improving the efficiency of services provided by a maintenance team and repairing buildings of a public university. VSM was used as a basis for the identification of waste and improvement points. Then, the simulation was used to validate the proposals. The changes made, based on the simulation, allowed for a reduction in lead time by 26.8% and a reduction in waiting times by 33.6%. This case highlights the increased difficulties of implementing lean concepts in the area of services. However, they can be implemented and provide very good results. |
| [36] | Theory | In this work, a VSM model focused on sustainability was used, designating it as Sus-VSM. It emerged with the emergence of sustainable manufacturing systems. The particularity of this model is that, in addition to evaluating the classic VSM metrics such as cycle time, lead time and material cost, it also analyzes a set of metrics related to the environment and the social environment. For example, it analyzes chemical consumption, water consumption, energy consumption, noise level and the ergonomics of jobs. Thus, the future state map is not only aimed at improving the product and process flow, but it also improves environmental performance and work conditions. |
| [128] | Theory | In this work, a VSM model focused on energy was developed. The authors’ model was designated as Lean Energy Six Sigma Value Stream Mapping (LESSVSM) and was based on Energy Value Stream Mapping (EVSM). It has emerged to combat waste existing in the energy area. It evaluates consumption along the manufacturing system chain and identifies foci where consumption can be eliminated or managed more efficiently. The design of the future state map from this model aims to achieve sustainable manufacturing by reducing energy and waste costs, increasing efficiency in their jobs. |
| [16] | Theory | In this work, a model was proposed that integrates the Eco-Function Matrix with VSM. The process starts with the construction of the current state map in which it identifies and categorizes waste. Areas classified as more critical are configured as requirements in the Eco-Function Matrix. Brainstorming sessions are then held building proposals and improvements that can be designated as attributes. Then, the conventional Procedure of QFD (Quality Function Deployment) begins to consider the environmental perspective in the construction of the matrix and its interrelationships. Finally, the waste and proposals for improvements is ordered as a priority; therefore, the construction of the future state map is one of the most important topics. |
| [18] | Theory | In this work, a model designated as Variability Source Mapping (VSMII) is proposed, with a focus on the identification and reduction in variability throughout the production system. The construction steps are similar to the classic VSM model, but it adds some details, such as the mean, standard deviation and coefficient of variation of the cycle time for each job. It also assesses the variability of the flow on arrival between jobs or phases, developing a system variability metric that is able to identify the most critical locations or jobs with variability levels. With the help of lean tools and control production policies, it is possible to build a future state map that allows for the reduction or elimination of the sources of variability, thus decreasing the variability level of the system |
| [105] | Theory | In this work, the authors provide a new approach capable of incorporating the PDCA (Plan–Do–Check–Act) methodology with environmental VSM (E-VSM). This is an alternative proposal capable of improving the environmental performance of operations using principles, techniques and lean tools. Reductions in energy consumption and waste production are some of the environmentally analyzed wastes with great focus on E-VSM. The PDCA approach allows for a systematic methodology in the elaboration of the current state map and future state map. According to the author, the main focus of this model is for industrialists who intend to achieve environmentally sustainable operations. |
| [106] | Theory | In this work, the author presents a new tool called Ergo-VSM, based on the VSM methodology and incorporating ergonomic indicators related to the physical and psychological factors of workers. The goal is to improve the ergonomic conditions of workers without compromising the classic productivity indicators. The inclusion of factors related to the physical environment of workers, such as noise, temperature and luminosity, can affect not only the health of workers but also their own performance. Therefore, this tool can also have a positive effect on productivity. |
| [107] | Construction | In this work, the authors propose a new model based on the integration of LCA (Life Cycle Assessment) and VSM, called LCA-VSM, a tool capable of prioritizing measures that improve economic and environmental performance, encouraging a continuous process improvement approach. The model was validated by a construction company that produces paint materials and tools, providing a reduction between 5% and 15% in environmental impact (across nine environmental categories), reducing lead time from 103.26 to 24.01 days and promoting a reduction in cycle time from 35.7 to 33.75 s. |
| [108] | Theory | In this work, the authors provide a model capable of modeling VSM from an economic and environmental perspective. The methodology is called E^2-VSM. It is a simulation model that considers the dynamic behavior of a multi-product production system and assesses its environmental impact, such as energy consumption. The model also evaluates the financial and environmental performance of each of the manufactured products. The goal is to optimize the machines, production orders and production parameters that lead to the best solution through energy efficiency and resources for a production system. |
| [109] | Multisector | This work shows the practicality of Sus-VSM. Three cases of studies demonstrating their applicability in different areas of industry are presented. It enables improvement in the ratio of activities with added value (such as the classic VSM model) as well as the improvement of environmental and social indicators. At the environmental level, for example, reductions in energy consumption, water consumption and raw materials consumption were achieved. At the social level, for example, workers’ exposure to ergonomic hazards and risks in the workplace were also reduced. |
| [111] | Electronics | This paper presents a new methodology called Socio-VSM, the objective of which is to incorporate environmental and social indictors in order to accelerate the transition to sustainable manufacturing. For the validation of this methodology, a case study was carried out by an electronics company in Malaysia. Indicators such as noise level, ergonomic workstation conditions and classical productivity indicators were evaluated. On the basis of these indicators, changes were made to reduce the risk of injury or occupational disease by workers by reducing noise exposure and ergonomic changes in jobs. At the environmental and economic level, no changes were made to the production system. |
| [112] | Car industry | This paper presents a new methodology called scrap value stream mapping (S-VSM), a tool that allows for the mapping and identification of scrap and its costs throughout the process chain, from which it is possible to act with lean tools in order to attenuate the volume of scrap and generate potential savings. The validation of this tool was achieved with a case study by an automotive company, in which savings of €44,782 were possible in the following years if the volume of plastic waste remained at the same level in 2015. |
| [79] | Car industry | In this work, the focus was on minimizing the sources of waste resulting from the transport of raw materials in a manufacturing plant. With the spaghetti diagram, inefficiencies were identified with respect to layout and transport, allowing for optimizing the distances traveled from raw materials in the factory from 152 km to 117 km per year. With respect to time consumed in material transports, a decrease from 67 h to 30.1 h per year was achieved. |
| [80] | Health | In this work, the focus was on improving the satisfaction of patients in a hospital through the standardization of drug logistics processes. By applying the spaghetti diagram, it was possible to optimize the routes of the medicine cart and thus decrease the travel times through the hospital. About 92% of patients reported that, after the intervention in the cart routes, the medications were provided in less time. In addition, the application of the 5S in the cart allowed for reductions in the time spent in the search for drugs from 50.8 s to 30.2 s per unit. |
| [81] | Feed | In this work, the focus was on the application of lean philosophy in a food industry factory. A spaghetti diagram allowed for the tracking of worker movements and identifying unnecessary movements that could be eliminated, from which it was possible to redesign the layout, and there was a reduction from 6 m to 2 m of distance traveled by the workers for each cycle of time. Other tools such as VSM, OEE and Job Balancing were applied in the project. Overall, productivity increased by around 40%. |
| [82] | Health | In this work, the focus was on the application of lean six sigma in the medical records department of a hospital. Several tools were used, including a spaghetti diagram, from which it was possible to record the patterns of movement in the work area under study and to identify unnecessary movements between various points of the department. A new layout was designed to minimize movements and delays. The study resulted in a decrease in the processes, on average, from 19 to 8 min. Overall, the project allowed the hospital to save about 20,000 USD in human resources and fixed costs related to the hospital’s bureaucratic processes. |
| [83] | Car industry | In this work, the objective was to improve the productivity of a seating factory in the automotive industry through the lean methodology. Several tools were used in the project. The spaghetti diagram allowed for the study of the layout, cycle times and movements of the workers. This work led to outlining a new layout proposal that allowed for reducing the number of workstations from 6 to 5, the cycle time from 807 to 697 s and the movements of the workers for each seat produced on the line from 15 to 9.6 m. |
| [84] | Health | In this work, the focus was on improving efficiency and quality in the provision of medical care in the urology department of a hospital with lean methodology. Data such as patient volume, waiting times, cycle times and the movements of physicians were collected with the help of a spaghetti diagram. As result of that work, it was possible to reduce the average cycle time per patient from 46 to 41 min in a period of 90 days. In addition, it allowed for reductions in waiting times and increases in the available contact time between the doctor and the patient from 7.5 to 10.6 min. The time of added value in the patient’s visits to the hospital increased, in proportion, from 30.6% to 66.3% at the end of the 90-day period. |
| [91] | Car industry | Through the Yamazumi tool, it was possible to analyze three jobs and identify sources of waste. Improvements were made with respect to job design and the sequence of operator activities, allowing for the value of the takt time imposed on the assembly line to be fulfilled. |
| [94] | Manufacturing | In this work, the objective was to improve the efficiency of an assembly line of a refrigerator factory in Turkey. With Yamazumi’s help, the situation presented was analyzed, resulting in improved productivity from 118 units to 155 units per shift. The number of operators was reduced from 32 to 28. The average idle time of the operators dropped from 155 s to 70 s. |
| [95] | Textile | In this work, the focus was on improving the efficiency of a production line of a textile factory. Yamazumi and 5S were the tools selected for process analysis. The improvement proposals were designed and implemented, resulting in a 34% decrease in production cycle time and a 32% decrease in time without added value. The application of the 5S was crucial for the increase in the line efficiency by 12.5%; therefore, human resources were well-used. |
| [96] | Graphic | In this work, two practical cases related to two departments of a printing press are presented. The first case was carried out on a line of the production department. Standardization of Work and Yamazumi were the tools chosen to increase productivity. Line balancing was achieved with a reduction in the variation of waste throughout the processes, allowing for decreases in the number of workers from 17 to 15. The bottleneck operation of the production line was optimized to increase production from 16.3 copies per hour to 21.3 copies per hour. The second practical case was carried out in the packaging department. Line balancing was achieved by reducing movement times and reducing material flow distances through changes in layout organization. The bottleneck of the production line was also optimized, and some manual operations were eliminated, resulting in increased productivity from 22 boxes per hour to 25 boxes per hour. |
| [64] | Polymer industry | In this work, the authors describe the adaptation of a lean production system for Industry 4.0. The practical case, which took place in a polymer industry organization, consisted in the development of a Poka-Yoke tool through a sensor system, which was able to manage the interactions between the physical components and the corresponding manufacturing processes, thus communicating instructions and corrections through block functions. Lean 4.0 tools can interact with the production database and can be updated depending on the scenario, making Lean 4.0 tools dynamic, intelligent and flexible, and ensuring compliance with lean principles, organization objectives, the elimination of waste and increased productivity and value creation for the customer. |
| [2] | Aerospace | In this work, the focus was on production in an aerospace company. First, the layout was identified, and the operations in the production lines were sequenced. Through observation, it was possible to reconfigure the layout to reduce transport times and to improve the production flow. With the 5S tool application, a more organized system was constituted, reducing movements and waits and also eliminating inventory and unnecessary materials in the production line. A worker was added at one of the stations to decrease wait times. Work standardization was also crucial to increase efficiency in addition to promoting a better work environment. These changes resulted in increased productivity and decreased cycle times of operations. |
| [65] | Multisector | In this work, the application of lean techniques in small and medium-sized enterprises in India is analyzed. Nine manufacturing units were subjected to the lean program, which lasted about 18 months. Depending on the diagnosis performed in each manufacturing unit, an improvement project was developed using tools such as VSM, 5S, Kaizen and SMED. Overall, these projects achieved savings in the order of 9 million Rupees (official currency of India) and a reduction in the setup time from 135 min to 45 min, and more than 300 Kaizen measures were implemented, resulting in material savings, time and improved working conditions. Manufacturing units have managed to create jobs and compete with more attractive prices and higher quality. |
| [120] | Logistics | In this work, the focus was on optimizing the time spent by the product in logistics processes. With the application of DMAIC and VSM methodologies, and with the perspective of lean thinking, it was possible to identify foci of waste in order to improve the processes. VSM allowed for the understanding of the logic of flow in logistics and for the optimization of the times of the various processes identified by changing the current map state. The development and application of the future state map allowed for the achievement of reductions in lead time and reductions in processing time. |
| [36] | Manufacturing | In this work, the DMAIC methodology was applied together with the Sus-VSM approach, seeking to achieve sustainable manufacturing. Thus, not only was it possible to make improvements in the set of classical metrics of production management, but improvements in a set of environmental and social metrics were also achieved. The significant reduction in energy consumption and chemicals in the practical case that is presented must be highlighted. |
| Tool | Effect(s) | Impact Dimension | ||
|---|---|---|---|---|
| Economic | Environmental | Social | ||
| Standardized Work | Reduction in the workforce; Improvement in process productivity; Reduction in non-productive times; Reduction in workers’ movements; | ++ | ++ | |
| SMED | Improvement in process efficiency; Increased energy consumption; | + | - | |
| 5S | Improved organization and safety; Reduction in material consumption, movements, energy and waste; | ++++ | +++ | ++ |
| Visual Management | Improvement in process efficiency; Process control; | ++ | ||
| TPM | Improvement in process management; Reduction in non-productive times, rework and energy consumption; Prevention of mechanical problems; | +++++ | + | |
| VSM | Improvement in process efficiency; Identification and reduction in waste such as: the excessive use of raw materials, energy, waste, non-productive times, stocks and a reduction in the workforce; | +++++ | +++ | + |
| Sus-VSM | Reduction in the environmental and social impact of processes; Reduction in consumption of chemicals, water, energy and noise; Evaluation of ergonomic conditions; | +++ | ++++ | +++ |
| Socio-VSM | Assessment of risk factors for workers’ health and safety; | + | + | |
| S-VSM | Identification of and reduction in waste and scrap throughout the process chain; | ++ | ++ | |
| Spaghetti Diagram | Reduction in movements, transport and work; | +++ | ++ | |
| Yamazumi | Balancing jobs; Compliance of takt time; Improvement in process productivity; Reduction in the workforce; | ++++ | ||
| Poka-Yoke | Reduction in process inefficiencies; Reduction in energy consumption; | + | + | |
| Kaizen | Reduction in energy, waste and material consumption; | +++ | +++ | |
| Kanban | Improvement in the operational efficiency of the processes; Reduction in material consumption; | ++ | + | |
| LESSVSM | Reduction in waste related to energy consumption; | + | + | |
| VSM II | Identification and reduction in the variability of the production system; | + | + | |
| E-VSM | Identification and reduction in energy waste sources; | + | + | |
| Ergo-VSM | Evaluation of ergonomic conditions related to physical and psychological factors of workers; | ++ | ||
Publisher’s Note: MDPI stays neutral with regard to jurisdictional claims in published maps and institutional affiliations. |
© 2022 by the authors. Licensee MDPI, Basel, Switzerland. This article is an open access article distributed under the terms and conditions of the Creative Commons Attribution (CC BY) license (https://creativecommons.org/licenses/by/4.0/).
Share and Cite
Sá, J.C.; Reis, M.; Dinis-Carvalho, J.; Silva, F.J.G.; Santos, G.; Ferreira, L.P.; Lima, V. The Development of an Excellence Model Integrating the Shingo Model and Sustainability. Sustainability 2022, 14, 9472. https://doi.org/10.3390/su14159472
Sá JC, Reis M, Dinis-Carvalho J, Silva FJG, Santos G, Ferreira LP, Lima V. The Development of an Excellence Model Integrating the Shingo Model and Sustainability. Sustainability. 2022; 14(15):9472. https://doi.org/10.3390/su14159472
Chicago/Turabian StyleSá, José Carlos, Manuel Reis, José Dinis-Carvalho, Francisco J. G. Silva, Gilberto Santos, Luis P. Ferreira, and Vanda Lima. 2022. "The Development of an Excellence Model Integrating the Shingo Model and Sustainability" Sustainability 14, no. 15: 9472. https://doi.org/10.3390/su14159472