Article

Changes in Logistics Activities in Poland as a Result of the COVID-19 Pandemic

by
Tomasz Rokicki
1,*,
Piotr Bórawski
2,
Aneta Bełdycka-Bórawska
2,
András Szeberényi
3 and
Aleksandra Perkowska
1
1
Institute of Economics and Finance, Warsaw University of Life Sciences, 02-787 Warsaw, Poland
2
Faculty of Agriculture and Forestry, University of Warmia and Mazury in Olsztyn, 10-719 Olsztyn, Poland
3
Institute of Marketing, Budapest Metropolitan University, 1148 Budapest, Hungary
*
Author to whom correspondence should be addressed.
Sustainability 2022, 14(16), 10303; https://doi.org/10.3390/su141610303
Submission received: 30 July 2022 / Revised: 14 August 2022 / Accepted: 17 August 2022 / Published: 18 August 2022
(This article belongs to the Special Issue Economic and Social Consequences of the COVID-19 Pandemic)

Abstract

:
The main objective of this article is to identify the direction of change in logistical activities and their critical segments as a result of the COVID-19 pandemic in a country that is an important logistical hub of Europe. The specific objectives are to identify changes in logistical activities, especially during the COVID-19 pandemic, to determine the dynamics of changes in business revenues and in quantitative parameters for total logistics services and their segments during the pandemic, to establish the relationship between the economic situation and parameters related to logistics services, including during the COVID-19 pandemic. Using the method of purposive selection, Poland, which is well developed in logistics and aspires to be a crucial logistical hub of Europe, was selected for the study. The analysed period covered the years 2015–2021. The material sources were the literature on the subject and data from reports on individual logistics segments. Dynamic indicators with a fixed and variable base, coefficient of variation and Kendall’s tau correlation coefficient were used for analysis and presentation. It was found that the COVID-19 pandemic accelerated changes in logistics activities. These changes included digitalisation, the development of the e-commerce market, multi-channel sales and the development of these services, and the introduction of automation and artificial intelligence. In all activities, 2020 was the most challenging year, but there was generally a reduction in revenue growth and, less often, stagnation. Logistics companies gained in the second year of the pandemic (2021) when implemented solutions generated record revenues. Among the winning segments were logistics services in general, especially sea freight forwarding, warehousing services, courier services related to e-commerce, and a lesser extent, freight transport. Losses were incurred in the segment related to passenger transport. COVID-19 became a positive catalyst for change. The logistics industry ultimately benefited from the pandemic. Additionally, due to the pandemic, logistics operations have had greater sustainability, contributing to resource conservation and environmental protection.

1. Introduction

1.1. The Importance of Logistics for Business

Business activity is changing rapidly, which is mainly influenced by the increasing demands of consumers and the pervasive introduction of IT tools. The environment in which a company operates is very dynamic. It can also be said that the dynamics of these changes are accelerating. All this means that, in order to stay in the market and play a significant role in it, companies must change and use modern solutions [1,2,3,4]. One of the areas that are rapidly changing is logistics. It can happen mainly due to the function of this area of business activity and also because logistics plays a servant role in the core business activities of a company. Managers recognise the importance of logistics. In the case of reasonably uniform technology used by manufacturers, logistics is the one that can determine the success of a company [5,6,7]. The winner is the one who delivers the right product, in the correct quantity, in the proper condition, to the right place, at the right time, to the right customer, and at the right (appropriate) price. In this way, the logistical 7R principle is realised. In another approach, logistics can be defined as the management of phenomena and processes of the flow of goods based on an integrated view of them [8,9]. Logistics enables the efficient overcoming of time and space in realising the flow of goods. It has numerous interrelationships with many functional areas in a company, such as production, marketing, and accounting. From a practical point of view, transport and warehousing are the most important. Other types of services provided to companies and individual customers should not be forgotten either. Examples are just-in-time deliveries for manufacturing companies or courier services received by individual customers ordering products from online shops. Logistics is responsible for the proper functioning of goods supply chains, which are often global in nature [10,11,12]. Without well-functioning logistics, it would be impossible for the economy and society to function smoothly [13,14].

1.2. Importance and Functioning of Logistics during COVID-19

All sectors are connected by a complex network of supply chains and logistics. The importance of logistics for the smooth functioning of the economy is therefore very high. During the pandemic, expectations of logistics were high. Haren and Simchi-Levi [15] noted the significant impact of the COVID-19 outbreak on supply chain and production operations. The consequences were expected to be global in scope. According to Remko [16], emerging problems will be the search for innovative approaches to supply chain recovery. Chowdhury et al. [17] identified the main issues and studies that affected supply chains. These were: the impact of the COVID-19 pandemic on supply chain performance, resilience strategies for consequence management and chain recovery, the role of technology in implementing resilience strategies, and supply chain sustainability. According to Gunessee and Subramanian [18] and Paul and Chowdhury [19], the global reach of the pandemic means that it affected all nodes (supply chain members) and linkages in the supply chain simultaneously. According to Amankwah-Amoah [20], supply, transport, and production faced numerous challenges that reduced their efficiency. These included border closures, supply market blockages, disruptions in vehicle movements and international trade, labour shortages, and physical distance at production facilities. Xu et al. [21] showed that increasing supply chain resilience significantly reduces vulnerability under challenging times. The pandemic experience will also influence the shortening of supply chains through renewed strategies that increasingly focus on relocation and backshoring. Heidary [22], on the other hand, thought that improving capacity flexibility was one of the essential strategies that global supply chain managers should pursue. Choi [23] believed the logistics system is crucial in managing supply chain disruptions and restoration. Linton and Vakil [24] stated that weaknesses in global supply chains were exposed during a pandemic, resulting in lost revenue, demand, and unfulfilled supply. The situation is a lesson for embracing resilience and robustness in the supply chain to help businesses that lost out during the pandemic recover [25,26,27].

1.3. Changes in Logistics during COVID-19 in the Polish Market

The pandemic has caused parts of life to move online, such as shopping and using services. This situation has also caused changes on the supply side. There was a need to optimise processes, competition increased in the market, and many new online shops were created. In Poland, this was dominated by the food, multimedia, health and beauty, and home and garden industries. Optimising the delivery process and the possibility of using several sales channels became particularly important. The logistics of efficient and convenient delivery became crucial. Courier companies have introduced a parcel collection service without needing a signature, as well as cashless payments or the abandonment of cash on delivery [28]. The growth of the e-commerce market has led to an increasing interest in warehouse space and a search for more technologically advanced facilities that provide greater operational efficiency to keep up with consumer demand. The challenge has become the simultaneous management of several sales channels (Omnichannel), with different last-mile delivery solutions envisaged, such as PUDO (pick up, drop off) points, click and collect, or parcel machine networks [29]. Warehouses and storage facilities should be adapted to the increased demand for sorting and storage services. The reverse logistics and returns management processes are no less critical, for which additional or even dedicated warehouse facilities are often needed. The need for smaller storage facilities closer to city centres is reported. Such warehouses will allow customers’ expectations of same-day product delivery to be met [29]. Broken supply chains also drove demand for warehouses. In addition, logistics operators supported their partners operating in the same supply chain [30].
A noticeable direction of logistics change due to the pandemic was accelerated digitalisation. This change may have primarily influenced the increased revenue dynamics [31]. The simplest example is streamlining workflow processes and the possibility of remote handling. This mentioned example made it possible to operate despite not being able to run operations directly from the office [32]. Automating logistics processes has gained a vital role due to the growing demand for transport and warehousing services and the rapid growth of e-commerce. This is helped by using semi-automated order picking solutions that support employees in repetitive or complex activities, the robotisation of processes, or the extensive digitalisation of areas such as finance and warehouse operations. Some platforms automatically provide information to customers or present estimated delivery times. In addition, devices that measure shipments, autonomous or semi-autonomous forklifts, and ‘robotic’ arms or Internet of Things sensors are being implemented [33]. Automation also applies to returns processes. Integrating multiple IT systems minimises human labour, and the customer feels that returns are made easy and straightforward [34]. Pandemic has accelerated the implementation of many solutions, such as real-time supply chain visibility. These innovative solutions support the management of logistics processes and decision-making and help respond quickly to disruptions and dynamically changing situations in the global supply chain. Courier companies, on the other hand, have implemented a contactless delivery procedure and digitalised some stages of the process [35]. Before the pandemic, there were stages of digital transformation being implemented, namely the digitisation of processes, the use of cloud computing, and the implementation of cognitive technologies. The deployment of cognitive technologies is a stage of transformation that the recent crisis has accelerated. It can be honestly stated that there is no turning back from these technologies. Among cognitive technologies, artificial intelligence is essential. Robots support the following processes: logistics, planning, loading and unloading, and billing, quoting, invoicing, or customs documents. Software bots, which mimic the actions of users in IT systems, can work around the clock. They perform human work several times faster, without mistakes [36].

1.4. Justification, Aims, and Structure of the Article

The themes of the article are important and timely. Logistics is a key area of economic activity. Its importance increased especially during COVID-19. Other sectors depended on its efficiency. It is therefore important to determine how the COVID-19 pandemic affected logistics activities. Did it pose a major problem and cause a reversal of the positive growth trend in the industry? Alternatively, perhaps the problems have outgrown the logistics companies. In the first weeks of the pandemic, the pandemic certainly caused a surprise; as a rule, logistics companies were not prepared for such a shock. It was an action not foreseen in any of the forecasts. The occurrence of the pandemic worldwide was a particular problem. Of course, the impact varied from country to country and geographic region to geographic region. However, no one was immune from the effects of a pandemic. The scale and unpredictability of the phenomenon certainly had a significant impact on the situation and changes in logistics operations. Poland is a rapidly developing country. In addition, it has an excellent location, which means that many companies are locating their logistics and warehousing in Poland. Poland is the hub of Central and Eastern Europe, resulting in many logistics companies operating in the country, including those with a global reach. The conjuncture before the pandemic was very good. The changing playing field may also have caused changes in the logistics business. The new aspect of this article is the presentation of a comprehensive analysis of the impact of COVID-19 on logistics activities in one of the most important countries in Europe in terms of logistics. In addition, reference has been made to the most critical logistics segments, which makes it possible to show the outflow of the pandemic in different areas of logistics activities. A problem and limitation is the lack of comprehensive data available. Logistics activities are generally assessed as a whole, which somewhat limits the inference about the development of individual areas. The article uses several data sources, thus providing a comprehensive analysis. The literature review indicates that there is limited research in this area. To date, the authors have treated logistics activities as a whole or focused on a single segment (business area). The authors of this article have not encountered—so far—such a comprehensive study of logistics as a whole and its areas during the COVID-19 pandemic. It will be interesting to determine whether the development of logistics activities was halted during the COVID-19 pandemic and how it proceeded in individual segments. The above aspects make the research necessary and original. The article presented here may fill a research gap.
The article’s main objective is to identify the direction of change in logistics activities and their key segments due to the COVID-19 pandemic in a country that is an important logistics hub for Europe.
The specific objectives are:
  • Identifying changes in logistics activities, especially during the COVID-19 pandemic;
  • To determine the dynamics of change in business revenue and volume parameters for logistics services in general and its segments during the pandemic;
  • Establish a link between the economic situation and parameters related to logistics services, including during the COVID-19 pandemic.
The article formulates three research hypotheses:
Hypothesis 1.
The COVID-19 pandemic has accelerated changes in logistics operations, particularly at large logistics operators.
Hypothesis 2.
In Poland, revenue dynamics decreased in the first year of the COVID-19 pandemic, while revenue increased significantly in the second year as a result of adaptation measures.
Hypothesis 3.
The development of the logistics business in its various segments is closely linked to the economic situation.
The organisation of the work is as follows: Section 1 provides an introduction to the topic. The importance of logistics for economic activities and the course of the pandemic in Poland are presented. The impact of COVID-19 on various economic and social activities is shown, as well as the importance and changes in logistics as a result of the pandemic. This section also includes the rationale and objectives of the article. Section 2 proposes methods to identify changes in logistics activities in Poland. In Section 3, the research findings are presented. In Section 4, the reference is made to other research results that dealt with the relationships tested. Finally, Section 5 concludes this paper.

2. Materials and Methods

2.1. Data Collection, Processing, and Limitations

Poland was selected for the study, utilising a purposive selection method. It is one of the largest countries in the European Union, with an excellent geographical location in Europe. There are many global logistics companies in this country. Logistics is also developing rapidly. Poland already fulfils vital functions in Central and Eastern Europe and could become Europe’s most important logistics hub in the future. The research period covered the years 2015–2021. The adoption of such a period is substantively justified. By 2019, changes in logistics activities resulting from the normal functioning of the economy can be observed. In 2020, there was an economic crisis caused by the COVID-19 pandemic. The European continent was quite severely affected by COVID-19. The last year in which complete research data were available was 2021. In addition, it was the second year of the COVID-19 pandemic.
The data used in the study come from several sources. Logistics activities in Poland are not studied comprehensively by one unit. The results are scattered over several research units. Data collection is limited by the lack of detailed and up-to-date information on comprehensive logistics activities. Data are often not aggregated at the country level but relate to individual areas of logistics activity, so there is a problem in performing this type of analysis. The following data sources were used:
  • Rankings of TSL companies are published annually by Dziennik Gazeta Prawna (Dziennik Gazeta Prawna is a nationwide legal and economic journal published by the Polish company Infor Biznes. It is published five times a week, from Monday to Friday. Every year in June, Gazeta publishes the TSL Companies Ranking. The ranking of TSL companies is prepared on the basis of an on-line survey. Substantive supervision is carried out by the student—Warsaw School of Economics. In 2022, the 27th ranking was already published.). The ranking annually takes into account approximately 70 largest logistics companies in Poland. Including a company in the ranking is to have revenue from the core TSL activity of at least PLN 2 million (approx. EUR 450 thousand). This revenue should represent at least 51% of the total revenue for the company;
  • Reports on the Polish warehouse market published annually by AXI IMMO Group (AXI IMMO Group is a leader among Polish consulting companies providing comprehensive services on the commercial real estate market. One of the areas of activity is the creation of reports and publications on the commercial real estate market, including warehouse market. Reports of this kind have been produced since 2011.);
  • Reports on the state of the postal market published annually by the Office of Electronic Communications;
  • Yearbooks entitled Transport-activity results (Transport-activity results is publication containing basic data on the results of the transport sector activity. The aim of this publication is to present the aspects (economic and infrastructural) that determine the development of the sector and its operational activity. Reports have been published since 2002.) published annually by Statistics Poland.
In addition to the presented sources of numerical data, other sources were used concerning the results of research already carried out and the regularities occurring in the industry. Literature in the form of books, articles in scientific and popular magazines, industry reports, and articles in portals dealing with logistics topics was used.
The study is the result of the author’s previous research on logistics. More recently, the authors’ field of interest has been the impact of COVID-19 on the situation in various sectors of the economy. The two areas are closely linked as, without efficient logistics, the economy could not function smoothly during the pandemic. All the authors are economists. Therefore, an aspect related to economics was raised. In addition, attention was drawn to the lack of up-to-date scientific studies on the relationship between the functioning of logistics in Poland and economic development.

2.2. Applied Methods

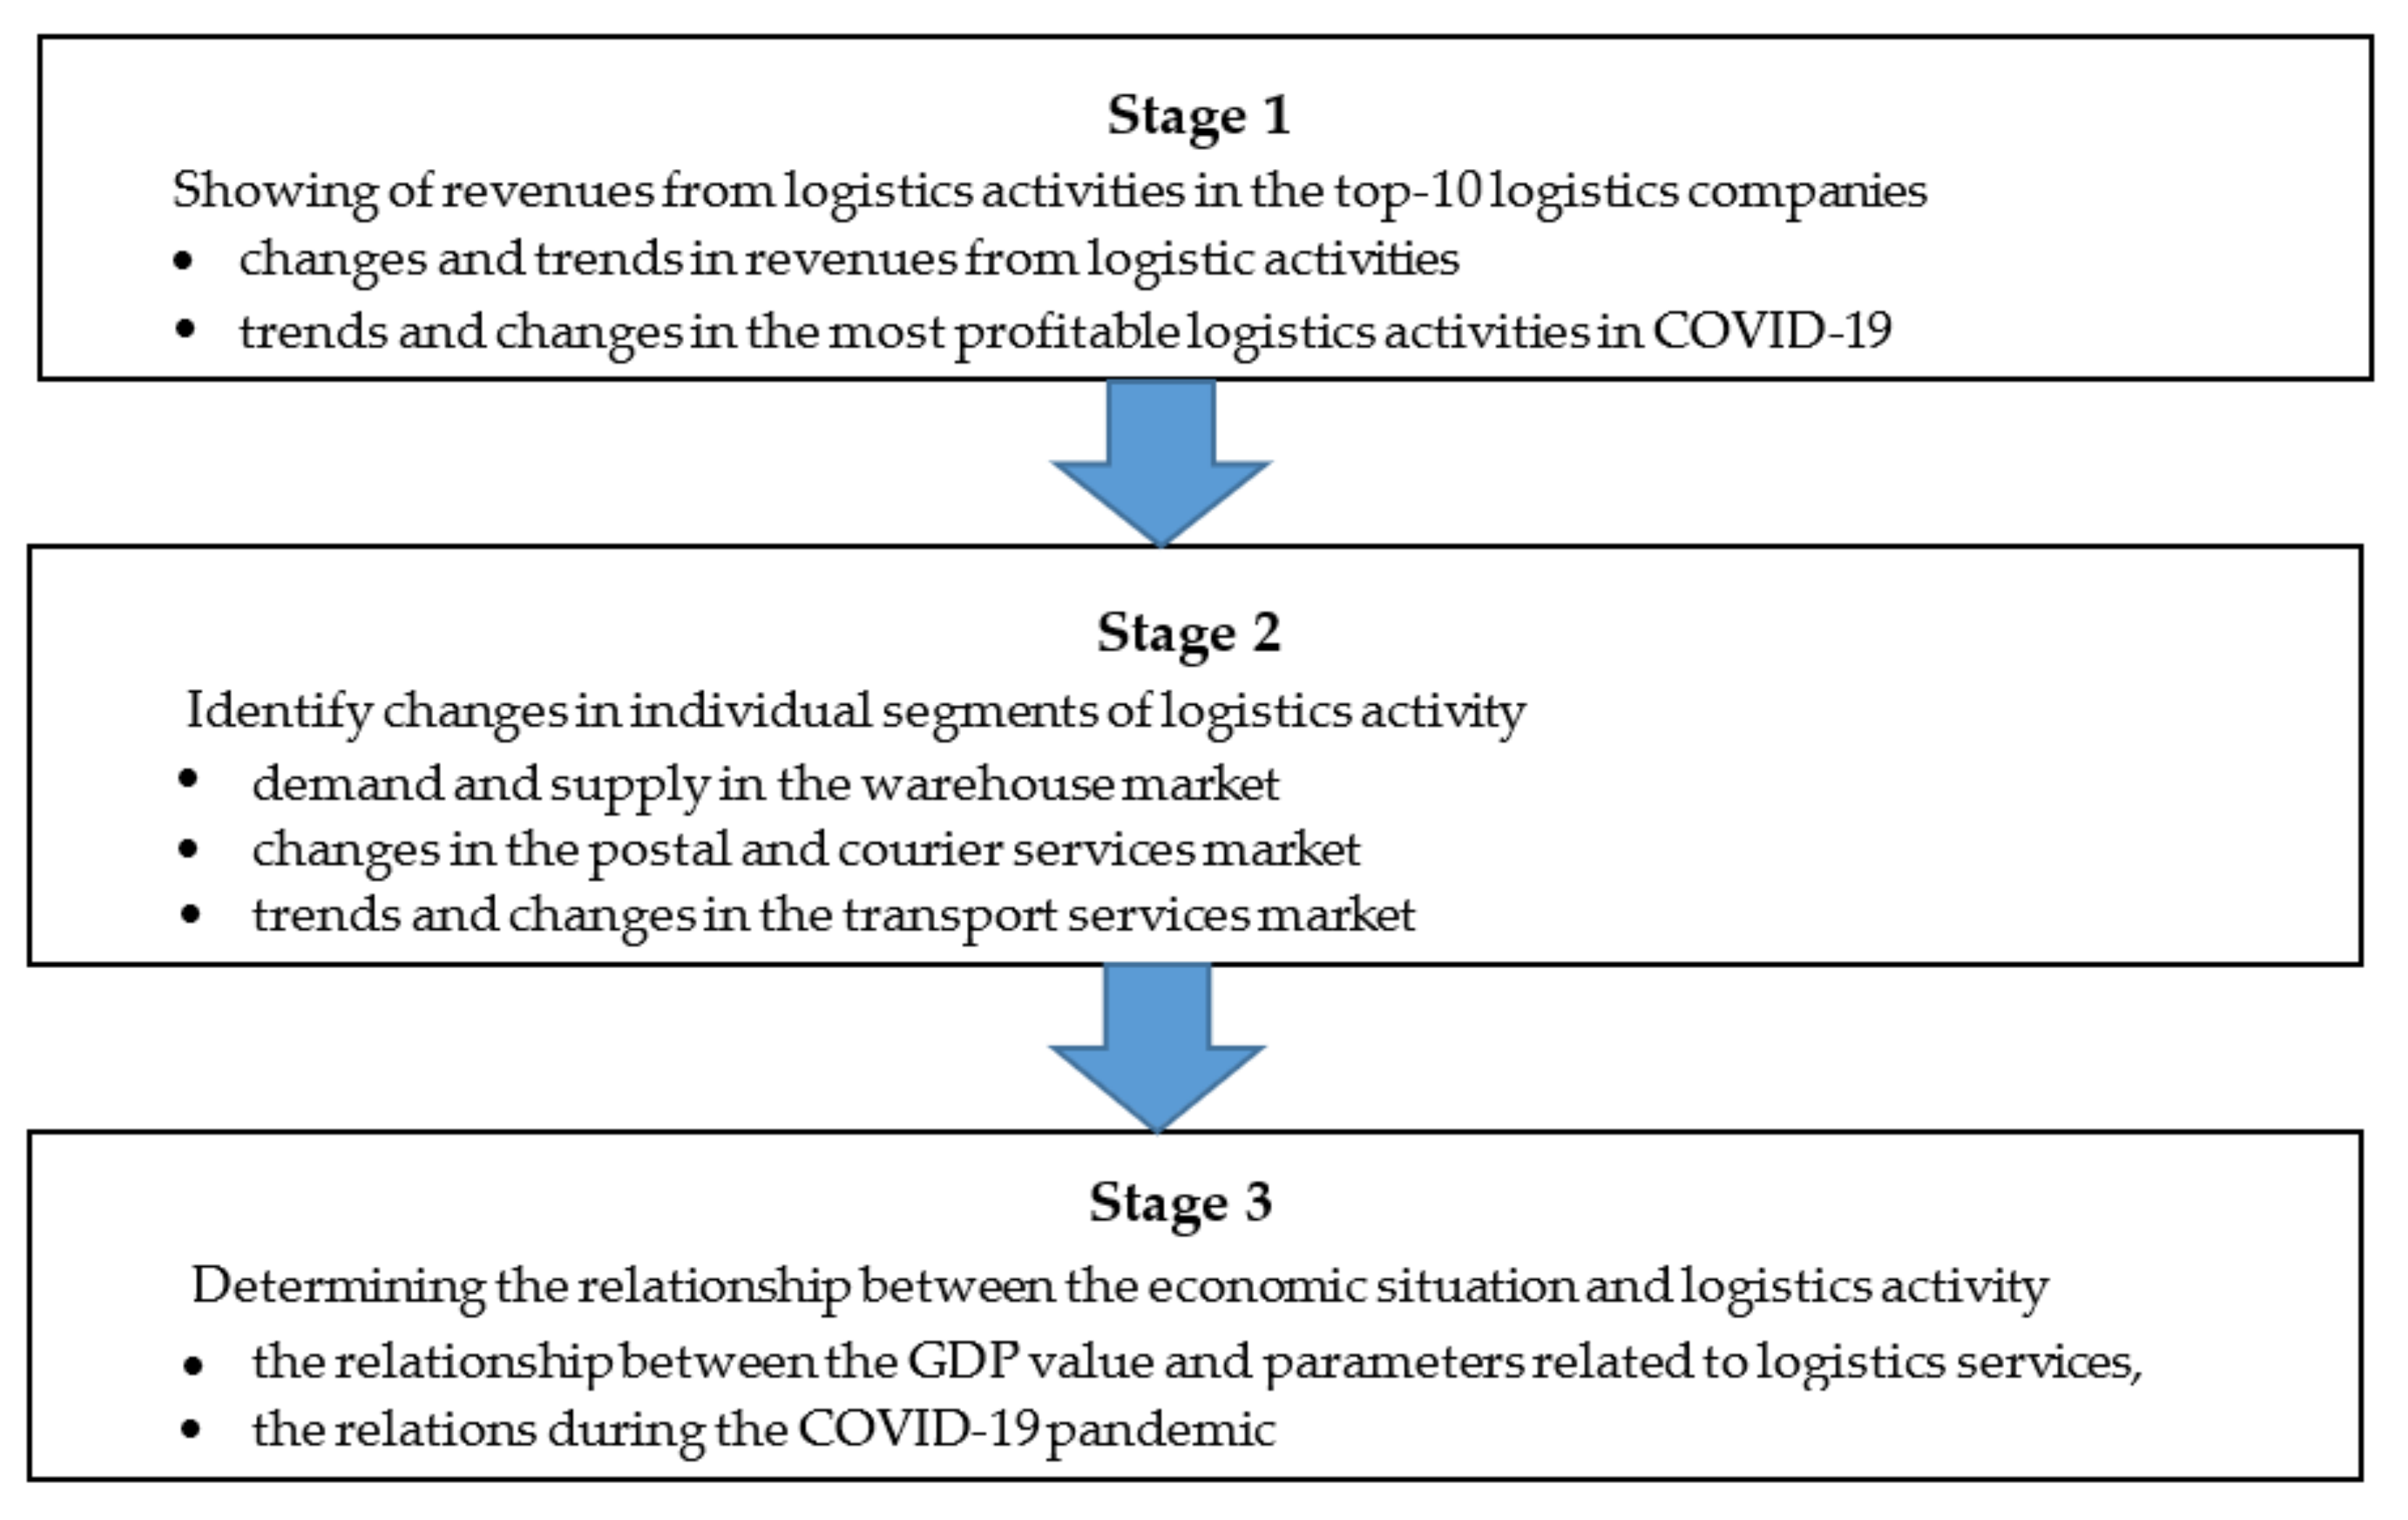
The research was divided into stages. Figure 1 shows a diagram of the conducted research.
The first stage of the research presented the situation in Poland before and during the COVID-19 pandemic (2015–2021) in terms of the top logistics companies’ revenues. Such data made it possible to identify changes in logistics activities. These changes can happen because the top companies set the direction of change and provide a barometer of the situation in the industry. For this purpose, chained and fixed-base dynamic indicators were used. The coefficients of variation were used to show the variability in individual periods. The analyses presented were supplemented by listing the top 10 companies in revenue dynamics in the years in question. In this case, it was possible to identify changes based on the fastest-growing companies. This also made it possible to compare the situation and growth opportunities before COVID-19 and during the pandemic. In addition, it was determined which logistics business segments developed best in the different periods. This section aimed to show the directions of change and the actual leaders in the logistics business in Poland in the period before and during the pandemic.
The second step of the research presents the results for the individual segments of the logistics services market. In the first step, the situation in the warehouse space market was shown, which was the segment particularly affected by the pandemic; however, the effects were positive. The focus was on the basic parameters related to the market, such as demand and supply and the most important indicators. Changes were shown through chained and fixed-base dynamic indicators. As a result, the directions and strength of the analysed variables were obtained. Fixed-base dynamics indicators were calculated for the three periods 2015–2019, 2015–2020, and 2015–2021. This will allow the impact of COVID-19 on changes in the first and second years of the pandemic to be determined. In a second step, postal services were addressed. Among these, courier services and postal parcels are the most important. Calculations were made for the dynamics of individual value and quantity parameters. As before, two dynamics indicators were used to determine the strength and direction of change, particularly during the COVID-19 period. This section additionally presents the structure of the services and their change over the years. The section also identifies the changes that have taken place in the market. The key logistics area, transport, was addressed in a third step. Similarly, research was carried out into the changes in the value of revenue generated, the number of transport work carried out, and the number of freight and passengers transported. Identical to the previous logistics business segments, two types of dynamic indicators were calculated. The patterns occurring, the strength, and directions of change in transport activity were identified. This way, comparisons were made between periods before and during the pandemic.
In this paper, the chain simple dynamic indicators were used as follows [37]:
i t , t 1 = y t y t 1 × 100
where:
  • yt—level of the phenomenon in a certain period,
  • yt−1—level of the phenomenon during one period earlier.
The dynamics indices with a constant base were used for the research too. The constant-based dynamics index has the following formula [37]:
i =   y n y 0   or   i =   y n y 0 × 100 %
where:
  • yn—the level of the phenomenon in a certain period,
  • y0—level of the phenomenon during the reference period.
The variation coefficient marked as Cv eliminates the assessment unit from the standard deviation of a set of digits. It is done by obtaining the quotient of standard deviation divided by the arithmetic mean. Formally, for the sequence of N numbers, the variation coefficient is calculated as follows [38]:
C v = S M
where:
  • S—standard deviation from the exemplar set of numbers,
  • M—arithmetic mean of the exemplar set of numbers.
The third stage of the research concerns the determination of the relationship between the value of GDP and changes in individual parameters concerning the logistics services market in general and its most important segments. The logistics parameters and indicators presented in the first and second stages of the research were used. A total of 28 parameters and indicators relating to logistics activities and their segments were used. For the economic situation, one parameter was used, i.e., GDP. Tests performed with other parameters concerning the economy (domestic demand, total consumption including households, value of exports and imports) gave similar results. Therefore, it was decided to present only the result for the value of GDP. The tests were performed for the three periods 2015–2019, 2015–2020, and 2015–2021. This will allow the impact of the pandemic on the results achieved to be determined. The logic for performing the tests for the different periods was the same as for the momentum indicators. The non-parametric test will make it possible to check the interdependencies that exist and answer the question: is logistics developing interdependently with the economy, or are there differences in this respect between segments of the logistics business? Of particular interest are the changes that have occurred due to the pandemic. With this study, it is possible to determine the importance of the parameters and the strength of their association with economic prosperity before and during the COVID-19 pandemic. In this project phase, a non-parametric test was applied to define the correlation between the variables. Kendall’s tau correlation coefficient was used. It is established on the difference between the probability that two variables fall in the same sequence (for the interpreted data) and the probability that these factors are different. This coefficient fluctuates in the range of values <−1, 1>. Value 1 means complete match, value 0 indicates no match of order, and value −1 indicates the complete opposite. The Kendall coefficient suggests not only the robustness but also the direction of the interdependence. It is a valuable tool for representing the similarity of the ordered data sets. The following formula can be used to calculate Kendall’s tau correlation coefficient [39]:
τ = P x 1 x 2 y 1 y 2 > 0 P x 1 x 2 y 1 y 2 < 0
where:
  • P x 1 x 2 y 1 y 2 > 0 —concordance probability, i.e., the probability that random variables X and Y move in one direction (increase or decrease),
  • P x 1 x 2 y 1 y 2 < 0 —the probability of nonconformity, i.e., the probability that the random variables X and Y move in the opposite direction.
The given formula evaluates Kendall’s tau based on a statistical sample. First, all possible pairs of the observed population are combined. Next, the pairs are split into three possible units:
P-compatible pairs, when the analysed factors within two observations fluctuate in the same trend, i.e., either in the first observation both are higher than in the second, or both are less significant,
Q-incompatible pairs, when the factors differ against each other in the opposite trend, i.e., one of them is more significant for this observation in the pair, while the other is smaller,
T-related pairs in the case of one of the variables having equal values in both observations.
The Kendall tau coefficient is then calculated from the following formula:
τ =   P Q P + Q T
Moreover,
P + Q + T =   N 2 =   N N 1 2
where:
  • N—sample volume.
The pattern can be quantified as:
τ =   2 P Q N N 1
Descriptive, tabular, and graphic methods were also used to present some of the findings.

3. Results

3.1. Impact of COVID-19 on Business Revenues at Top Logistics Companies in Poland

The first stage of the research shows the changes in the economic performance of the top 10 logistics companies in terms of revenue value in Poland. These companies set trends in the market and have been dominant for many years. Table 1 shows the dynamics of change in business revenue for the surveyed companies from 2015 to 2021, taking into account changes compared to the previous year. Blue indicates the three best performers in a given year, and red the three worst performers. These designations will also be used in subsequent tables. It turned out that the dominant companies were not the fastest growing at all. They had substantial total revenues, which did not allow for rapid growth. It was mainly the companies in the middle of the pile that grew fast. Taking into account the revenues across all companies in the top 10, they can be identified by the most and least favourable years. The best year was 2021, with an average growth rate of 51%, and the worst year was 2020, with a growth rate of 10% concerning the previous year. These were the years with the COVID-19 pandemic, with only FM Logistics experiencing a decrease in revenue in 2020. In contrast, record revenue growth was achieved in 2021, the largest at VGL Solid Group Sp. z o.o. and Rhenus Group, for which there was a doubling of business revenue. Overall, the industry’s situation and logistics revenue growth dynamics were great.
The changes in the revenue dynamics of the top logistics companies in the three periods 2015–2019, 2015–2020, and 2015–2021 were then collated, allowing the impact of COVID-19 on the economic situation of the companies in 2020–2021 to be seen (Table 2). In all the periods studied, practically the same companies were among the leaders in revenue dynamics and the outsiders. Thus, it can be concluded that among the top companies, the pandemic did not disrupt the existing balance of power. On the other hand, particularly in the last period covering 2021, a considerable increase in revenue was evident. Disparities have widened. Two companies can be mentioned that increased their revenues fivefold between 2015 and 2021. At the same time, some companies achieved only a few tens of per cent higher revenues. It would be necessary to determine what factors influenced this. Was it specialisation in certain types of logistics services? Or were companies developing specific solutions and modern tools that were more competitive? Indeed, the research results indicate that logistics companies did not lose from the pandemic and even gained. The more difficult year was 2020, which required adaptation to the new conditions; in addition, during this time, some sectors of the economy were under lockdown, which also impacted the revenues achieved. The year 2021 was very successful and was characterised by the best performance in the period under review.
A comparison of the coefficient of variation for the top logistics companies’ business revenues was also made (Table 3). The highest volatility was for the fastest-growing companies and the lowest for those with the lowest growth rate. The same companies were repeated as in Table 2. Note the increase in variability in the period, including 2021. At that time, there was a massive increase in revenue for most logistics companies, which also increased the coefficient of variation. Undoubtedly, 2021 was a very favourable year for logistics companies. The coefficients of variation for the years 2015–2019 and 2015–2020 were at a very similar level, meaning that 2020 did not stand out significantly and fit the pattern of average revenue growth for logistics companies.
In terms of the value of revenue generated, the best logistics companies are not necessarily the most innovative and fastest growing. Their advantage comes from their accumulated capital, resources, signed contracts and good industry reputations. Often, small and innovative companies can grow faster, e.g., by introducing innovative solutions to the market or by seizing a particular moment in the market, an opportunity to make a lot of money at a given time. Therefore, the results obtained should be complemented by ranking the logistics companies with the highest growth rate in business revenues. Again, the ten companies with the highest revenue growth were selected (Table 4). It turns out that there was a very high turnover in this respect. It was difficult for companies to maintain a fast business revenue growth rate. Investments were needed, which, in addition to being capital intensive, also took time. As a result, only a few companies were ranked for several years. Examples include: LANGOWSKI LOGISTICS Sp. z o.o. (five times in the ranking), DONE Deliveries Sp. z o.o. Sp. k., MKW Suchecki Sp. z o.o. (three times each), Abakus Logistics Sp. z o.o, Omida Group, Optima Logistics Group S.A., ID Logistics Polska S.A., Optima Logistics Group S.A. (two times each). The given comparison shows that only a few companies managed to achieve very high excesses of business revenues in several years. In the top 10 companies, the lowest dynamics were achieved in 2019–2018, i.e., immediately before COVID-19. In the first year of the pandemic, companies grew at a rate similar to 2015–2018. In 2021, the best results were achieved, as the average business revenue growth for the top 10 companies was 125%. Additionally, the core logistics activities that guaranteed high revenue growth changed during the pandemic. Between 2015 and 2019, road transport and road forwarding dominated. In 2020, warehousing services (due to the increase in e-commerce) and air logistics gained additional importance. In 2021, on the other hand, the most significant increase in revenue was due to sea freight forwarding. The reason for this was the very high demand for this type of service and the several-fold increase in the rates offered by shipowners for the transport of containers. Thus, the pandemic caused a change in the needs, prices, and profitability of the various logistics services. Gains were made by companies offering services that were limited at the time and became very necessary, such as sea freight forwarding, as well as air freight forwarding and warehousing services.

3.2. Changes in Storage Services in Poland during the Pandemic

The next stage of the research looked at warehouse services. It was determined whether there had been major changes in this area. Firstly, the dynamics of changes in the demand and supply of warehouse space were examined by year (Table 5). Immediately before the pandemic, poor results were achieved for most of the parameters related to rental demand for warehouse space. In 2019, the total available warehouse space rental share was 21.51%. The vacancy rate of 6.5% was also high. The year 2020 was characterised by a solid increase in demand for warehouse space, which was not kept up with the supply. The reason for this was the transfer of trade to the internet. Demand for warehouse space increased. It was reported by small and medium-sized shops that, to survive in the market, they had to open up sales online. However, the greatest demand was generated by large companies that had stationary and online sales but had to move virtually all their business to the internet during the pandemic. After the first shock in 2020, the total supply of warehouse space increased by 26% in 2021. Gross rental demand, however, increased even more, by 31%. At the same time, warehouse space under contract increased by 150%. These include projects developed by developers but also on behalf of specific companies, which are self-storage facilities. In 2021, the rental share of total warehouse space rose to 26.36%, with the vacancy share falling to 3.72%. It can therefore be concluded that the pandemic has influenced a surge in demand for warehousing services. It seems that this trend may slow down in the coming years. However, some companies will develop their business online. Many customers have become convinced of online shopping and will more often substitute traditional shopping in this way.
Confirmation of the regularities occurring is provided by comparing the dynamics of changes in demand and supply for warehousing services in the three periods of 2015 (Table 6). A decline in the new supply of warehouse space was achieved in 2020. The market was not prepared for such high demand; thus, this was compensated for in the following year. The same was true for warehouses under construction. Increased demand resulted in new warehouse space, but not until 2021. This increment could happen because investment in warehouse facilities takes time.

3.3. Impact of COVID-19 on Postal Services in Poland

The value of the postal services market in Poland grew systematically (Table 7). The COVID-19 pandemic did not change this value. However, it should be remembered that postal services contain several segments that differ from each other. From the point of view of logistic activity, the key segments are those related to the delivery of postal parcels and courier services. The pandemic caused a decrease in the revenue generated from postal parcels and letter mail. There was, however, an increase in revenue from courier deliveries. The main reason was the need for social distance. People avoided postal parcels and letters, which would have involved sending or collecting such parcels at a postal or other point designated by the postal operator. A much more convenient way was to collect the parcel from a courier. In the pandemic, contactless ways of confirming receipt of a parcel began to be used, such as by entering a code received on the telephone. Some companies did away with receipts issued by the recipient. The courier then confirmed the delivery of the parcel on behalf of the customer. Sending a parcel using a courier also reduced contacts. All that was needed was to prepare the parcel and order a courier who would pick up the parcel in a contactless manner. The importance of postal services, especially those related to courier services, has increased. This applied to both domestic and international delivery services. An interesting situation, however, concerned the number of parcels served, which was steadily declining. It was only in 2021 that an increase was recorded. In the individual segments, the situation varied. There was a continuous decline in the volume of letter mail handled and in the other services group. In the first year of the pandemic, there were substantial increases in the volume of postal parcels and courier services handled. Particularly in the latter category, the increase was very rapid (by 44%) and was maintained in the following year, but at a slightly lower level.
The following tables contain the dynamic indicators in relation to 2015 (Table 8). It can be concluded that there is a shift away from letter mail. The pandemic has halted this process with regard to postal parcels. Instead, there has been a considerable increase in courier deliveries in value and volume. Interestingly, revenue growth in the other postal services segment was recorded despite the declining volume. In the case of postal parcels, the situation was different. Revenues fell despite an increase in volume. In the case of courier parcels, volume growth was much faster than revenue growth, showing a change in the prices of the postal services offered. In many cases, prices fell because they had to be competitive with other operators in the market. The situation was favourable for customers. It can also be said that the performance of most postal services, including logistics, has improved due to the pandemic. The changes initiated in 2020 continued in 2021 as well. Customers were particularly convinced by courier services, which met the basic requirements during the pandemic relating to security.
Next, the structure of the postal services market in Poland is presented (Table 9). The presented summary confirms the previous findings. The share of letter mail in total revenues decreased drastically. The pandemic only accelerated the process. The same was valid for postal parcels, which generated only 3% of total revenue in 2021. On the other hand, the share of courier parcels in generated revenue increased from 42% in 2015 to 64% in 2021. This segment became crucial. The importance of other services was decreasing. The pandemic did not cause significant changes in the structure of services by area of performance. Domestic services continued to dominate. In the case of shipment volumes and services, the regularity was similar to that for revenue. Despite the declines, letter mail was still the most comprehensive volume handled. The share of courier mail increased from 11% in 2015 to 40% in 2021. Interestingly, the share of postal parcels was at a similar level of 1–2% throughout the period under review. The importance of other postal services was decreasing. Therefore, some changes in the market were already occurring, but the pandemic accelerated them.

3.4. Changes in the Transport Sector in Poland during a Pandemic

The transport sector is very important in logistics activities and is crucial for the economy. First of all, it is essential to compare the economic parameters. Revenues from transport activities have steadily increased (Table 10), and only in 2020 did they decline. However, differences are apparent if freight and passenger transport revenues are examined separately. Carriage of goods generated a continuous increase in revenue, while in 2020, there was stagnation. For passenger transport, there was a favourable trend until 2019. In 2020, revenues fell by 28%. These were pandemic-related constraints, such as a reduction in the number of people in vehicles and the closure of transport routes that had become unprofitable. The following year was better than before, but the lost revenue was not recovered. In 2020, the upward trend in employment in the transport sector was halted and primarily affected passenger transport as well. Cargo haulage also suffered from understaffing problems. The pandemic did not slow down wage growth. One effect of the pandemic was a drastic decrease in the profitability of companies. They were balancing on the edge of profitability. The pandemic caused an increase in cargo handled in tonnes and transport work performed in tkm (tonne-kilometres). The main reason why this is important is that 2019 has seen declines in these areas. However, the situation was different for the number of passengers carried and the transport work done in pkm (passenger-kilometres). In 2020, the decrease in the number of passengers was 46%, while the transport work was as high as 67%. In the following year, the declines were not compensated, and presumably, it will take at least a few years to return to 2019 levels.
The following summary shows the changes in the market for transport services in relation to 2015 (Table 11). The juxtaposition confirms that the pandemic caused an increase in demand for freight transport and a decrease in passenger transport. At the same time, the profitability of the services provided decreased, which meant that the effect of the increase in volume and transport work in freight was invisible from the point of view of the economic situation of companies. In passenger transport, the reduction was due to the restrictions introduced in the pandemic. Although 2020 was very unfavourable, the situation already started to improve in 2021, even if it was still far from the acceptable rate.

3.5. Relationship between GDP Value and Changes in Logistics Activities in Poland during a Pandemic

In the next step, Kendall’s tau correlation coefficient was calculated. The aim was to find a relationship between GDP value and parameters related to the market and logistics services in Poland (Table 12). The cut-off value for the significance level was p = 0.05. Significant results are shown in bold. Correlation coefficients were calculated for Poland for different periods. The research project attempted to test correlations that do not indicate that a factor influences another but that there is a strong significant or weak secondary relationship. The value of GDP was used for the calculations. Tests performed with other parameters concerning the economy (domestic demand, total consumption including households, value of exports and imports) gave similar results. Therefore, it was decided to present only the result for the GDP value. Significant results were found for half of the parameters. The results varied according to the period studied. There were strong positive correlations between the value of GDP and total revenue for the companies in the top 10 TSL ranking, as well as the total supply of warehouse space, the value of the total postal services market, the value and volume of postal courier services, freight revenue, and the average monthly salary in transport. This means that these parameters were strongly correlated with the change in the value of GDP in the economy. The pandemic did not disrupt the trends. On the other hand, strong negative correlations were found between the value of GDP and the volume of postal mail services, as well as other services. These services are gradually being withdrawn from the market. There were also parameters, which only as a result of the pandemic became significant to the value of GDP, such as gross demand for rental of warehouse space, the value of domestic postal services, foreign postal services, and other postal services, as well as the rate of profitability of net turnover in transport, cargo transport (thousand tonnes), cargo transport (million tkm), and passenger transport (thousand persons). Thus, it can be concluded that the pandemic has affected specific parameters that were more emphasised during the crisis period. Certain changes have been accelerated. Not all of them are favourable, such as the decrease in the profitability of transport activities, while freight transport has increased. Based on the research, the general conclusion can be drawn that the development of logistics services is progressing despite the crisis caused by COVID-19. The pandemic has only accelerated the patterns and trends occurring.

4. Discussion

The evaluation of logistics activities and changes in the COVID-19 result did not apply to all segments. There is a great deal of research on the transport segment. For example, Arellana et al. [40] studied the seven most populated cities in Colombia, analysing the impact on three elements of the transport system: air transport, freight transport, and urban transport. In the first months of the pandemic, only freight transport increased, while passenger transport was reduced. The same results were obtained in our study. The same three transport systems were studied by Munawar et al. [41], using Australia as an example. In the early stages of the pandemic, revenue declines were found in the transport industry’s air, public transport, and freight sectors. The first two systems involved passenger transport, and the last involved freight. In general, there is a great deal of research on the negative consequences of passenger transport, such as Li et al. [42] on the situation of passenger air transport worldwide, which was closely related to the rate of disease increase. Similar results were obtained by Sun et al. [43,44] for the world as a whole and by Linka et al. [45,46] for European countries. Rahman and Thill [47] confirmed the patterns occurring based on studies on 86 countries. A higher number of confirmed COVID-19 cases and deaths reduced human mobility. In our study, similar results were obtained for passenger transport. In addition, the first year of the pandemic was the most difficult, while adaptation measures were introduced in the second year, which allowed partial recovery of lost passenger transport. Łącka and Suproń [48] examined the impact of the COVID-19 pandemic on the Polish road freight transport industry. They found that the imposition of the blockade on the European economy had a negative impact on the short-term activities of transport companies. On the other hand, the number of road kilometres travelled by the surveyed companies increased following the reduction of infections and the subsequent reduction of restrictions. This increase was higher than in the corresponding periods of previous years. In turn, Periokaitė and Dobrovolskienė [49] found that in Lithuania, road transport companies experienced a decrease in profitability rates during the first wave of COVID-19. In our study, we obtained similar results. Freight transport was stagnant in the first year of the pandemic, which could be due to this short-lived decrease in the initial months of 2020. In the following months, there was an increase. As a result, there was a slight increase in 2020. A decline in revenue profitability was also found in road transport companies in the first year of the pandemic. In the following year, increases in transport work were already higher. Alaimo et al. [50] and Chang and Meyerhoefer [51] found that there was a change in shopping habits and preferences, which became a growth opportunity for transport companies due to the increased interest in the e-commerce industry. Our research also points to the strong growth of the e-commerce industry in Poland. The consequence of this is an increase in demand for warehouse space. Sansa [52] and Ghazanfari [53] pointed to the drop in fuel prices on global markets, which also supported road freight transport. Similar observations were confirmed by Osińska and Zalewski [54] with regard to the Polish road freight market. Demand shocks caused by operating restrictions in other sectors, on the other hand, were a threat. On the other hand, Ivanov and Dolgui [55] concluded that demand for certain products increased dramatically in a pandemic. Such regularities may be an explanation for our research results. We found that revenues were maintained during the first year of the pandemic in the road freight transport industry.
The growth of the e-commerce market has occurred in virtually all countries. There are many examples of studies on this market in Croatia [56], Saudi Arabia [57], Italy [58], and Germany [59]. Overall, it can be said that it was a global trend. In 2020, global e-commerce sales increased by 19% compared to a year earlier [60]. Abdelrhim and Elsayed [61] studied the impact of COVID-19 on global e-commerce companies, where the five largest e-commerce companies in the world were selected in terms of revenue and market value. They confirmed a large impact of the pandemic on their financial performance. However, everything depended on the severity of COVID-19, with online purchases also increasing during the increased incidence. Associated with the growth of e-commerce is an increase in demand for warehouse space. This area is very poorly covered in the literature. We found only a few articles, making our study all the more valuable. Kaur et al. [62] point to the inadequate number of warehouses in India serving major cities and supplying food. The greater need is due to demand and supply shocks created by the pandemic. New warehouses needed to be built, the location of which would reduce transport costs. Information on the warehouse segment is presented in industry reports. In the USA, for example, retailers accelerated investment in warehouses to sell goods stored on their websites. Demand for warehouse space and logistics centres has increased tremendously, which has also influenced rental prices [63]. Prologis, the global leader in logistics real estate, also points to the increased interest in renting warehouses. As a result of the pandemic, demand for warehouses and distribution centres has increased, as consumers’ shopping habits have changed and manufacturers and retailers are adapting to changing demands [64]. Similar results were obtained in our study. A boom in warehouse space was observed in 2020, but demand was partially realised in 2021. Indeed, investments in warehouses take time.
Based on the Philippine market, Dones and Young [65] found that the demand for courier services has increased significantly due to the threat of the COVID-19 pandemic. Demand is always followed by supply, which means that courier companies can fulfil the reported service needs. Courier services provide delivery of virtually any type of goods. Izzah [66], in a Malaysian market study, found a significant relationship between courier companies and e-business companies. In addition, logistics companies have contributed to the emergence of new services developed specifically for critical situations such as COVID-19. The pandemic has also accelerated the trend towards widespread digitisation. On the other hand, the professionalisation of logistics customer service requires standardisation to ensure both the distinction of the company and the distinction of the services offered by the company [67]. In turn, standardisation enables the digitisation and automation of processes [68]. COVID-19 also contributed to an increase in customer needs and expectations in terms of ease of purchase and greater flexibility. New solutions allowed the selection of additional delivery features such as place, time, delivery date and payment method [69]. Such solutions have led to the emergence of multiple sales channels. The pandemic accelerated this phenomenon [70]. In our research, we obtained similar patterns in developing general courier services and logistics services. There is a worldwide shift away from traditional postal services. In Malaysia, for example, lower demand for letter mail and higher operating costs were indicated. For this reason, public operators are focusing on express and parcel posts. These areas are characterised by high competition but allow revenue growth [71]. Similar results were obtained in our research for the Polish postal services market.
Logistics providers during the pandemic focused on five topics, i.e., creating revenue streams, increasing operational transport flexibility, forcing digitalisation and data management, optimising logistics infrastructure, and also optimising staff capacity. These topics could give logistics companies resilience during the COVID-19 crisis [72]. Our research shows that the largest logistics companies in Poland paid attention to these elements. Such measures also contributed to revenue growth. Atayah et al. [73] examined the financial performance of logistics companies in G20 countries during the first months of the pandemic. Financial performance in 14 countries was higher compared to other countries. In contrast, Germany, Korea, Russia, Mexico, Saudi Arabia, and the UK performed worse than in the pre-pandemic period. Nguyen [74] examined the financial performance of 114 logistics forms listed on the Vietnamese stock exchange and compared the years 2019 and 2020. Financial performance did not improve and even worsened. Only a few logistics companies grew. Liu et al. [75], using the Chinese market as an example, found that in the initial period, the pandemic caused many problems for logistics companies. The number of companies incurring losses increased. After the initial shock, logistics companies will develop rapidly under the influence of three driving forces, i.e., market, technology, and politics. The specifics of the Chinese market are different from those of the Polish market. In China, ports were periodically closed due to the pandemic, which entailed significant losses. Subsequently, solutions were developed that allowed the logistics industry to function and proliferate. In our research, virtually all companies increased revenues in the first year of the pandemic. In contrast, the second year of operation under COVID-19 conditions was a record year in revenue. Logistics companies learned their lessons and adapted their solutions to the situation. It can be said that the adaptation was swift and effective.
During the pandemic, digitalisation and sustainable solutions became a priority for logistics companies. Managing logistics operations for sustainability has become a major challenge [76]. Dovbischuk [77] found that a dynamic capacity for innovation reinforces dynamic adaptability in logistics companies. Logistics service providers have generally been successful in creating new services and responding to changing market conditions regarding logistics service quality and company performance. The ability to disseminate new knowledge, effectively train employees, develop cross-functional cooperation within the company, develop long-term inter-firm relationships with business partners, and learn from rivals are key. According to Dilyard et al. [78], it is crucial to use digital technologies to make logistics operations more flexible and resilient to crises. This way of operating will also contribute to sustainability. Alesiuniene et al. [79] point out additional advantages of digitalisation, such as reduced energy consumption and environmental impact. Lachvajderová [80], on the other hand, points to the emergence during the pandemic of new standards for the sustainable operation of supply chains in order to minimise the negative environmental impact of their activities. Such benefits have also been confirmed in many other studies, such as de Andres Gonzalez et al. [81], Pernestål et al. [82] and Todorovic et al. [83]. We obtained similar results in our research and literature review on logistics companies operating in Poland. Large logistics companies were efficiently implementing new IT tools and digitalisation. Such activities, on the one hand, were an opportunity to adapt to new market conditions and competition and, on the other hand, were perfectly in line with the strategy of sustainable business development. Work on the introduction of new, often innovative solutions was already underway. The pandemic, on the other hand, accelerated everything and, in a way, contributed to taking a few steps forward. The benefits of the transformation will accrue to logistics companies, consumers, and the environment as a result of better efficiency and less involvement and consumption of resources.

5. Conclusions and Recommendations

5.1. Conclusions

The conducted research allows for a few generalisations.
  • The occurrence of the COVID-19 pandemic caused logistics companies to take several steps forward immediately. The pandemic accelerated changes in logistics operations that had already been initiated. In particular, the changes involved digitalisation, the development of the e-commerce market, multi-channel sales, and the development of these services, and the introduction of automation and artificial intelligence.
  • Polish logistics companies were doing well before the pandemic. Record revenue increases were achieved in the second year of the pandemic when the changes introduced by logistics companies began to have a tangible effect. The occurrence of COVID-19 only reduced the growth rate, but it was still positive.
  • The pandemic caused various consequences in the logistics business segments. As a result of increased online sales and the strong growth of e-commerce, there was a boom in demand for warehouse space, which the supply could not keep up with. The market responded the following year when new warehouses were built. Still, demand was very high. In the pandemic, courier shipments experienced a very high growth rate. Parcel volumes grew faster than the value of revenue, which was due to the high level of competition in the market.
  • In transport activities, the situation was not clear-cut. Before the pandemic, freight transport was proliferating, while passenger transport was growing moderately. The pandemic caused substantial reductions in passenger transport, where record declines were experienced. Freight transport, on the other hand, was doing well. The first year of the pandemic resulted in stagnation in the value of revenues in freight but a decline in the profitability of services. There was an improvement in 2021, but profitability was still low.
  • The pandemic has highlighted fundamental changes and trends in logistics activities. The development of logistics activities in the individual was closely linked to the economic situation in the case of revenue from the sale of logistics companies, supply of storage space, total postal services, courier services, and revenue from transport activities, including freight. In turn, less profitable activities or COVID-19 time-limited activities, such as the dispatch of letters and parcels by post and passenger transport, were being abandoned.
  • Indeed, the pandemic accelerated the inevitable changes. Many companies had prepared for them, so they were not too surprised. Interestingly, the changes introduced generally resulted in a considerable increase in business revenue. Greater sustainability in logistics operations can also be seen as an added value, contributing to saving resources and protecting the environment. The logistics industry ultimately benefited from the pandemic.

5.2. Recommendations

The research reveals the changes that have taken place in the logistics services market and its various segments as a result of the pandemic. Such a comprehensive approach is new. Research on such relationships during the COVID-19 pandemic in other European and global countries is lacking. It would be worthwhile to contrast the results, as the determinants and scale of constraints in the pandemic may have differed from country to country. This is a new situation; therefore, it needs clarification.
A limitation of conducting such studies is the lack of available up-to-date and detailed segment-specific and comprehensive data. Collecting information requires the use of several data sources. A possible direction for further research is to link the transformation of logistics activities as a result of COVID-19 to sustainable development, especially pollution reduction and economic development. Research could also address these relationships using the example of individual logistics business segments. There is virtually no research on the warehousing space market and its changes, which could also be a research gap to be filled.

Author Contributions

Conceptualization, T.R.; Data curation, T.R.; Formal analysis, T.R.; Funding acquisition, T.R.; Investigation, T.R.; Methodology, T.R.; Project administration, T.R.; Resources, T.R.; Software, T.R.; Supervision, T.R.; Validation, T.R.; Visualization, T.R.; Writing—original draft, T.R., P.B., A.B.-B., A.S. and A.P.; Writing—review & editing, T.R., P.B., A.B.-B., A.S. and A.P. All authors have read and agreed to the published version of the manuscript.

Funding

This research received no external funding.

Institutional Review Board Statement

Not applicable.

Informed Consent Statement

Not applicable.

Data Availability Statement

Not applicable.

Conflicts of Interest

The authors declare no conflict of interest.

References

  1. Erkan, B. The importance and determinants of logistics performance of selected countries. J. Emerg. Issues Econ. Financ. Bank. 2014, 3, 1237–1254. [Google Scholar]
  2. Bashir, R.; Vijayalakshmi, H.; Bashir, N. A Comparative Study on the Prices of Products in Logistics Companies and Their Impact on Economic Growth. In Proceedings of the 2020 8th International Conference on Reliability, Infocom Technologies and Optimization (Trends and Future Directions) (ICRITO), Noida, India, 4–5 June 2020; pp. 934–939. [Google Scholar]
  3. Es, H.A.; Hamzacebi, C.; Firat, S.U.O. Assessing the logistics activities aspect of economic and social development. Int. J. Logist. Syst. Manag. 2018, 29, 1–16. [Google Scholar] [CrossRef]
  4. Rokicki, T.; Bórawski, P.; Bełdycka-Bórawska, A.; Żak, A.; Koszela, G. Development of Electromobility in European Union Countries under COVID-19 Conditions. Energies 2022, 15, 9. [Google Scholar] [CrossRef]
  5. Huang, H.; Xu, T. Discussing about the relationship between logistics industry and economy development. Logist. Manag. 2005, 5, 1–4. [Google Scholar]
  6. Tudor, F. Historical evolution of logistics. Rev. Des Sci. Polit. 2012, 36, 22–32. [Google Scholar]
  7. Rokicki, T. The importance of logistics in agribusiness sector companies in Poland. In Economic Science for Rural Development: Production and Cooperation in Agriculture/Finance and Taxes, Proceedings of the International Scientific Conference, Jelgava, Latvia, 6 April 2013; Latvia University of Agriculture: Jelgava, Latvia, 2013; pp. 116–120. [Google Scholar]
  8. Hanne, T.; Dornberger, R. Computational Intelligence in Logistics and Supply Chain Management; Springer: Cham, Switzerland, 2017; pp. 1–12. [Google Scholar]
  9. Pfohl, H.C. Characterization of the Logistics Conception. In Logistics Systems; Springer: Berlin/Heidelberg, Germany, 2022; pp. 21–45. [Google Scholar]
  10. Amin, H.M.; Shahwan, T.M. Logistics management requirements and logistics performance efficiency: The role of logistics management practices-evidence from Egypt. Int. J. Logist. Syst. Manag. 2020, 35, 1–27. [Google Scholar] [CrossRef]
  11. Chu, Z.; Wang, Q.; Lado, A.A. Customer orientation, relationship quality, and performance: The third-party logistics provider’s perspective. Int. J. Logist. Manag. 2016, 27, 738–754. [Google Scholar] [CrossRef]
  12. Wicki, L.; Rokicki, T. Differentiation of level of logistics activities in milk processing companies. In Information Systems in Management X: Computer Aided Logistics/Sci; Jałowiecki, P., Orłowski, A., Eds.; WULS Press: Warsaw, Poland, 2011; pp. 117–127. [Google Scholar]
  13. Chu, Z. Logistics and economic growth: A panel data approach. Ann. Reg. Sci. 2012, 49, 87–102. [Google Scholar] [CrossRef]
  14. Saidi, S.; Mani, V.; Mefteh, H.; Shahbaz, M.; Akhtar, P. Dynamic linkages between transport, logistics, foreign direct Investment, and economic growth: Empirical evidence from developing countries. Transp. Res. Part A Policy Pract. 2020, 141, 277–293. [Google Scholar] [CrossRef]
  15. Haren, P.; Simchi-Levi, D. How Coronavirus Could Impact the Global Supply Chain by Mid-March; Harvard Business Review: Harvard, UK, 2020. [Google Scholar]
  16. Remko, V.H. Research opportunities for a more resilient post-COVID-19 supply chain–closing the gap between research findings and industry practice. Int. J. Oper. Prod. Manag. 2020, 40, 341–355. [Google Scholar] [CrossRef]
  17. Chowdhury, P.; Paul, S.K.; Kaisar, S.; Moktadir, M.A. COVID-19 pandemic related supply chain studies: A systematic review. Transp. Res. Part E Logist. Transp. Rev. 2021, 148, 102271. [Google Scholar] [CrossRef]
  18. Gunessee, S.; Subramanian, N. Ambiguity and its coping mechanisms in supply chains lessons from the Covid-19 pandemic and natural disasters. Int. J. Oper. Prod. Manag. 2020, 40, 1201–1223. [Google Scholar] [CrossRef]
  19. Paul, S.K.; Chowdhury, P. A production recovery plan in manufacturing supply chains for a high-demand item during COVID-19. Int. J. Phys. Distrib. Logist. Manag. 2020, 51, 104–125. [Google Scholar] [CrossRef]
  20. Amankwah-Amoah, J. Note: Mayday, Mayday, Mayday! Responding to environmental shocks: Insights on global airlines’ responses to COVID-19. Transp. Res. Part E Logist. Transp. Rev. 2020, 143, 102098. [Google Scholar] [CrossRef]
  21. Xu, Z.; Elomri, A.; Kerbache, L.; El Omri, A. Impacts of COVID-19 on global supply chains: Facts and perspectives. IEEE Eng. Manag. Rev. 2020, 48, 153–166. [Google Scholar] [CrossRef]
  22. Heidary, M.H. The Effect of COVID-19 Pandemic on the Global Supply Chain Operations: A System Dynamics Approach. Foreign Trade Rev. 2022, 57, 198–220. [Google Scholar] [CrossRef]
  23. Choi, T.M. Innovative “bring-service-near-your-home” operations under corona-virus (COVID-19/SARS-CoV-2) outbreak: Can logistics become the messiah? Transp. Res. Part E Logist. Transp. Rev. 2020, 140, 101961. [Google Scholar] [CrossRef]
  24. Linton, T.; Vakil, B. Coronavirus is Proving We Need More Resilient Supply Chains; Harvard Business Review: Harvard, UK, 2020. [Google Scholar]
  25. Currie, C.S.; Fowler, J.W.; Kotiadis, K.; Monks, T.; Onggo, B.S.; Robertson, D.A.; Tako, A.A. How simulation modelling can help reduce the impact of COVID-19. J. Simul. 2020, 14, 83–97. [Google Scholar] [CrossRef]
  26. Ivanov, D. Viable supply chain model: Integrating agility, resilience and sustainability perspectives—lessons from and thinking beyond the COVID-19 pandemic. Ann. Oper. Res. 2020, 1–21, online ahead of print. [Google Scholar] [CrossRef]
  27. Dolgui, A.; Ivanov, D.; Sokolov, B. Reconfigurable supply chain: The X-network. Int. J. Prod. Res. 2020, 58, 4138–4163. [Google Scholar] [CrossRef]
  28. Branża kurierska 2020—Podsumowanie Roku. Available online: https://www.globkurier.pl/ciekawostki/branza-kurierska-2020-podsumowanie-roku (accessed on 21 July 2022).
  29. Osiadacz, K. Logistyka kluczem do sukcesu strategii omnichannel. 26 ranking firm TSL. Dziennik Gazeta Prawna, 21 June 2021. [Google Scholar]
  30. Wskaźnik optymizmu branży TSLw Polsce w latach 2009–2021. 26 ranking firm TSL. Dziennik Gazeta Prawna, 24 June 2021.
  31. Brzeziński, M. Jak E-Commerce Wpływa na Rynek Magazynowy w Regionie CEE? Available online: https://www.logistyka.net.pl/bank-wiedzy/item/92060-jak-e-commerce-wplywa-na-rynek-magazynowy-w-regionie-cee (accessed on 21 July 2022).
  32. Jak automatyzować procesy i zyskać przewagę w e-commerce? 26 ranking firm TSL. Dziennik Gazeta Prawna, 24 June 2021.
  33. Transport i logistyka w innowacyjnych odsłonach. 26 ranking firm TSL. Dziennik Gazeta Prawna, 24 June 2021.
  34. Michalski, K. NO LIMIT automatyzuje procesy zwrotów. Logistyka 2022, 1, 71–74. [Google Scholar]
  35. Michalski, K. Polska logistyka po roku z COVID-19—Przegląd doświadczeń. Logistyka 2021, 2, 44–46. [Google Scholar]
  36. Michalski, K. Brygady botów na usługach Raben. Logistyka 2022, 1, 59–63. [Google Scholar]
  37. Starzyńska, W. Statystyka Praktyczna; Wydawnictwo Naukowe PWN: Warszawa, Poland, 2002; pp. 45–57. [Google Scholar]
  38. Abdi, H. Coefficient of variation. In Encyclopedia of Research Design; SAGE: Thousand Oaks, CA, USA, 2010; Volume 1, pp. 169–171. [Google Scholar]
  39. Kendall, M.G. Rank Correlation Methods; Griffin: London, UK, 1955; Volume 19. [Google Scholar]
  40. Arellana, J.; Márquez, L.; Cantillo, V. COVID-19 outbreak in Colombia: An analysis of its impacts on transport systems. J. Adv. Transp. 2020, 2020, 8867316. [Google Scholar] [CrossRef]
  41. Munawar, H.S.; Khan, S.I.; Qadir, Z.; Kouzani, A.Z.; Mahmud, M.A.P. Insight into the Impact of COVID-19 on Australian Transportation Sector: An Economic and Community-Based Perspective. Sustainability 2021, 13, 1276. [Google Scholar] [CrossRef]
  42. Li, S.; Zhou, Y.; Kundu, T.; Sheu, J.B. Spatiotemporal variation of the worldwide air transportation network induced by COVID-19 pandemic in 2020. Transp. Policy 2021, 111, 168–184. [Google Scholar] [CrossRef]
  43. Sun, X.; Wandelt, S.; Zhang, A. Ghostbusters: Hunting abnormal Flights in Europe during COVID-19; SSRN: Rochester, NY, USA, 2022; p. 4152511. [Google Scholar]
  44. Sun, X.; Wandelt, S.; Zhang, A. Aviation under COVID-19 Pandemic: Status Quo and How to Proceed Further? SSRN: Rochester, NY, USA, 2022; p. 4031476. [Google Scholar] [CrossRef]
  45. Linka, K.; Peirlinck, M.; Sahli Costabal, F.; Kuhl, E. Outbreak dynamics of COVID-19 in Europe and the effect of travel restrictions. Comput. Methods Biomech. Biomed. Eng. 2020, 23, 710–717. [Google Scholar] [CrossRef]
  46. Linka, K.; Goriely, A.; Kuhl, E. Global and local mobility as a barometer for COVID-19 dynamics. Biomech. Modeling Mechanobiol. 2021, 20, 651–669. [Google Scholar] [CrossRef]
  47. Rahman, M.M.; Thill, J.-C. Associations between COVID-19 Pandemic, Lockdown Measures and Human Mobility: Longitudinal Evidence from 86 Countries. Int. J. Environ. Res. Public Health 2022, 19, 7317. [Google Scholar] [CrossRef]
  48. Łącka, I.; Suproń, B. The impact of COVID-19 on road freight transport evidence from Poland. Eur. Res. Stud. 2021, 24, 319–333. [Google Scholar] [CrossRef]
  49. Periokaitė, P.; Dobrovolskienė, N. The impact of COVID-19 on the financial performance: A case study of the Lithuanian transport sector. Insights Into Reg. Dev. 2021, 3, 34–50. [Google Scholar] [CrossRef]
  50. Alaimo, L.S.; Fiore, M.; Galati, A. How the COVID-19 pandemic is changing online food shopping human behaviour in Italy. Sustainability 2020, 12, 9594. [Google Scholar] [CrossRef]
  51. Chang, H.H.; Meyerhoefer, C.D. COVID-19 and the demand for online food shopping services: Empirical Evidence from Taiwan. Am. J. Agric. Econ. 2021, 103, 448–465. [Google Scholar] [CrossRef]
  52. Sansa, N.A. Analysis for the Impact of the COVID-19 to the Petrol Price in China; SSRN: Rochester, NY, USA, 2022; p. 3547413. [Google Scholar]
  53. Ghazanfari, A. The impact of the COVID-19 pandemic and crude oil price crisis on the price of automobile fuels in European countries. Divers. J. Multidiscip. Res. 2020, 2, 10–19. [Google Scholar]
  54. Osińska, M.; Zalewski, W. Vulnerability and resilience of the road transport industry in Poland to the COVID-19 pandemic crisis. Transportation 2021, 1–24, online ahead of print. [Google Scholar] [CrossRef]
  55. Ivanov, D.; Dolgui, A. Viability of intertwined supply networks: Extending the supply chain resilience angles towards survivability. A position paper motivated by COVID-19 outbreak. Int. J. Prod. Res. 2020, 58, 2904–2915. [Google Scholar] [CrossRef]
  56. Leskovar, M.; Gregurec, I.; Kutnjak, A. Perspective of consumers and sellers about the impact of COVID-19 pandemic on e-commerce. Int. J. Multidiscip. Bus. Sci. 2021, 7, 15–28. [Google Scholar]
  57. Abed, S.S. Social commerce adoption using TOE framework: An empirical investigation of Saudi Arabian SMEs. Int. J. Inf. Manag. 2020, 53, 102118. [Google Scholar] [CrossRef]
  58. Cavallo, C.; Sacchi, G.I.; Carfora, V. Efekty odporności na zachowania związane z konsumpcją żywności w czasie Covid-19: Perspektywy z Włoch. Helijon 2020, 6, e05676. [Google Scholar]
  59. Dannenberg, P.; Fuchs, M.; Riedler, T.; Wiedemann, C. Digital transition by COVID-19 pandemic? The German food online retail. Tijdschr. Econ. Soc. Geogr. 2020, 111, 543–560. [Google Scholar] [CrossRef]
  60. Statista. eCommerce Report 2021. Available online: https://www.statista.com/study/42335/ecommerce-report/ (accessed on 21 July 2022).
  61. Abdelrhim, M.; Elsayed, A. The Effect of COVID-19 Spread on the e-Commerce Market: The Case of the 5 Largest E-Commerce Companies in the World; SSRN: Rochester, NY, USA, 2022; p. 3621166. [Google Scholar]
  62. Kaur, G.; Pasricha, S.; Kathuria, G. Resilience Role of Distribution Centers amid COVID-19 Crisis in Tier-A Cities of India: A Green Field Analysis Experiment. J. Oper. Strateg. Plan. 2020, 3, 226–239. [Google Scholar] [CrossRef]
  63. Covid E-Commerce Boom Sees U.S. Retailers Hunt for Warehouses. Available online: https://www.bloomberg.com/news/newsletters/2022-01-11/supply-chain-latest-covid-e-commerce-boom-sees-warehouse-demand-soar (accessed on 21 July 2022).
  64. Report: Pandemic Intensifies Demand for Warehousing. Available online: https://www.supplychainquarterly.com/articles/3802-report-pandemic-intensifies-demand-for-warehousing (accessed on 21 July 2022).
  65. Dones, R.L.E.; Young, M.N. Demand on the of Courier Services during COVID-19 Pandemic in the Philippines. In Proceedings of the 2020 7th International Conference on Frontiers of Industrial Engineering (ICFIE), Singapore, 27–29 September 2020; pp. 131–134. [Google Scholar]
  66. Izzah, N.; Dilaila, F.; Yao, L. The growth of reliance towards courier services through e-business verified during COVID-19: Malaysia. J. Phys. Conf. Ser. 2021, 1874, 012041. [Google Scholar] [CrossRef]
  67. Sułkowski, Ł.; Kolasińska-Morawska, K.; Brzozowska, M.; Morawski, P.; Schroeder, T. Last Mile Logistics Innovations in the Courier-Express-Parcel Sector Due to the COVID-19 Pandemic. Sustainability 2022, 14, 8207. [Google Scholar] [CrossRef]
  68. Ranieri, L.; Digiesi, S.; Silvestri, B.; Roccotelli, M. A review of last mile logistics innovations in an externalities cost reduction vision. Sustainability 2018, 10, 782. [Google Scholar] [CrossRef]
  69. Chornopyska, N.; Bolibrukh, L. The Influence of the Covid-19 Crisis on the Formation of Logistics Quality. Intellect. Logist. Supply Chain. Manag. 2020, 2, 88–98. [Google Scholar] [CrossRef]
  70. Bogetić, Z.; Stojković, D.; Dokić, A. The importance of digitalization of procurement in achieving multiple channel retail excellence. Marketing 2021, 52, 163–172. [Google Scholar] [CrossRef]
  71. Yeop Ali, D.; Hock, O.Y. Malaysian Postal Delivery Service in the New Normal Post Covid-19 Pandemic Era: E-Duction for Postal Services. Solid State Technol. 2021, 64, 394–401. [Google Scholar]
  72. Herold, D.M.; Nowicka, K.; Pluta-Zaremba, A.; Kummer, S. COVID-19 and the pursuit of supply chain resilience: Reactions and “lessons learned” from logistics service providers (LSPs). Supply Chain. Manag. Int. J. 2021, 26, 702–714. [Google Scholar] [CrossRef]
  73. Atayah, O.F.; Dhiaf, M.M.; Najaf, K.; Frederico, G.F. Impact of COVID-19 on financial performance of logistics firms: Evidence from G-20 countries. J. Glob. Oper. Strateg. Sourc. 2021, 15, 172–196. [Google Scholar] [CrossRef]
  74. Nguyen, H.T.X. The Effect of COVID-19 Pandemic on Financial Performance of Firms: Empirical Evidence from Vietnamese Logistics Enterprises. J. Asian Financ. Econ. Bus. 2022, 9, 177–183. [Google Scholar]
  75. Liu, W.; Liang, Y.; Bao, X.; Qin, J.; Lim, M.K. China’s logistics development trends in the post COVID-19 era. Int. J. Logist. Res. Appl. 2022, 25, 965–976. [Google Scholar] [CrossRef]
  76. Gupta, A.; Singh, R.K. Applications of emerging technologies in logistics sector for achieving circular economy goals during COVID 19 pandemic: Analysis of critical success factors. Int. J. Logist. Res. Appl. 2021, 2021, 1–22. [Google Scholar] [CrossRef]
  77. Dovbischuk, I. Innovation-oriented dynamic capabilities of logistics service providers, dynamic resilience and firm performance during the COVID-19 pandemic. Int. J. Logist. Manag. 2022, 33, 499–519. [Google Scholar] [CrossRef]
  78. Dilyard, J.; Zhao, S.; You, J.J. Digital innovation and Industry 4.0 for global value chain resilience: Lessons learned and ways forward. Thunderbird Int. Bus. Rev. 2021, 63, 577–584. [Google Scholar] [CrossRef]
  79. Alesiuniene, K.S.; Simanaviciene, Z.; Bickauske, D.; Mosiiuk, S.; Belova, I. Increasing the effectiveness of food supply chain logistics through digital transformation. Indep. J. Manag. Prod. 2021, 12, 677–701. [Google Scholar] [CrossRef]
  80. Lachvajderová, L.; Kádárová, J.; Kopec, J.; Rybárová, D. Postpandemic innovative trends in logistics, distribution and supply chain. Adv. Logist. Syst. Theory Pract. 2022, 16, 19–30. [Google Scholar] [CrossRef]
  81. de Andres Gonzalez, O.; Koivisto, H.; Mustonen, J.M.; Keinänen-Toivola, M.M. Digitalization in Just-In-Time Approach as a Sustainable Solution for Maritime Logistics in the Baltic Sea Region. Sustainability 2021, 13, 1173. [Google Scholar] [CrossRef]
  82. Pernestål, A.; Engholm, A.; Bemler, M.; Gidofalvi, G. How Will Digitalization Change Road Freight Transport? Scenarios Tested in Sweden. Sustainability 2020, 13, 304. [Google Scholar] [CrossRef]
  83. Todorovic, V.; Maslaric, M.; Bojic, S.; Jokic, M.; Mircetic, D.; Nikolicic, S. Solutions for More Sustainable Distribution in the Short Food Supply Chains. Sustainability 2018, 10, 3481. [Google Scholar] [CrossRef]
Figure 1. Diagram of the conducted research.
Sustainability 14 10303 g001
Table 1. Variable-basis dynamics indices for revenues from operations of top 10 TSL companies in Poland in 2015–2021. Blue indicates the three best performers in a given year, and red the three worst performers.
Lp.Company NameChange Dynamics of Revenue (Previous Year = 100)
Previous Year = 100
2015201620172018201920202021
1Raben Group100.00101.43104.94109.48113.87101.95119.08
2DPD Polska Capital Group100.00109.25118.88117.95116.61125.80117.77
3DSV Group100.00129.37115.80109.73161.34107.86170.33
4Schenker Sp. z o.o.100.00102.65103.36105.24105.93101.42129.14
5ROHLIG SUUS Logistics SA100.00116.48121.47106.45104.42121.63171.12
6Rhenus Group100.00121.13155.64112.75121.12113.24212.13
7VGL Solid Group Sp. z o.o.100.00118.09132.28127.63115.85113.15230.01
8KUEHNE + NAGEL Sp. z o.o.100.00115.92119.12117.71105.70104.13145.04
9HEGELMANN TRANSPORTE Sp. z o.o.100.00106.00114.62171.89170.82110.56106.54
10FM Logistic100.00102.88104.77108.65106.1699.83111.20
Top 10 on average100.00112.32119.09118.75122.18109.96151.24
Table 2. Fixed-base growth rates for revenues from the top 10 TSL companies in Poland, 2015–2021. Blue indicates the three best performers in a given period, and red the three worst performers.
Lp.Company NameDynamics of Change in Revenue (Year 2015 = 100)Type of Activity
2015–20192015–20202015–2021
1Raben Group132.69135.28161.09logistics services
2DPD Polska Capital Group178.64224.72264.66courier services
3DSV Group265.22286.06487.24logistics services
4Schenker Sp. z o.o.118.26119.95154.90logistics services
5ROHLIG SUUS Logistics SA157.28191.29327.33sea freight forwarding
6Rhenus Group257.45291.53618.42logistics services
7VGL Solid Group Sp. z o.o.230.98261.35601.12sea freight forwarding
8KUEHNE + NAGEL Sp. z o.o.171.79178.88259.45logistics services
9HEGELMANN TRANSPORTE Sp. z o.o356.73394.39420.19road transport
10FM Logistic124.31124.10138.00logistics services
Top 10 on average199.34220.76343.24road freight forwarding
Table 3. Coefficients of variation for revenues from the top 10 TSL companies in Poland from 2015 to 2021. Blue indicates the three best performers in a given period, and red the three worst performers.
Lp.Company NameCoefficient of Variation in Years
2015–20192015–20202015–2021
1Raben Group0.110.120.17
2DPD Polska Capital Group0.210.290.34
3DSV Group0.350.380.55
4Schenker Sp. z o.o.0.060.070.15
5ROHLIG SUUS Logistics SA0.160.210.41
6Rhenus Group0.330.350.63
7VGL Solid Group Sp. z o.o.0.300.330.66
8KUEHNE + NAGEL Sp. z o.o.0.200.200.30
9HEGELMANN TRANSPORTE Sp. z o.o0.540.560.54
10FM Logistic0.080.090.11
Top 10 on average0.240.260.39
Table 4. Variable-basis dynamics indicators for the top 10 companies with the highest growth in revenue from operations in the TSL sector in Poland in 2015–2021. Blue indicates the best performer in a given period, and red the worst performer.
L.p.Company NameDynamics of ChangeType of ActivityCompany NameDynamics of ChangeType of Activity
Years 2016/2015Years 2017/2016
1Trans Polonia Group (TPG)282.02transportKIMLOG222.22road freight forwarding
2MKW Suchecki Sp. z o.o.171.37transportDONE DELIVERIES173.22road freight forwarding
3Krotrans Logistics Sp. z o.o.167.99transportLANGOWSKI SHIPPING HALINA LANGOWSKA165.04sea freight forwarding
4BAMA LOGISTICS Sp. z o.o.144.42forwardingOptima Logistics Group Sp. z o.o.161.33road transport
5LINK sp. z o.o.140.78transportKrotrans Logistics Sp. z o.o.148.84road transport
6OMIDA GROUP137.91forwardingMKW Suchecki Sp. z o.o.148.17road transport
7No Limit Sp. z o.o.135.14logistics servicesZET Transport sp. z o.o.132.42road transport
8ZET Transport sp. z o.o.136.50transportAsstrA Polska Sp. z o.o.141.65road freight forwarding
9DSV Group129.37logistics servicesUnico Logistics138.94road transport
10Langowski Shipping Halina Langowska132.19forwardingTirsped Sp. z o.o.136.41maritime transport
Top 10 on average157.77-Top 10 on average156.82-
Years 2018/2017Years 2019/2018
1Abakus Logistics Sp. z o.o211.60road freight forwardingHEGELMANN TRANSPORTE Sp. z o.o.171.13road transport
2HEGELMANN TRANSPORTE POLAND173.56road transportKRUK LOGISTIC Piotr Kruk154.92road freight forwarding
3KIMLOG162.50cargo consolidationAbakus Logistics Sp. z o.o141.07road freight forwarding
4Optima Logistics Group S.A.154.18road transportMetrans (Polonia) Sp. z o.o135.97rail transport
5DONE! Deliveries149.53road freight forwardingMKW Suchecki Sp. z o.o.125.45road transport
6Unico Logistics142.38road transportFREJA Transport & Logistics Sp. z o.o.121.64road freight forwarding
7LANGOWSKI LOGISTICS Sp. z o.o139.26sea freight forwardingUnico Logistics Polska Sp. z o.o.120.13road freight forwarding
8No Limit135.19logistics servicesDONE Deliveries Sp. z o.o. Sp. k.118.78road freight forwarding
9Omida Group132.04road freight forwardingRhenus Group118.75logistics services
10Colian Logistic129.03road freight forwardingDTA GROUP118.18customs services
Top 10 on average152.93-Top 10 on average132.60-
Years 2020/2019Years 2021/2020
1Ray Trans Sp. z o.o238.08road freight forwardingTIRSPED Sp. z o.o353.70sea freight forwarding
2Goose Logistics Solutions Sp. z o.o. Sp.k.223.65road freight forwardingEV Cargo Global Forwarding Sp. z o.o.237.02sea freight forwarding
3ID Logistics Polska S.A.166.48warehousing servicesVGL Solid Group Sp. z o.o.230.01sea freight forwarding
4TVM Transport & Logistics sp. z o.o159.40road transportExpeditors Polska Sp. z o.o.218.23air freight forwarding
5DHL Global Forwarding Sp. z o.o.151.94air freight forwardingLANGOWSKI LOGISTICS Sp. z o.o.213.45rail forwarding
6ESA S.r.o. Sp. z o.o. Branch in Poland146.31road freight forwardingRhenus Group212.12logistics services
7FIEGE Group Poland145.71logistics servicesRay Trans Sp. z o.o.210.19road freight forwarding
8Kruk Logistic Sp. z.o.o.141.85road freight forwarding“Terramar” International Shipping Ltd.196.39sea freight forwarding
9LANGOWSKI LOGISTICS Sp. z o.o137.61sea freight forwardingID Logistics Polska S.A.189.80warehousing services
10DPD Polska Capital Group125.80courier servicesOmida Group185.41sea freight forwarding
Top 10 on average163.68-Top 10 on average224.63-
Table 5. Variable-basis dynamics indicators for parameters related to storage services in Poland in 2015–2021. Blue indicates the best performer in a given period, and red the worst performer.
ParametersDynamics of Changes in Demand and Supply of Warehouse Space in Years
(Previous Year = 100)
2015201620172018201920202021
gross demand100.00122.13129.45100.2599.75130.00130.77
net demand100.00144.37136.7095.9788.11150.79142.11
new supply100.00135.87188.8093.64123.0877.21133.33
under construction100.00157.14105.30138.1398.96100.00252.63
total supply100.00114.29118.75118.05118.47110.22125.85
Indicators in years
Share of rentals in total area (%)25.8227.5930.0825.5421.5125.3726.36
vacancy rate (%)4.806.004.504.506.507.103.72
Table 6. Fixed base dynamics indicators for parameters related to storage services in Poland in 2015–2021. Blue indicates the best performer in a given period, and red the worst performer.
ParametersDynamics of Change in Demand and Supply of Warehouse Space (Year 2015 = 100)
2015–20192015–20202015–2021
gross demand158.10205.53268.77
net demand166.89251.66357.62
new supply295.65228.26304.35
under construction226.19226.19571.43
total supply189.80209.18263.27
Table 7. Variable-basis dynamics indicators for parameters related to postal services in Poland in the years 2015–2021. Blue indicates the best performer in a given year, and red the worst performer.
ParametersDynamics of Change in the Postal Services Market in the Years
(Previous Year = 100)
2015201620172018201920202021
Value of postal services market (PLN million)100.00100.18110.12112.12108.44114.10110.30
-postal consignments100.0093.76111.43107.95104.8993.8296.52
-postal parcels100.00101.61102.43100.23106.6296.3690.77
-courier services100.00111.62111.08116.73111.58132.56119.36
-other services100.0079.47103.84113.32107.14100.95104.85
country100.0097.87110.93113.22112.34115.25110.48
abroad100.00109.99107.06107.8092.40108.36109.35
Volumes of postal services (million pieces)100.0094.6898.40103.0797.9499.50103.11
-postal consignments100.0094.3897.65101.4090.8384.6492.51
-postal parcels100.0094.29104.5587.12109.57119.0597.33
-courier services100.00122.01116.67119.67119.58144.45121.84
-other services100.0076.0980.7789.61107.2789.1499.42
Table 8. Fixed-base dynamics indicators for parameters related to postal services in Poland in the years 2015–2021. Blue indicates the best performer in a given period, and red the worst performer.
Market ParametersDynamics of Change in the Postal Services Market (Year 2015 = 100)
2015–20192015–20202015–2021
Value of postal services market (PLN million)134.13153.04168.81
-postal consignments118.30110.99107.13
-postal parcels111.22107.1797.27
-courier services161.49214.06255.51
-other services100.19101.14106.04
country138.09159.14175.83
abroad117.29127.10138.98
Volumes of postal services (million pieces)94.0493.5796.48
-postal consignments84.8871.8566.46
-postal parcels94.10112.02109.04
-courier services203.71294.26358.53
-other services59.0852.6652.36
Table 9. Structure of the postal services market in Poland in the period 2015–2021. Blue indicates the best performer in a given period, and red the worst performer.
Market ParametersStructure of the Postal Services Market in the Years (%)
2015201620172018201920202021
Value of postal services market (PLN million)100.00100.00100.00100.00100.00100.00100.00
-postal consignments41.8039.1239.5938.1236.8730.3226.53
-postal parcels5.565.645.244.694.613.893.20
-courier services42.0146.8147.2249.1650.5958.7763.59
-other services10.638.437.958.037.947.026.68
country80.9479.0879.6680.4483.3484.1784.31
abroad19.0620.9220.3419.5616.6615.8315.69
Volumes of postal services (million pieces)100.00100.00100.00100.00100.00100.00100.00
-postal consignments73.1972.9672.4171.2466.0656.2050.42
-postal parcels1.341.331.411.191.341.601.51
-courier services10.7913.9116.4919.1523.3833.9440.10
-other services14.6811.809.698.429.228.267.97
Table 10. Variable-based dynamics indicators for parameters related to transport services in Poland in 2015–2021. Blue indicates the best performer in a given period, and red the worst performer.
SpecificationThe Dynamics of Change in the Transport Services Market in the Years (Previous Year = 100)
2015201620172018201920202021
Total revenues (PLN million)100.00108.84112.50105.71115.2696.85104.60
-for the carriage of cargo100.00106.34111.03108.70114.14100.32101.93
-for the carriage of passengers100.00106.44120.05111.94112.1672.13120.17
Average employment based on the employment relationship in thousand persons100.00106.33107.07104.08105.7699.91100.27
Average monthly gross wages and salaries of employees based on an employment relationship in PLN100.00102.37105.39106.05107.38105.72105.32
Net turnover profitability in %100.00114.29102.5075.6196.7746.67142.86
Cargo movements in thousands of tonnes100.00101.80111.74106.8085.32117.70102.37
Cargo transport in a million tkm100.00106.90112.79107.4089.65113.30103.55
Passenger transport in thousands100.0098.60100.3895.20103.6454.40112.87
Freight movements in a million pkm100.00102.90113.82105.60127.0933.40133.20
Table 11. Fixed-base dynamics indicators for parameters related to transport services in Poland in 2015–2021. Blue indicates the best performer in a given period, and red the worst performer.
SpecificationDynamics of Change in the Transport Services Market (Year 2015 = 100)
2015–20192015–20202015–2021
Total revenues (PLN million)149.18144.48151.12
-for the carriage of cargo146.49146.96149.80
-for the carriage of passengers160.44115.72139.07
Average employment based on the employment relationship in thousand persons125.32125.20125.55
Average monthly gross wages and salaries of employees based on an employment relationship in PLN122.86129.89136.80
Net turnover profitability in %85.7140.0057.14
Cargo movements in thousands of tonnes103.66122.01124.90
Cargo transport in a million tkm116.09131.53136.21
Passenger transport in thousands97.6553.1259.96
Passenger transport in a million pkm157.1852.5069.93
Table 12. Kendall’s tau correlation coefficients between GDP value and parameters related to logistics services in Poland in 2015–2021.
Tested ParametersKendall’s Tau Correlation Coefficient in Years
2015–20192015–20202015–2021
τp-Valueτp-Valueτp-Value
Correlation coefficients between the value of GDP and
Total revenues of companies in the top 10 of the TSL ranking (PLN million)1.0000.0281.0000.0091.0000.003
Gross take-up of warehouse space (million m2)0.7380.1300.8280.0350.8780.001
Total supply of warehouse space (million m2)1.0000.0281.0000.0091.0000.003
Share of rentals in total warehouse space (%)−0.4000.221−0.4670.133−0.2380.368
Vacancy rate of warehouse space (%)0.1051.0000.4140.3390.0000.879
The total value of the postal services market (PLN million)1.0000.0281.0000.0091.0000.003
Value of postal services—letter mail (PLN million)0.8000.0860.6000.1330.4290.230
Value of postal services—parcels (PLN million)1.0000.0280.8670.0240.3330.368
Value of postal services—courier services (PLN million)1.0000.0281.0000.0091.0000.003
Value of postal services—other services (PLN million)0.4000.4620.6000.1330.7140.036
Value of domestic postal services (PLN million)0.8000.0860.8670.0240.9050.007
Value of international postal services (PLN million)0.6000.2210.7330.0600.8100.016
The total volume of postal services (million pieces)−0.4000.221−0.4670.133−0.1430.548
Volume of postal services—letter mail (million items)−0.8000.028−0.8670.009−0.9050.003
Volume of postal services—parcels (million items)−0.6000.086−0.0670.7070.1430.764
Volume of postal services—courier services (million items)1.0000.0281.0000.0091.0000.003
Volume of postal services—other services (million pieces)−0.8000.028−0.8670.009−0.9050.003
Revenues from all transport activities (PLN million)1.0000.0280.8670.0240.9050.007
Cargo revenues (PLN million)1.0000.0281.0000.0091.0000.003
Passenger revenues (PLN million)1.0000.0280.6000.1330.5240.133
Average employment based on the employment relationship in transport (thousands)1.0000.0280.8670.0240.9050.007
Average monthly gross wages and salaries of employees in transport (PLN)1.0000.0281.0000.0091.0000.003
Return on net turnover in transport (%)−0.4000.221−0.6000.060−0.6190.036
Cargo transport (thousand tonnes)0.6000.2210.7330.0600.8100.016
Cargo transport (million tkm)0.6000.2210.7330.0600.8100.016
Passenger transport (thousands of persons)−0.6000.086−0.7330.024−0.7140.016
Passenger transport (million pkm)1.0000.0280.3330.4520.0481.000
Publisher’s Note: MDPI stays neutral with regard to jurisdictional claims in published maps and institutional affiliations.

