
The Evaluation of Rock Mass Characteristics against Seepage for Sustainable Infrastructure Development


Abstract
:1. Introduction
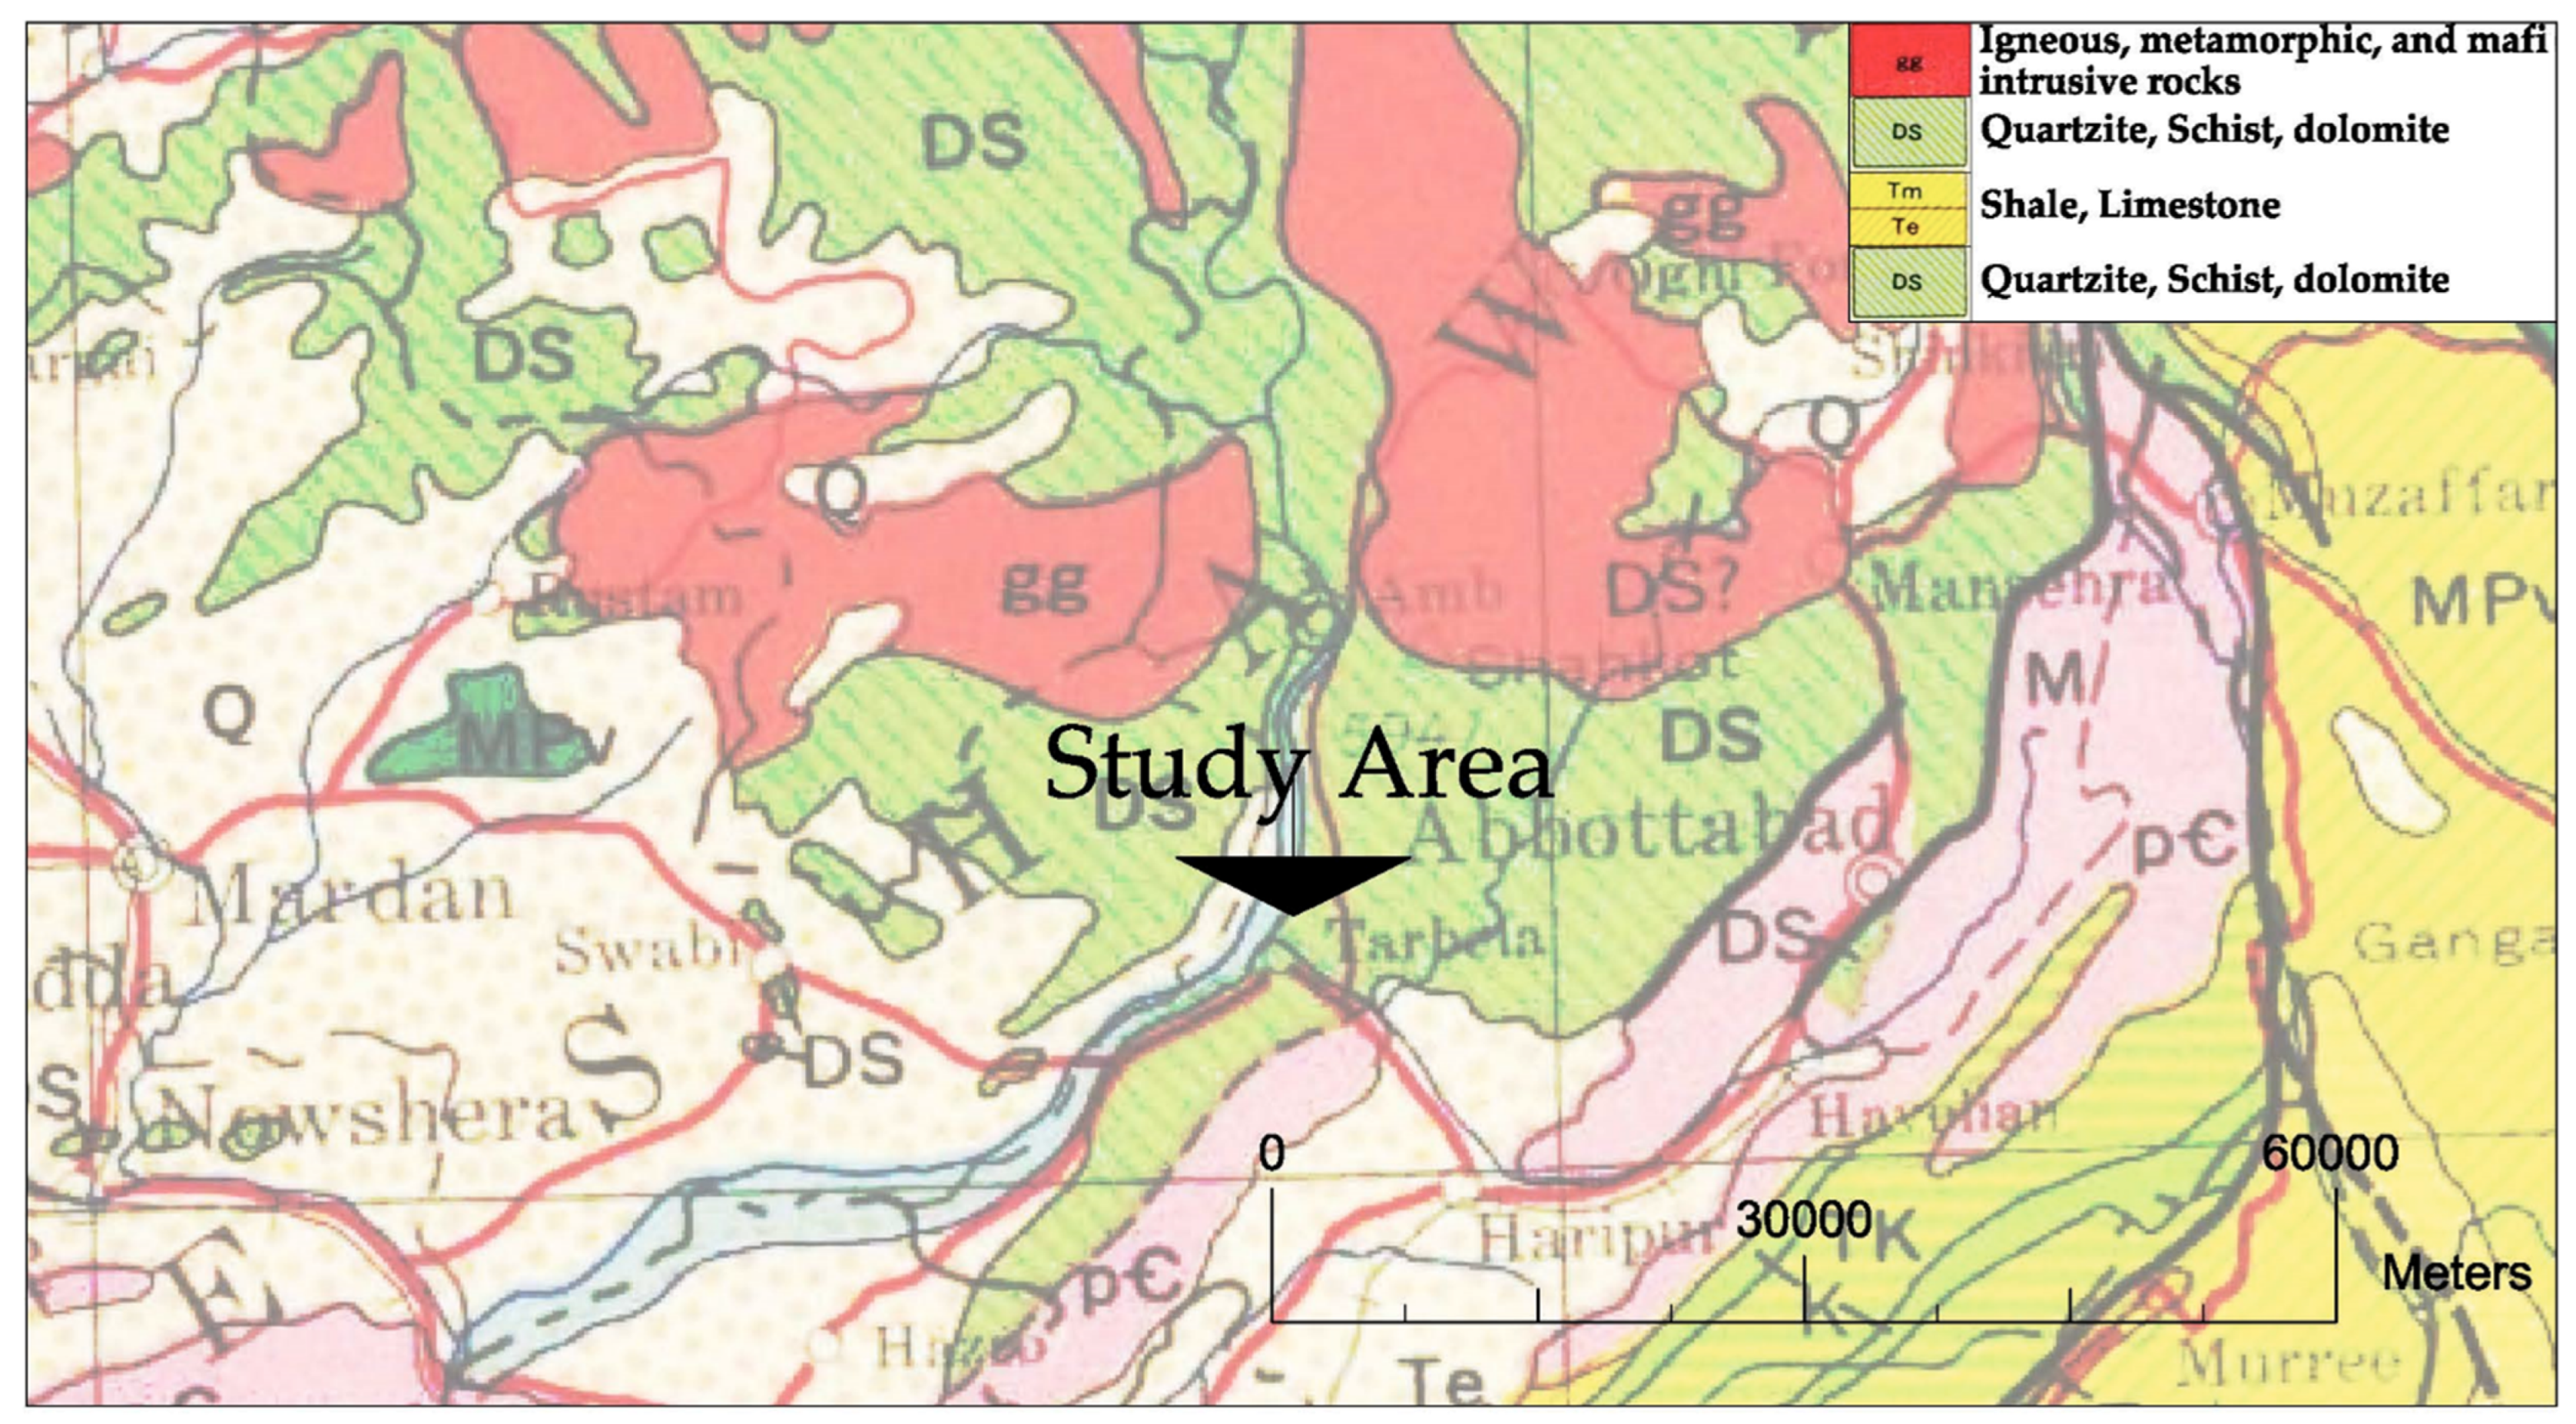
2. Materials and Methods
- Extensive review of literature related to rock mass formation, distribution, and seepage characteristics in Pakistan and other countries. Different stakeholders involved in the infrastructure development projects on rock mass, such as the Geological Survey of Pakistan (GSP), Water and Power Development Authority of Pakistan [43], etc., were approached for guidance in study area selection and a collection of necessary geo-mechanical engineering data.
- Based on a review of literature and meetings with stakeholders, the study area was selected.
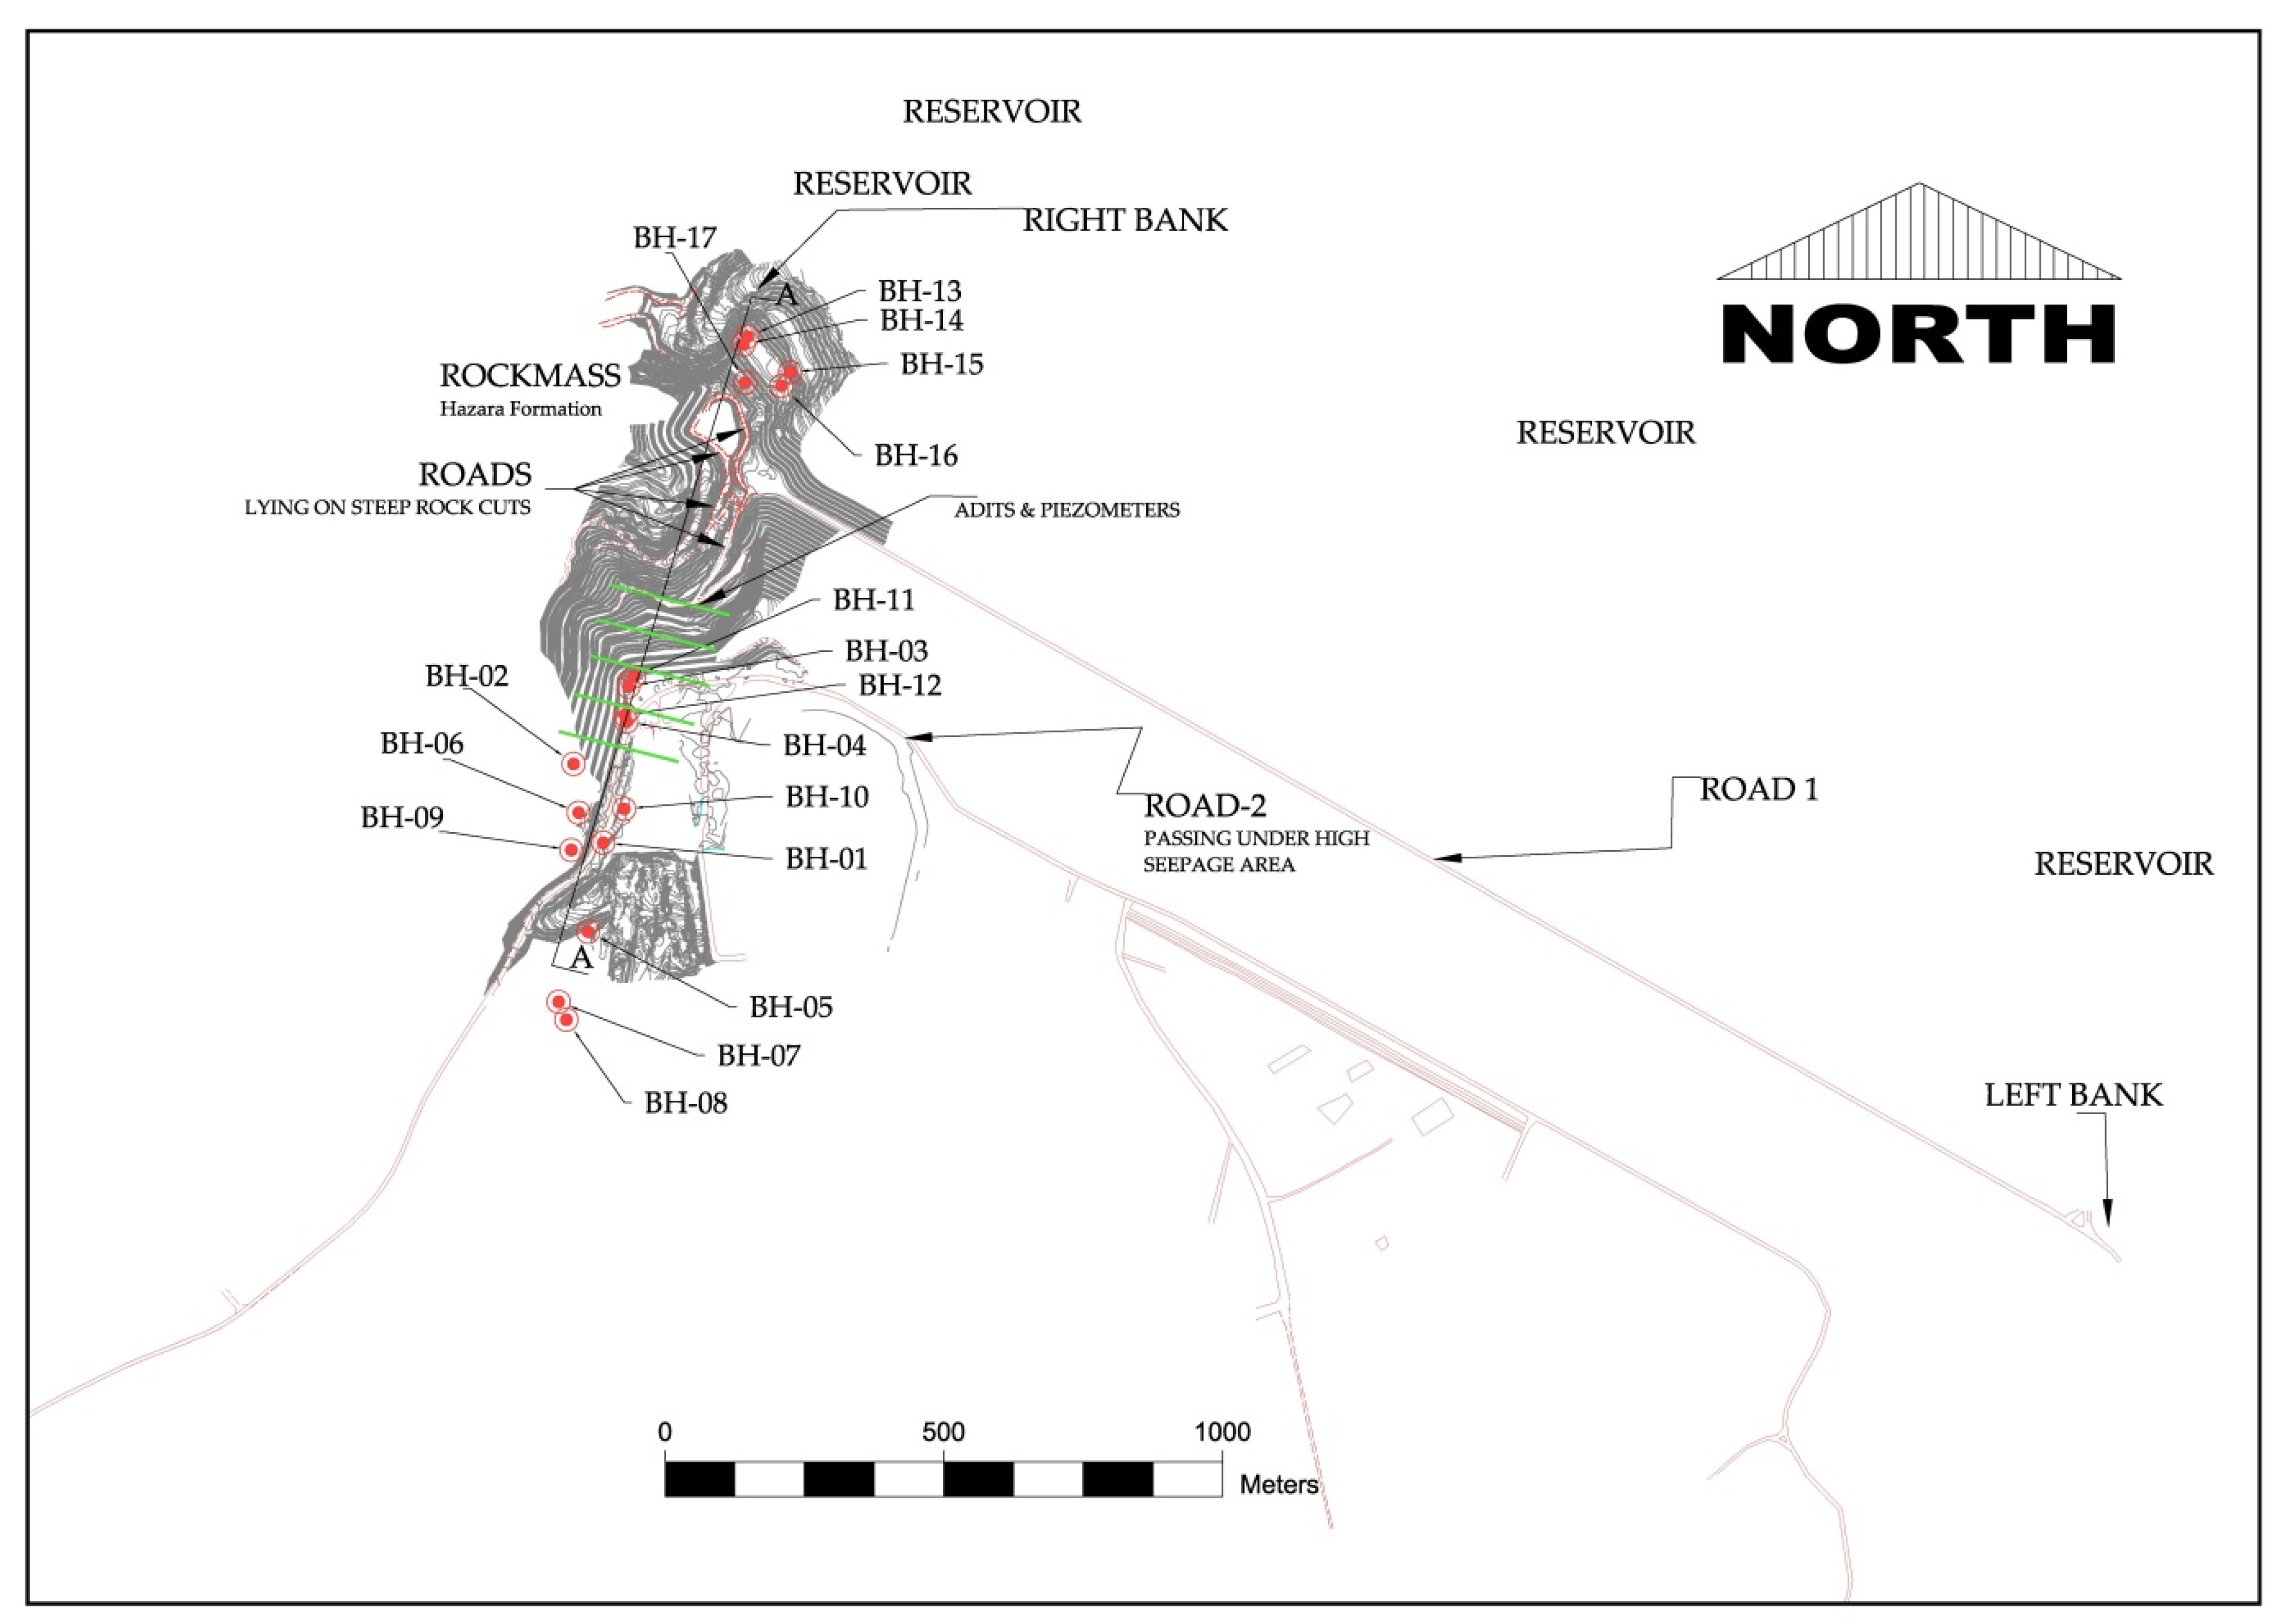
- A reconnaissance survey was carried out as per the guidelines of International Society of Rock Mechanics (ISRM) for study area profiling.
- Analysis of rock mass types, discontinuities/fault lines, etc., of the study area was carried out from the database of the Geological Survey of Pakistan.
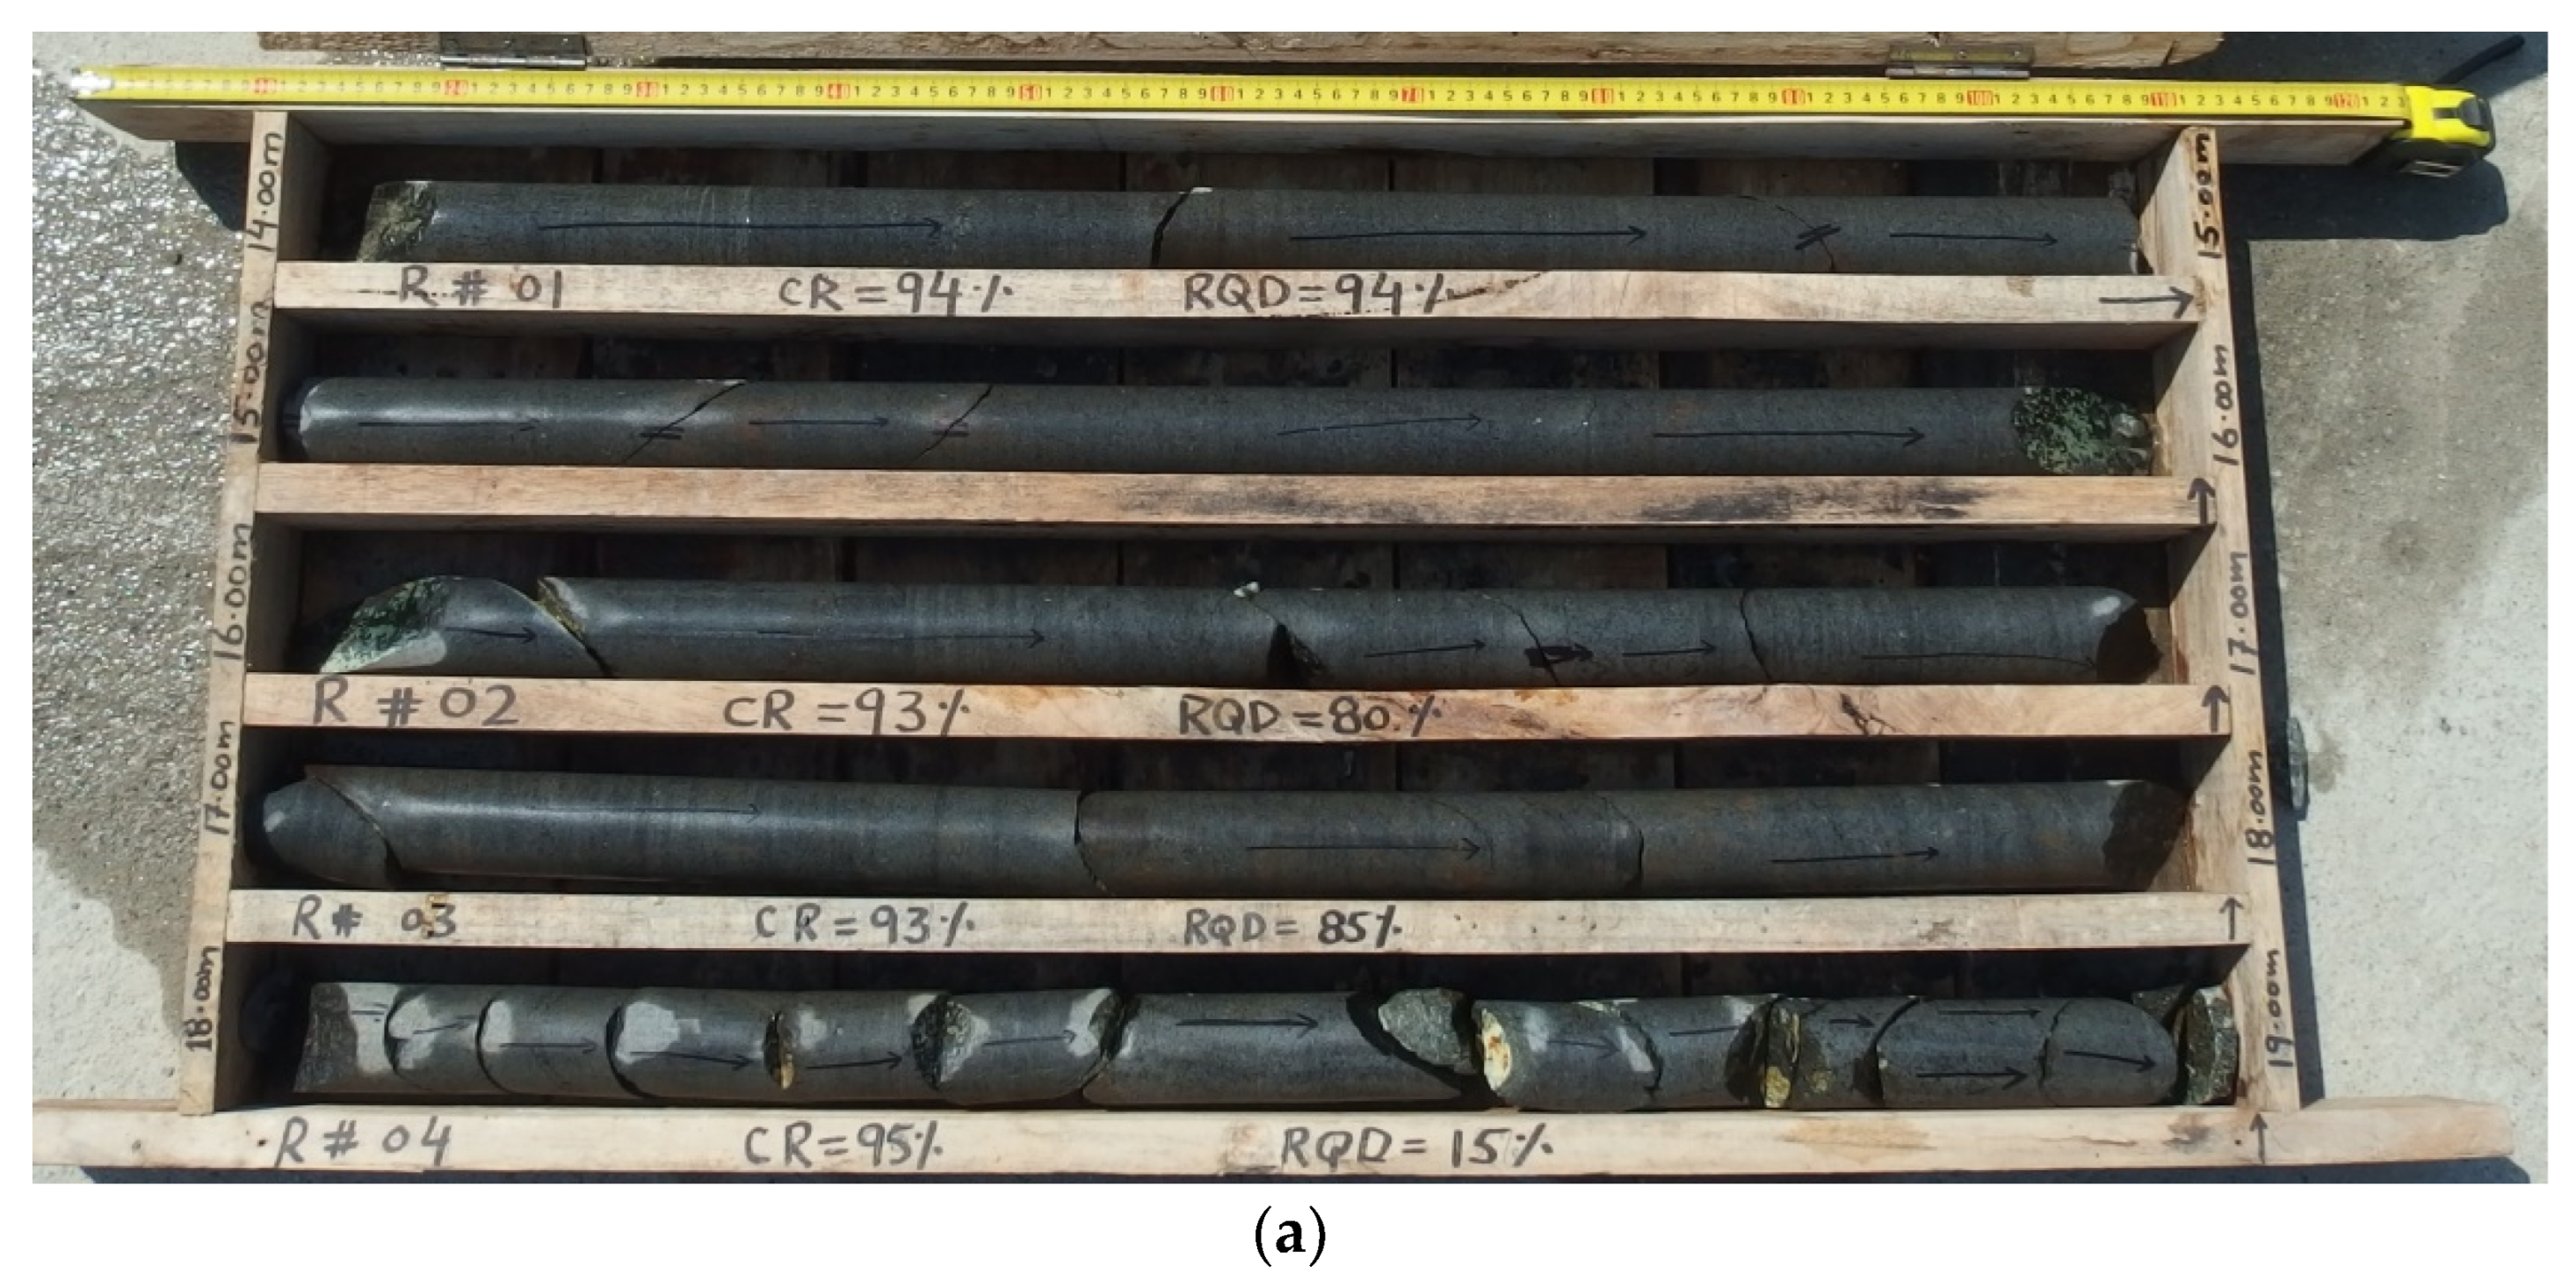
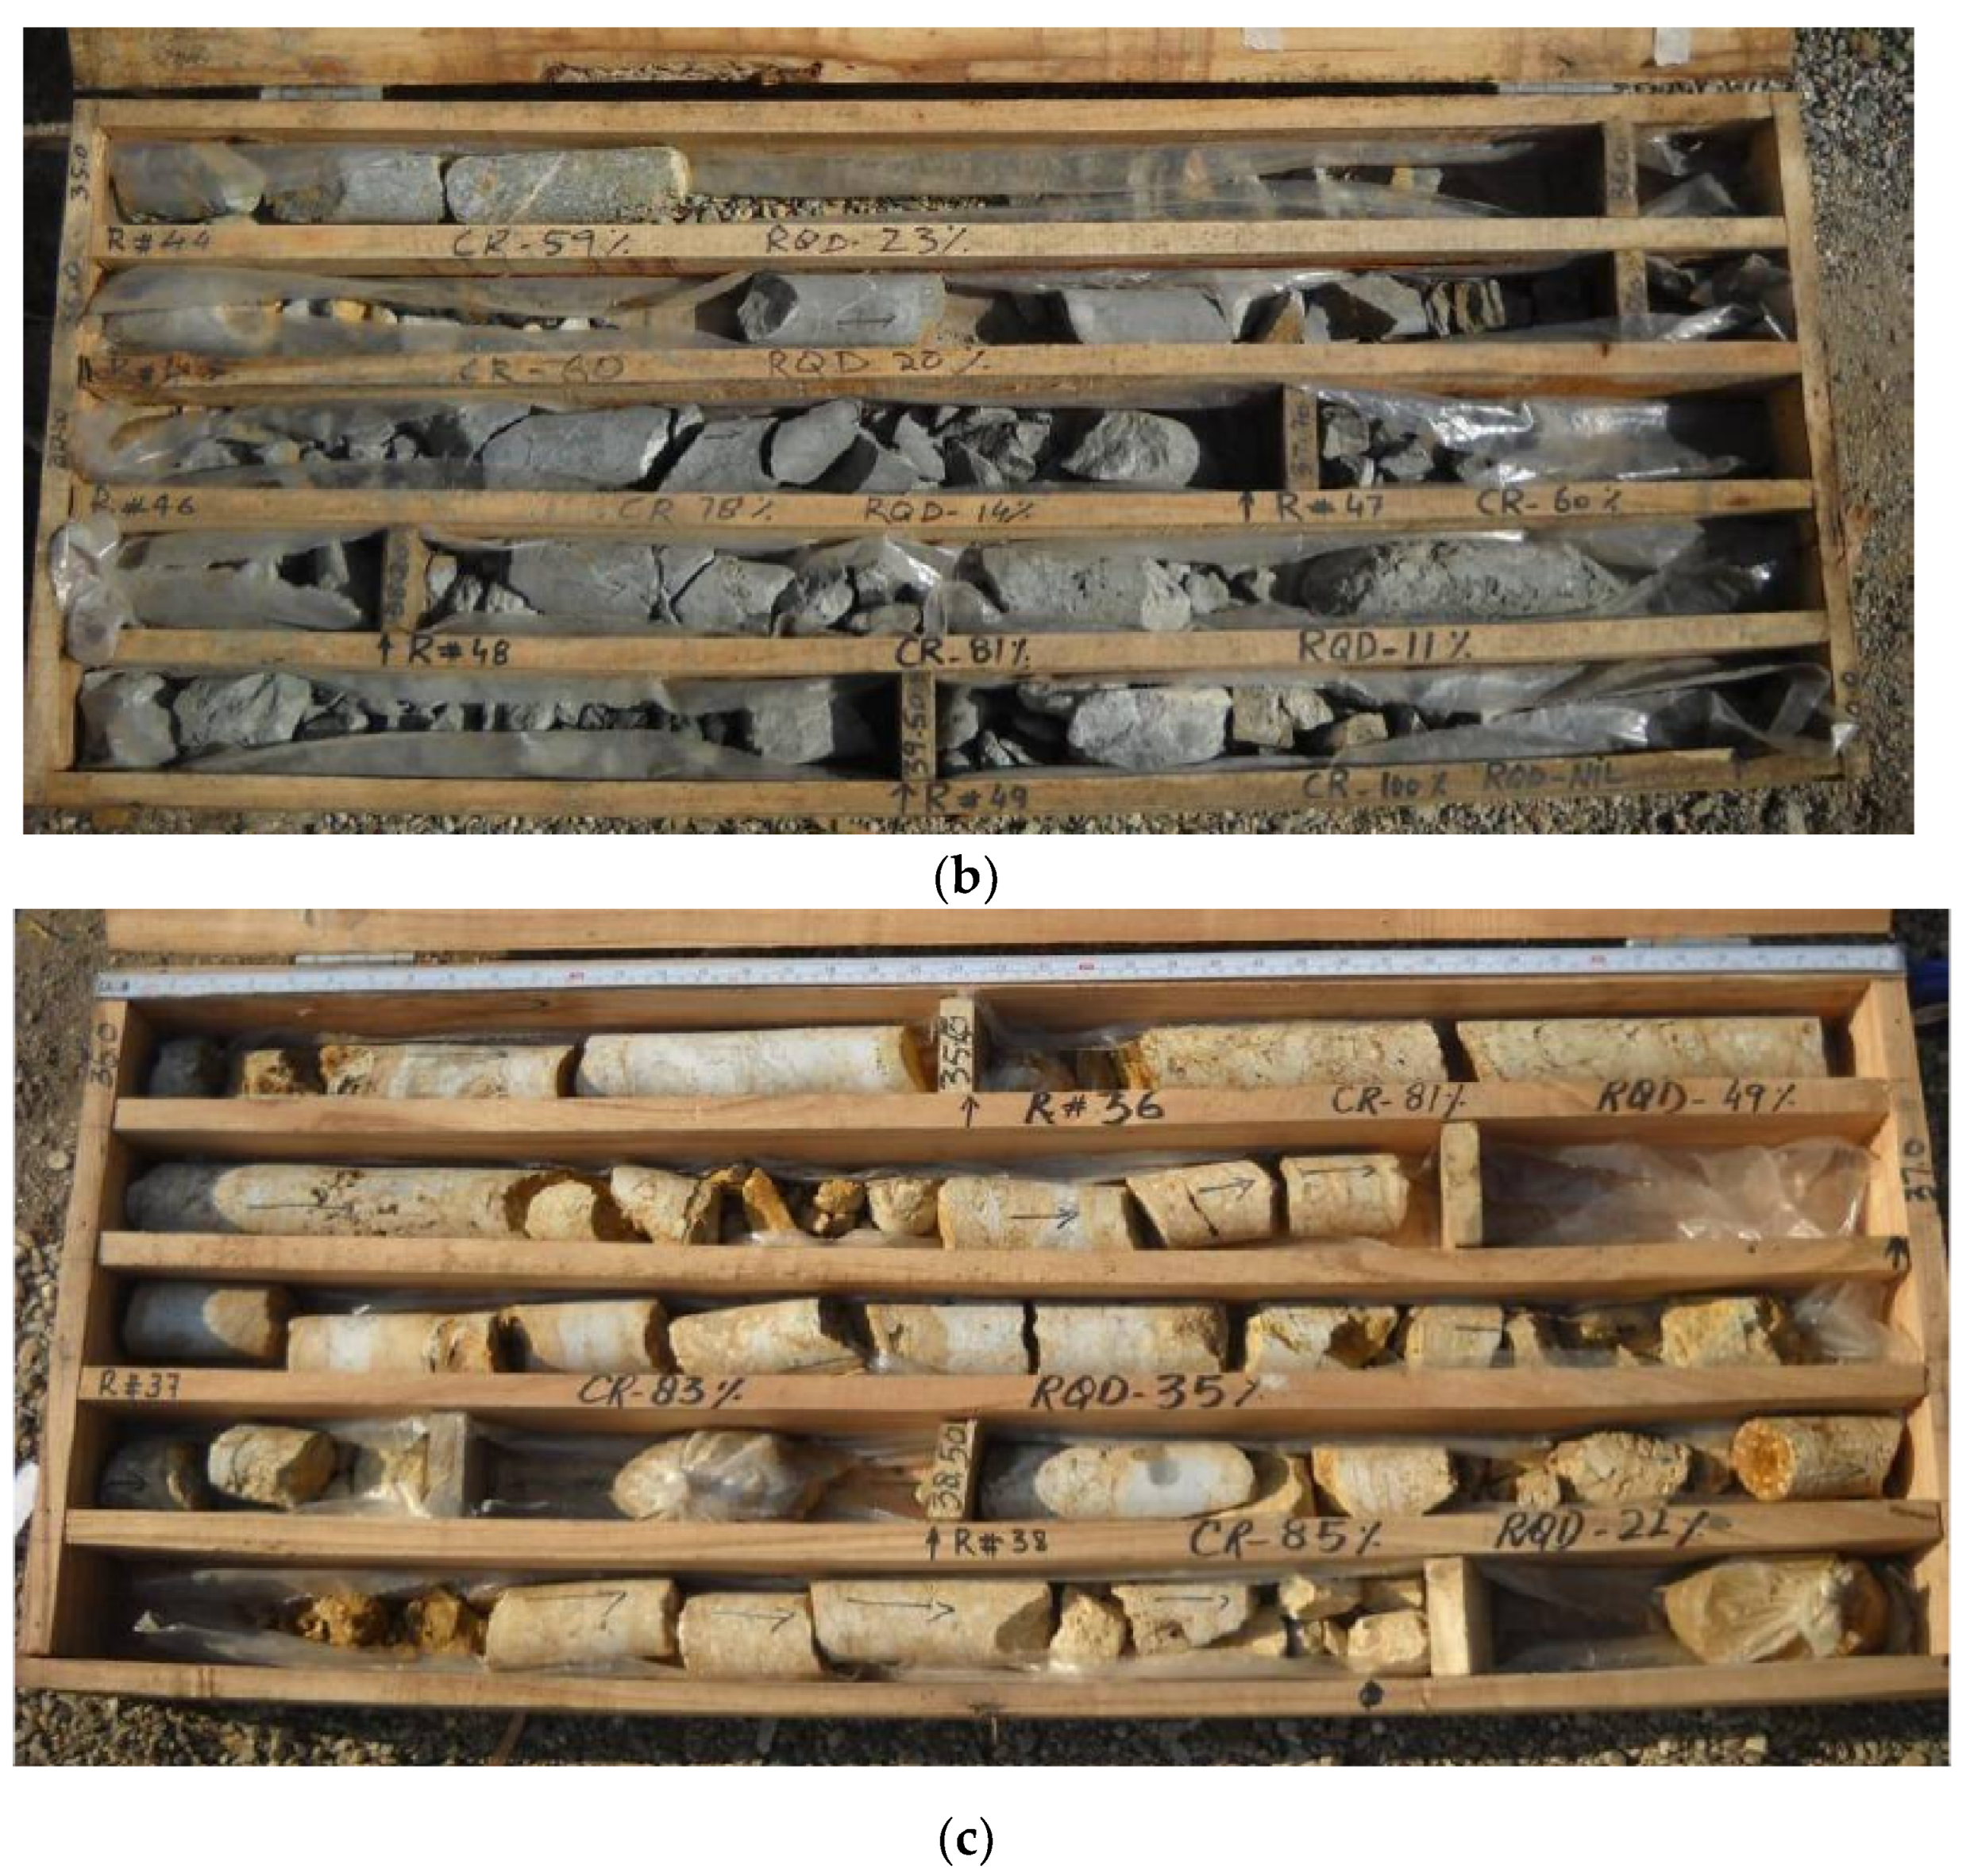
- Field and laboratory tests (rock coring, Lugeon, uniaxial, triaxial, Hoek direct shear, point load index, etc.) and data (geological and geotechnical) obtained from WADPA were analyzed in accordance with relevant ASTM/ISRM standards.
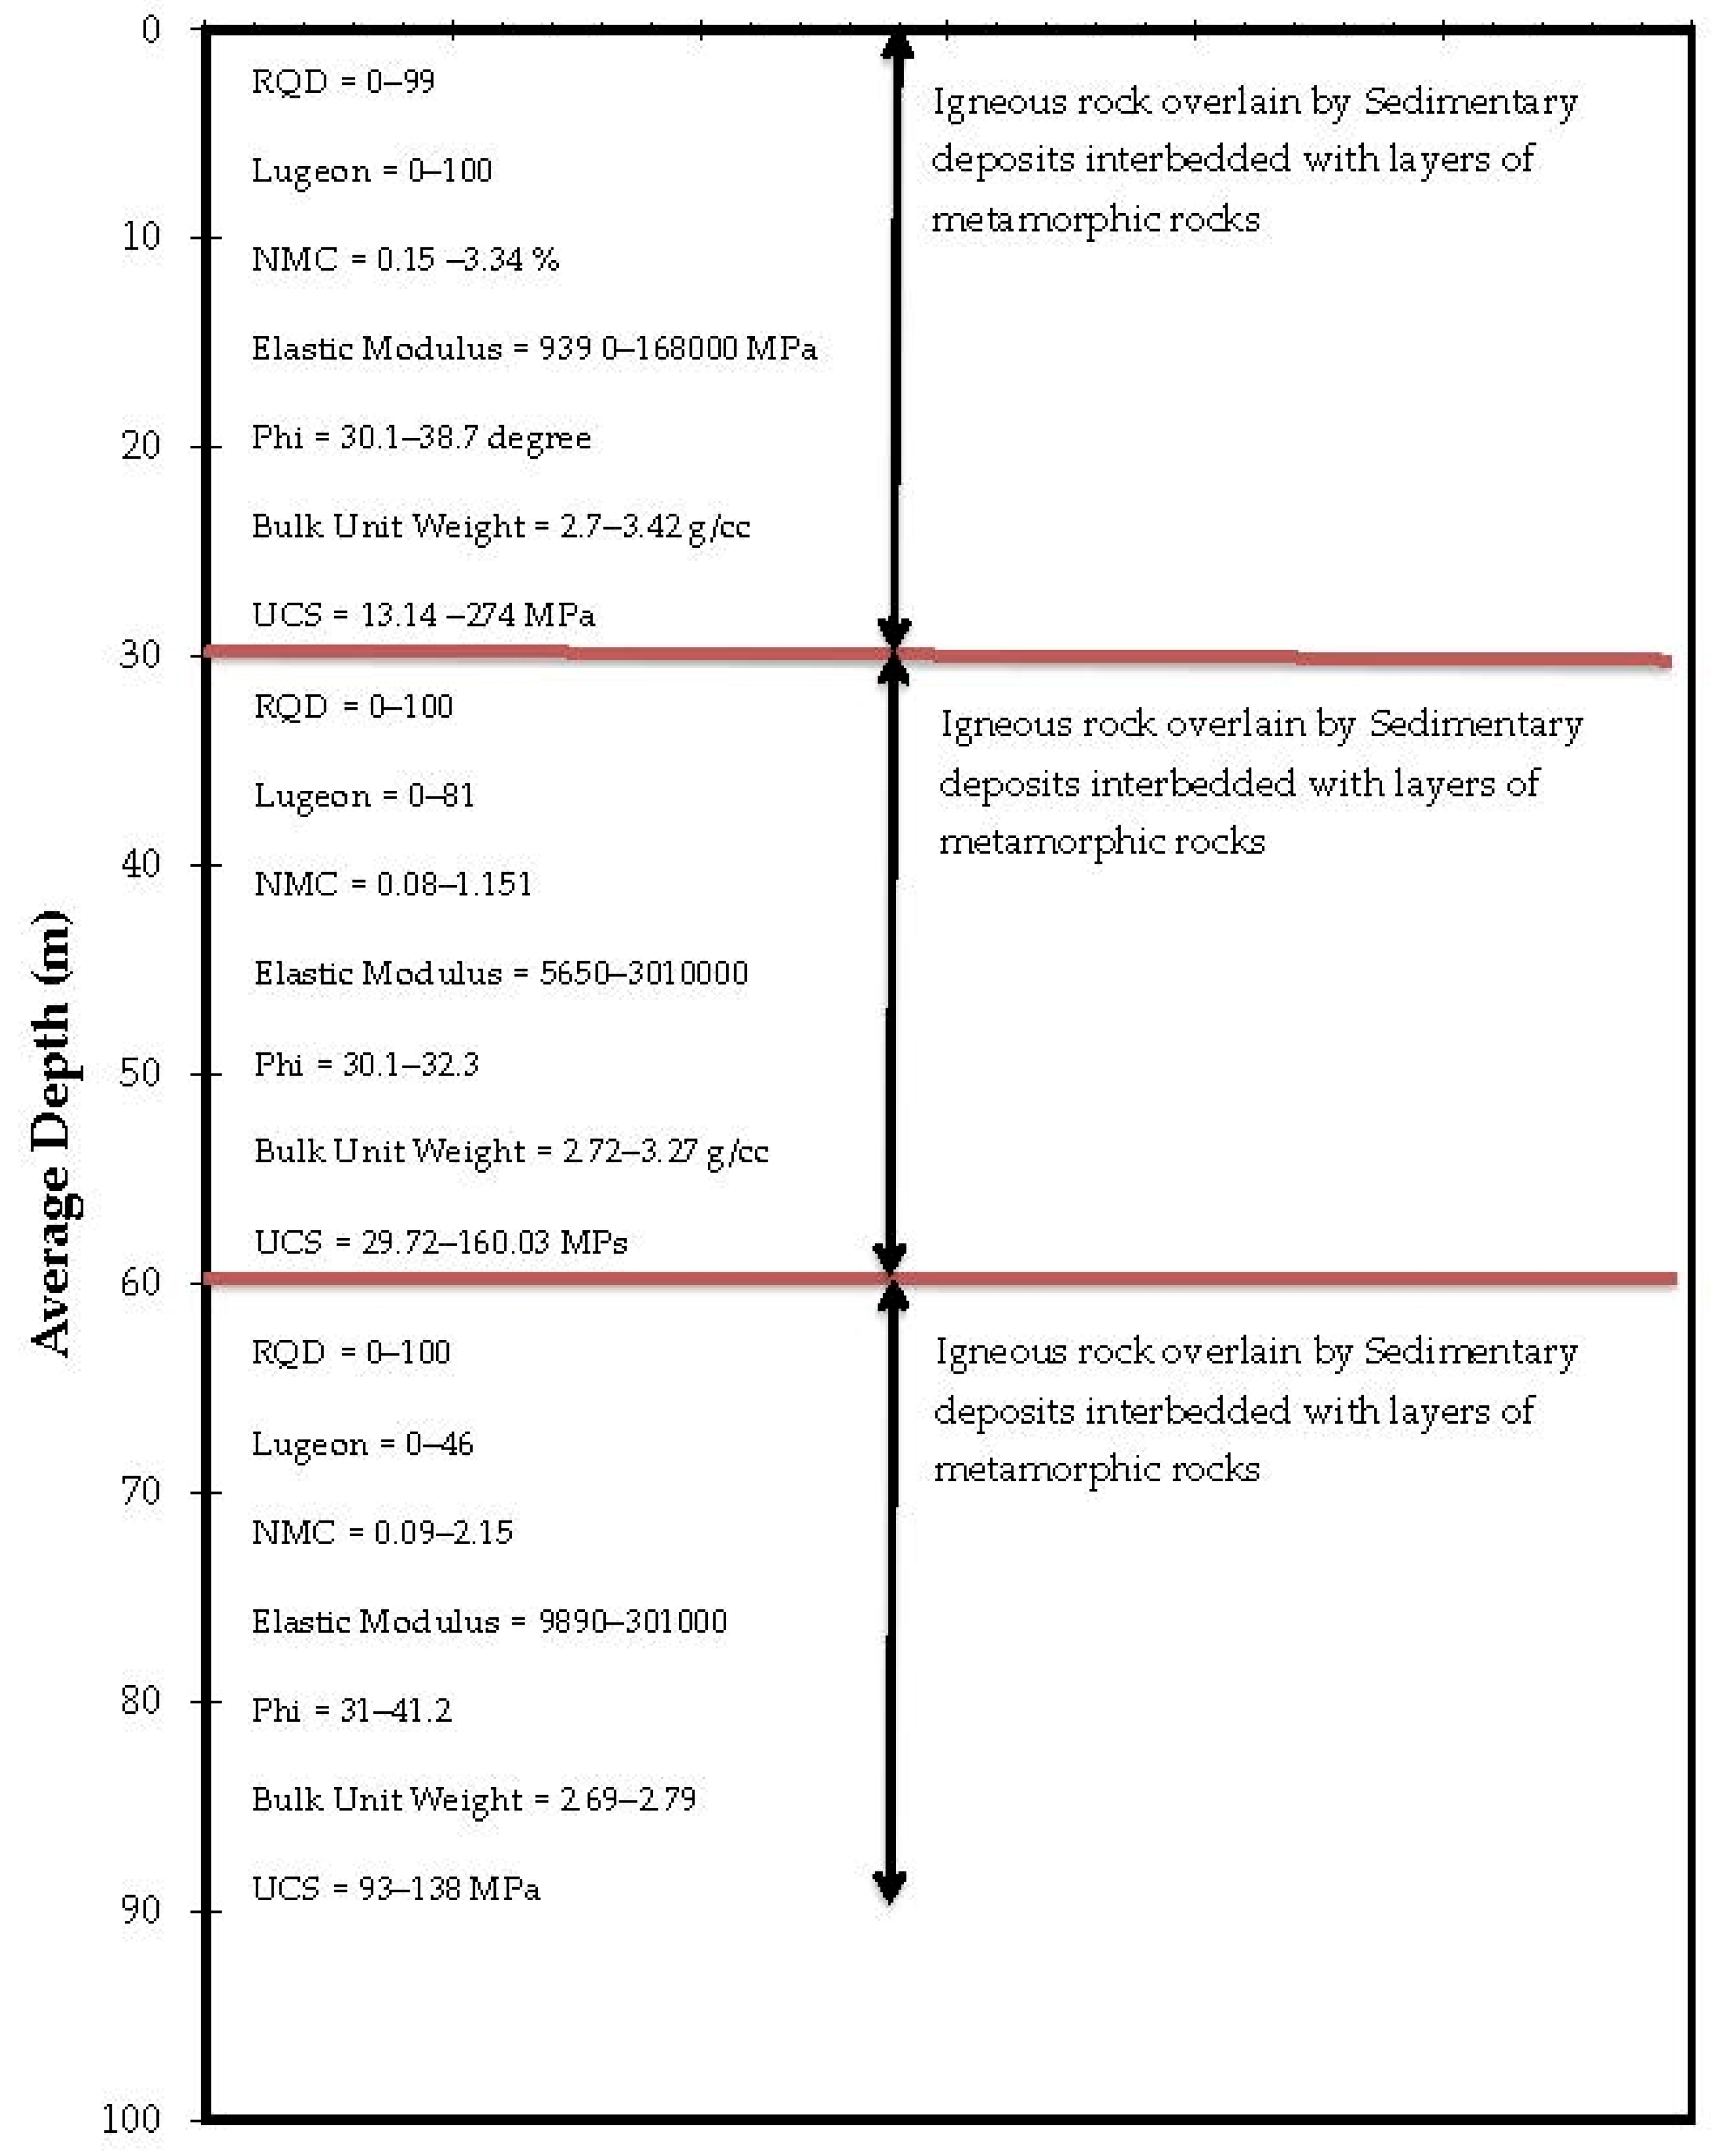
- The rock types were classified based on the Rock Quality Designation (RQD) classification system and petrographic analysis. Determination of different rock mass properties including RQD, hydraulic conductivity, uniaxial compression strength, cohesion, friction angle, tensile strength, young’s modulus, poison’s ratio, specific gravity, void ratio, water absorption, seepage characteristics (hydraulic conductivity (K), anisotropy hydraulic conductivity (K ratio (Ky/Kx)), etc., were carried out.
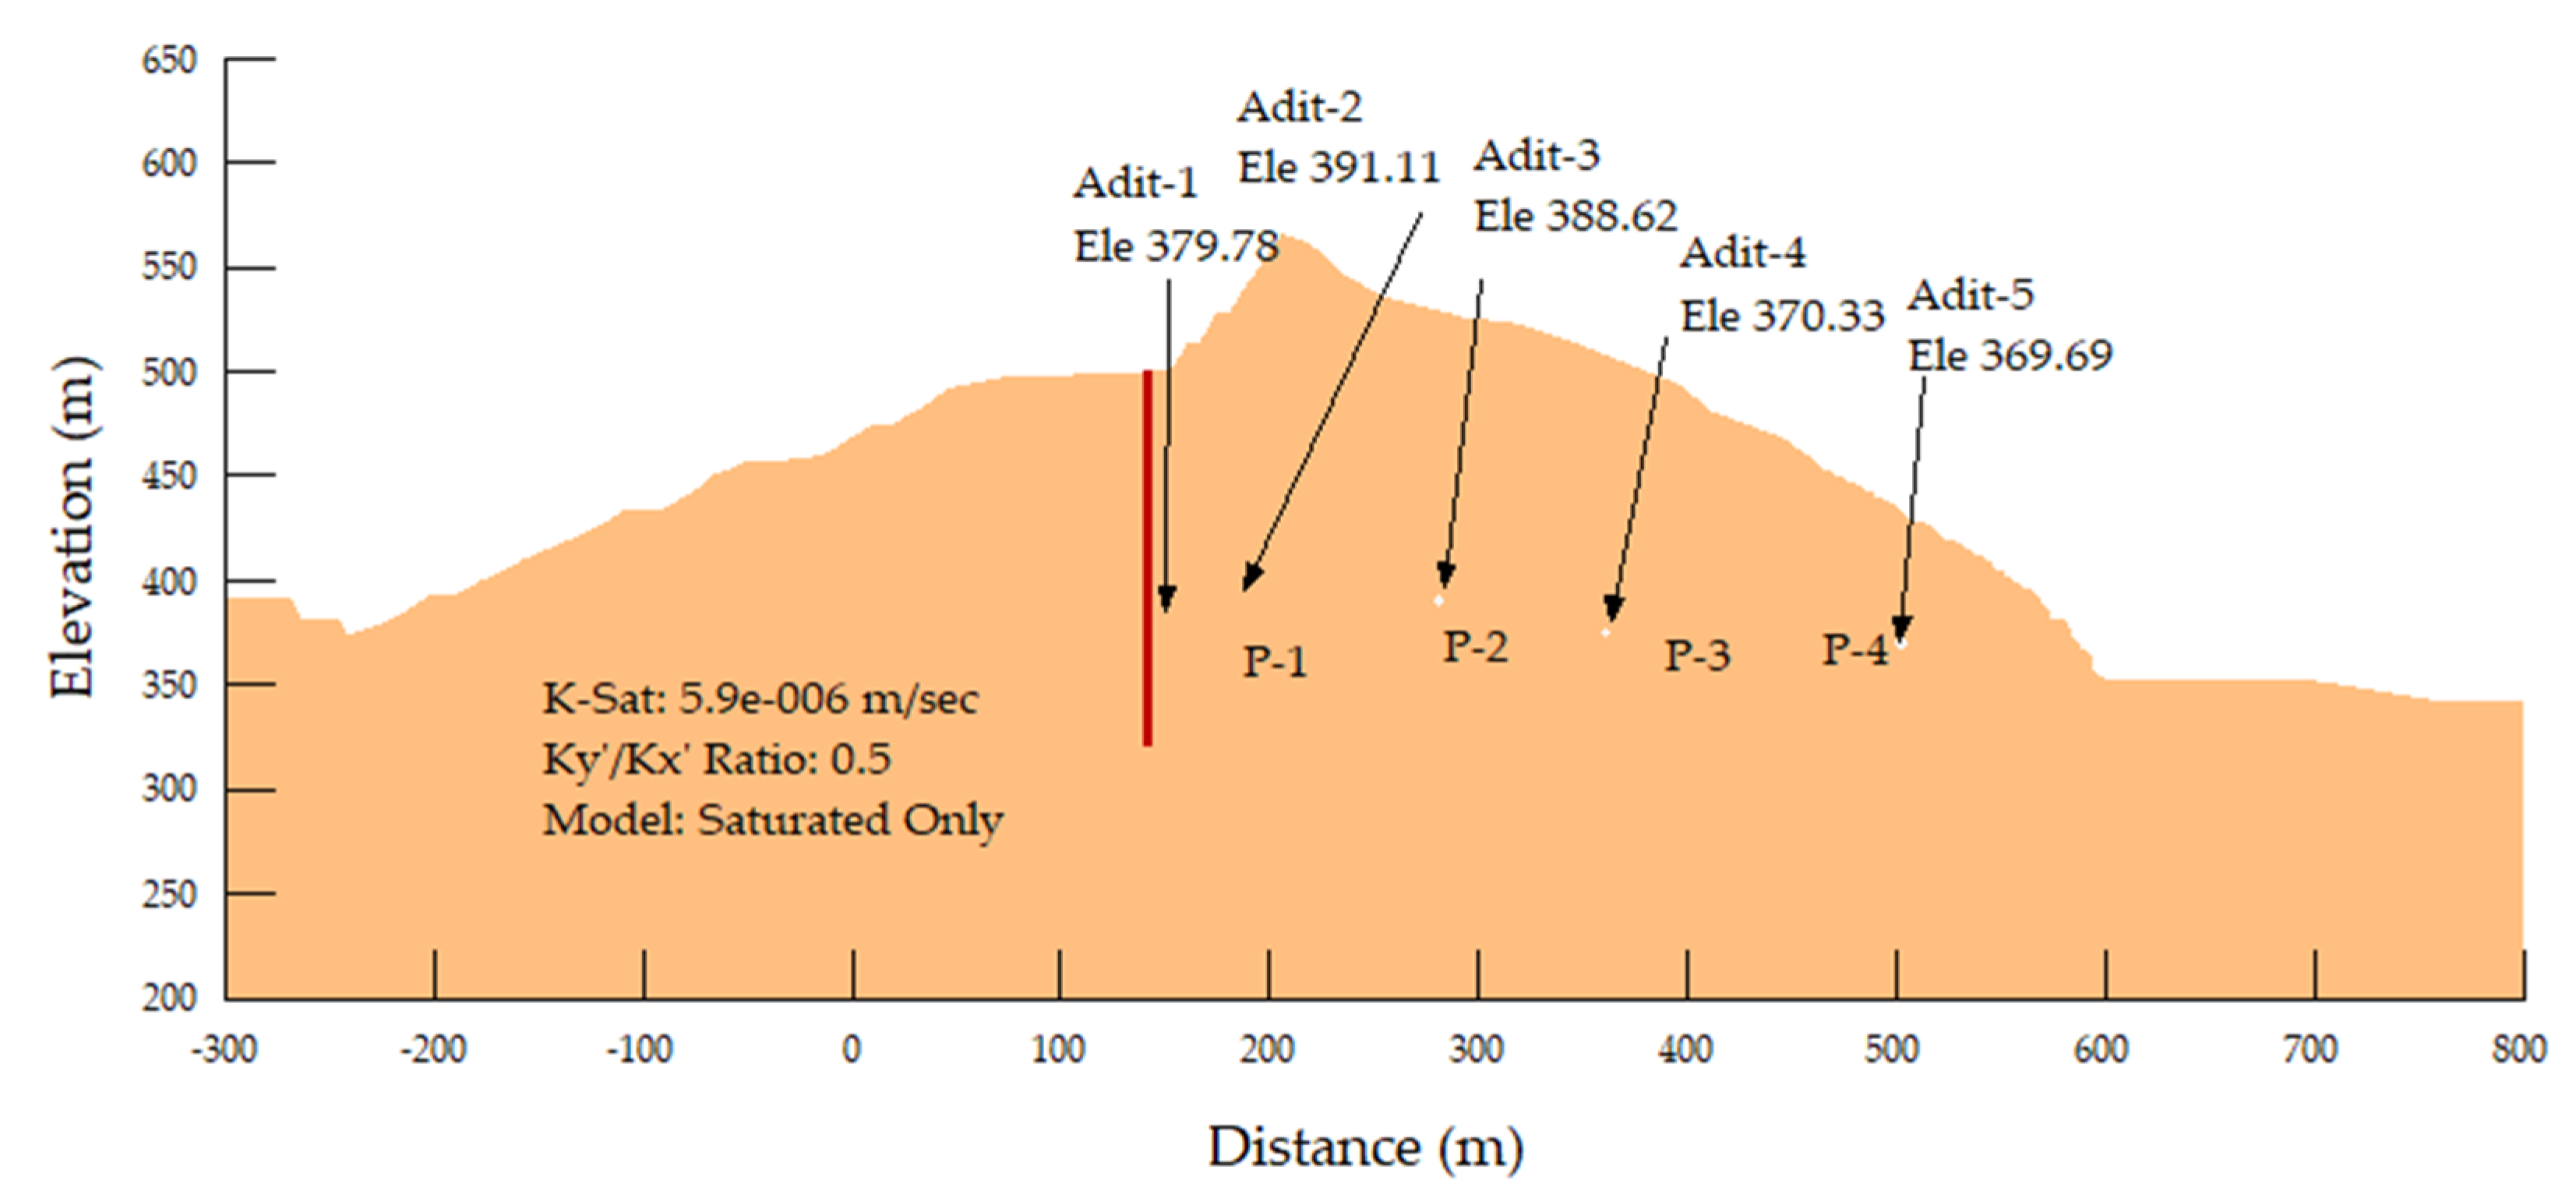
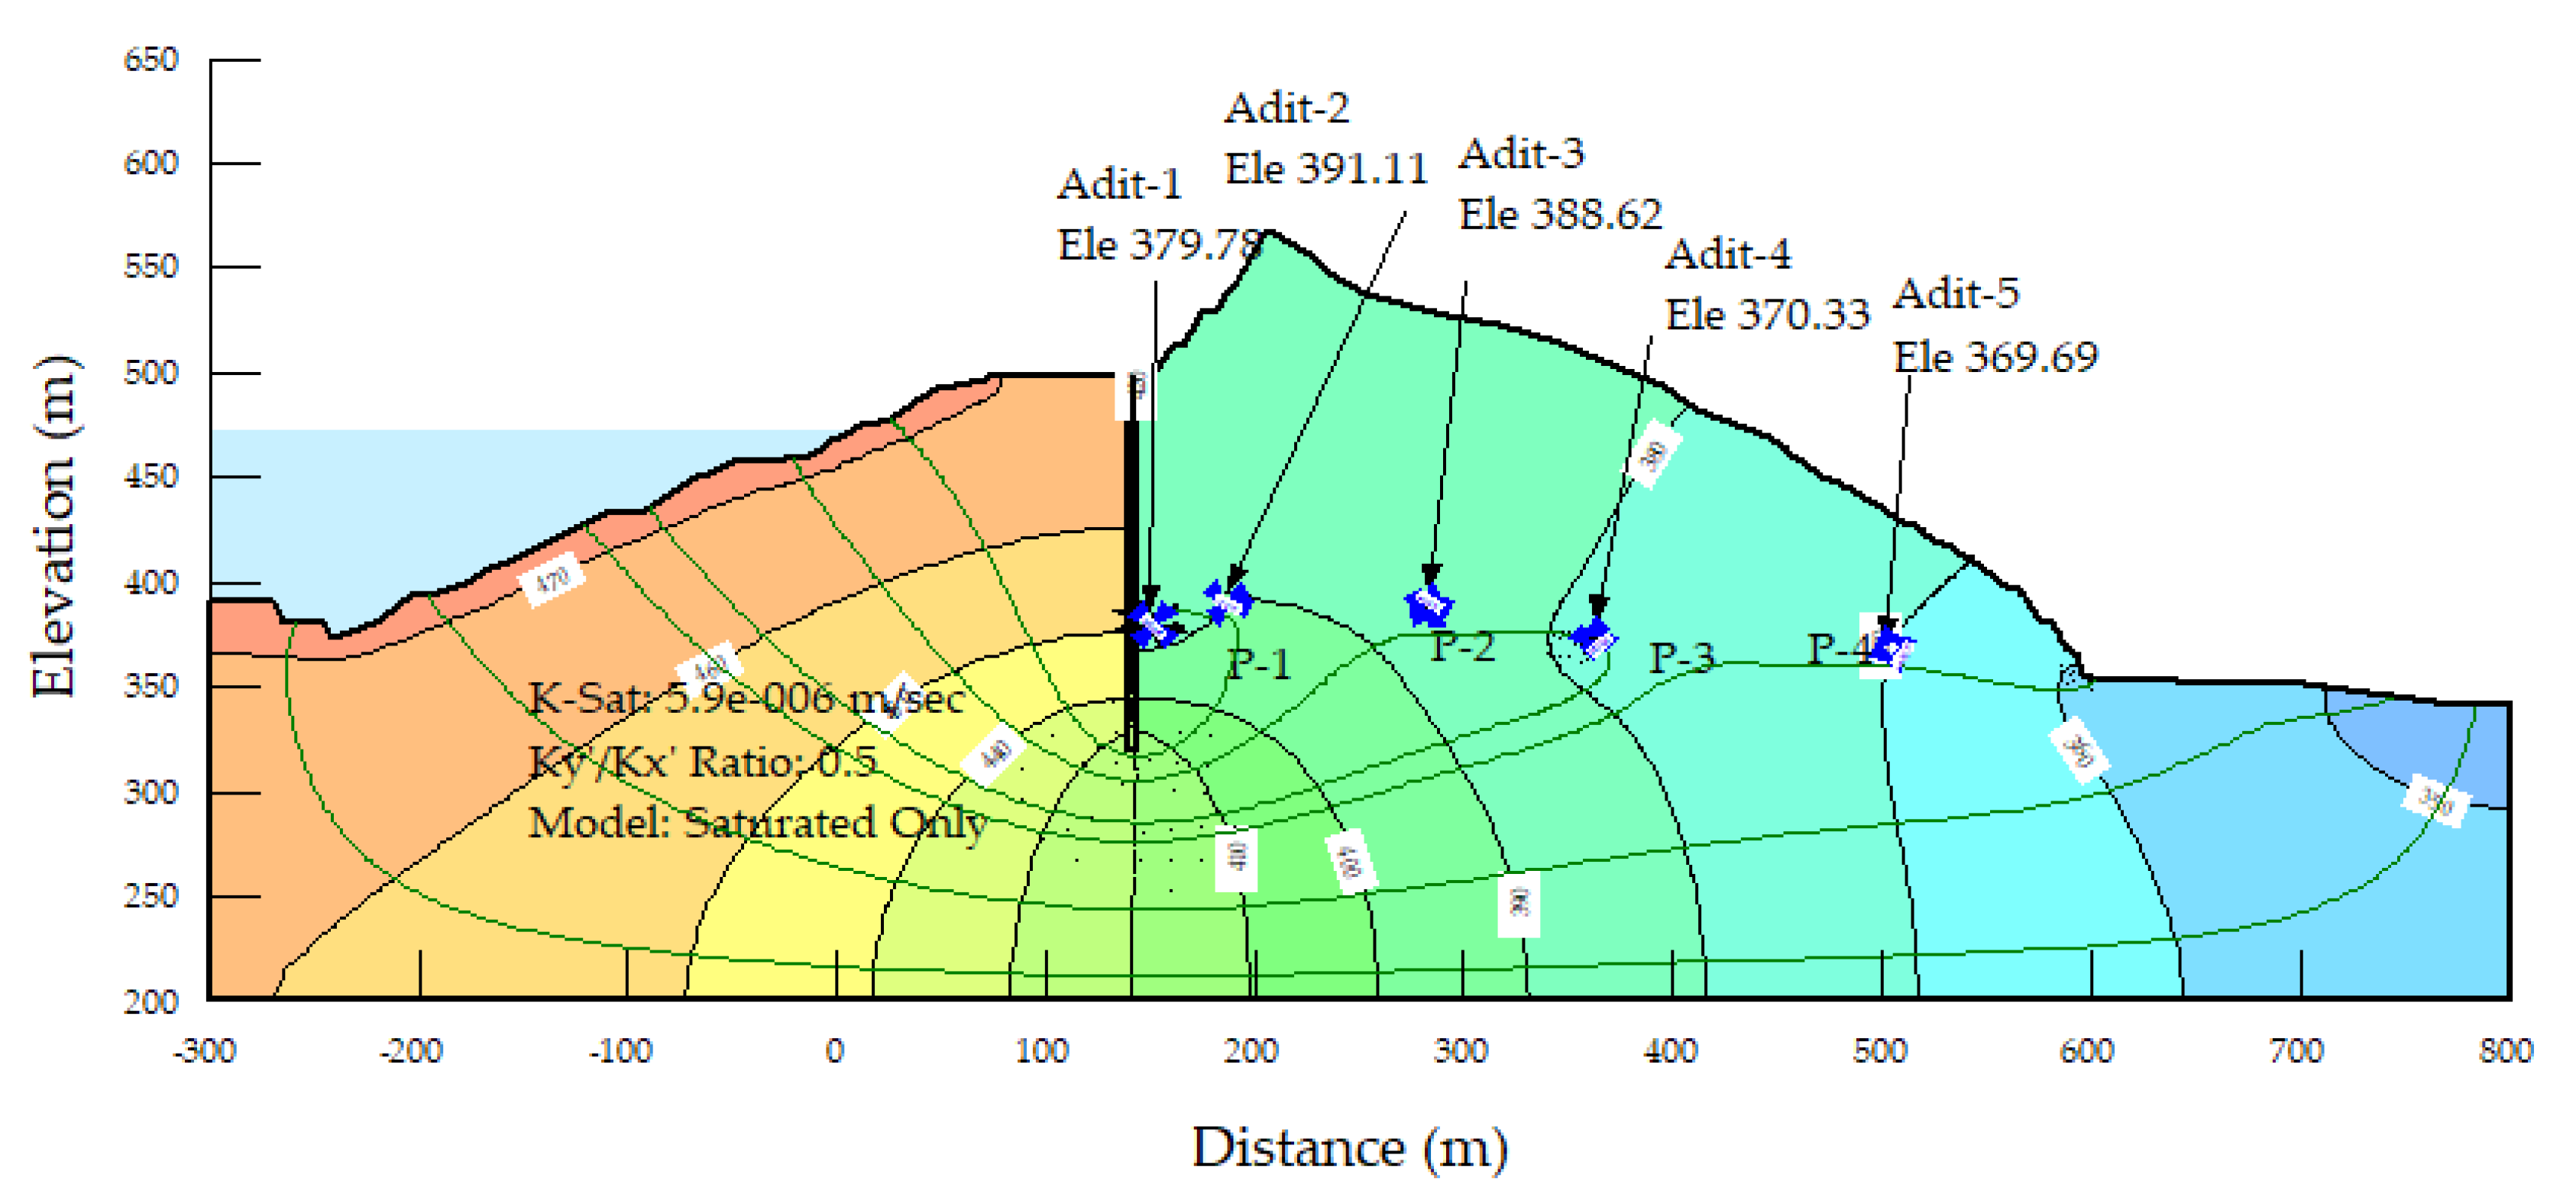
- A seepage analysis model of the rock mass observed at the study area was also prepared using Seep W software. The input parameters, such as K, Ky/Kx, and boundary conditions were established for the model, keeping the nomenclature of the study area.
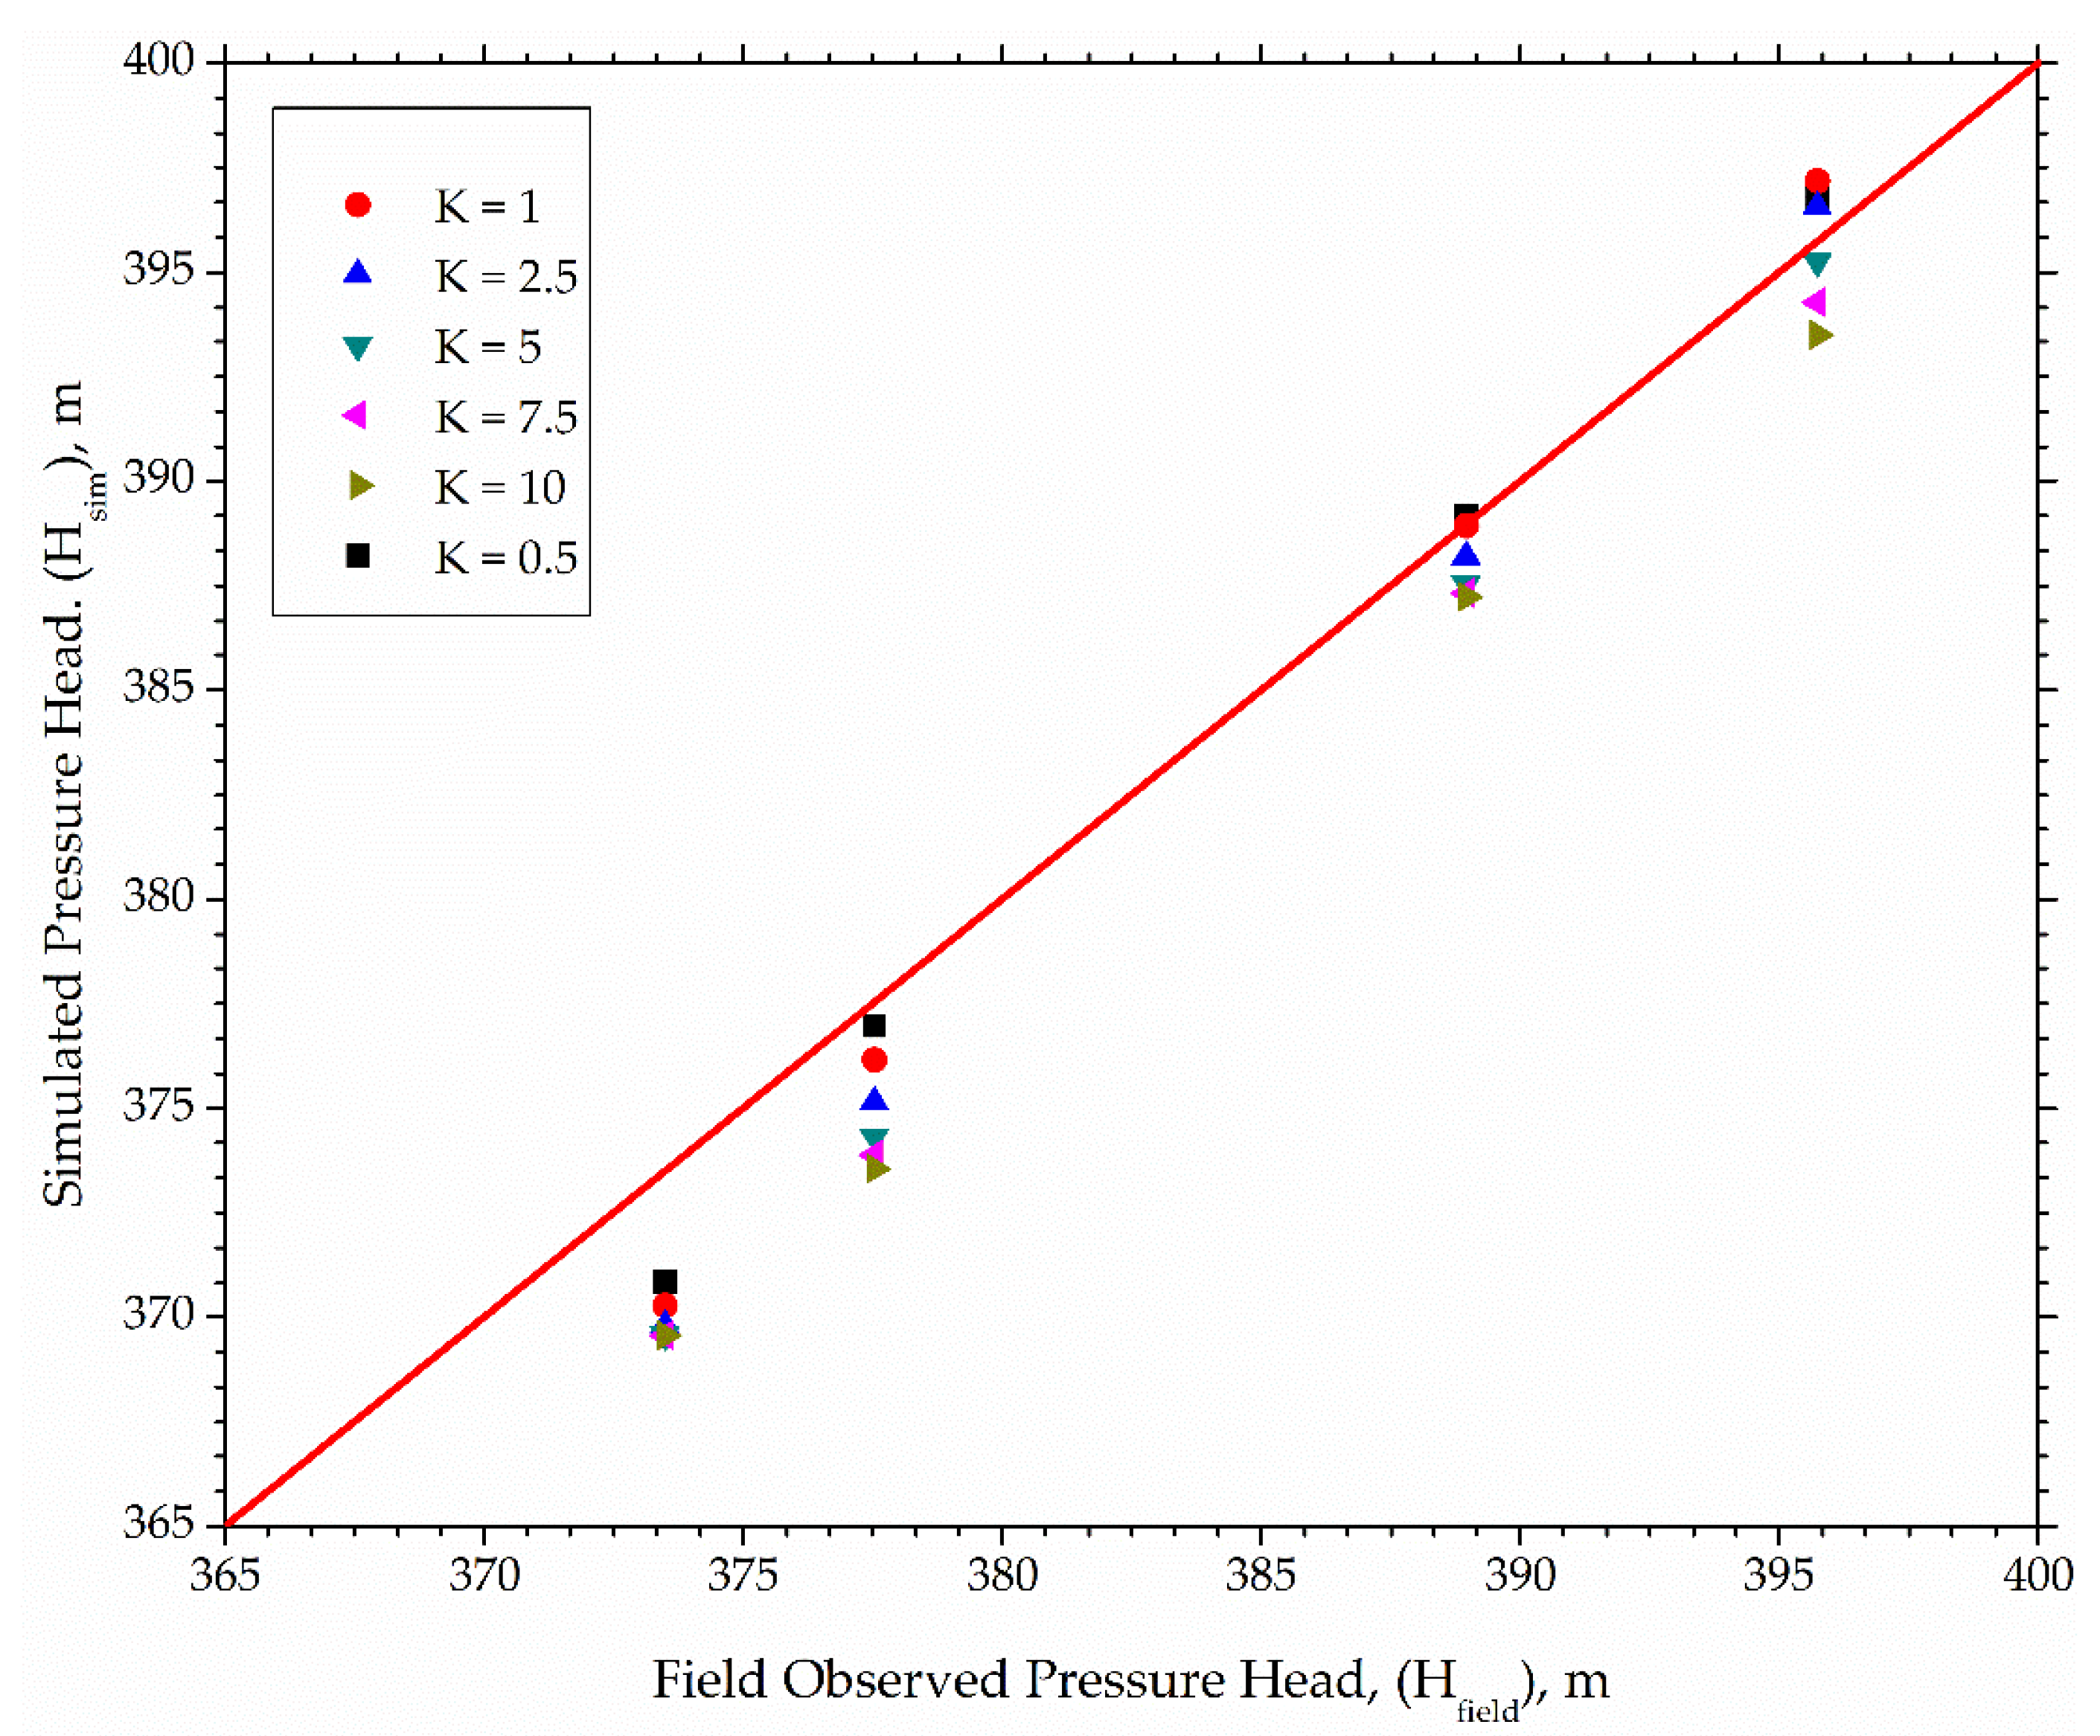
- In the study area, actual seepage data obtained from adits and piezometers were also compared with seepage characteristics (discharge and pressure head) obtained through Finite Element Model (FEM) Seep W model. Trends between seepage characteristics in rock mass were also plotted for assessment of the necessary seepage profile of the rock mass.
- Suitable correlations between RQD and hydraulic conductivity for observed rock mass were proposed.
3. Results & Discussions
4. Conclusions
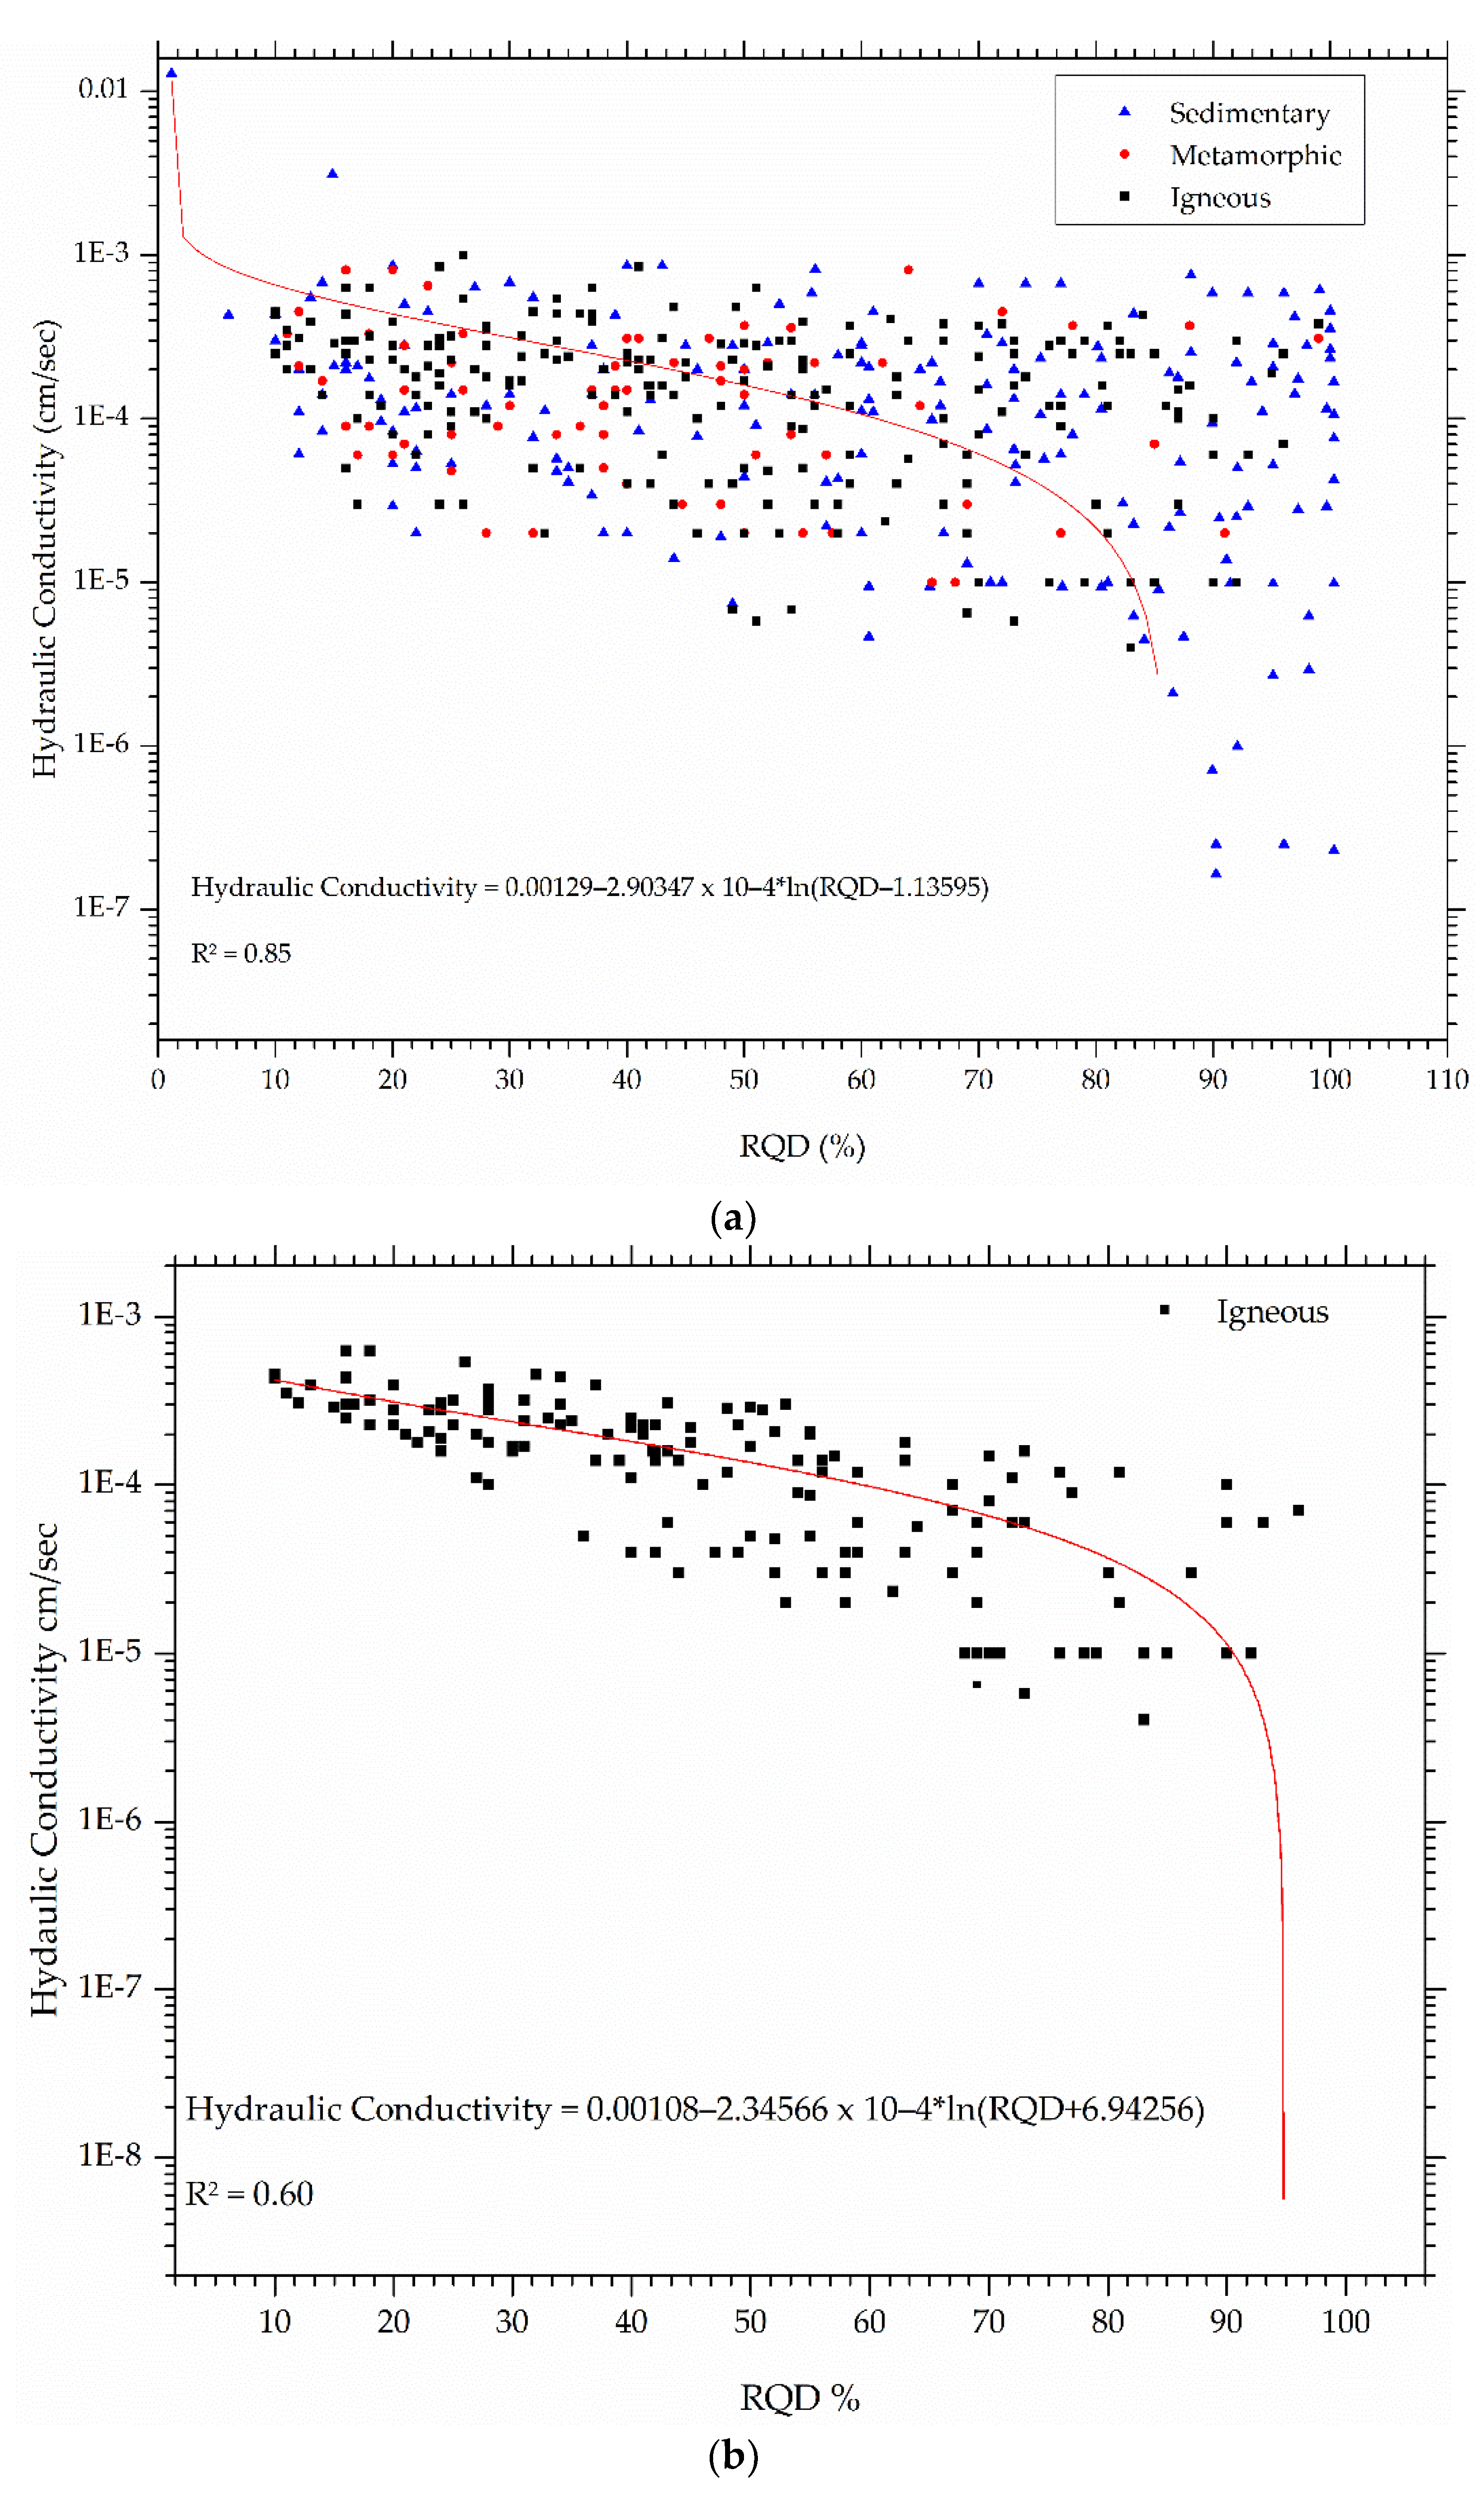
- A strong correlation exists between RQD and hydraulic conductivity of the composite rock mass formation.
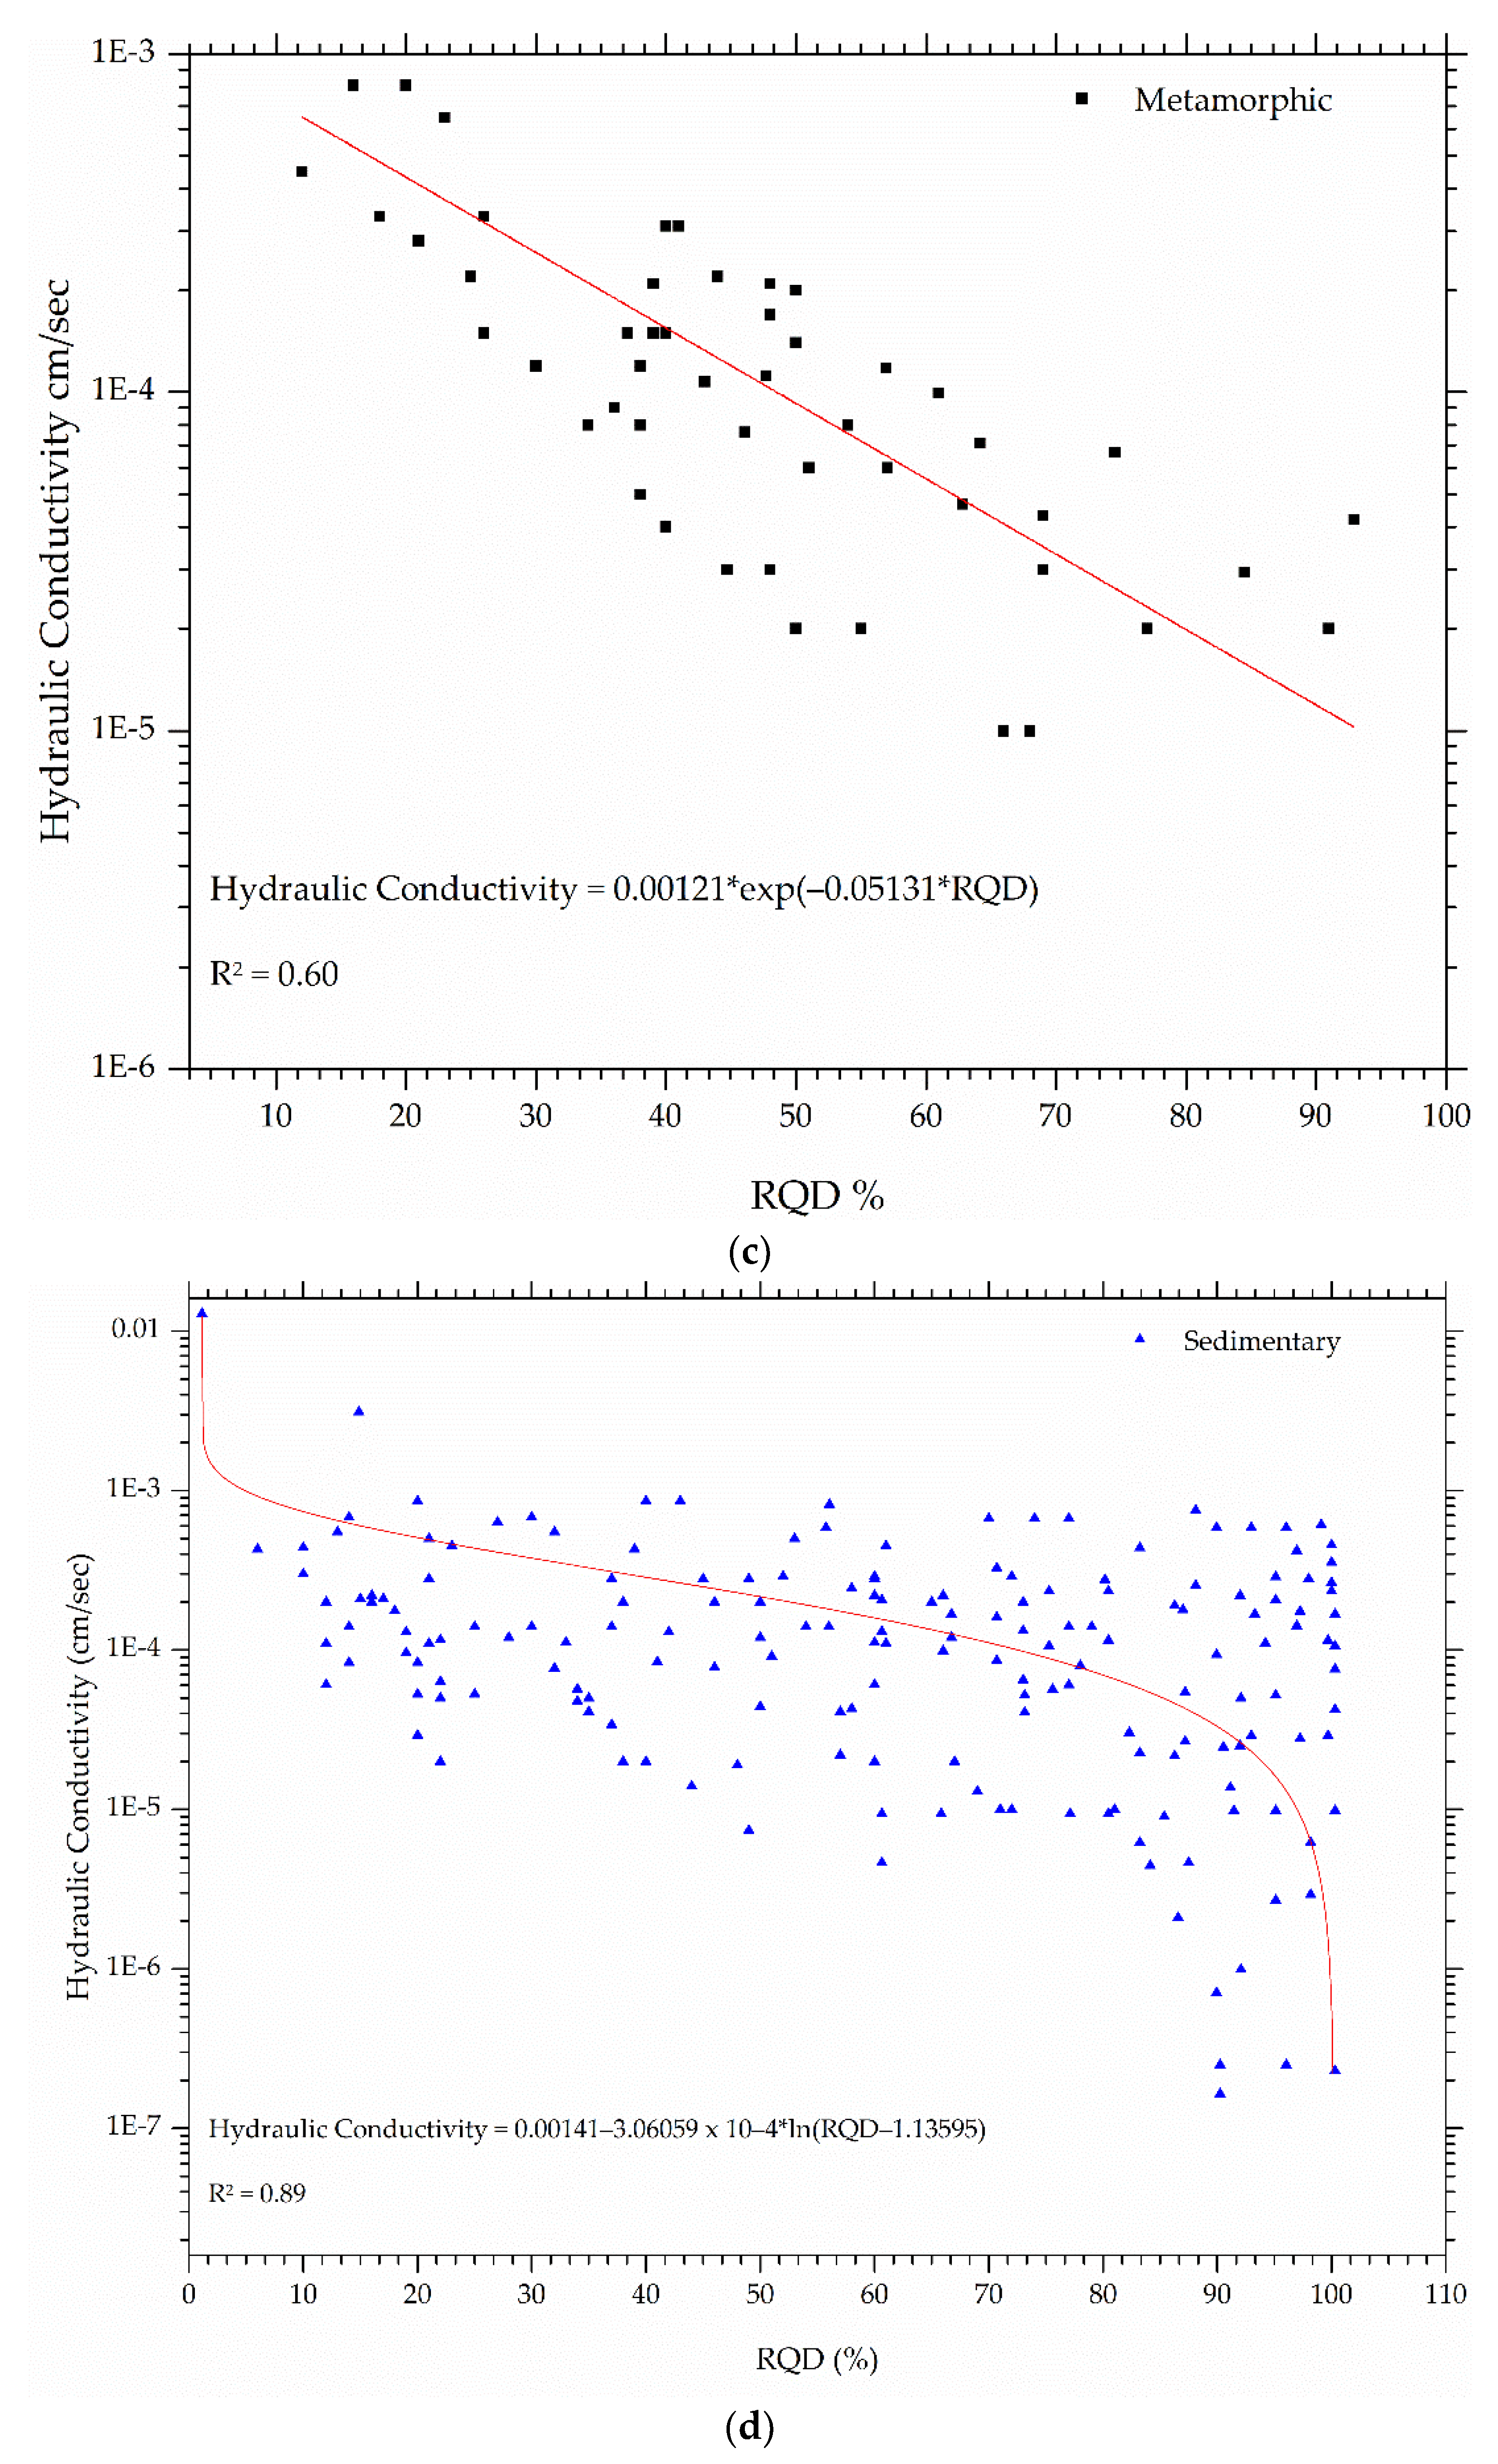
- Reasonable correlations do exist between RQD and hydraulic conductivity of the individual rock types.
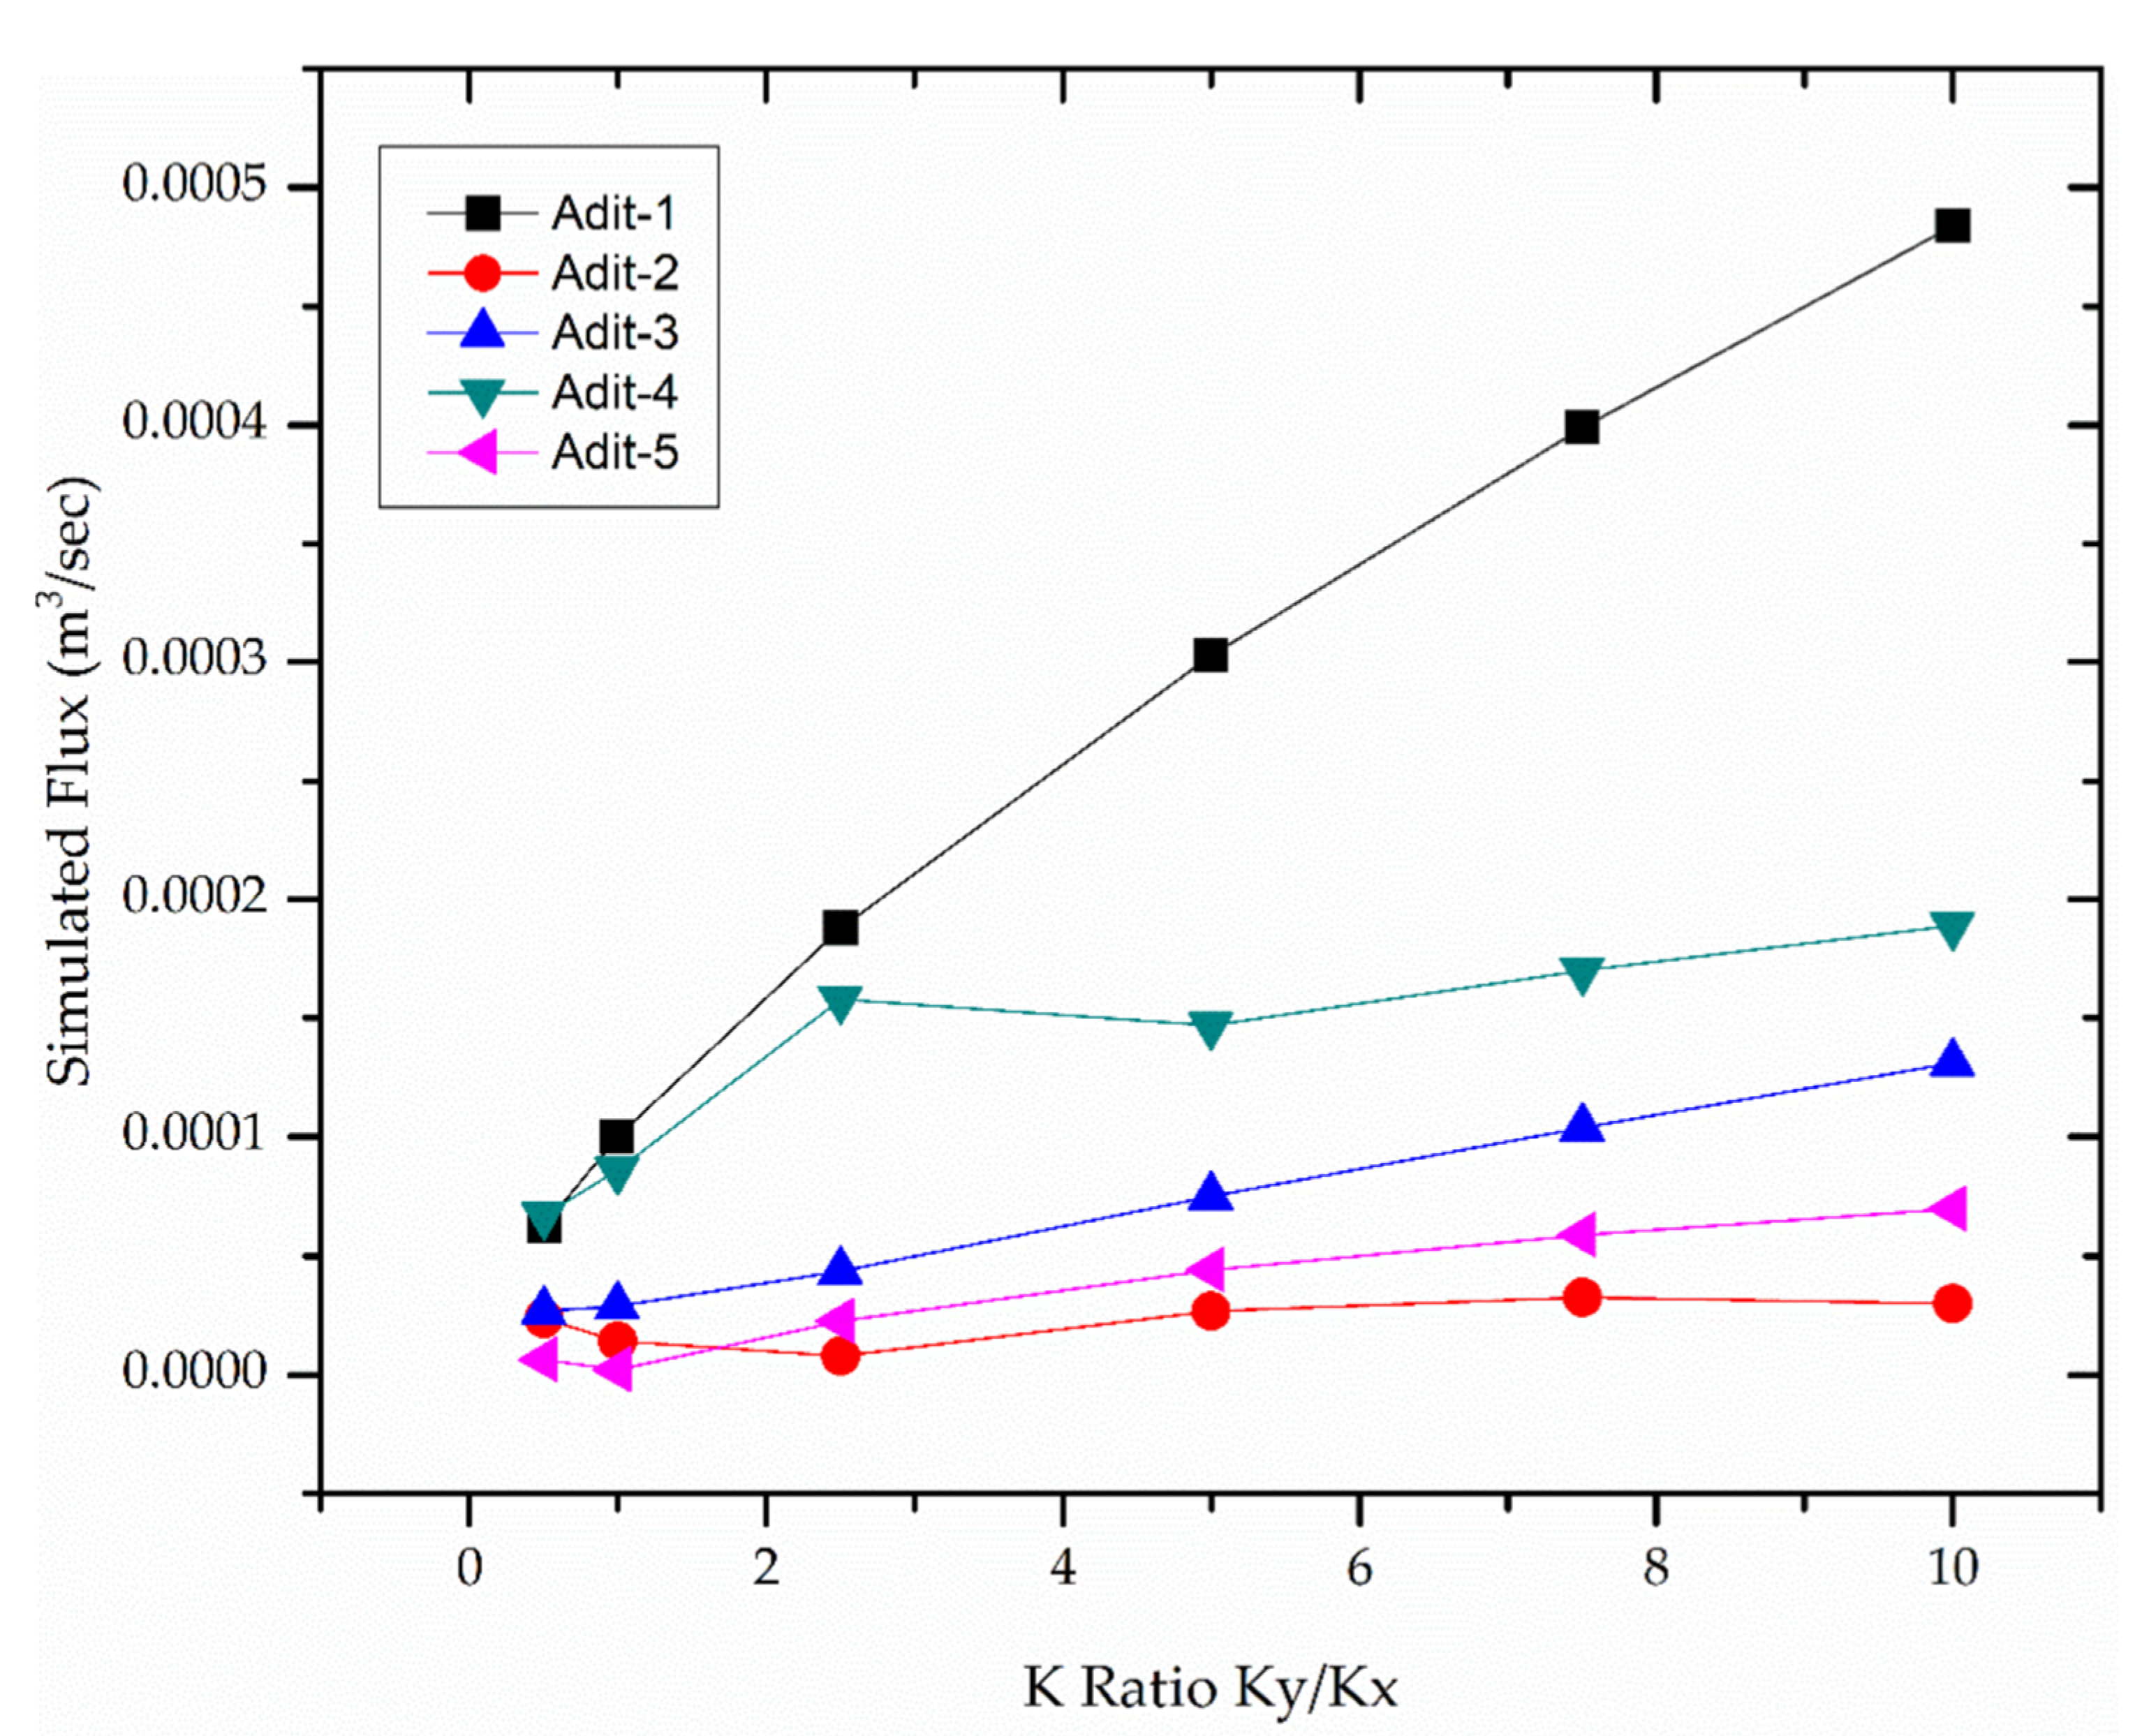
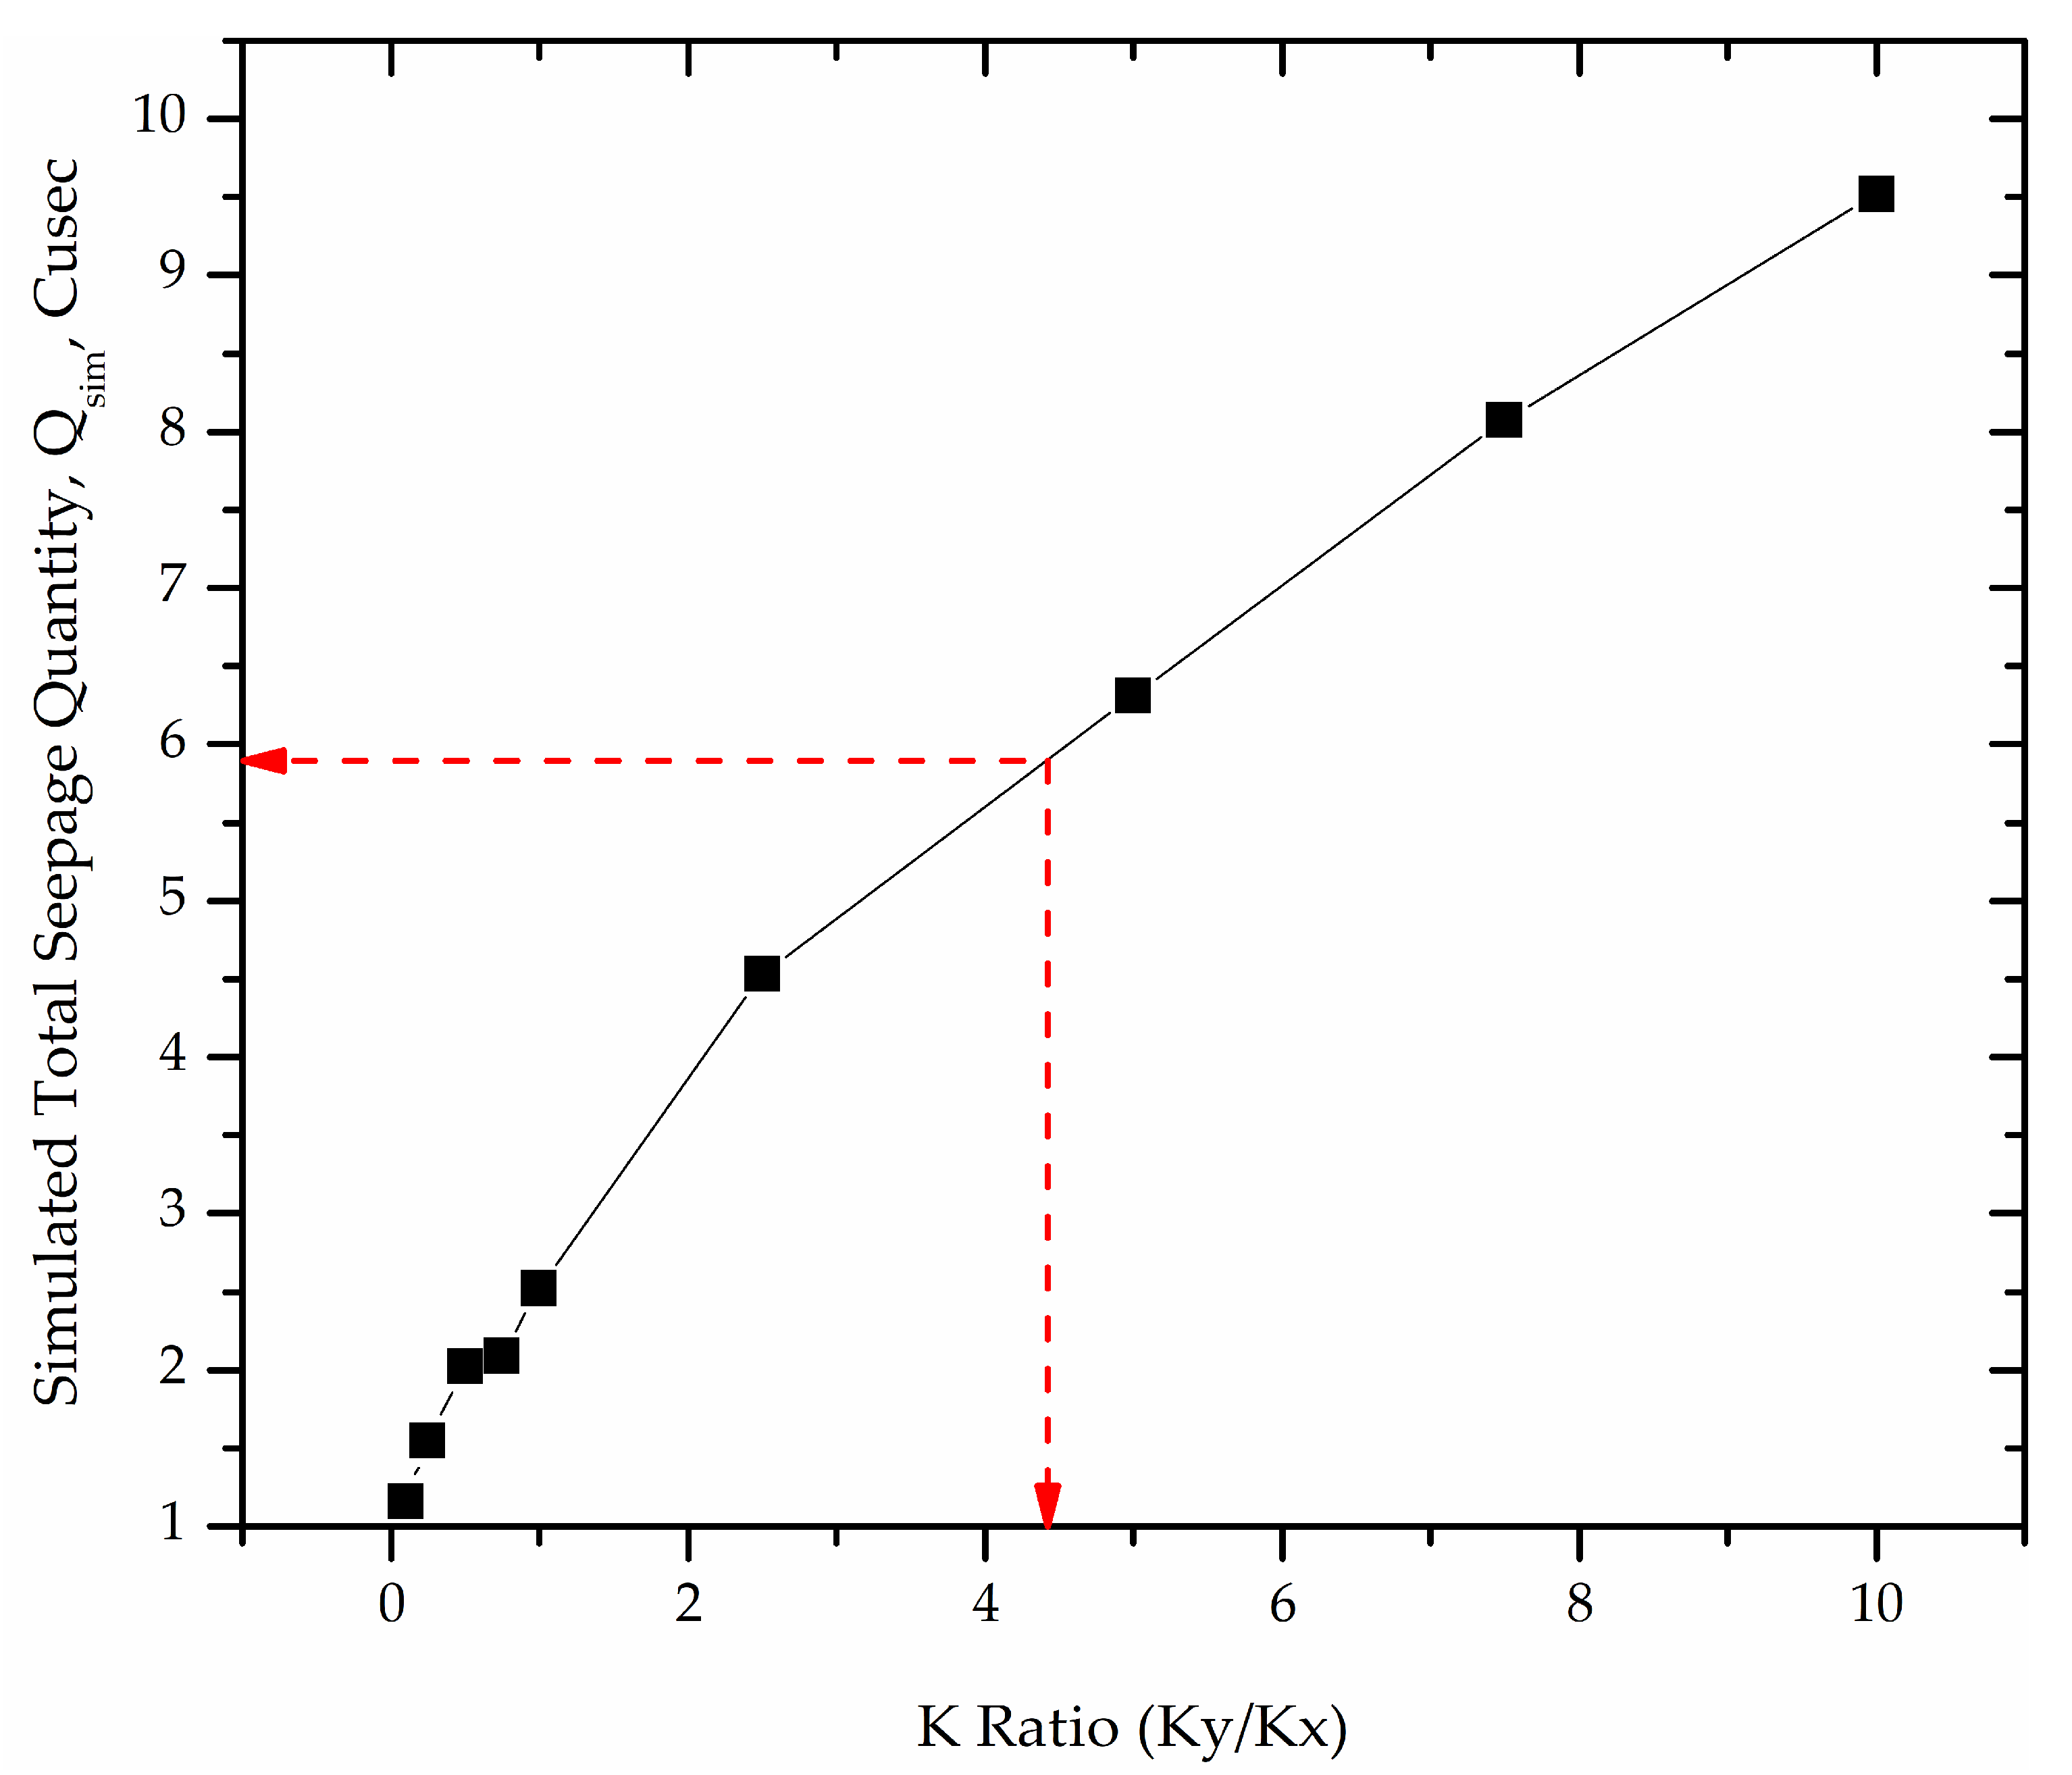
- The variation of seepage quantity with hydraulic conductivity anisotropy parameter K ratio reveals that the rock discontinuities contributing to a higher K ratio can contribute to higher seepage quantity and uplift pressure as compared to discontinuities resulting in a lower K ratio.
Author Contributions
Funding
Institutional Review Board Statement
Informed Consent Statement
Data Availability Statement
Acknowledgments
Conflicts of Interest
References
- Jiang, T.; Shen, Z.; Liu, Y.; Hou, Y. Carbon Footprint Assessment of Four Normal Size Hydropower Stations in China. Sustainability 2018, 10, 2018. [Google Scholar] [CrossRef]
- Tang, W.; Li, Z.; Tu, Y. Sustainability Risk Evaluation for Large-Scale Hydropower Projects with Hybrid Uncertainty. Sustainability 2018, 10, 138. [Google Scholar] [CrossRef]
- Rasolofosaon, P.; Zinszner, B. Comparison between permeability anisotropy and elasticity anisotropy of reservoir rocks. Geophysics 2002, 67, 230. [Google Scholar] [CrossRef]
- Quinones-Rozo, C. Lugeon Test Interpretation, Revisited. In Proceedings of the 30th Annual USSD Conference, Sacramento, CA, USA, 12–16 April 2010; pp. 405–414. [Google Scholar]
- Öge, İ.F. Assessing Rock Mass Permeability Using Discontinuity Properties. Procedia Eng. 2017, 191, 638–645. [Google Scholar] [CrossRef]
- Al-Yaarubi, A.H.B. Numerical and Experimental Study of Fluid Flow in a Rough-Walled Rock Fracture; Imperial College: London, UK, 2003. [Google Scholar]
- Fan, Z.Q.; Jin, Z.-H.; Johnson, S.E. Modelling petroleum migration through microcrack propagation in transversely isotropic source rocks. Geophys. J. Int. 2012, 190, 179–187. [Google Scholar] [CrossRef]
- Fan, Z.; Eichhubl, P.; Newell, P. Basement Fault Reactivation by Fluid Injection into Sedimentary Reservoirs: Poroelastic Effects. J. Geophys. Res. Solid Earth 2019, 124, 7354–7369. [Google Scholar] [CrossRef]
- Gowida, A.; Moussa, T.; Elkatatny, S.; Ali, A. A Hybrid Artificial Intelligence Model to Predict the Elastic Behavior of Sandstone Rocks. Sustainability 2019, 11, 5283. [Google Scholar] [CrossRef]
- Zhang, C.; Li, D.; Wu, S.; Chen, L.; Peng, J. Study on Evolution Mechanism of Structure-Type Rockburst: Insights from Discrete Element Modeling. Sustainability 2021, 13, 8036. [Google Scholar] [CrossRef]
- El-Naqa, A. The hydraulic conductivity of the fractures intersecting Cambrian sandstone rock masses, central Jordan. Environ. Geol. 2001, 40, 973–982. [Google Scholar] [CrossRef]
- Qureshi, M.; Khan, K.; Bessaih, N.; Al-Mawali, K.; Al-Sadrani, K. An empirical relationship between in-situ permeability and RQD of discontinuous sedimentary rocks. Electron. J. Geotech. Eng. 2014, 19, 4781–4790. [Google Scholar]
- Ahmad, K.; Kristály, F.; Docs, R. Effects of clay mineral and physico-chemical variables on sandstone rock permeability. J. Oil Gas Petrochem. Sci. 2018, 1, 18–26. [Google Scholar] [CrossRef]
- Hamm, S.-Y.; Kim, M.; Cheong, J.-Y.; Kim, J.-Y.; Son, M.; Kim, T.-W. Relationship between hydraulic conductivity and fracture properties estimated from packer tests and borehole data in a fractured granite. Eng. Geol. 2007, 92, 73–87. [Google Scholar] [CrossRef]
- Lu, H.; Zhang, Y.; Zhang, G.; Zhang, M. A Thermal Effect Model for the Impact of Vertical Groundwater Migration on Temperature Distribution of Layered Rock Mass and Its Application. Water 2021, 13, 1285. [Google Scholar] [CrossRef]
- Priest, S.D. Discontinuity Analysis for Rock Engineering; Springer: Berlin/Heidelberg, Germany, 1993. [Google Scholar]
- Tsang, C.-F.; Neretnieks, I. Flow Channeling in Heterogeneous Fractured Rocks. Rev. Geophys. 1998, 36, 275–298. [Google Scholar] [CrossRef]
- Youn, D.; Gutierrez, M. Effect of Fracture Distribution on Permeability of Fractured Rock Masses. In Proceedings of the 45th U.S. Rock Mechanics/Geomechanics Symposium, San Francisco, CA, USA, 1 January 2011; p. 7. [Google Scholar]
- Zhang, Z. Hydro Mechanical Behaviour and Nonlinear Flow Characteristic of Rock Fractures. Ph.D. Thesis, University of Wollongong, Wollongong, Australia, 2013. [Google Scholar]
- Zhang, Z.; Nemcik, J. Fluid flow regimes and nonlinear flow characteristics in deformable rock fractures. J. Hydrol. 2013, 477, 139–151. [Google Scholar] [CrossRef]
- Zhang, Z.; Nemcik, J. Friction Factor of Water Flow Through Rough Rock Fractures. Rock Mech. Rock Eng. 2013, 46, 1125–1134. [Google Scholar] [CrossRef]
- Zhu, Z.; Niu, Z.; Que, X.; Liu, C.; He, Y.; Xie, X. Study on Permeability Characteristics of Rocks with Filling Fractures Under Coupled Stress and Seepage Fields. Water 2020, 12, 2782. [Google Scholar] [CrossRef]
- Baghbanan, A.; Jing, L. Stress effects on permeability in a fractured rock mass with correlated fracture length and aperture. Int. J. Rock Mech. Min. Sci. 2008, 45, 1320–1334. [Google Scholar] [CrossRef]
- Li, Z.; Liu, H.; Dun, Z.; Ren, L.; Fang, J. Grouting effect on rock fracture using shear and seepage assessment. Constr. Build. Mater. 2020, 242, 118131. [Google Scholar] [CrossRef]
- Donnelly, C.R. Icold 2015-Question 97, Spillways-Évacuateurs de Crues. In Proceedings of the 25th International Congress on Large Dams, Stavanger, Norway, 7 July 2015. [Google Scholar]
- Donnelly, C.R.; Acharya, A. A Discussion on the Evolution and Application of Quantitative Risk Informed Dam Safety Decision Making. In Proceedings of the 1st International Conference on Dam Safety Management and Engineering, Penang, Malaysia, 21 November 2019. [Google Scholar]
- Moeini, H.; Farhadian, H.; Nikvar-Hassani, A. Determination of the optimum sealing method for Azad pumped storage dam considering seepage analysis. Arab. J. Geosci. 2018, 11, 389. [Google Scholar] [CrossRef]
- Zhang, Q.-H.; Liu, Q.-B.; Su, A.-J.; Li, Y.-J.; Zhang, Y.-H. Hydraulic Conductivity of Rock Masses Surrounding Water Curtain Boreholes for Underground Oil Storage Caverns. Energies 2021, 14, 4588. [Google Scholar] [CrossRef]
- Kassab, M.A.; Abuseda, H.H.; El Sayed, N.A.; LaLa, A.M.; Elnaggar, O.M. Petrographical and petrophysical integrated studies, Jurassic rock samples, North Sinai, Egypt. Arab. J. Geosci. 2016, 9, 99. [Google Scholar] [CrossRef]
- Wang, J.C.; Wang, C.Y.; Tang, X.J.; Hu, S.; Han, Z.; Wang, Y.T. A method for estimating rock mass joint size using borehole camera technique. Yantu Lixue/Rock Soil Mech. 2017, 38, 2701–2707. [Google Scholar] [CrossRef]
- Xue, Y.; Liu, Y.; Dang, F.; Liu, J.; Ma, Z.; Zhu, L.; Yang, H. Assessment of the Nonlinear Flow Characteristic of Water Inrush Based on the Brinkman and Forchheimer Seepage Model. Water 2019, 11, 855. [Google Scholar] [CrossRef]
- Arshad, I.; Muhammad Munir, B. Comparison of SEEP/W Simulations with Field Observations for Seepage Analysis through an Earthen Dam (Case Study: Hub Dam-Pakistan) Comparison of SEEP/W Simulations with Field Observations for Seepage Analysis through an Earthen Dam (Case Study: Hub Dam-Pakistan). Int. J. Res. 2014, 1, 57–70. [Google Scholar]
- Bear, J. Dynamics of Fluids in Porous Media; Courier Corporation: Chelmsford, MA, USA, 2013. [Google Scholar]
- Chouireb, M.; Djehiche, A. Simulation of seepage flow through an earthen dam with vertical drain and comparison of results with observations data (case study: Harreza dam-Algeria). Arab. J. Geosci. 2019, 12, 406. [Google Scholar] [CrossRef]
- Khaleel, R. Scale dependence of continuum models for fractured basalts. Water Resour. Res. 1989, 25, 1847–1855. [Google Scholar] [CrossRef]
- Li, H.; Tian, H.; Ma, K. Seepage Characteristics and Its Control Mechanism of Rock Mass in High-Steep Slopes. Processes 2019, 7, 71. [Google Scholar] [CrossRef]
- Long, J.C.S.; Remer, J.S.; Wilson, C.R.; Witherspoon, P.A. Porous media equivalents for networks of discontinuous fractures. Water Resour. Res. 1982, 18, 645–658. [Google Scholar] [CrossRef]
- Min, K.-B.; Jing, L.; Stephansson, O. Determining the equivalent permeability tensor for fractured rock masses using a stochastic REV approach: Method and application to the field data from Sellafield, UK. Hydrogeol. J. 2004, 12, 497–510. [Google Scholar] [CrossRef]
- Niu, Z.; Zhu, Z.; Que, X. Constitutive Model of Stress-Dependent Seepage in Columnar Jointed Rock Mass. Symmetry 2020, 12, 160. [Google Scholar] [CrossRef]
- Turturro, A.C.; Caputo, M.C.; Perkins, K.S.; Nimmo, J.R. Does the Darcy–Buckingham Law Apply to Flow through Unsaturated Porous Rock? Water 2020, 12, 2668. [Google Scholar] [CrossRef]
- Xia, C.; Lu, G.; Bai, D.; Zhu, Z.; Luo, S.; Zhang, G. Sensitivity Analyses of the Seepage and Stability of Layered Rock Slope Based on the Anisotropy of Hydraulic Conductivity: A Case Study in the Pulang Region of Southwestern China. Water 2020, 12, 2314. [Google Scholar] [CrossRef]
- Karakuş, H.; Erguler, Z.A.; Ediz, İ.G.; Beyhan, S. Assessment of hydraulic conductivity of disturbed and undisturbed rock masses in Tunçbilek lignite basin, Turkey. Arab. J. Geosci. 2021, 14, 1522. [Google Scholar] [CrossRef]
- WAPDA. Design Report for Tarbela 4th Extension Hydropower Project; WB-P115893; World Bank: Washington, DC, USA, 2012. [Google Scholar]
- ASTM D2216; Standard Test Methods for Laboratory Determination of Water (Moisture) Content of Soil and Rock by Mass. ASTM International: West Conshohocken, PA, USA, 2019.
- ASTM D6473; Standard Test Method for Specific Gravity and Absorption of Rock For Erosion Control. ASTM International: West Conshohocken, PA, USA, 2015.
- ATM D7012; Standard Test Methods for Compressive Strength and Elastic Moduli of Intact Rock Core Specimens under Varying States of Stress and Temperatures. ASTM International: West Conshohocken, PA, USA, 2014.
- ATM D5731; Standard Test Method for Determination of the Point Load Strength Index of Rock and Application to Rock Strength Classifications. ASTM International: West Conshohocken, PA, USA, 2016.
- ASTM D3967; Standard Test Method for Splitting Tensile Strength of Intact Rock Core Specimens. ASTM International: West Conshohocken, PA, USA, 2016.
- ASTM D5607; Standard Test Method for Performing Laboratory Direct Shear Strength Tests of Rock Specimens Under Constant Normal Force. ASTM International: West Conshohocken, PA, USA, 2016.


| Sr. No. | Equation | R2 | Rock Type | Data Type | Reference |
|---|---|---|---|---|---|
| 1 | 0.64 | Sedimentary | Borehole data | [11] | |
| 2 | 0.87 | Field mapping data | |||
| 3 | 0.70 | Borehole data | [12] |
| Borehole No. | Depth (m) | BH. Inclination Degree | RQD No. | Lugeon No. | Bulk Density | NMC * [44] | Water Absorption (%) [45] | Sp. Gravity [45] | UCS *** [46] | Point Load Strength [47] | Brazilian Tensile Strength [48] | Hoek Direct Shear [49] | Young’s Modulus [46] | Poisson’s ratio [46] |
|---|---|---|---|---|---|---|---|---|---|---|---|---|---|---|
| Field Testing | Laboratory Testing | |||||||||||||
| BH-01 | 60 | Vertical | 61 | 5 | ✓ | ✓ | ✓ | ✓ | ✓ | ✓ | ✓ | ✓ | ✓ | ✓ |
| BH-02 | 100 | Vertical | 20 | 3 | ✓ | ✓ | ✓ | ✓ | ✓ | ✓ | ✓ | ✓ | ✓ | ✓ |
| BH-03 | 35 | Vertical | 77 | 14 | ✓ | ✓ | ✓ | ✓ | ✓ | ✓ | ✓ | ✓ | ✓ | ✓ |
| BH-04 | 35 | Vertical | 116 | 18 | ✓ | ✓ | ✓ | ✓ | ✓ | ✓ | ✓ | ✓ | ✓ | ✓ |
| BH-05 | 20 | Vertical | 62 | 12 | ✓ | ✓ | ✓ | ✓ | ✓ | ✓ | ✓ | ✓ | ✓ | ✓ |
| BH-06 | 110 | Vertical | 49 | 6 | ✓ | ✓ | ✓ | ✓ | ✓ | ✓ | ✓ | ✓ | ✓ | ✓ |
| BH-07 | 20 | Vertical | 29 | 3 | ✓ | ✓ | ✓ | ✓ | ✓ | ✓ | ✓ | ✓ | ✓ | ✓ |
| BH-08 | 90 | Vertical | 82 | 12 | ✓ | ✓ | ✓ | ✓ | ✓ | ✓ | ✓ | ✓ | ✓ | ✓ |
| BH-09 | 120 | 30° | 117 | 15 | ✓ | ✓ | ✓ | ✓ | ✓ | ✓ | ✓ | ✓ | ✓ | ✓ |
| BH-10 | 80 | Vertical | 156 | 9 | ✓ | ✓ | ✓ | ✓ | ✓ | ✓ | ✓ | ✓ | ✓ | ✓ |
| BH-11 | 50 | Hor. ** | 44 | 10 | ✓ | ✓ | ✓ | ✓ | ✓ | ✓ | ✓ | ✓ | ✓ | ✓ |
| BH-12 | 50 | Hor. ** | 62 | 3 | ✓ | ✓ | ✓ | ✓ | ✓ | ✓ | ✓ | ✓ | ✓ | ✓ |
| BH-13 | 120 | Vertical | 14 | 1 | ✓ | ✓ | ✓ | ✓ | ✓ | ✓ | ✓ | ✓ | ✓ | ✓ |
| BH-14 | 100 | 30° | 0 | 1 | ✓ | ✓ | ✓ | ✓ | ✓ | ✓ | ✓ | ✓ | ✓ | ✓ |
| BH-15 | 115 | Vertical | 90 | 13 | ✓ | ✓ | ✓ | ✓ | ✓ | ✓ | ✓ | ✓ | ✓ | ✓ |
| BH-16 | 100 | Vertical | 106 | 18 | ✓ | ✓ | ✓ | ✓ | ✓ | ✓ | ✓ | ✓ | ✓ | ✓ |
| BH-17 | 100 | 30° | 149 | 18 | ✓ | ✓ | ✓ | ✓ | ✓ | ✓ | ✓ | ✓ | ✓ | ✓ |
| Bore Hole No. | Core Recovery (%) | RQD Values (%) | Lugeon Values | Primary Rock Type | Secondary Rock Type |
|---|---|---|---|---|---|
| BH-01 | 0–100 | 0–76 | 25–68 | Metamorphic/Sedimentary | Schist/Limestone |
| BH-02 | 10–100 | 4–80 | 13–44 | Metamorphic/Sedimentary | Schist/Limestone |
| BH-03 | 0–100 | 0–99 | 1–38 | Metamorphic/Sedimentary | Schist/Limestone |
| BH-04 | 10–100 | 0–100 | 0.40–35 | Metamorphic/Sedimentary | Schist/Limestone |
| BH-05 | 0–100 | 0–100 | 1–81 | Metamorphic/Sedimentary | Schist/Limestone |
| BH-06 | 0–100 | 0–92 | 1–22 | Metamorphic/Sedimentary | Schist/Limestone |
| BH-07 | 0–100 | 0–99 | 31–86 | Metamorphic/Sedimentary | Schist/Limestone |
| BH-08 | 0–100 | 0–98 | 1–67 | Metamorphic/Sedimentary | Schist/Limestone |
| BH-09 | 0–100 | 0–63 | 1–46 | Metamorphic/Sedimentary | Schist/Limestone |
| BH-10 | 0–100 | 0–89 | 12–100 | Metamorphic/Sedimentary | Schist/Limestone |
| BH-11 | 30–100 | 0–61.8 | 6–63 | Metamorphic/Sedimentary | Schist/Limestone |
| BH-12 | 8–100 | 0–88 | 7–14 | Metamorphic/Sedimentary | Schist/Limestone |
| BH-13 | 40–100 | 0–87 | 28–28 | Igneous | Dolerite |
| BH-14 | 32–90 | 0–76 | 35–35 | Igneous | Dolerite |
| BH-15 | 0–100 | 0–92 | 1–25 | Igneous | Dolerite |
| BH-16 | 0–100 | 0–92 | 0.68–45 | Igneous | Dolerite |
| BH-17 | 0–100 | 0–96 | 0.58–85 | Igneous | Dolerite |
| Rock Type * | Typcial RQD % | Petrographic Results |
|---|---|---|
| Igneous | 0–100 | Amphibole 45.5%, Plagioclase 33.5% |
| Sedimentary | 0–98 | Predominantly Calcite Mineral |
| Metamorphic | 0–80 | Quartz 26.5%, Muscovite/Sericite 24% |
| Sr. No. | Test Parameters | Igneous | Metamorphic | Sedimentary |
|---|---|---|---|---|
| 1 | Bulk Density (gm/cm3) | 2.83–3.72 | 2.66–3.24 | 2.63–2.81 |
| 2 | Natural Moisture Content (%) | 0.08–0.40 | 0.15–3.34 | 0.22–0.97 |
| 3 | Water Absorption (%) | 0.06–0.60 | 0.52–1.19 | 0.29–1.45 |
| 4 | Specific Gravity | 2.86–3.78 | 2.69–3.30 | 2.71–2.85 |
| 5 | Unconfined Compressive Strength (MPa) | 14–274 | 14–153 | 43–105 |
| 6 | Point Load Strength (MPa) | 1.84–15.58 | 0.61–6.03 | 1.05–5.51 |
| 7 | Brazilian Tensile Strength (MPa) | 8.79–19.91 | 7.58–11.06 | 7.29–22.02 |
| 8 | Hoek Direct Shear Test c (MPa) | 0.01–0.53 | - | 7.29–13.56 |
| 9 | Friction angle ϕ (deg) | 21.1–42.1 | - | 14.29–13.56 |
| 10 | Young’s Modulus (MPa) | 17,400–301,000 | 17,200–82,600 | 28,100–69,900 |
| 11 | Poisson’s Ratio | 0.02–0.45 | 0.03–0.50 | 0.33–0.34 |
| 12 | Hydraulic Conductivity (cm/sec) | 0.4 × 10⁻⁴–8.5 × 10⁻⁴ | 0.8 × 10⁻⁴ | 0.2 × 10⁻⁴–10 × 10−4 |
Publisher’s Note: MDPI stays neutral with regard to jurisdictional claims in published maps and institutional affiliations. |
© 2022 by the authors. Licensee MDPI, Basel, Switzerland. This article is an open access article distributed under the terms and conditions of the Creative Commons Attribution (CC BY) license (https://creativecommons.org/licenses/by/4.0/).
Share and Cite
Khurshid, M.N.; Khan, A.H.; Rehman, Z.u.; Chaudhary, T.S. The Evaluation of Rock Mass Characteristics against Seepage for Sustainable Infrastructure Development. Sustainability 2022, 14, 10109. https://doi.org/10.3390/su141610109
Khurshid MN, Khan AH, Rehman Zu, Chaudhary TS. The Evaluation of Rock Mass Characteristics against Seepage for Sustainable Infrastructure Development. Sustainability. 2022; 14(16):10109. https://doi.org/10.3390/su141610109
Chicago/Turabian StyleKhurshid, Muhammad Nasir, Ammad Hassan Khan, Zia ur Rehman, and Tahir Sultan Chaudhary. 2022. "The Evaluation of Rock Mass Characteristics against Seepage for Sustainable Infrastructure Development" Sustainability 14, no. 16: 10109. https://doi.org/10.3390/su141610109