
Investigation of Some Property Changes of Light-Colored Turkish Natural Stones after High-Temperature Treatments


Abstract
:1. Introduction
2. Materials and Methods
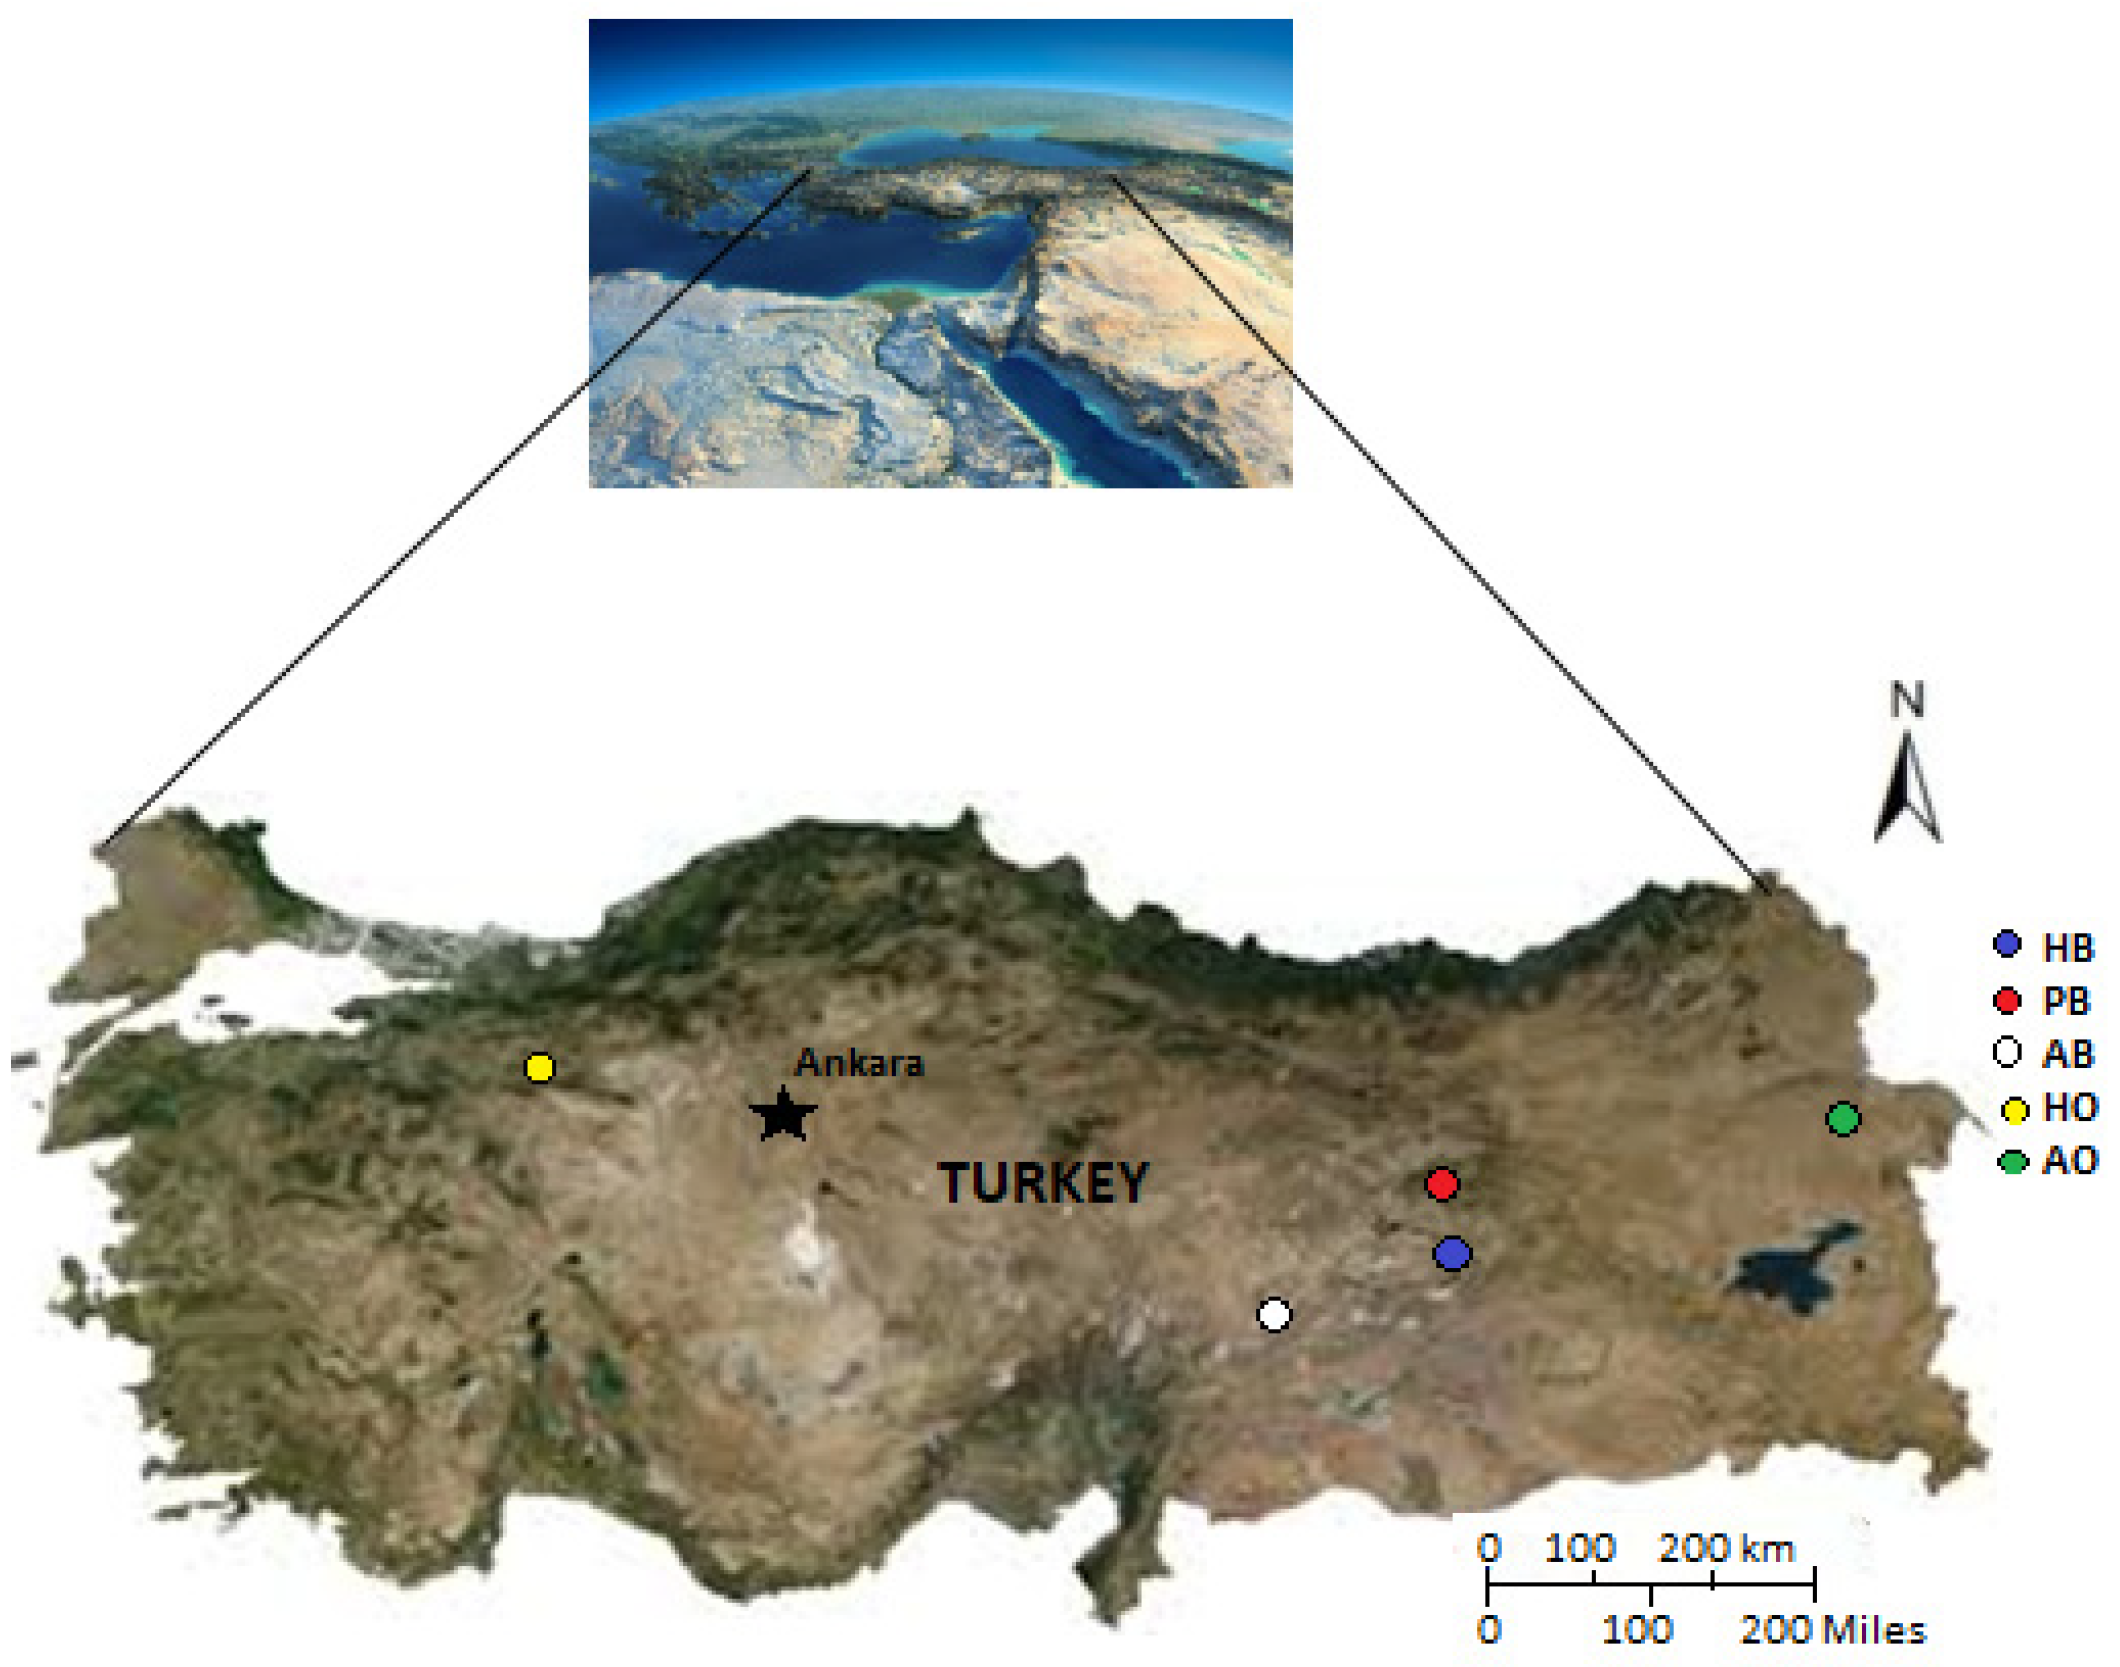
2.1. Material
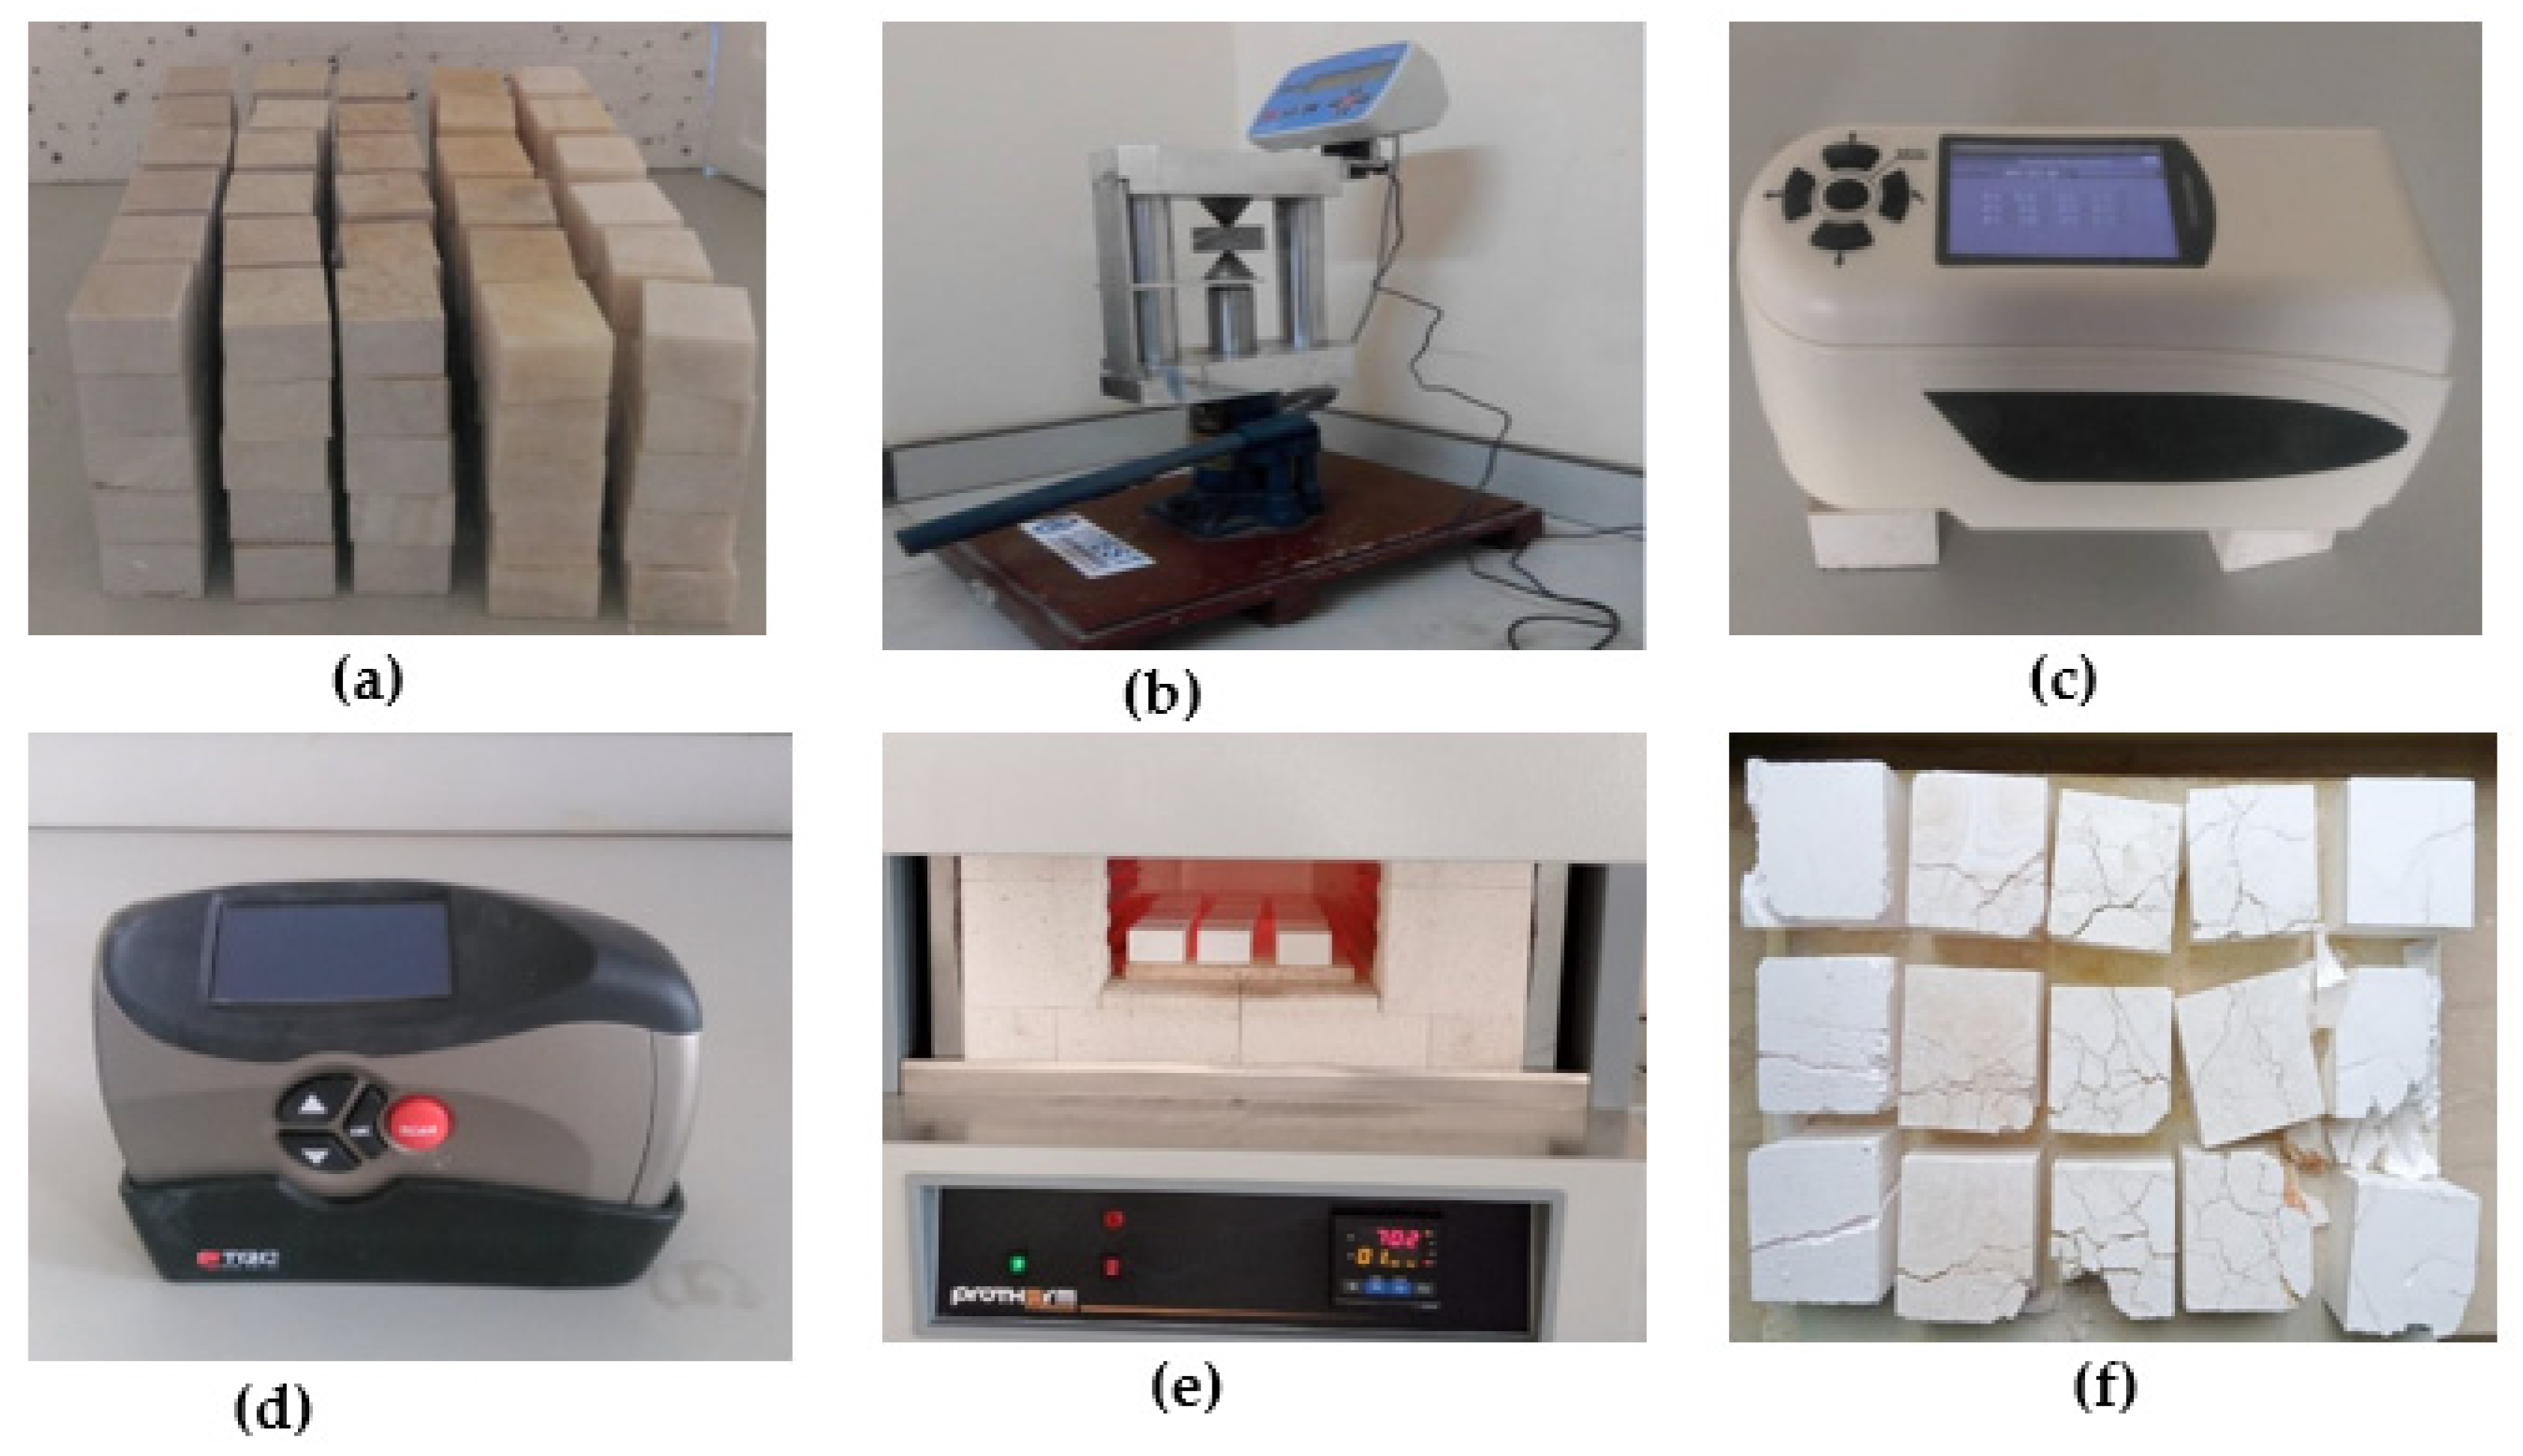
2.2. Methods
2.2.1. High Temperature Test
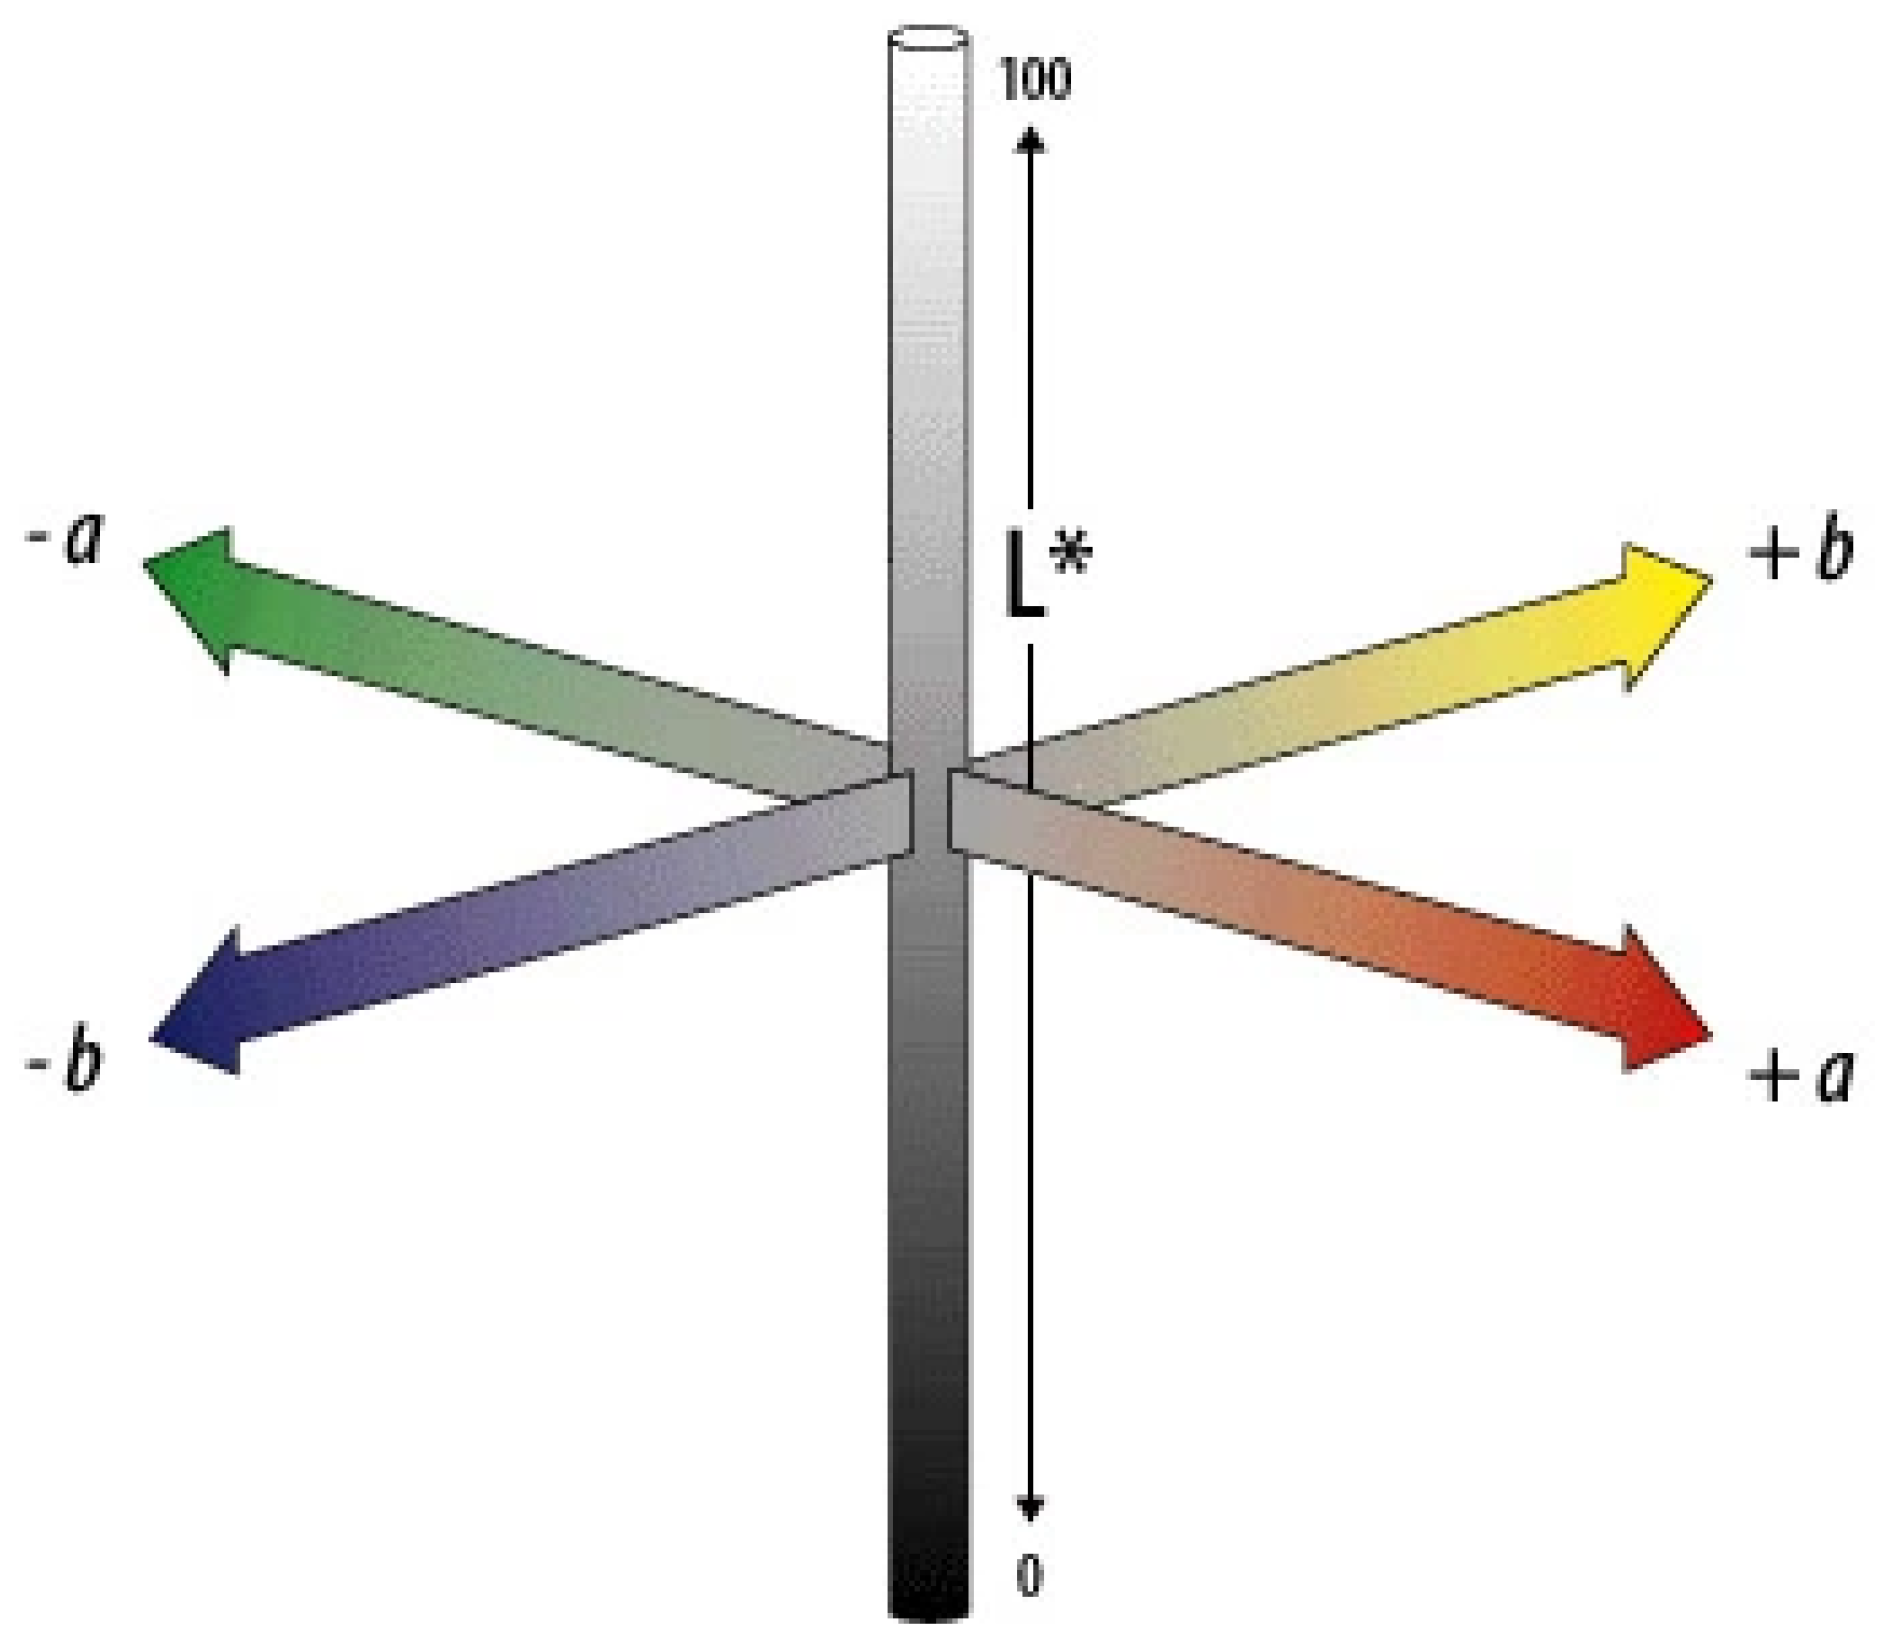
2.2.2. Non-Destructive Tests
2.2.3. Point Load Strength Test
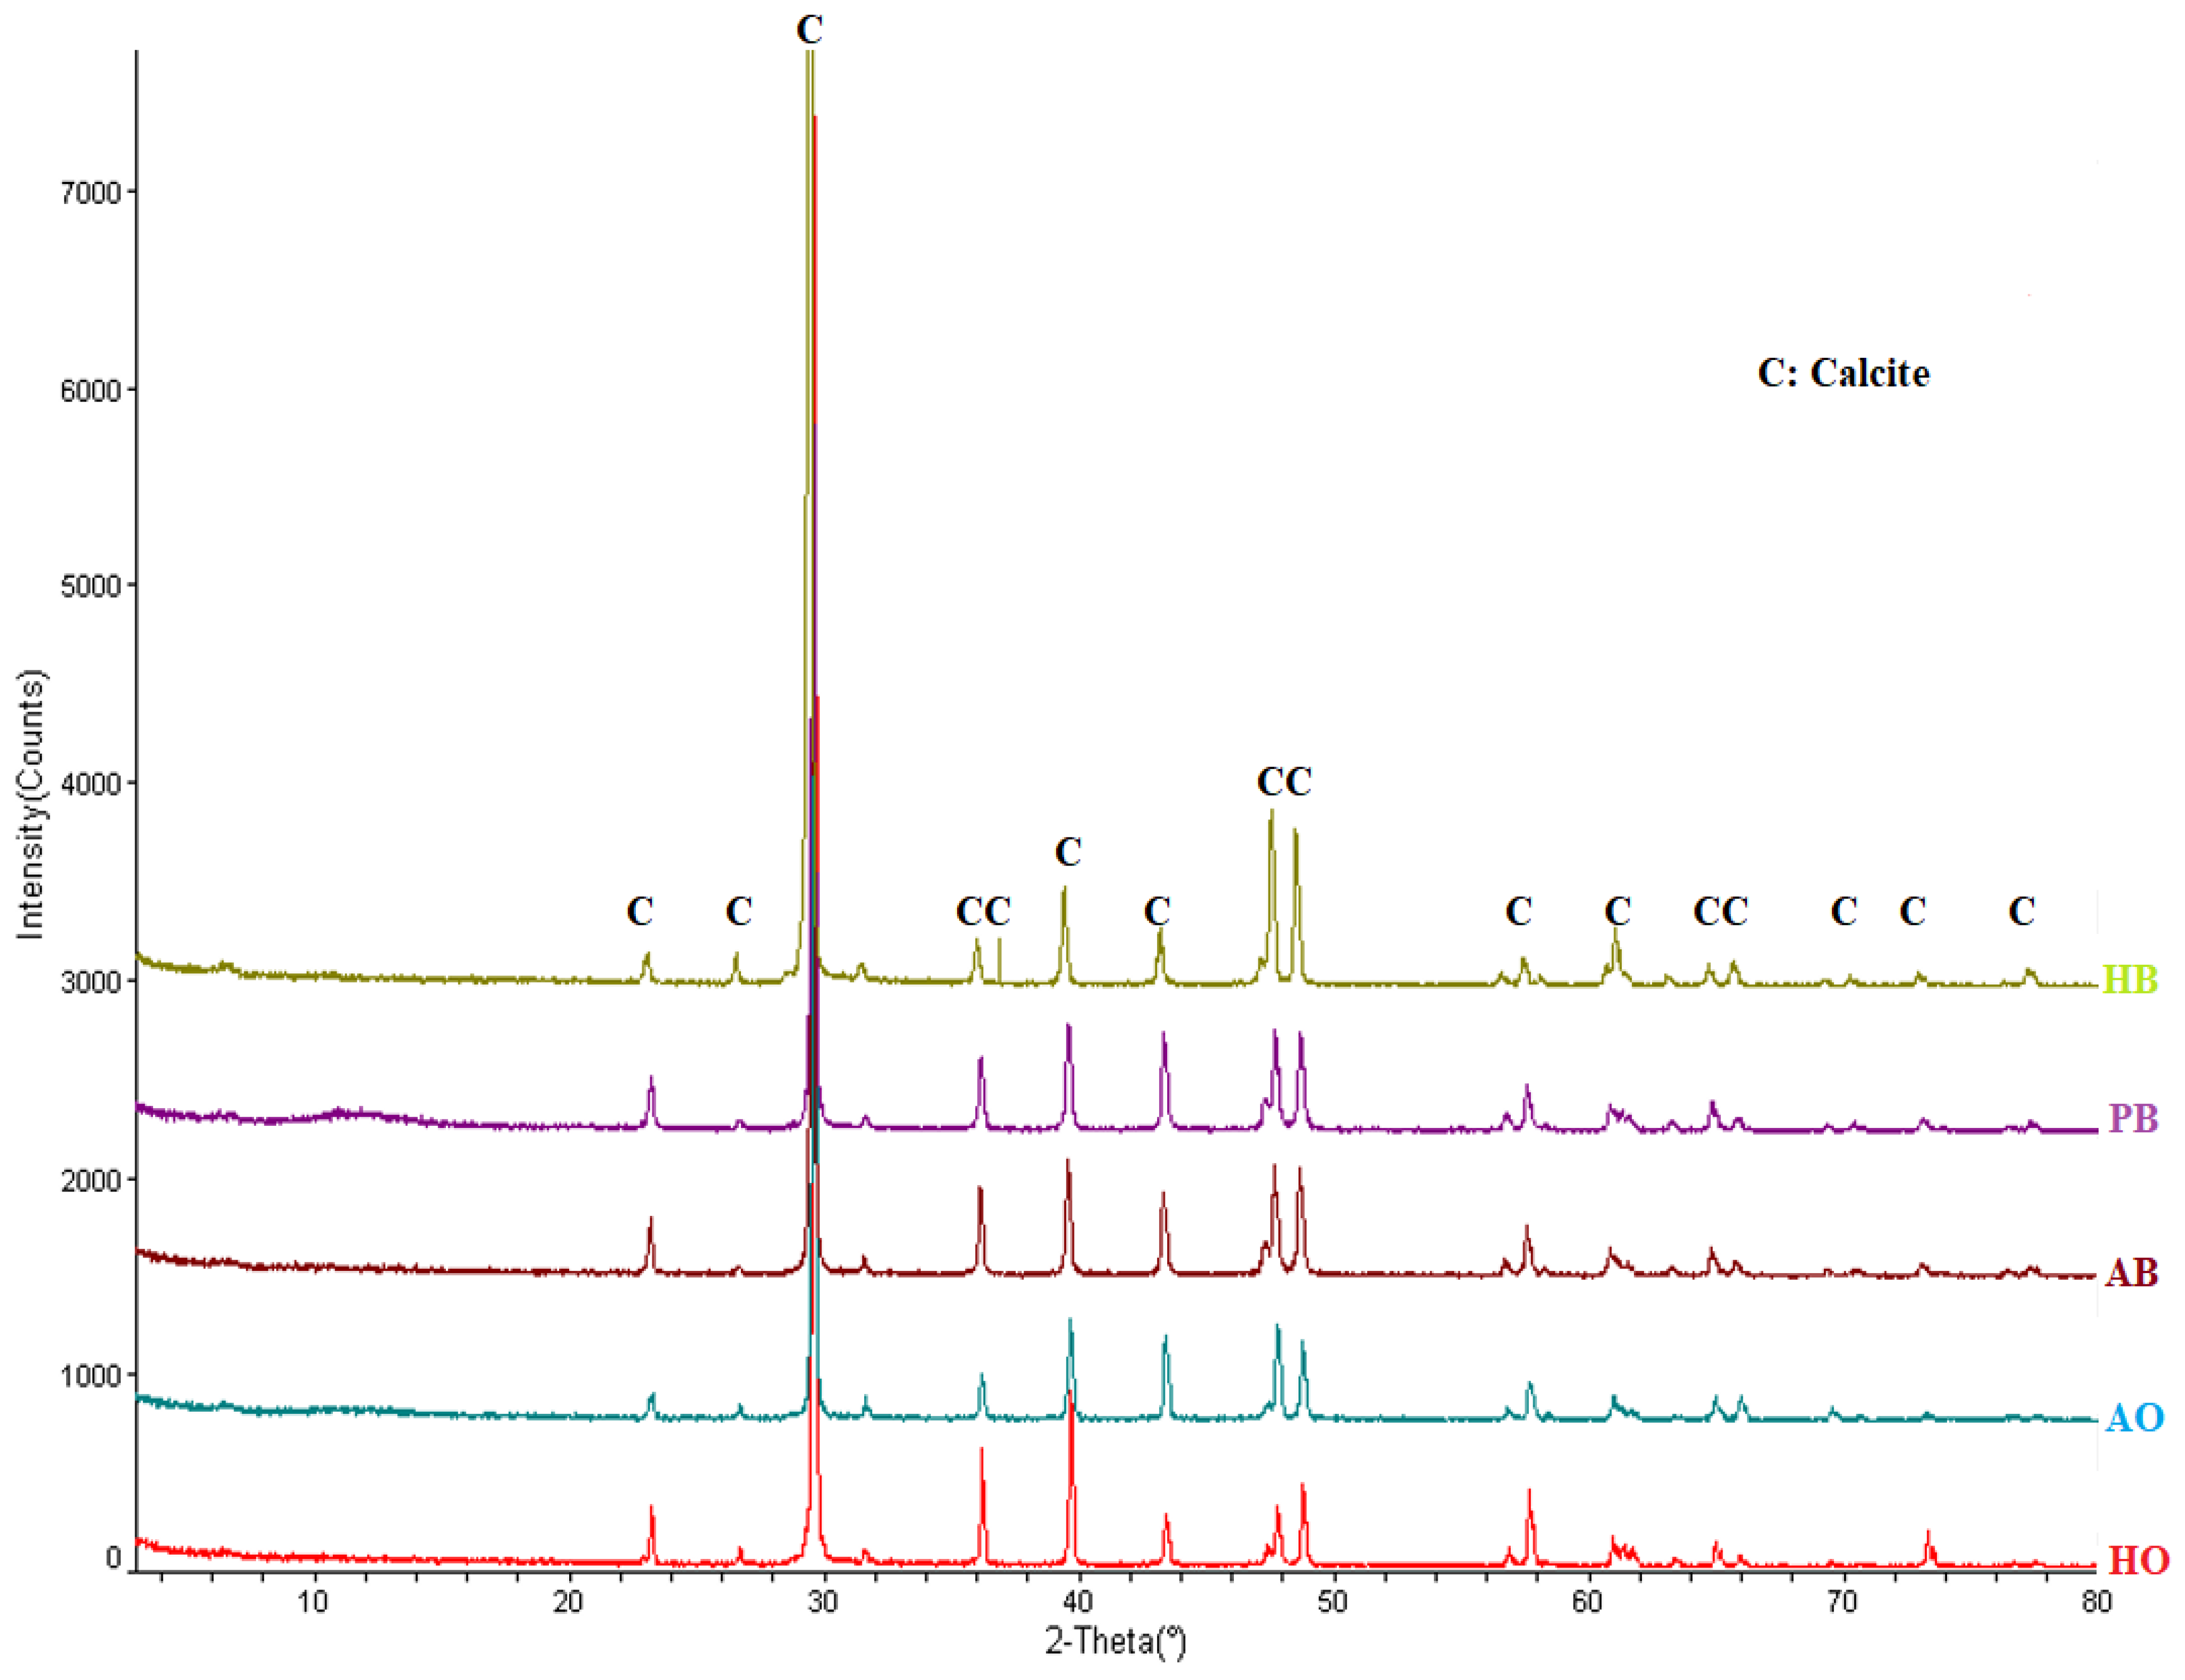
3. Results and Discussion
4. Conclusions
Funding
Institutional Review Board Statement
Informed Consent Statement
Data Availability Statement
Acknowledgments
Conflicts of Interest
References
- Celik, M.Y. Types and usage areas of the decorative natural building stones. Sci. Min. J. 2003, 42, 3–15. (In Turkish) [Google Scholar]
- Karakaş, A.; Morali, G.; Coruk, Ö.; Bozkurtoğlu, E. Geomechanical, durability–hygrothermal and thermal shock properties of Kocaeli Kandira stone used as building stone in historical structures. Environ. Earth Sci. 2021, 80, 130. [Google Scholar] [CrossRef]
- Mutlutürk, M.; Altindag, R.; Türk, G. A decay function model for the integrity loss of rock when subjected to recurrent cycles of freezing-thawing and heating-cooling. Int. J. Rock Mech. Min. Sci. 2004, 41, 237–244. [Google Scholar] [CrossRef]
- Yavuz, H. Effect of freeze–thaw and thermal shock weathering on the physical and mechanical properties of an andesite stone. Bull. Eng. Geol. Environ. 2011, 70, 187–192. [Google Scholar] [CrossRef]
- Fener, M.; Ince, I. Effects of the freeze–thaw (F-T) cycle on the andesitic rocks (Sille-Konya/Turkey) used in construction building. J. African Earth Sci. 2015, 109, 96–106. [Google Scholar] [CrossRef]
- Ghobadi, M.H.; Babazadeh, R. Experimental studies on the effects of cyclic freezing-thawing, salt crystallization, and thermal shock on the physical and mechanical characteristics of selected sandstones. Rock Mech. Rock Eng. 2015, 48, 1001–1016. [Google Scholar] [CrossRef]
- Gökçe, M.V.; İnce, İ.; Fener, M.; Taşkıran, T.; Kayabali, K. The effects of freeze–thaw (F-T) cycles on the Gödene travertine used in historical structures in Konya (Turkey). Cold Reg. Sci. Tech. 2016, 127, 65–75. [Google Scholar] [CrossRef]
- Bozdağ, A.; Bayram, A.F.; İnce, İ.; Asan, K. The relationship between weathering and welding degree of pyroclastic rocks in the Kilistra ancient city, Konya (Central Anatolia, Turkey). J. African Earth Sci. 2016, 123, 1–9. [Google Scholar] [CrossRef]
- Heidari, M.; Torabi-Kaveh, M.; Mohseni, H. Assessment of the effects of freeze–thaw and salt crystallization ageing tests on Anahita Temple Stone, Kangavar, West of Iran. Geotech. Geol. Eng. 2017, 35, 121–136. [Google Scholar] [CrossRef]
- Özşen, H.; Bozdağ, A.; İnce, İ. Effect of salt crystallization on weathering of pyroclastic rocks from Cappadocia, Turkey. Arab. J. Geosci. 2017, 10, 258. [Google Scholar] [CrossRef]
- Deng, H.; Yu, S.; Deng, J. Damage characteristics of sandstone subjected to coupled effect of freezing-thawing cycles and acid environment. Adv. Civ. Eng. 2018, 2018, 3560780. [Google Scholar] [CrossRef]
- Sun, Q.; Zhang, Y. Combined effects of salt, cyclic wetting and drying cycles on the physical and mechanical properties of sandstone. Eng. Geol. 2019, 248, 70–79. [Google Scholar] [CrossRef]
- Amirkiyaei, V.; Ghasemi, E.; Faramarzi, L. Determination of P-wave velocity of carbonate building stones during freeze–thaw cycles. Geotech. Geol. Eng. 2020, 38, 5999–6009. [Google Scholar]
- Guler, S.; Türkmenoğlu, Z.F.; Varol, O.O. Thermal shock and freeze–thaw resistance of different types of carbonate rocks. Int. J. Rock Mech. Min. Sci. 2021, 137, 104545. [Google Scholar] [CrossRef]
- Mardoukhi, A.; Mardoukhi, Y.; Hokka, M.; Kuokkala, V.T. Effects of test temperature and low temperature thermal cycling on the dynamic tensile strength of granitic rocks. Rock Mech. Rock Eng. 2021, 54, 443–454. [Google Scholar] [CrossRef]
- Goudie, A.S.; Allison, R.J.; McLaren, S.J. The relations between modulus of elasticity and temperature in the context of the experimental simulation of rock weathering by fire. Earth Surf. Proc. Landf. 1992, 17, 605–615. [Google Scholar] [CrossRef]
- Allison, R.J.; Bristow, G.E. The effects of fire on rock weathering: Some further considerations of laboratory experimental simulation. Earth Surf. Proc. Landf. 1999, 24, 707–713. [Google Scholar] [CrossRef]
- Chakrabarti, B.; Yates, T.; Lewry, A. Effect of fire damage on natural stonework in buildings. Constr. Build. Mater. 1996, 10, 539–544. [Google Scholar] [CrossRef]
- Sippel, J.; Siegesmund, S.; Weiss, T.; Nitsch, K.H.; Korzen, M. Decay of natural stones caused by fire damage. Geol. Soc. Lond. Spec. Publ. 2007, 271, 139–151. [Google Scholar] [CrossRef]
- Hajpál, M.; Török, Á. Mineralogical and colour changes of quartz sandstones by heat. Environ. Geol. 2004, 46, 311–322. [Google Scholar] [CrossRef]
- Gillhuber, S.; Lehrberger, G.; Goske, J. Fire damage of trachyte: Investigations of the Tepla monastery building stones. Geol. Soc. Lond. Spec. Publ. 2010, 333, 73–79. [Google Scholar] [CrossRef]
- Hajpál, M. Changes in sandstones of historical monuments exposed to fire or high temperature. Fire Technol. 2002, 38, 373–382. [Google Scholar] [CrossRef]
- Tian, H.; Ziegler, M.; Kempka, T. Physical and mechanical behavior of claystone exposed to temperatures up to 1000 °C. Int. J. Rock Mech. Min. Sci. 2014, 70, 144–153. [Google Scholar] [CrossRef]
- Ozguven, A.; Ozcelik, Y. Effects of high temperature on physico-mechanical properties of Turkish natural building stones. Eng. Geol. 2014, 183, 127–136. [Google Scholar] [CrossRef]
- TS EN 13755; Natural Stone Test Methods—Determination of Water Absorption at Atmospheric Pressure. Turkish Standardization Institute: Ankara, Turkey, 2009. (In Turkish)
- TS EN 1936; Natural Stone Test Methods—Determination of Real Density and Apparent Density and of Total and Open Porosity. Turkish Standardization Institute: Ankara, Turkey, 2010. (In Turkish)
- Wang, M.; Wan, W. A new empirical formula for evaluating uniaxial compressive strength using the Schmidt hammer test. Int. J. Rock Mech. Min. Sci. 2019, 123, 104094. [Google Scholar] [CrossRef]
- Aydin, A. ISRM Suggested Method for Determination of the Schmidt Hammer Rebound Hardness: Revised Version. In The ISRM Suggested Methods for Rock Characterization, Testing and Monitoring: 2007–2014; Ulusay, R., Ed.; Springer: Cham, Switzerland, 2008. [Google Scholar] [CrossRef]
- Sousa, L.M.O.; Gonçalves, B.M.M. Differences in the quality of polishing between sound and weathered granites. Environ. Earth. Sci. 2013, 69, 1347–1359. [Google Scholar] [CrossRef]
- Kompaníková, Z.; Gomez-Heras, M.; Michňová, J.; Durmeková, T.; Vlčko, J. Sandstone alterations triggered by fire-related temperatures. Environ. Earth Sci. 2014, 72, 2569–2581. [Google Scholar] [CrossRef]
- Sharma, P.K.; Singh, T.N. A correlation between P-wave velocity, impact strength index, slake durability index and uniaxial compressive strength. Bull. Eng. Geol. Env. 2008, 67, 17–22. [Google Scholar] [CrossRef]
- Khandelwal, M.; Ranjith, P.G. Correlating index properties of rocks with P-wave measurements. J. Appl. Geophys. 2010, 71, 1–5. [Google Scholar] [CrossRef]
- Ozdemir, E. A New Predictive Model for Uniaxial Compressive Strength of Rock Using Machine Learning Method: Artificial Intelligence-Based Age-Layered Population Structure Genetic Programming (ALPS-GP). Arab. J. Sci. Eng. 2022, 47, 629–639. [Google Scholar] [CrossRef]
- ISRM. Suggested method for determining point load strength. Int. J. Rock Mech. Min. Sci. Geomech. Abstr. 1985, 22, 51–60. [Google Scholar] [CrossRef]
- Jamshidi, A.A. Comparative Study of Point Load Index Test Procedures in Predicting the Uniaxial Compressive Strength of Sandstones. Rock Mech. Rock Eng. 2022, 55, 4507–4516. [Google Scholar] [CrossRef]
- Garrido, M.E.; Petnga, F.B.; Martínez-Ibáñez, V.; Serón, J.B.; Hidalgo-Signes, C.; Tomás, R. Predicting the Uniaxial Compressive Strength of a Limestone Exposed to High Temperatures by Point Load and Leeb Rebound Hardness Testing. Rock Mech. Rock Eng. 2022, 55, 1–17. [Google Scholar] [CrossRef]
- Yavuz, H.; Demirdag, S.; Caran, S. Thermal effect on the physical properties of carbonate rocks. Int. J. Rock Mech. Min. Sci. Geomech. Abstr. 2010, 47, 94–103. [Google Scholar] [CrossRef]
- Wang, S.R.; Hagan, P.; Li, Y.C.; Zhang, C.G.; Liu, X.L. Experimental study on deformation and strength characteristics of sandstone with different water contents. J. Eng. Sci. Tech. Rev. 2017, 10, 199–203. [Google Scholar] [CrossRef]
- Ferrero, A.M.; Marini, P. Experimental studies on the mechanical behaviour of two thermal cracked marbles. Rock Mech. Rock Eng. 2001, 34, 57–66. [Google Scholar] [CrossRef]
- Malaga-Starzec, K.; Ǻkesson, U.; Lindqvist, J.E.; Schouenborg, B. Microscopic and macroscopic characterization of the porosity of marble as a function of temperature and impregnation. Constr. Build. Mater. 2006, 20, 939–947. [Google Scholar] [CrossRef]
- Zhang, L.; Mao, X.; Lu, A. Experimental study on the mechanical properties of rocks at high temperature. Sci. China Ser. E Tech. Sci. 2009, 52, 641–646. [Google Scholar] [CrossRef]
- Zhang, W.; Qian, H.; Sun, Q.; Chen, Y. Experimental study of the effect of high temperature on primary wave velocity and microstructure of limestone. Environ. Earth Sci. 2015, 74, 5739–5748. [Google Scholar] [CrossRef]
- Garrido, M.E.; Martínez-Ibáñez, V.; Hidalgo-Signes, C.; Company, J.; Tomás, R. Temperature threshold of sedimentary rocks: A comparative study. In Proceedings of the ISRM International Symposium Eurock 2020—Hard Rock Engineering Trondheim, Trondheim, Norway, 14–19 June 2020. [Google Scholar]
- Gomez-Heras, M. Procesos y Formas de Deterioro Térmico en Piedra Natural del Patrimonio Arquitectónico; Editorial Complutense: Madrid, Spain, 2006. [Google Scholar]
- Tondon, S.; Gupta, V. Estimation of strength from Schmidt hammer rebound, point load index and compressional wave velocity. Bull. Eng. Geol. Environ. 2014, 74, 521–533. [Google Scholar] [CrossRef]
- Wang, M.; Wan, W.; Zhao, Y. Prediction of the uniaxial compressive strength of rocks from simple index tests using a random forest predictive model. Comptes Rendus Mécanique 2020, 384, 3–32. [Google Scholar] [CrossRef]
- Sadeghi, E.; Nikudel, M.R.; Khamehchiyan, M.; Kavussi, A. Estimation of unconfined compressive strength (UCS) of carbonate rocks by index mechanical tests and specimen size properties: Central Alborz zone of Iran. Rock Mech. Rock Eng. 2022, 55, 125–145. [Google Scholar] [CrossRef]
- Elhakim, A.F. The use of point load test for Dubai weak calcareous sandstones. J Rock Mech. Geotech. Eng. 2015, 7, 452–457. [Google Scholar] [CrossRef]
- Gomez-Heras, M.; McCabe, S.; Smith, B.J.; Fort, R. Impacts of fire on stone-built heritage. J. Archit. Conserv. 2009, 15, 47–48. [Google Scholar] [CrossRef]
- Ozguven, A.; Ozcelik, Y. Investigation of some property changes of natural building stones exposed to fire and high heat. Constr. Build. Mater. 2013, 38, 813–821. [Google Scholar] [CrossRef]
- Vázquez, P.; Acuña, M.; Benavente, D.; Gibeaux, S.; Navarro, I.; Gomez-Heras, M. Evolution of surface properties of ornamental granitoids exposed to high temperatures. Constr. Build. Mater. 2016, 104, 263–275. [Google Scholar] [CrossRef]


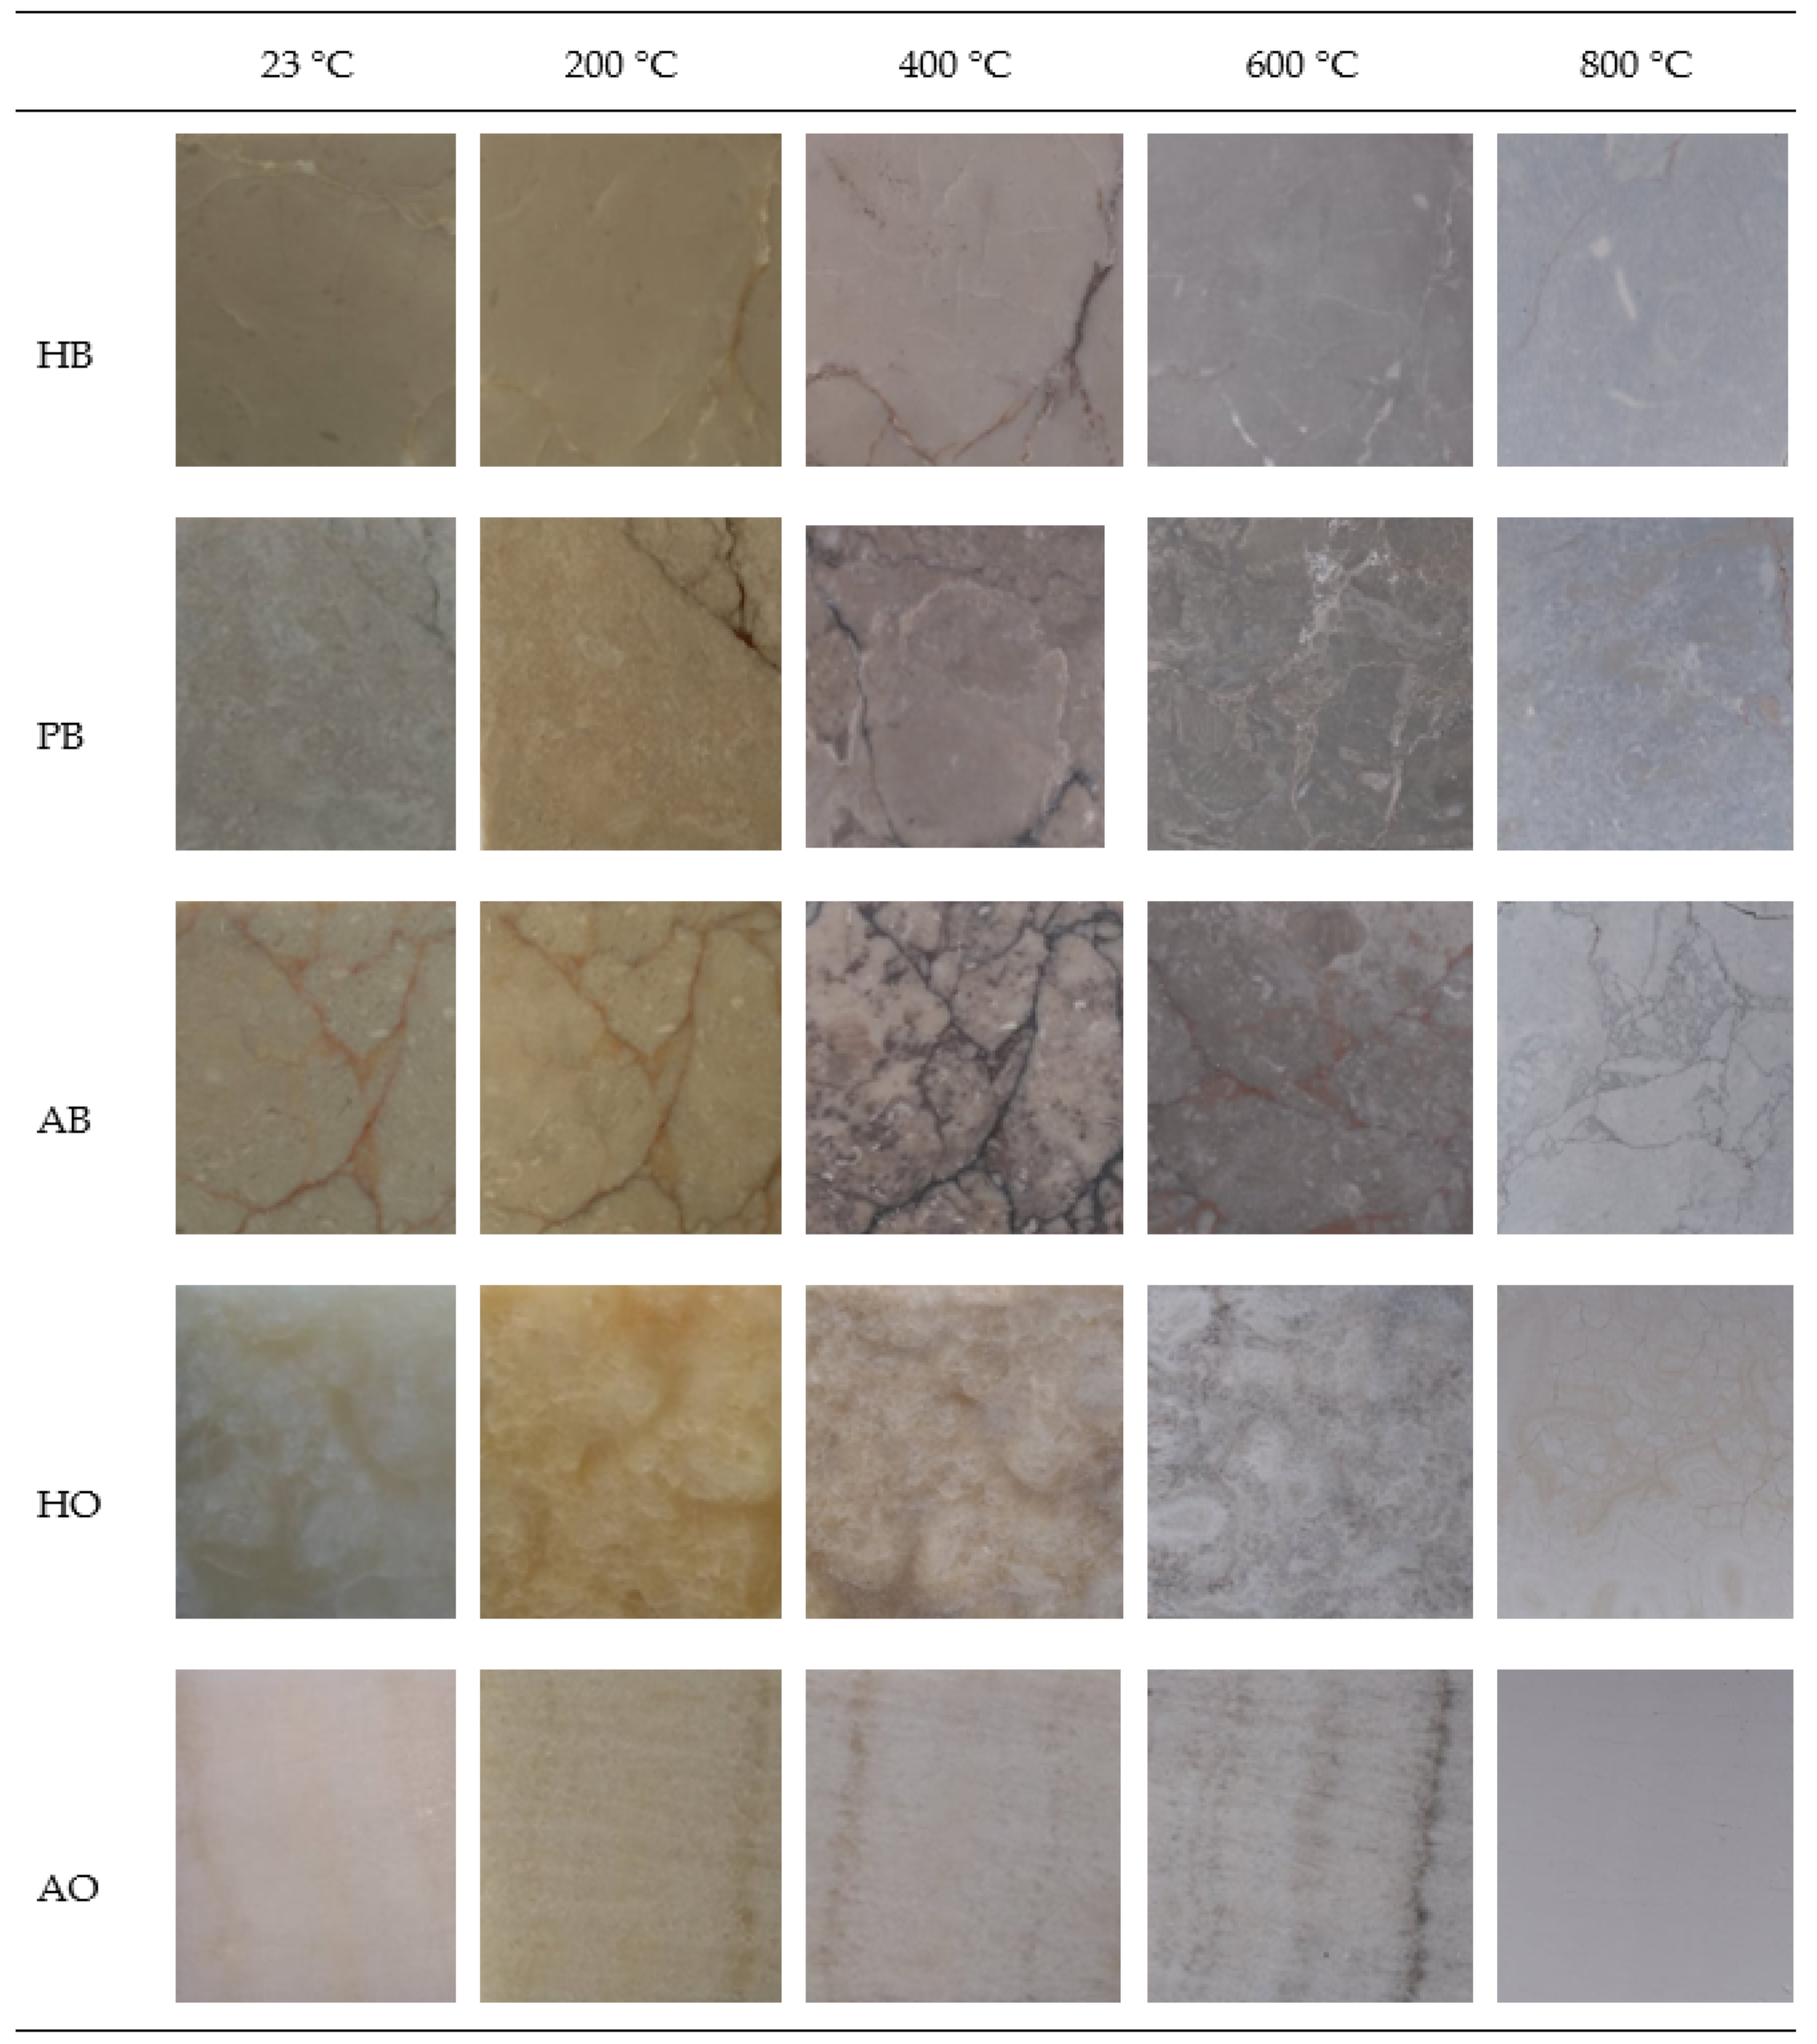
| Code | Commercial Name | Stone Type | Location |
|---|---|---|---|
| HB | Hazar Beige | Limestone | Hazar-Elazig |
| PB | Pertek Beige | Limestone | Pertek-Tunceli |
| AB | Akçadağ Beige | Limestone | Akçadağ-Malatya |
| HO | Honey Onyx | Limestone | Sögüt-Bilecik |
| AO | Ağrı Onyx | Dolomite | Diyadin-Ağri |
| Sample | HB (%) | PB (%) | AB (%) | HO (%) | AO (%) |
|---|---|---|---|---|---|
| Fe2O3 | 0.06 | 0.06 | 0.15 | 2.45 | 1.66 |
| MgO | 0.45 | 0.42 | 0.30 | 0.69 | 14.48 |
| Al2O3 | 0.04 | 0.04 | 0.08 | ˂0.01 | ˂0.01 |
| SiO2 | ˂0.01 | ˂0.01 | ˂0.01 | ˂0.01 | ˂0.01 |
| P2O5 | ˂0.01 | ˂0.01 | 0.01 | 0.06 | 0.07 |
| K2O | ˂0.01 | ˂0.01 | ˂0.01 | 0.01 | 0.01 |
| CaO | 54.14 | 53.15 | 53.70 | 52.16 | 38.82 |
| TiO2 | ˂0.01 | ˂0.01 | 0.01 | ˂0.01 | ˂0.01 |
| MnO | ˂0.01 | ˂0.01 | ˂0.01 | 0.29 | 0.35 |
| ZnO | ˂0.01 | ˂0.01 | ˂0.01 | ˂0.01 | ˂0.01 |
| SrO | 0.02 | 0.02 | 0.01 | ˂0.01 | ˂0.01 |
| PbO | ˂0.01 | ˂0.01 | ˂0.01 | ˂0.01 | ˂0.01 |
| Na2O | 2.20 | 2.18 | 2.01 | 0.08 | 0.12 |
| LOI | 43.08 | 44.12 | 43.73 | 44.25 | 44.48 |
| Test | Code | 23 °C | 200 °C | 400 °C | 600 °C | 800 °C |
|---|---|---|---|---|---|---|
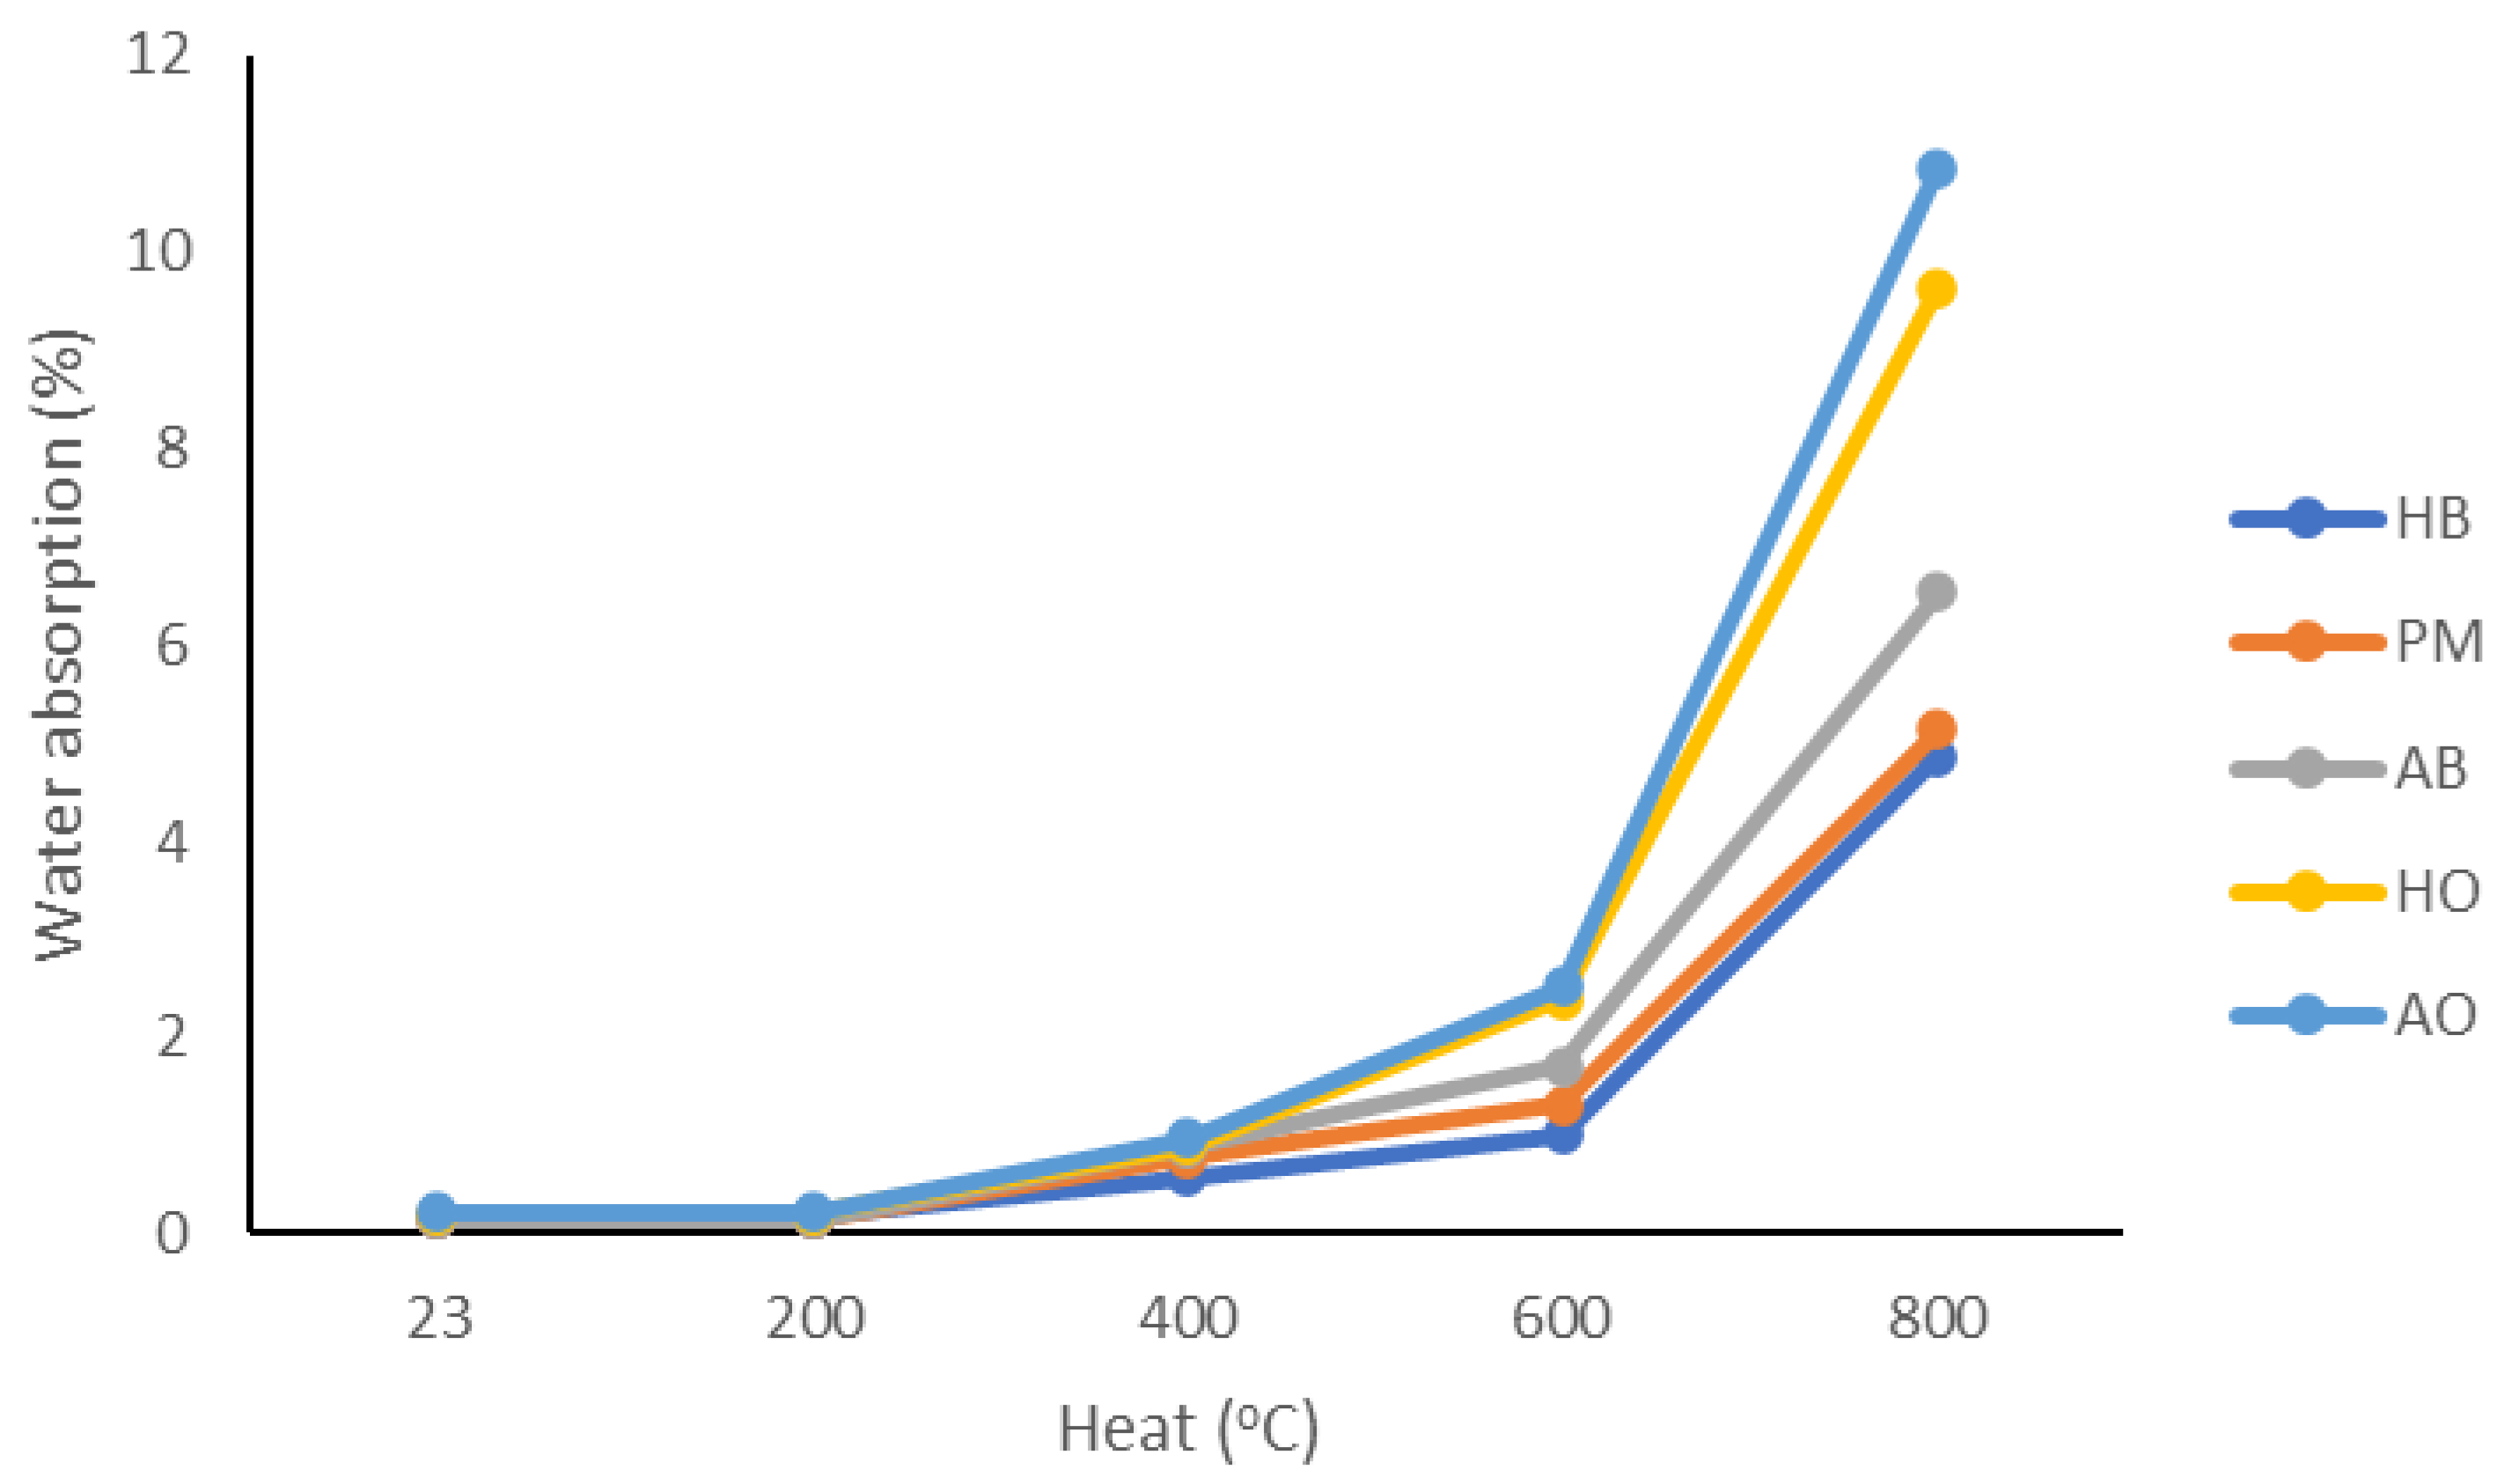
| Water Absorption (%) | HB | 0.162 ± 0.031 | 0.164 ± 0.034 | 0.587 ± 0.053 | 1.008 ± 0.088 | 4.862 ± 0.245 |
| PM | 0.158 ± 0.030 | 0.161 ± 0.037 | 0.787 ± 0.062 | 1.321 ± 0.101 | 5.142 ± 0.271 | |
| AB | 0.151 ± 0.032 | 0.155 ± 0.040 | 0.889 ± 0.069 | 1.719 ± 0.124 | 6.541 ± 0.432 | |
| HO | 0.202 ± 0.048 | 0.210 ± 0.044 | 0.907 ± 0.078 | 2.388 ± 0.142 | 9.643 ± 0.678 | |
| AO | 0.221 ± 0.042 | 0.229 ± 0.042 | 0.972 ± 0.101 | 2.524 ± 0.159 | 10.862 ± 0.702 | |
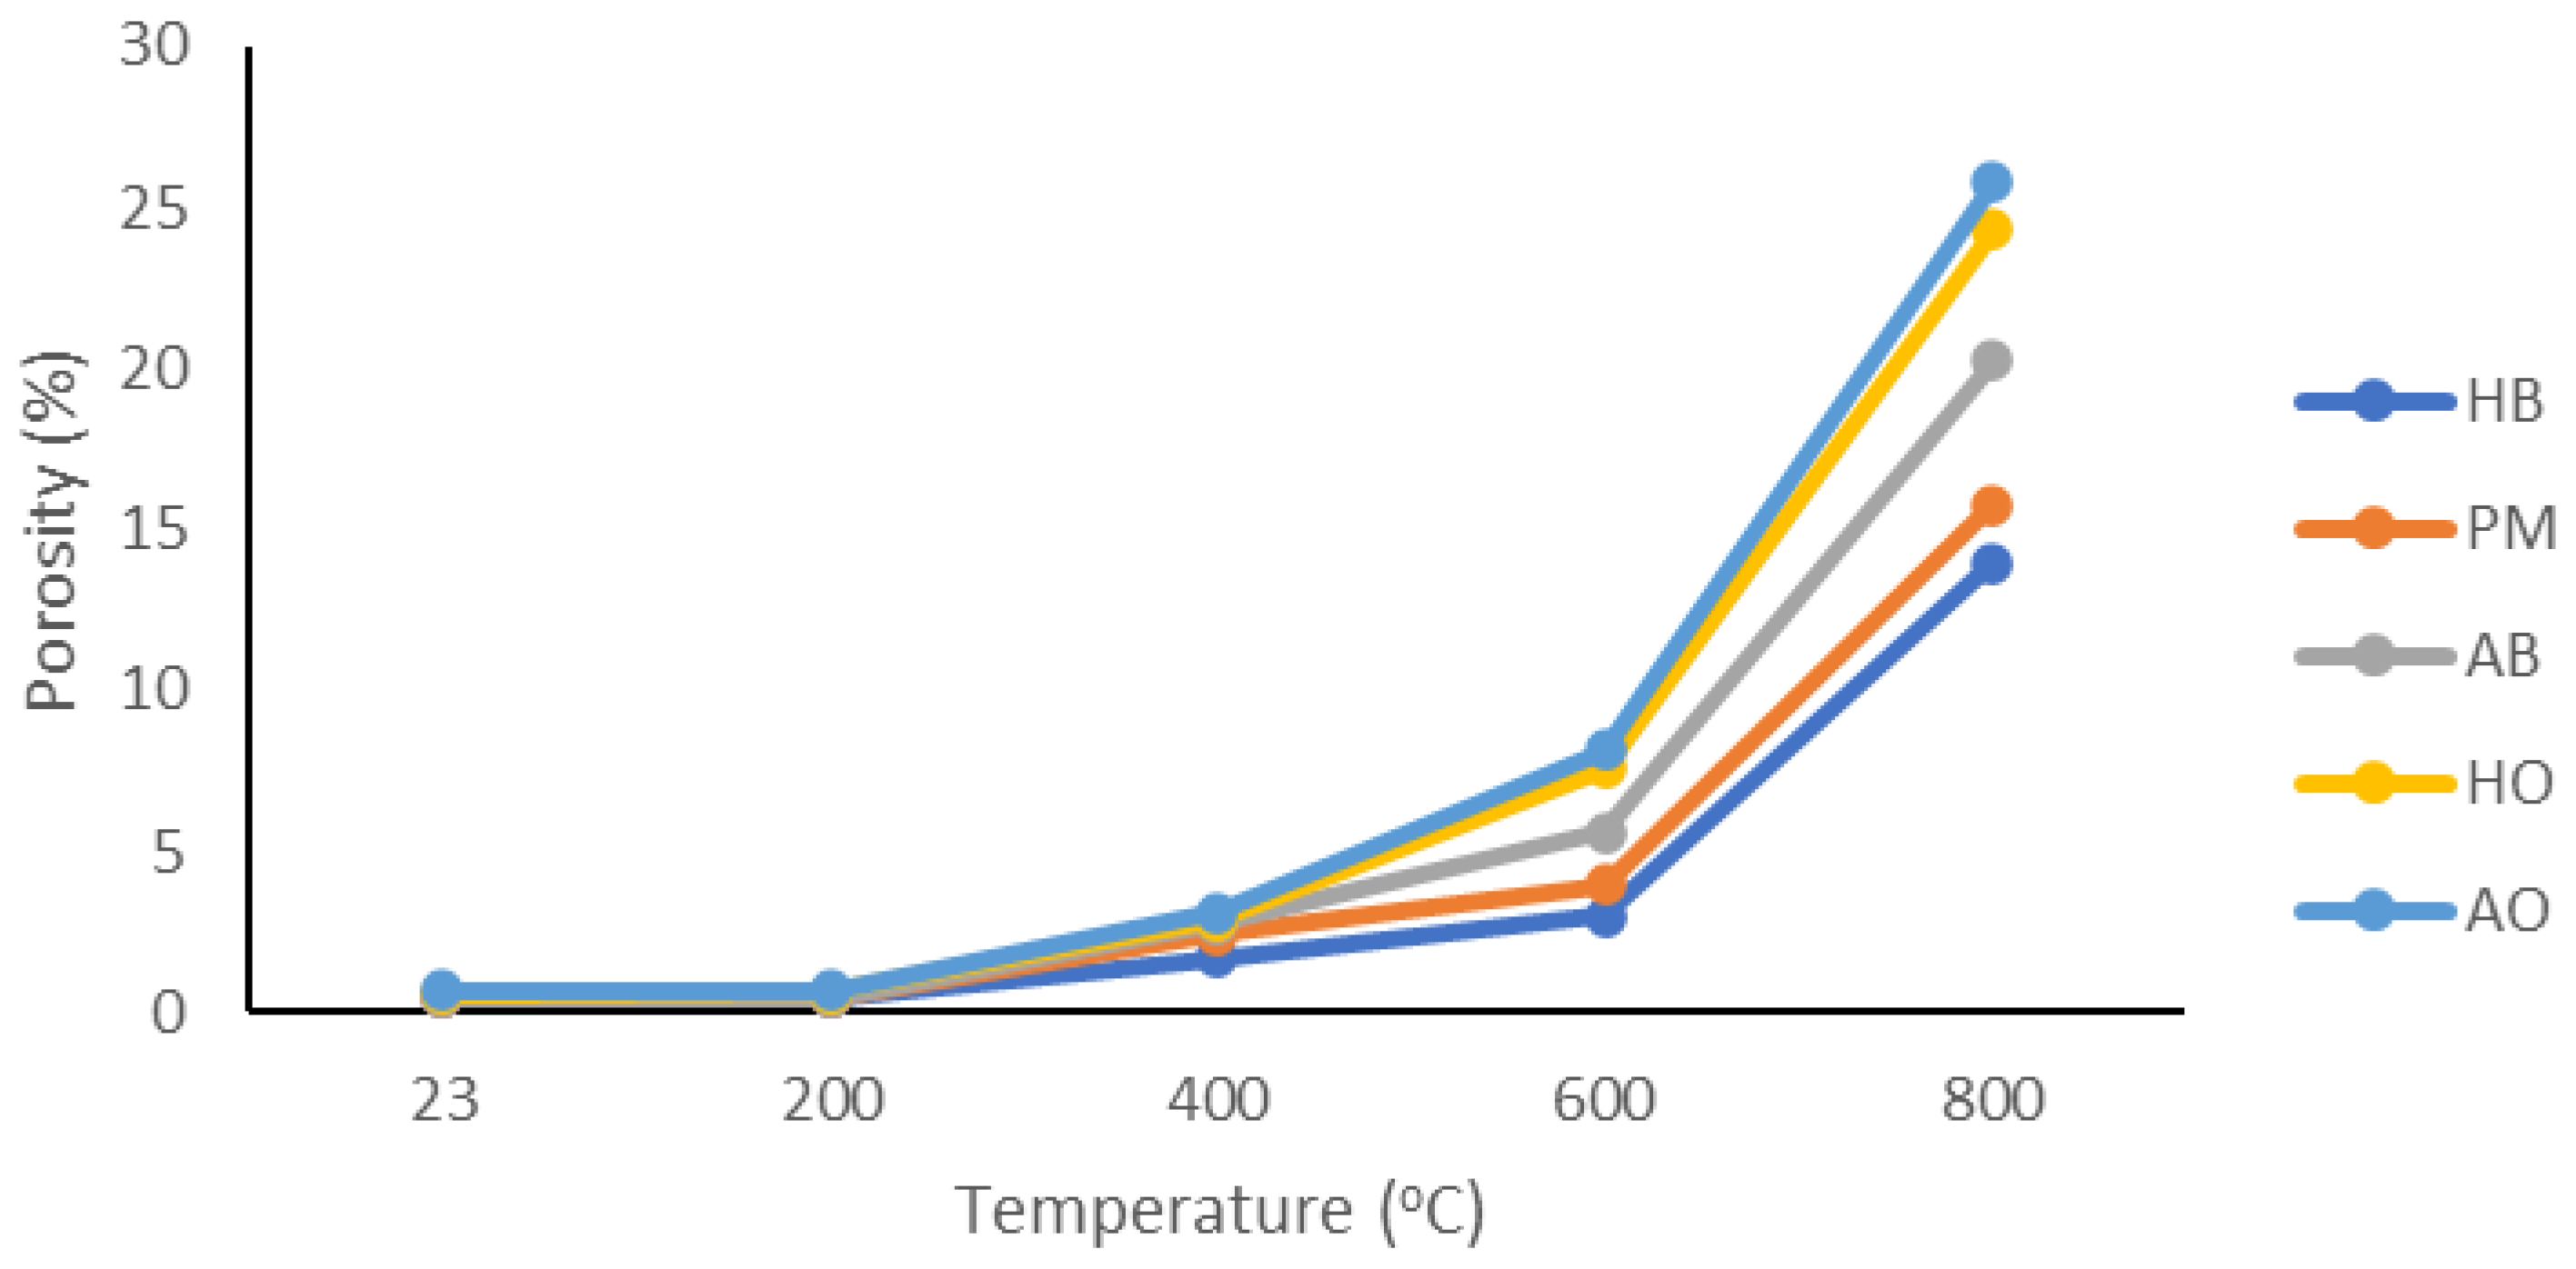
| Porosity (%) | HB | 0.466 ± 0.058 | 0.472 ± 0.054 | 1.702 ± 0.122 | 2.993 ± 0.171 | 13.965 ± 0.897 |
| PM | 0.422 ± 0.050 | 0.451 ± 0.051 | 2.423 ± 0.154 | 3.976 ± 0.192 | 15.785 ± 0.991 | |
| AB | 0.423 ± 0.048 | 0.433 ± 0.049 | 2.777 ± 0.158 | 5.570 ± 0.298 | 20.221 ± 1.131 | |
| HO | 0.589 ± 0.062 | 0.601 ± 0.060 | 2.884 ± 0.170 | 7.593 ± 0.542 | 24.294 ± 1.211 | |
| AO | 0.652 ± 0.060 | 0.672 ± 0.062 | 3.120 ± 0.181 | 8.134 ± 0.612 | 25.784 ± 1.227 | |
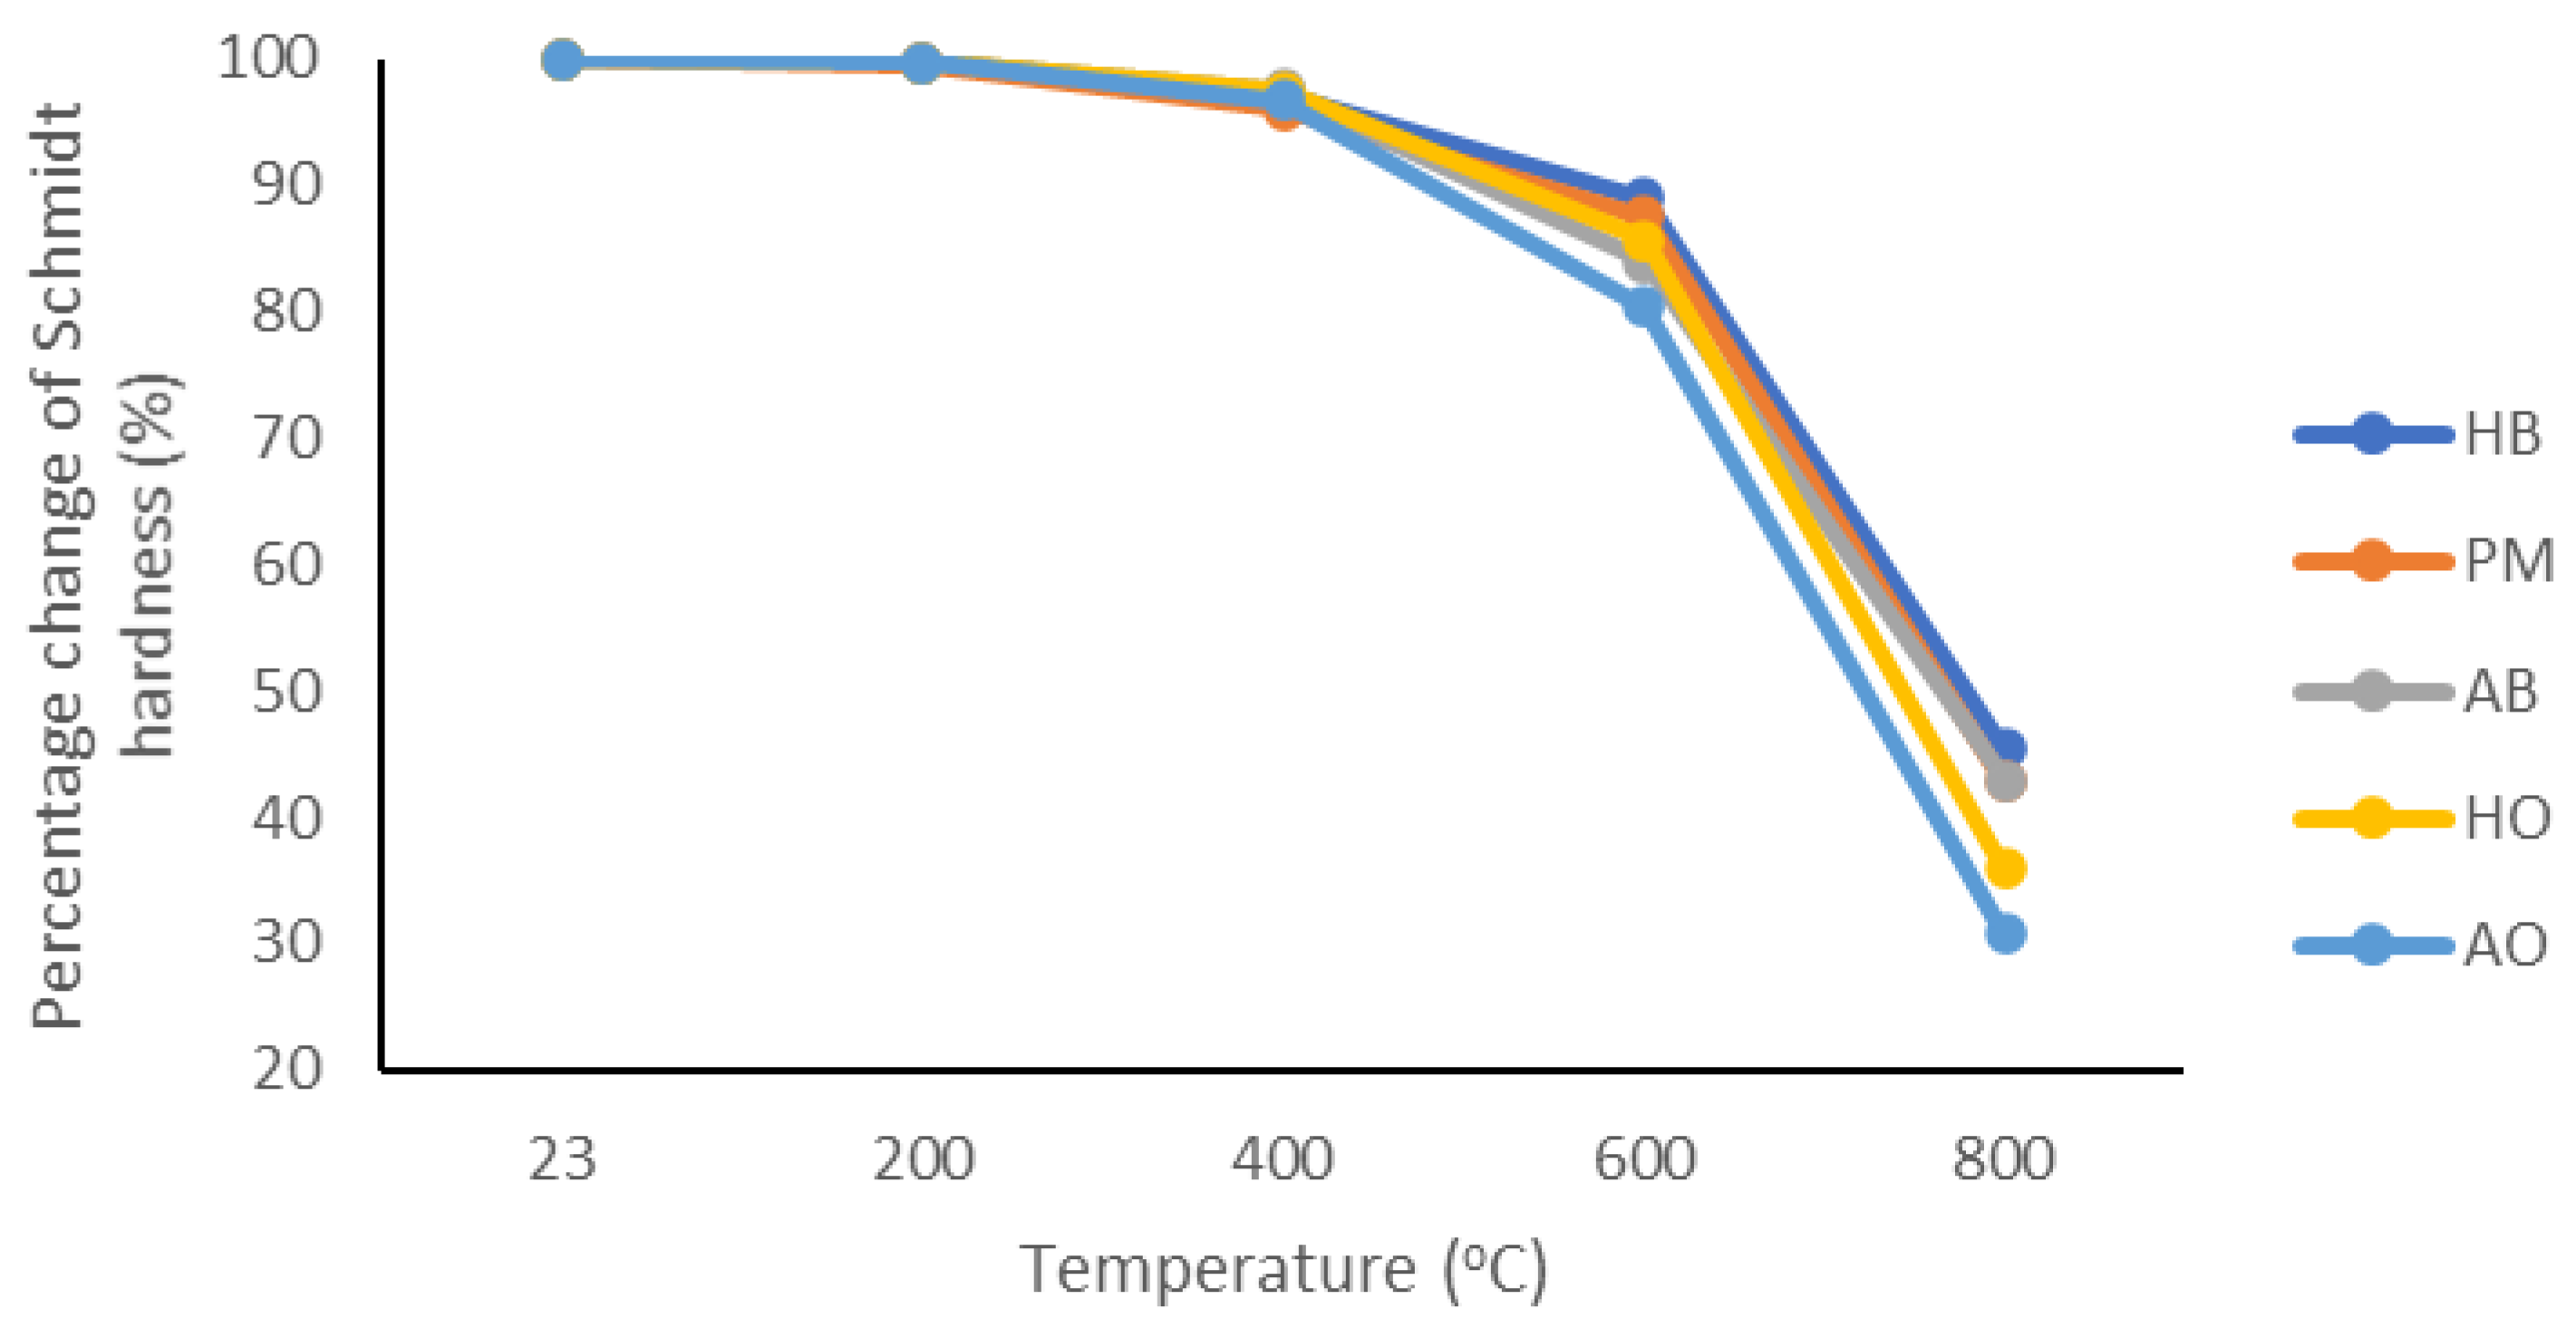
| Schmidt Hammer Hardness | HB | 45.4 ± 0.6 | 45.3 ± 0.7 | 44.2 ± 0.7 | 40.4 ± 0.6 | 20.6 ± 0.4 |
| PM | 44.8 ± 0.5 | 44.6 ± 0.6 | 43.0 ± 0.7 | 39.2 ± 0.7 | 19.2 ± 0.4 | |
| AB | 43.1 ± 0.5 | 43.0 ± 0.6 | 42.1 ± 0.6 | 36.2 ± 0.4 | 18.5 ± 0.3 | |
| HO | 38.4 ± 0.4 | 38.3 ± 0.4 | 37.4 ± 0.5 | 32.9 ± 0.5 | 13.8 ± 0.3 | |
| AO | 37.1 ± 0.5 | 37.0 ± 0.4 | 35.9 ± 0.6 | 29.8 ± 0.4 | 11.4 ± 0.2 | |
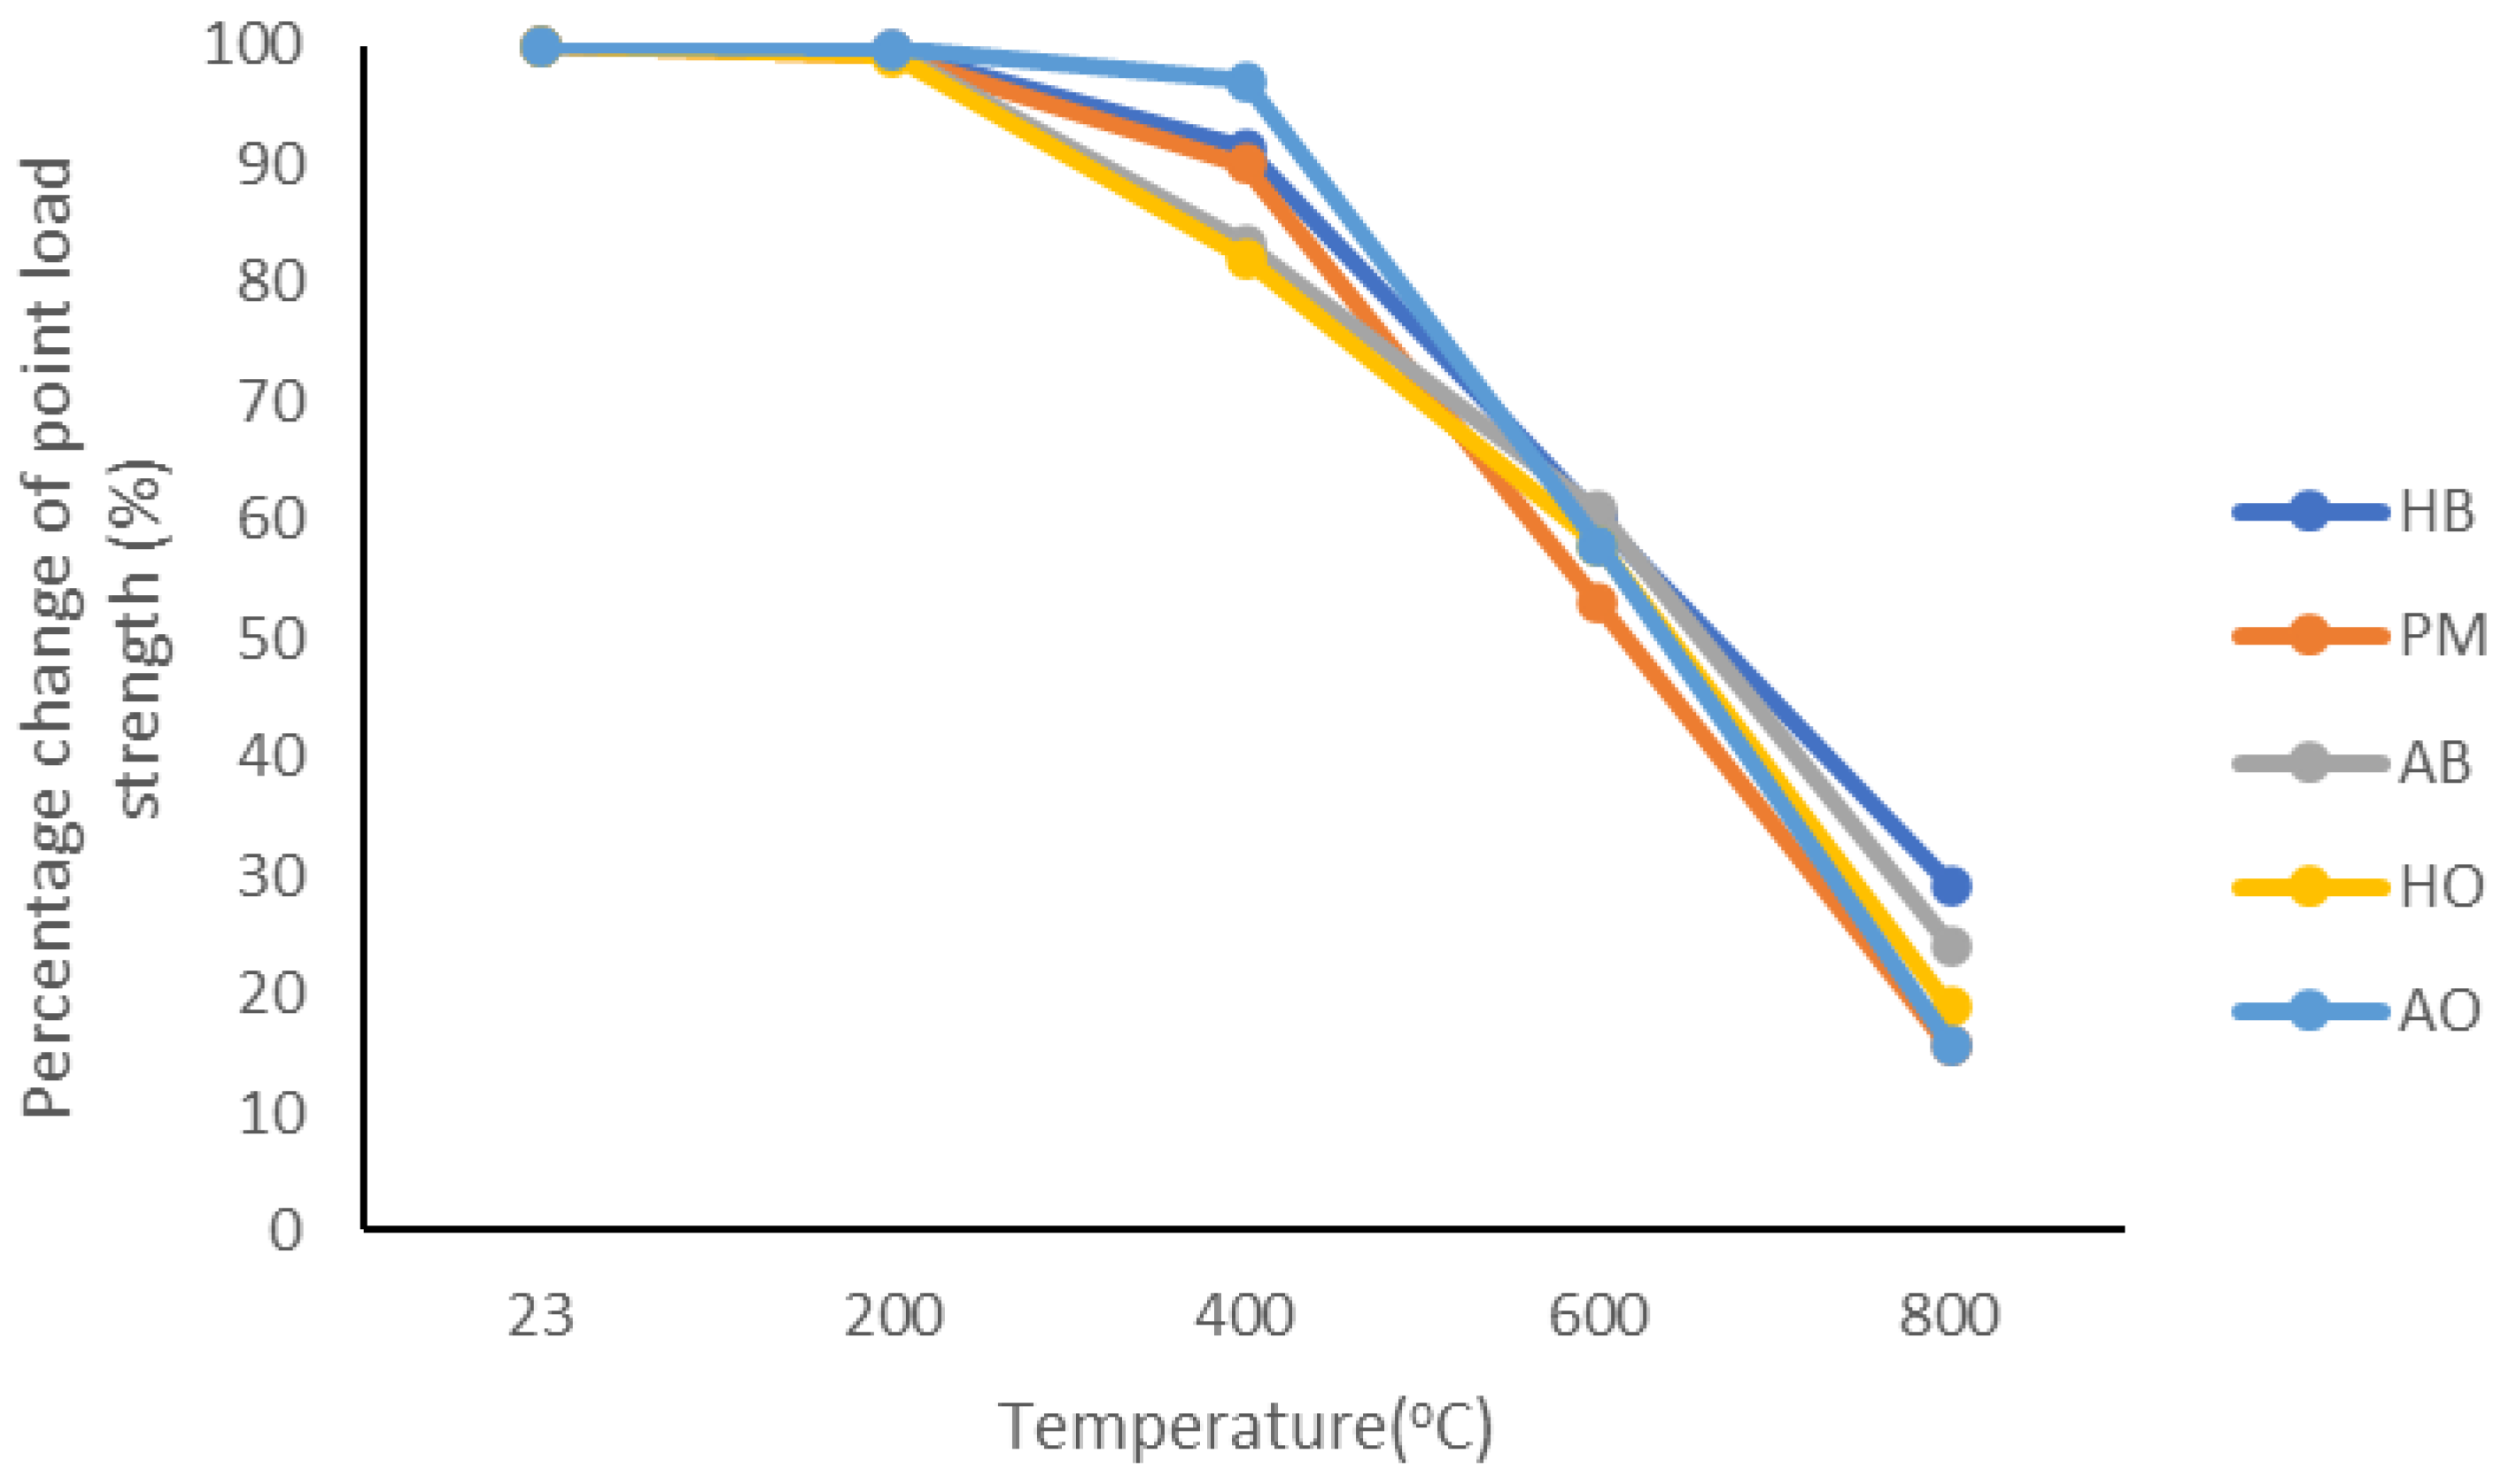
| Point Load Strength (MPa) | HB | 7.67 ± 0.89 | 7.64 ± 0.63 | 7.01 ± 0.56 | 4.61 ± 0.37 | 2.24 ± 0.11 |
| PM | 7.58 ± 0.33 | 7.53 ± 0.46 | 6.82 ± 0.48 | 4.02 ± 0.34 | 1.18 ± 0.12 | |
| AB | 5.89 ± 0.17 | 5.87 ± 0.47 | 4.91 ± 0.36 | 3.58 ± 0.29 | 1.42 ± 0.14 | |
| HO | 5.49 ± 0.32 | 5.44 ± 0.36 | 4.51 ± 0.32 | 3.18 ± 0.26 | 1.04 ± 0.19 | |
| AO | 5.21 ± 0.46 | 5.20 ± 0.41 | 5.06 ± 0.44 | 3.02 ± 0.14 | 0.82 ± 0.11 |
| Test | Heat (°C) | HB (%) | PB (%) | AB (%) | HO (%) | AO (%) |
|---|---|---|---|---|---|---|
| Water Absorption | 200 | +0.002 | +0.003 | +0.004 | +0.008 | +0.008 |
| 400 | +0.425 | +0.629 | +0.738 | +0.705 | +0.751 | |
| 600 | +0.846 | +1.163 | +1.568 | +2.186 | +2.303 | |
| 800 | +4.700 | +4.984 | +6.390 | +9.441 | +10.641 | |
| Porosity | 200 | +0.006 | +0.029 | +0.010 | +0.012 | +0.020 |
| 400 | +1.236 | +2.001 | +2.354 | +2.295 | +2.468 | |
| 600 | +2.527 | +3.554 | +5.147 | +7.004 | +7.482 | |
| 800 | +13.499 | +15.363 | +19.798 | +23.705 | +25.132 | |
| Schmidt Hammer Hardness | 200 | −0.220 | −0.446 | −0.232 | −0.260 | −0.270 |
| 400 | −2.643 | −4.018 | −2.320 | −2.604 | −3.235 | |
| 600 | −11.013 | −12.500 | −16.009 | −14.323 | −19.677 | |
| 800 | −54.626 | −57.143 | −57.077 | −64.063 | −69.272 | |
| Point Load Strength | 200 | −0.391 | −0.660 | −0.340 | −0.911 | −0.192 |
| 400 | −8.605 | −10.026 | −16.638 | −17.851 | −2.879 | |
| 600 | −39.896 | −46.966 | −39.219 | −42.077 | −42.035 | |
| 800 | −70.795 | −84.433 | −75.891 | −81.056 | −84.261 |
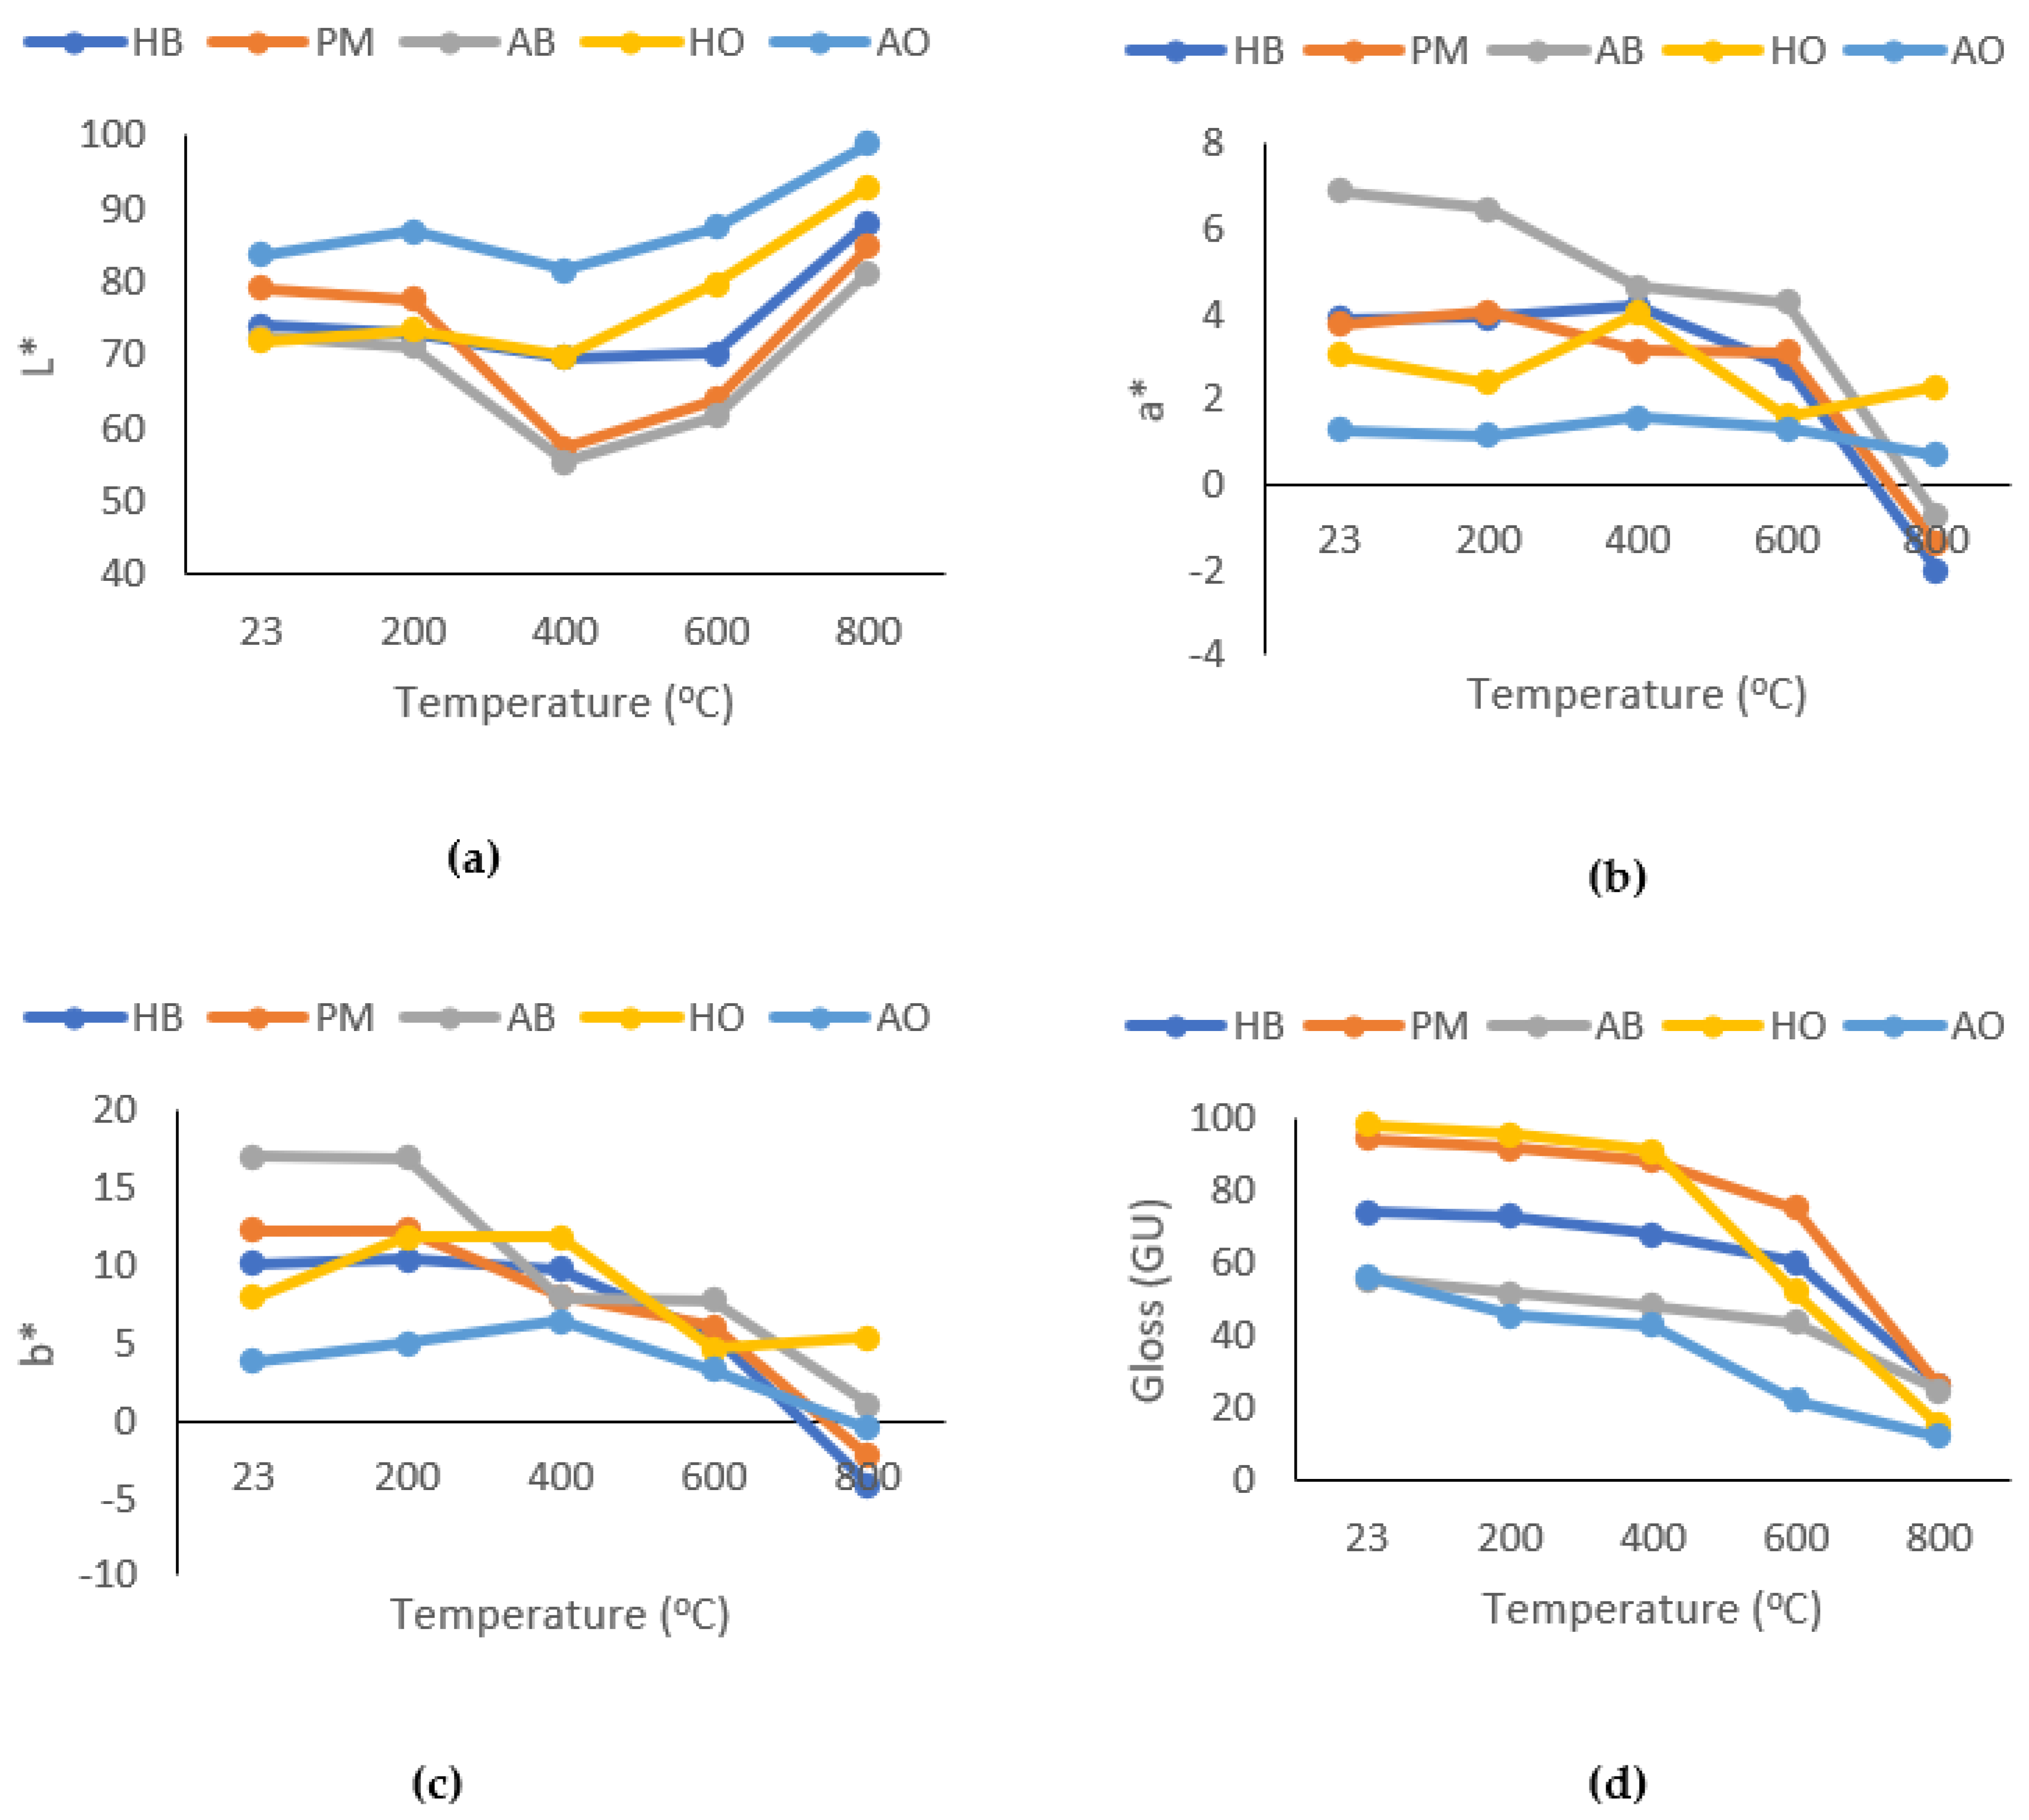
| Code | L*, a*, b*, GU | 23 °C | 200 °C | 400 °C | 600 °C | 800 °C |
|---|---|---|---|---|---|---|
| HB | L | 74.09 | 72.87 | 69.67 | 70.15 | 88.11 |
| a | 3.89 | 3.94 | 4.20 | 2.75 | −2.01 | |
| b | 10.12 | 10.41 | 9.81 | 5.67 | −4.15 | |
| GU | 74.1 | 73.2 | 68.2 | 60.3 | 26.3 | |
| PM | L | 79.15 | 77.58 | 57.25 | 63.87 | 84.77 |
| a | 3.77 | 4.07 | 3.13 | 3.10 | −1.38 | |
| b | 12.32 | 12.28 | 8.08 | 6.07 | −2.25 | |
| GU | 94.6 | 91.8 | 88.5 | 75.3 | 26.0 | |
| AB | L | 72.54 | 71.22 | 55.42 | 61.72 | 81.17 |
| a | 6.91 | 6.46 | 4.64 | 4.28 | −0.75 | |
| b | 17.01 | 16.95 | 8.01 | 7.83 | 1.06 | |
| GU | 55.6 | 51.8 | 48.3 | 43.9 | 24.8 | |
| HO | L | 71.94 | 73.51 | 69.86 | 79.77 | 92.98 |
| a | 3.05 | 2.41 | 4.02 | 1.62 | 2.31 | |
| b | 8.02 | 11.8 | 11.8 | 4.66 | 5.38 | |
| GU | 98.4 | 95.8 | 91.1 | 52.4 | 15.3 | |
| AO | L | 83.77 | 86.85 | 81.53 | 87.45 | 98.93 |
| a | 1.28 | 1.15 | 1.59 | 1.33 | 0.69 | |
| b | 3.86 | 5.04 | 6.47 | 3.29 | −0.48 | |
| GU | 56.4 | 45.9 | 42.9 | 22.3 | 12.1 |
Publisher’s Note: MDPI stays neutral with regard to jurisdictional claims in published maps and institutional affiliations. |
© 2022 by the author. Licensee MDPI, Basel, Switzerland. This article is an open access article distributed under the terms and conditions of the Creative Commons Attribution (CC BY) license (https://creativecommons.org/licenses/by/4.0/).
Share and Cite
Özdemir, E. Investigation of Some Property Changes of Light-Colored Turkish Natural Stones after High-Temperature Treatments. Sustainability 2022, 14, 10298. https://doi.org/10.3390/su141610298
Özdemir E. Investigation of Some Property Changes of Light-Colored Turkish Natural Stones after High-Temperature Treatments. Sustainability. 2022; 14(16):10298. https://doi.org/10.3390/su141610298
Chicago/Turabian StyleÖzdemir, Engin. 2022. "Investigation of Some Property Changes of Light-Colored Turkish Natural Stones after High-Temperature Treatments" Sustainability 14, no. 16: 10298. https://doi.org/10.3390/su141610298