Article

Spatial-Temporal Changes of Carbon Source/Sink in Terrestrial Vegetation Ecosystem and Response to Meteorological Factors in Yangtze River Delta Region (China)

1
College of Geography and Tourism, Anhui Normal University, Wuhu 241002, China
2
College of Computer and Information Engineering, Chuzhou University, Chuzhou 239000, China
3
College of Geography and Tourism, Xinjiang Normal University, Urumqi 830054, China
4
College of Landscape Architecture, Sichuan Agricultural University, Chengdu 611130, China
*
Authors to whom correspondence should be addressed.
Sustainability 2022, 14(16), 10051; https://doi.org/10.3390/su141610051
Submission received: 1 June 2022 / Revised: 5 August 2022 / Accepted: 8 August 2022 / Published: 13 August 2022

Abstract

:
As an important part and the core link of a terrestrial ecosystem, terrestrial vegetation is the main means for human to regulate climate and mitigate the increase in atmospheric CO2 concentration. The Yangtze River Delta (YRD) region is an urban agglomeration with the strongest comprehensive strength among developing countries (China). In the context of global climate change, a rapid, comprehensive, and detailed understanding of the spatio-temporal characteristics and variation tendency of the net ecosystem productivity (NEP) of vegetation and its response to climate during the rapid development of the YRD region is important for protecting ecological land, strengthening land management, and optimizing urban planning. The monthly mean temperature and rainfall data from 63 meteorological stations, the MODIS net primary productivity product, and a land cover product in the YRD region were used to estimate the NEP from 2000 to 2019 based on the soil respiration model, and the correlation between NEP and meteorological factors (such as temperature and rainfall) was analyzed. The results showed that: (1) From 2000 to 2019, the carbon sink area was much larger than the carbon source area in terrestrial vegetation in the Yangtze River Delta, the mean NEP of the vegetation ecosystem in the past 20 years was 253.2 g C·m−2·a−1, and the spatial distribution presented a trend that was higher in the south and lower in the north, higher in the east and lower in the west, and that gradually increased from northwest to southeast; moreover, the NEP of mountain areas was generally higher than that of river courses and urban surroundings. The interannual fluctuation of NEP was small, but presented a slightly increasing trend, and the interannual variation of NEP was significantly correlated with the maximum NEP in this region. (2) The carbon sink capacity of different vegetation cover types was (from strong to weak): forestlands > grasslands > wetlands ≈ croplands. (3) The area with the NEP change rate (θslope) > 0 accounted for 69.0%; however, there was certain spatial difference, the proportions of the areas with θslope < 0 were (from large to small) 14.50% (Zhejiang Province, China), 9.10% (Anhui Province, China), 6.65% (Jiangsu Province, China), and 0.79% (Shanghai, China). In terms of the individual changes of these provinces and municipalities, Shanghai > Zhejiang Province > Jiangsu Province ≈ Anhui Province. (4) There was a correlation between NEP and the annual mean temperature and annual precipitation in some regions.

1. Introduction

Globally, China is the largest developing country and the largest carbon-emitting country. At the 75th Session of the United Nations General Assembly in 2020, China made a solemn commitment to the world to achieve carbon peak by 2030 and carbon neutral by 2060. Moreover, the Fifth Plenary Session of the 19th CPC Central Committee and the Central Economic Working Conference also arranged for related tasks [1,2,3]. The establishment of a national Carbon Emission Trade Market was a prerequisite and an important measure for China to realize this commitment as scheduled, which led to the evolution of “carbon emission rights” into a commodity that can be traded on the market [4]. The Yangtze River Delta region (hereinafter referred to as the Yangtze River Delta) is the urban agglomeration area with the strongest comprehensive strength in China [5], and promoting the integrated development of the Yangtze River Delta has become a national strategy. In order to improve the economic agglomeration, regional connectivity, and policy collaborative efficiency in the Yangtze River Delta region, and to actively respond to the opening of the China Carbon Emission Trade Exchange, building a modern economic system is a major challenge [6]. Therefore, it is necessary to accurately measure and analyze the evolution of the temporal and spatial patterns of carbon sources and sinks in this region in recent years and their influencing factors, thus providing strong support for the adjustment of the regional economic structure, industrial structure, and energy structure.
Since 1980s, extensive research has been conducted on regional carbon sources and carbon sinks at home and abroad, and the research contents have mainly focused on the following three aspects: firstly, the metrical research on carbon sources and carbon sinks, including the metrical research on gross primary productivity (GPP) [7,8,9], net primary productivity (NPP) [10,11,12], and net ecosystem productivity (NEP) of vegetation [13,14,15]. Secondly, the analysis of the main influencing factors that cause changes in carbon sources and carbon sinks in the region or the responses of various factors to their changes, such as climate change [16,17], human activities [18,19], and the natural environment, etc., [20,21]. Thirdly, the prediction of future forms is made by establishing models or adjusting parameters or selecting parameters. For example, machine learning technology is combined with remote sensing technology to establish a data set; then, random forest is used as an estimation model. The model is adjusted according to data characteristics after modeling [22]. By analyzing the long-term emission characteristics of a certain industry with large carbon emissions in a specific region and the macro-control effect of its development strategy, the future change scenario of carbon emissions in this region is predicted [23]. In some cases, regional characteristics of carbon emissions are analyzed empirically, and scenario simulation, influence factor analysis, and grey correlation degree calculation are adopted to propose main paths and specific schemes to achieve low-carbon goals according to the development goals of a regional, low-carbon economy in the coming decades [24]. The above studies have laid a theoretical foundation for the research on carbon sources and sinks in the region. In addition, these studies require various data types, high precision requirements, complex calculation, and large human intervention in model parameters. However, most of them have concentrated on the original ecological areas with relatively few human activities. In urban agglomerations with rapid economic development, there are few studies on the temporal variation of the spatial distribution pattern of a carbon source and carbon sink of a terrestrial vegetation ecosystem. In particular, the transformation of land types under different land cover types (such as forestland, grassland, etc.) caused by rapid social and economic development leads to changes in carbon sources and carbon sinks and less analysis and research on their spatial pattern changes. According to the new national development strategy aiming to tackle the challenge of the opening of the China Carbon Emission Trade Exchange that will be actively faced by the integrated development of the Yangtze River Delta, this paper analyzes the temporal changes and spatial distribution patterns of carbon sources and carbon sinks over time and their response to meteorological factors in the terrestrial vegetation ecosystem of the region from 2000 to 2019. The opportunities and challenges behind the rapid social and economic development of the integration of the Yangtze River Delta are explored so as to understand the history, current status, and influencing mechanisms of carbon sources and carbon sinks in this region from multiple aspects, as well as to better revise and improve the opening policy of the National Carbon Emission Trade Exchange and provide a good decision-making basis for emission reduction policies.

2. Materials and Methods

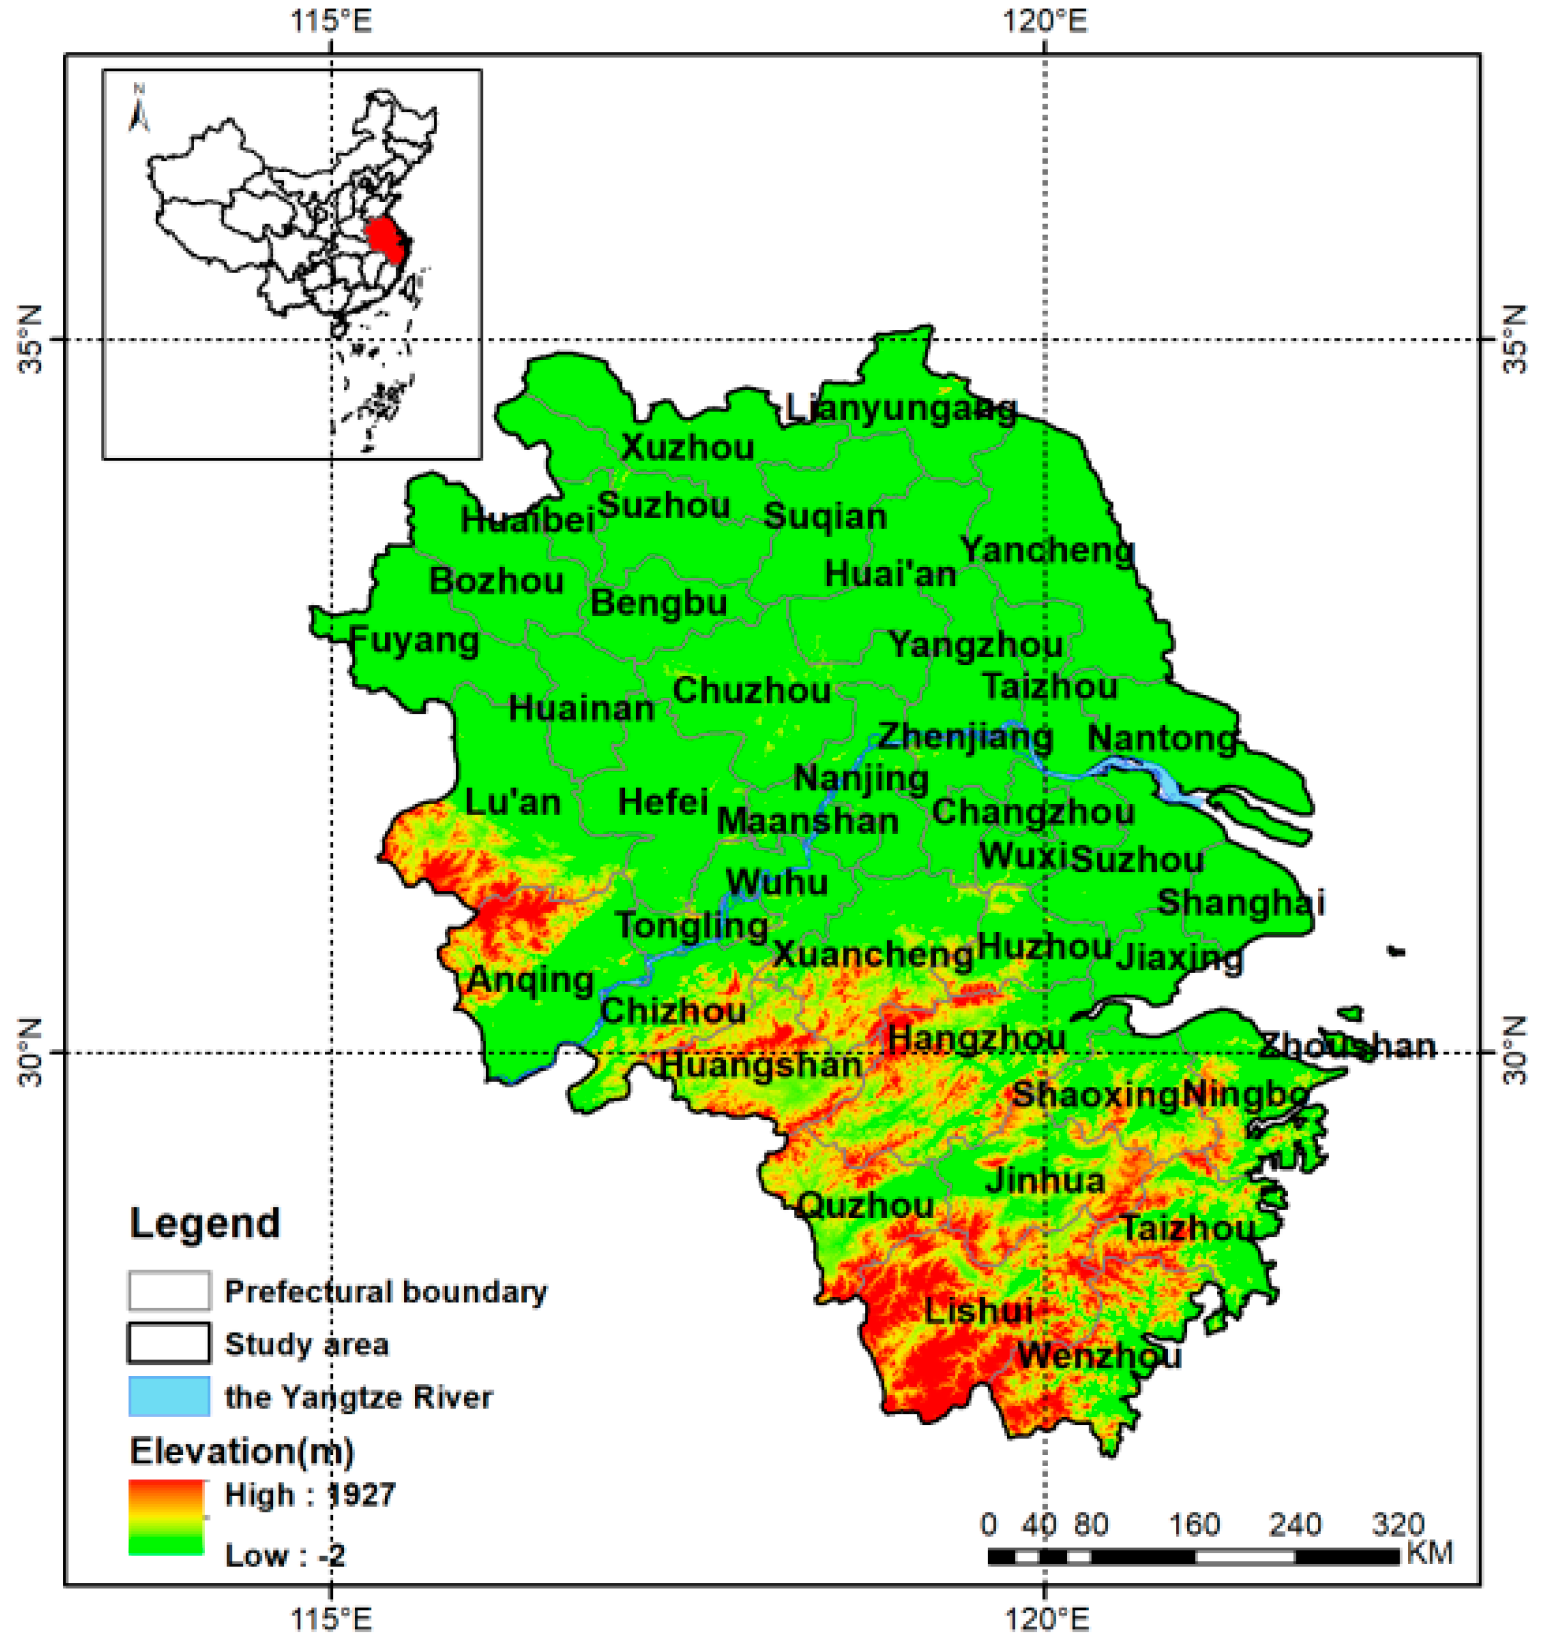
2.1. Overview of Research Area

According to the Outline of the Integrated Development Plan for the Yangtze River Delta region issued by the State Council, the planning scope of the Yangtze River Delta (Figure 1) includes Shanghai, Jiangsu Province, Zhejiang Province, and Anhui Province of China (Area: 358,000 km2, Population: 235 million people). Yangtze River Delta Urban Agglomerations are established with 27 cities as the central area (225,000 km2), including Shanghai Municipality, Nanjing, Wuxi, Changzhou, Suzhou, Nantong, Yangzhou, Zhenjiang, Yancheng, and Taizhou in Jiangsu Province of China; Hangzhou, Ningbo, Wenzhou, Huzhou, Jiaxing, Shaoxing, Jinhua, Zhoushan, and Taizhou in Zhejiang Province of China; Hefei, Wuhu, Ma’anshan, Tongling, Anqing, Chuzhou, Chizhou, and Xuancheng in Anhui Province of China, so as to radiate and drive the high-quality development of the Yangtze River Delta region. Qingpu District (Shanghai), Wujiang District (Jiangsu), and Jiashan County (Zhejiang, China) are taken as the Ecological and Green Integrated Development Demonstration Zone of Yangtze River Delta (area: about 2300 km2) to the demonstrate and lead the higher-quality integrated development of the Yangtze River Delta region. Shanghai Lingang and other areas are taken as the new areas of the China (Shanghai) Pilot Free Trade Zone to create special economic function zones that are in line with international general practices and have greater influence and competitiveness in the international market.
The Yangtze River Delta region is in the lower reaches of the Yangtze River in China and is close to the Yellow Sea and the East China Sea. It is located at the intersection of the river and the sea and has many ports. It is an alluvial plain formed before the Yangtze River enters the sea, and has a vast water surface, significant tidal action, and a lot of sediment deposits. It is mainly dominated by subtropical monsoon climate. Since 2000, the annual mean temperature and the annual mean maximum and minimum temperatures have increased significantly, and the temperature’s increasing rate is higher in winter and spring, and lowest in summer. The Yangtze River Delta is the region with the highest drainage density in China, with a mean length of 4.8–6.7 km per square kilometer. There are more than 200 lakes on the plain, with abundant water resources and a good natural water environment. There are complex types of ecosystems and diverse surface coverages. There are mainly six land use types, namely grasslands, croplands, forestlands, wetland, built-up lands, and unused lands. The Yangtze River Delta spans the north and middle subtropics, and consists of three types of forest tree communities, namely deciduous broad-leaved forests containing the evergreen broad-leaved tree species, deciduous and evergreen broad-leaved mixed forests, and evergreen broad-leaved forests.

2.2. Data Sources

Remote sensing data: EOS/MODIS 500 m resolution net primary productivity product (MOD17A3H) from 2000 to 2019. The data used the BIOME-BGC model and the solar energy utilization efficiency model to calculate the annual net primary productivity (NPP) of the regional terrestrial vegetation ecosystem. The data were downloaded from the MODIS website (https://modis.gsfc.nasa.gov/, accessed on 6 August 2020).
Land cover data: MODIS land cover product MCD12Q1 data, land cover classification scheme 1 was used: IGBP global vegetation classification scheme. The data were used to analyze the carbon sink capacity of different vegetation types, including cultivated land, wetland, grassland, shrub, woodland, construction land, and unused land (7 categories, covering 17 subcategories). The data were downloaded from the MODIS website (https://modis.gsfc.nasa.gov/, accessed on 6 August 2020) to analyze the difference in carbon sink capacity under the coverage of different vegetation types.
Meteorological data: the monthly mean temperature and monthly precipitation data of 63 stations in the Yangtze River Delta from 2000 to 2019 were downloaded from the website of China Meteorological Data (http://data.cma.cn/, accessed on 6 August 2020). The data for 2020 were not downloaded due to no authorization resulting from the website revision.

2.3. Data Processing

2.3.1. Calculation of NEP

The NEP of a vegetation ecosystem is an important index to measure the carbon source and sink of vegetation in a region. Without considering the influence of other natural and human factors, NEP is equal to the difference between vegetation NPP and soil microbial respiration carbon consumption [25]. the lengthy sequenced variation of NEP of terrestrial vegetation, and its response to climate needs to be rapidly, comprehensively, and precisely understood in the process of the rapid development of urban agglomeration with the strongest comprehensive strength in developing countries. If the influence of other natural and human conditions is not considered, it can be expressed as the difference between NPP and the carbon emissions from soil microbial respiration ( R H ), and the calculation formula is:
N E P = N P P R H
In Formula (1), NEP is the net ecosystem productivity of vegetation, NPP is the net primary productivity of vegetation, and R H is soil microbial respiration, and the units of these three factors are all g C·m−2·a−1. When NEP > 0, it means that the carbon fixed by vegetation is more than the carbon emitted by soil respiration, and the carbon sequestration by vegetation is reflected as a carbon sink effect. On the contrary, when NEP < 0, it is reflected as a carbon source effect. Therefore, it can be used for the quantitative analysis of the carbon sequestration status and potential of a regional vegetation ecosystem. The annual NPP data of vegetation are based on MODIS satellite remote sensing parameters, and the data are calculated by using the BIOMe-BGC model and light energy utilization model [26]. At present, these data have been verified and widely used in carbon cycle studies in many regions [27,28,29,30]. The annual total value is the total amount of NEP of all pixels in a year, the mean value of the total value in a year is the sum of annual total values of NEP of all pixels divided by the number of pixels, and the maximum and minimum values of the annual total value of NEP are the maximum and minimum values of NEP in all pixels in this region in the current year. R H refers to the amount of soil microbial respiration, which is related to the number and types of microorganisms in the soil and the exudates of plant roots. Temperature and precipitation are the two most important factors among all the factors affecting soil microbial respiration [31]. Therefore, R H was calculated by using the regression equation of temperature, precipitation, and carbon emission. Based on the field-measured data, the regression equation between soil carbon emission and conventional meteorological data (temperature T and precipitation R) is established, which can be readily applied to forestlands, grasslands, and croplands [13,15]. The calculation formula is:
R H = 0.22 × [ e 0.0913 T + l n ( 0.3145 R + 1 ) ] × 30 × 46.5 %
In Formula (2), conventional meteorological data are used. T (°C) is the monthly mean temperature, and R (mm) is the monthly precipitation.
Since construction land and unused land are carbon sources, when calculating NPP, the pixel values of such land types are removed in advance.

2.3.2. Evaluation Model

The Zhou Guangsheng–Zhang Xinshi (ZGS) model [32] connects vegetation productivity with temperature and precipitation, which is conducive to studying the interaction between climate change and vegetation. The simulated productivity model is closer to the actual [33,34,35], therefore the simulated results are usually taken as the actual values. Therefore, the accuracy of the values obtained by the ZGS model is verified with our estimated results. The results are then compared and verified to verify the accuracy of the MOD17A3-NEP data. The water heat balance vegetation net primary productivity model uses the precipitation and net radiation data obtained from the land surface to obtain the regional potential vegetation net primary productivity, i.e.,:
N P P = R D I · R · R n ( R 2 + R n 2 + R · R n ) ( R + R n ) · ( R 2 + R n 2 )   · E x p ( 9.87 + 6.25 R D I )
where RDI is radiation dryness; Rn is the annual net radiation (mm); R is annual precipitation (mm); NPP is the net primary productivity of vegetation (102 g·m−2·a−1).
Formula (3) can be further sorted as follows:
N P P = R D I 2 · R · ( 1 + R D I + R D I 2 ) ( 1 + R D I ) · ( 1 + R D I 2 ) · E x p ( 9.87 + 6.25 R D I )
It is not suitable for predicting the net primary productivity of a terrestrial ecosystem under the condition of global change due to the fact that the calculation of annual radiation obtained from the land surface requires climate variables, such as solar radiation at the top of the atmosphere, possible sunshine hours, actual sunshine hours, reflectivity, air temperature, air humidity, altitude, and dimension. It is found that there is a highly significant correlation between possible evapotranspiration rate (PER) and annual radiation dryness (RDI) through analysis, i.e.,:
R D I = ( 0.629 + 0.237 P E R 0.00313 P E R 2 ) 2
The correlation coefficient is 0.90. Among them, P E R is obtained by using the relationship between Holdridge’s possible evapotranspiration rate and biological temperature and precipitation:
P E R = P E T R = B T · 58.93 R
where PET is the possible evapotranspiration (mm), BT is the annual average biological temperature (°C).
B T = t 365 or = T 12
where t is the daily average temperature of <30 °C and >0 °C, and T is the monthly average temperature of <30 °C and >0 °C.
The NPP value of the observation station can be obtained from Formulas (4)–(7), and the NEP value can be converted by combining the RH value of the observation station.

2.3.3. Analysis of NEP Change Trend

In order to quantitatively describe the change law of NEP in the Yangtze River Delta region in the past 20 years, unitary linear regression analysis method was used to analyze the change trend of the NEP of each pixel in this region from 2000 to 2019. The trend line of a single pixel is simulated by unitary linear regression from the pixel values of that pixel within 20 years [29]. The calculation formula for the slope of the trend line is:
θ s l o p e = n × i = 1 n i × N E P i i = 1 n i i = 1 n N E P i n × i = 1 n i 2 ( i = 1 n i ) 2
In Formula (8), θ s l o p e is the slope of the trend line; i is the serial number of the year 1–20; N E P i represents the NEP value of the i year. It reflects the overall change trend of the NEP of each pixel during these 20 years. If θ s l o p e > 0, it means that the change trend of NEP is increasing, otherwise it is decreasing.

2.4. Sequence Mutation Point Recognition Method

The Mann–Kendall test [36] is a nonparametric test method widely used in hydrology, meteorology, and other fields. Its advantage is that it does not need samples to follow a certain amount of distribution and is not disturbed by abnormal values. It is suitable for type variables and sequential variables. It has simple calculation, can clarify the start time of mutation, and point out the region of mutation. It is a common mutation detection method. The sample size is n’s original time series y, r i represents the ith sample y i > y j (1 ≤ ji) cumulative number, whose statistics are:
S k = i = 1 k r i ,   ( k = 1 , 2 , , n )
S k average value E ( S k ) and variance V a r ( S k ) are, respectively:
E ( S k ) = k ( k 1 ) / 4 · V a r ( S k ) = k ( k 1 ) ( 2 k + 5 ) / 72
Standardize S k as:
U F k =   S k E ( S k ) V a r ( S k ) ,   ( k = 1 , 2 , , n )
U F k forms a U F curve, and whether there is a significant change trend can be obtained through the reliability test. This method is applied to the inverse sequence to calculate another curve U B , and the intersection of the two curves within the confidence interval is determined as the mutation point. If U F > 0, the sequence shows an upward trend; otherwise, it shows a downward trend. When U F or U B exceeds the critical value (±1.96), it indicates a significant upward or downward trend. If it has an intersection between the two curves of U F and U B , and the intersection is between the critical values, the time corresponding to the intersection is the start time of mutation.

3. Results

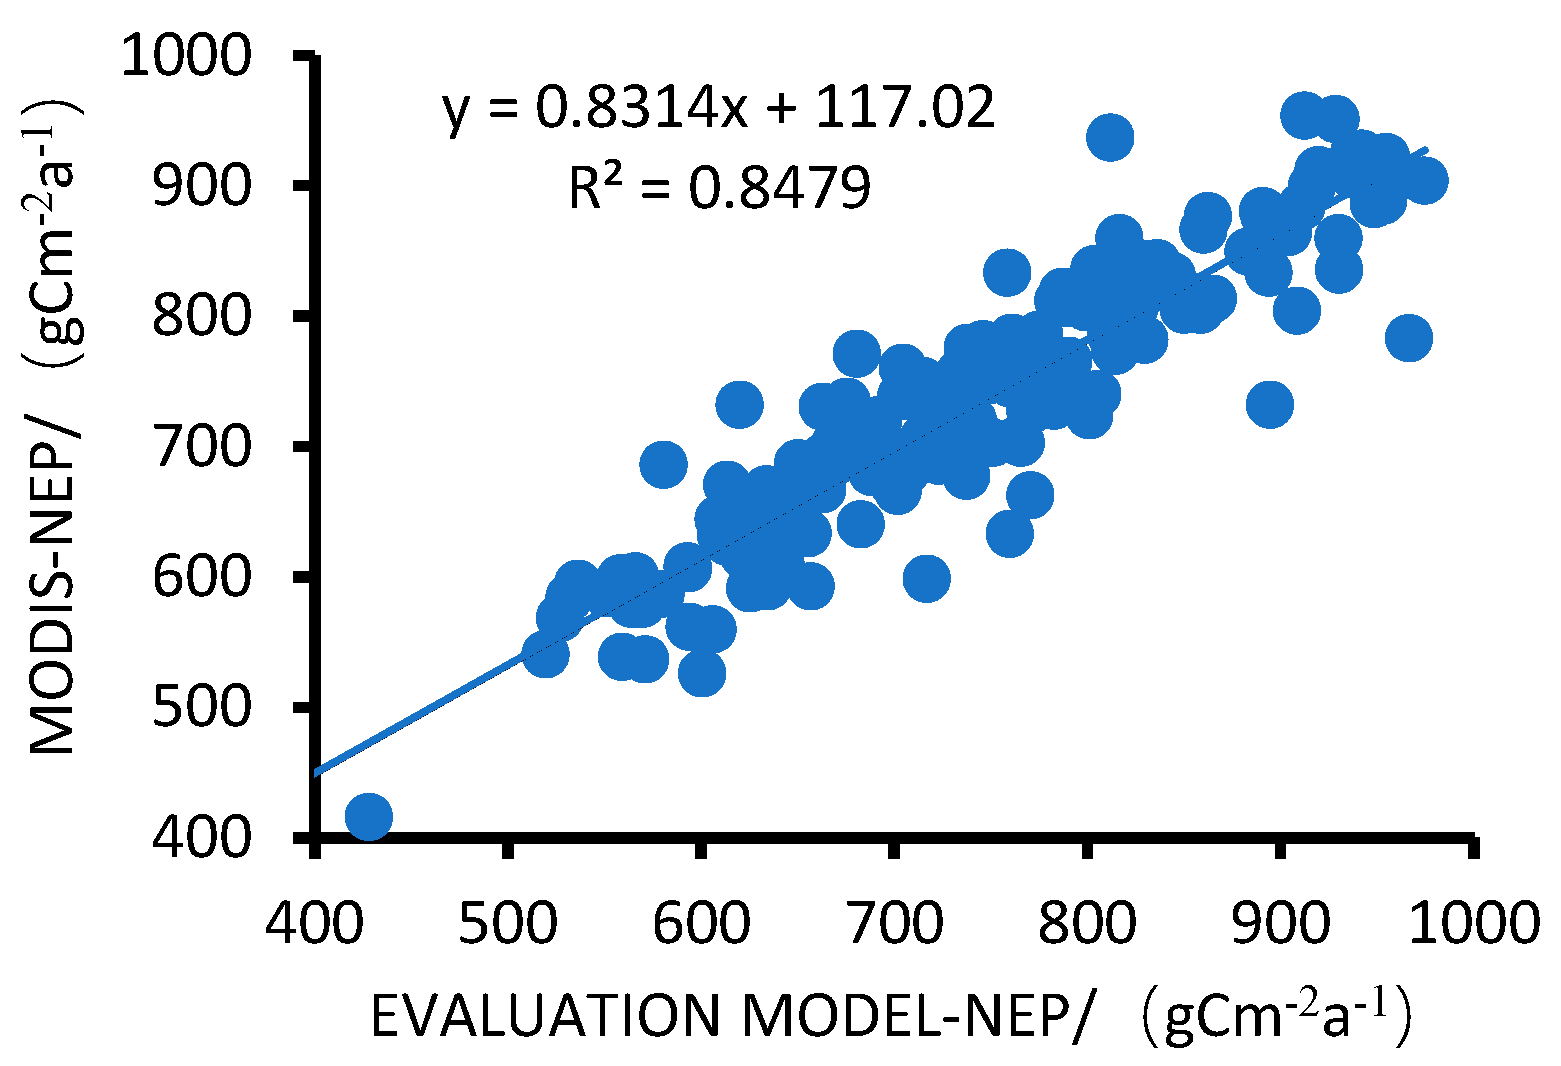
3.1. Evaluation of Estimation Precision

At present, there are two kinds of accuracy evaluation methods: one is based on field observation data; the other is comparative analysis and evaluation based on the research results recognized by peer experts. It is difficult to verify the field observation data of NPP or NEP with a large range and multiple vegetation types due to the large scope of the study area. The acquisition cycle of field observation data is long, and the acquisition time is difficult to match the model simulation time. The two are not comparable to a certain extent due to the influence of climate change and other factors. Based on the above considerations and the analysis of relevant literature within the research area, the ZGS model with a partially overlapping research area and verified accuracy was selected. Comparing the NEP value converted by the MOD17A3 product and ZGS model, it is found that the NEP value converted by the MOD17A3 product is smaller than that produced by the ZGS model. The fitting results are shown in Figure 2. There is a good correlation between the product data value and the model data value, with the determination coefficient R2 = 0.8479, and the fitting curve is significantly correlated (p < 0.01), indicating that the NEP data converted by MOD17A3 product is reliable.

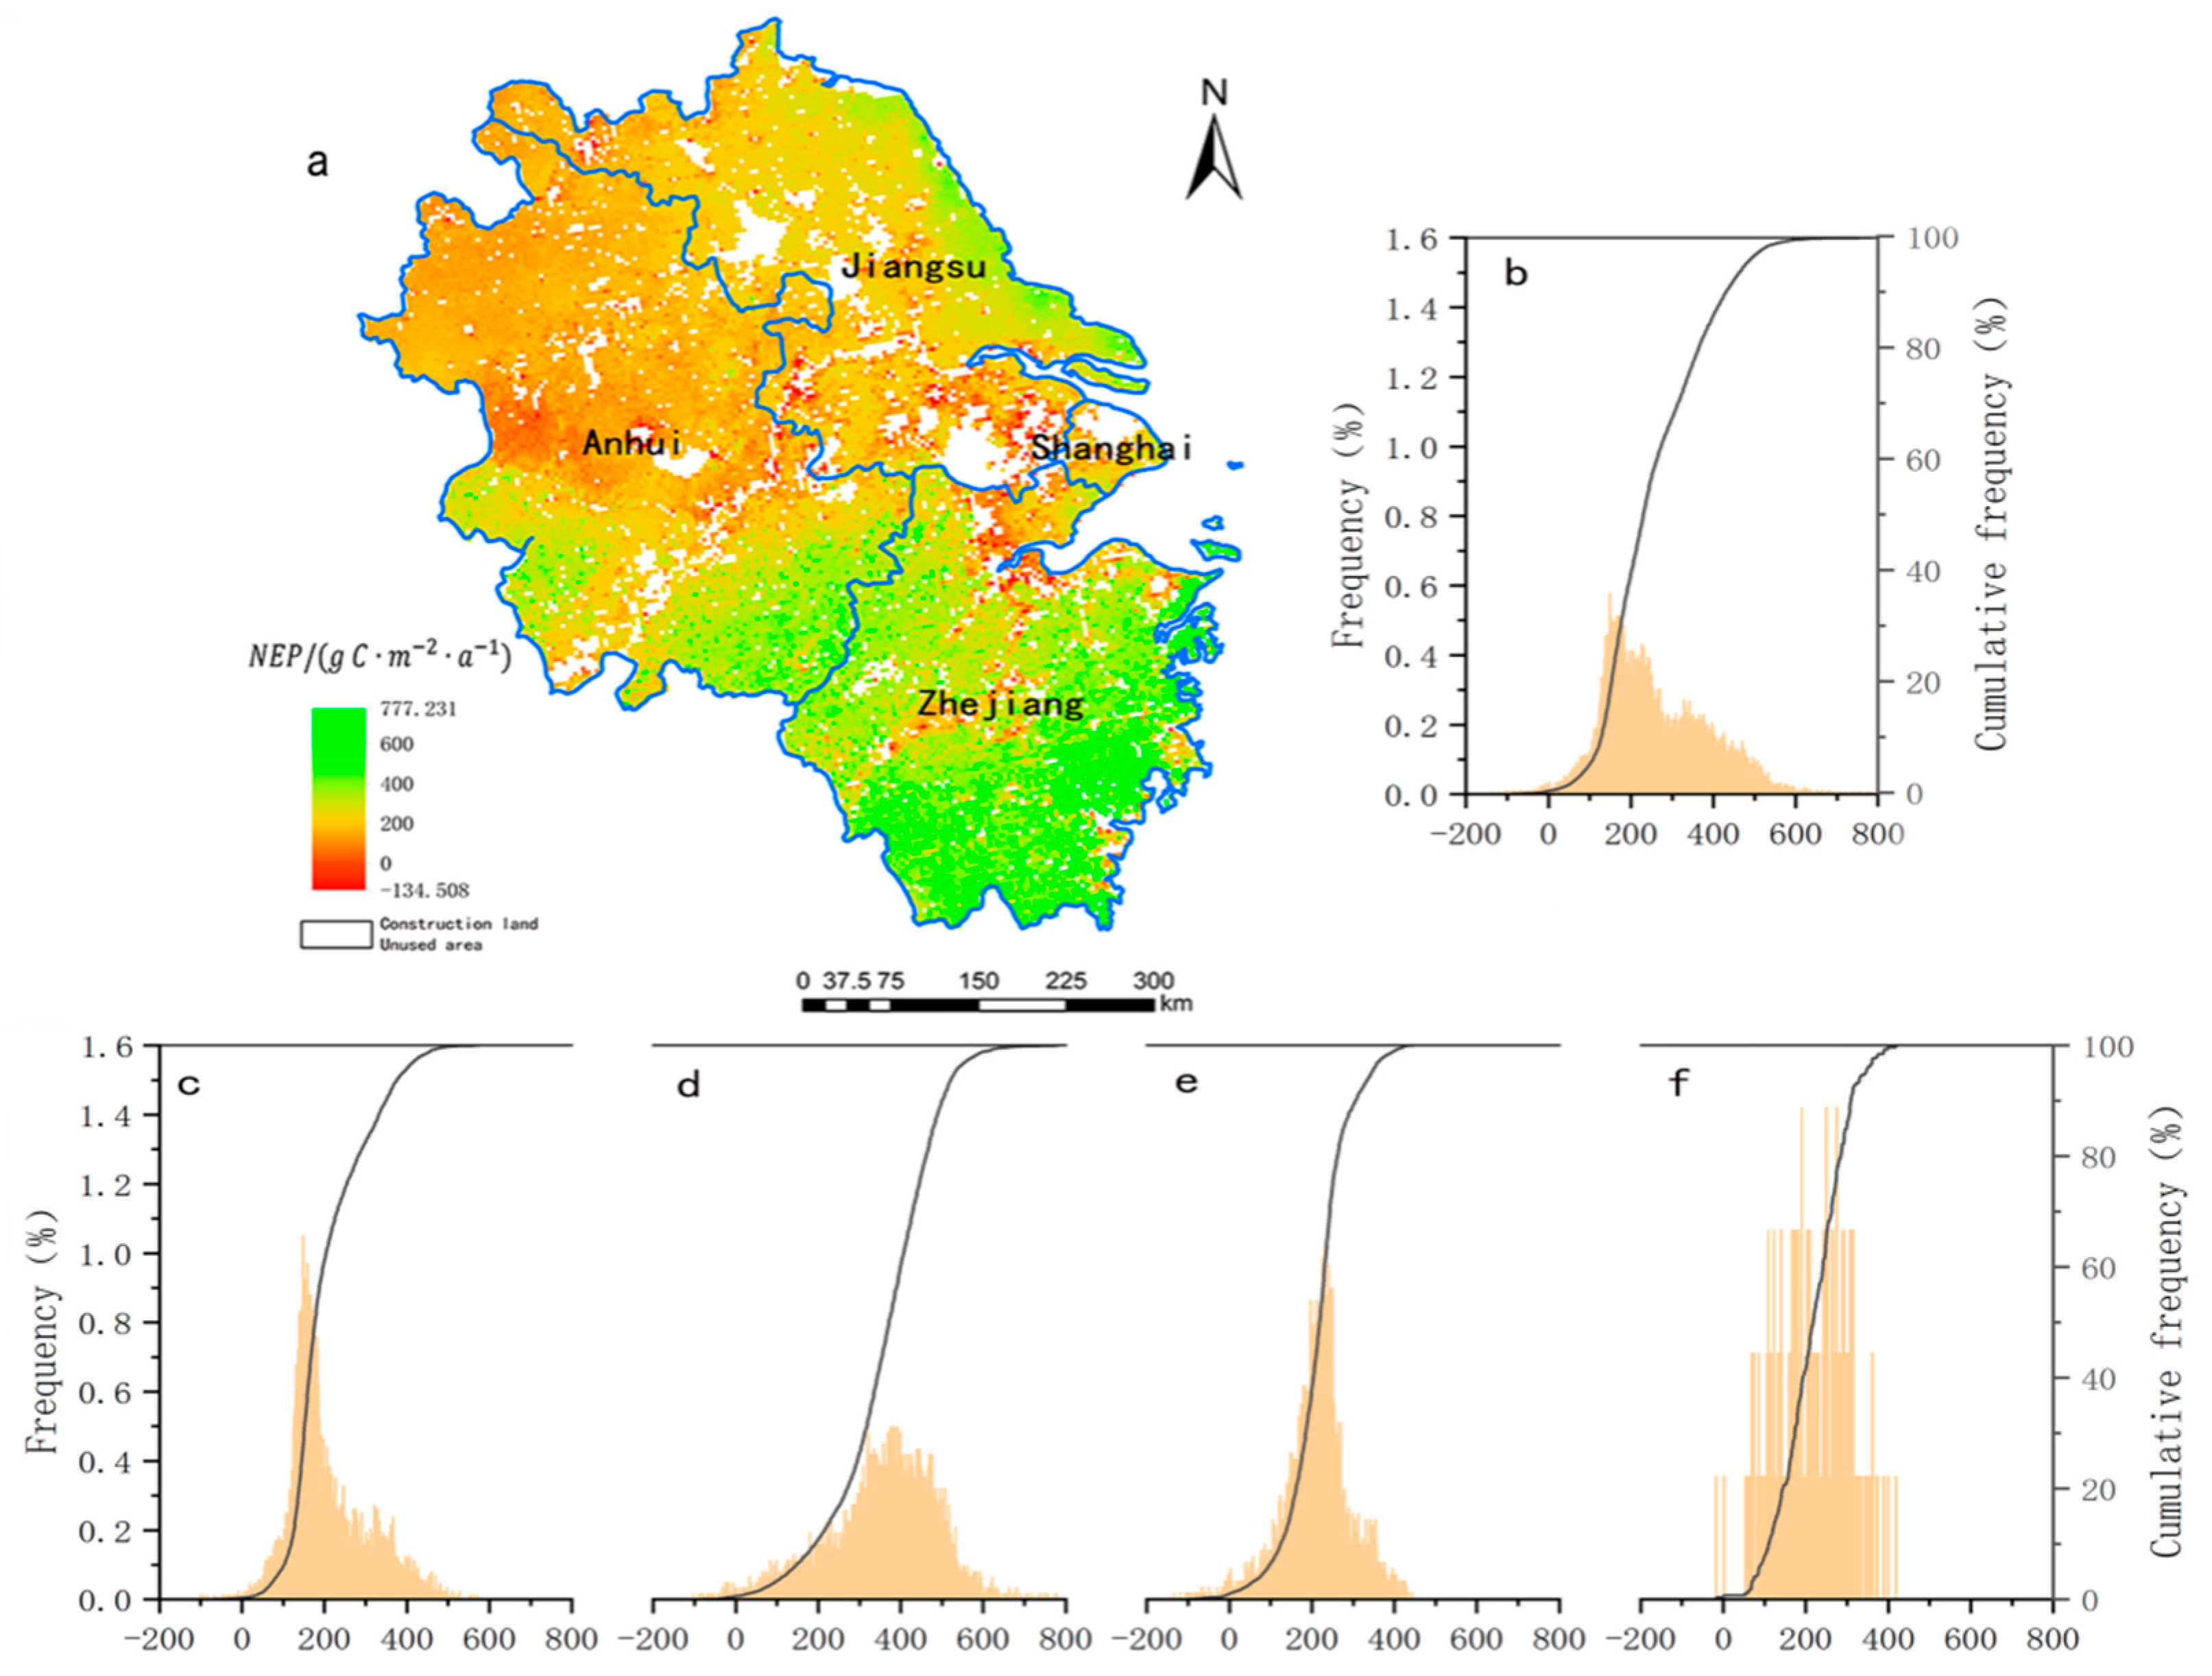
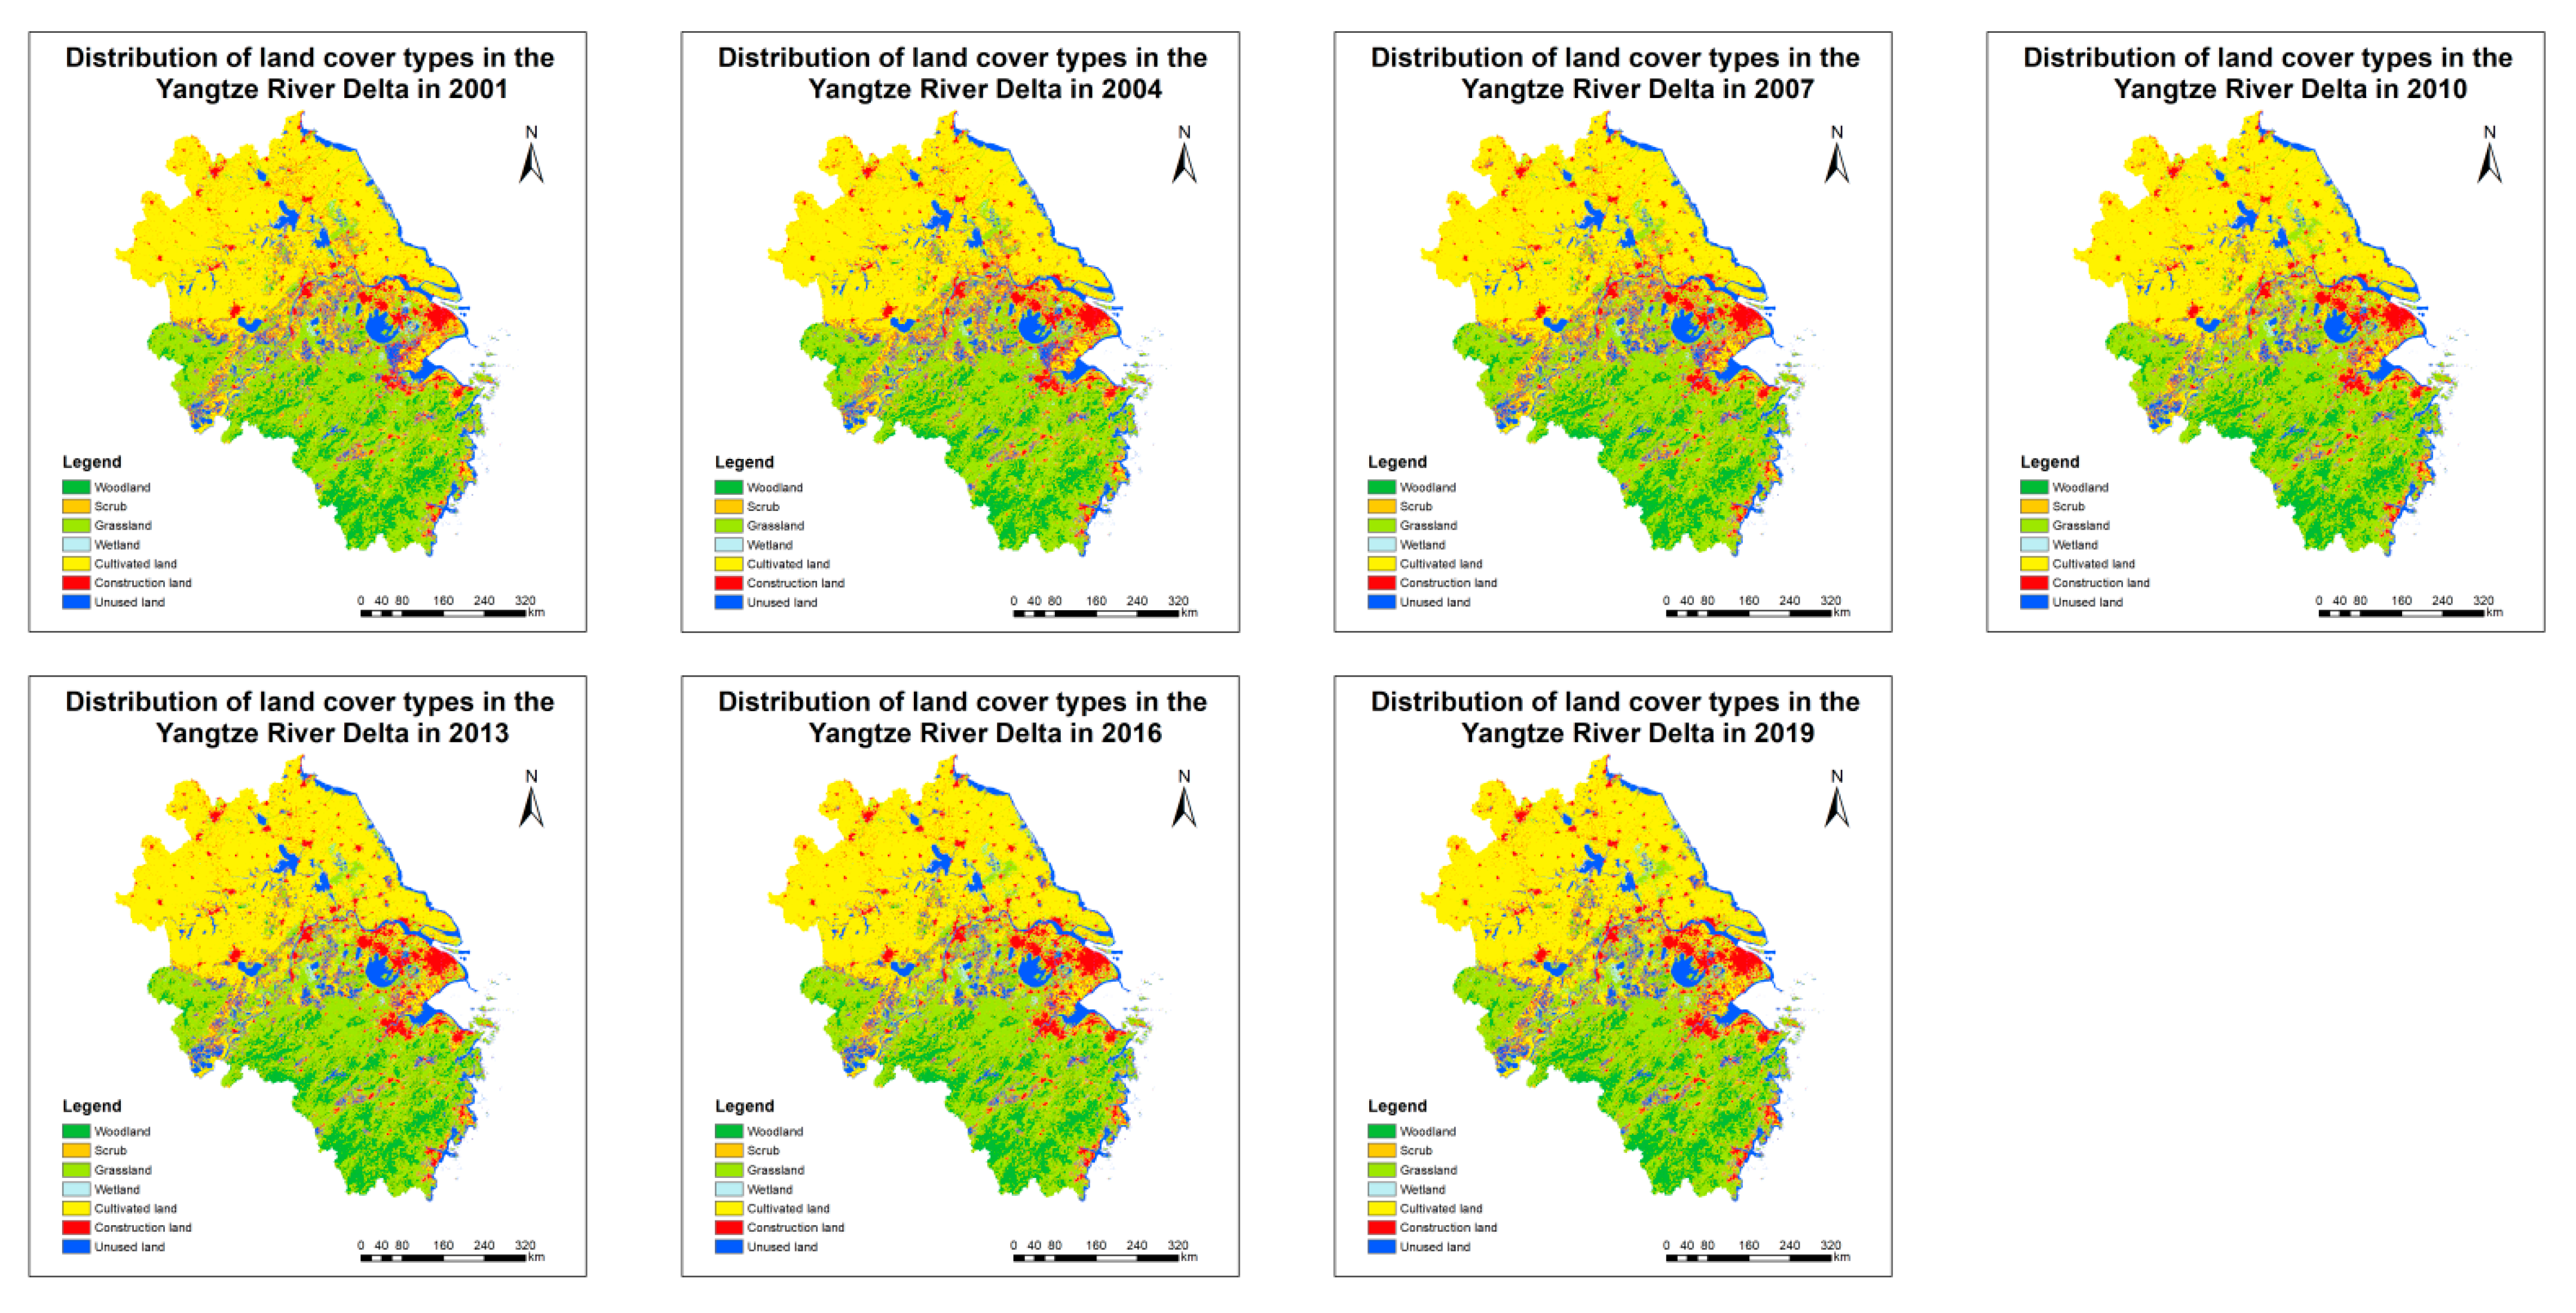
3.2. Spatial Distribution Characteristics of NEP

The NEP represents the net absorption or net storage of carbon in the vegetation ecosystem, which can quantitatively describe the carbon source/sink capacity of the vegetation ecosystem. When NEP > 0, it means that the ecosystem plays the role of a carbon sink; otherwise, it plays the role of a carbon source [17]. Therefore, as a key parameter to characterize vegetation activities, the accurate estimation of NEP can not only measure the health of vegetation ecosystem, but also can quantitatively analyze the carbon sequestration status and potential of a regional vegetation ecosystem.
After removing the two land cover types of construction land and unused land in the Yangtze River Delta year by year, the annual mean NEP of each pixel in the remote sensing image of the Yangtze River Delta region from 2000 to 2019 was calculated. The spatial distribution map of the 20-year NEP mean value in the region was obtained (Figure 3), which showed that, from 2000 to 2019, the overall spatial distribution pattern of the mean vegetation NEP in the Yangtze River Delta region presented the trends that were higher in the south and lower in the north, higher in the east and lower in the west, and increasing from the northwest to the southeast. In addition, it can be found that there is a clear boundary in Anhui Province, and the NEP for the southern district of the Yangtze River is generally higher than that in the north. Although RH for the southern district is higher than that in the north because of the higher temperature and precipitation in the south, it cannot change that the NEP in the south is higher than that in the north in the Yangtze River Delta. Combined with the land cover data, it was found that there was more cultivated land in the north of the Yangtze River and more forest and grassland in the south of the Yangtze River. The mean NEP of each pixel in the terrestrial ecosystem in this region is mostly higher than 0 in the past 20 years, therefore the carbon sink is dominant, and the proportion of pixels with NEP > 0 is much larger than that of carbon sources (including construction land and unused land), accounting for more than 85% of the total area of the Yangtze River Delta region; however, the areas with a very high NEP value (NEP > 600 g C·m−2·a−1) accounts for less than 1.3%, and the high-value areas are mainly distributed in Wenzhou, Taizhou, Lishui, and Zhoushan (south of Zhejiang Province). These areas have high terrain, lush vegetation, and a forest coverage as high as more than 70% [37], and the carbon sequestration amount of vegetation is much higher than the carbon emissions from soil microbial respiration. In addition, the proportion of pixels with a mean NEP < 0 is relatively small, and these pixels are mainly distributed in Shanghai, Suzhou, Hangzhou, and Nanjing of China, etc. These areas have a relatively low forest coverage rate, their industrial structures mainly include the industries with high energy consumption and high carbon emissions, such as heavy industry and manufacturing industry, and the construction land expands rapidly [5], therefore the carbon sink capacity is weak, and the carbon source is dominant. After the statistics of the average annual NEP of the Yangtze River Delta region in the last 20 years, the results show that the average annual NEP of the Yangtze River Delta region is 253.2 g C·m−2·a−1, of which the highest is 355.9 g C·m−2·a−1 in Zhejiang Province of China, then 212.4 g C·m−2·a−1 in Jiangsu Province, 208.0 g C·m−2·a−1 in Anhui Province of China, and the lowest is 188.5 g C·m−2·a−1 in Shanghai of China. The first Zhejiang Province of China is much higher than the last three.

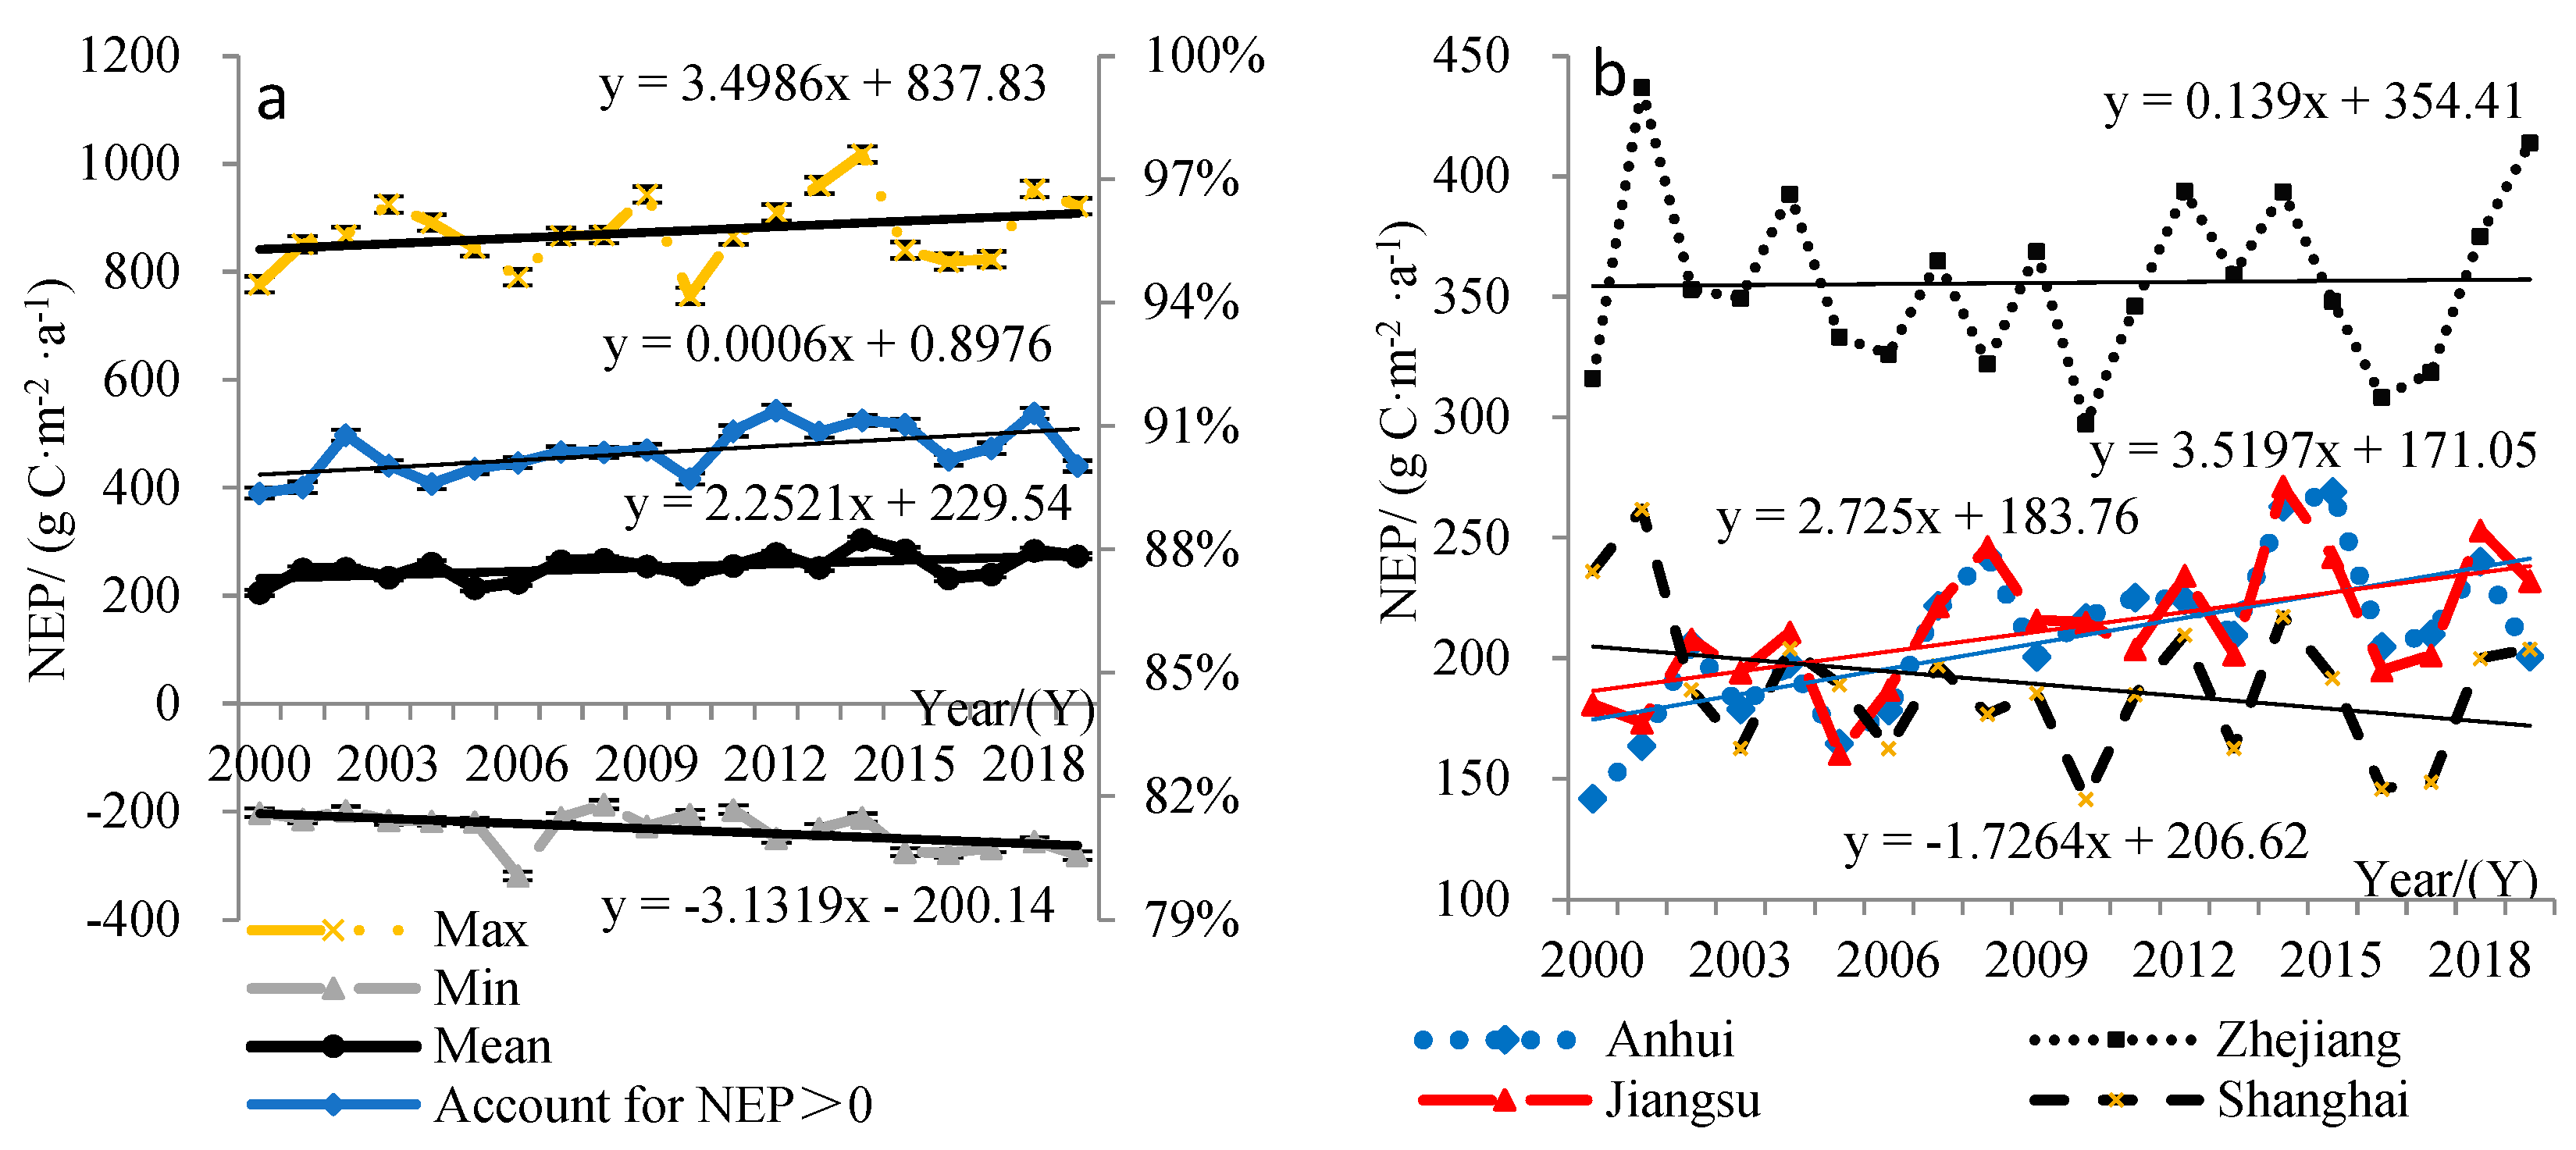
3.3. Interannual Variation Characteristics of NEP

The total NEP value per unit area of the terrestrial vegetation ecosystem in the Yangtze River Delta region, in each year, from 2000 to 2019, was calculated, and the mean NEP value of the Yangtze River Delta region in each year over the last 20 years, as well as the maximum and minimum NEP values in the research area and the interannual variations of the proportion of pixels with NEP > 0, were obtained (Figure 4a). It can be found that, from 2000 to 2019, the annual mean NEP of vegetation in the Yangtze River Delta region fluctuated slightly around 253 g C·m−2·a−1, the interannual variations were not large and presented a slightly increasing trend, and the slope of the trend line (k) was 2.25, indicating that the health of the vegetation ecosystem in this region was at a high level over the past 20 years; after eliminating the carbon consumption of soil respiration in the system, the vegetation in the entire Yangtze River Delta region played the role of a carbon sink, and the carbon sequestration capacity increased to some extent. The maximum values of NEP under vegetation coverage in this region in these years appeared in southern Zhejiang, and all such NEP values exceeded 750 g C·m−2·a−1; however, the interannual fluctuations were large, and the values generally presented a relatively significant upward trend, the slope of the trend line (k) was 3.50, indicating that the maximum carbon sequestration capacity of the vegetation ecosystem in southern Zhejiang increased significantly and was greatly affected by the external environment. During the same period, the location where the minimum NEP occurred in this region was not fixed, and there was no law. The minimum value fluctuated around −233 g C·m−2·a−1; moreover, although the interannual variation was small, the values generally presented a downward trend, and the slope of the trend line (k) was −3.13, indicating that the carbon emissions from soil microbial respiration in the vegetation ecosystem in this region increased significantly, and the vegetations in these locations were weakened. Comparing these three NEP values, it can be found that the change and increase in the mean value of NEP in this region were mainly realized by the change of the maximum value of NEP in this region. In addition, it can be found that the proportion of pixels with NEP > 0 fluctuated around 90%, and the interannual change was relatively stable, and that the proportion increased slightly irrespective of the value, with the trend line slope being close to zero.
Compared with the interannual variation of the average NEP of three provinces and one city (Figure 4b), it can be found that the carbon sequestration capacity of Zhejiang Province of China is much higher than that of the other three places. Although there are large fluctuations in each year, there is no significant change trend, and the overall development is relatively stable. The average NEP of Jiangsu Province of China is slightly higher than that of Anhui Province of China; however, the increasing trend of Anhui Province of China is higher than that of Jiangsu Province of China. The average value of NEP in Shanghai of China is the smallest and is decreasing year by year.
Through the identification of time series mutation points for the average NEP of each year in the Yangtze River Delta from 2000 to 2019 (as shown in Figure 5), it is found that the UF curve in the Yangtze River Delta has multiple intersections with the critical value after 2011. Therefore, NEP has an upward trend before 2013; however, the trend is not significant. NEP has increased significantly from 2013 to 2016, and the upward trend slows down after 2016. UF and UB curves have two intersections in 2004 and 2006. It can be considered that 2006 is the mutation point, and NEP begins to rise. The UF and UB curves of Anhui Province of China have an intersection between the critical values in 2005 and exceeded the critical value after 2008. Therefore, the NEP of Anhui Province increased significantly after 2008 and mutated in 2005. There was an intersection point between UF and UB curves in Jiangsu Province of China in 2006. NEP fluctuated and changed before 2006, and there were several turning points; however, it was not significant. NEP increased after 2006 and exceeded the critical value after 2013–2016. Therefore, NEP mutated and tended to rise in 2006. Shanghai UF and UB curves have an intersection between the critical values in 2001 and are within the critical value; therefore, their NEP began to decline after 2001; however, the trend is not significant. The UF and UB curves of Zhejiang Province of China are basically within the critical value of significance level a = 0.05. UF and UB have several intersections and fluctuate in the years with intersections; however, the change in trend is not significant and there is no mutation.
After identifying the time series mutation points of the proportion of NEP > 0 in each year of the Yangtze River Delta from 2000 to 2019 (as shown in Figure 6), it was found that the UF and UB curves of NEP > 0 in the Yangtze River Delta have an intersection between the critical value in 2005 and exceeded the critical value after 2009. Therefore, the proportion of NEP > 0 in the Yangtze River Delta increased significantly after 2009 and mutated in 2005. Combined with Figure 5, it can be found that the increase of the NEP value in the triangle area is mainly caused by an increase in the area of the terrestrial ecosystem where the underlying surface plays the role of a carbon source. Comparing the respective situations of three provinces and one city in the Yangtze River Delta region, it is found that there is only one intersection point between the critical values of UF and UB curves. Shanghai of China appeared the earliest, and the mutation point appeared in 2001. After 2005, the proportion of NEP > 0 began to decrease significantly; Jiangsu and Zhejiang of China took the second place. The mutation point appeared in 2004; however, the proportion of NEP > 0 in Jiangsu began to decrease significantly after 2004, while Zhejiang of China showed a significant decrease from 2007 to 2011 and after 2014; within the critical range of the UF curve in Anhui, the proportion of NEP > 0 had increased, but it was not significant.

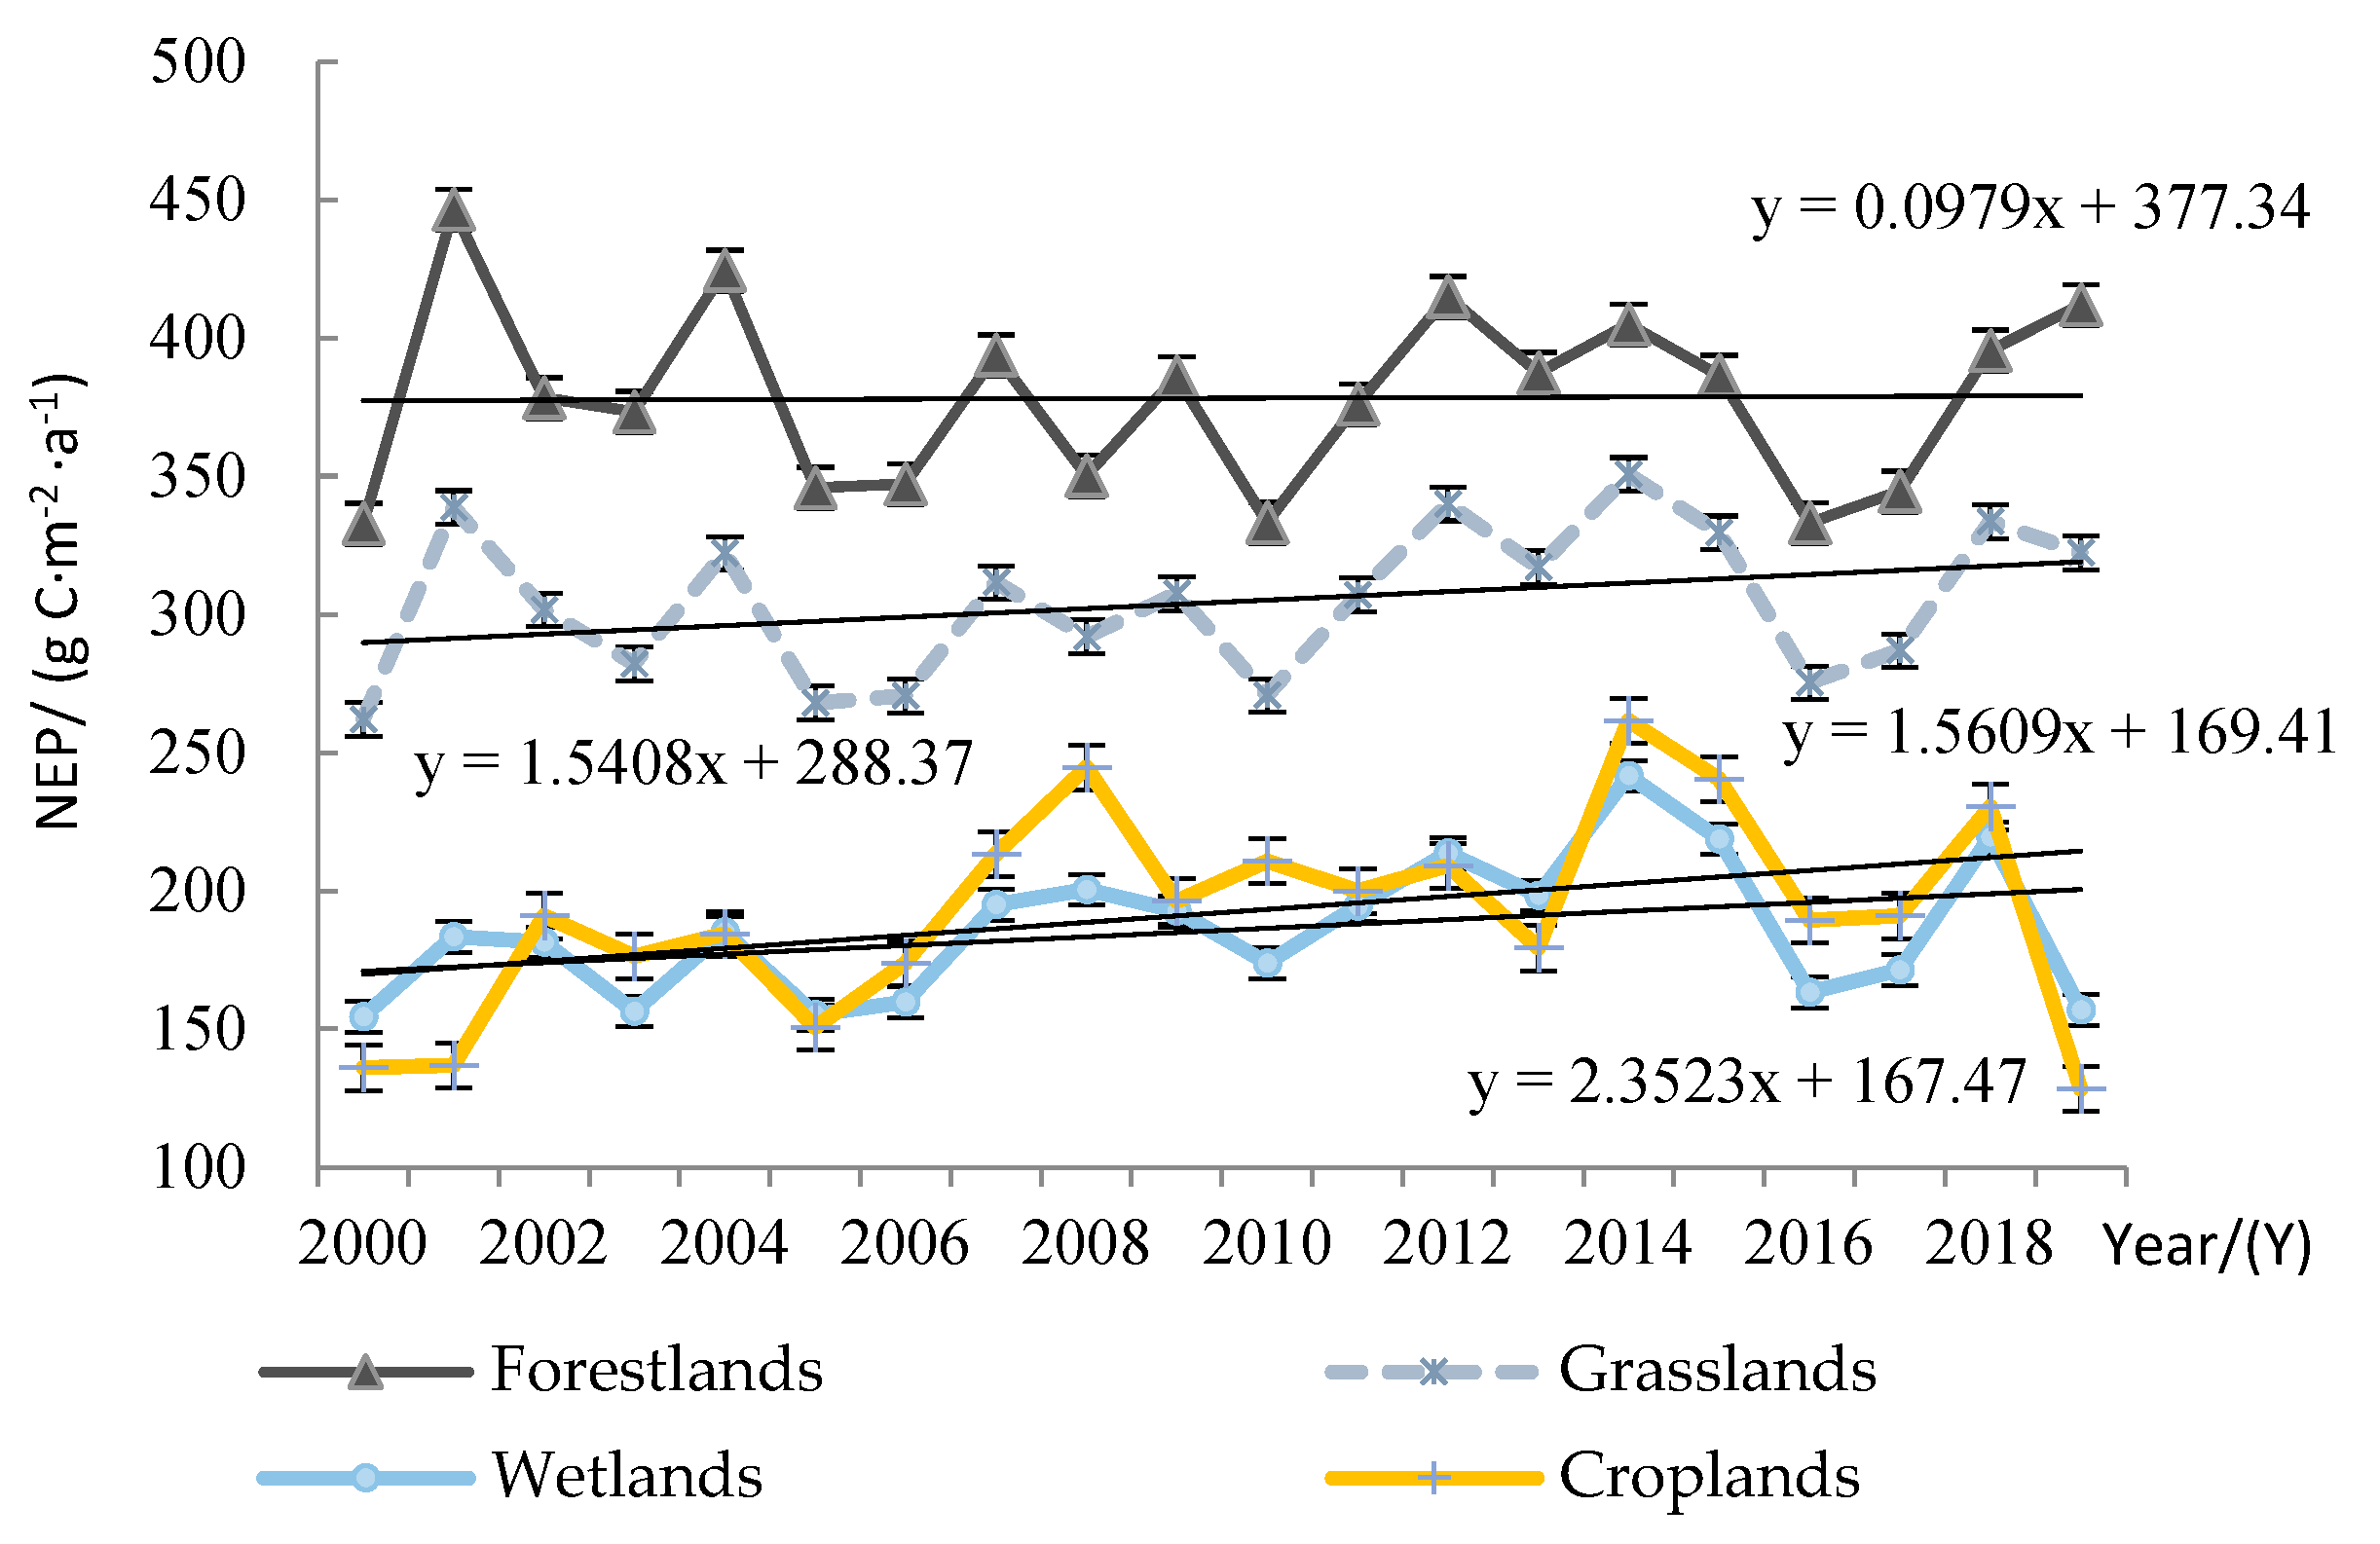
3.4. NEP Characteristics of Different Vegetation Cover Types

In order to research the distribution of the carbon source/sink capacity of terrestrial vegetation ecosystems under different vegetation cover types, the data merger results of land cover types were used, as shown in Figure 7. Comparing the land cover type diagram and the NEP distribution diagram, it can be found that there is significant consistency between the two diagrams. The areas of cropland and wetland have a good correspondence with the areas of weak carbon sink capacity, and the areas of forestland and grassland have a good correspondence with the areas of strong carbon sink capacity.
In addition, in order to research the changes in the carbon sink capacity of different vegetation cover types and the differences in the carbon sink capacity of different land cover types over the past 20 years, the annual changes in NEP (Figure 8) and the mean values of NEP (Table 1) under different vegetation cover types (including grasslands, croplands, forestlands, and wetlands) in the Yangtze River Delta region were recorded for these 20 years, respectively. It can be seen from Table 1 that the carbon sink capacities of terrestrial vegetation ecosystems under different land cover types were different. Among them, woodland had the highest NEP and the best carbon sink capacity, the mean NEP over the 20 years was 378.37 g C·m−2·a−1, followed by the grassland, at 304.55 g C·m−2·a−1; the land cover types with lower carbon sequestration capacity were cultivated land and wetland, with NEP values of 192.17 g C·m−2·a−1 and 185.80 g C·m−2·a−1, respectively, and the construction land and the unused land were carbon sources.
Vegetation Cover TypeMean NEP (g C·m−2·a−1)Carbon Source/SinkStandard Deviation
Forestlands378.37Carbon Sink31.51
Grasslands304.55Carbon Sink25.96
Wetlands185.80Carbon Sink23.79
Croplands192.17Carbon Sink34.77
Built-up Lands\Carbon Source\
Unused lands\Carbon Source\
It can be seen from Figure 8 that the annual mean NEP values under different vegetation coverage types fluctuated to varying degrees from 2000 to 2019; however, the interannual fluctuations of woodland, grassland, and wetland had a good consistency, while cultivated land was less consistent with the interannual variation fluctuations of the above three types of vegetations. This may be due to the fact that woodland, grassland, and wetland are less affected by human activities and are mainly affected by external natural environmental factors; however, cultivated land is affected by the external natural environment and human activities, which cause slight differences. Through linear trend analysis, under the four vegetation cover types, the NEP values all presented an upward trend; however, the annual mean NEP value of woodland had a small increase trend over the years, and the slope was only 0.1, while the slope of grassland and wetland was 1.5, and the slope of cultivated land reached up to 2.35. This may be due to climate warming, and the doubling of CO2 concentration has been known to produce better growth promotion and yield increase effects on rice, wheat, corn, and other C3 crops [38], resulting in a larger upward trend in the NEP of the cultivated lands in the Anhui and Jiangsu provinces, where rice and wheat are the main crops and the proportion of cultivated land is very large. In addition, it can also be seen that the carbon sequestration capacity of different land cover types in this region can be divided into three levels: woodland has better carbon sequestration capacity in each year, followed by grassland, wetland, and cultivated land, which have a relatively lower capacity.

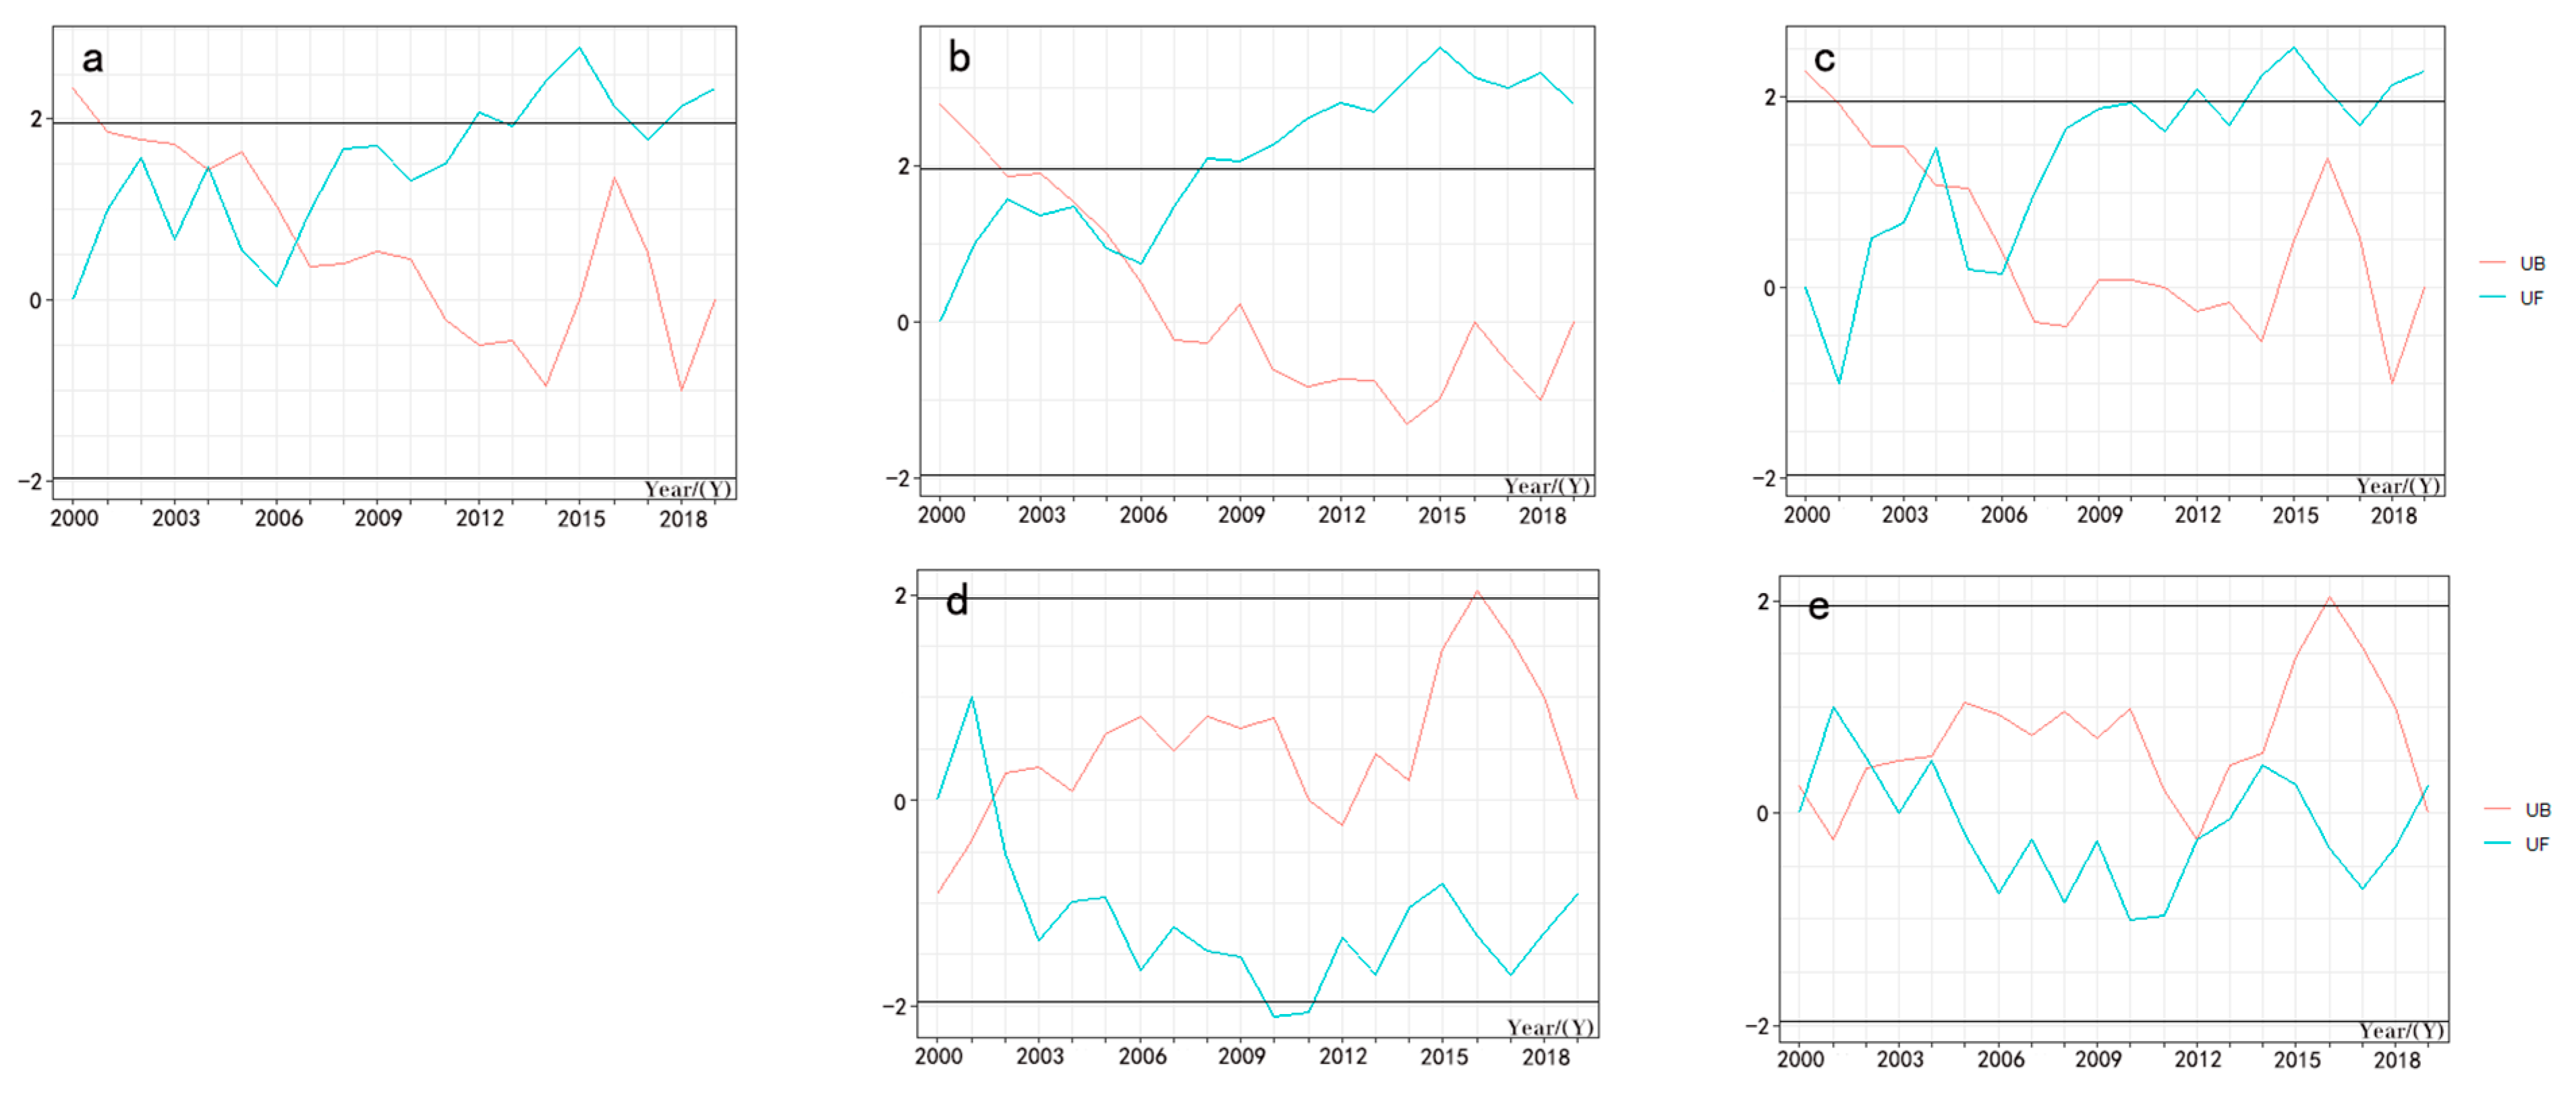
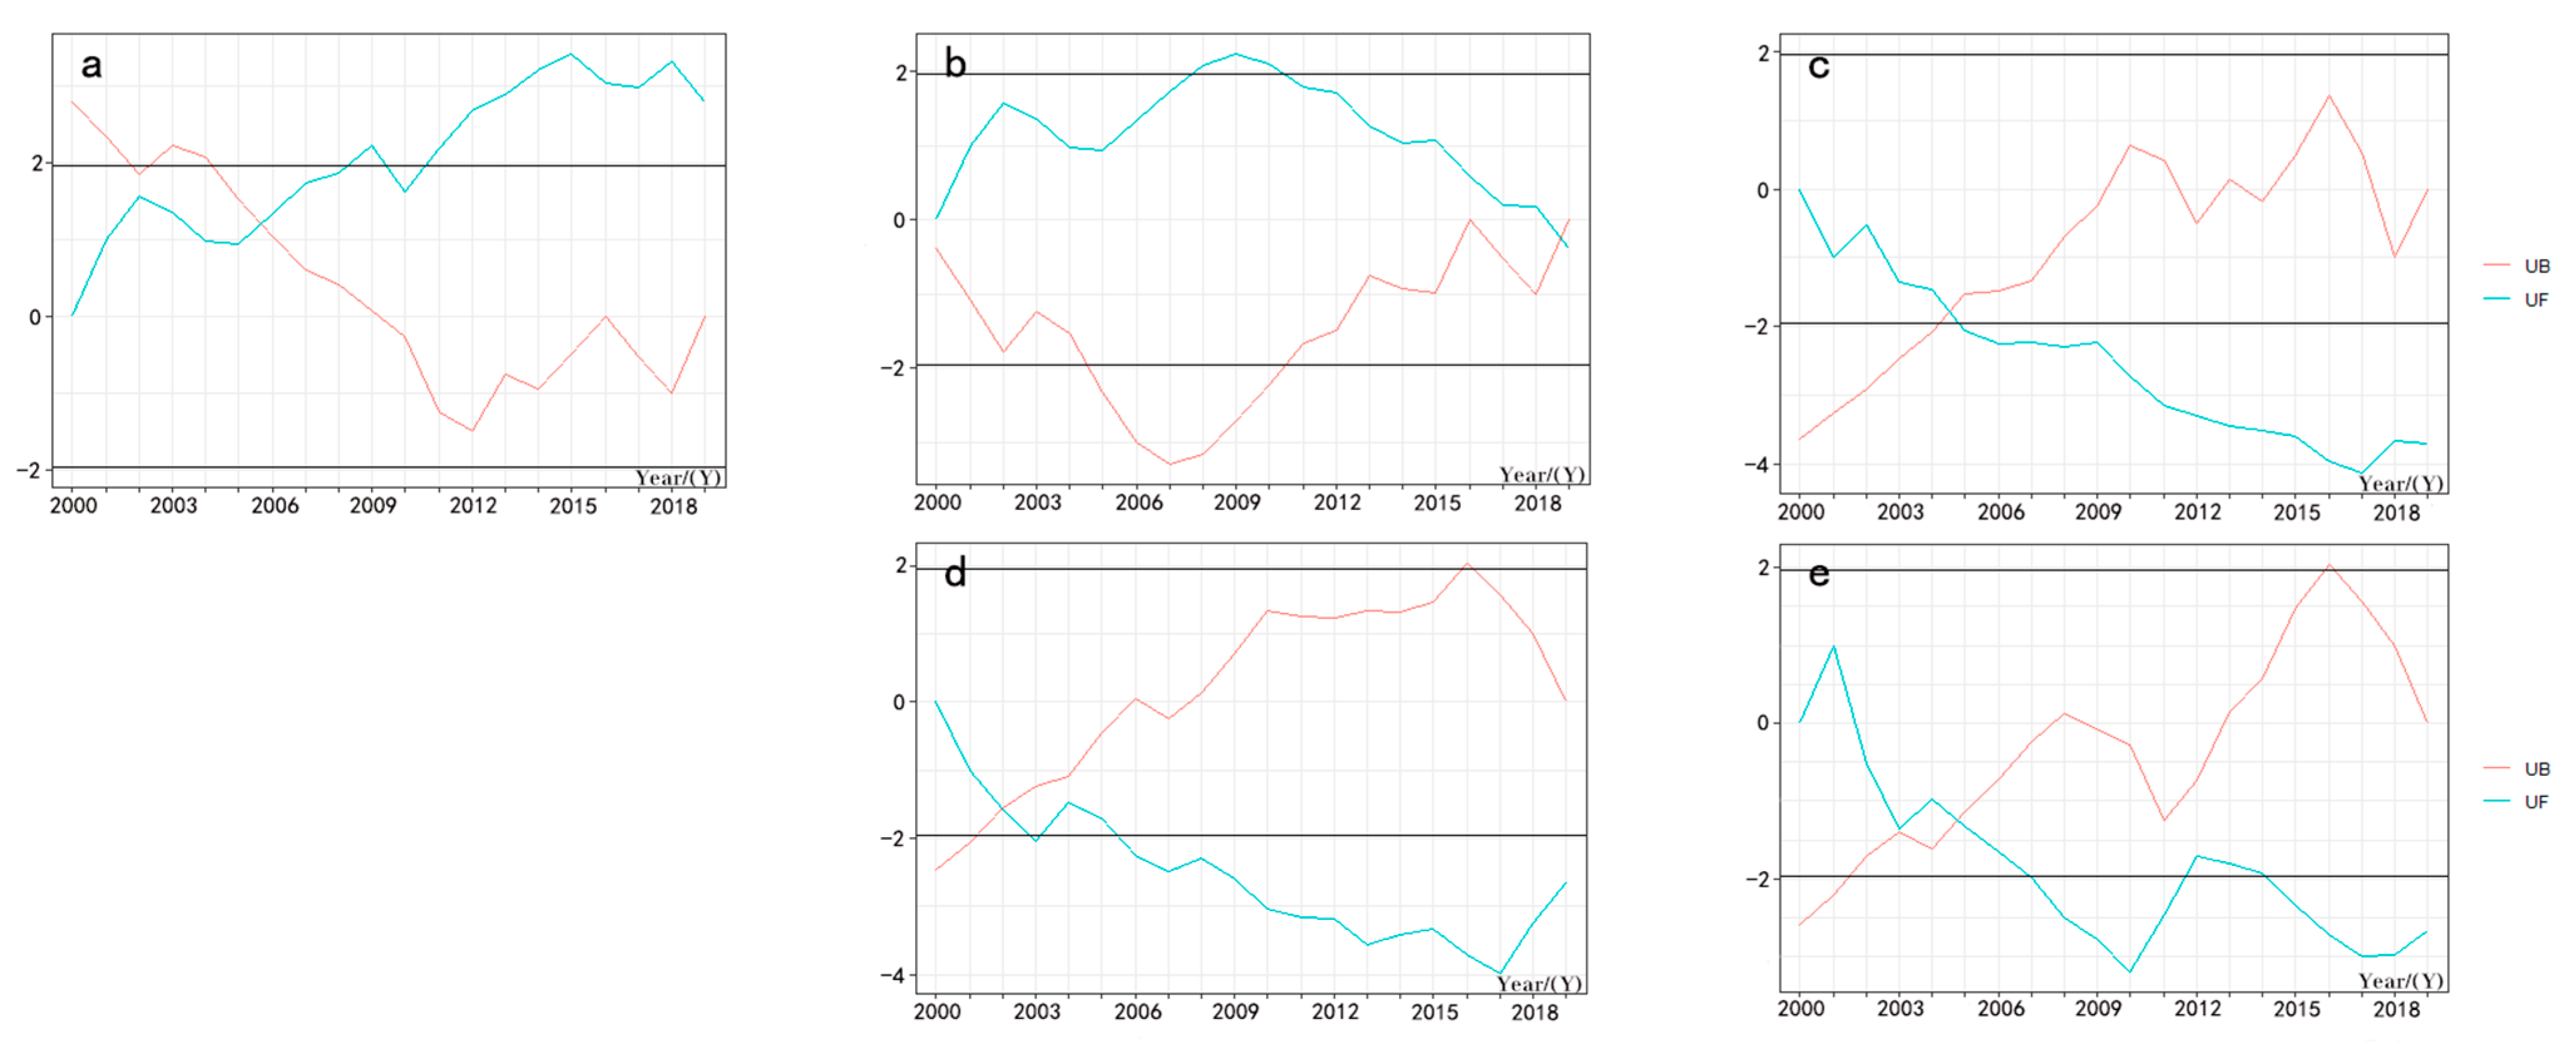
3.5. Analysis of NEP Change Trend

In order to describe the spatial distribution characteristics of the NEP change trend in the Yangtze River Delta region over the past 20 years, the unitary linear regression analysis method was used to analyze the NEP change trend of each pixel from 2000 to 2019, and the annual mean NEP variation slope was calculated pixel by pixel (Figure 9).
It can be seen from Figure 9 that the change rate of the NEP value in the Yangtze River Delta region from 2000 to 2019 was not consistent (with increase and decrease); however, increase was the dominant trend of the entire region, and the proportion of pixels with θ s l o p e > 0 reached 69.0 %, that is, the carbon sink capacity increased and the carbon source capacity decreased. However, there were certain spatial differences in the entire region. The proportions of pixels in provinces and municipalities with θ s l o p e < 0 in this region were 14.50% (Zhejiang Province), 9.10% (Anhui Province), 6.65% (Jiangsu Province), and 0.79% (Shanghai). In terms of the changes of pixels with θ s l o p e < 0 in each province and municipality, the pixels with θ s l o p e < 0 in Shanghai account for the largest proportion (62.7%), followed by Zhejiang Province (48.9%), Jiangsu Province (24.64%), and Anhui Province (21.59%). This data indirectly showed that the Yangtze River Delta region did not stop the ecological construction at the same time of stable urban development and expansion in the past 20 years.

3.6. Analysis of NEP and Temperature and Precipitation

The carbon sink capacity of natural terrestrial vegetation ecosystems in this region is not only related to the autotrophic respiration and heterotrophic respiration of terrestrial plants, but it also affected by the external environments, such as climate, soil, seaside, and other conditions [39]. In addition, it is also affected by human activities. The overall annual mean NEP in the Yangtze River Delta region from 2000 to 2019 was recorded, and the interannual variation curves between NEP and the annual mean temperature and annual precipitation were drawn (Figure 10) to analyze the relations between the NEP and the annual mean temperature and annual precipitation. It is found that there is no significant correlation between the NEP and the annual mean temperature and annual precipitation factors in this region. This is due to the fact that the terrestrial vegetation ecosystem in the Yangtze River Delta region is seriously affected by the external environment and human activities. In addition, the region has a wide range, large area, complex and diverse underlying surface, and the meteorological stations are relatively sparse. The meteorological data of all stations are simple and average throughout the year, which cannot represent the actual situation. Therefore, according to subregional statistics, it is found that the NEP values of Shanghai and Zhejiang have a negative correlation with the annual average temperature (r = −0.43), and Anhui has a positive correlation with the annual rainfall (r = 0.36).
However, it can be seen from Figure 10 that the temperature increases in the Yangtze River Delta region from 2000 to 2019 were very small, with a slope of only 0.04; however, the precipitation increased significantly, with a slope of 11.0. The climate in the entire region is dominated by humidification. Through the identification of mutation points, it is further confirmed that there is no mutation point in the annual average temperature of the five regions, and the change trend is not obvious. Only the Yangtze River Delta and Shanghai have abrupt changes in annual precipitation; however, the increase is not significant.

4. Discussion

This paper estimates the spatial distribution characteristics of the NEP of a terrestrial vegetation ecosystem in urban agglomerations with the strongest comprehensive strength in developing countries over the past 20 years. To some extent, it reveals the temporal and spatial variation of a carbon source/sink of a vegetation ecosystem in an urban high-speed development area under the background of climate change. It is of great significance not only to measure the health degree of vegetation ecosystem, but also to rationally exploit and utilize natural resources and to take measures to protect the ecological environment. However, due to the complex ecological processes of the vegetation carbon cycle and soil respiration combined with the influence of human factors, there is some uncertainty in model estimation. In addition, the temporal and spatial variation of NEP under different vegetation coverage in the Yangtze River Delta was only considered, and the response of NEP to different meteorological factors was quantitatively analyzed. It is found that there is no obvious correlation between vegetation NEP and meteorological factors if the whole region is considered as a whole with only one value. Therefore, the analysis after the subdivision of the region shows that air temperature inhibited the increase in NEP in Shanghai and Zhejiang, and that precipitation had no significant effect on it. However, precipitation promoted an increase in NEP in Anhui, and air temperature had no significant effect on it. The results are consistent with the results of some other scholars [15,40,41], namely that the NEP of vegetation is negatively correlated with annual mean temperature in a small region, especially in a region with little human disturbance. This data indirectly indicates that the vegetation ecosystem in the Yangtze River Delta region was also developing healthily while the cities were developing rapidly in the past 20 years.

5. Conclusions

Based on the data of the MODIS net primary productivity product MOD17A3H and land cover product MCD12Q1, combined with monthly mean temperature and precipitation data, this paper calculated the NEP values in the Yangtze River Delta region from 2000 to 2019, obtained its spatial distribution information and change characteristics, and analyzed its correlation with the annual mean temperature and annual precipitation data of the Yangtze River Delta region. The main conclusions are as follows:
(1)
From 2000 to 2019, the carbon sink area in the Yangtze River Delta was much larger than the carbon source area, the mean NEP of the vegetation ecosystem in the past 20 years was 253.2 g C·m−2·a−1, and the spatial distribution presented a trend that was higher in the south and lower in the north, higher in the east and lower in the west, and gradually increasing from northwest to southeast, and showed that the NEP of mountain areas is generally higher than that of river courses and urban surroundings. From 2000 to 2019, the NEP value of the vegetation ecosystem in the Yangtze River Delta region had small interannual fluctuations; however, the changes in various years were not large and presented a slightly increasing trend, and the interannual variation of the NEP was significantly correlated with the maximum NEP in this region;
(2)
The carbon sink capacities of different vegetation cover types and terrestrial vegetation ecosystems were different. The carbon sink capacity can be divided into three levels: the carbon sink capacity of woodland is better than that of grassland, and the carbon sink capacity of grassland is better than that of wetland and cultivated land;
(3)
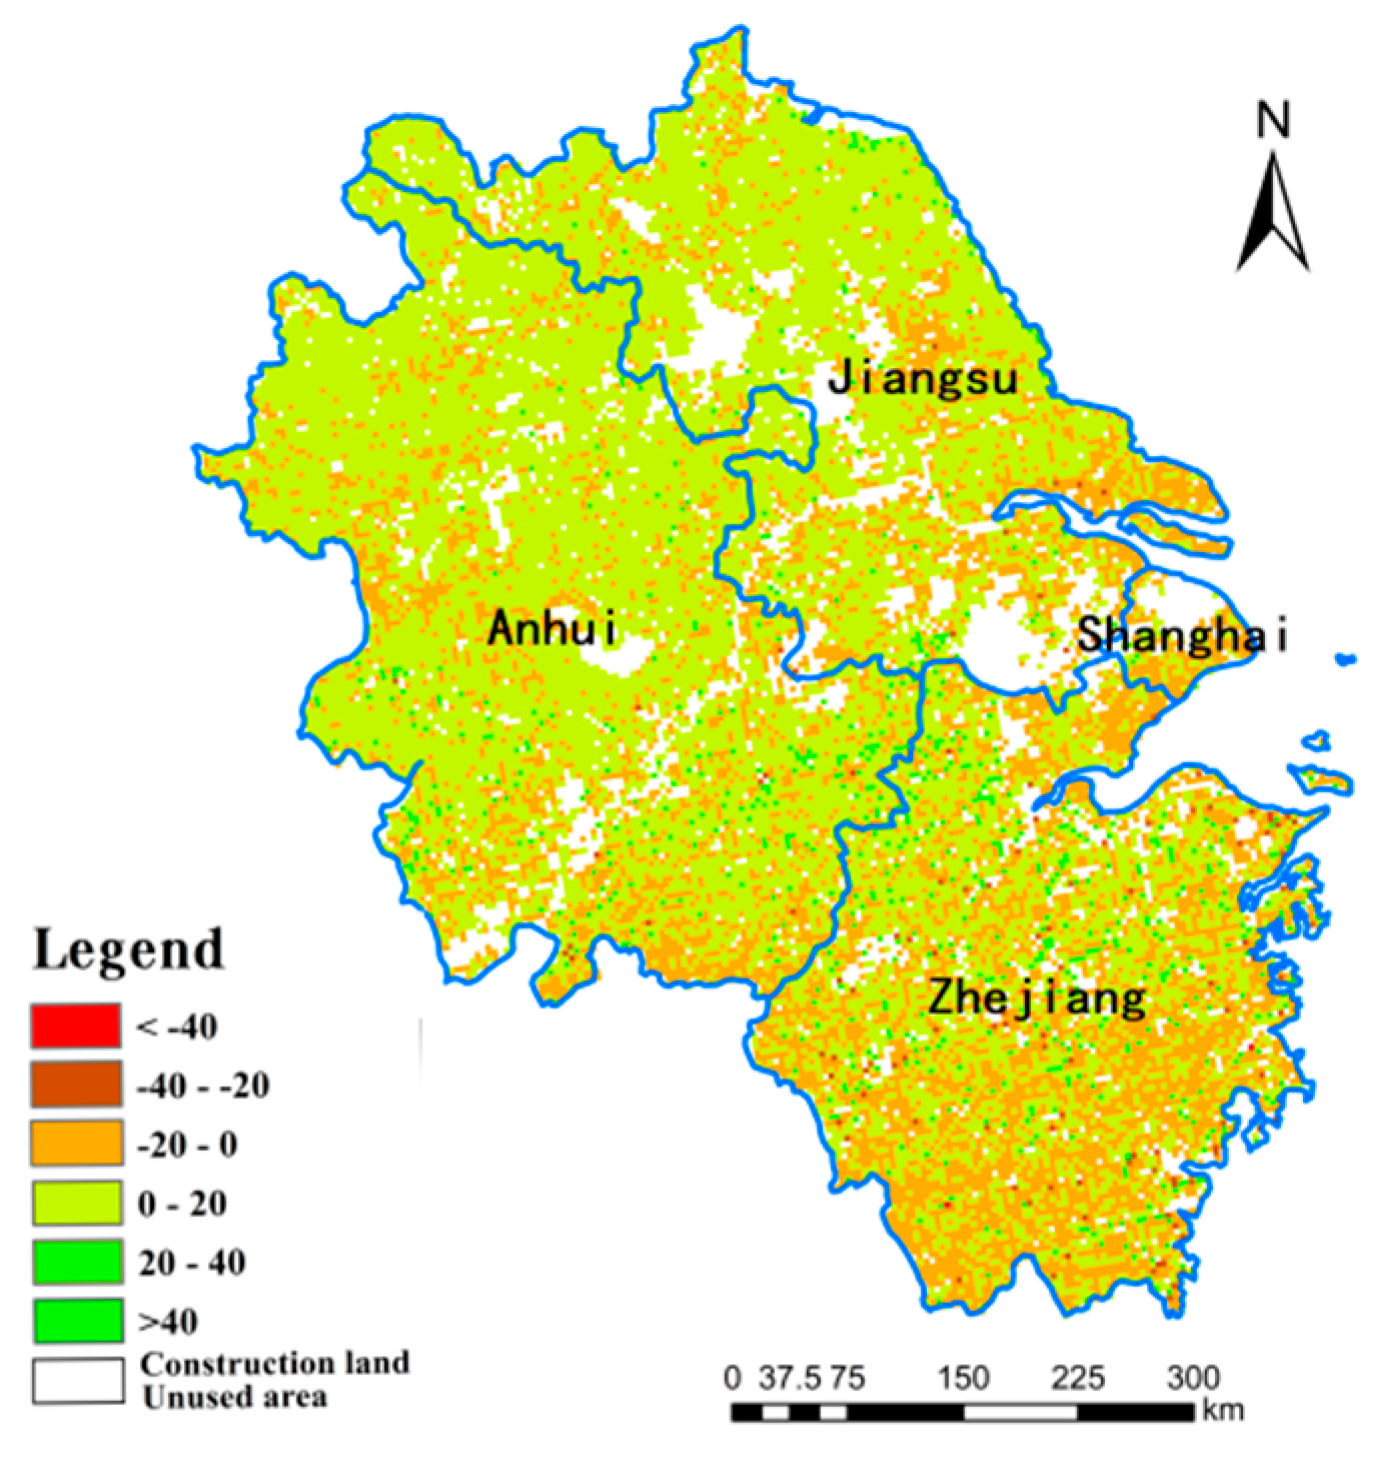
From 2000 to 2019, the area of the Yangtze River Delta region had a change rate of NEP value greater than 0 and accounted for 69.0%; however, there were certain spatial differences. The proportions of provinces and municipalities with θslope < 0 in this region are 14.50% (Zhejiang Province), 9.10% (Anhui Province), 6.65% (Jiangsu Province), and 0.79% (Shanghai); however, in terms of the changes of each province and municipality, Shanghai of China accounted for the largest proportion, followed by Zhejiang Province of China; the proportions of Jiangsu Province of China and Anhui Province of China were smaller;
(4)
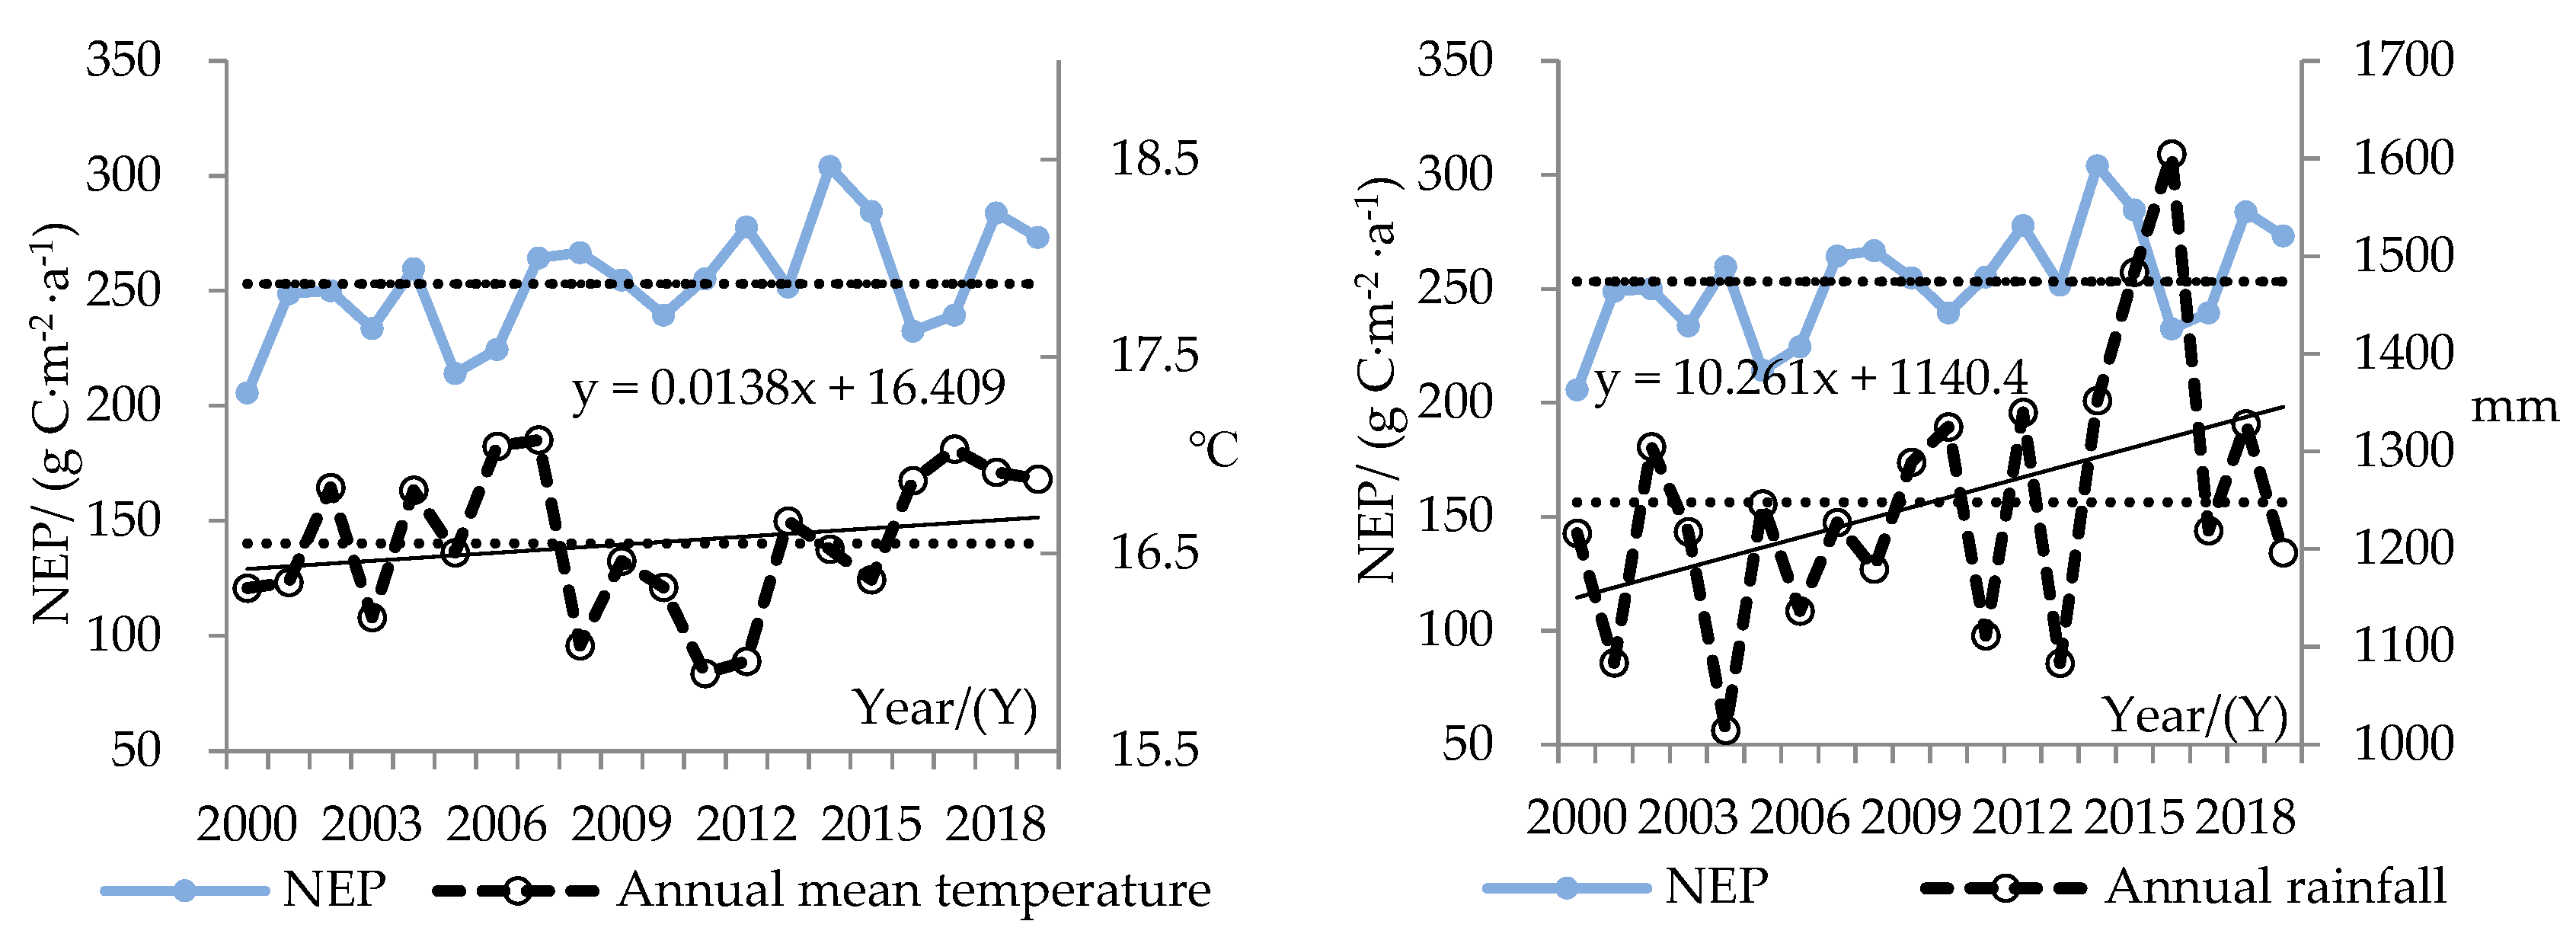
The carbon sink of the terrestrial vegetation ecosystem in the Yangtze River Delta region is a complex process, and there is no significant correlation between its NEP and the annual mean temperature and annual precipitation factors, indicating that the capacity is not only related to the plants’ own characteristics and external environment, but are also affected by human activities.

Author Contributions

Investigation, Methodology, Software, Validation, Formal analysis, Visualization, Writing—original draft, C.Z.; Funding acquisition, Project administration, Resources, H.L.; Investigation, Methodology, D.C.; Software, Cartography, J.F. and Z.L.; Remote sensing image processing, X.X. and Z.W.; Evaluation, J.L.; All authors have read and agreed to the published version of the manuscript.

Funding

This research was funded by the Anhui Science and Technology Major Program [grant number 202003a06020002], Anhui Province key research and development plan [grant number 2021003, 202104A07020002], Anhui Province Fifth Special Support Program, Anhui University Collaborative Innovation Project [grant number GXXT-2021-048], Anhui Provincial Natural Science Foundation [grant number 2008085QD166].

Institutional Review Board Statement

Not applicable.

Informed Consent Statement

Not applicable.

Data Availability Statement

Not applicable.

Acknowledgments

We would like to thank the forestry administration of ChuZhou City, Anhui Province.

Conflicts of Interest

The authors declare no conflict of interest.

References

  1. Xi, J.P. Speech at the General Debate of the 75th United Nations General Assembly; State Council Gazette of the People’s Republic of China: Beijing, China, 2020; Volume 28, pp. 5–7.
  2. Liu, W.; Gu, H.L.; Hong, Y.X.; Chen, Z.S.; Huang, T.Y.; Wei, H.K.; Ding, R.Z.; Yang, K.Z. Remarks on Learning the Spirits of the Fifth Plenary Session of the 19th Central Committee of the Communist Party of China. Econ. Perspect. 2021, 1, 3–26. [Google Scholar]
  3. The Central Economic Working Conference Was Held, Xi Jinping and Li Keqiang Made Important Speeches. Financ. Account. 2020, 12, 3–7.
  4. Hu, A.G. China Plans to Achieve the Goal of Peak Carbon Dioxide Emissions by 2030 and the Main Ways. J. Beijing Univ. Technol. (Soc. Sci. Ed.) 2021, 21, 1–15. [Google Scholar]
  5. Yi, B.L.; Han, J.; Zhou, X.; Yang, F.; Meng, X.; Cao, W.X.; Huang, L.X.; Xiang, W.N. Spatial and Temporal Patterns of Regional Carbon Sources and Carbon Sinks: Taking the Yangtze River Delta as An Example. Chin. J. Appl. Ecol. 2015, 26, 973–980. [Google Scholar]
  6. Jiang, J.; Ding, C.L. Deep Integration of Manufacturing and Service Industries: A New Strategic Choice for High-Quality Integration of the Yangtze River Delta. J. Nantong Univ. (Soc. Sci. Ed.) 2021, 37, 33–42. [Google Scholar]
  7. Sosa-Ávalos, R.; Millán-Núñez, R.; Santamaría-Del-Ángel, E. Primary productivity of phytoplankton estimated with the oxygen and carbon fourteen methods at one station of Estero de Punta Banda, Mexico. Cienc. Mar. 1997, 23, 361–375. [Google Scholar] [CrossRef]
  8. Williams, M.; Rastetter, E.B.; Johnson, L.C. Predicting gross primary productivity in terrestrial ecosystems. Ecol. Appl. 1997, 7, 882–894. [Google Scholar] [CrossRef]
  9. Berninger, F. Effects of drought and phenology on GPP in Pinus sylvestris: A simulation study along a geographical gradient. Funct. Ecol. 1997, 11, 33–42. [Google Scholar] [CrossRef]
  10. Cramer, W.; Kicklighter, D.W.; Schloss, A.L. Comparing global models of terrestrial net primary productivity (NPP): Overview and key results. Glob. Change Biol. 1999, 5, 1–15. [Google Scholar] [CrossRef]
  11. Perez-Garcia, J.; Joyce, L.A.; Binkley, C.; McGuire, A.D. Economic impacts of climatic change on the global forest sector: An integrated ecological/economic assessment. Crit. Rev. Environ. Sci. Technol. 1997, 27, 123–138. [Google Scholar] [CrossRef]
  12. Soukhovolsky, V.G.; Ivanova, J.D. Estimation of forest-stand net primary productivity using fraction phytomass distribution model. Contemp. Probl. Ecol. 2013, 6, 700–707. [Google Scholar] [CrossRef]
  13. Liu, F.; Zeng, Y.N. Temporal and Spatial Patterns and Changes of Vegetation Carbon Sources/Sinks in Qinghai Plateau from 2000 to 2015. Acta Ecol. Sin. 2021, 41, 5792–5803. [Google Scholar]
  14. Liang, L.; Geng, D.; Yan, J.; Qiu, S.; Shi, Y.; Wang, S.; Wang, L.; Zhang, L.; Kang, J. Remote Sensing Estimation and Spatiotemporal Pattern Analysis of Terrestrial Net Ecosystem Productivity in China. Remote Sens. 2022, 14, 1902. [Google Scholar] [CrossRef]
  15. Zhang, L.; Wang, J.; Shi, R.H. Remote Sensing Research on Temporal and Spatial Dynamics of Carbon Sources and Sinks in Three Provinces in Northeast China from 2000 to 2010. J. East China Norm. Univ. (Nat. Sci.) 2015, 4, 164–173. [Google Scholar]
  16. Zheng, J.; Mao, F.; Du, H.; Li, X.; Zhou, G.; Dong, L.; Zhang, M.; Han, N.; Liu, T.; Xing, L. Spatiotemporal Simulation of Net Ecosystem Productivity and Its Response to Climate Change in Subtropical Forests. Forests 2019, 10, 708. [Google Scholar] [CrossRef]
  17. Cao, M.; Woodward, F.I. Dynamic responses of terrestrial ecosystem carbon cycling to global climate change. Nature 1998, 393, 249–252. [Google Scholar] [CrossRef]
  18. Keenan, T.; Bohrer, G.; Friedl, M.; Gray, J.; Hollinger, D.; Munger, J.W.; Schmid, H.P.; Toomey, M.; Richardson, A.; Wing, I.S.; et al. Increased carbon uptake in the eastern US due to warming induced changes in phenology. AGU Fall Meet. Abstr. 2013, 16, B51G-0375. [Google Scholar]
  19. Zhou, C.; Wei, X.; Zhou, G.; Yan, J.; Wang, X.; Wang, C.; Liu, H.; Tang, X.; Zhang, Q. Impacts of a large-scale reforestation program on carbon storage dynamics in Guangdong, China. For. Ecol. Manag. 2008, 255, 847–854. [Google Scholar] [CrossRef]
  20. Li, Z.; Chen, Y.; Zhang, Q.; Li, Y. Spatial patterns of vegetation carbon sinks and sources under water constraint in Central Asia. J. Hydrol. 2020, 590, 125355. [Google Scholar] [CrossRef]
  21. Schulze, E.D.; Prokuschkin, A.; Arneth, A.; Knorre, N.; Vaganov, E.A. Net ecosystem productivity and peat accumulation in a Siberian Aapa mire. Tellus B Chem. Phys. Meteorol. 2002, 54 Pt B, 531–536. [Google Scholar] [CrossRef]
  22. Zhang, K.; Liu, N.; Gao, S.; Zhao, S. Data-Driven Estimation Method for Gross Primary Productivity of Vegetation. Remote Sens. Technol. Appl. 2020, 35, 943–949. [Google Scholar]
  23. Aboumahboub, T.; Schaber, K.; Wagner, U.; Hamacher, T. On the CO2 emissions of the global electricity supply sector and the influence of renewable power-modeling and optimization. Energy Policy 2012, 42, 297–314. [Google Scholar] [CrossRef]
  24. Hu, J.F.; Ma, S.H. Regional Low-Carbon Economic Development Goals and Implementation Plans—Taking the Yangtze River Delta as an Example. J. Financ. Econ. 2012, 38, 81–92. [Google Scholar]
  25. Raich, J.W.; Rastetter, E.B.; Melillo, J.M.; Kicklighter, D.W.; Steudler, P.A.; Peterson, B.J.; Grace, A.L.; Moore, B., III; Vorosmarty, C.J. Potential net primary production in South America: Application of a global model. Ecol. Appl. 1991, 1, 399–429. [Google Scholar] [CrossRef]
  26. Running, S.W.; Nemani, R.R.; Heinsch, F.A.; Zhao, M.; Reeves, M.; Hashimoto, H. A continuous satellite-derived measure of global terrestrial primaryproduction. Bioscience 2004, 54, 547–560. [Google Scholar] [CrossRef]
  27. Zhao, M.; Heinsch, F.A.; Nemani, R.R.; Running, S.W. Improvements of the MODIS terrestrial gross and net primary productionglobal data set. Remote Sens. Environ. 2005, 95, 164–176. [Google Scholar] [CrossRef]
  28. Turner, D.P.; Ritts, W.D.; Cohen, W.B.; Gower, S.T.; Running, S.W.; Zhao, M.; Costa, M.H.; Kirschbaum, A.A.; Ham, J.M.; Saleska, S.R.; et al. Evaluation of MODIS NPP and GPP products across multiple biomes. Remote Sens. Environ. 2006, 102, 282–292. [Google Scholar] [CrossRef]
  29. Li, D.K.; Fan, J.Z.; Wang, J. Variation Characteristics of Vegetation NPP in Shaanxi Province Based on MOD17A3. Chin. J. Ecol. 2011, 30, 2776–2782. [Google Scholar]
  30. Xie, B.; Qin, Z.; Wang, Y.; Chang, Q. Spatial and temporal variation in terrestrial net primary productivity on Chinese Loess Plateau and its influential factors. Editor. Off. Trans. Chin. Soc. Agric. Eng. 2014, 30, 244–253. [Google Scholar]
  31. Wang, Y.X.; Weng, B.Q.; Huang, Y.B. Effects of land use/cover changes on soil carbon storage and carbon cycle. Subtrop. Agric. Res. 2005, 1, 44–50. [Google Scholar]
  32. Zhou, G.S.; Zhang, X.S. Study on NPP Of Natural Vegetation In China Under Global Climate Change. Acta Ecol. Sin. 1996, 20, 11–19. [Google Scholar]
  33. Zhang, S.Q.; Pu, Z.C.; Fu, X.H.; Ding, L. Effects of climate change on net primary productivity of natural vegetationin Xinjiang. Arid. Zone Res. 2010, 27, 905–914. [Google Scholar]
  34. Liang, R.; Ren, Z.Y. Spatiotemporal dynamic evolution of net primary productivity of vegetation in southern Shaanxi. Bull. Soil Water Conserv. 2014, 34, 86–90, 94, 95. [Google Scholar]
  35. Sun, S.L.; Zhou, S.Q.; Shi, J.H.; Lin, Y.; Xue, G.Y.; Lai, A.W.; Li, H.L. Calculation and Comparison of Vegetation Net Primary Productivity(NPP) in Zhejiang Province with Three Models. Chin. J. Agrometeorol. 2010, 31, 271–276. [Google Scholar]
  36. Mann, H.B. Nonparametric test against trend. Econometrica 1945, 13, 245–259. [Google Scholar] [CrossRef]
  37. Yi, B.L. Multi-scale Spatiotemporal Pattern Evolution Research on Carbon Sources and Carbon Sinks in Yangtze River Delta Region. Master’s Thesis, East China Normal University, Shanghai, China, 2015. [Google Scholar]
  38. Wang, X.L.; Xu, S.H.; Cui, D.C. Diagnosis and Evaluation of the Influence of CO2 Concentration Doubling and Climate Warming on Agricultural Production. Chin. J. Eco-Agric. 2003, 11, 47–48. [Google Scholar]
  39. Yang, X.; Wang, M.X. A Review of Some Problems on Terrestrial Carbon Cycle Research. Adv. Earth Sci. 2001, 16, 427–435. [Google Scholar]
  40. Li, J.; Zhang, Y.D.; Gu, F.X.; Huang, M.; Guo, R.; Hao, W.P.; Xia, X. Spatial and Temporal Dynamics of Net Ecosystem Productivity in Northeast China in the Recent 50 Years. Acta Ecol. Sin. 2012, 34, 1490–1502. [Google Scholar]
  41. Pang, R.; Gu, F.X.; Zhang, Y.D.; Hou, Z.H.; Liu, S.R. Spatial and Temporal Dynamics of Net Ecosystem Productivity in Alpine Region of Southwest China. Acta Ecol. Sin. 2012, 32, 7844–7856. [Google Scholar] [CrossRef]
Figure 1. The location of the study area.
Sustainability 14 10051 g001
Figure 2. Comparison between MODIS-NEP and vegetation net primary productivity model.
Sustainability 14 10051 g002
Figure 3. (a) Spatial distribution of NEP mean value in Yangtze River Delta from 2000 to 2019. NEP mean distribution frequency; (b) Yangtze River Delta region; (c) Anhui; (d) Jiangsu (e) Zhejiang; (f) Shanghai (black curve is cumulative frequency).
Sustainability 14 10051 g003
Figure 4. From 2000 to 2019: (a) interannual variation of annual mean, maximum, minimum and NEP > 0 in the Yangtze River Delta; (b) interannual variation of mean NEP in Anhui, Jiangsu, Shanghai, and Zhejiang.
Sustainability 14 10051 g004
Figure 5. Identification of m–k mutation points of NEP value in Yangtze River Delta region (a) Yangtze River Delta region; (b) Anhui of China; (c) Jiangsu of China; (d) Shanghai of China; (e) Zhejiang of China.
Sustainability 14 10051 g005
Figure 6. Identification of m–k mutation points with NEP > 0 in Yangtze River Delta region (a) Yangtze River Delta region; (b) Anhui of China; (c) Jiangsu of China; (d) Shanghai of China; (e) Zhejiang of China.
Sustainability 14 10051 g006
Figure 7. Land cover types in Yangtze River Delta (2001, 2004, 2007, 2010, 2013, 2016, 2019).
Sustainability 14 10051 g007
Figure 8. Interannual changes of the NEP of different land cover types in the Yangtze River Delta region from 2000 to 2019.
Sustainability 14 10051 g008
Figure 9. Change rate of NEP in Yangtze River Delta (2000–2019).
Sustainability 14 10051 g009
Figure 10. Interannual variation of NEP, annual average temperature, and annual rainfall in the Yangtze River Delta.
Sustainability 14 10051 g010
Table 1. Average NEP values of different land cover types.
Vegetation Cover TypeMean NEP (g·C·m−2·a−1)Carbon Source/SinkStandard Deviation
Forestlands378.37Carbon Sink31.51
Grasslands304.55Carbon Sink25.96
Wetlands185.80Carbon Sink23.79
Croplands192.17Carbon Sink34.77
Built-up Lands\Carbon Source\
Unused lands\Carbon Source\
Publisher’s Note: MDPI stays neutral with regard to jurisdictional claims in published maps and institutional affiliations.

