1. Introduction
Groundwater is a valuable natural resource and plays a vital role in social production, life, and ecosystem maintenance, especially in arid and semiarid regions. Due to the frequent occurrence of extreme climate and the rapid growth of population, the demand for groundwater resources has increased greatly in recent decades [
1]. In addition to considering groundwater quantity, groundwater quality is also an essential factor in determining the availability of groundwater resources [
2]. Generally, the hydrochemical composition of groundwater depends on the natural factors such as recharge water characteristics, aquifer media, and water-rock processes [
3]. However, with the deepening of the impact of human society on the geological environment, groundwater is increasingly affected by mining, industry, agriculture, urbanization, and other human activities. Therefore, to analyze the chemical characteristics and formation mechanism of groundwater, especially in areas affected strongly by human activities, is the key to the safe and sustainable utilization of groundwater resources.
In recent times, a great deal of work has been done in assessing and protecting groundwater quality by many scholars all around the world. As an important research method, hydrogeochemistry specializes in the formation of chemical components and the migration, transformation, and enrichment of various elements in groundwater. It has been widely used to evaluate the chemical characteristics of groundwater [
4]. Li et al. (2010) used geochemical modeling to quantify the evolution process and formation mechanism of local groundwater chemistry in the southern plain of Pengyang County, Ningxia, China [
5]. Sivakarun et al. [
6] adopted the methods of ion ratios and hydrochemical parameters statistics to illustrate the factors that affected groundwater in coastal areas of southern India [
6]. Osta et al. [
7] revealed the hydrochemical characteristics and the main evolution processes of groundwater in sandstone aquifer. Liu et al. [
8] analyzed the hydrochemical characteristics and the controlling factors of groundwater in the alluvial-proluvial fan of the Qinhe river using these methods of mathematical statistics: the Schakerev classification, Piper diagrams, Schoeller diagrams, Gibbs plots, and ion ratios.
Nanchang is situated in the north-central part of the Jiangxi Province and the alluvial plain of the lower reaches of Gan River and Fu River. It is the only capital city that is adjacent to the Yangtze River Delta, the Pearl River Delta, and the Western Taiwan Straits Economic Circle. As an important source of water, groundwater has a close connection to the development of Nanchang city. In recent decades, industrialization, urbanization, and economic growth have significantly impacted the groundwater environment. Based on the analysis of hydrogeological conditions in the study area, this work adopted the methods of mathematical statistics, Piper diagrams, Gibbs diagrams, ion ratios, and a hydrogeochemical model to reveal the geochemical characteristics and controlling factors of the chemical composition of groundwater in a part of the Nanchang section of the Ganfu plain. This work is helpful to understand the groundwater circulation process and provides a scientific basis for the evaluation and rational development of regional water resources.
2. Materials and Methods
2.1. Study Area
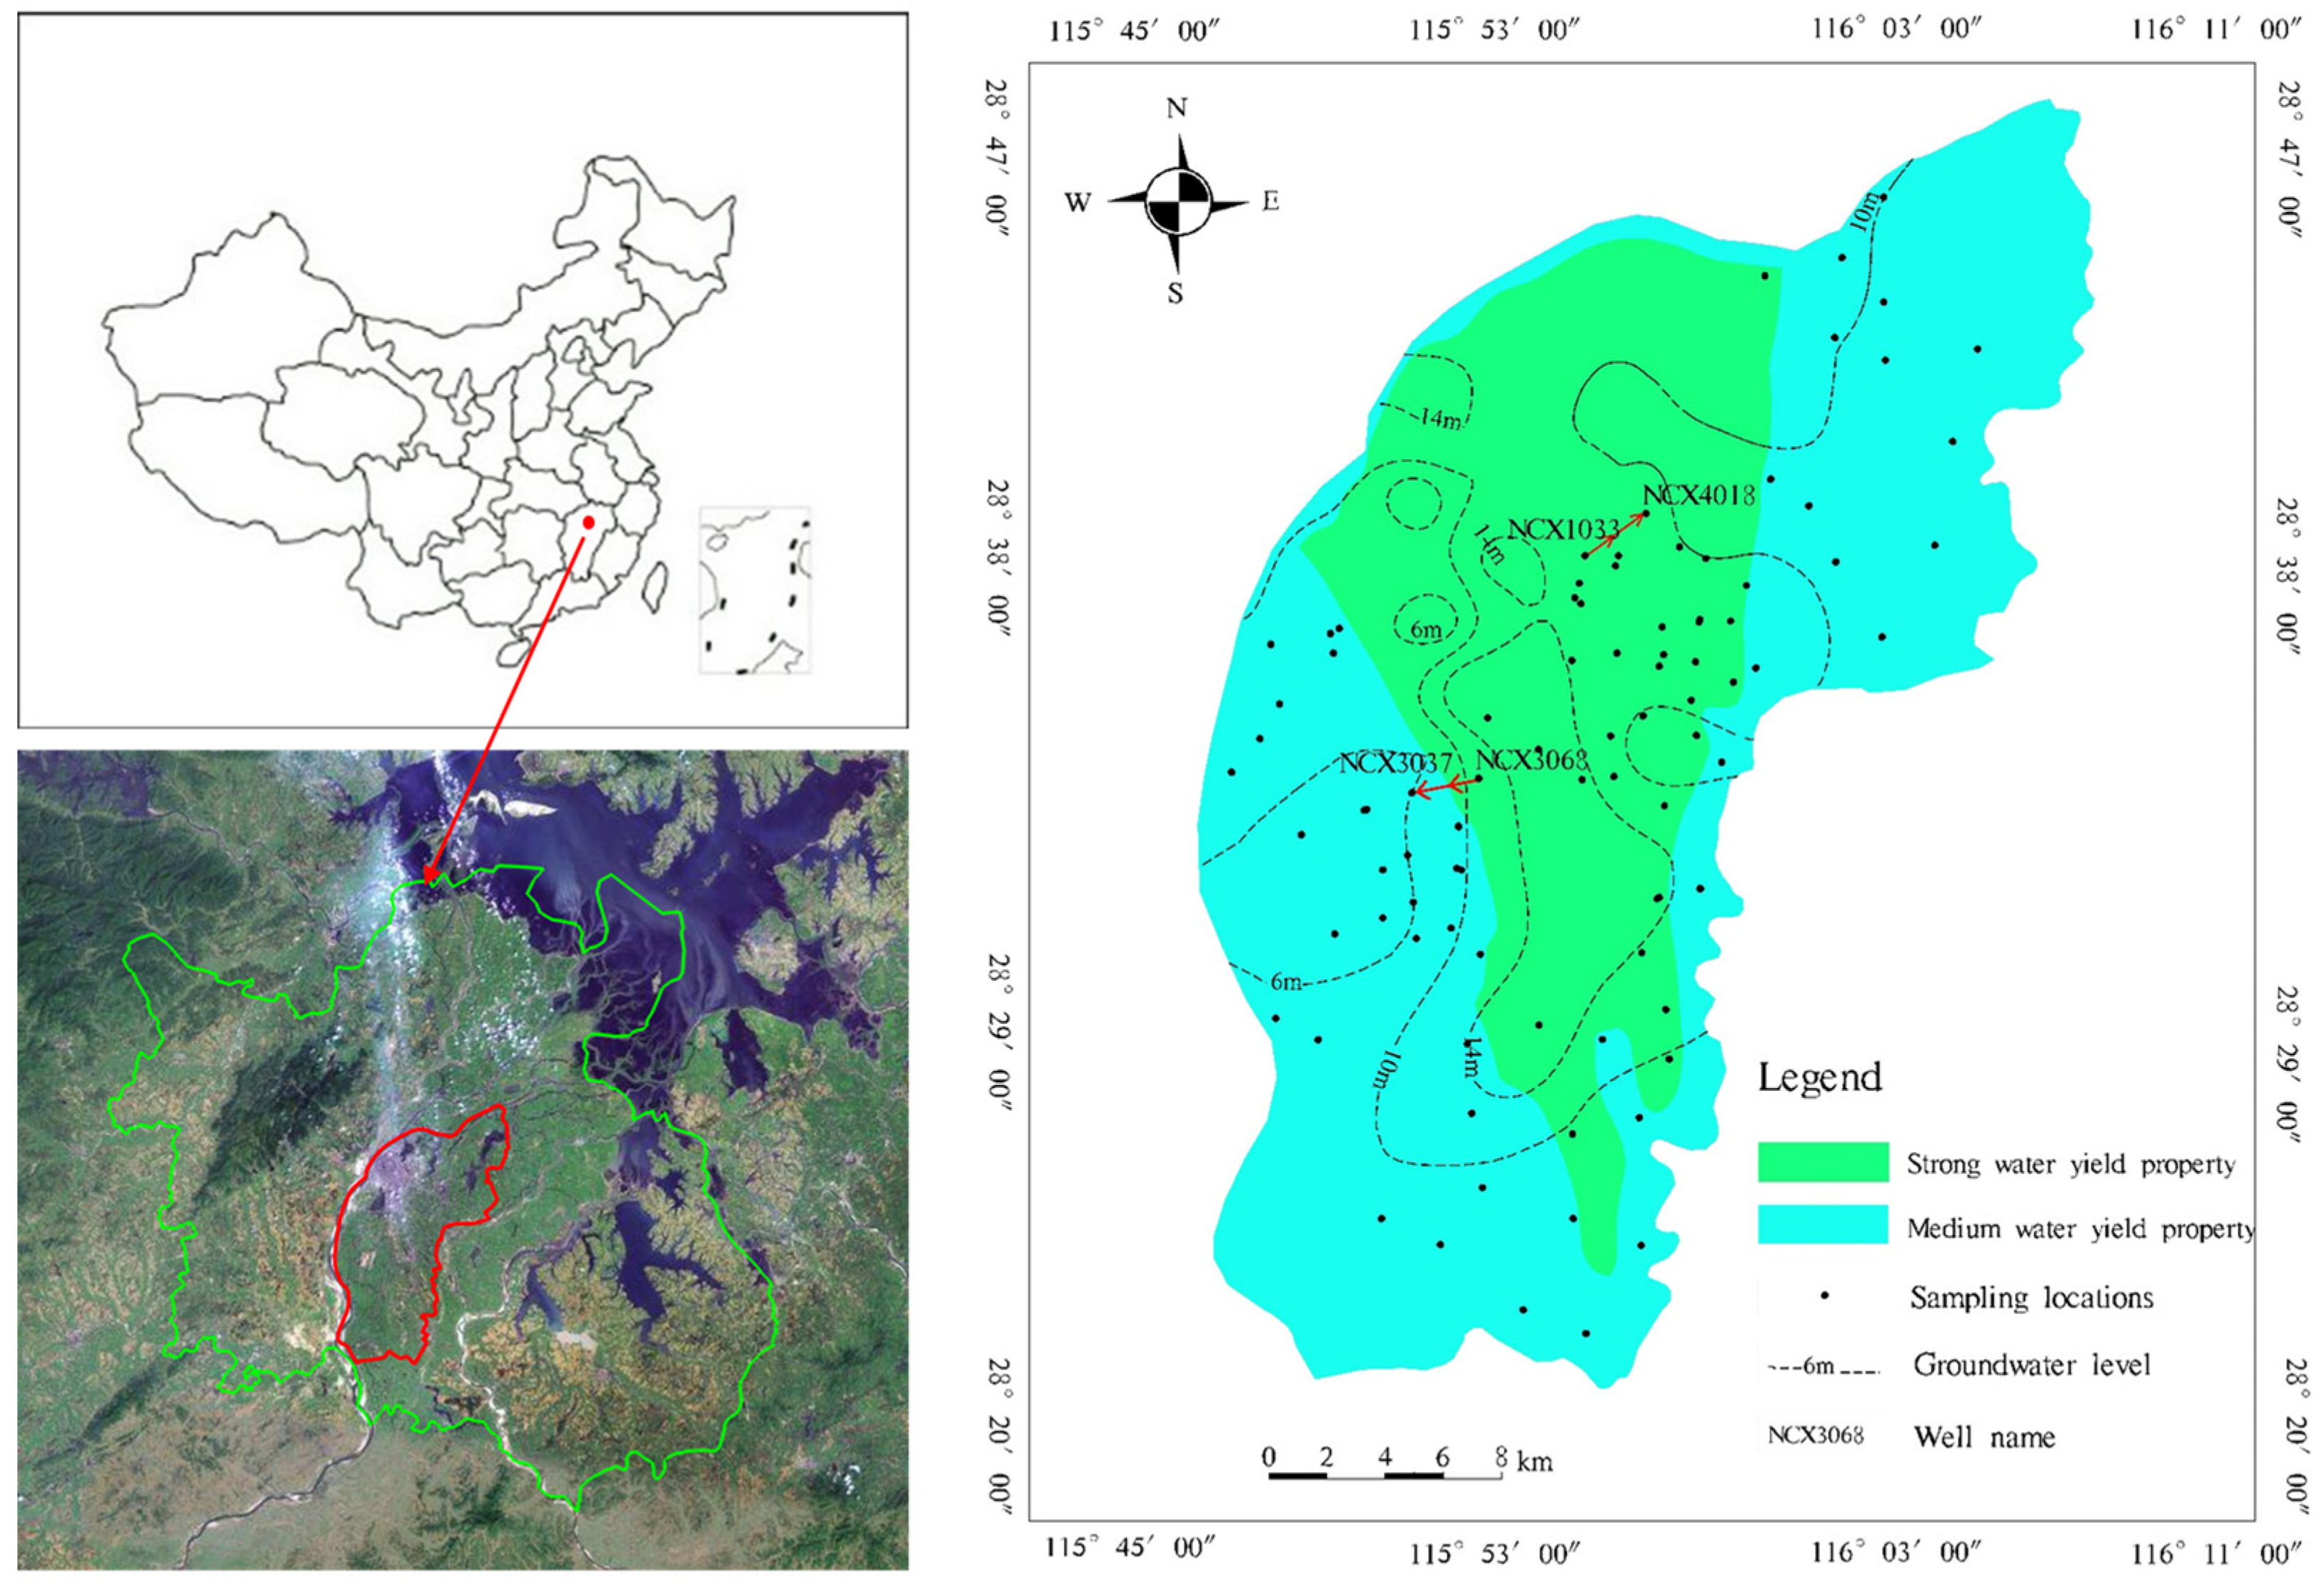
The study area is a part of the Ganfu plain and lies between 28°21′2.93″ and 28°46′15.13″ N latitude and 115°48′43.09″ and 116°07′32.06″ E longitude (
Figure 1). It is located in the humid subtropical climate zone with a long humid summer and a short and cool winter. The annual average temperature is 17~17.7 °C. The average annual rainfall is approximately 1610 mm, with 49.33% concentrated in April through June. The average yearly evaporation is about 1227.4 mm [
9].
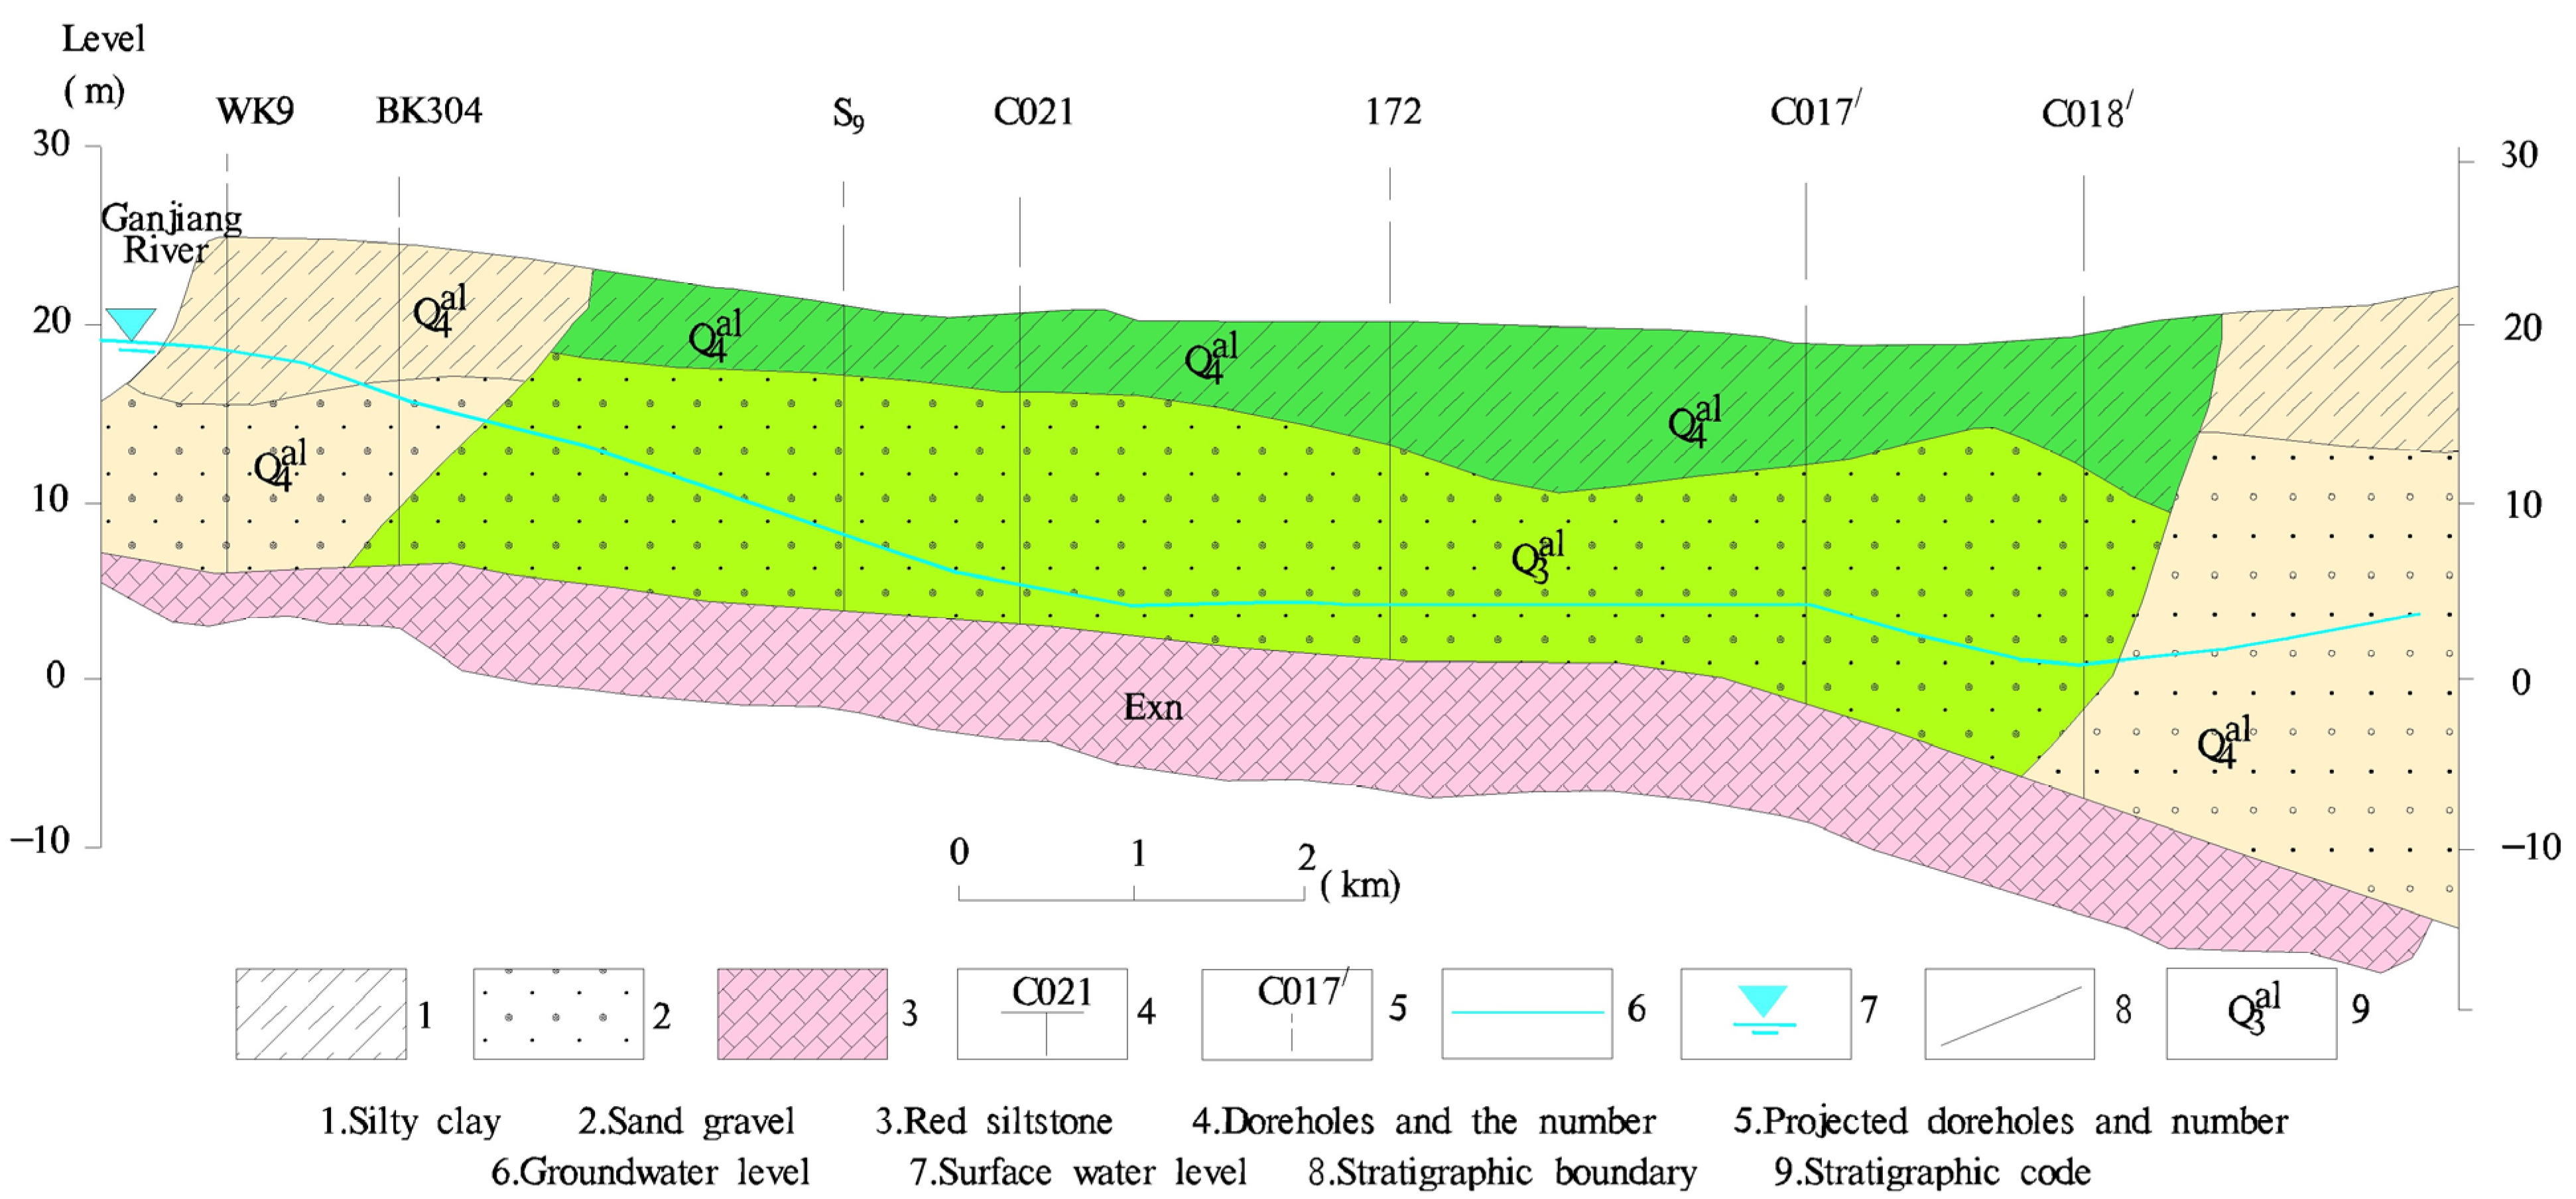
The groundwater in the study area is mainly quaternary loose rock pore water. The quaternary aquifers consist of sand and gravel aquifers of the upper Middle Pleistocene, Upper Pleistocene, and Holocene, respectively. The aquifer has a binary structure: the upper part is a relatively impervious layer, which is composed of cohesive soil and silt, with mixed mucky cohesive soil locally, and the thickness is generally 5~15 m, and the average thickness is 6.95 m. The lithology of the lower part is sand and gravel, which is the main storage space for groundwater.
The bedrock fissure aquifer is widely distributed below the quaternary loose pore layer and has a good connectivity with the overlying loose rock pore aquifer [
9]. The hydrogeological profile is shown in
Figure 2.
2.2. Sample Collection and Chemical Analysis of Groundwater
A total of 90 groundwater samples were collected in two sampling campaigns (December 2018 and July 2019). Groundwater samples were collected from shallow wells ranging in depth from 2 to 30 m below ground level. The clean, dry polyethylene plastic bottles were used to collect water samples, and the bottles were rinsed at least three times with the source water before sampling. During sampling, water was filtered by 0.45 μm pore size membrane and aliquots for cations acidified to prevent mineral precipitation. After sampling, the groundwater samples were labeled, sealed, and transported to the laboratory for testing within 48 h.
The parameters of temperature, DO, EC, Eh, and pH were determined by SMART SpectroTM on-site, and the others were tested by the Ministry of Land and Resources East China Mineral Resources Supervision and Testing Center. Flame atomic absorption spectroscopy (AAS) was used to determine the concentrations of four different metal cations (Ca
2+, Mg
2+, Na
+ and K
+) (Perkin Elmer AAnalyst 100). The total hardness and HCO
3− were titrated using a HACH digital titrator. Cl
−, SO
42−, NO
3−, F
− were measured on ion chromatography (Dionex ICS-2500), and the total dissolved solids (TDS) were determined by the drying method [
10]. The reliability of chemical data was checked for accuracy via ionic balance analysis. The results show that the ionic balance error is less than ±5%, indicating that the accuracy of the measurements is acceptable in this study [
11].
2.3. Analytical Method
Combined with the hydrogeological condition and hydrochemical data of the study area, the chemical characteristics of groundwater were analyzed using the methods of mathematical statistics, Piper’s trilinear diagram, and Gibbs’ diagram, etc. [
12,
13]. The hydrogechemical calculation (saturation indices, logPCO2) and modeling (inverse modeling) were carried out using PHREEQC 2.8 software [
14]. A Piper diagram was used to analyze the evolution characteristics of groundwater hydrochemistry. A Gibbs diagram was used to analyze the formation mechanism of chemical component of groundwater. The reverse hydrogeochemical simulation was used to determine the amount of dissolution or precipitation of minerals and to analyze the variation characteristics of each hydrochemical component along the flow path. Descriptive statistical analysis of hydrochemical parameters was carried out by SPSS 22.0 software. Piper’s trilinear diagram and Gibbs’ diagram are drawn by AqQA 1.1.1 [
15] and Excel software, respectively. Other diagrams were drawn using Photoshop and Arcgis 10.0.
3. Results and Discussions
3.1. Statistical Results
The statistical results of the analyzed parameters have been presented in
Table 1. Generally, the groundwater is weakly acidic with mean acidity being 6.27 pH units. The pH data display little variability over the domain of the study area. The TDS values of groundwater range between 38 mg/L and 593 mg/L with an average of 198.46 mg/L. Na
+ and Ca
2+ are the predominant cations. The concentration of Ca
2+ varies from 1.5 to 105 mg/L with a mean of 26.4 mg/L. The concentration of Na
+ varies from 4.01 to 85.2 mg/L with a mean of 19.79 mg/L. The average concentration of cation in groundwater decreases in Ca
2+ > Na
+ > Mg
2+ > K
+. Calcium (Ca
2+) is the most abundant cation in groundwater, but most samples are obviously much less than the WHO standard (75 mg/L) for drinking water (WHO, 2006) [
16]. With respect to anions, HCO
3− is the most dominant anion, and the concentration ranged between 5.51 and 352 mg/L. The abundance is in the order HCO
3− > NO
3− > SO
42− > Cl
− for anions. The dominance of the HCO
3− ion also suggests that groundwater in the area is generally shallow groundwater [
17].
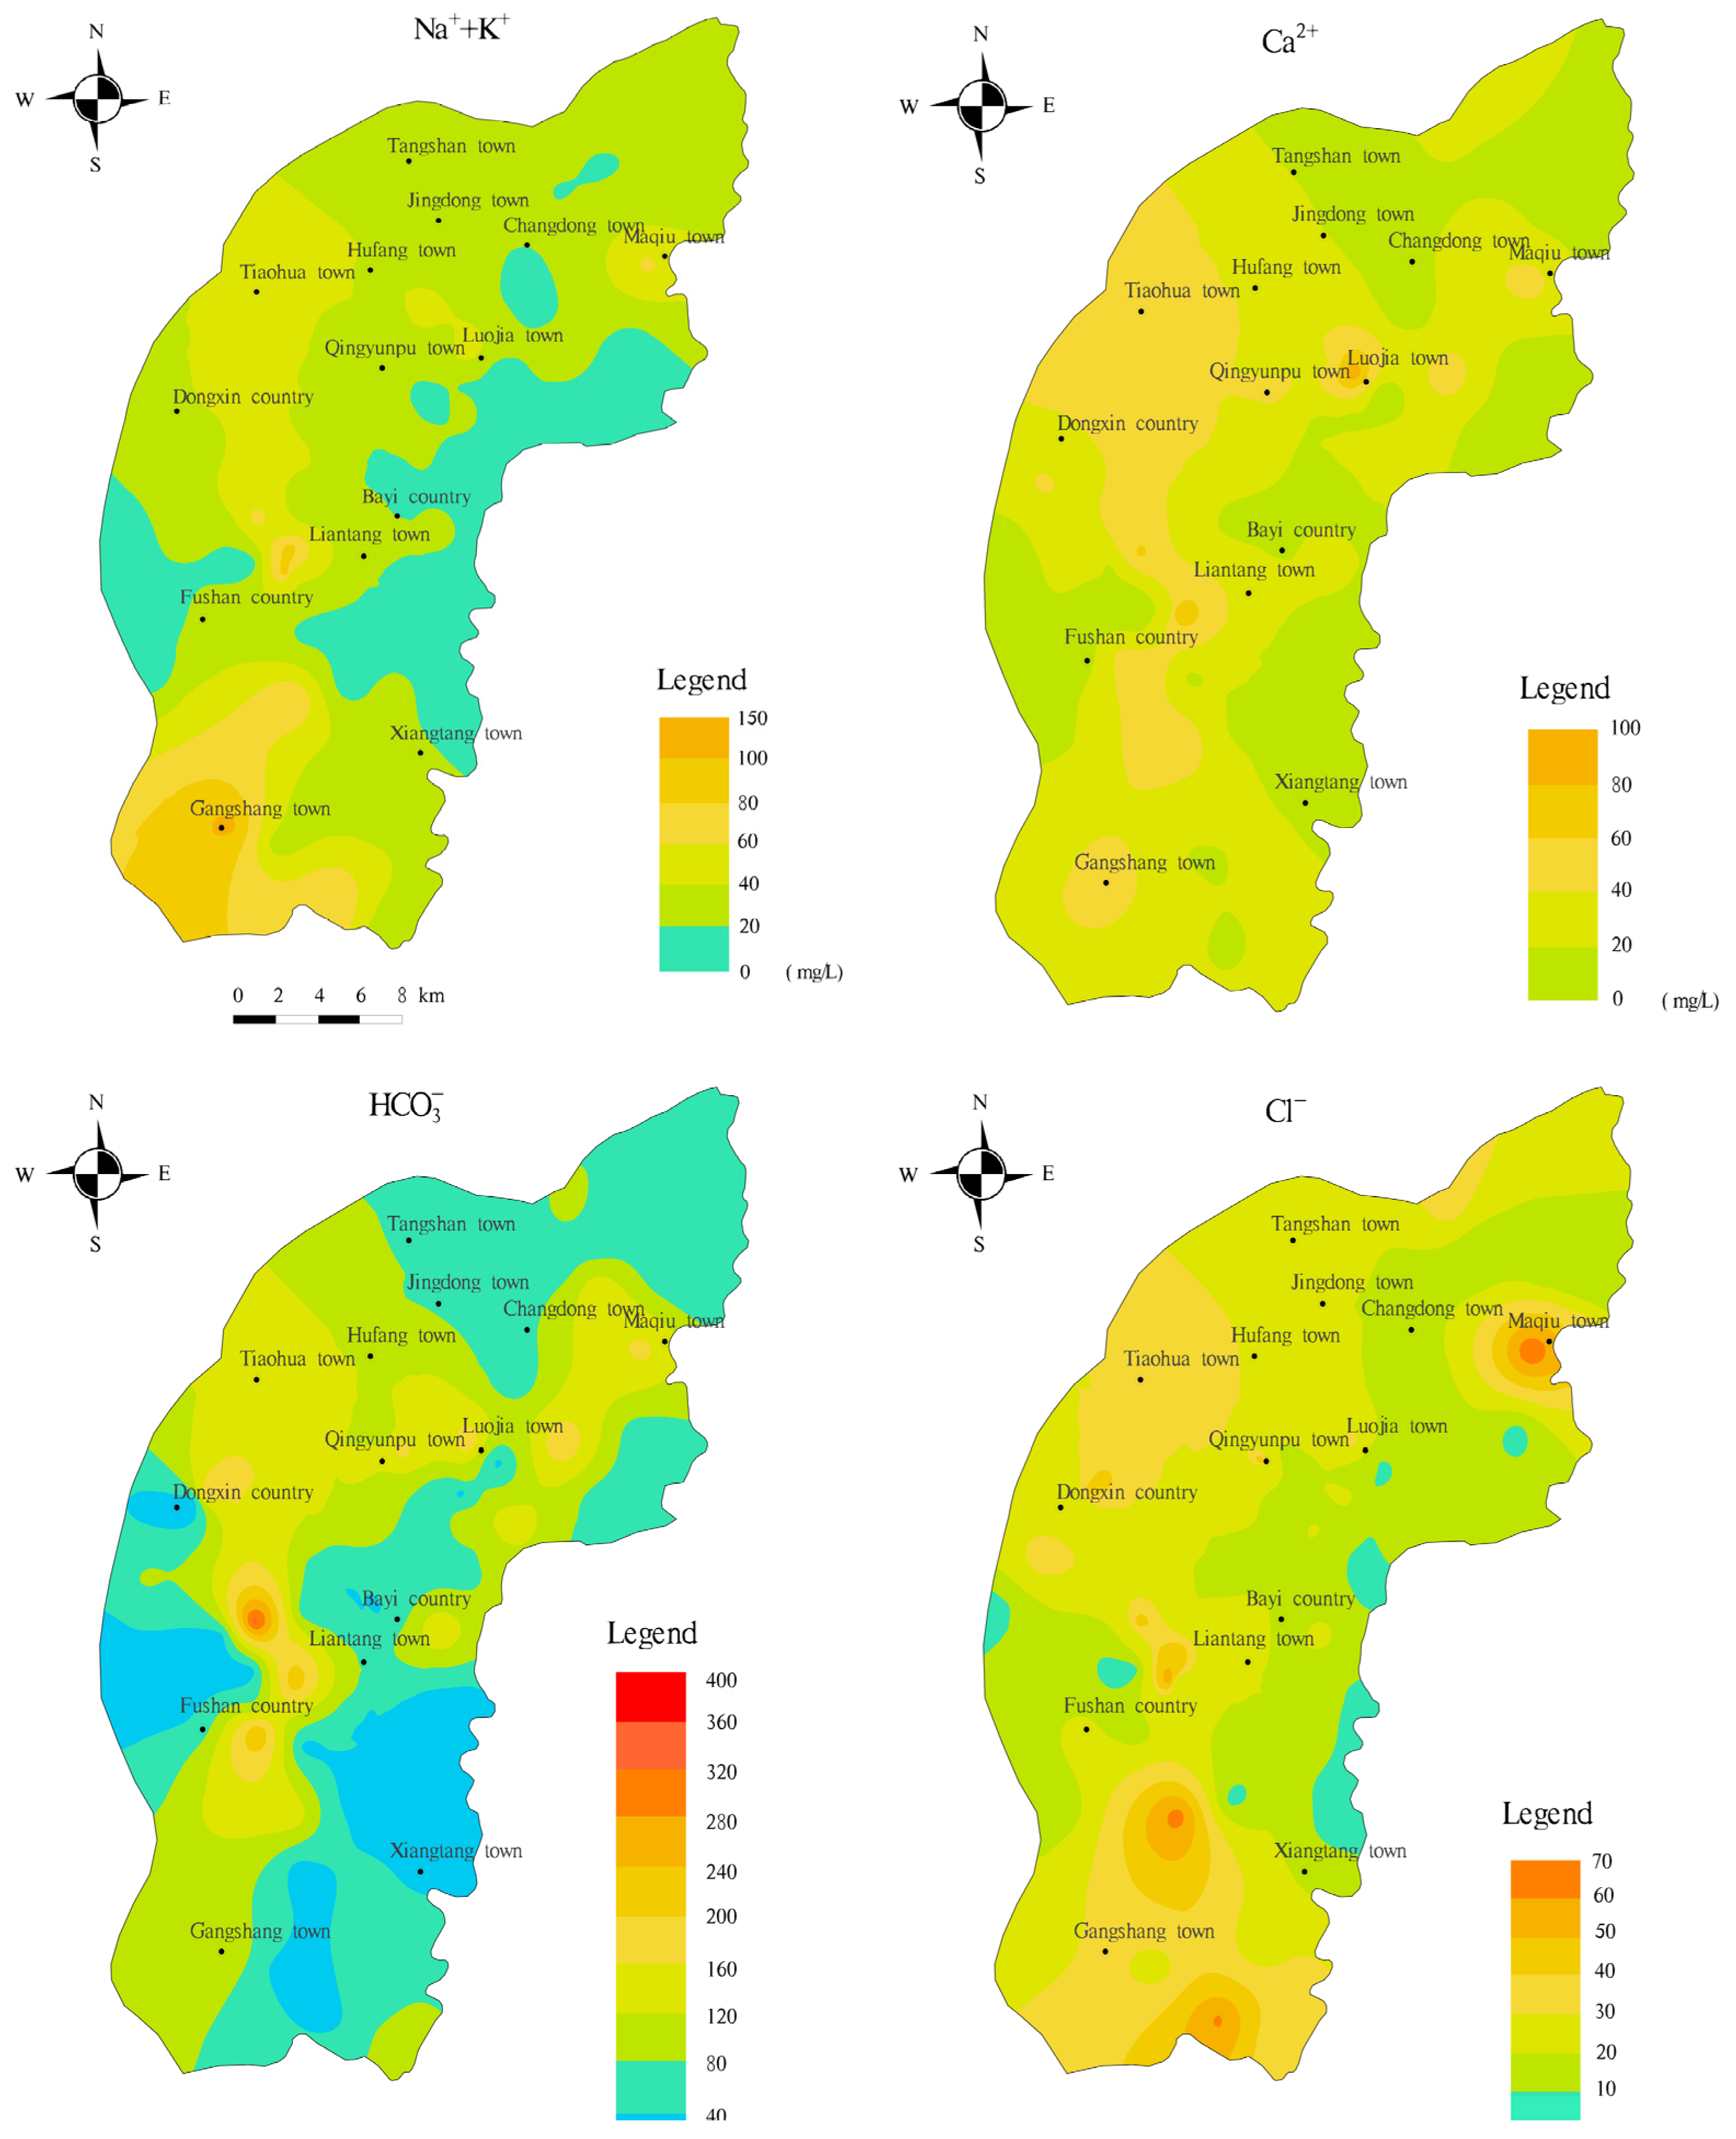
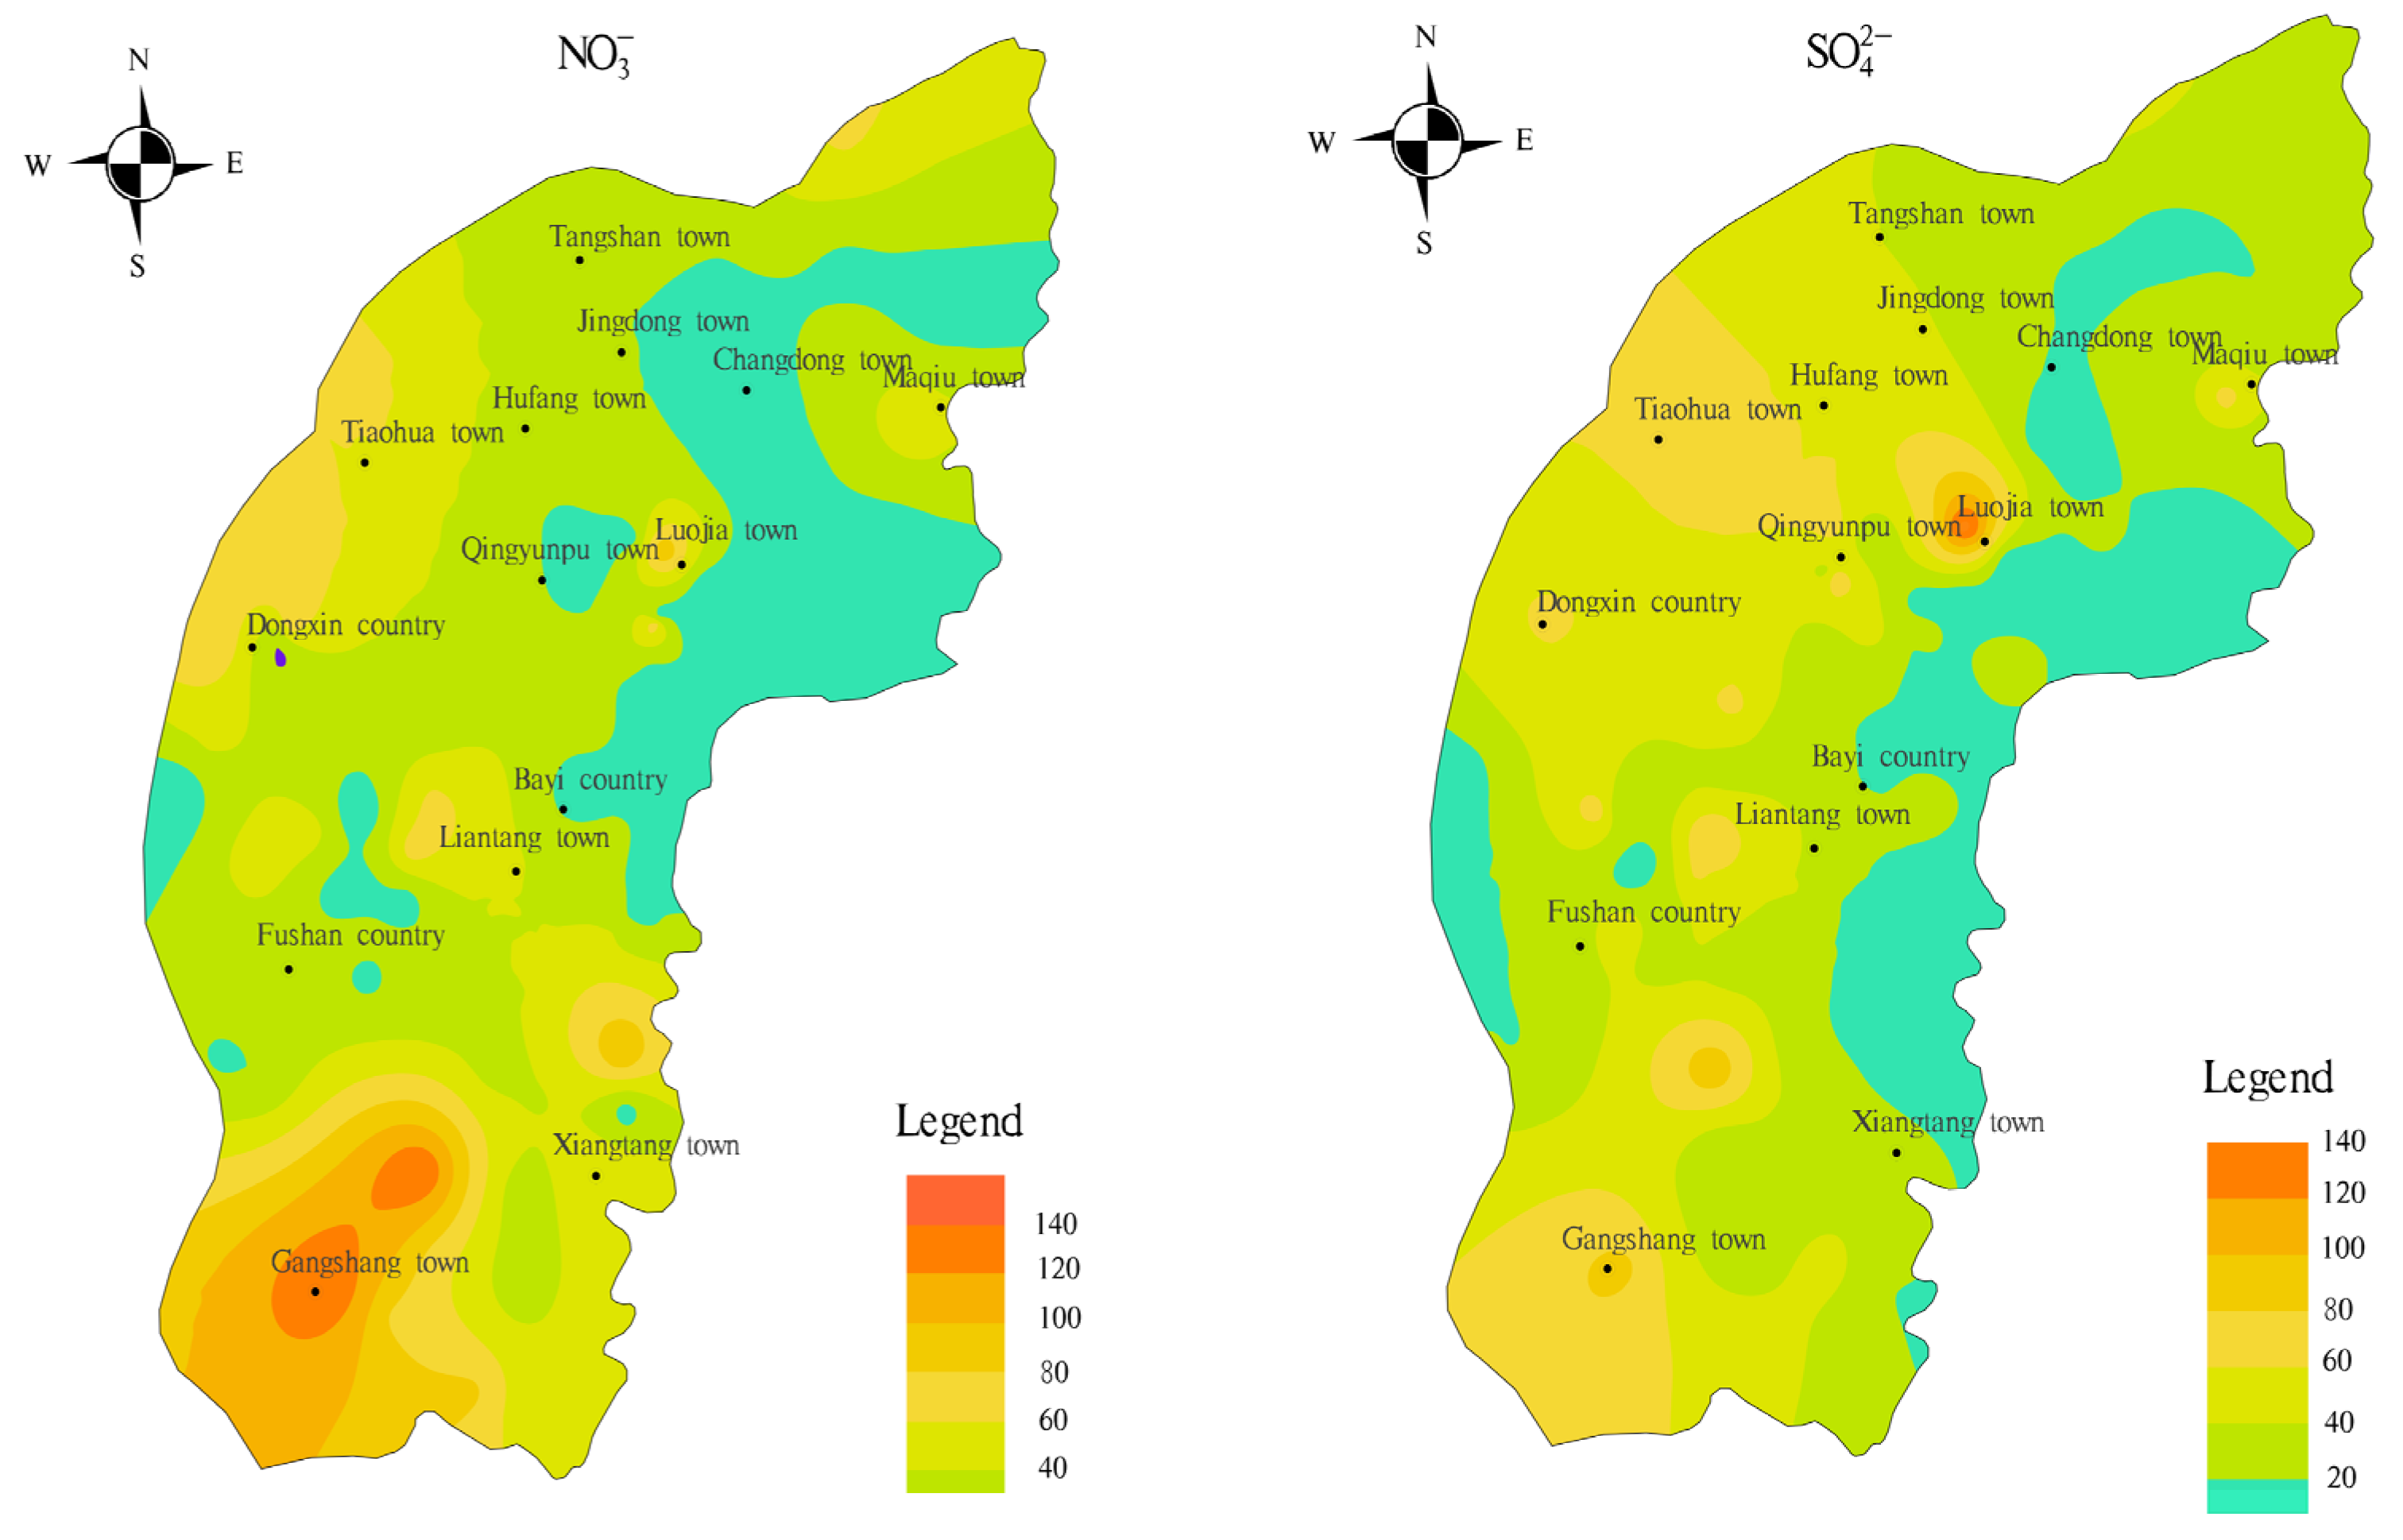
The coefficient of variation shows that there is more pronounced variability in the spatial distribution of ion concentrations. The spatial distribution of main ion concentrations is shown in
Figure 3. It can be seen from
Figure 3 that the concentration of ions has an apparent zoning phenomenon, which generally presents the distribution characteristics with high concentrations in the central part of the study area and low concentrations in the north and south sides.
3.2. Hydrochemical Types
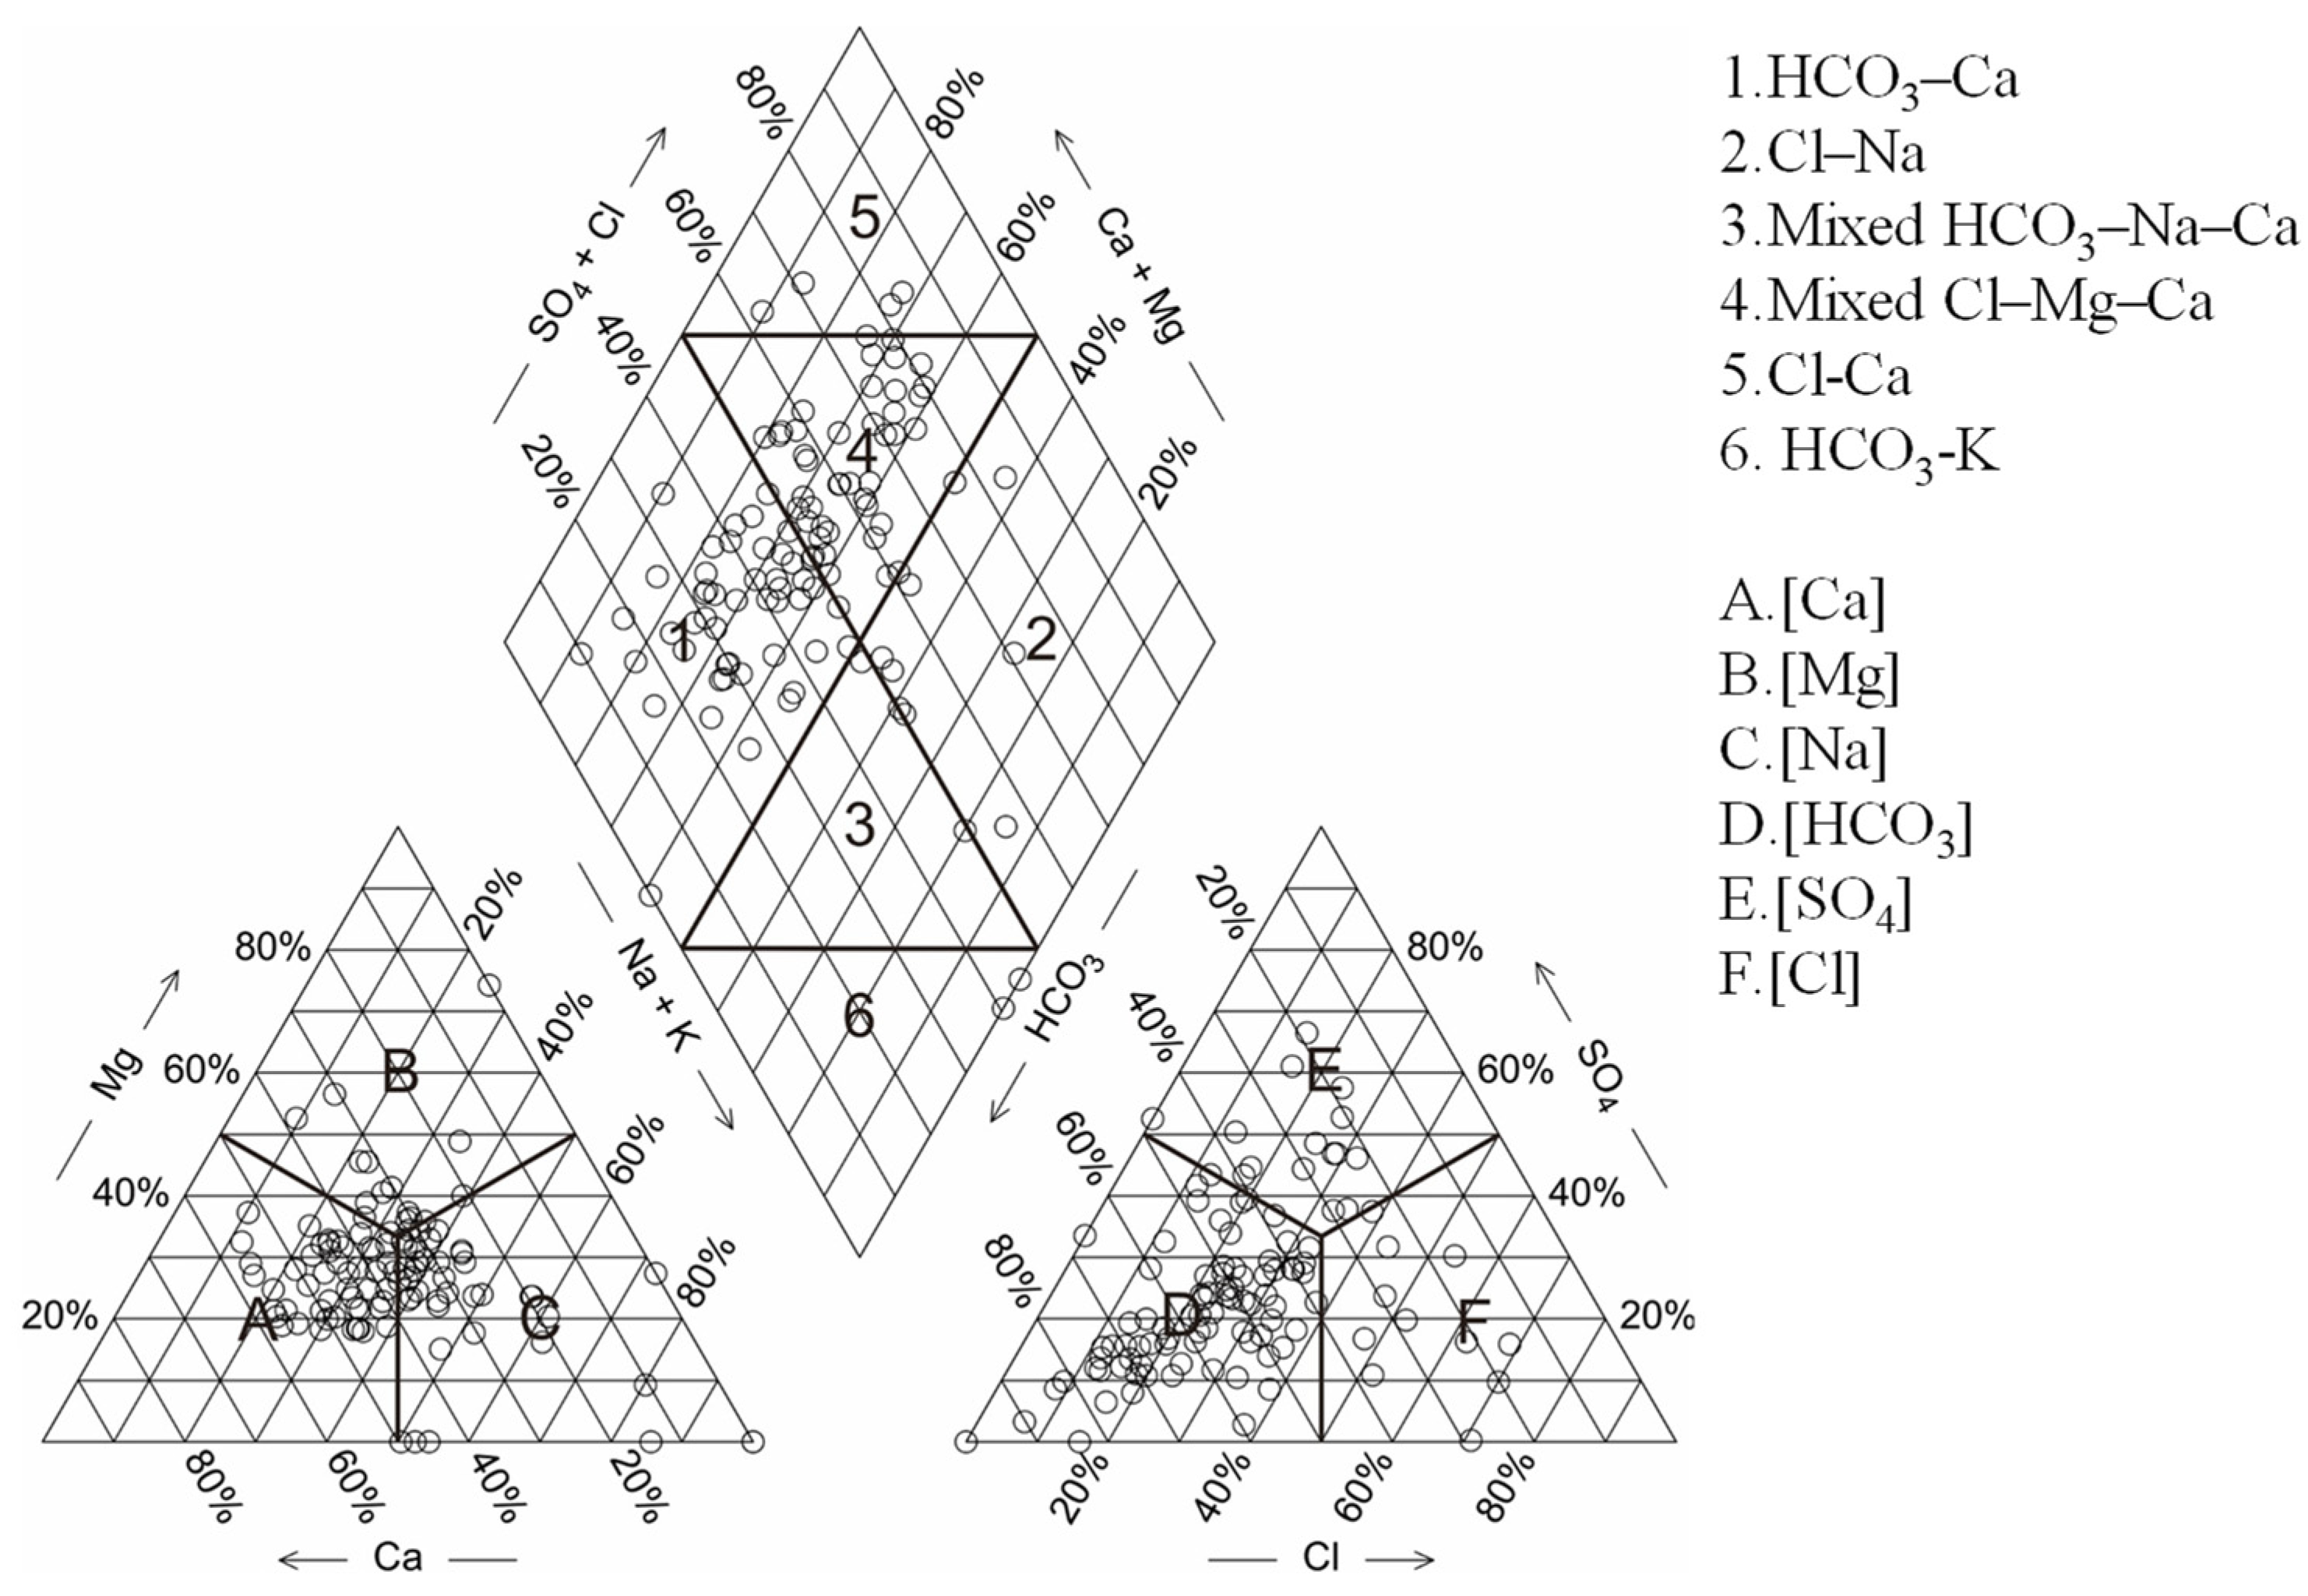
Piper diagrams have been widely used to characterize the composition and evolution of the main ions in groundwater chemistry. The method has an advantage of being independent of human influence [
18]. The groundwater samples were put on the Piper diagram, as shown in
Figure 4. On the cationic triangle (left-hand triangle), most of groundwater samples were classified as calcium type or mixed type, collectively accounting for 73.34% of water samples. On the anion triangle (right-hand triangle), the bicarbonate and mixed types were predominant, collectively representing 82.71% of all groundwater samples. As seen on the diamond of the Piper plot, the hydrochemical types of groundwater in the study area belong to three categories, including the HCO
3-Na·Ca·Mg facies, HCO
3·Cl-Na·Ca·Mg facies, and HCO
3-Na·Ca facies.
3.3. Mechanisms Controlling Groundwater Geochemistry
3.3.1. Gibbs Diagram
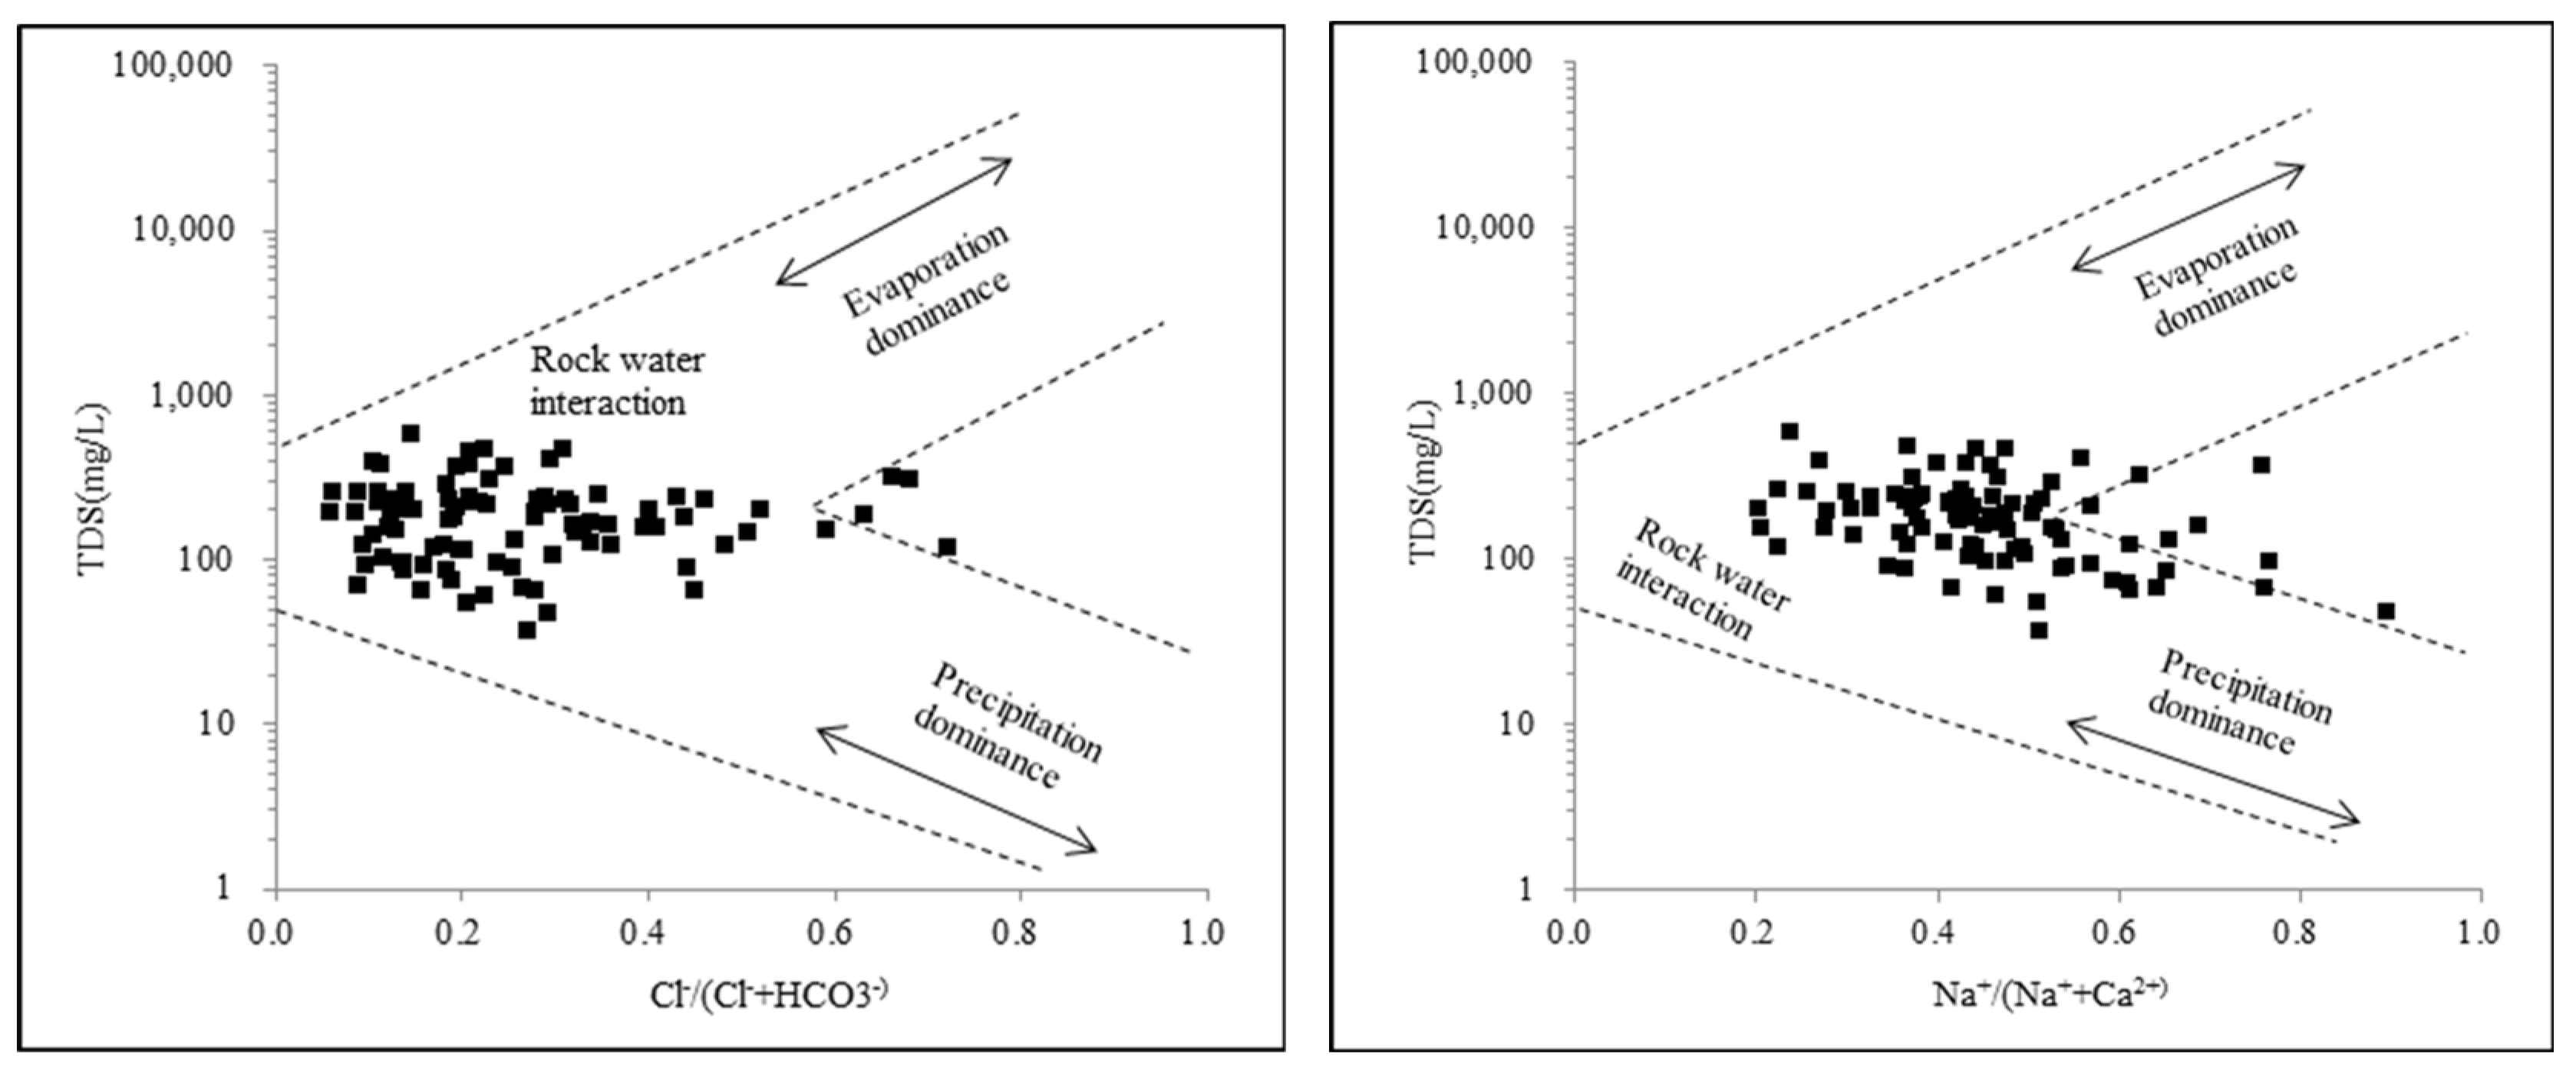
Gibbs diagrams can be utilized to qualitatively determine the hydrochemical evolution process controlled by atmospheric precipitation, evaporation, and rock weathering, which were originally drawn using surface water samples [
13]. If Gibbs diagrams are used to analyze groundwater, the outlines of Gibbs diagrams should be reconsidered [
19]. As shown in
Figure 5, the ratio of Na
+/(Na
+ + Ca
2+) ranged from 0.2 to 0.89, whereas the Cl
−/(Cl
− + HCO
3−) anion weight ratios ranged from 0.05 to 0.72. From the distribution of groundwater samples, most of the collected samples were located in the central area of the Gibbs diagram, indicating that the chemical composition of groundwater in the study area was mainly dominated by water–rock interaction. Besides, the increase in the ratio of Na
+/(Na
+ + Ca
2+) implied that cation exchange also impacts groundwater hydrochemistry [
20].
3.3.2. Hydrogeochemical Processes
To further analyze the source of chemical components of shallow groundwater, the ratio graphs of ions are used to determine the origins of solutes and hydrochemical processes [
21].
The ratio of Na
+ + K
+/Cl
− has been widely used to study the source of Na
+ and K
+. If the ratio of (Na
+ + K
+)/Cl
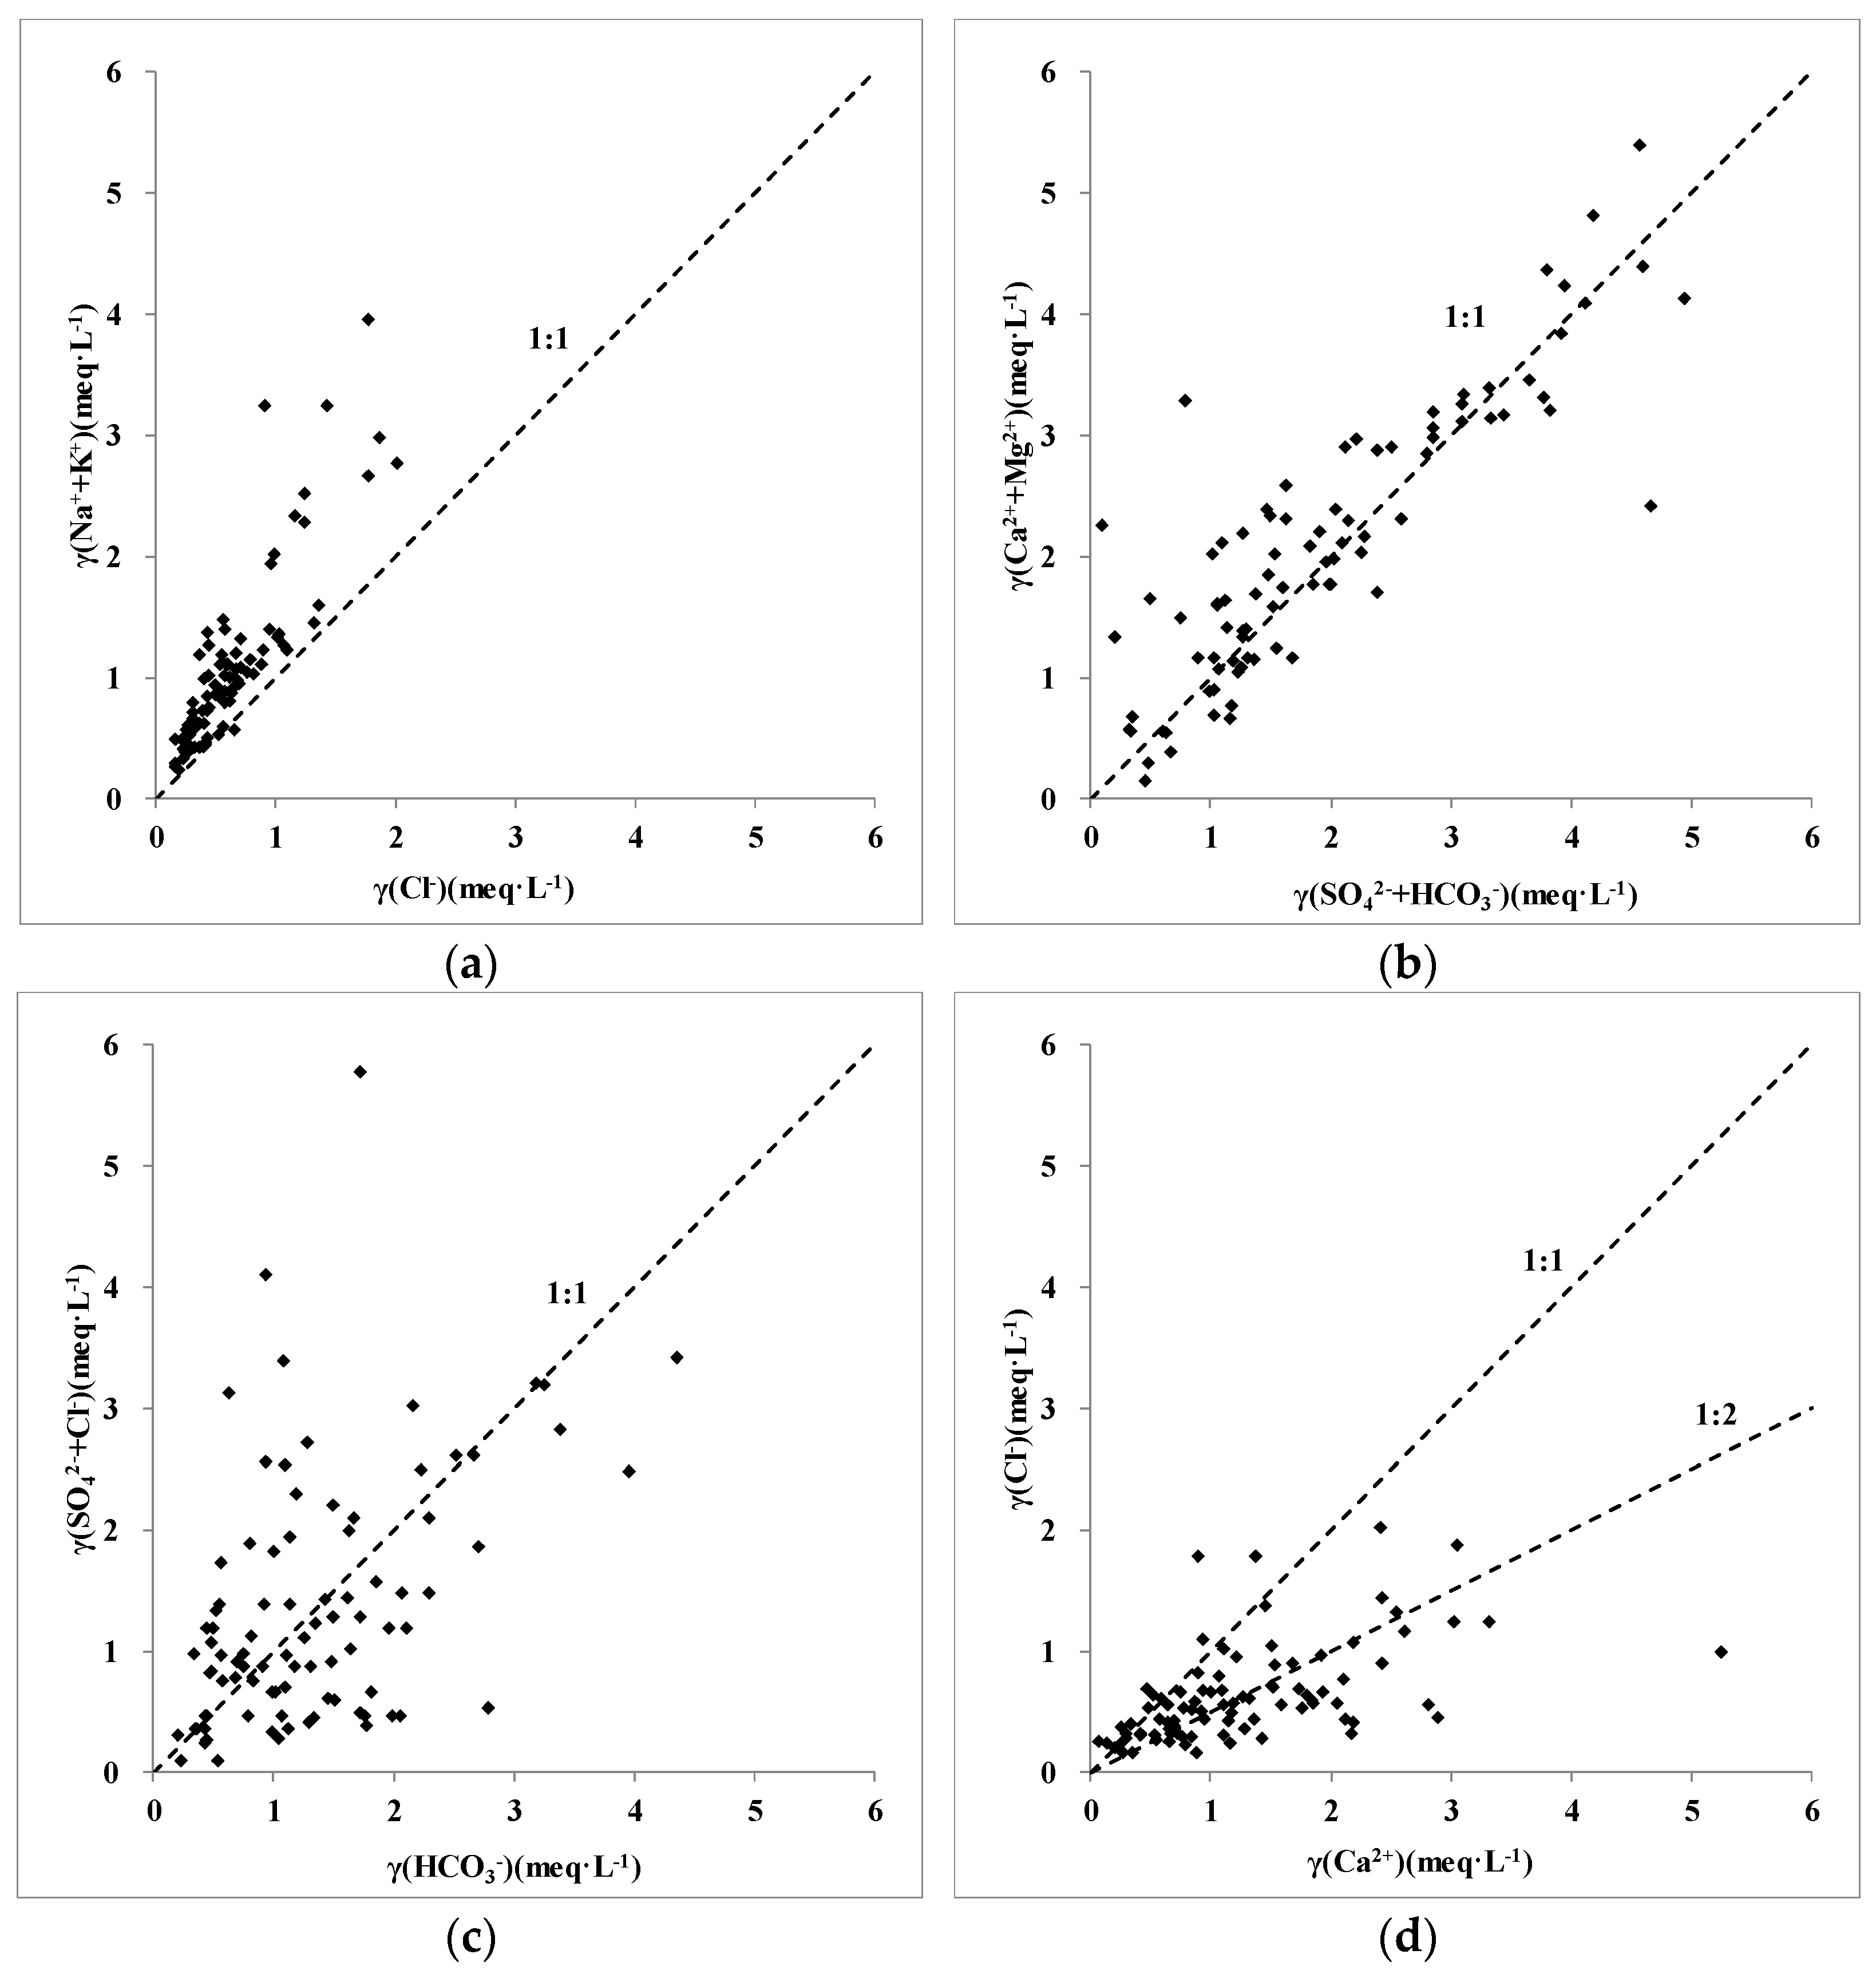
− is greater than 1, it indicates that hydrochemistry is mainly influenced by the dissolution of halite. Otherwise, the dissolution of silicate drives the groundwater hydrochemistry of the region.
Figure 6a shows that almost all samples laid above the line (Na
+ + K
+: Cl
− ratios varied from 0.86 to 3.59), indicating that Na
+ and K
+ originate mainly from the dissolution of halite.
A ratio of (Ca
2+ + Mg
2+)/(HCO
3− + SO
42−) can be used to reflect the dissolution of carbonate and sulfate in groundwater. If the ratio of (Ca
2+ + Mg
2+)/(HCO
3− + SO
42−) is greater than 1, it indicates that Ca
2+ and Mg
2+ originate from the dissolution of carbonate. Otherwise, it means that Ca
2+ and Mg
2+ originate from the dissolution of silicate and evaporite. As it can be seen in
Figure 6b, approximately 57.77% of the samples laid above the 1:1 line, indicating that the dissolution of carbonate was the predominant processes of groundwater. Meanwhile, the dissolution of silicate and evaporite also occurred.
A ratio of (SO
42− + Cl
−)/(HCO
3−) could be used to determine the main source of SO
42− and Cl
−. If the ratio of (SO
42− + Cl
−)/(HCO
3−) is greater than 1, it indicates that the chemical composition of groundwater is influenced by evaporite. Conversely, that is affected by carbonate. As shown in
Figure 6c, most of the water samples were on both sides of the 1:1 line, and almost 54% samples laid above the line, and 46% samples laid below the 1:1 line, indicating that the dissolution of carbonate and evaporite were the predominant processes of groundwater in the region.
The ratio of Ca
2+/Mg
2+ has been widely used to study the dissolution of major minerals [
22]. The relationship between Ca
2+ and Mg
2+ is shown in
Figure 6d. Most samples laid above the 1:2 relationship line, indicating that groundwater hydrochemistry was affected by the dissolution of silicate. However, approximately 24.4% of the samples were located between the 1:1 and the 1:2 line, suggesting that the dissolution of calcite also occurred.
3.3.3. Ion Exchange
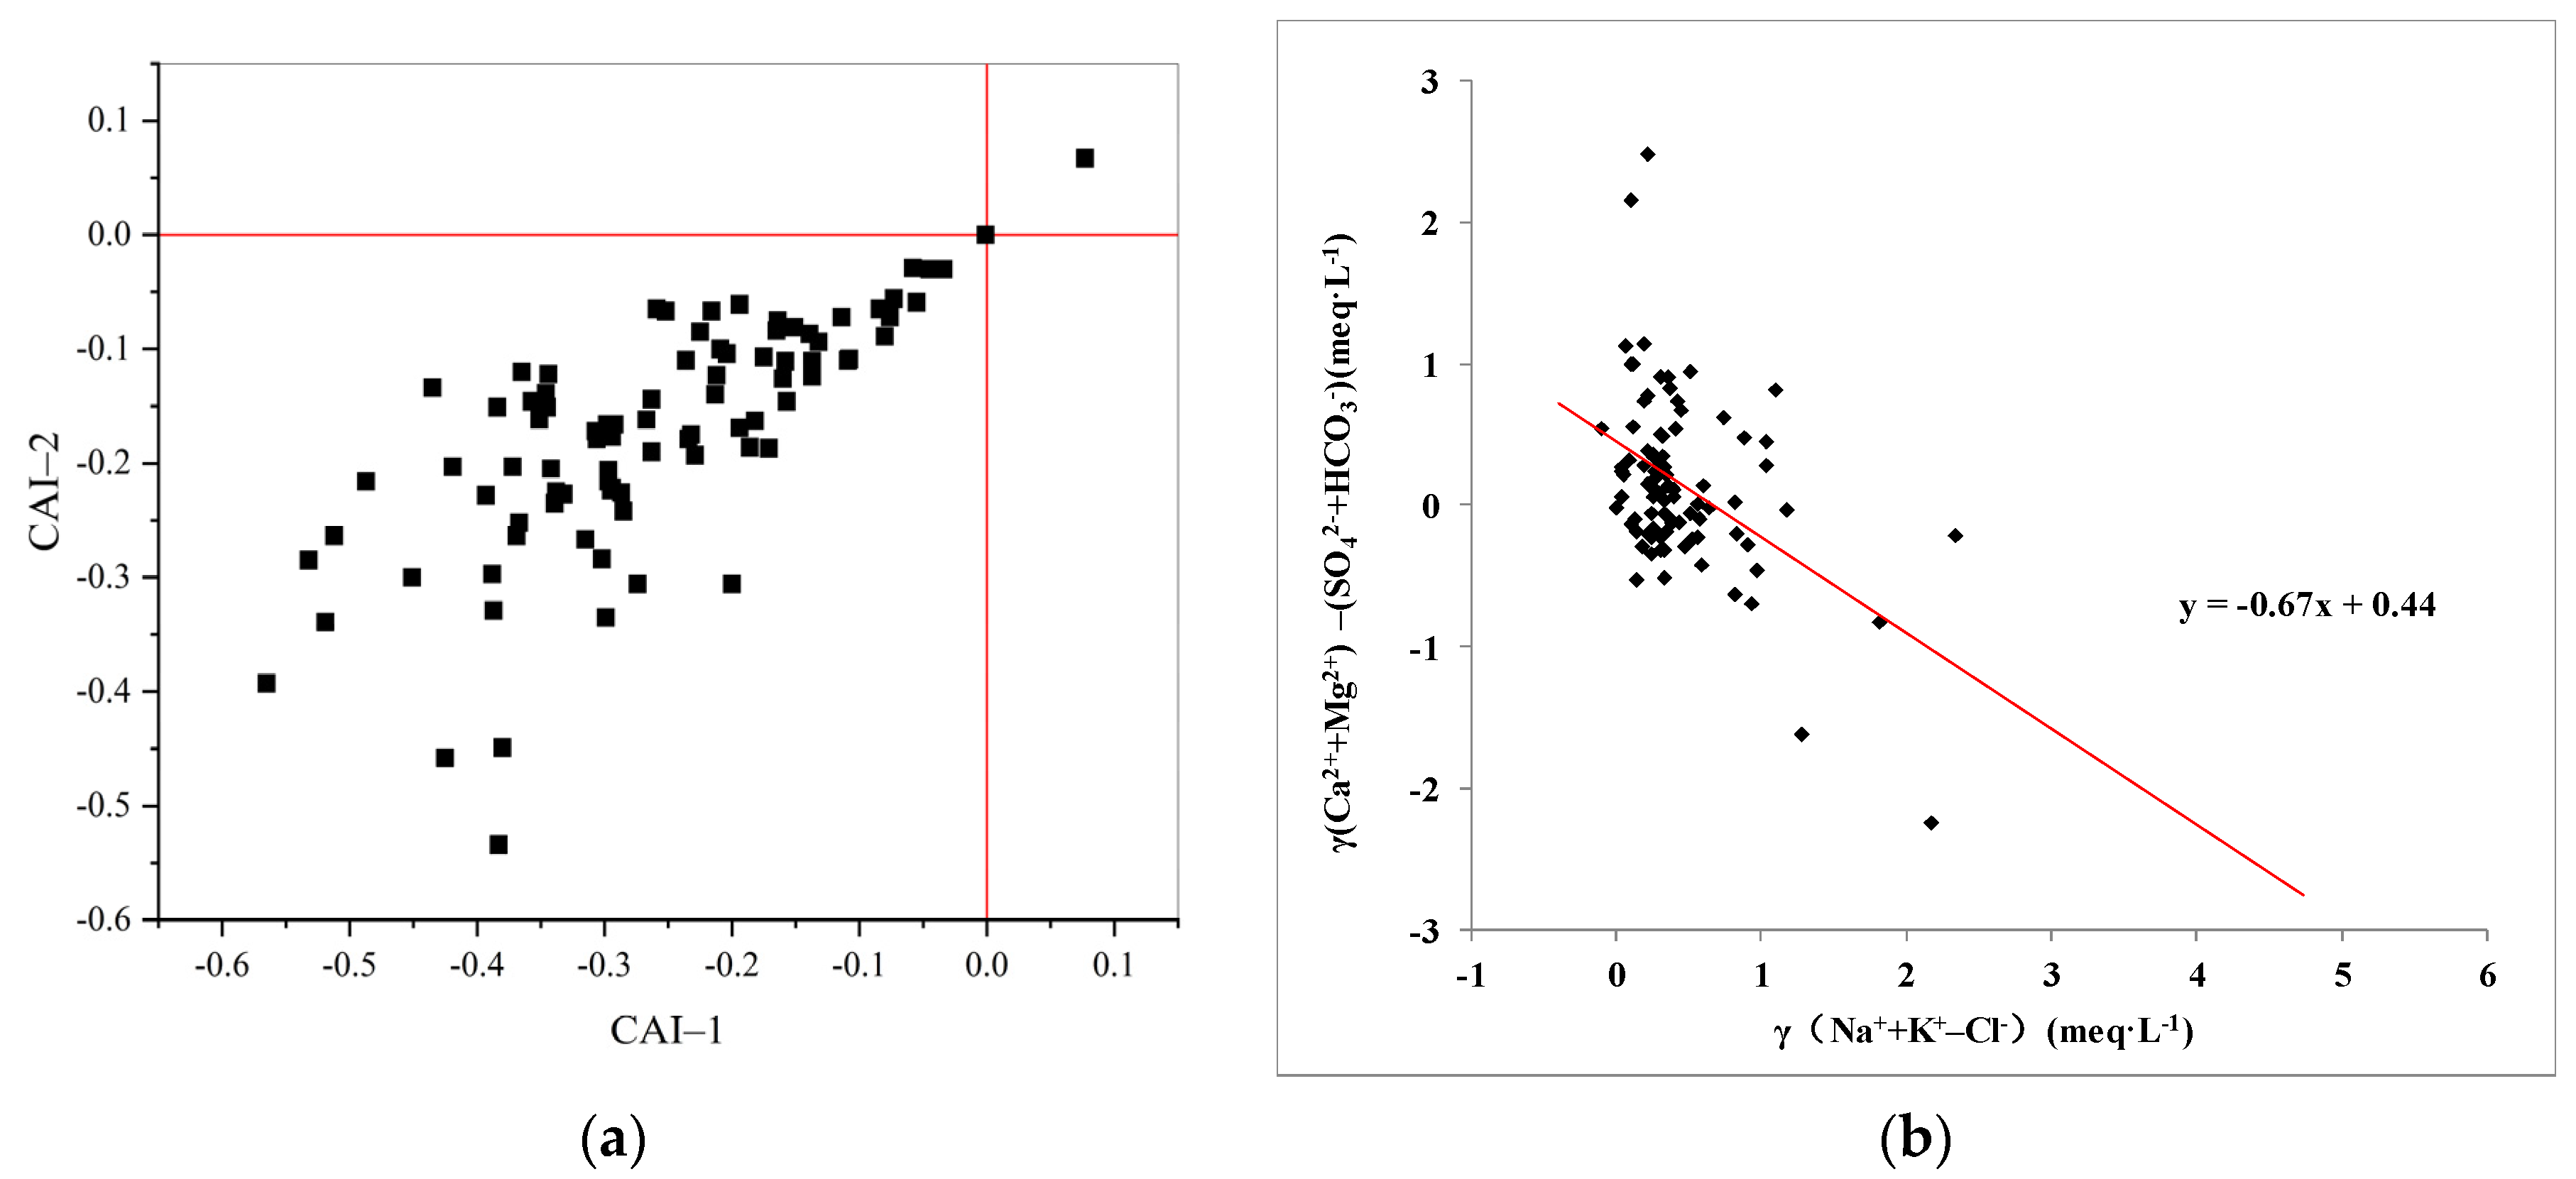
The Chlor Alkaline Indices (CAI) are applied to characterize the intensity of ion exchange during the chemical evolution of groundwater [
23]. CAI-I and CAI-II are negative when Na
+ or K
+ exchange Ca
2+ or Mg
2+ in the groundwater. However, CAI is positive if reverse ion exchange occurs. As shown in
Figure 7, most of the groundwater samples showed negative values for CAI, indicating Ca
2+ and Na
+ had an ion exchange effect in groundwater. In addition, the ratio of (Na
+ + K
+ − Cl
−)/(Ca
2+ +Mg
2+ − HCO
3− +SO
42−) has been widely used to analyze the possible role of ion exchange in groundwater. Moreover, the water samples have a better correlation following the line, indicating that cation exchange has an important influence on groundwater hydrochemistry in the study area.
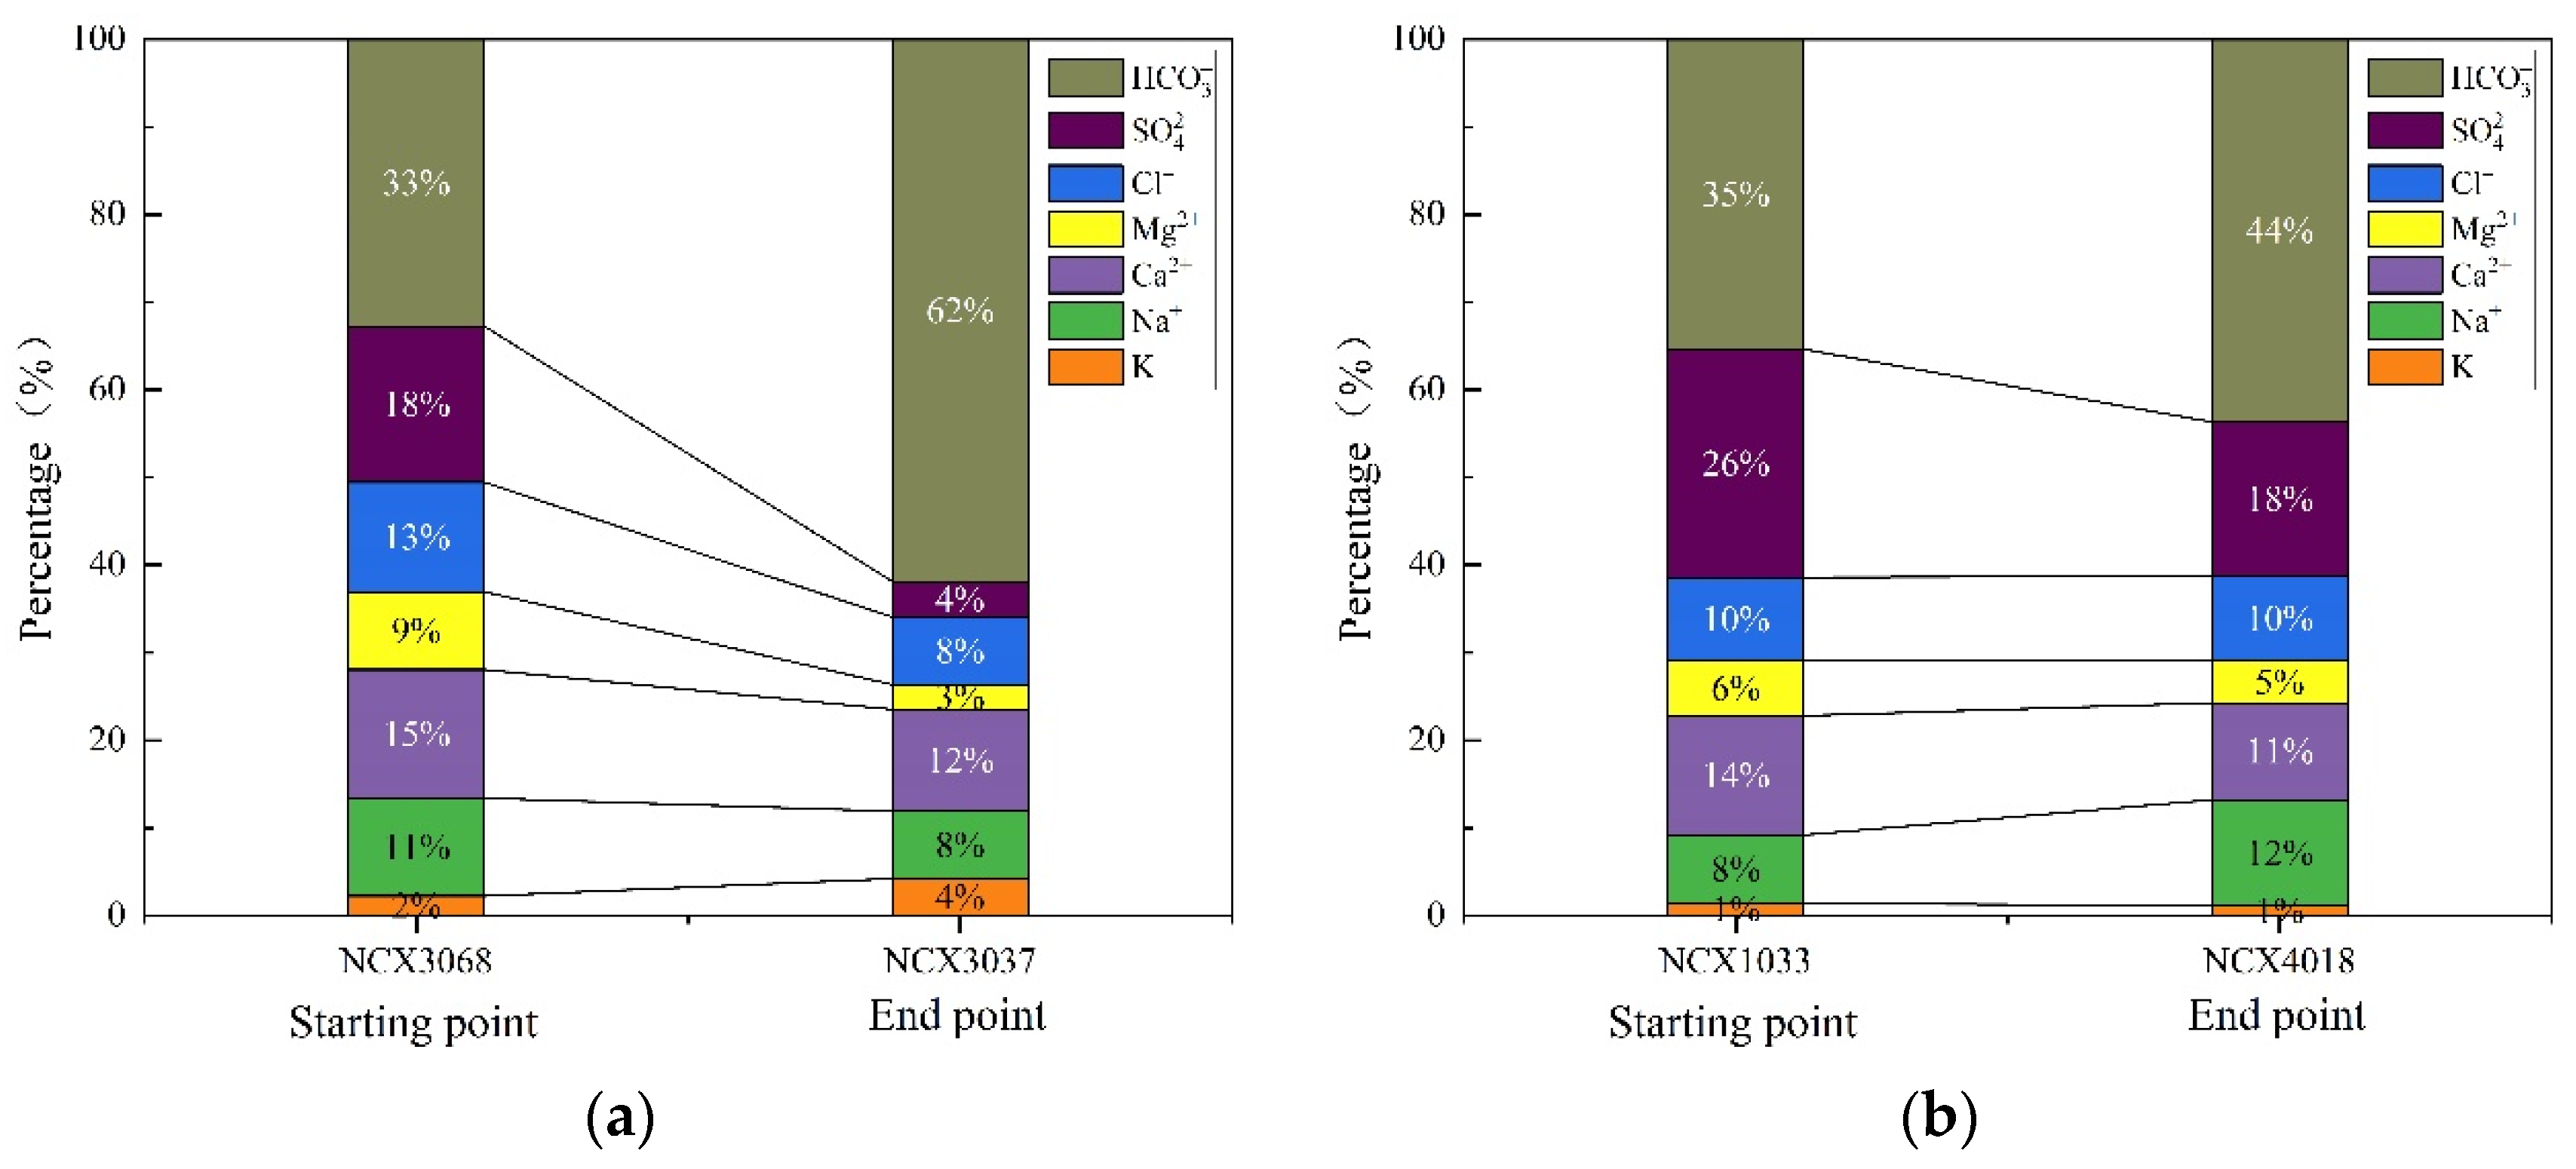
3.4. Inverse Geochemical Modeling
PHREEQC software can quantitatively simulate water–rock interactions under the influence of various natural processes and anthropogenic activities [
24]. In the current study, two flow paths were selected for simulation along the groundwater flow direction, path 1 (NCX3068
→NCX3037) and path 2 (NCX1033
→NCX4018).
The “possible mineral phases” are the basis and key to determine the possible reactions along the flow path. Considering the lithology of the strata, diagenetic mineral characteristics of aquifer media, and the hydrochemical analysis results in the study area, calcite, dolomite, sylvite, gypsum, and halite were selected as the main mineral phases for the inverse hydrogeochemical simulation in this work. Since the groundwater system is in an open state, CO2(g) is regarded as a “possible mineral phase”.
The saturation index of main minerals of in groundwater were calculated using PHREEQC. The results of the saturation indices are shown in
Table 2. In particular, the value of SI
CO2(g) was calculated by CO
2 partial pressure, and the formula is SI
CO2(g) = log10(P
CO2). P
CO2 is the partial pressure (atm) calculated using activities in the aqueous phase [
16]. It can be seen from
Table 2, the saturation indices of dolomite, calcite, sylvite, gypsum, and halite were negative, indicating that all these minerals have not reached the saturation state. The unsaturated degree of calcite and dolomite along flow path 1 is obviously alleviated. Halite and sylvite along flow path 2 also show a similar change trend. Thus, the cation exchange between Na
+ and Ca
2+ occurred during mineral dissolution. Specifically, calcium ion from the calcite and gypsum dissolved into the water and then underwent exchange with Na
+ absorbed on the rock’s surface. The Na
+ from the rock surface dissolved into the water, and calcium ion was adsorbed into the rock surface. This can be concluded from the change of ion concentration along the flow path [
25] (
Figure 8).
The mole transfer of different minerals along groundwater flow paths was calculated by the inverse modeling, and the uncertainty coefficient of model was set to 0.05. The results are summarized in
Table 3. The amount of the dissolved gypsum, calcite, dolomite, halite, and sylvite mineral phases along flow path 1 is 0.1157, 0.8789, 0.4096, 1.571, 0.5755, and 3.709 mmol/L, respectively. Moreover, the amount of the calcite, dolomite, and halite mineral that dissolved along flow path 2 is 0.11, 0.029, and 0.9835 mmol/L, respectively, and precipitated gypsum is 0.053 mmol/L.
The dissolution of CO
2 decreased the pH of water, promoting the dissolution of carbonates [
26]. As a result of calcite dissolution and ion exchange, the calcium content in the water increases, which in turn leads to gypsum precipitation. It can be concluded that the cation exchange reactions that took place along flow path 2 indicated the dissolution of calcite, halite, and dolomite as the main reason for the precipitation of gypsum.
4. Conclusions
This work adopts the methods of mathematical statistics, Piper diagrams, Gibbs diagrams, ion ratios, and hydrogeochemical simulations to study the geochemical characteristics and the controlling factors of the chemical composition of groundwater in a part of the Nanchang section of the Ganfu plain. The results are as follows.
The shallow groundwater is weakly acidic, and Na+ and Ca2+ are the most dominant ions. The average concentration of cation in groundwater decreases in Ca2+ > Na+ > Mg2+ > K+. HCO3− is the most dominant anion, and that anionic concentration is in HCO3− > NO3− > SO42− > Cl−. The coefficients of variation show that Na+ and SO42− have significant variability and dispersion in space. The hydrochemical types of groundwater are mainly HCO3-Na·Ca·Mg, HCO3·Cl-Na·Ca·Mg, and HCO3-Na·Ca.
The main controlling factors of groundwater hydrochemistry are water–rock interactions. Na+ and K+ mainly originate from the dissolution of halite. Ca2+ and Mg2+ are mainly controlled by carbonate dissolution, while the main anions come from the dissolution of evaporite and carbonate.
According to inverse geochemical modeling results, the evolution of groundwater is affected by the dissolution and precipitation of the mineral phase and cation exchange. And the saturation indices of dolomite, calcite, anhydrite, gypsum, and halite are negative, indicating that these minerals in groundwater are unsaturated. The unsaturated degree of calcite and dolomite along flow path 1 is alleviated. Halite and sylvite along flow path 2 also show a similar change trend. Thus, the cation exchange between Na+ and Ca2+ occurred along the path. Moreover, the Na+ from the rock surface dissolved into the water, and the calcium ion was adsorbed into the rock surface.
Author Contributions
Methodology, Q.M.; software, Q.M.; writing—original draft preparation, Q.M.; project administration, W.G.; formal analysis, F.T. All authors have read and agreed to the published version of the manuscript.
Funding
The research work described herein was funded by a multi-element urban geological survey project of Nanchang city, Nanjing Center, China Geological survey (No: DD20189240).
Institutional Review Board Statement
Not applicable.
Informed Consent Statement
Written informed consent has been obtained from the patient(s) to publish this paper.
Data Availability Statement
Not applicable.
Acknowledgments
We appreciate the support from Changjian Chen of School of Water Resources & Environmental Engineering, East China University of Technology. We also thank two anonymous reviewers for their helpful comments and suggestions which have led to significant improvement of this paper.
Conflicts of Interest
The authors declare no conflict of interest.
References
- Díaz-Alcaide, S.; Martínez-Santos, P. Advances in groundwater potential mapping. Hydrogeol. J. 2019, 27, 2307–2324. [Google Scholar] [CrossRef]
- Abbasnia, A.; Yousefi, N.; Mahvi, A.H.; Nabizadeh, R.; Radfard, M.; Yousefi, M.; Alimohammadi, M. Evaluation of groundwater quality using water quality index and its suitability for assessing water for drinking and irrigation purposes: Case study of Sistan and Baluchistan province (Iran). Hum. Ecol. Risk Assess. Int. J. 2018, 25, 988–1005. [Google Scholar] [CrossRef]
- Xing, L.T.; Huang, L.X.; Hou, X.Y.; Yang, L.Z.; Chi, G.Y.; Xu, J.X.; Zhu, H.H. Groundwater hydrochemical zoning in inland plains and its genetic mechanisms. Water 2018, 10, 752. [Google Scholar] [CrossRef] [Green Version]
- Rao, N.S. Spatial control of groundwater contamination, using principal component analysis. J. Earth Syst. Sci. 2014, 123, 715–728. [Google Scholar] [CrossRef] [Green Version]
- Li, P.Y.; Qian, H.; Wu, J.H.; Ding, J. Geochemical modeling of groundwater in southern plain area of Pengyang County, Ningxia, China. Water Sci. Eng. 2010, 3, 282–291. [Google Scholar]
- Sivakarun, N.; Udayaganesan, P.; Chidambaram, S.; Venkatramanan, S.; Prasanna, M.V.; Pradeep, K.; Panda, B. Factors determining the hydrogeochemical processes occurring in shallow groundwater of coastal alluvial aquifer, India. Geochemistry 2020, 80, 125623. [Google Scholar] [CrossRef]
- Osta, M.E.; Masoud, M.; Ezzeldin, H. Assessment of the geochemical evolution of groundwater quality near the El Kharga Oasis, Egypt using NETPATH and water quality indices. Environ. Earth Sci. 2020, 79, 56. [Google Scholar] [CrossRef]
- Liu, J.T.; Cai, W.T.; Cao, Y.T.; Cai, Y.M.; Bian, C.; Lü, Y.G.; Chen, Y.M. Hydrochemical characteristics of groundwater and the origin in alluvial-proluvial fan of Qinhe River. Huan Jing Ke Xue= Huanjing Kexue 2018, 39, 5428–5439. [Google Scholar] [PubMed]
- Ma, Q.; Jia, J.; Tian, F.; Lei, T.; Chen, C. Numerical Simulation of Groundwater Flow of Emergency Water Source in Nanchang City. In Proceedings of the 2nd International Symposium on Architecture Research Frontiers and Ecological Environment (ARFEE 2019), Guilin, China, 20–22 December 2019; EDP Sciences: Les Ulis, France, 2020; Volume 143, p. 02041. [Google Scholar]
- Baird, R.B.; Eaton, A.D.; Rice, E.W. Standard Methods for the Examination of Water and Wastewater, 23rd ed.; American Public Health Association, American Water Works Association, Water Environment Federation: Denver, CO, USA, 2017. [Google Scholar]
- Ren, X.F.; Li, P.Y.; He, X.D.; Su, F.M.; Elumalai, V. Hydrogeochemical Processes Affecting Groundwater Chemistry in the Central Part of the Guanzhong Basin, China. Arch. Environ. Contam. Toxicol. 2021, 80, 74–91. [Google Scholar] [CrossRef] [PubMed]
- Piper, A.M. A graphical procedure in the geochemical interpretation of water analysis. Trans. Am. Geophys. Union 1944, 25, 914–928. [Google Scholar] [CrossRef]
- Gibbs, R.J. Mechanisms controlling world water chemistry. Science 1970, 170, 1088–1090. [Google Scholar] [CrossRef] [PubMed]
- Parkhurst, D.L.; Appelo, C.A.J. Description of Input and Examples for PHREEQC Version 3—A Computer Program for Speciation, Batch-Reaction, One-Dimensional Transport, and Inverse Geochemical Calculations; U.S. Geological Survey Techniques and Methods: Reston, Virginia, 2013; Chapter A43; p. 497. [Google Scholar]
- Rockware AqQA Software, 2011; Version AQC10664. Available online: www.rockware.com(accessed on 3 March 2020).
- WHO. Guidelines for Drinking-Water Quality. In Recommendations, 3rd ed.; World Health Organization: Geneva, Switzerland, 2006; Volume 1. [Google Scholar]
- Appelo, C.A.J.; Postma, D. Geochemistry, Groundwater and Pollution, 2nd ed.; CRC Press, Taylor & Francis Group, A.A. Balkema Publishers: New York, NY, USA, 2005. [Google Scholar]
- Zhang, Y.; Xu, M.; Li, X.; Qi, J.; Zhang, Q.; Guo, J.; Yu, L.; Zhao, R. Hydrochemical characteristics and multivariate statistical analysis of natural water system: A case study in Kangding County, Southwestern China. Water 2018, 10, 80. [Google Scholar] [CrossRef] [Green Version]
- Marandi, A.; Shand, P. Groundwater chemistry and the Gibbs Diagram. Appl. Geochem. 2018, 97, 209–212. [Google Scholar] [CrossRef]
- Wu, C.; Wu, X.; Qian, C.; Zhu, G. Hydrogeochemistry and groundwater quality assessment of high fluoride levels in the Yanchi endorheic region, northwest China. Appl. Geochem. 2018, 98, 404–417. [Google Scholar] [CrossRef]
- Mostaza-Colado, D.; Carreño-Conde, F.; Rasines-Ladero, R.; Iepure, S. Hydrogeochemical characterization of a shallow alluvial aquifer: 1 baseline for groundwater quality assessment and resource management. Sci. Total Environ. 2018, 639, 1110–1125. [Google Scholar] [CrossRef] [PubMed]
- Askri, B. Hydrochemical processes regulating groundwater quality in the coastal plain of Al Musanaah, Sultanate of Oman. J. Afr. Earth Sci. 2015, 106, 87–98. [Google Scholar] [CrossRef]
- Schoeller, H. Qualitative Evaluation of Groundwater Resources. In Methods and Techniques of Groundwater Investigation and Development; Water Resources Series No. 33; Unite Nation: New York, NY, USA, 1967; pp. 44–52. [Google Scholar]
- Yu, D.; Zhou, J.L.; Zhang, J.; Sun, Y.; Zeng, Y.Y. Hydrogeochemistry and evolution of iron and manganese in groundwater in Kashgar, Xinjiang. Acta Sci. Circumst. 2021, 41, 2169–2181. [Google Scholar]
- Appelo, C.A.J.; Parkhurst, D.L. Calculating Cation Exchange with PHREEQC (Version 2). Dr C.A.J. Appelo –HYDROCHEMICAL CONSULTANT 2002. Available online: https://www.hydrochemistry.eu/pub/ap_pa02.pdf (accessed on 15 May 2021).
- Ibrahim, K.M.; El-Naqa, A.R. Inverse geochemical modeling of groundwater salinization in Azraq Basin, Jordan. Arab. J. Geosci. 2018, 11, 237. [Google Scholar] [CrossRef]
| Publisher’s Note: MDPI stays neutral with regard to jurisdictional claims in published maps and institutional affiliations. |
© 2022 by the authors. Licensee MDPI, Basel, Switzerland. This article is an open access article distributed under the terms and conditions of the Creative Commons Attribution (CC BY) license (https://creativecommons.org/licenses/by/4.0/).


