Article

Effect of Structural Parameters and Operational Characteristic Analysis on Ejector Used in Proton Exchange Membrane Fuel Cell

School of Mechanical Engineering, Beijing Institute of Technology, Beijing 100081, China
*
Author to whom correspondence should be addressed.
Sustainability 2022, 14(15), 9205; https://doi.org/10.3390/su14159205
Submission received: 16 June 2022 / Revised: 13 July 2022 / Accepted: 25 July 2022 / Published: 27 July 2022
(This article belongs to the Special Issue Hydrogen as a Sustainable Energy: Current Status and Future Prospect)

Abstract

:
A hydrogen ejector for PEMFC system is designed based on thermodynamic theory with considering the influence of water vapor. A CFD model is built in order to optimize the geometric parameters, comprehensively considering performance of different operating conditions. Moreover, effect of structural parameters and operating conditions on PEMFC ejector performance was studied using single-factor and multi-factor analysis methods. The single-factors analysis results show that the nozzle throat diameter, nozzle divergent angle (A), nozzle throat length (B), nozzle exit position (C), mixing tube diameter (D), mixing tube length (E) and are crucial structural parameters that affect the performance of the ejector significantly. Multi-factors analysis is carried to gain the sensitivity of the crucial parameters and further optimize performance of the ejector on PEMFC. For low current (110 A), middle current (275 A), and high current (412.5 A), the order of influence of performance were (D > A > B > C > E), (D > A > B> E > C), and (D > C > E > B > A), respectively. The optimized ejector by multi-factor analysis method has a better performance than one optimized by single-factor. This study may provide a new way of thinking for optimization of structural parameters of any PEMFC ejector with various operating condition.

1. Introduction

Proton exchange membrane fuel cell (PEMFC) is a very promising energy conversion technology, its energy conversion process is not restricted by the Carnot cycle. It has the advantages of high efficiency, low emissions, strong distribution and modularity. However, fuel cells still have many problems in practical applications, such as membrane drying, water flooding, cold start, cost and durability [1]. To ensure stable operation of the PEMFC stack, the stack usually uses an excess supply of hydrogen to meet the instantaneous load change demand and to bring out the liquid water that is accumulated downstream of the anode flow field [2]. However, the PEMFC system has different requirements for hydrogen supply under different working conditions. During low-load operation, the hydrogen entering stack cannot be completely consumed, and the excess hydrogen is utilized to drainage. When stack operates under medium and high loads, current rises rapidly, the demand for hydrogen also increases, which may cause hydrogen starvation, excess hydrogen is used to meet the demand for power changes [3]. An anode recirculation system is utilized to circulate anode exhaust gas, which includes unused hydrogen, water vapor and liquid water [4]. Recirculation of the hydrogen and water vapor is beneficial to improve the fuel utilization rate of the system and alleviate anode membrane drying tendency [5]. Therefore, the anode recirculation subsystem is an essential component of the fuel cell system. The ejector is a very promising type of anode recirculation subsystem device, and the other is mechanical pump [6,7]. The ejector-based anode recirculation system on PEMFC is illustrated in Figure 1. High-pressure hydrogen called the primary flow enters ejector after passing through the pressure reducing valve and pressure control module. Exhaust gas called secondary flow from anode exit is entrained by primary flow. They mix with each other in ejector under actions of moment and energy exchange. Then, the mixing gas is pressurized to the stack, and reacts to generate electricity.
Compared with the mechanical hydrogen circulation pump, it has a simple structure and no parasitic power. Ejectors require no lubrication and dynamic sealing, so they are safe and reliable [8]. However, ejectors only have good entrainment performance within a specified flow range. Therefore, structural design of the ejector is a major research field to satisfy the operation of the fuel cell. Ejectors were mainly designed by two methods, namely aerodynamic functions and thermodynamic functions. Based on numerous gas experiments, Cokojiob proposed a method for designing ejector aerodynamic functions, and summarized many theoretical formulas and empirical coefficients for ejector design [9]. Zhang established a PEMFC subsonic ejector thermodynamic model, they studied the relationship between the primary flow rate and the nozzle area, and designed a low-power stack ejector. Both of these methods can be used for the initial sizing of ejectors [10]. Similar to Zhang’s approach, Jin proposed a thermodynamics-based 1D design method, and designed a submarine PEMFC system ejector with reference to a two-dimensional iterative numerical solution, that contains moisture in the secondary flow, and verified entrainment performance through experiments [11]. Zhu introduced the two-dimensional velocity curve of the mixing tube inlet into the theoretical model of PEMFC ejector. In addition, they used the CFD results to fit the velocity index, which greatly improved the calculation speed and accuracy of the one-dimensional theoretical model [12]. Dadvar proposed a new design and selection method of ejector, and studied the correlation between stack design parameters and ejector design parameters, and summarized two important dimensionless parameters in ejector design [13].
The parameters analysis and optimization of ejector used in PEMFC were carried out by means of experiment and CFD simulation. Brunner used the two-dimensional CFD numerical calculation method to design the geometric mechanism of a variable cross-section PEMFC ejector, and verified the control algorithm by simulation and experiment [14]. Sricha used vector evaluation particle swarm algorithm to optimize the fuel cell ejector. Under a specific entrainment ratio, a set of non-dominant solutions is obtained for selecting the best area ratio and nozzle exit Mach number [15]. Maghsoodi [16] and Bai [17] combined numerical models with intelligent optimization algorithms to optimize the structure, then the optimal structures corresponding to the design condition is obtained. Nikiforow [18] studied the effects of different turbulence models on ejector performance, and carried out experiments. The structure and operating conditions are also optimized. Feng [19] and Lakzian [20] compared the effects on entrainment performance of convergent nozzles and convergent-divergent nozzles, and found that the convergent nozzles had better performance and could improve entrained fluid flow. Yin [21] studied the influence of structural parameters on the entrainment ratio, and optimally designed an 80 kW fuel cell ejector using a 3D numerical model of the PEMFC ejector. Wang [22] explored the influence of some geometric parameters on the entrainment ratio and the effect of vapor, and optimized its structural parameters. Besagni proposed a method of combining lumped parameters with CFD, which accurately evaluated the performance of on-design and off-design by determining the efficiency of components in different states [23,24]. Pei [25] used the CFD model combined with the anode pressure drop model to optimize the main geometric parameters based on the fuel cell usage characteristics, which is conducive to the development of a wide range of fuel cell ejectors. Yang [26] analyzed the sensitivity of the parameters of nozzle diameter, mixing chamber diameter, nozzle outlet distance, mixer length, diffuser length and diffuser angle, and optimized the ejector by considering the interaction between the two parameters. Yan [27] conducted multi-round optimization of the mixing chamber size of steam ejector, and the results showed that single-round optimization could not achieve global optimization. The optimal parameters and the corresponding maximum ER were significantly different, and the optimization sequence had an impact on the rounds to be optimized. Wu [28] conducted a single factor analysis to investigate the influence of structural parameters such as nozzle outlet diameter, distance from nozzle outlet to mixing chamber entrance and diameter of nozzle contraction section on steam ejector. Then the structure was optimized by multi-factor analysis and the sensitivity of each factor to the entrainment performance was concluded. Amin [29] applied the factorial method to the geometric optimization process of natural gas ejectors by regression calculation, considering the interaction between parameters and using the regression kriging substitute model. Nine geometric factors of the ejectors were optimized, and the entrainment ratio of the optimized design reached 19.45%.
Although many studies have been conducted on the design of ejector, there are few studies on design of ejector considering different operating conditions of PEMFC simultaneously, and few studies on the sensitivity of structural factors. In this paper, an optimizing method based on multi-case evaluation is proposed, structural design and optimization of an ejector are carried out by single-factor analysis and multi-factor analysis based on CFD method, the influence of structural parameters on performance of ejector under different operating conditions and the sensitivity of structural parameters are explored. Finally, the optimal structure of the ejector in a forklift PEMFC system is obtained. This work provides theoretical guidance for design of wide-range fuel cell ejector.

2. Ejector Structure Design

The basic structural parameters and schematic of the ejector are presented in Figure 2. The ejector includes a working nozzle, a secondary flow suction chamber, a mixing tube, and a diffuser. Ejector has two inlets and one outlet, namely primary flow inlet, secondary flow inlet and mixed flow outlet. The ejector performance is usually evaluated by entrainment ratio, which is defined as:
E R = m s m p
where, m p and m s are mass flow rates of primary flow and secondary flow, respectively.
In fuel cell system, the primary flow of ejector is pure hydrogen and the secondary flow is a mixture of water vapor and hydrogen. During the operation of the PEMFC system, the primary fluid maintains a certain pressure after the decompression and adjustment of the hydrogen from the high-pressure cylinder. The primary flow from the high-pressure hydrogen cylinder exits the nozzle outlet (Section 1 in Figure 2) at a very high velocity, then a low-pressure zone is formed in the suction chamber. The pressure in this zone is lower than the secondary flow from the stack anode outlet, the secondary flow is sucked into the ejector because of the pressure difference, and is entrained due to viscous shear force. The two fluids move into the mixing tube from Section 2 and are uniformly mixed at the mixing tube outlet (Section 3) under energy and momentum exchange. The mixing flow enters the diffuser to achieve deceleration and pressurization, then pressure reaches the stack inlet pressure requirement at ejector exit. Then, the mixing gas, including hydrogen and vapor, moves into PEMFC stack

2.1. Design Condition

The ejector design in this work is based on a forklift PEMFC system. The fuel cell operates at the different loads with different operating conditions. As presented in Table 1, load variation defines the mass flow rate, the species and the pressure of the stack. These data are derived from the calibration testing of the forklift PEMFC stack. The mass flow rate in the primary inlet is calculated by the current. In addition, the entrainment ratio is calculated by hydrogen stoichiometry ratio and the proportion of species. In addition, temperature of primary flow is the same as the ambient temperature, that is 25 °C. The temperature in secondary inlet is assumed to be the same as the stack outlet (70 °C), regardless of the effect of pipe heat dissipation.
Table 1 shows a low entrainment ratio is needed at high currents which corresponds to high load. In addition, for low current, the entrainment ratio is high. However, entrainment ability of the fixed ejector is poor under a low load, and the secondary flow cannot be entrained when current is lower. In order to ensure the recirculation of excess hydrogen under high load and widen the operating range of ejector used in PEMFC, the rated power point (412.5 A) is selected as the design condition of the ejector. In addition, the maximum primary flow inlet pressure is 8.5 bar limited by proportional valve.

2.2. Thermodynamic Theory Design Procedure

The initial dimensions of PEMFC ejector are determined based on the thermodynamic function design method, it assumes that the flow in the ejector is steady and isentropic, the flow is treated as an ideal gas. The radial velocity of the secondary flow is non-uniformly distributed, and a velocity boundary layer near the wall is considered. The primary flow and the secondary flow have the same radial pressure and temperature in ejector. The loss of flow in parts of ejector is corrected by friction loss coefficient.
For PEMFC ejector, the mass flow rate of the primary flow is the hydrogen consumption rate which is calculated by:
m p = N I 2 F M H 2
where, N is the number of single cell in PEMFC stack; I is the PEMFC stack current; F is Faraday’s constant (96,485 C mol−1); M H 2 is the molar weight of hydrogen.
The primary flow through the convergent nozzle is divided into subsonic and sonic states. The nozzle throat diameter is determined by applying the following equation:
m p = p p A t ϕ p γ p R p T p 2 γ p + 1 γ p + 1 2 ( γ p - 1 ) , M a = 1 m p = p p A t 2 ϕ p γ p [ ( p s / p p ) 2 / γ p ( p s / p p ) ( γ p + 1 ) / γ p ( γ p - 1 ) R p T p , M a < 1
where, A t is the throat area; γ p is the specific heat ratio of primary flow; T p is the temperature; ϕ p is the friction loss coefficient, ϕ p = 0.95 (from literature [12,16]); M a is Much number at nozzle throat; p p and p s is the primary and secondary pressure, respectively.
The mixing tube diameter is determined by iterative calculation at a given mass flow rate of entrained flow, which is gain with specific ER. Iteration procedure executed by using by the following equation:
m s = 2 π V p y ρ ¯ s n v R y 2 n v + 1 1 R p y R y n v + 1 n v n v R y 2 2 n v + 1 1 R p y R y 2 n v + 1 n v
where, subscript y describes properties of gas at mixing tube inlet, R p y is the equivalent radius of secondary flow at mixing tube inlet, n v is the exponent of the velocity function, ρ ¯ s is the average density of the secondary flow.
Other structural parameters are calculated using empirical formulas [9]. The initial dimensions of the ejector are presented in Table 2.
Remark. 
Detailed thermodynamic calculation formula are available in the literature [30].

3. Numerical Modeling

In this section, the CFD model building process and validation results are critically outlined. First, CFD modeling settings are introduced. Second, the grid independency results are detailed. Third, the y+ independence is compared. Finally, the experiment validation procedure is explained.

3.1. CFD Modeling and Convergence Criteria

The calculation structure in this paper is built as a two-dimensional axisymmetric domain. The parameterized structure and the mesh are created in ANSYS Workbench 19.3. ANSYS Fluent is employed to solve governing equations of ejector. Turbulence models have a significant impact on the simulation accuracy of the ejector. Numerous studies have compared the k-ε and the k-ω models with different wall treatment methods. They proved that the SST k-ω model has a smaller relative error compared with the experimental results [18,22]. Therefore, the SST model is selected in this study. The species transport model is selected to simulate a mixture of vapor and hydrogen in ejector. Selection of boundary conditions are based on fuel cell operations for hydrogen ejectors: Primary flow is satisfied with PEMFC stack generating. Therefore, primary flow selects mass flow rate as inlet condition. In addition, stack anode outlet should consider back pressure, so that the secondary flow from stack anode set as pressure inlet. Due to anode input pressure needs to reach a certain stack working value, so ejector output set as pressure outlet.
The Couple algorithm is utilized to solve the nonlinear control equations for obtaining the pressure field and the velocity field. The discrete forms of momentum, component transmission, turbulent kinetic energy and dissipation rate equations are all utilized in the second-order upwind style. Furthermore, the initialization is taken by hybrid initialization. The convergence criterion is that the residual of the energy term is less than 10−6, and the remaining residuals are less than 10−5.

3.2. Grid Independence Verification

A structured mesh grid was used in the ejector, and the grid-independent study is performed by the simulation results of five models with different mesh numbers are compared when stack operating current is 110 A as shown in Table 1. The grid independence has been verified using both global and local data. Concerning the global data, the entrainment ratio is compared in Table 3, it showed that relative deviation of entrainment ratio approaching 1% when mesh number above 153,144. Concerning the local data, Figure 3 shows diversification of center flow Mach number under different mesh number to verify internal flow characteristics. The Mach number is almost same in all locations when mesh number exceeds 153,144. Therefore, 153,144 cells were selected for subsequent calculation research in this work.

3.3. The y+ Independence

The k-ω SST needed a lower y+ value which is recommended to be less than 1. However, this value will also change as the operating conditions change. The maximum y+ of the grid used in this paper is less than 5. Comparing the results of different fine mesh grids in Table 4, it is shown that the relative deviation of ER is less than 0.1% when y+ is between 1 and 5. Concerning the local data, it was shown that the wall pressure has almost no deviation in Figure 4. Therefore, it is concluded that y+ has no noticeable impact on the performance of the ejector in this mesh number. This stems from the fact that the selected SST k-ω model uses y+ insensitive wall treatment. In addition, this article assumes that the wall is insulated, and the boundary layer does not simulate heat transfer prediction, so the near-wall mesh is not deliberately refined.

3.4. Model Validation

The structural parameters and the operating conditions of PEM fuel cell ejector are utilized to simulate and compare with experimental data which from Nikiforow’s research [18]. Primary flow is pure hydrogen while secondary flow is a mixture of hydrogen and water vapor, meaning that it is highly similar to the ejector for this work. Several numerical simulations are conducted with the primary flow pressure varying from 2.5 to 7 bar, while secondary pressure varies from 1.15 to 1.225 bar and the ejector outlet pressure is fixed with 1.25 bar. Comparisons between the simulated results and the experimental data are shown in Figure 5a. It is found that the simulated mass flow rates are highly consistent with the experimental data in terms of numerical values and trends with 1.15 bar secondary flow pressure. In addition, the simulated results of different secondary flow pressure are compared showing in Figure 5b. The deviations of ER are no more than 11% and among most of them are within 8%. Therefore, the model used in this article can be considered reliable.

4. Single-Factor Analysis of the Performance of Ejector in PEMFC

The flow field of ejector has a tremendous influence on its entrainment capacity, and the structural parameters and operating conditions are the main factors affecting the flow field. The effect of nine main structural parameters of ejector on the performance of the PEMFC ejector is studied under various PEMFC current (110 A, 275 A and 412.5 A), which represent the low, medium and high load of PEMFC output. Analysis of the effect of single structural variables under different loads is presented, and these structural parameters are optimized. The optimization objective of this research is to ensure the largest operating range of PEMFC. In detailed procedure, the entrainment ratio of high current shall exceed the requirements of PEMFC firstly, then it shall be required for the medium current, lastly the entrainment ratio under low current is required to satisfy or as close as possible to the required value.

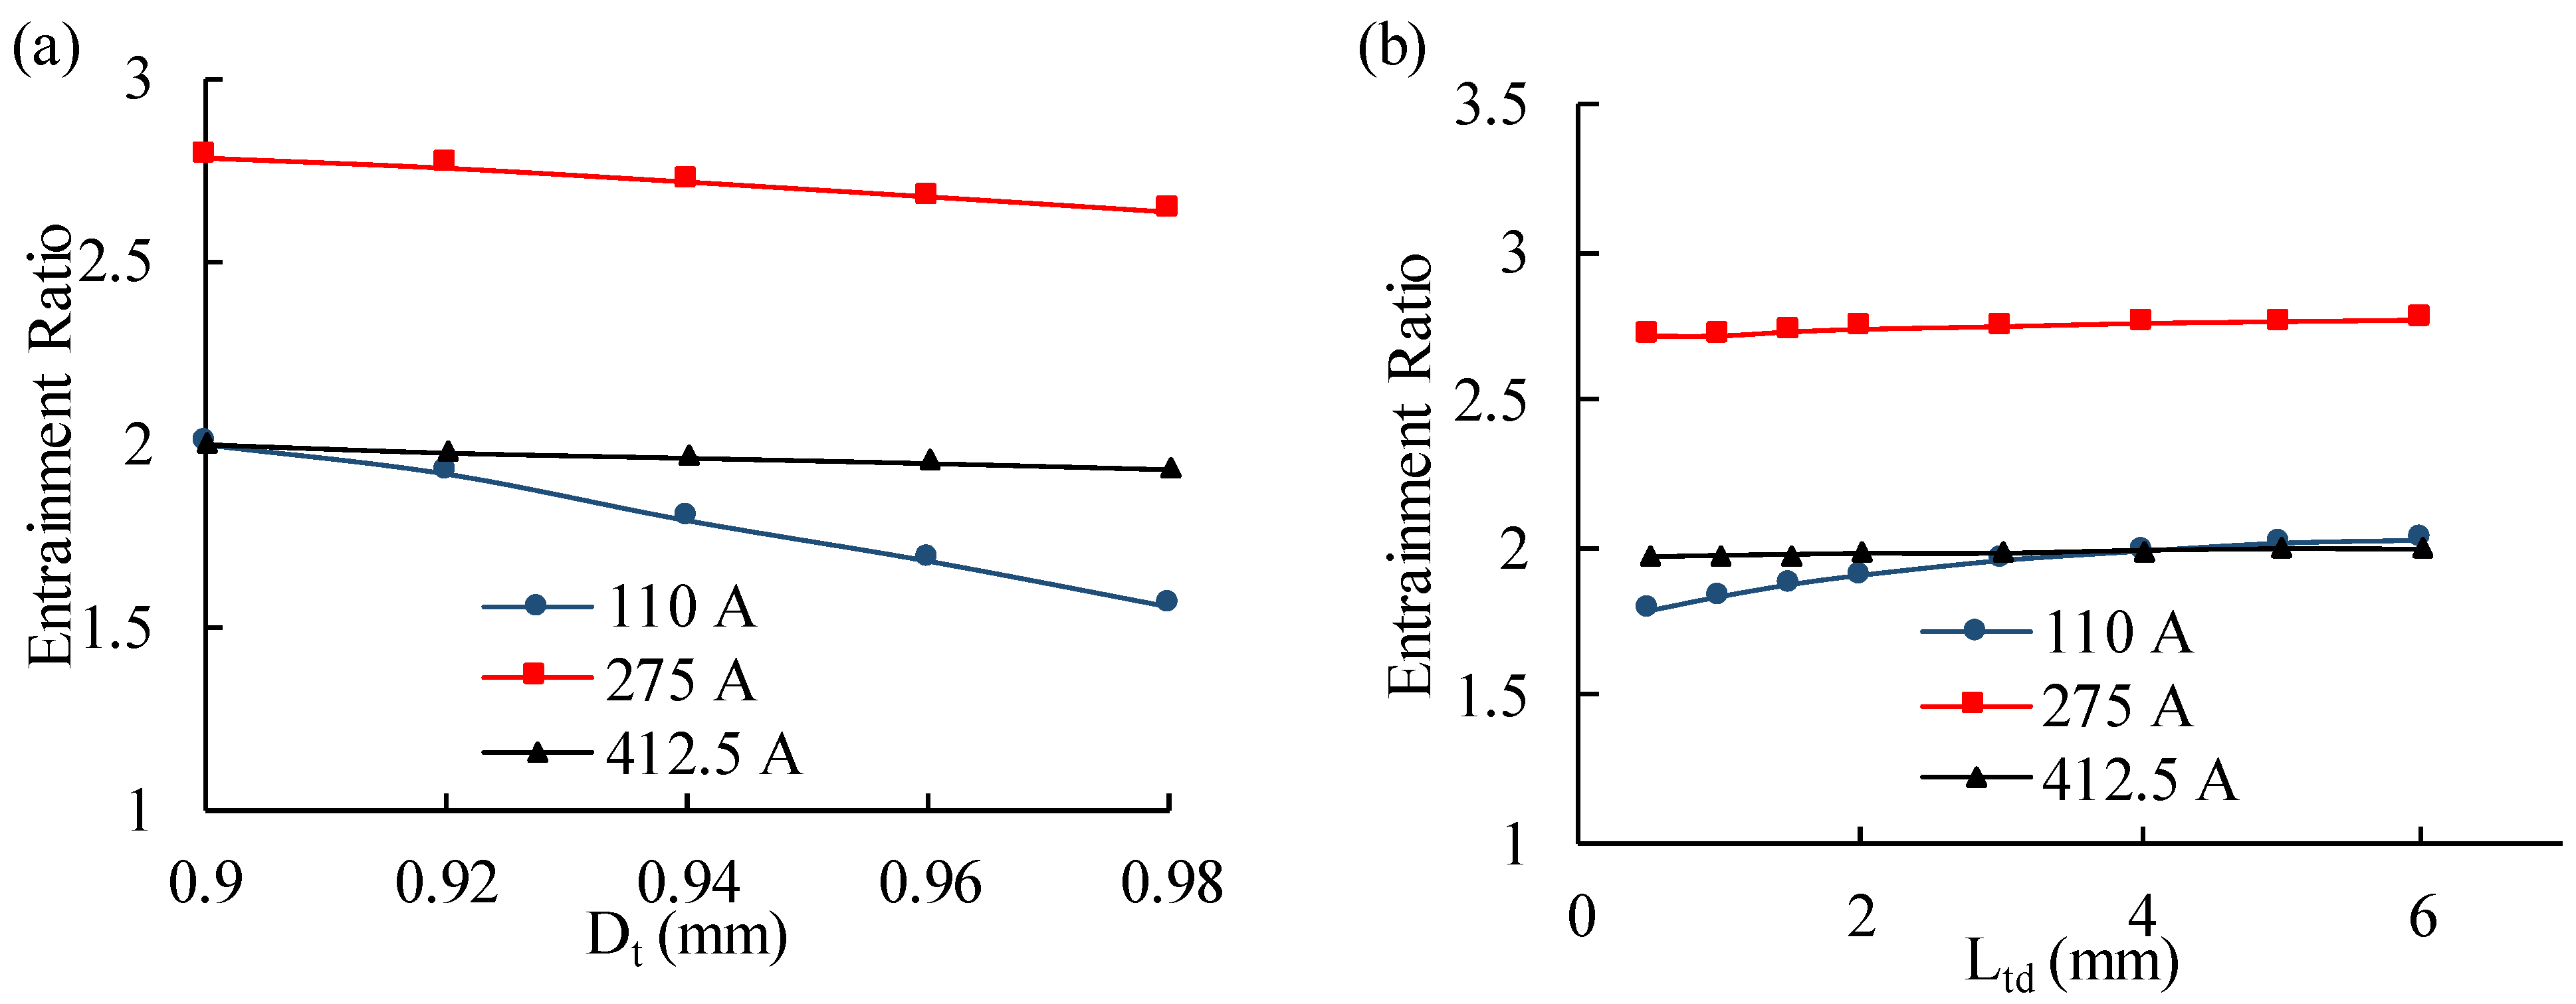
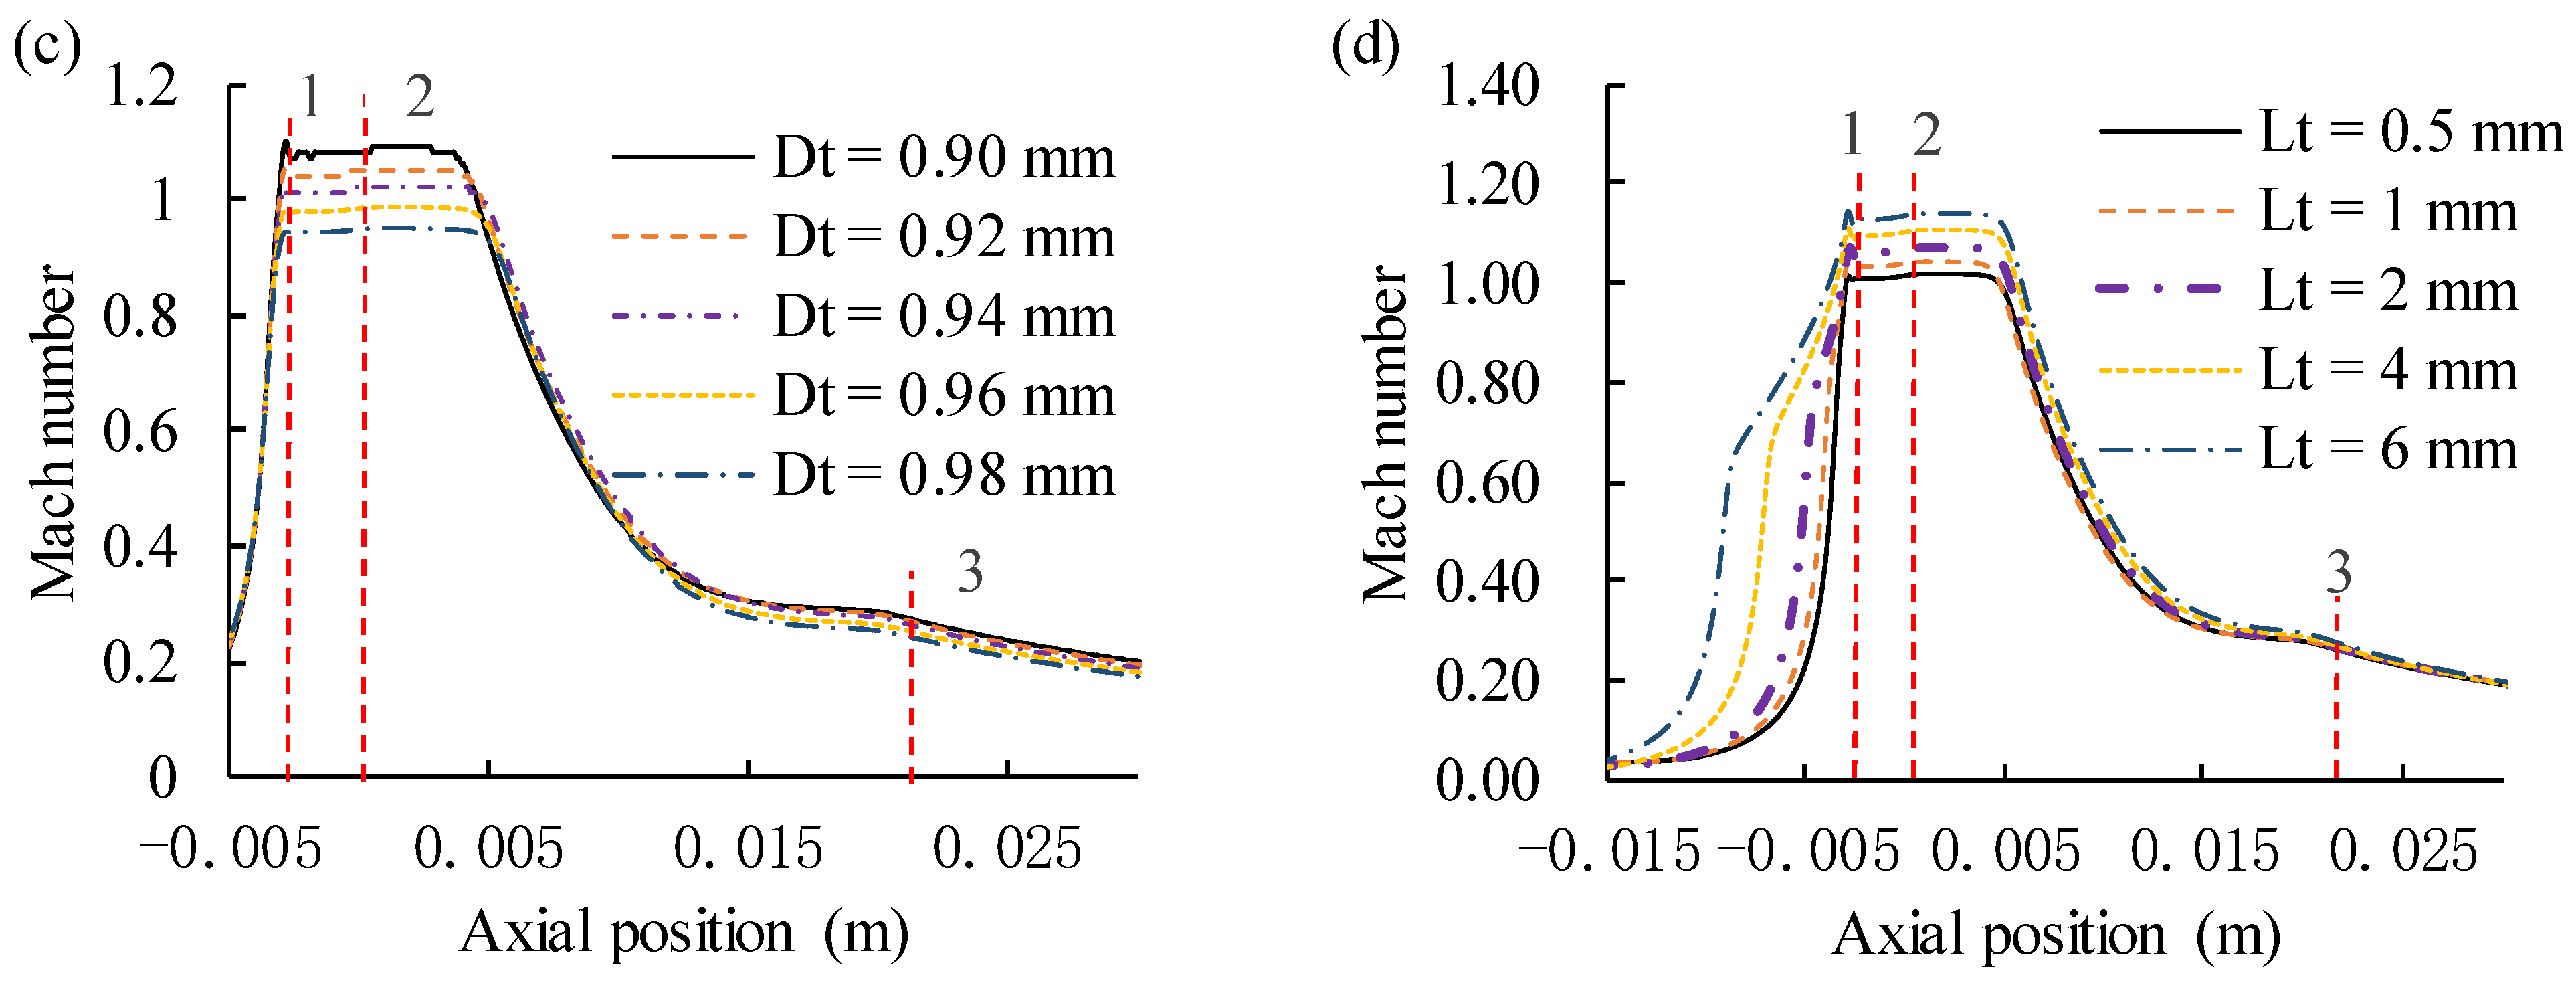
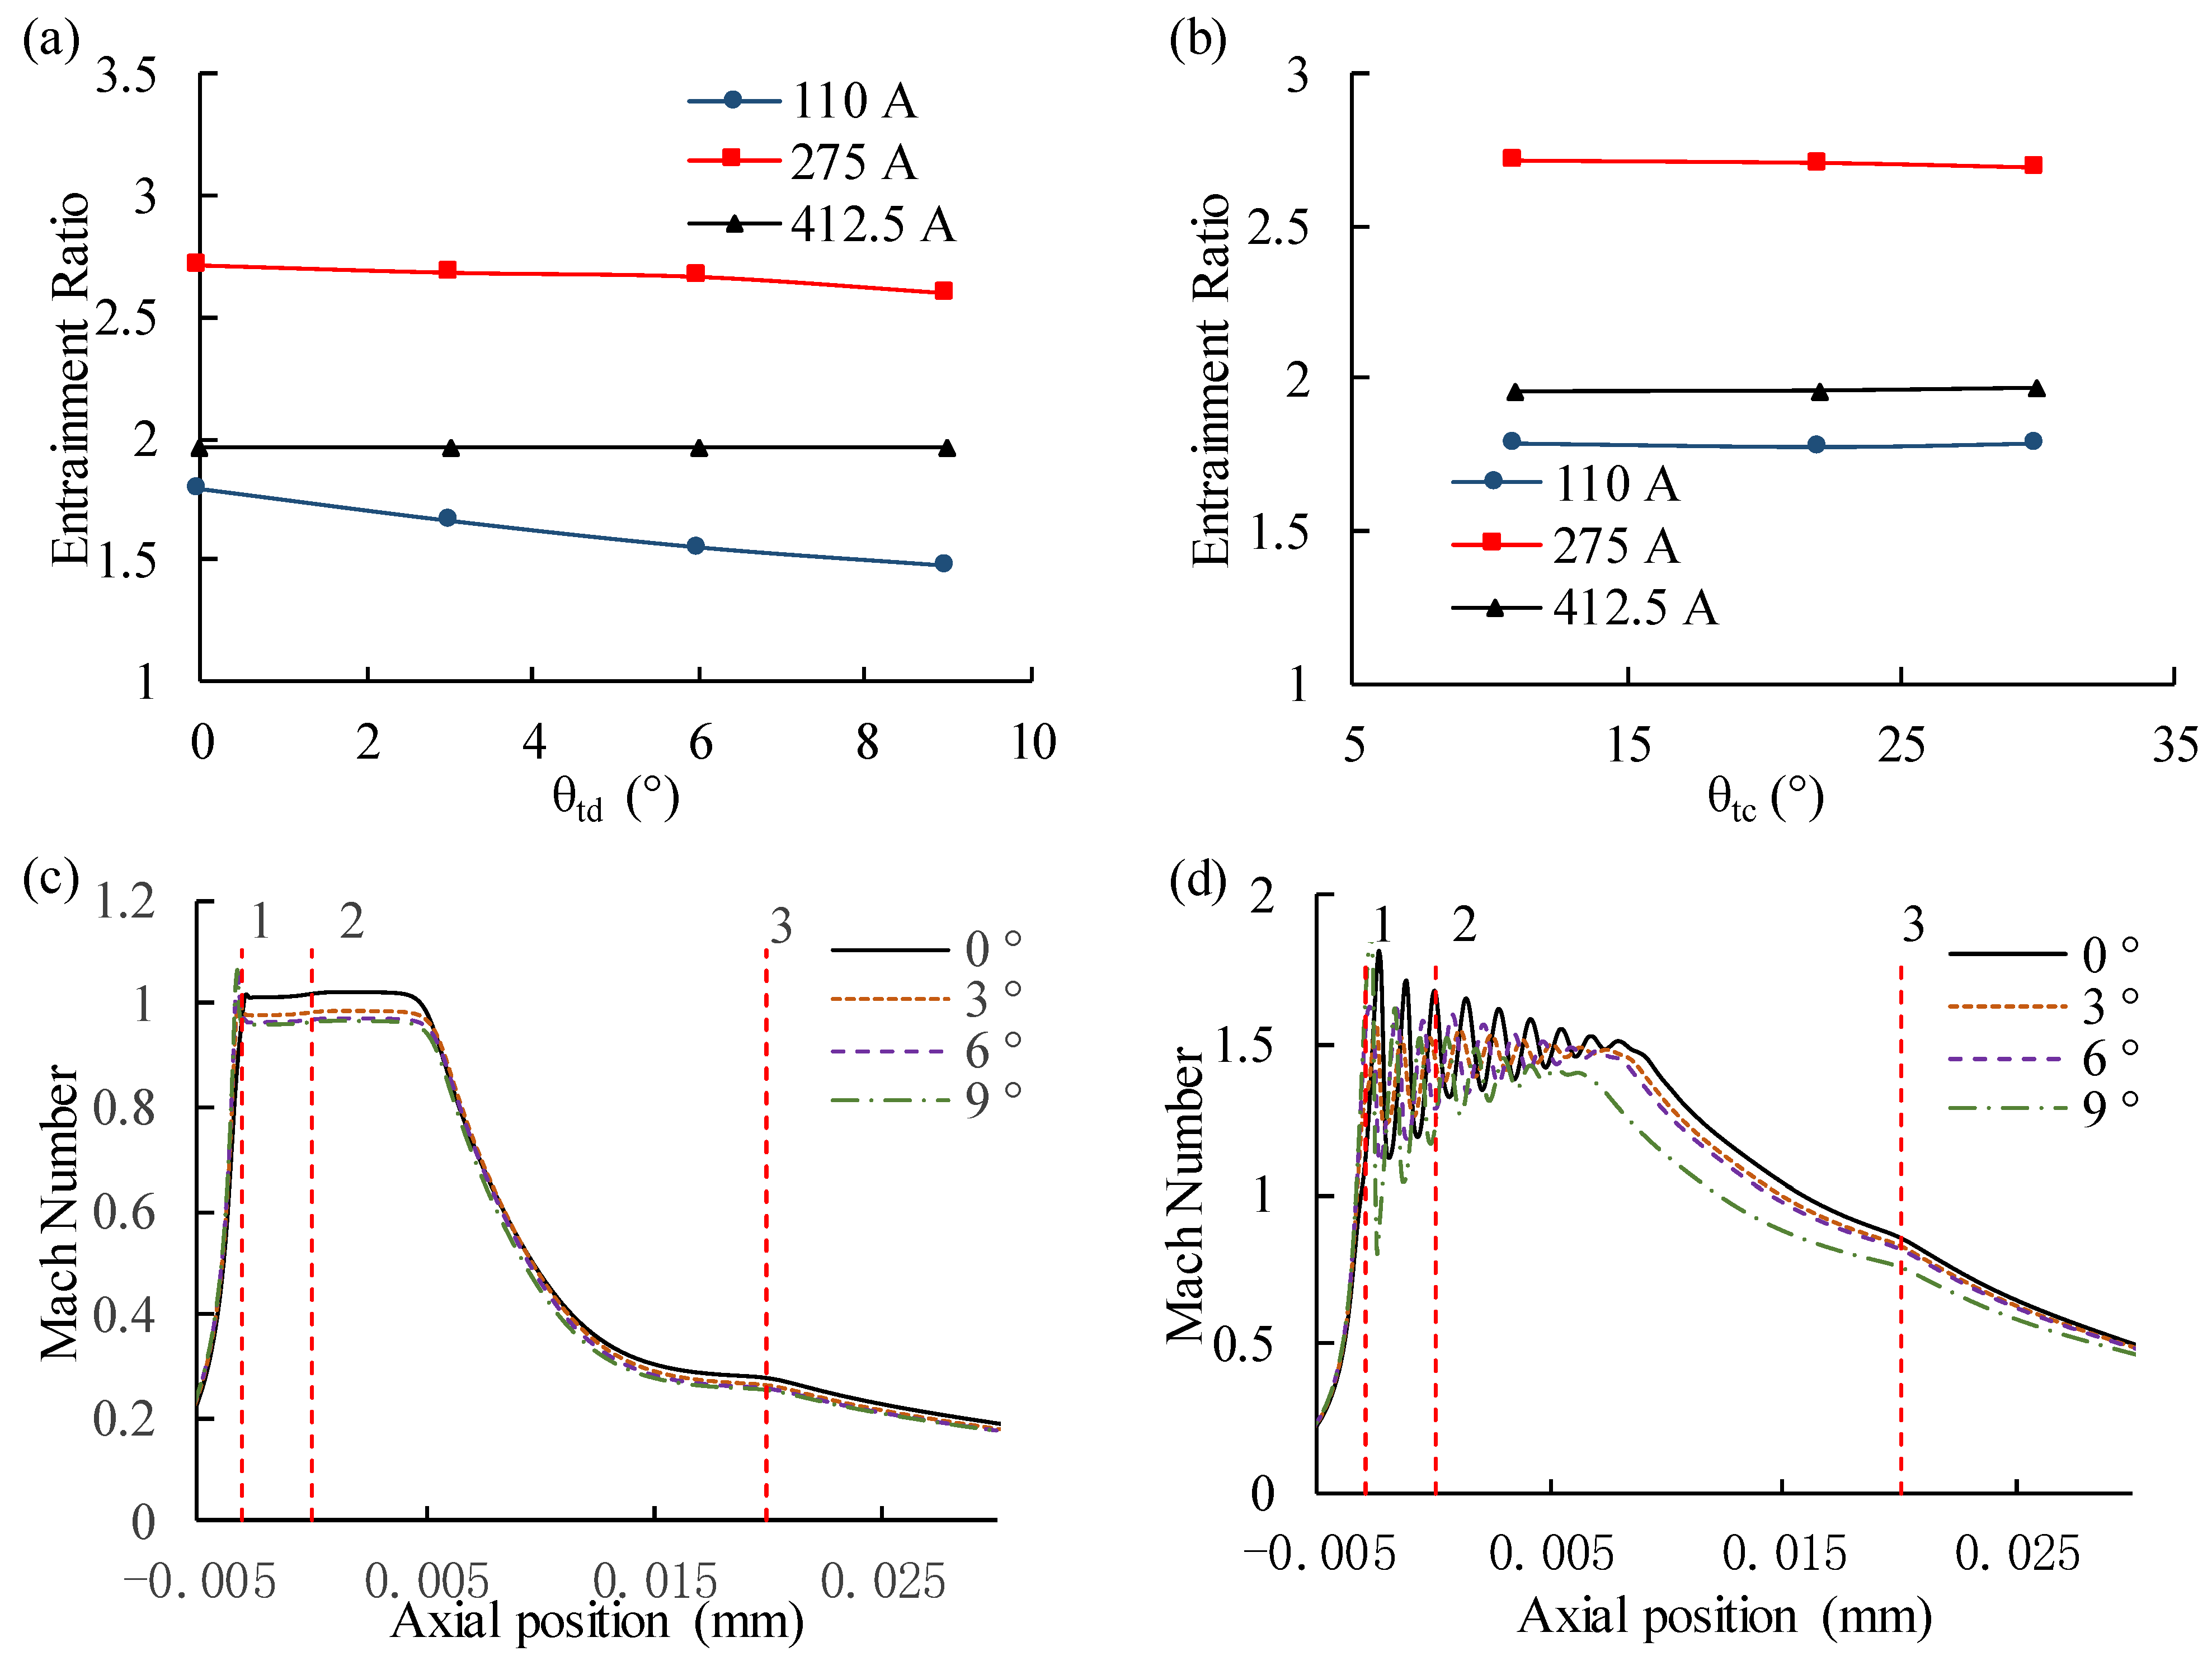
4.1. Effect of Nozzle Dimensions

The nozzle throat diameter Dt is investigated in the range of 0.9~0.98 mm, while the other ejector geometric parameters were unchanged. Figure 6a indicates that the ejector performance is affected by the nozzle throat diameter on in PEMFC system, the entrainment ratio continuously falls while the nozzle throat diameter increases under full current condition. Especially at a low current, when the stack current is 110 A, the entrainment ratio decreases by 0.45 as the nozzle throat diameter increases from 0.9 to 0.98 mm. The entrainment ratio is negatively related with Dt, due to falling axial velocity of nozzle and suction chamber, as shown in Figure 6c. Similarly, Feng [19] analyzed a PEMFC ejector to obtain the effect of various nozzle diameters on entrainment ratio of hydrogen. Their results indicate that entrainment ratio is affected significantly by the diameter, and entrainment ratio becomes higher as the diameter decreases. Therefore, the nozzle diameter is classified as a crucial parameter of ejector design. In order to enhance the range of the ejector at low currents, the throat diameter should be as small as possible. However, a higher inlet pressure of the primary flow is needed as the diameter of the nozzle throat reduces, which is limited by the pressure regulating capacity of the proportional valve. There is a trade-off between operating range and primary inlet pressure, when the throat diameter is optimized. In this work, the primary pressure is higher than 8.5 bar when Dt is less than 0.94 mm. So, the ejector nozzle diameter was supposed to be 0.94 mm.
The effect of the length of the nozzle throat is investigated with different dimensions (range from 0.5~6 mm). Figure 6b indicates that the nozzle throat length has little effect on the performance of the ejector at medium and high currents. This is because the primary flow in nozzle is under-expanded as the current increases, velocity at the nozzle exit is more than sonic speed with tremendous kinetic energy [19]. However, at a low current, nozzle throat length makes a notable effect on entrainment ratio. When stack current is 110 A, the entrainment ratio improves from 1.79 to 2.02 while nozzle throat length increases from 0.5 to 6 mm, due to the increased primary flow pressure and velocity at nozzle exit, as shown in Figure 6d. Therefore, nozzle throat length is an important parameter at low currents. Thus, the length of the nozzle throat was taken as 6 mm.
Figure 7a shows the results that the effect of the nozzle divergent angle on PEMFC ejector performance, there are 4 groups of the nozzle divergent angle (0°, 3°, 6°, 9°, respectively) were selected. The result indicates that the nozzle divergent angle has a small effect on the entrainment ratio at high currents. However, at low and medium currents, the nozzle divergent angle plays an important role on ejector performance. At low currents, the hydrogen mass flow rate from high-pressure source is small, and velocity of primary flow didn’t exceed the sonic speed at the nozzle throat, if there is a divergence angle, the velocity will be further reduced at the nozzle exit. Then the momentum of the primary flow decreases, and the penetration distance of primary hydrogen reduces. As a result, the ability of primary hydrogen to entrain secondary flow will decrease. As presented in Figure 7c, over-expanded occurred in nozzle inner of convergent-divergent ejector, the velocity goes to sonic speed and then deceases to subsonic speed. The Mach Number is over 1 in suction chamber with divergence angle is 0°, while it is below 1 with another angle. As seen in Figure 7d, when nozzle divergent angle varies from 0° to 9°, the length of shock wave is obviously reduced, the momentum is also decreased, so the mass rate of secondary flow entrained by same primary flow is reduced. Therefore, the nozzle divergent angle is an important parameter for partial working conditions. In PEMFC system, ejector needs to be designed for operating condition of low currents, so it is better to use a convergent nozzle rather than a convergent-divergent nozzle. Therefore, the divergence angle was taken as 0° in this work.
The result in Figure 7b shows the effect of nozzle convergence angle on entrainment ratio. It can be seen that the nozzle convergence angle has no noticeable effect on the performance of the ejector, which is considered as a non-essential parameter of the structure. In actual manufacturing and application, it is also necessary to consider the surface roughness of nozzle with convergence angle, which has an important influence on pressure loss. In this study, the convergence angle of the ejector was selected as 11° by comprehensively considering the miniaturization of ejector and manufacturing difficulty.

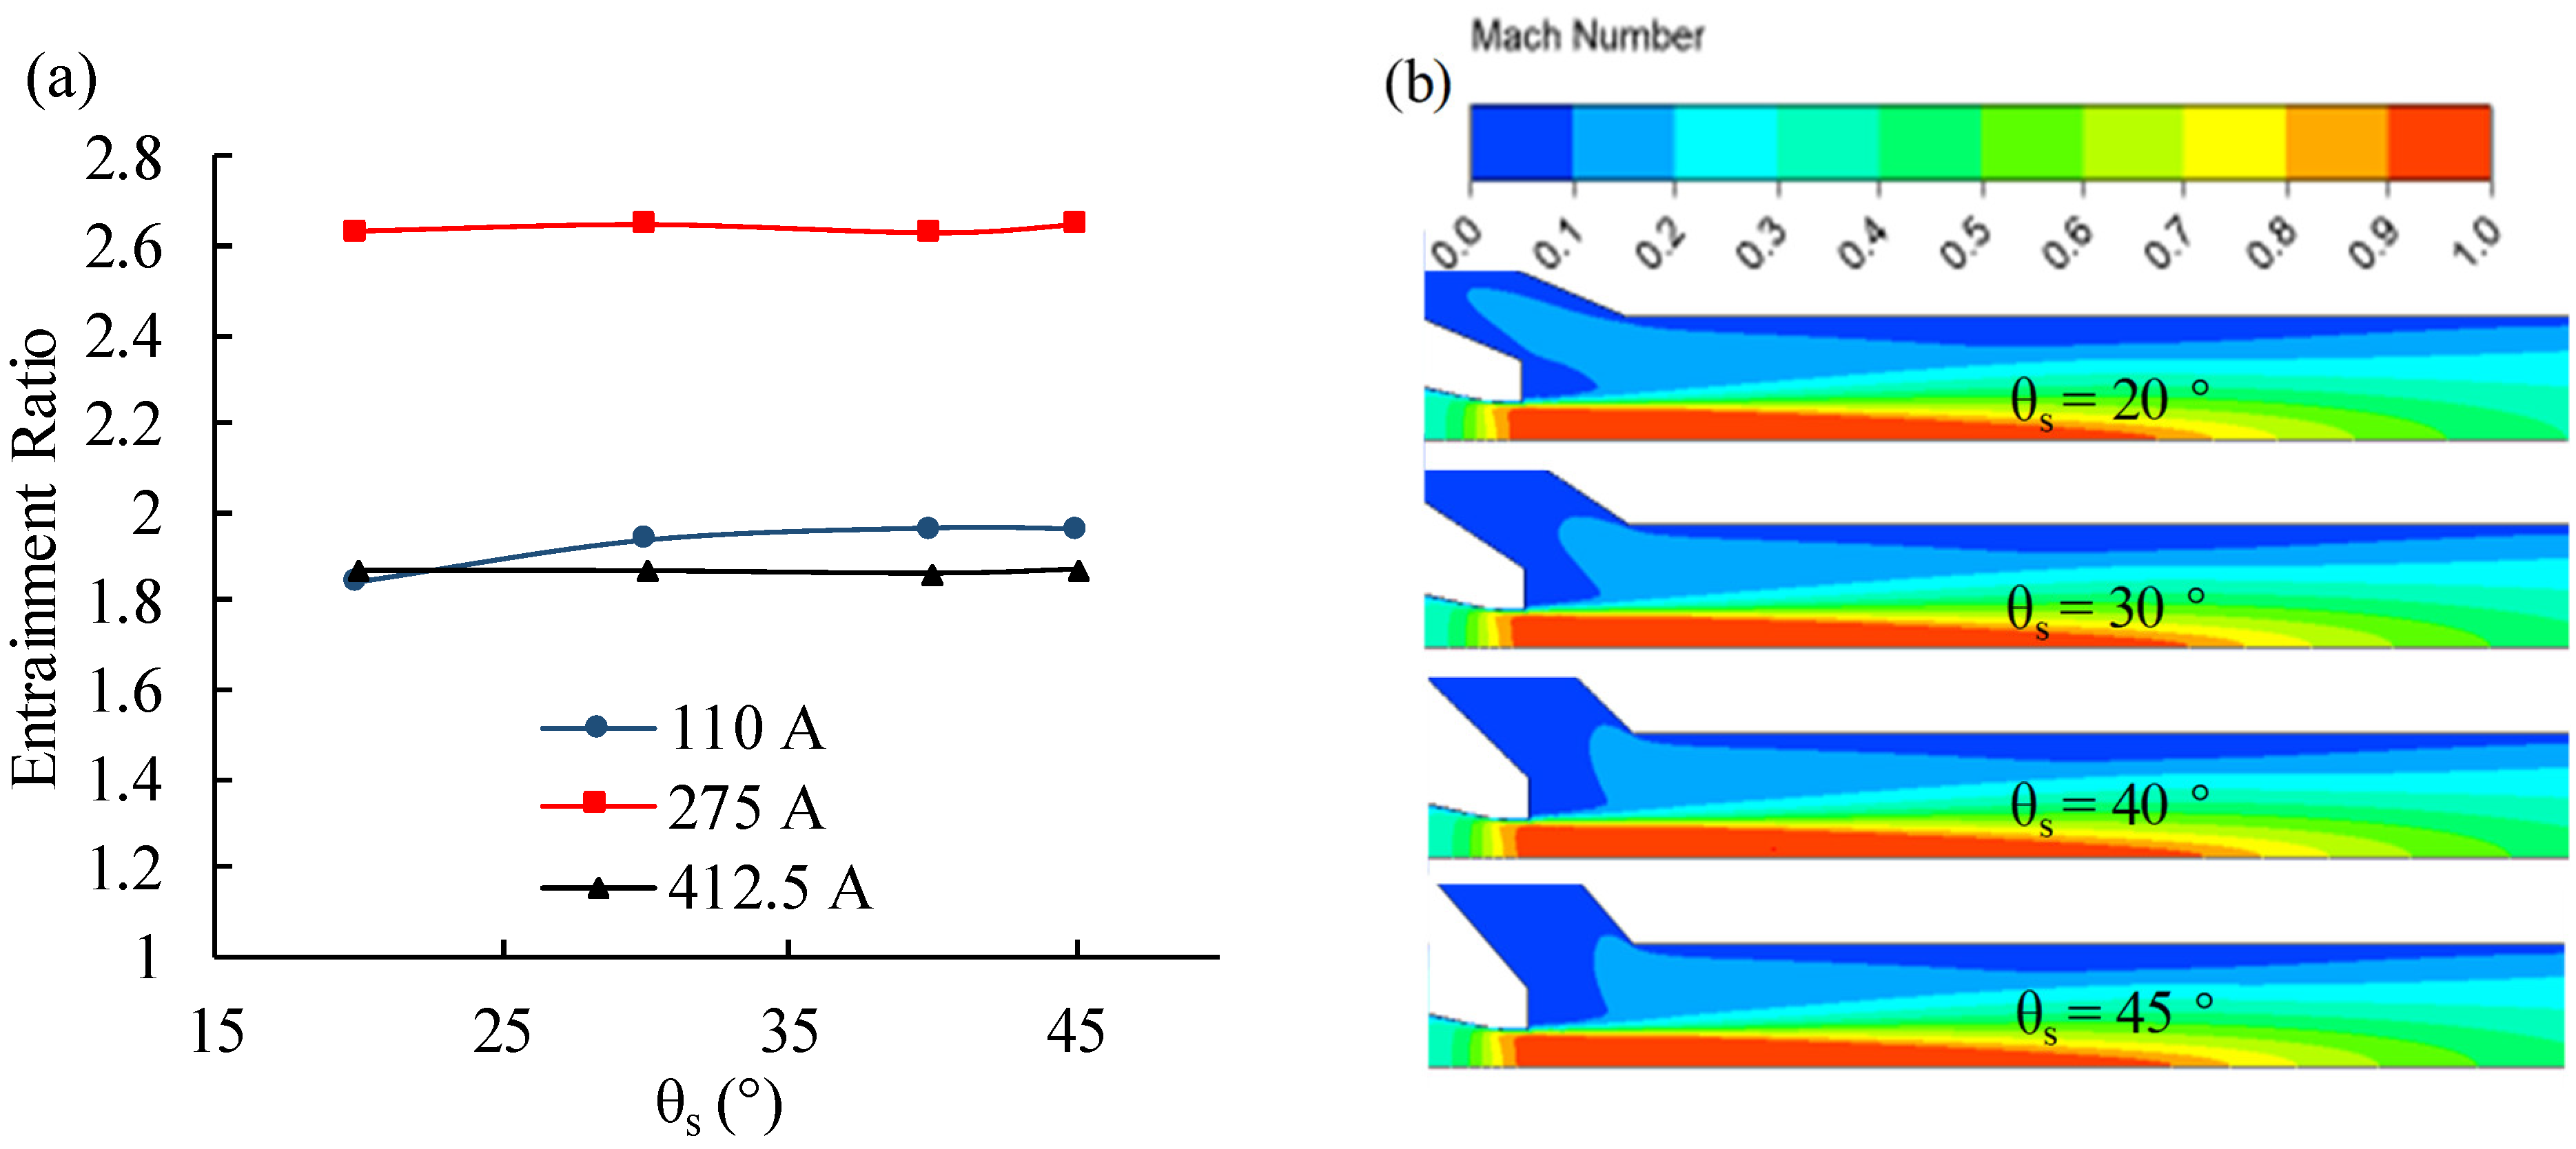
4.2. Effect of Suction Chamber Dimensions

The nozzle exit position (NXP) is investigated in a normal range of 0.5~6 mm, it has different optimal values under different currents, illustrated in Figure 8a. ER increases when NXP is up to a special value, but further increase in NXP leads to a reduction of ER as the effective area of secondary flow and shear mixing layer decreased [25]. At 275 A, Figure 8b show an increased ER caused by the enlargement of the effective area in the suction chamber, and a decreased entrainment ratio caused by weaker shock waves in the suction chamber and the mixing tube, so does 412.5 A. It is worth noting that if NXP is too small, the velocity of the secondary flow in the suction area will be too high and the throttling loss will be severe. In contrast, if NPX is too large, the primary flow will be over-expanded, then the entrainment ratio decreases, as shown in Figure 8b. At 110 A, the secondary flow forms a vortex in the mixing tube due to the low energy carried by the primary flow and the viscous effect of the near-wall region. With the increase of NXP, the flow velocity of the primary flow into the mixing tube is further reduced, and the position of the vortex formed moves forward and the size of vortex gradually increases, which would cause the loss of kinetic energy, and reduced entrainment capacity, as shown in Figure 8c. In addition, the optimal NXP value gradually increases while the load increases, the optimal NXP is 1.5 mm at 110 A, 3 mm at 275 A, and 4.5 mm at 412.5 A. Consequently, NXP is a crucial parameter that affects ejector performance. Thus, the NXP was taken as 1.5 mm considering the ejector performance at both high and low currents.
Simulation results of various suction chamber angles are shown in Figure 9. At low current, the smaller angle will result in a reduced flow area for the secondary flow into the suction chamber and the mixing tube, resulting in a lower entrainment ratio due to wall viscous effects, as shown in Figure 9b. Under conditions of medium and high currents, the primary flow kinetic energy is large, and the suction ability caused by shear stress becomes strong, so the performance is almost unchanged. Accordingly, the suction chamber angle is a non-essential parameter within normal range, and it has no noticeable effect on entrainment ratio in all stack operating conditions. In this study, the suction chamber angle was selected as 30°.

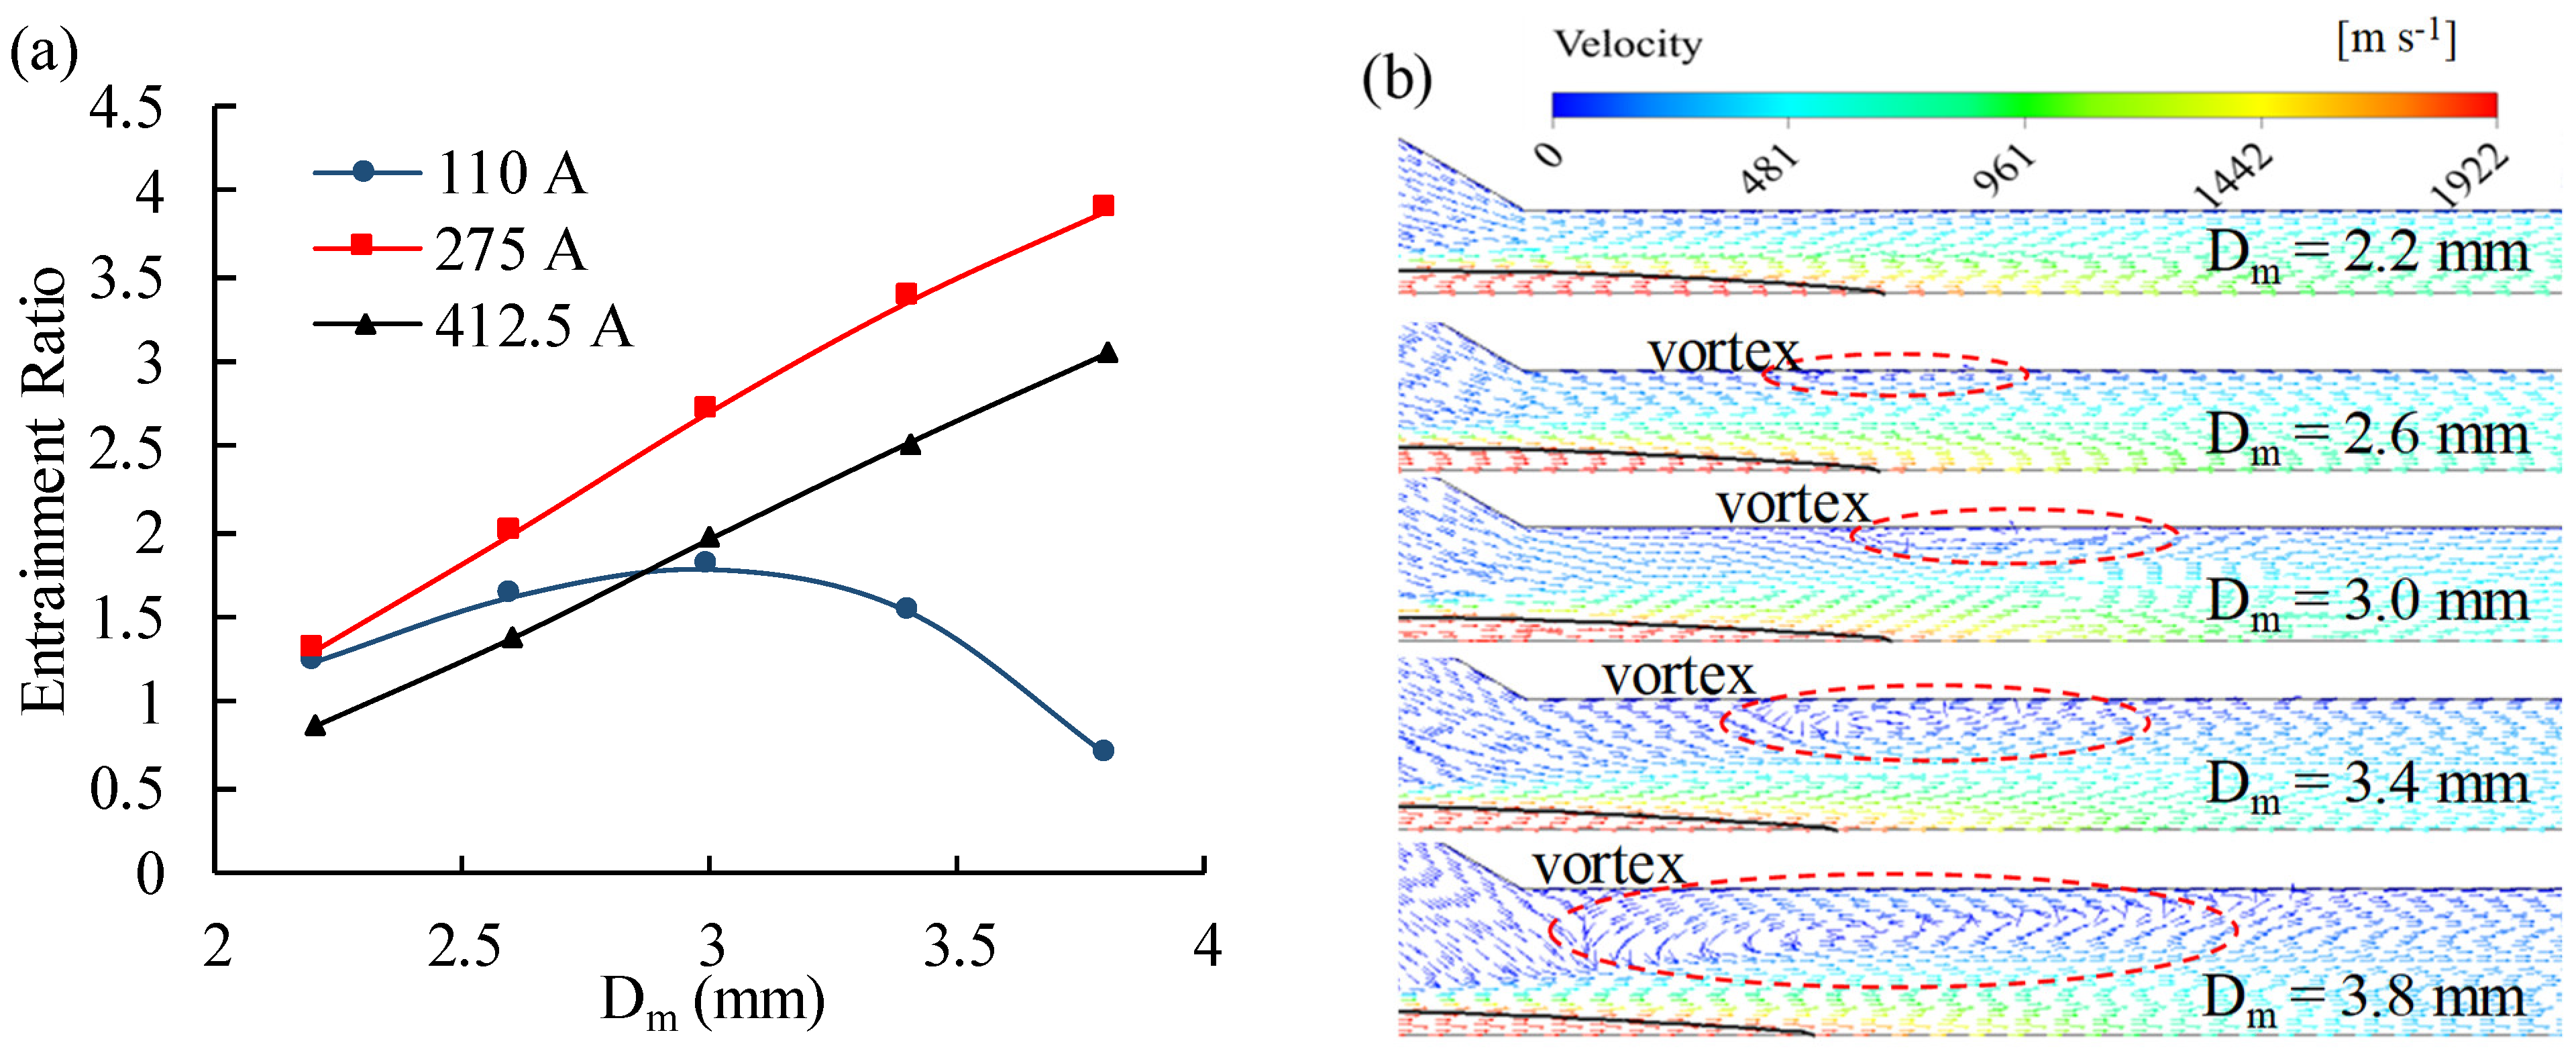
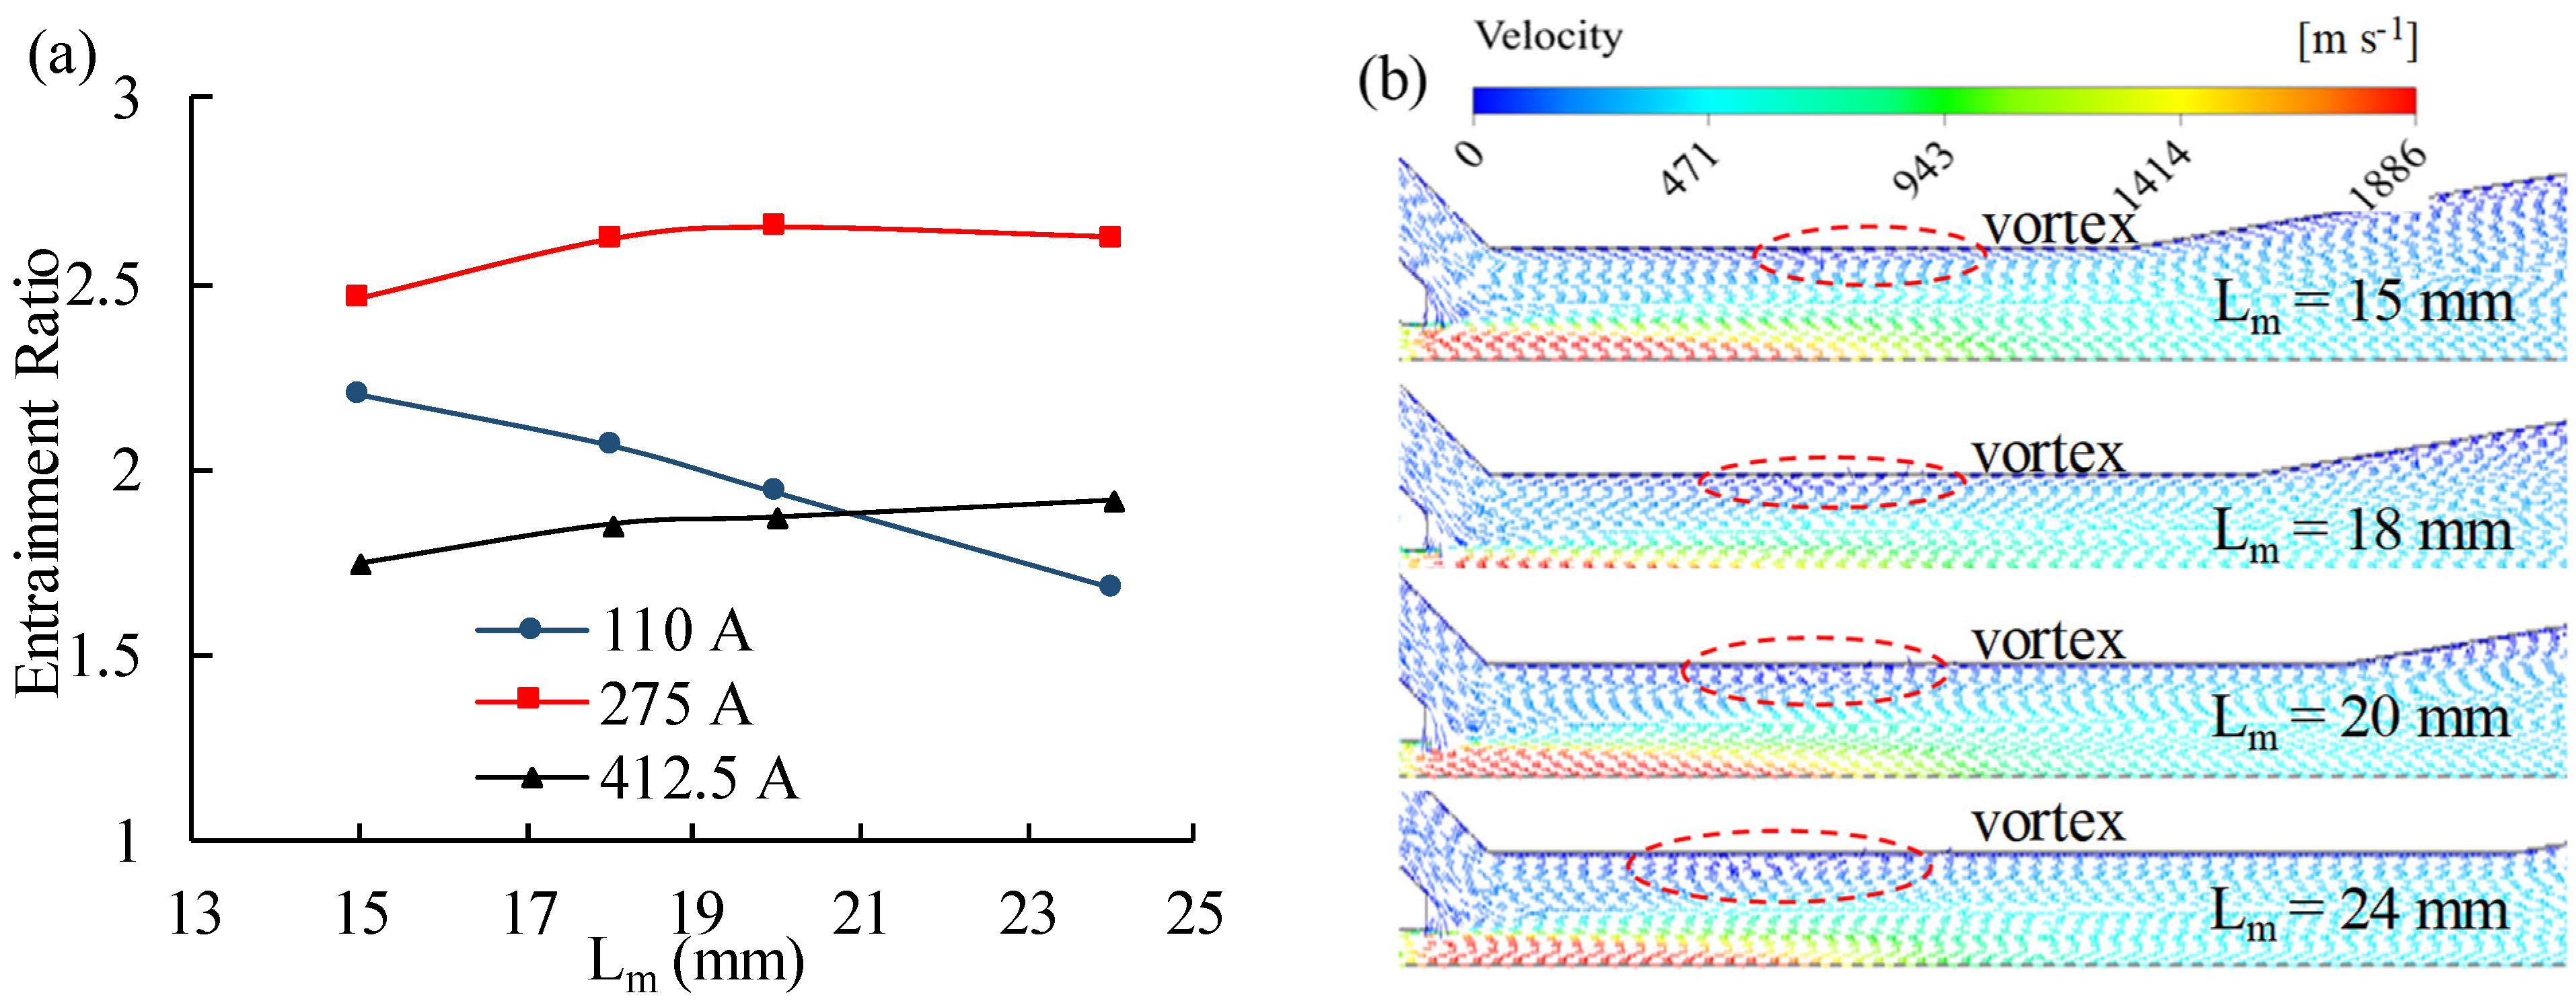
4.3. Effect of Mixing Tube Dimensions

Figure 10a shows the relationship between mixing tube diameters and performances of PEMFC ejector under different current. The mixing chamber diameter varies from 2.2 to 3.8 mm. At a low load of 110 A, the ejector performance is best when the mixing tube diameter is 2.6~3 mm. Increasing the Dm up to 3 mm causes an increase of ER due to the enlargement of the effective area. Further enlargement of Dm leads to a decreasing ER caused by the reduced effect of the shear mixing layer between the primary and secondary flow. In fact, each working condition corresponds to a unique optimal mixing tube diameter, a mixing tube diameter that makes optimal entrainment ratio at high currents may not fit well for the low current conditions [22]. If the mixing tube diameter is small, the secondary flow area is small in the mixing tube, and the velocity is increasing at sonic speed (namely, flow is chocked), mass flow rate of the secondary flow will be decreased. If the mixing tube diameter is too large, there may exist backflow in the mixing tube inner zone, which would reduce the entrainment ratio. In Figure 10a, entrainment ratios at medium and high currents increase continuously, the reason should be that the dimension change of mixing tube diameter is too small to be seen the optimal value. If the diameter is increased further, an optimum will appear at medium and high currents, respectively, similar to the low current case. As shown in Figure 10b, when Dm = 2.2 mm, a vortex is not formed in the mixing tube, and the entrainment capacity is mainly limited by the flow cross-sectional area of the mixing tube. When Dm is increased, a vortex is formed due to insufficient kinetic energy and wall viscous effect. When it increases from 2.6 to 3.8 mm, the size of vortex gradually increases, which further consumes the primary flow kinetic energy, and the entrainment ability is weakened. Thus, the mixing tube diameter was optimized to be 3 mm for ensuring PEMFC recirculation ratio (same as entrainment ratio in this study) of different operating conditions and taking into account the uniformity of the entrainment ratio.
The effect of different mixing tube length (15 mm, 18 mm, 20 mm, 24 mm) on entrainment ratio is illustrated in Figure 11a, the entrainment ratio decreases when the length increases at a low current, while the entrainment ratio increases at medium and high currents. The reason for the difference is that the velocity of hydrogen is different. At low currents, primary flow velocity is lower than sonic speed, there might be vortex formed in the mixing tube. It can be observed in Figure 11b that the size of the vortex increases as increasing mixing tube length, caused by the resistance along the secondary flow near the wall, resulting in a decrease in the entrainment capacity. When the length increases, the flow resistance increases, and entrainment ratio reduces. At medium and high currents, a series of shock waves are formed in the mixing tube, and the zone that the two flows mixing becomes bigger. If the mixing tube length is too small, the mixing process is insufficient at the mixing tube exit, and part of the mixing process will take place in the diffuser. Therefore, the mixing tube length is a crucial parameter affecting the ejector performance. If only the ER at low currents is considered as the optimization objective, the length should be taken as 15 mm. Nonetheless, the ER is lower than the requirements of PEMFC at high currents, so the length shall be taken as 18 mm.

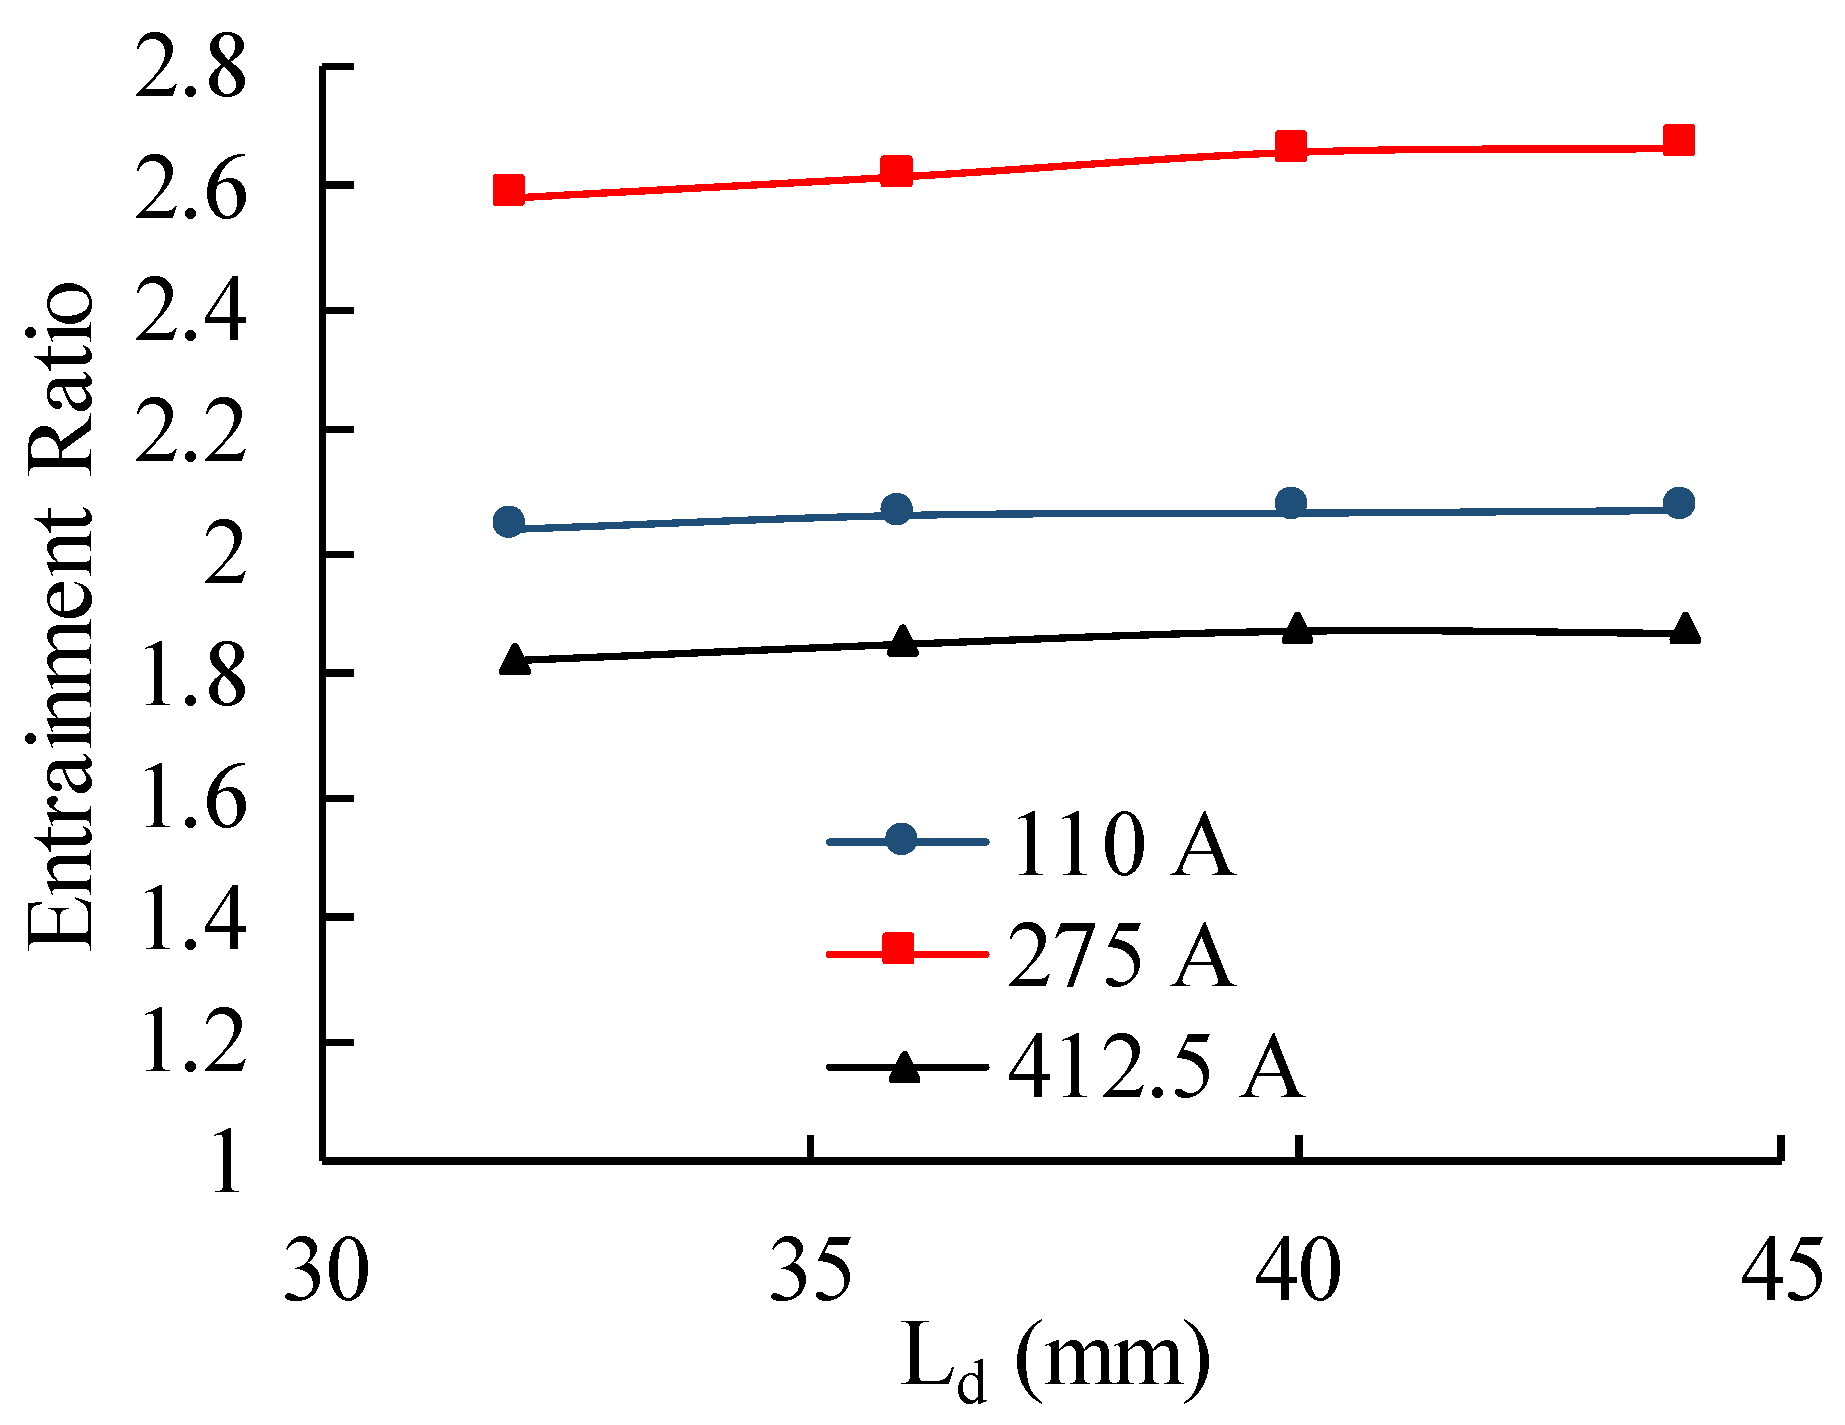
4.4. Effect of Diffuser Dimensions

The diffuser length is varied from 32 to 44 mm, which is equivalent to changes of the diffuser angle. Figure 12 displays the effect of the diffuser length on the ejector performance, it is observed that the entrainment ratio increases slightly with increasing length at each current. However, it should be known if the diffuser angle is too large, that means the diffuser length is too short, the expansion loss will increase in inlet of diffuser. If diffuser length too long, loss caused by friction also would be larger, and that may not be benefit to the miniaturization of the ejector. So, it can be concluded that the diffuser length is a non-essential structural parameter within the normal range. In addition, the optimum diffuser length was selected as 44 mm.

5. Multi-Factor Analysis of the Performance of Ejector Using Taguchi Method

The above single-factor analysis determines the crucial parameters of PEMFC ejector, the optimized results of various structural parameters on performances of ejectors are presented. However, optimizing process is executed by only one parameter changing but others were fixed, the optimized result corresponding to each optimized structural parameter would not be global optimal, which might be local optimal. Therefore, a multi-factor analysis of those crucial parameters should be carried out to performances of PEMFC ejector for gaining the more accurate optimization result and the more detailed parameter correlations.
The Taguchi method, which is a widely used multi-factor analysis method based on statistics and the orthogonality principle, could determine the order of influence and the optimal combination of the selected factors and levels [31]. It is one of the most important schemes for research of multi-factor and multi-level issues. Thus, the multi-factor analysis, for exploring the effect of several structural parameters on PEMFC ejector performance, was carried out based on the Taguchi method [32]. It uses the signal-to-noise ratio (S/N) to quantify the output result, namely entrainment ratio for PEMFC ejector. However, the entrainment ratio might be less than 0 of several cases, which could be performed with ANOVA analysis of Taguchi method, the excess ratio (namely, ratio of stack inlet mass rate and primary hydrogen mass rate) is calculated as the new performance evaluation index which is calculated by:
λ = m p + m s m p
The S/N ratio was selected as the optimization criterion. In this research, the objective was to maximize the S/N ratios, and ‘the larger, the better’ situations were calculated using:
S / N = 10 log 10 1 n i = 1 n 1 y 2
S/N ratio can be also used to predict the performance of random combination of control factors and levels. The level with maximum S/N ratio was deemed as the optimum level. A separate S/N ratio for each combination of control factor levels in the design needs to be calculated [33]. Hence, the combination was calculated by the following relationship:
η opt = η + Δ A + Δ B + Δ C + Δ D + Δ E
where, η is the overall mean of S/N ratio. Δ A , Δ B , Δ C , Δ D , Δ E are differences of the overall mean of S/N ratio and the mean of S/N ratio of factor A, factor B, factor C. factor D and factor E, respectively.

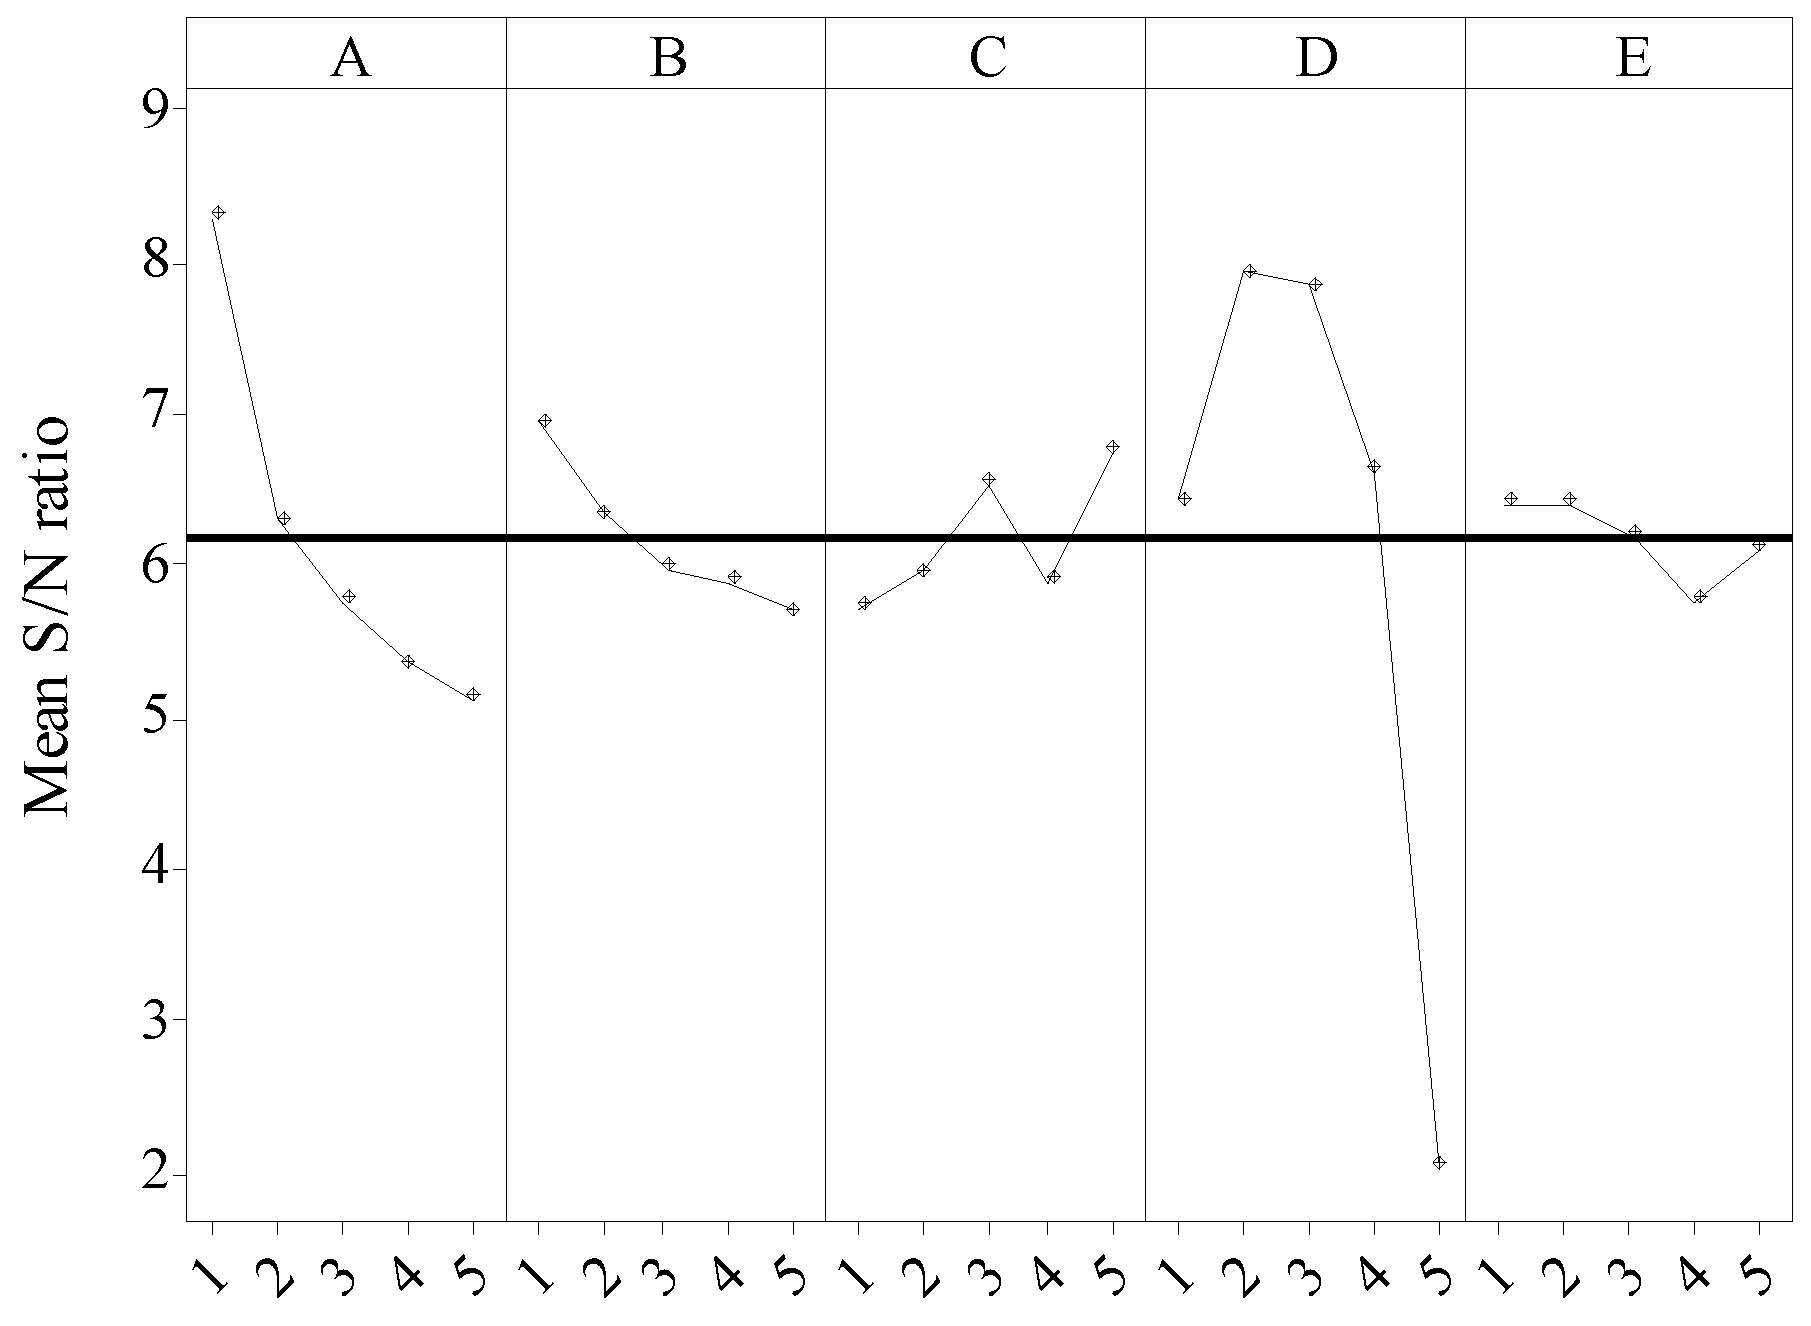
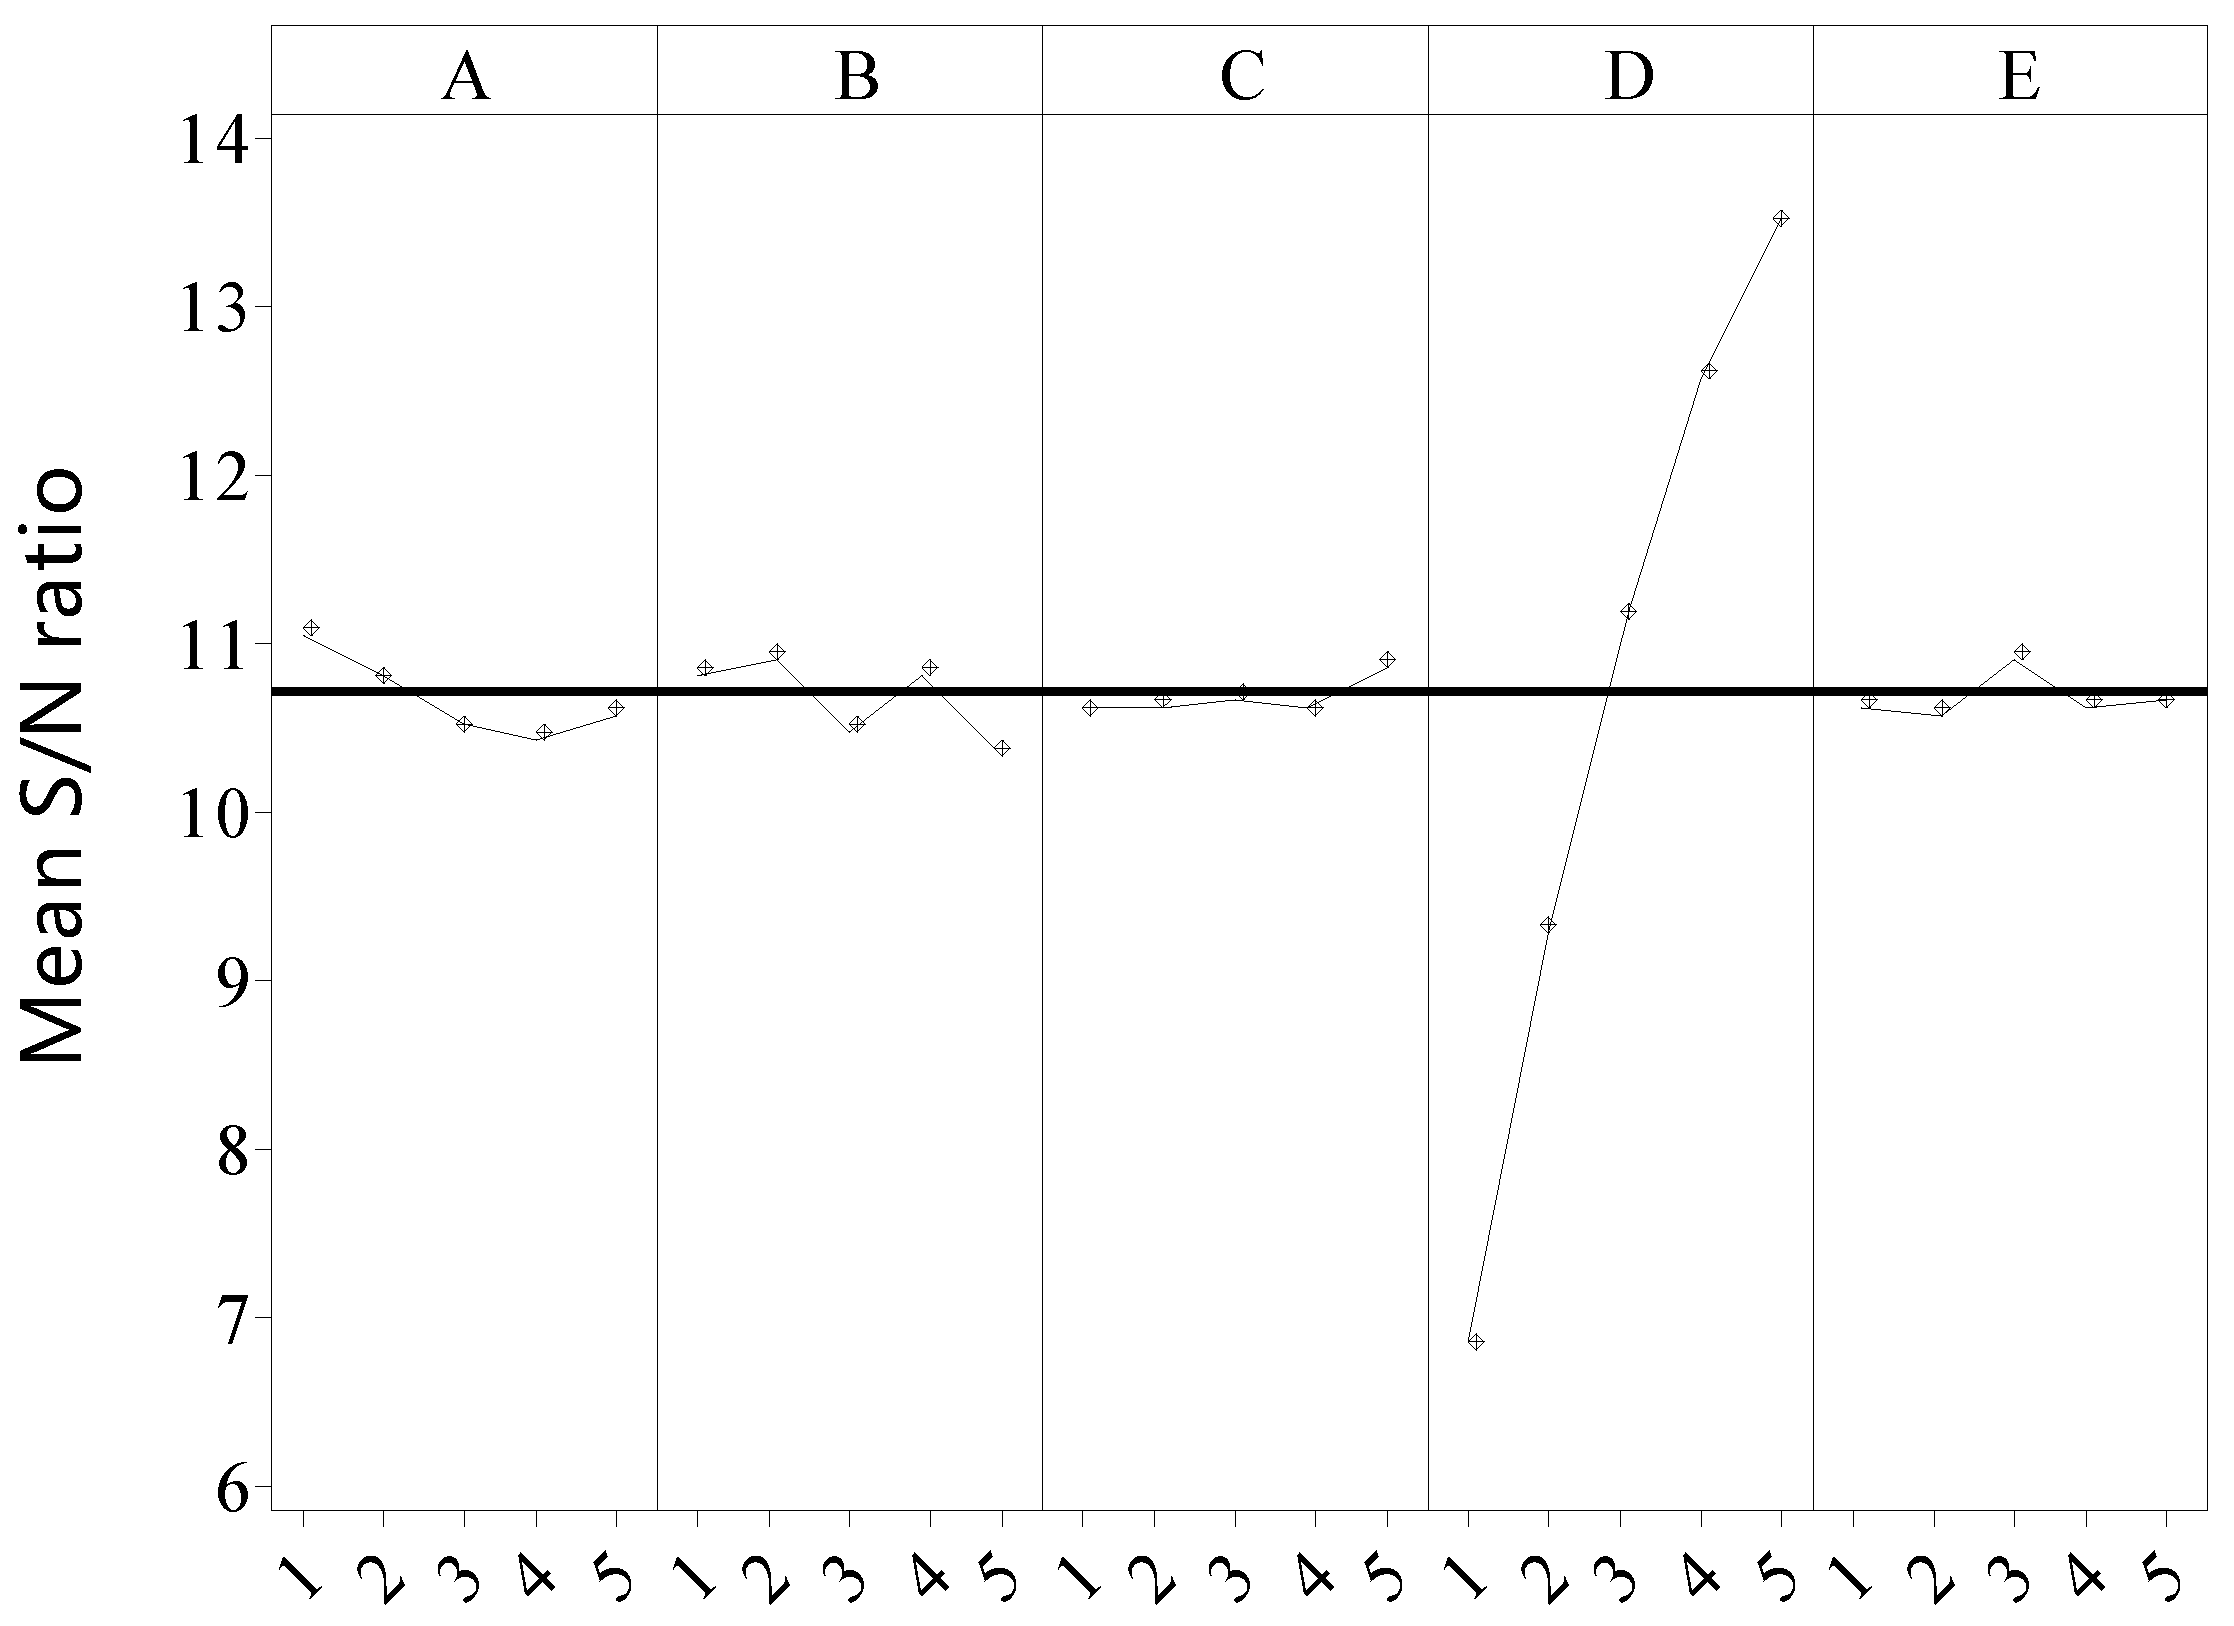
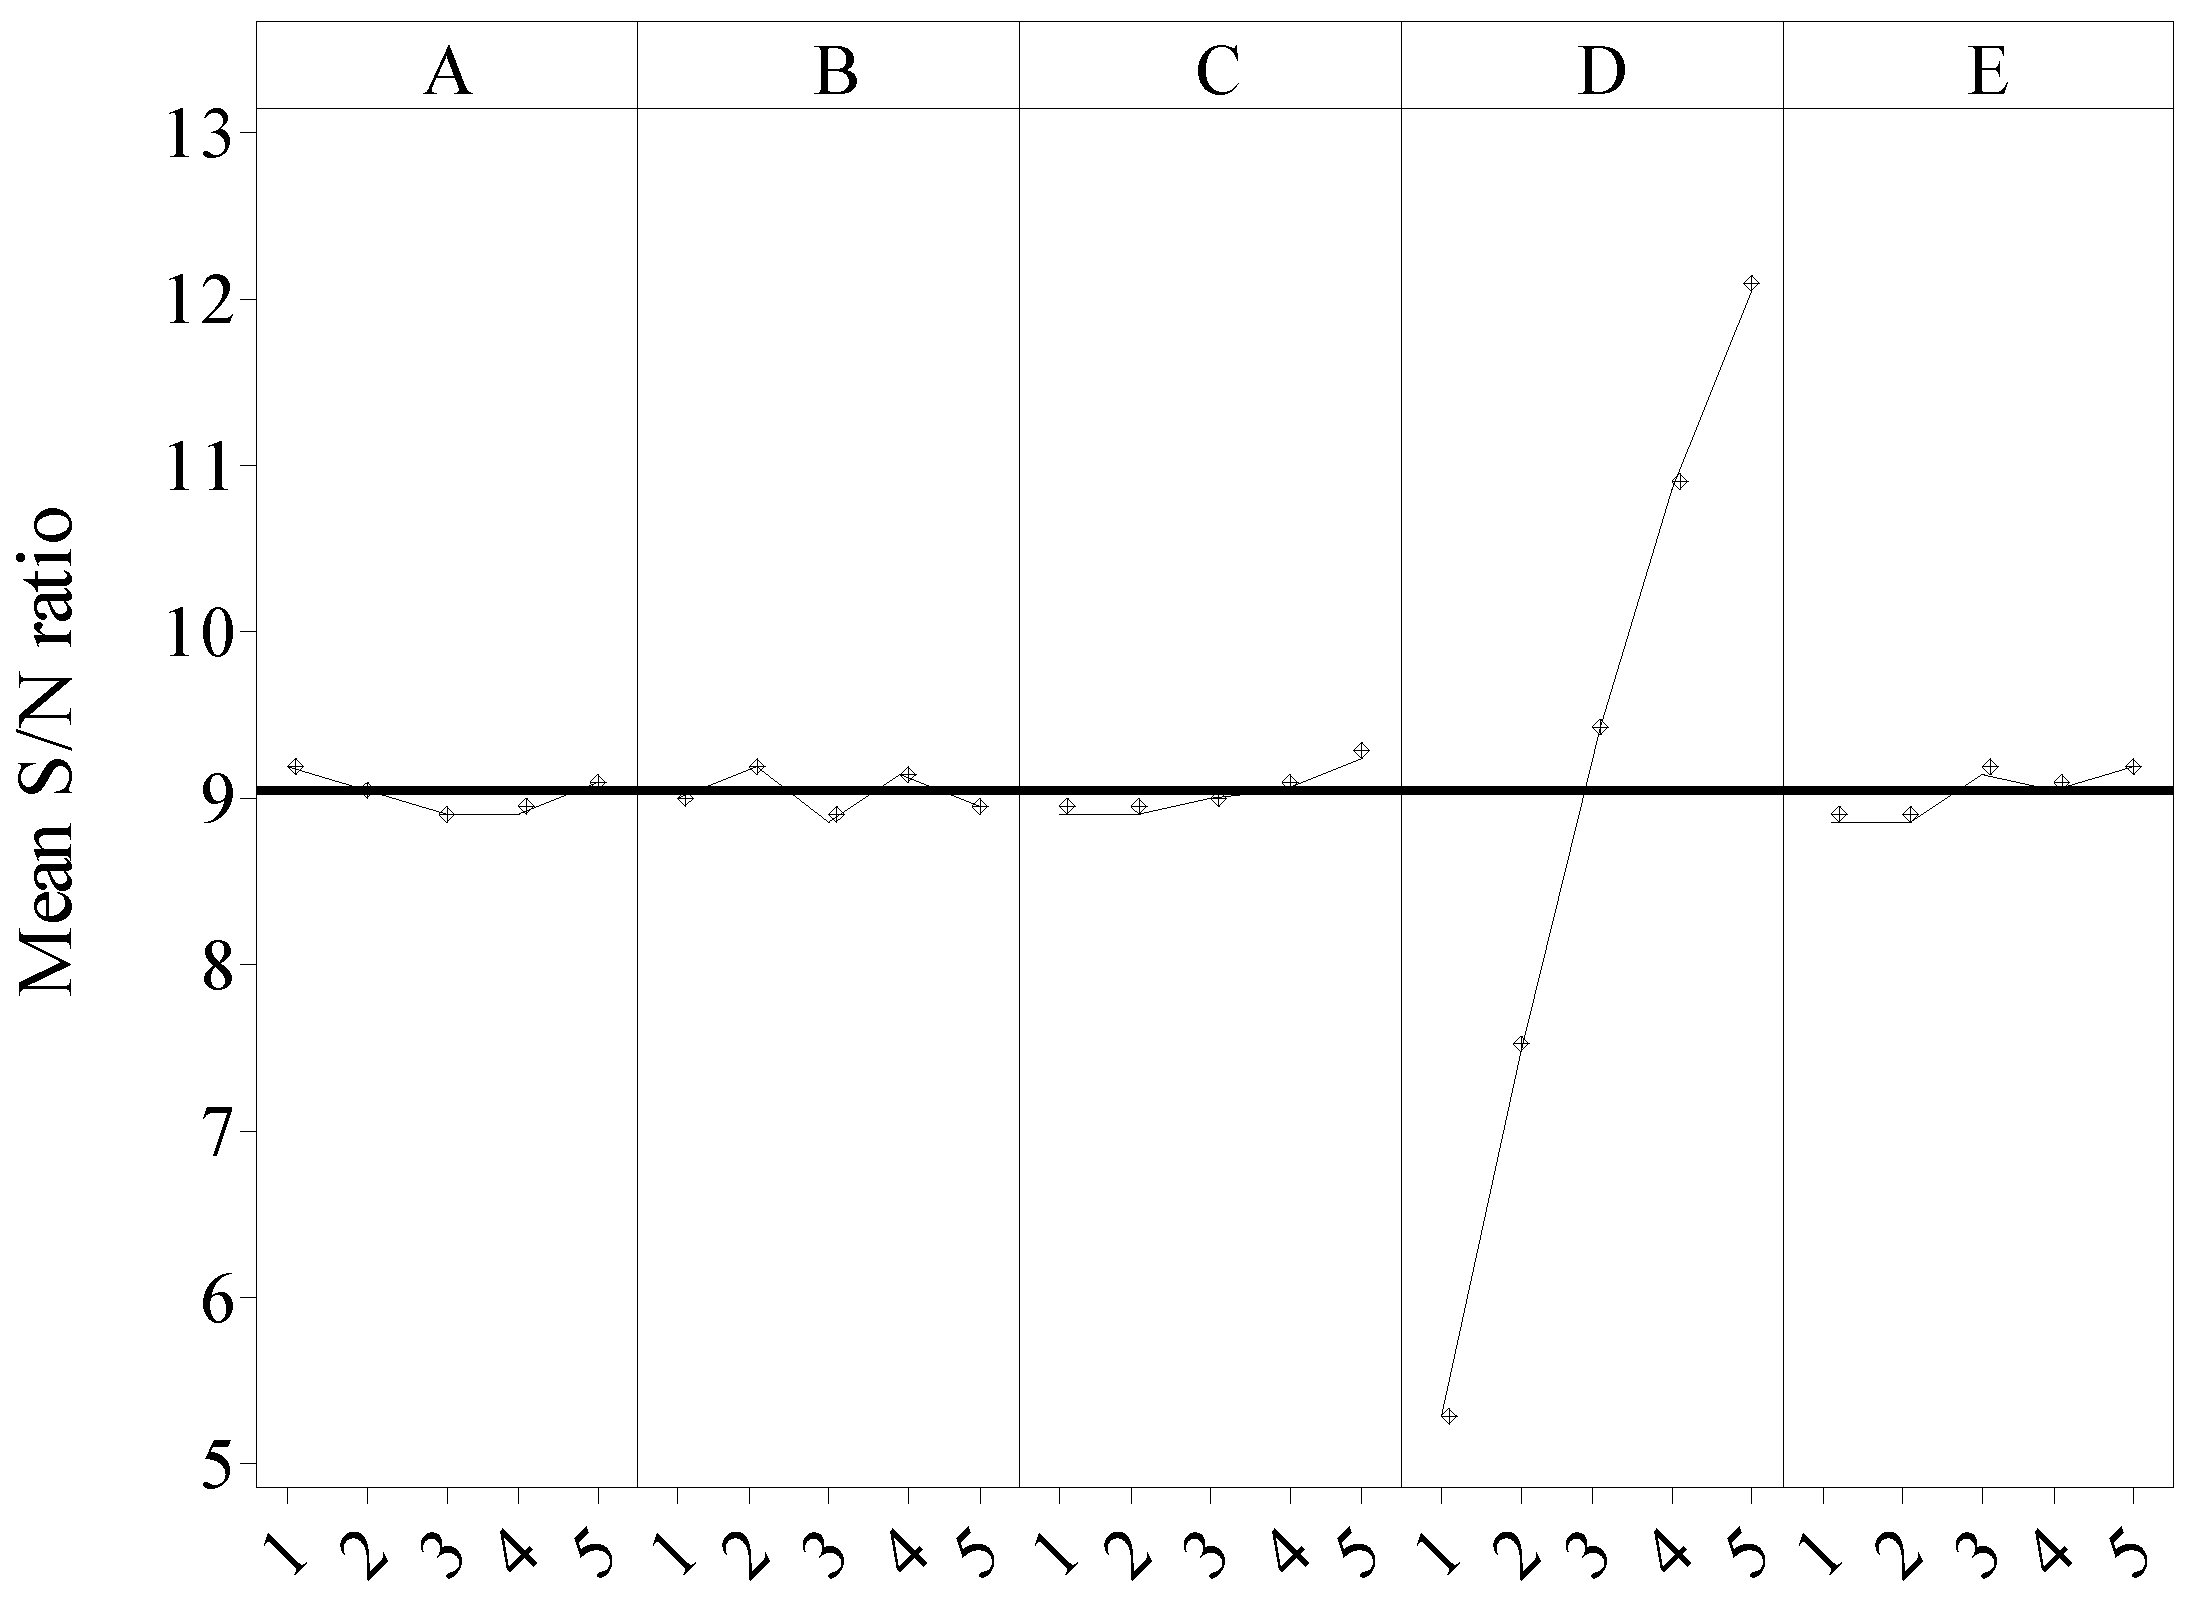
5.1. Taguchi Experimental Design

An orthogonal array is typically used in Taguchi tests method for analysis of experimental results, and it is commonly represented by forms of Ln (mk), which means m factor at k levels and n cases is required to run which. In this research, five factors that have crucial influence on the performance of PEMFC ejector are chosen according to above single-factor analysis results, namely nozzle divergent angle (θtd), nozzle throat length (Lt), nozzle exit position (NXP), mixing tube diameter (Dm), mixing tube length (Lm). As showed in Table 5, each factor shall correspond to 5 levels at most, which ensures that performances of ejectors shall be optimal.
Therefore, at least 21 experiments were required to be conducted in this study based on the minimum number of Taguchi design. The orthogonal array L25(55) with 25 cases, as shown in Table 6, are simulated using CFD model such as Section 3.

5.2. Correlation Analysis of Factors

In according with the above orthogonal list, entrainment ratios of ejector were simulated under different current. Thus, excess ratio of each case was calculated and The S/N value also was conducted as Taguchi test results. Multi-factor analysis of those results is carried out by main effects analysis method, which compares mean S/N ratio of under each level of factors to acquire the order of influence. The optical level is identified as the level whose mean S/N ratio is maximum.
Figure 13 indicates the changing trends of excess ratio according to the design factors at 110 A. It shows that nozzle divergent angle and mixing tube diameter have a significant effect on excess ratio. Excess ratio has an increasing trend with the decrease in nozzle divergent angle, and it first decreases and then increases with the increase in mixing tube diameter, which are the same trends as the single-factor analysis. It suggests that convergent nozzle shall be employed in PEMFC to improve the performance of PEMFC ejector at low currents. The significance of factors was based on the deviation of maximum and minimum mean S/N. The significance of the 5 factors for the entrainment ratio is as follows: D > A > B > C > E.
Figure 14 and Figure 15 reveal the changing trends of excess ratio according to the design factors at 275 A and at 412.5 A, respectively. The significances of the 5 factors for the entrainment ratio at 275 A are as follows: D > A > B> E > C, and at 412.5 are as follows: D> C > E > B > A. In addition, it was shown that mixing tube diameter has the most significant influence on PEMFC ejector performance in both cases, while other parameters have less influence on excess ratio comparing with the mixing tube diameter. The excess ratio improves when the mixing tube diameter increasing, which means entrainment ratio also improves, so it shall be taken as large a value as possible in the relevant range of this study.

5.3. Optimal Combination

In all cases, the objective was to maximize the S/N ratios, which means the larger S/N ratio implies the better achievement of the treatment goal. As shown in Table 7, the optimal combination is A1B1C5D2E2 at 110 A, however the excess ratio in high current is lower than the requirement of PEMFC. Similarly, the optimal combination is A1B2C5D5E3 at 275 A and the optimal combination is A1B2C5D5E5 at 412.5 A, while the excess ratios in low current are low. In PEMFC operation, the objective was to maximize the operation range, it means that the maximum S/N in each working current is not needed, but to make the low current operating conditions exceed to the fuel cell operating requirements under the condition of ensuring medium and high current, or as close as possible to it. Therefore, following the optimization procedure in Section 4, the operating range of fuel cell is ensured to as large as possible, and the optimal result is A1B1C3D3E2 considering the results of fuel cell under different currents comprehensively.

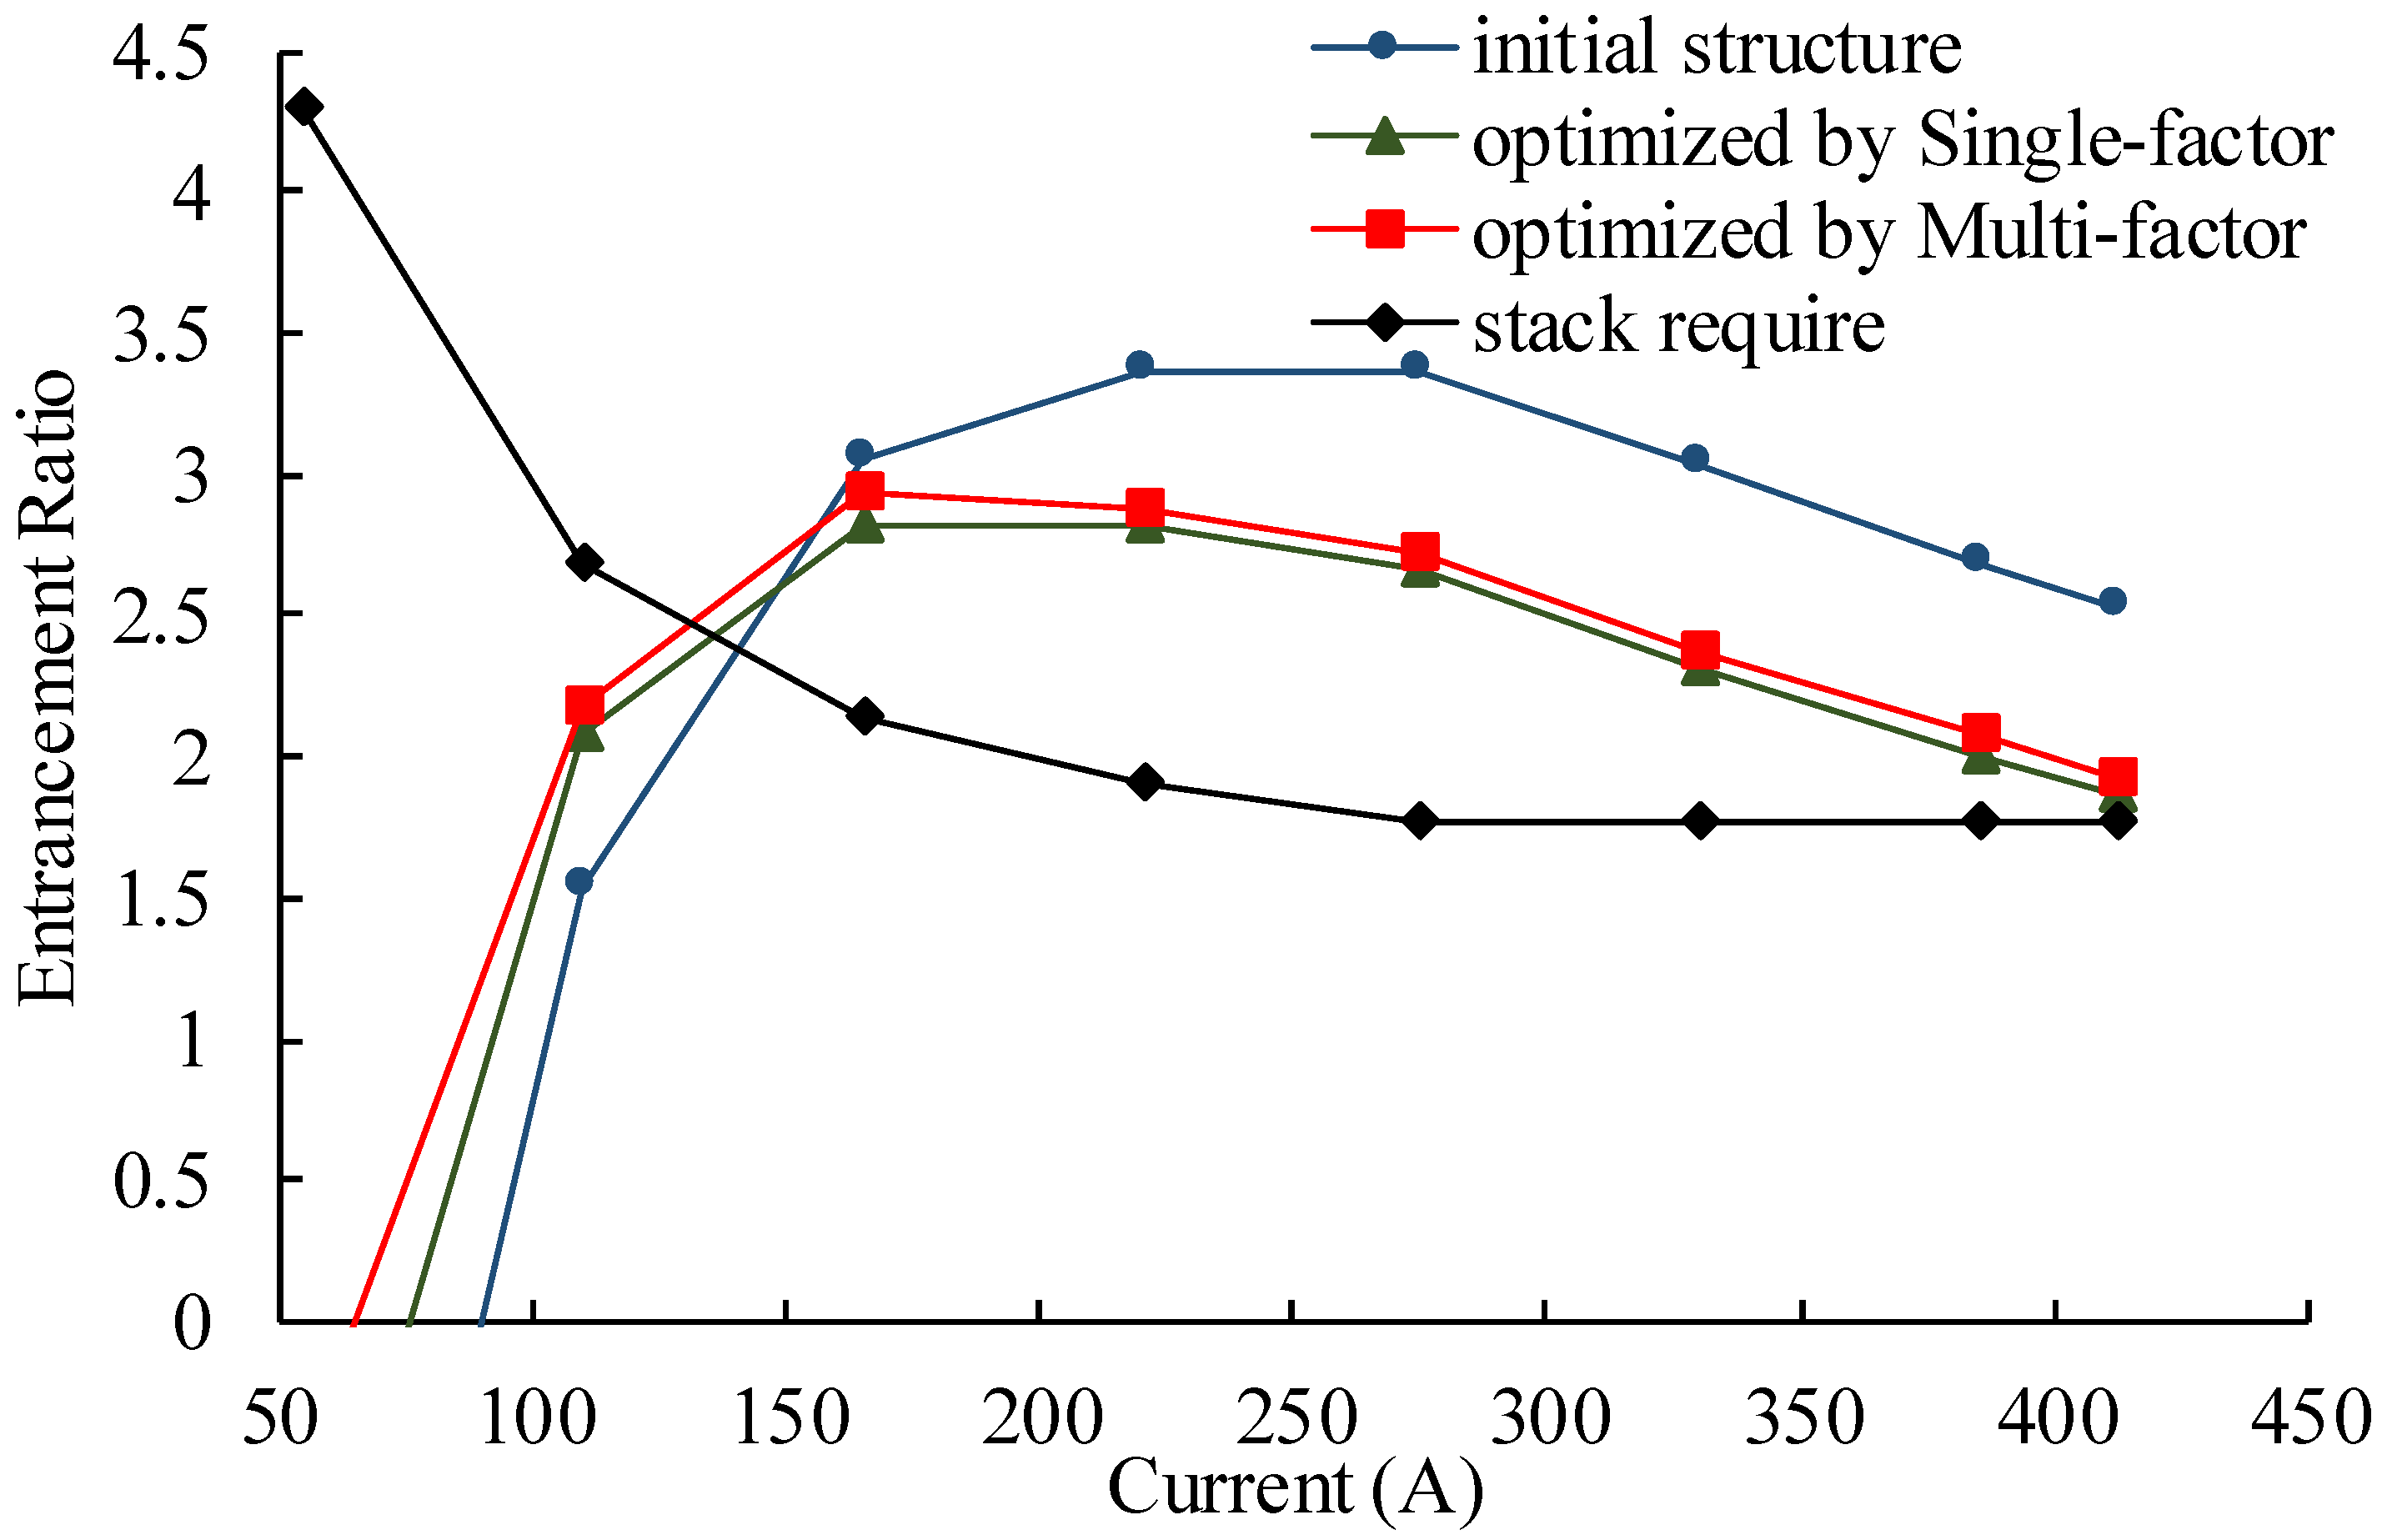
5.4. Comparison of the Optimized Result

The single-factor analysis was carried out to effects of only one structure parameter on performances of ejectors while any other parameter and operating conditions were unchanged, and the corresponding optimized results are shown in Table 8. The multi-factor analysis further was carried out to the sensitivity of the structural parameters considering the simultaneous change of the parameters, and the optimized results are also shown in Table 8.
The entrainment ratio was calculated by CFD method using ejectors shown in table. Figure 16 shows the comparison between the initial ejector structure designed based on the thermodynamic function, the optimized ejector by single-factor and the optimized ejector by multi-factor under the different stack operating conditions. The stack require is regards as the target entrainment ratio. The ejector performance is significantly improved at stack low load level, when the stack current is 110 A, the entrainment ratio of optimized ejector by single-factor is about 2.07 while the entrainment ratio of initial ejector is about 1.53. The entrainment ratio of the optimized ejector by multi-factor is about 2.19 and is more by about 143% than initial ejector. When PEMFC current is above 130 A, entrainment ratios of optimized ejectors are higher than the stack requirement.
It is noticed the optimized ejector by single-factor and the one by multi-factor start recirculating PEMFC exhaust gas above 75 A and 65 A, respectively, while the initial ejector is above 90 A. At about 135 A of the optimized ejector by single-factor achieves the required stack entrainment ratio and 130 A for the optimized ejector by multi-factor, while the initial ejector is about 140 A. The optimized ejectors can cover a wider operating range of PEMFC than initial ejector, and uniformity of full power range becomes better. Figure 16 also indicates that the entrainment ratio of the multi-factor optimized ejector is about 5% greater than that of the single-factor optimized ejector in each PEMFC current. Thus, the optimized structure by multi-factor leads to improvement of operating range of PEMFC ejector.

6. Conclusions

In this work, a two-dimensional CFD numerical model was established to optimize the ejector in detail, and used to gain the effect of structural parameters on the ejector performance with a single-factor analysis method. Afterwards, to explore the sensitivity of structural parameters and further optimize the results, a multi-factor analysis method was carried out to gain the sensitivity of each factor to ejector performances and the optimal structure of PEMFC ejector. The main conclusions are as follows:
  • In the normal range, the nozzle convergence angle, suction chamber angle, and diffuser length are non-essential structural factors that hardly affect the performance of ejector. Nozzle divergent angle and nozzle throat length are important parameters of partial working conditions. Nozzle throat diameter, nozzle exit position, mixing tube diameter and mixing tube length are crucial for wide-range ejector design in PEMFC.
  • Convergent nozzle outperforms convergent-divergent nozzle at entrainment ratio of PEMFC ejector. The optimal mixing tube diameter is 3 mm with the current is 110 A, and the optimal diameter as stack current increases. The optimal NXT is 1.5 mm with current is 110 A, while the optimal NXT is 3 mm and 4.5 mm when the current is 275 A and 412.5 A, respectively.
  • Multi-factor analysis indicated that mixing tube diameter shall be the most significant parameter affecting performance of PEMFC ejectors except the nozzle diameter. In addition, the nozzle angle and length are more sensitive to the entrainment performance at low and medium currents, while the nozzle exit position is more sensitive at high currents.
  • The ejector optimized based on multiple load condition can operate in a wider range, and the entrainment ratio is more uniform. Multi-factor analysis method rather than the single-factor analysis may lead to more effective improvement of operating range. Entrainment ratios of the ejector optimized by multi-factor is about 5% greater than single-factor.

Author Contributions

C.L., writing, modeling, validation, formal analysis, and investigation; Q.L., validation, review and editing; B.S., review and editing, visualization, supervision. All authors have read and agreed to the published version of the manuscript.

Funding

This research was funded by the Project (2020B090920001) supported by the research and development project in major fields of Guangdong Province.

Institutional Review Board Statement

Not applicable.

Informed Consent Statement

Not applicable.

Data Availability Statement

Not applicable.

Conflicts of Interest

The authors declare no conflict of interest.

Nomenclature

AArea [m−2]
DDiameter [m]
EREntrainment ratio
FFaraday’s constant [C mol−1]
LLength [m]
TTemperature [K]
ICurrent [A]
mmass flow rate [kg s−1]
Mmolar weight [kg mol−1]
MaMuch number
Nnumber of single cell of PEMFC stack
PPressure [Pa]
Rgas constant [J mol−1 K−1]
S/Nsignal-to-noise ratio
VVelocity [m s−1]
Greek letters
θAngle [°]
λexcess ratio
γspecific heat ratio
ρDensity [kg m3]
ηmean of S/N ratio
φEfficiency [%]
Subscript
pprimary flow
ssecondary flow
cexit flow
tnozzle throat
ymixing tube inlet
vvelocity distribution
h2hydrogen

References

  1. Barbir, F. PEM Fuel Cells: Theory and Practice; Academic press: London, UK, 2005. [Google Scholar]
  2. Lee, H.Y.; Su, H.C.; Chen, Y.S. A gas management strategy for anode recirculation in a proton exchange membrane fuel cell. Int. J. Hydrogen Energy 2018, 43, 3803–3808. [Google Scholar] [CrossRef]
  3. Hou, J.; Yang, M.; Zhang, J. Active and passive fuel recirculation for solid oxide and proton exchange membrane fuel cells. Renew. Energy 2020, 155, 1355–1371. [Google Scholar] [CrossRef]
  4. Shen, K.Y.; Park, S.; Kim, Y.B. Hydrogen utilization enhancement of proton exchange membrane fuel cell with anode recirculation system through a purge strategy. Int. J. Hydrogen Energy 2020, 45, 16773–16786. [Google Scholar] [CrossRef]
  5. Tsai, S.W.; Chen, Y.S. A mathematical model to study the energy efficiency of a proton exchange membrane fuel cell with a dead-ended anode. Appl. Energy 2017, 188, 151–159. [Google Scholar] [CrossRef]
  6. Toghyani, S.; Baniasadi, E.; Afshari, E. Performance analysis and comparative study of an anodic recirculation system based on electrochemical pump in proton exchange membrane fuel cell. Int. J. Hydrogen Energy 2018, 43, 19691–19703. [Google Scholar] [CrossRef]
  7. Toghyani, S.; Afshari, E.; Baniasadi, E. A parametric comparison of three fuel recirculation system in the closed loop fuel supply system of PEM fuel cell. Int. J. Hydrogen Energy 2019, 44, 7518–7530. [Google Scholar] [CrossRef]
  8. Hwang, J.J. Passive hydrogen recovery schemes using a vacuum ejector in a proton exchange membrane fuel cell system. J. Power Sources 2014, 247, 256–263. [Google Scholar] [CrossRef]
  9. Cokojiob, R.; Бpoдянcкий, H.M. Ejector; Science Press: Beijing, China, 1977. [Google Scholar]
  10. Zhang, L.H.; Li, X.J.; Li, J.; Shao, Z.G.; Yi, B.L. Design and performance test of subsonic ejector for proton exchange membrane fuel cell based on thermodynamic model. Chin. J. Power Sources 2014, 38, 1824–1827+1897. [Google Scholar]
  11. Jin, K.M.; Jun, S.Y.; Won, C.C.; Yong, L.W.; Soo, K.C. Customized design for the ejector to recirculate a humidified hydrogen fuel in a submarine PEMFC. J. Power Sources 2008, 176, 529–533. [Google Scholar]
  12. Zhu, Y.H.; Li, Y.Z. New theoretical model for convergent nozzle ejector in the proton exchange membrane fuel cell system. J. Power Sources 2009, 191, 510–519. [Google Scholar] [CrossRef]
  13. Dadva, M.; Afshar, E. Analysis of design parameters in anodic recirculation system based on ejector technology for PEM fuel cells: A new approach in designing. Int. J. Hydrogen Energy 2014, 39, 12061–12073. [Google Scholar] [CrossRef]
  14. Brunner, D.A.; Marcks, S.; Bajpai, M.; Prasad, A.K.; Advani, S.G. Design and characterization of an electronically controlled variable flow rate ejector for fuel cell applications. Int. J. Hydrogen Energy 2012, 37, 4457–4466. [Google Scholar] [CrossRef]
  15. MV, S.R.; Jagadeesh, G. Vector Evaluated Particle Swarm Optimization (VEPSO) of Supersonic Ejector for Hydrogen Fuel Cells. J. Fuel Cell Sci. Technol. 2010, 7, 16–22. [Google Scholar]
  16. Maghsoodi, A.; Afshari, E.; Ahmadikia, H. Optimization of geometric parameters for design a high-performance ejector in the proton exchange membrane fuel cell system using artificial neural network and genetic algorithm. Appl. Therm. Eng. 2014, 71, 410–418. [Google Scholar] [CrossRef]
  17. Bai, S.; Lei, W.; Wang, X. Optimization of ejector geometric parameters with hybrid artificial fish swarm algorithm for PEM fuel cell. In Proceedings of the 2017 Chinese Automation Congress (CAC), Jinan, China, 20 October 2017. [Google Scholar]
  18. Nikiforow, K.; Koski, P.; Karimaki, H.; Ihonen, J.; Alopaeus, V. Designing a hydrogen gas ejector for 5kW stationary PEMFC system—CFD-modeling and experimental validation. Int. J. Hydrogen Energy 2016, 41, 14952–14970. [Google Scholar] [CrossRef]
  19. Feng, J.; Han, J.; Hou, T.; Peng, X. Performance analysis and parametric studies on the primary nozzle of ejectors in proton exchange membrane fuel cell systems. Energy Sour. Part. A Recovery Util. Environ. Effects 2020, 1–20. [Google Scholar] [CrossRef]
  20. Lakzian, E.; Ghorbanzadeh, S. A numerical comparison between ejector performance with convergence and convergence-divergence primary nozzle. Modares Mech. Eng. 2016, 16, 324–332. [Google Scholar]
  21. Yin, Y.; Fan, M.; Jiao, K.; Du, Q.; Qin, Y. Numerical investigation of an ejector for anode recirculation in proton exchange membrane fuel cell system. Energy Convers. Manag. 2016, 126, 1106–1117. [Google Scholar] [CrossRef]
  22. Wang, X.; Xu, S.; Xing, C. Numerical and experimental investigation on an ejector designed for an 80 kW polymer electrolyte membrane fuel cell stack. J. Power Sources 2019, 415, 25–32. [Google Scholar] [CrossRef]
  23. Besagni, G.; Mereu, R.; Inzoli, F.; Chiesa, P. Application of an integrated lumped parameter-CFD approach to evaluate the ejector-driven anode recirculation in a PEM fuel cell system. Appl. Therm. Eng. 2017, 121, 628–651. [Google Scholar] [CrossRef]
  24. Besagni, G.; Mereu, R.; Chiesa, P.; Inzoli, F. An Integrated Lumped Parameter-CFD approach for off-design ejector performance evaluation. Energy Convers. Manag. 2015, 105, 697–715. [Google Scholar] [CrossRef]
  25. Pei, P.; Ren, P.; Li, Y.; Wu, Z.; Chen, D.; Huang, S.; Jia, X. Numerical studies on wide-operating-range ejector based on anodic pressure drop characteristics in proton exchange membrane fuel cell system. Appl. Energy 2018, 235, 729–738. [Google Scholar] [CrossRef]
  26. Yang, Y.; Du, W.; Ma, T.; Lin, W.; Cong, M.; Yang, H.; Yu, Z. Numerical studies on ejector structure optimization and performance prediction based on a novel pressure drop model for proton exchange membrane fuel cell anode. Int. J. Hydrogen Energy 2020, 45, 23343–23352. [Google Scholar] [CrossRef]
  27. Yan, J.; Wen, H. Multi-round optimization of an ejector with different mixing chamber geometries at various liquid volume fractions of inlet fluids. Appl. Therm. Eng. 2022, 200, 117709. [Google Scholar] [CrossRef]
  28. Wu, Y.; Zhao, H.; Zhang, C.; Wang, L.; Han, J. Optimization analysis of structure parameters of steam ejector based on CFD and orthogonal test. Energy 2018, 151, 79–93. [Google Scholar] [CrossRef]
  29. Amin, A.; Elbadawy, I.; Elgendy, E.; Fatouh, M. Effect of geometrical factors interactions on design optimization process of a natural gas ejector. Adv. Mech. Eng. 2019, 11, 168781401988036. [Google Scholar] [CrossRef]
  30. Zhu, Y.H.; Cai, W.J.; Li, Y.Z.; Wen, C.Y. Anode gas recirculation behavior of a fuel ejector in hybrid solid oxide fuel cell systems: Performance evaluation in three operational modes. J. Power Sources 2008, 185, 1122–1130. [Google Scholar] [CrossRef]
  31. Gu, P.; Xing, L.; Wang, Y.; Feng, J.; Peng, X. A multi-objective parametric study of the claw hydrogen pump for fuel cell vehicles using taguchi method and ANN. Int. J. Hydrogen Energy 2021, 46, 6680–6692. [Google Scholar] [CrossRef]
  32. Zhang, Q.; Feng, J.; Zhang, Q.; Peng, X. Performance prediction and evaluation of the scroll-type hydrogen pump for FCVs based on CFD–Taguchi method. Int. J. Hydrogen Energy 2019, 44, 15333–15343. [Google Scholar] [CrossRef]
  33. Amadane, Y.; Mounir, H. Performance improvement of a PEMFC with dead-end anode by using CFD-Taguchi approach. J. Electroanal. Chem. 2022, 904, 115909. [Google Scholar] [CrossRef]
Figure 1. Diagram of the recirculation system for a PEMFC using an ejector.
Sustainability 14 09205 g001
Figure 2. Ejector schematic.
Sustainability 14 09205 g002
Figure 3. Change of center flow characteristics under different mesh cells.
Sustainability 14 09205 g003
Figure 4. Change of wall pressure with different y+.
Sustainability 14 09205 g004
Figure 5. Comparison of simulated results and experimental data from [18]. (a) Mass flow rate of primary and secondary flow. (b) Deviation between simulation and experiment.
Sustainability 14 09205 g005
Figure 6. (a) Effect of nozzle throat diameter (Dt) on anode ejector; (b) Effect of nozzle throat length (Ltd) on anode ejector entrainment ratio; (c) Mach number of different nozzle throat diameter at 110 A; (d) Mach number of different nozzle throat length at 110 A. (Dash red lines 1, 2, and 3 in figure are the nozzle exit, the mixing tube inlet and the mixing tube exit, respectively.)
Sustainability 14 09205 g006aSustainability 14 09205 g006b
Figure 7. (a) Effect of nozzle convergence angle (θtc) on anode ejector; (b) Effect of nozzle divergent angle (θtd) on anode ejector; (c) Mach number of different nozzle divergent angle at 110 A; (d) Mach number of different nozzle divergent angle at 275 A.
Sustainability 14 09205 g007
Figure 8. Effect of NXP on PEMFC ejector. (a) Entrainment ratio; (b) Mach number of different NXP at 275 A; (c) Velocity vector diagrams of different NXP at 110 A. (The black box shows an enlarged view of the local flow. The red circle represents the vortex generation zone.)
Sustainability 14 09205 g008
Figure 9. Effect of suction chamber angle (θs) on PEMFC ejector. (a) Entrainment ratio; (b) Mach number of different suction chamber angle at 110 A.
Sustainability 14 09205 g009
Figure 10. Effect of mixing tube diameter (Dm) on PEMFC ejector. (a) Entrainment ratio; (b) Velocity vector diagrams of different mixing tube diameter at 110 A.
Sustainability 14 09205 g010
Figure 11. Effect of mixing tube length (Lm) on PEMFC ejector. (a) Entrainment ratio; (b) Velocity vector diagrams of different mixing tube length at 110A.
Sustainability 14 09205 g011
Figure 12. Effect of diffuser length (Ld) on PEMFC ejector entrainment ratio.
Sustainability 14 09205 g012
Figure 13. Factor level response to S/N for excess ratio in 110 A.
Sustainability 14 09205 g013
Figure 14. Factor level response to S/N for excess ratio in 275 A.
Sustainability 14 09205 g014
Figure 15. Factor level response to S/N for excess ratio in 412.5 A.
Sustainability 14 09205 g015
Figure 16. Comparison of initial ejector with optimized ejector.
Sustainability 14 09205 g016
Table 1. Fuel cell and ejector requirement.
Current
(A)
Power
(kW)
Mass Flow Rate of Primary Flow (g/s)Ejector Exit Pressure
(bar)
Ejector Secondary Flow Pressure
(bar)
H2 Mass Fraction of Secondary Flow
(%)
Entrainment Ratio
553.80.052431.31.2130.694.26
1107.40.103361.521.420.652.68
165100.155791.751.640.612.14
220140.206721.961.8450.581.90
27516.50.257652.22.080.551.77
330200.310092.22.070.551.77
385220.361022.22.0550.551.77
412.523.50.387982.22.0390.551.77
Table 2. Initial structural parameters of designed ejector.
ParametersValueParametersValue
Nozzle diameter (Dt)0.94 mmMixing tube length (Lm)20 mm
Mixing tube diameter (Dm)3.2 mmSuction chamber angle (θs)30°
Nozzle convergence angle (θtc)11°Nozzle exit position (NXP)3 mm
Nozzle throat length (Ltd)0.5 mmDiffuser length (Ld)40 mm
Nozzle divergent angle (θtd)
Table 3. Comparison of ER with different nesh numbers.
ModelMesh
Cells
ERRelative
Deviation
153,1441.8897066.78%
296,7291.9824592.21%
3153,1442.0065311.02%
4199,5492.0179660.46%
5300,3392.0272540.00%
Table 4. Effect of near-wall mesh.
y+maxPrimary Flow
(g·s−1)
Secondary Flow
(g·s−1)
Relative Deviation
4.50.3880.761830.021%
2.250.3880.762180.068%
10.3880.761670
Table 5. Factors and levels of the Taguchi experimental method.
levelθtd (A)Lt (B)NXP (C)Dm (D)Lm (E)
100.512.212
21.51.522.615
33.52.533.018
44.53.543.421
564.553.824
Table 6. Construction of orthogonal array L25(55).
L25(55)ABCDE
111111
212222
313333
414444
515555
621234
722345
823451
924512
1025123
1131352
1232413
1333524
1434135
1535241
1641425
1742531
1843142
1944253
2045314
2151543
2252154
2353215
2454321
2555432
Table 7. Optimal combinations and predict excess ratio.
ObjectiveCombination110 A220 A 412.5 A
S/NλS/NλS/Nλ
Low currentA1B1C5D2E211.663.839.953.147.722.43
Middle currentA1B2C5D5E34.941.7614.575.3512.764.34
High currentA1B2C5D5E54.851.7414.305.1912.774.35
Operating rangeA1B1C3D3E211.353.6911.643.829.402.95
Table 8. Optimized results in combination with single-factor results and multi-factor results.
StructureInitial EjectorOptimized by Single-FactorOptimized by Multi-Factor
Nozzle divergent angle000
Nozzle throat length0.560.5
NXP31.53
Mixing tube length201815
Mixing tube diameter3.233
Publisher’s Note: MDPI stays neutral with regard to jurisdictional claims in published maps and institutional affiliations.

