Article

Lumped Parameter Modeling of SAE J2601 Hydrogen Fueling Tests

1
Hubei Research Center for New Energy & Intelligent Connected Vehicle and Hubei Key Laboratory of Advanced Technology for Automotive Components, School of Automotive Engineering, Wuhan University of Technology, Wuhan 430070, China
2
School of Artificial Intelligence, Jianghan University, Wuhan 430056, China
3
Hydrogen Research Institute, Université du Québec à Trois-Rivières, Trois-Rivières, QC G9A 5H7, Canada
*
Author to whom correspondence should be addressed.
Sustainability 2023, 15(2), 1448; https://doi.org/10.3390/su15021448
Submission received: 24 October 2022 / Revised: 24 December 2022 / Accepted: 10 January 2023 / Published: 12 January 2023
(This article belongs to the Special Issue Hydrogen as a Sustainable Energy: Current Status and Future Prospect)

Abstract

:
The safety of hydrogen storage is essential for the development of fuel cell vehicles. A mathematical model for a compressed hydrogen storage tank is established based on the mass conservation equation, the energy conservation equation and the real gas equation of state. Using the Matlab/Simulink platform, a dual-zone lumped parameter model, which divides the tank into a hydrogen gas zone and a tank wall zone, is established. The initial conditions of the MC Default method hydrogen filling from SAE J2601 are utilized in the lumped parameter model for numerical simulation. Five cases are studied, including two different tanks. One case used the Lookup table for hydrogen refueling, and four cases used the MC Default method for fueling. The hydrogen gas temperature, wall temperature, pressure in the tank and state of charge are obtained during the fueling process. The simulated results show that the dual-zone lumped parameter model can well predict the temperature, pressure and state of charge (SOC) for Type IV tanks with volumes of 249 L and 117 L during refueling. By using the averaged heat transfer coefficient (80 W/(m2·K)) between gas and wall, and the constant heat transfer coefficient (20 W/(m2·K)) between wall and environment, the gas temperature and pressure of our dual-zone lumped parameter model show good agreement with the experiment. The maximum difference between simulated and experimental wall temperatures for five cases is around 2 °C. The experimental wall temperatures were measured on the external surface of the tank, while the simulated wall temperature of the dual-zone lumped parameter model is representative of a mean temperature averaged alone with the radial direction.

1. Introduction

With the increase in population of vehicles, there are two major problems facing the sustainable development of the global automotive industry: energy supply and environment protection. According to the current world consumption rate of fossil fuels, the utilization times of oil, natural gas and coal are 45~50 years, 50~60 years and 200~220 years. Furthermore, the CO2, CO and other gasses emitted by fossil fuels also lead to the environmental problems of the greenhouse effect. Therefore, developing and utilizing new energy sources is imminent to meet industry development [1,2,3,4].
As an energy carrier, hydrogen is environmentally friendly, renewable and has a high combustion calorific value. It is ideal for fuel cell vehicles [5,6]. However, its non-storage and transportation characteristics limit the utilization of hydrogen energy in a wide range. Solving those problems will greatly promote the utilization of hydrogen energy and the development of fuel cell vehicles [7]. Methods of storing hydrogen include metal hydrogen storage, liquid hydrogen storage and compressed hydrogen storage. Fuel cell vehicles generally use compressed hydrogen storage tanks to store hydrogen.
Compressed hydrogen tanks must meet two conditions to ensure the safety and convenience of hydrogen filling: (1) the hydrogen temperature inside the compressed hydrogen tank cannot exceed 85 °C; (2) the pressure in the compressed hydrogen tank at the end of fueling cannot exceed 1.25 NWP (Nominal Working Pressure). Therefore, studying the hydrogen gas temperature and pressure variation in the fueling process for a compressed hydrogen tank is significant. SAE J2601 Fueling Protocols for Light Duty Gaseous Hydrogen Surface Vehicles was initially released in 2010 and updated in 2020 [8]. The protocol mainly introduced the utilization of Lookup table methods for hydrogen fueling. The Lookup table method is based on a set of tables that are summarized from the filling process with different types of hydrogen storage tanks and refueling conditions. Therefore, a set of refueling parameters can be used during the refueling process by selecting the corresponding table according to the tank type and initial refueling conditions [9,10].
HONDA Corporation proposed a new fueling method called the MC method. According to the MC model, the multilayer structure of a compressed hydrogen tank can be regarded as a single-layer structure called characteristic volume. This structure combined mass M and heat capacity C, which gives a parameter named MC. It is important to know that characteristic volume is a mathematical structure. MC is used to evaluate how much heat is transferred into the tank wall during the fueling process. Unlike other models, characteristic volume is a heat sink rather than a structure for heat transfer. As mentioned above, the Lookup table method is based on the tank types, while the MC method can satisfy all types of the compressed hydrogen tank. Therefore, the MC method can greatly reduce the construction cost and workload for hydrogen fueling stations. Moreover, the MC method can effectively shorten the fueling time and improve fueling efficiency [11,12].
Based on TIR J2601, SAE J2601 was released as a version of the hydrogen storage standard protocol for fuel cell vehicles. In this new standard protocol, SAE introduced the MC method and conducted a set of fueling experiments to verify this method. It is the first time that the MC method has been introduced in a standard protocol. Furthermore, the variation of hydrogen temperature and other parameters during the fueling process of the MC model have been studied and compared with the experimental data of the Lookup table method. The results show that the MC method can accurately forecast the variation in hydrogen temperature during refueling [13,14,15].
Although the MC method has a wide range of applications, it is difficult to determine the value of the parameter MC in the fueling process. It can be calculated after repeated experiments. However, under different initial conditions, the value of the MC will accordingly change. Therefore, it is important to establish a model which can simulate the hydrogen fueling process for a compressed hydrogen tank [11,12,13]. There are two kinds of models for refueling simulation, the 0D model and the CFD model. With those models, the fueling strategies can be studied [16,17]. Furthermore, the fueling parameter and gas temperature distribution can be analyzed [18,19].
In order to speed up the commercialization of hydrogen fuel, the hydrogen data-sharing website H2Protocol.com was established in June 2015, which was proposed at the infrastructure workshop between the U.S. DOE (Department of Energy), German NOW (National Organization hydrogen and Fuel Cell Technology), Japanese NEDO (New Energy and Industrial Technology Development Organization) and Scandinavian government and industry representatives. The experimental data used in this paper come from this website [20]. Many scholars have also carried out research on hydrogen by using other experimental data. Ebru et al. [21] used traffic flow data to determine the HFCVs demand and conduct multi-period planning of HRS. Tim et al. [22] collected data on each refueling step for 1000 s of hydrogen refueling to gain insight into the impact of site capacity on customer wait times and network capacity for emerging infrastructure elsewhere. Based on data from quarterly reports of hydrogen production and dispensing, and from its data acquisition system, Matteo et al. [23] assessed possible critical points, calculations, mathematical modeling and analysis. Their analysis reduced the hydrogen losses in fueling station operations. Matteo et al. [24] shared comprehensive data for one year on fueling events frequency and refueling process station behaviors, and evaluated the performance of refueling stations under different load scenarios in severe conditions. Their presented data analysis could contribute as closer-to-reality inputs for various station performance modeling tools. In this study, we only used the experimental data in SAE J2601 for model verification. In future work, we could also use the data mentioned in the above references for model verification research.
A dual-zone lumped parameter model is used to simulate MC default fueling in this paper, and five cases that used the same initial fueling condition in the experiment are studied. Thus, the dual-zone lumped parameter model can be validated. Literature research shows that the lumped parameter modeling of hydrogen storage tanks and the derivation of related analytical solutions are the significant creative contributions of our team in this field. Our lumped parameter model has already been used to estimate final hydrogen temperature and mass, storage tank state of charge (SOC), refueling time and inflow temperature. The lumped parameter model of storage tanks can also be further extended to single-stage and cascade hydrogen refueling stations (HRSs), providing theoretical guidance for improving filling efficiency and safety in actual HRS.

2. Thermodynamic Model for Hydrogen Refueling

The walls of compressed hydrogen tanks consists of a wrap and liner. Generally, the liner is made of an alloy or plastic material, and the wrap is reinforced by carbon fiber, which has good mechanical properties. The dual-zone lumped parameter model regards the tank wall as a single-layer structure, and the compressed hydrogen tank is divided into two zones: the gas zone and the wall zone. The mass conversation equation and energy conversation equation for the dual-zone model are as follows [25,26]:
d m d t = m ˙
d m u d t = m ˙ h + A in a in T w T
d m w u w d t = A in a in T w T + A out a out T w T f
where m (kg) is mass of hydrogen, m ˙ (kg/s) is hydrogen mass inflow rate, t (s) is refueling time, h (J/kg) is hydrogen’s specific enthalpy, u (J/kg) is hydrogen’s specific internal energy, A in (m2) is internal surface area, a in (W/(m2·K)) is heat transfer coefficient between the tank wall and hydrogen, T w (K) is the temperature of the tank wall, T (K) is hydrogen temperature, m w (kg) is mass of tank wall, u w (J/kg) is the specific internal energy of the tank wall, A out (m2) is the external surface area, a out (W/(m2·K)) is the heat transfer coefficient between the tank wall and its environment, T f (K) is the temperature of the environment. When the mass inflow rate is constant, the solution of the ordinary differential equation of mass is as follows [25,26]:
m = m 0 + m ˙ t
when the inflow hydrogen temperature T i (K) is constant. h = c p T i and u = c v T . Therefore, Equations (2) and (3) become follows [27]:
d m c v T d t = m ˙ c p T i + A in a in T w T
where the c v (J/(kg·K)) and c p (J/(kg·K)) are the constant-volume and the constant-pressure specific heat of hydrogen, respectively. T i (K) is inflow gas temperature. c w (J/(kg·K)) is the specific heat of the tank wall, which can be calculated by the specific heats of the lining and the wrap.
According to the real gas equation of state, the pressure in the compressed hydrogen tank can be calculated by the following equation:
p = m Z R T V M H 2
where Z represents the real gas compressibility factor, which is calculated by the fluid thermodynamic and transport properties database (REFPROP) from the National Institute of Standards and Technology (NIST) [28]. R is the universal gas constant, V (m3) is tank volume, M H 2 (kg/mol) is hydrogen molecular weight.
The state of charge (SOC) is the ratio of current hydrogen density to the one at NWP (nominal working pressure) at 15 °C, which can be expressed as the following [9]:
SOC = ρ p , T ρ NWP , 15   × 100 %
where the hydrogen density at a nominal working pressure (NWP) of 70 MPa and 15   is 40.2 g/L [9].

3. Matlab/Simulink Model for Hydrogen Refueling

There are two types of compressed hydrogen tanks in the marketplace: Type III, with aluminum alloy lining, and Type IV, with plastic lining. Different lining materials have different heat transfer coefficients, which affect the heat transfer process. This paper uses Type IV 249 L and Type IV 117 L tanks to study refueling processes, and the nominal working pressure of those tanks is 70 MPa. According to the safety limit, the maximum pressure in the tank cannot exceed 70 × 125% MPa; i.e., 87.5 MPa. Experimental data for Type IV 249 L and Type IV 117 L tanks were obtained from Ref. [8]. The parameters of tanks are listed in Table 1 [9]. Material properties of hydrogen and heat transfer coefficient are given in Table 2 [27]. In Table 1, c w is calculated by the mass-weighted average of the specific heat of the lining and wrap, and the total mass and effective specific heat of the tank wall were calculated by
m w = m w in + m w out
c w = m w in m w c w in + m w out m w c w out
For the real compressed hydrogen storage tank, the mass of the wrap is much larger than the mass of the lining, therefore, m w out / m w is much higher than m w in / m w , which means the value of c w is close to the value of c w out in the dual-zone model. In order to simplify the model, a in is the average value of the heat transfer coefficient in the whole process, and T i is calculated by mass-weighted average hydrogen inflow temperature:
T i = j = 1 n T i , j m j j = 1 n m j
Based on Equations (1), (2) and (6), a Matlab/Simulink model was established to simulate the refueling process for compressed hydrogen tanks, and five cases were simulated in this paper. We solved the nonlinear ordinary differential equation set by Matlab/Simulink platform. Table 3 shows the initial conditions of five cases [25,26]. The initial temperature in the tank T 0 is often equal to the ambient temperature.

4. Results

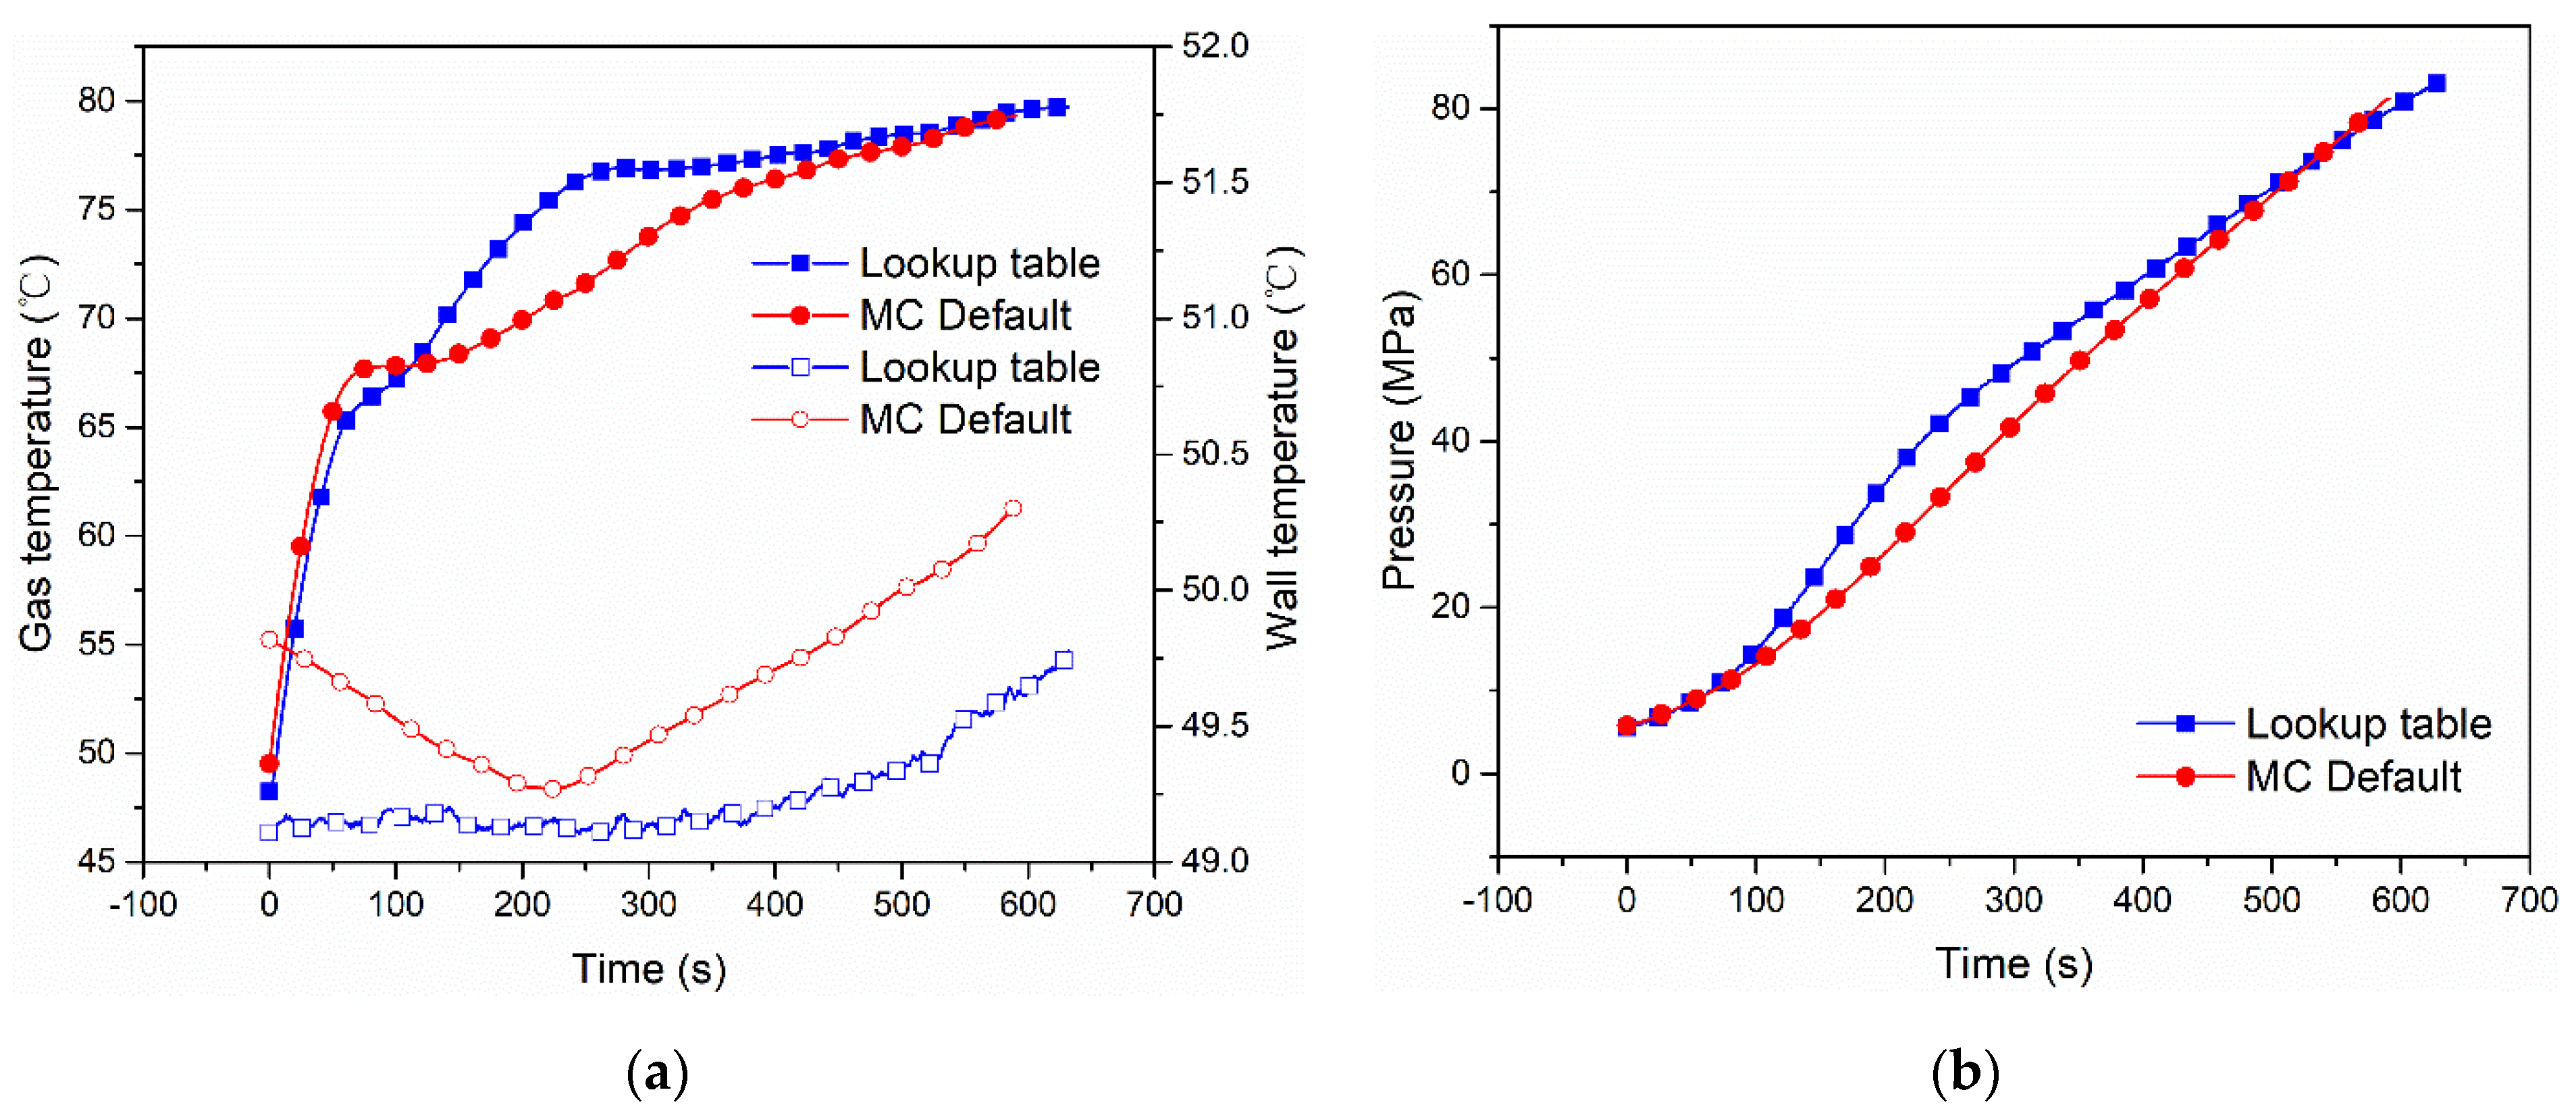
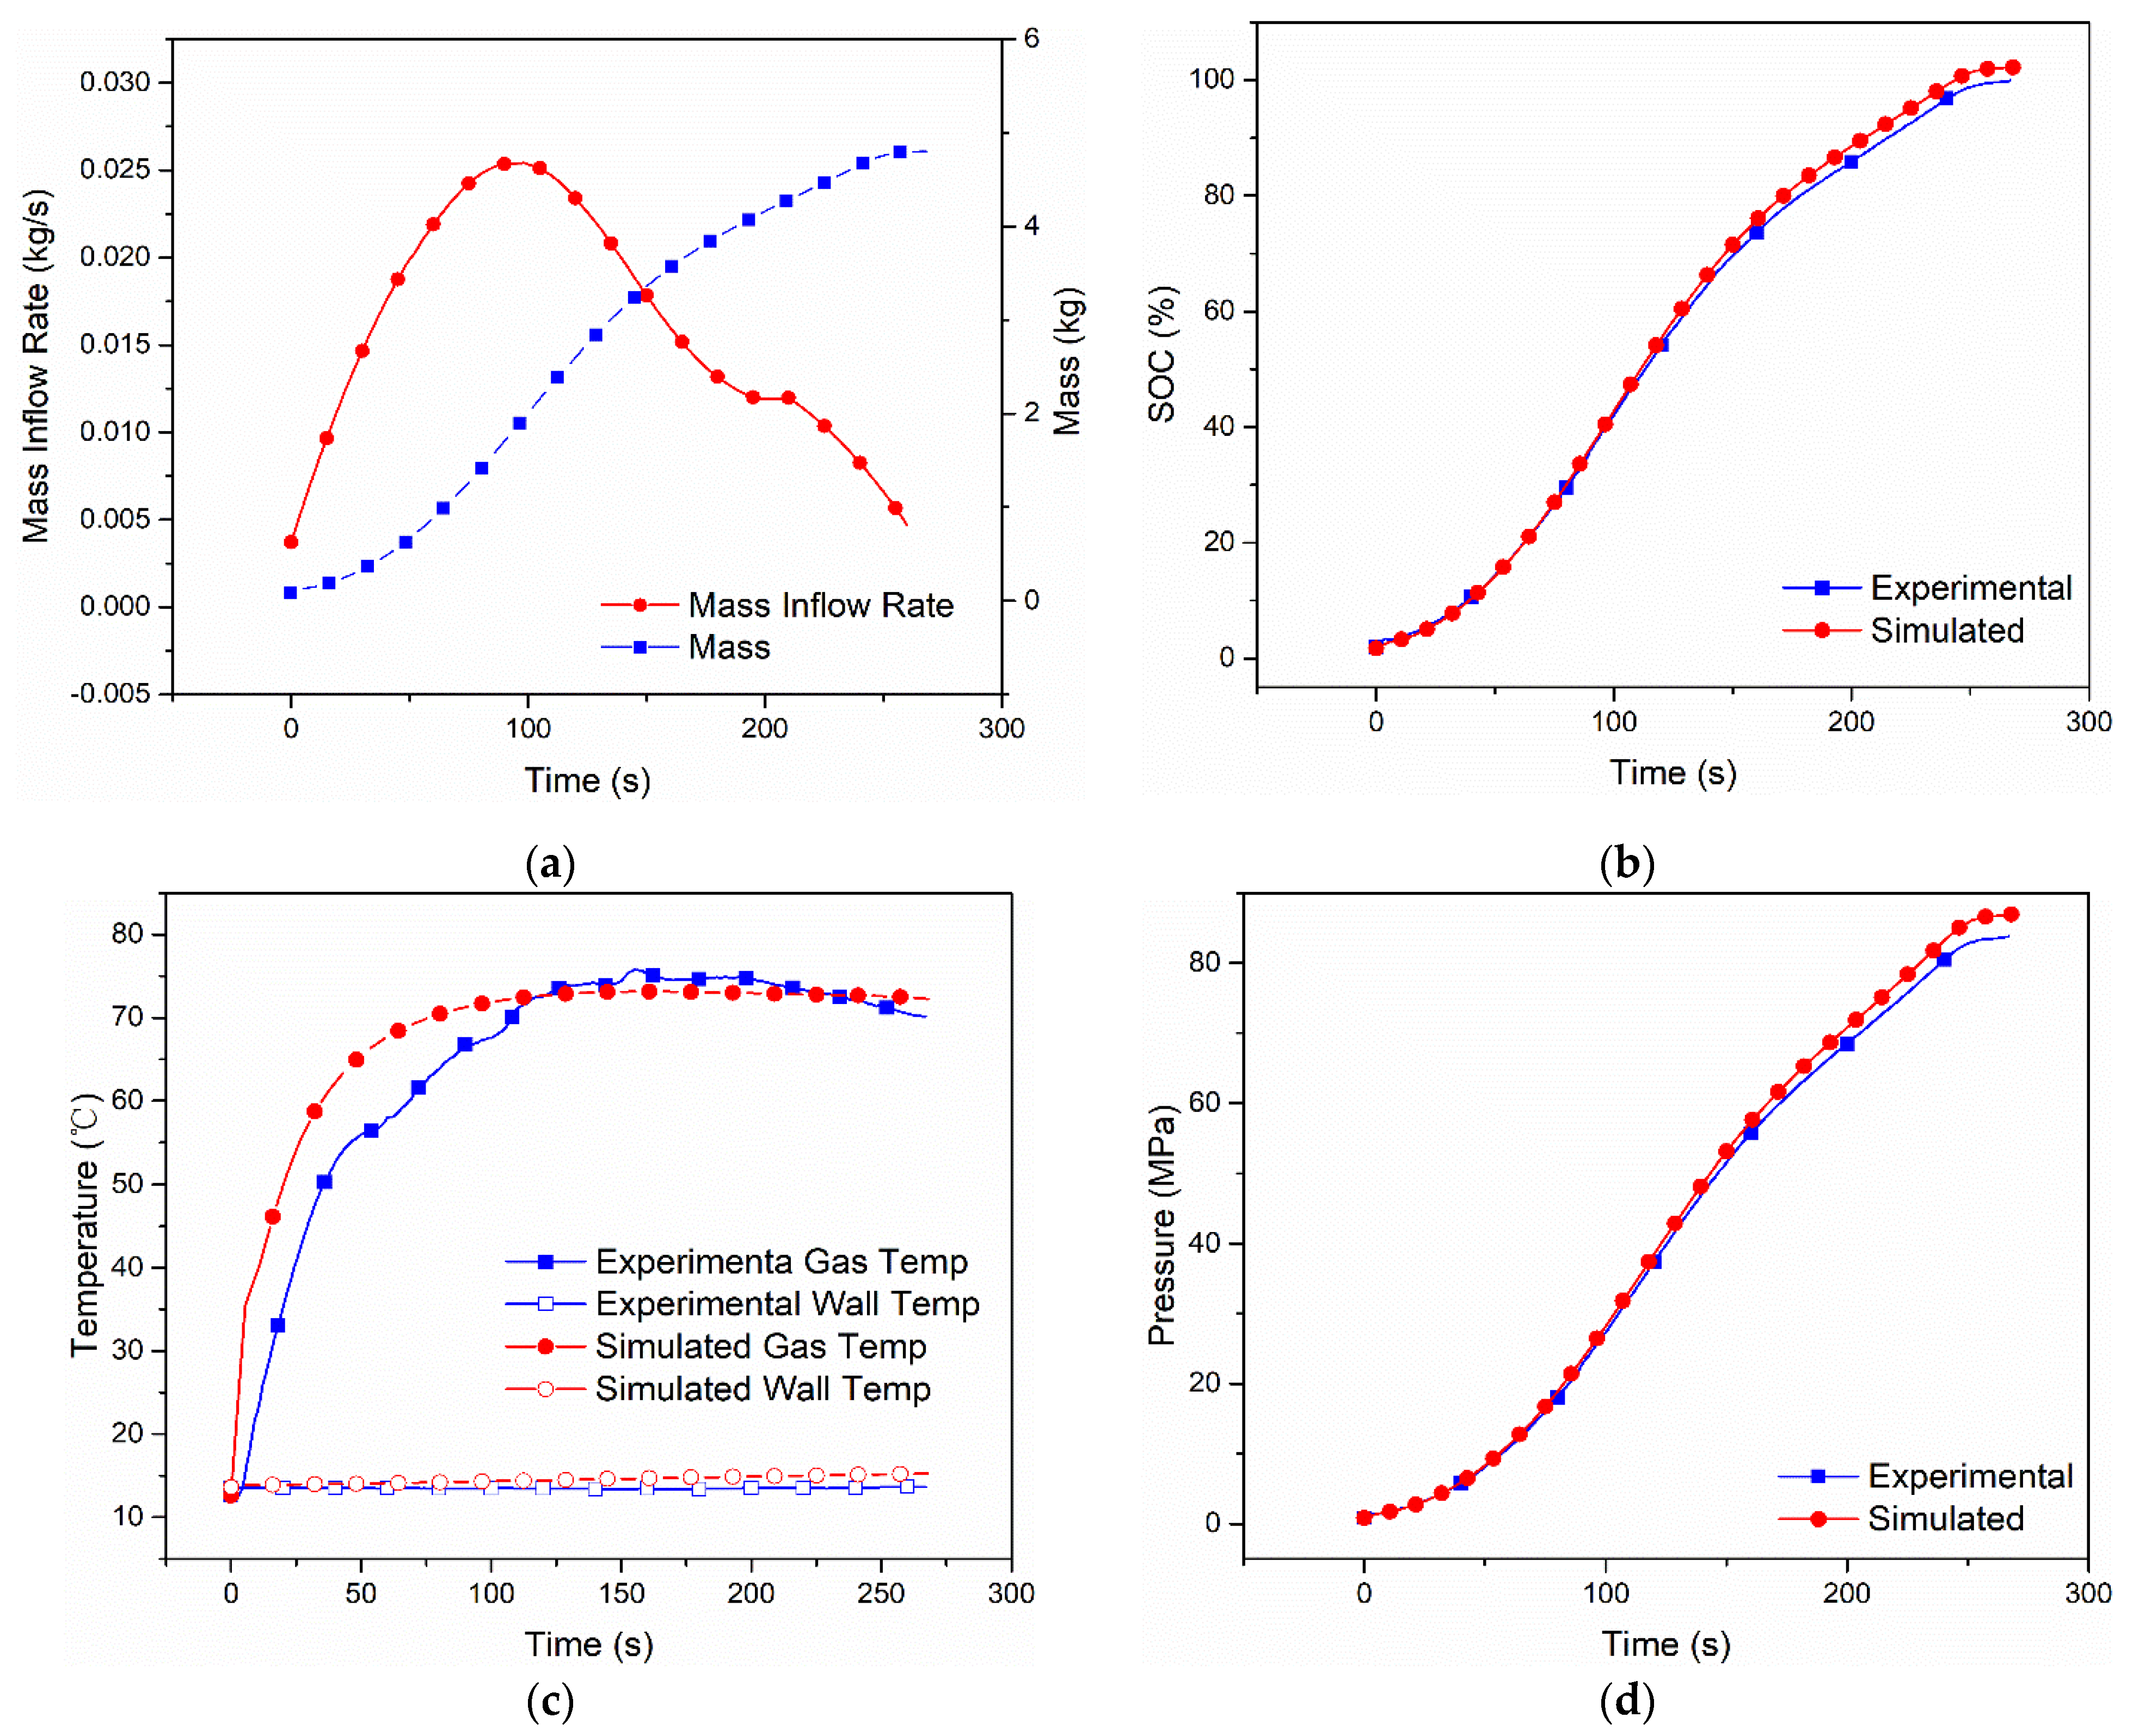
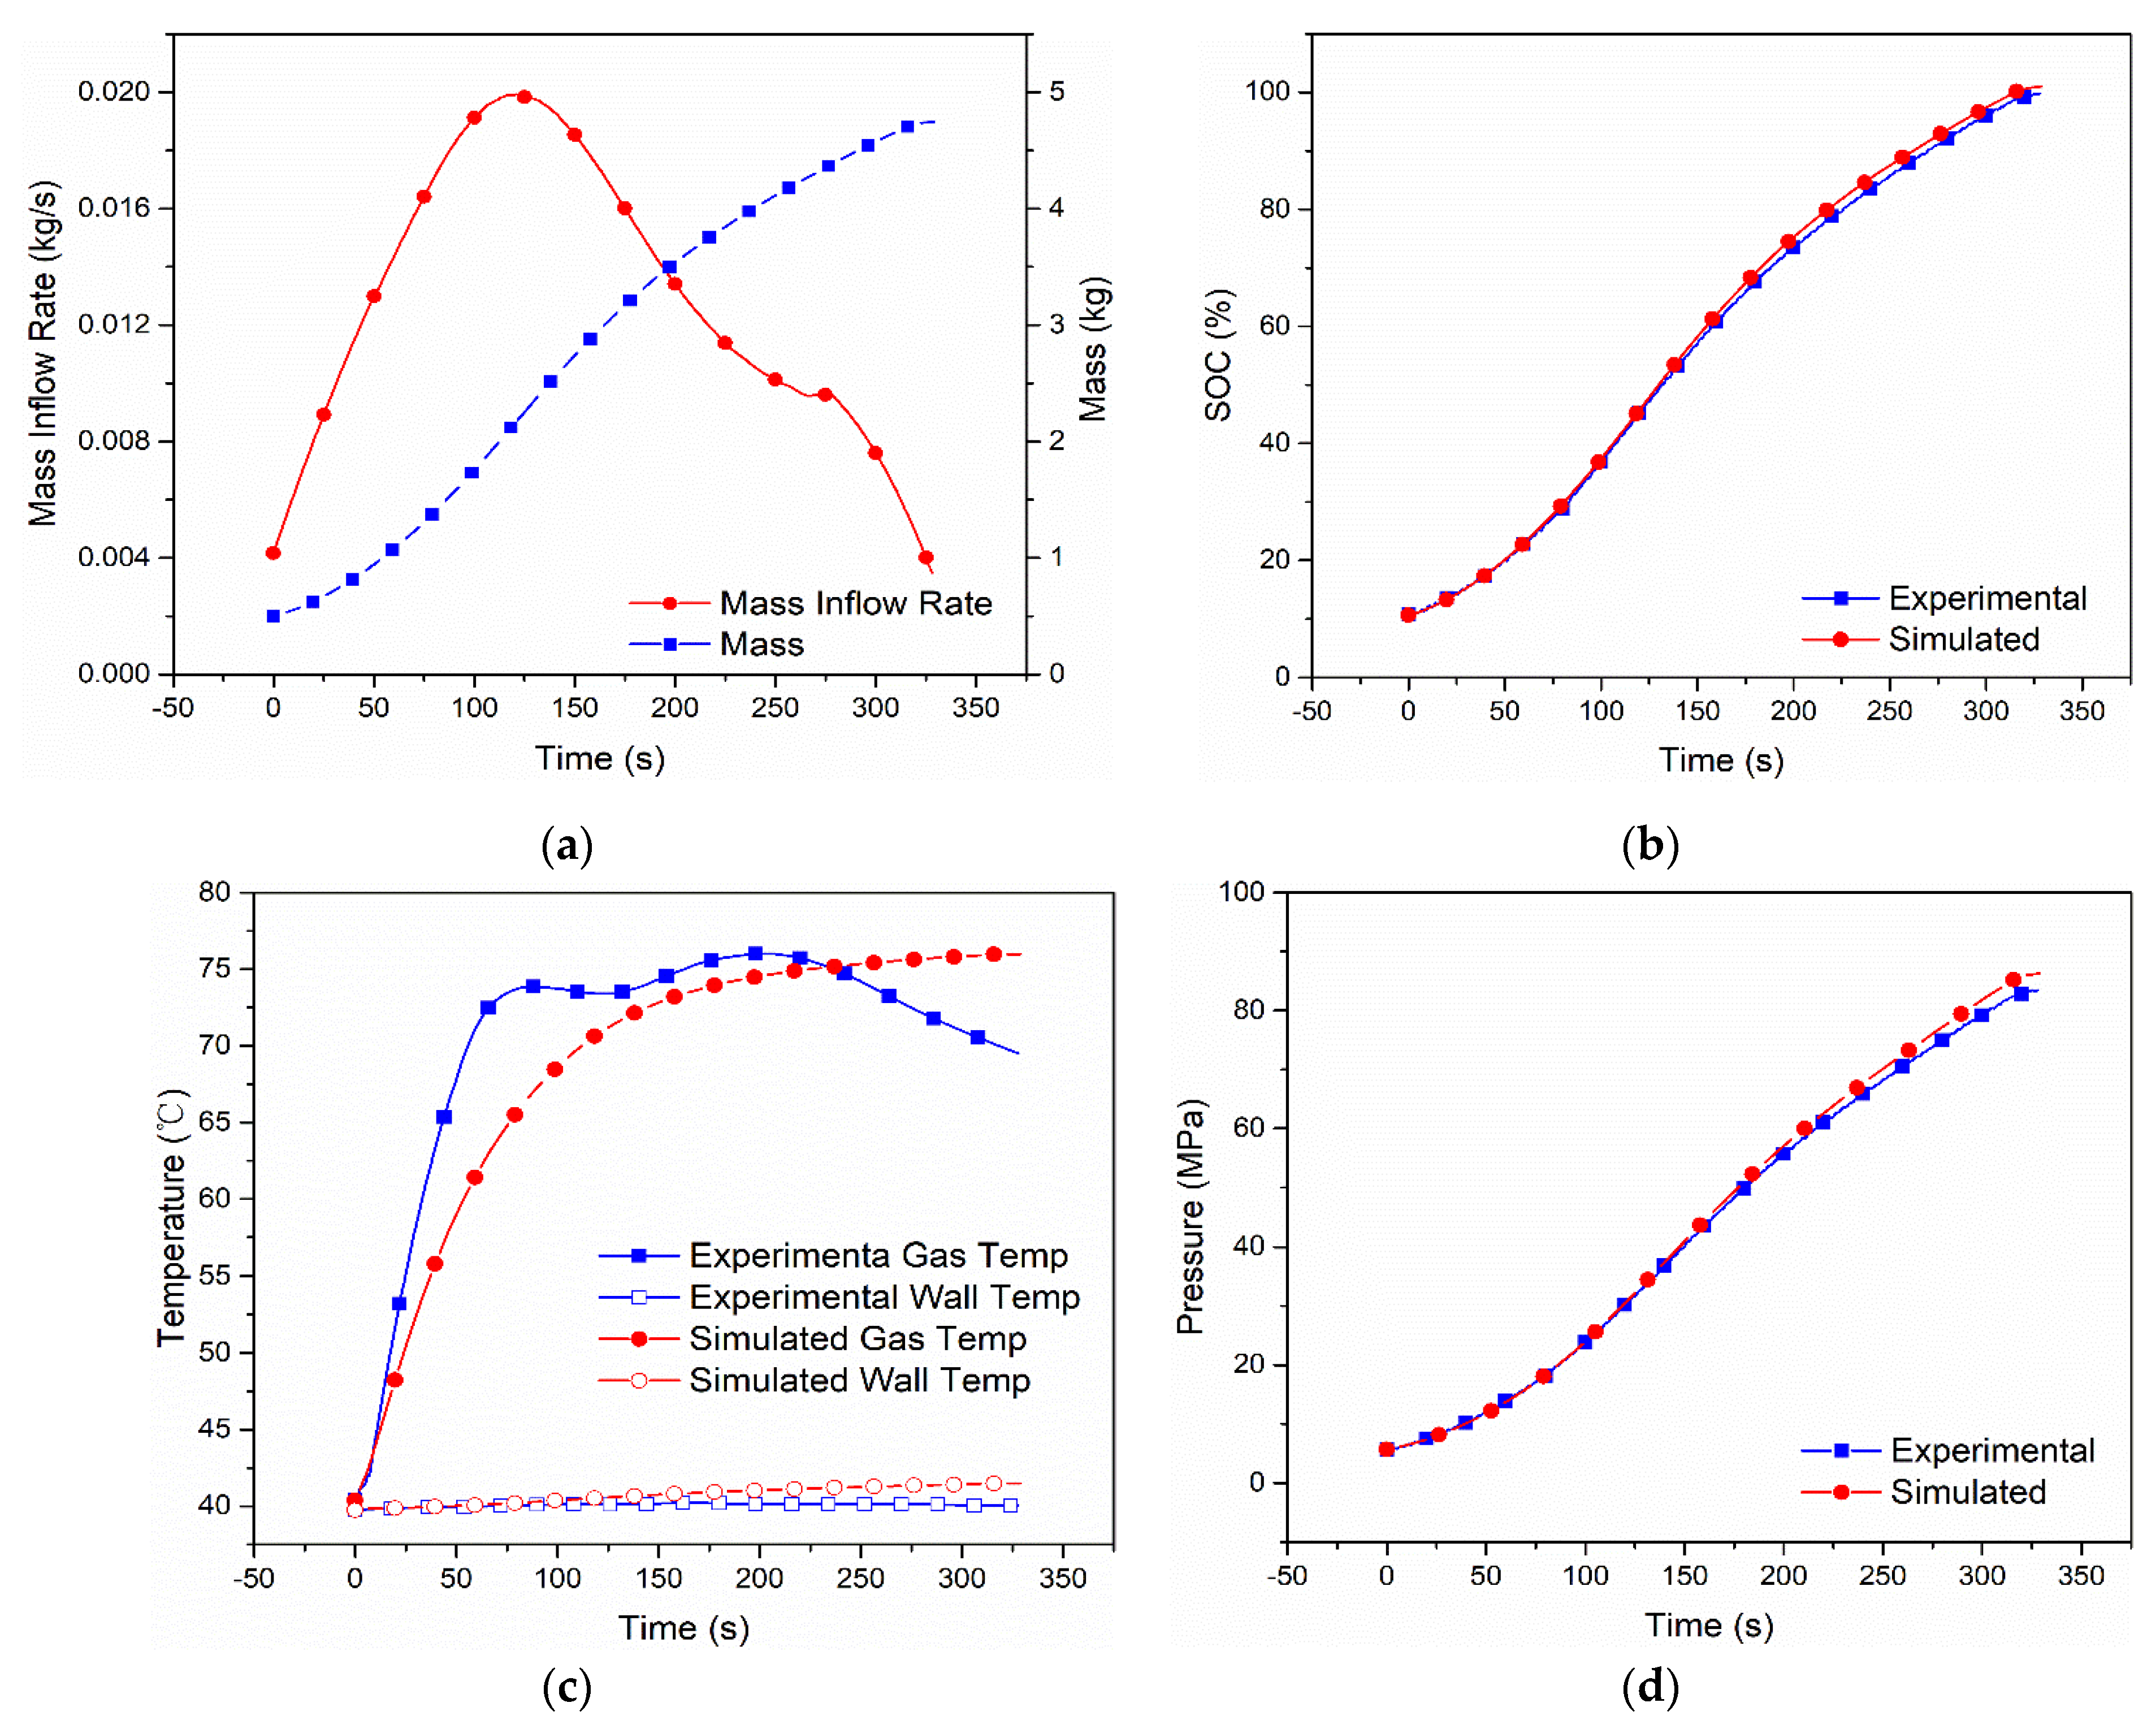
4.1. Comparison of Lookup Table Fueling and MC Default Fueling for Type IV 249 L Tank

In order to compare the filling characteristics of the Lookup table fueling and MC Default fueling, two sets of experiments were conducted to compare the pressure and temperatures, including hydrogen temperature and tank wall temperature. The two experiments were carried out using Lookup table fueling and MC Default fueling with the Type IV 249 L tank. The initial fueling conditions are as shown in Case 1 and Case 2. The comparison of hydrogen temperature, wall temperature and pressure is shown in Figure 1. Figure 1 shows the comparison of gas temperature, wall temperature and pressure of Lookup table refueling and MC Default refueling with Type IV 249 L tank. The hydrogen temperature and pressure of the two fueling methods are substantially the same during the fueling process.

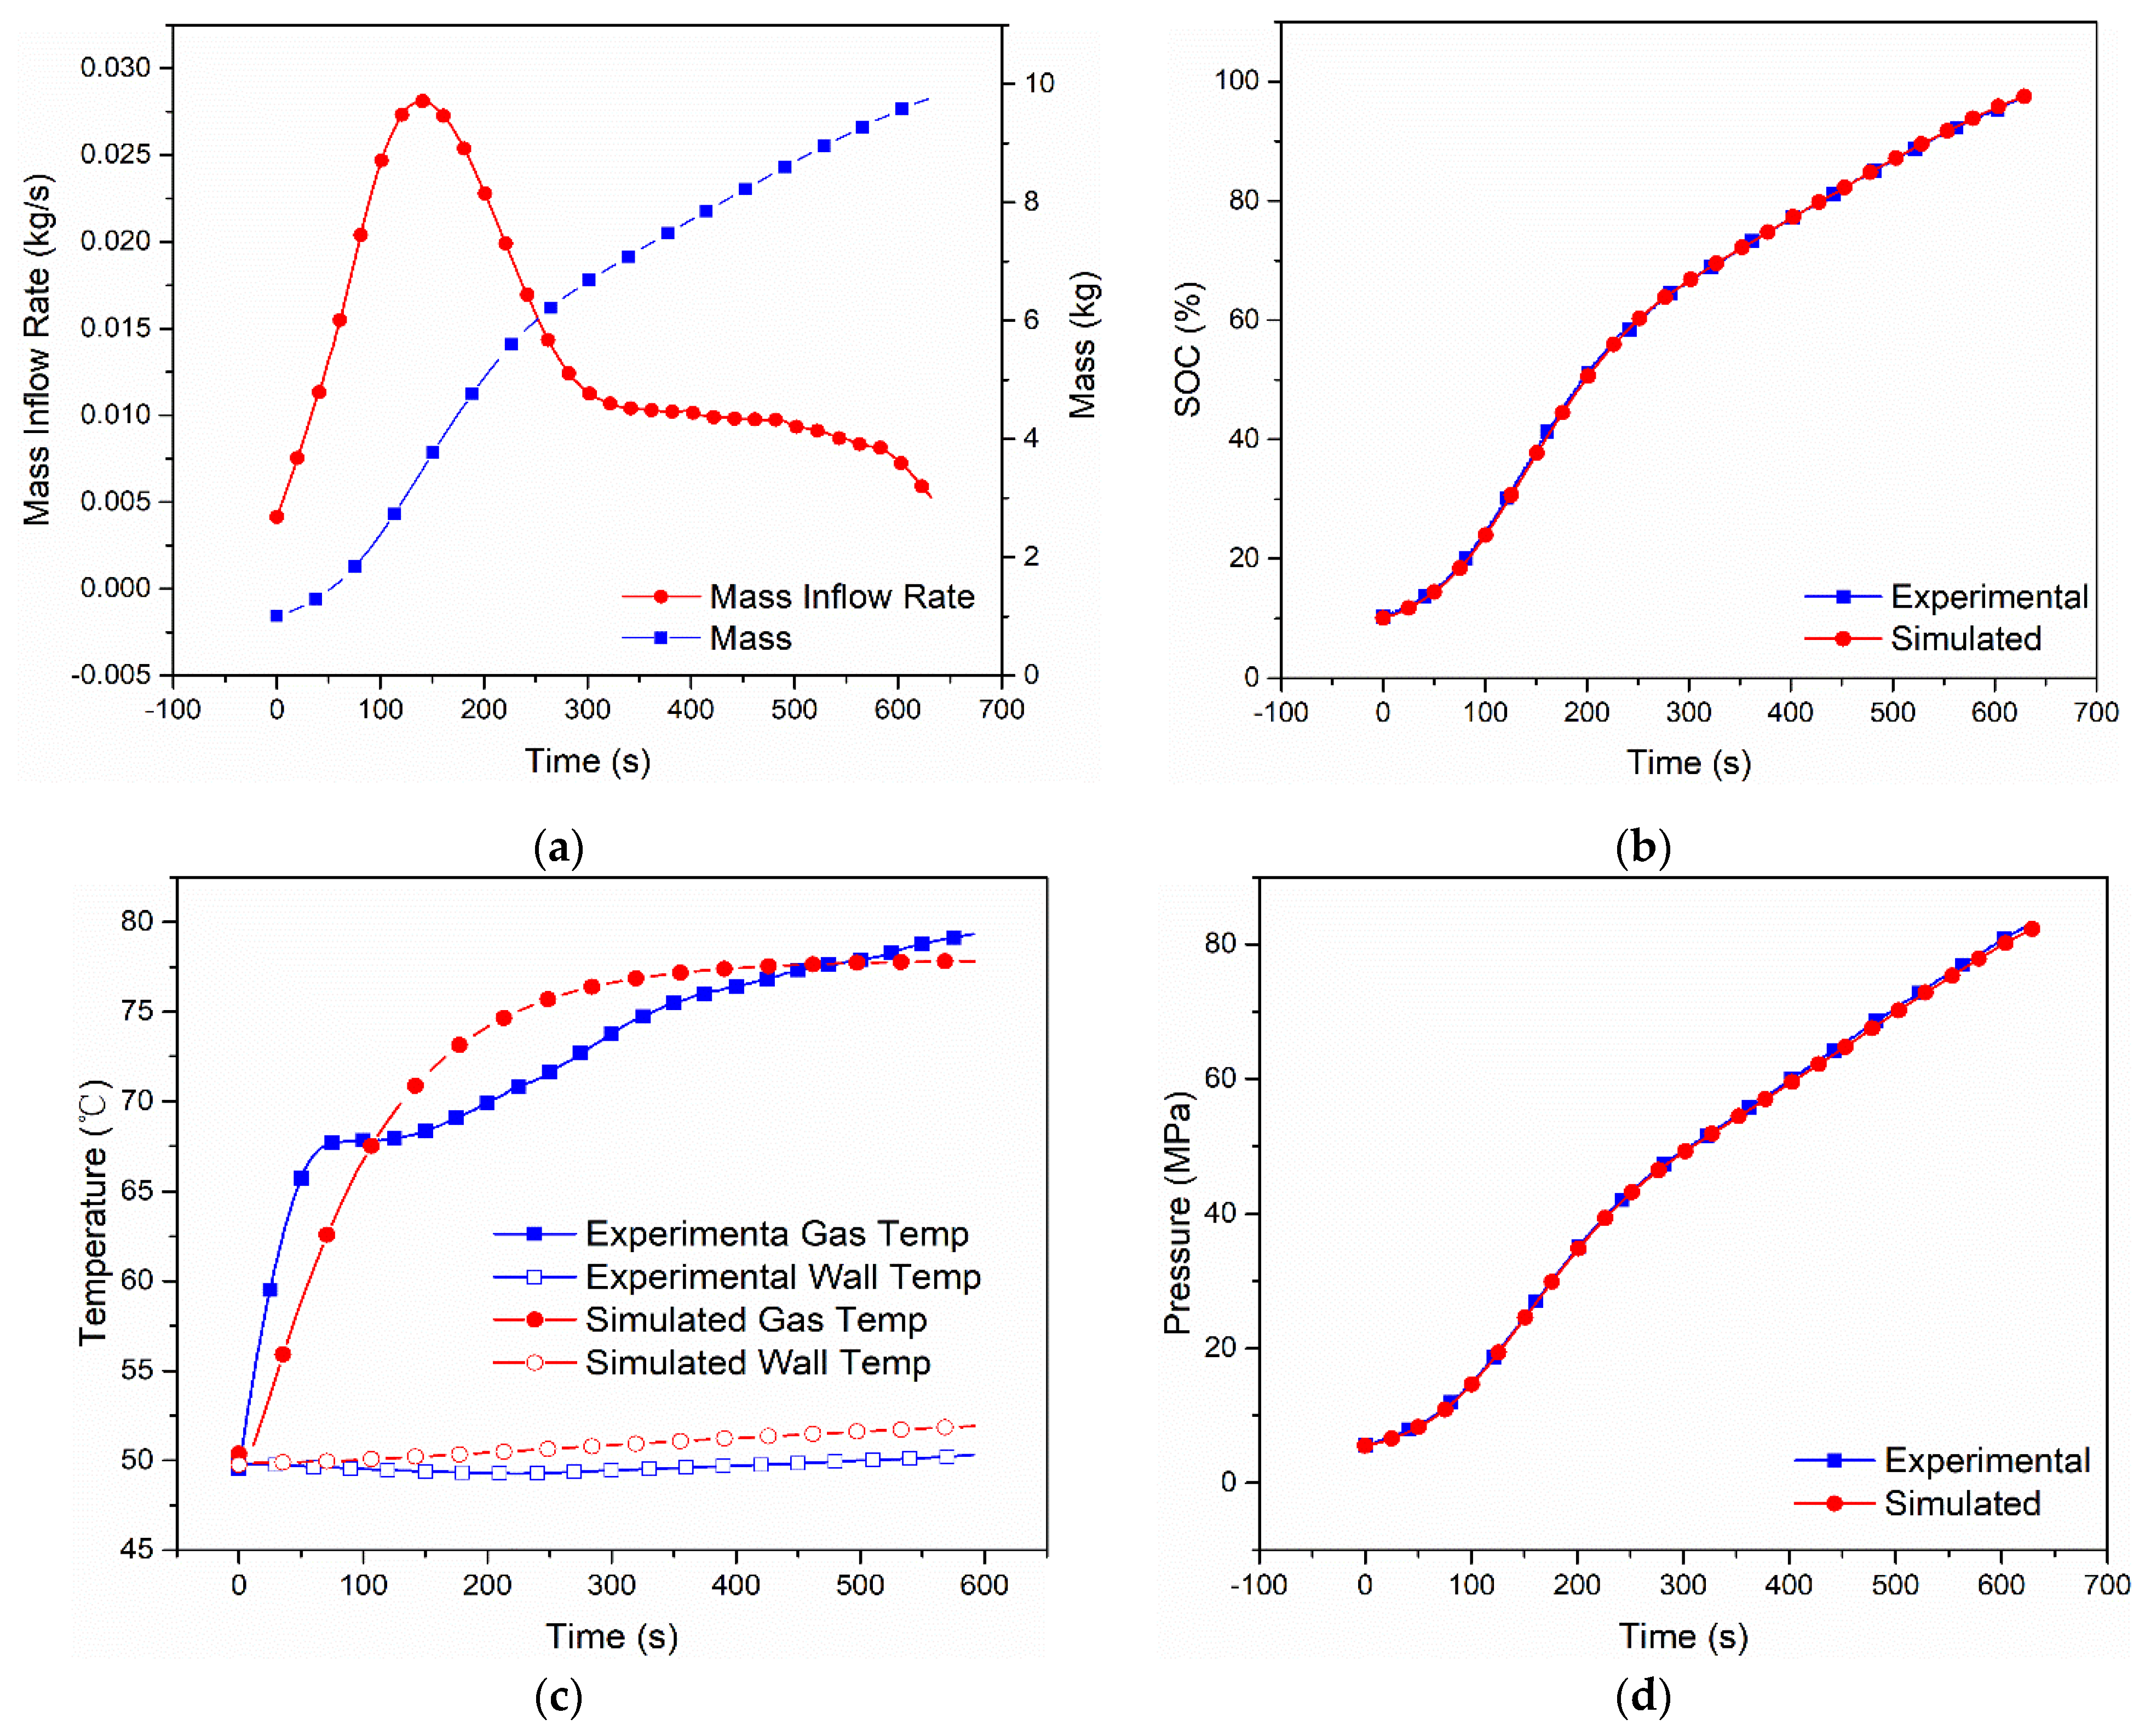
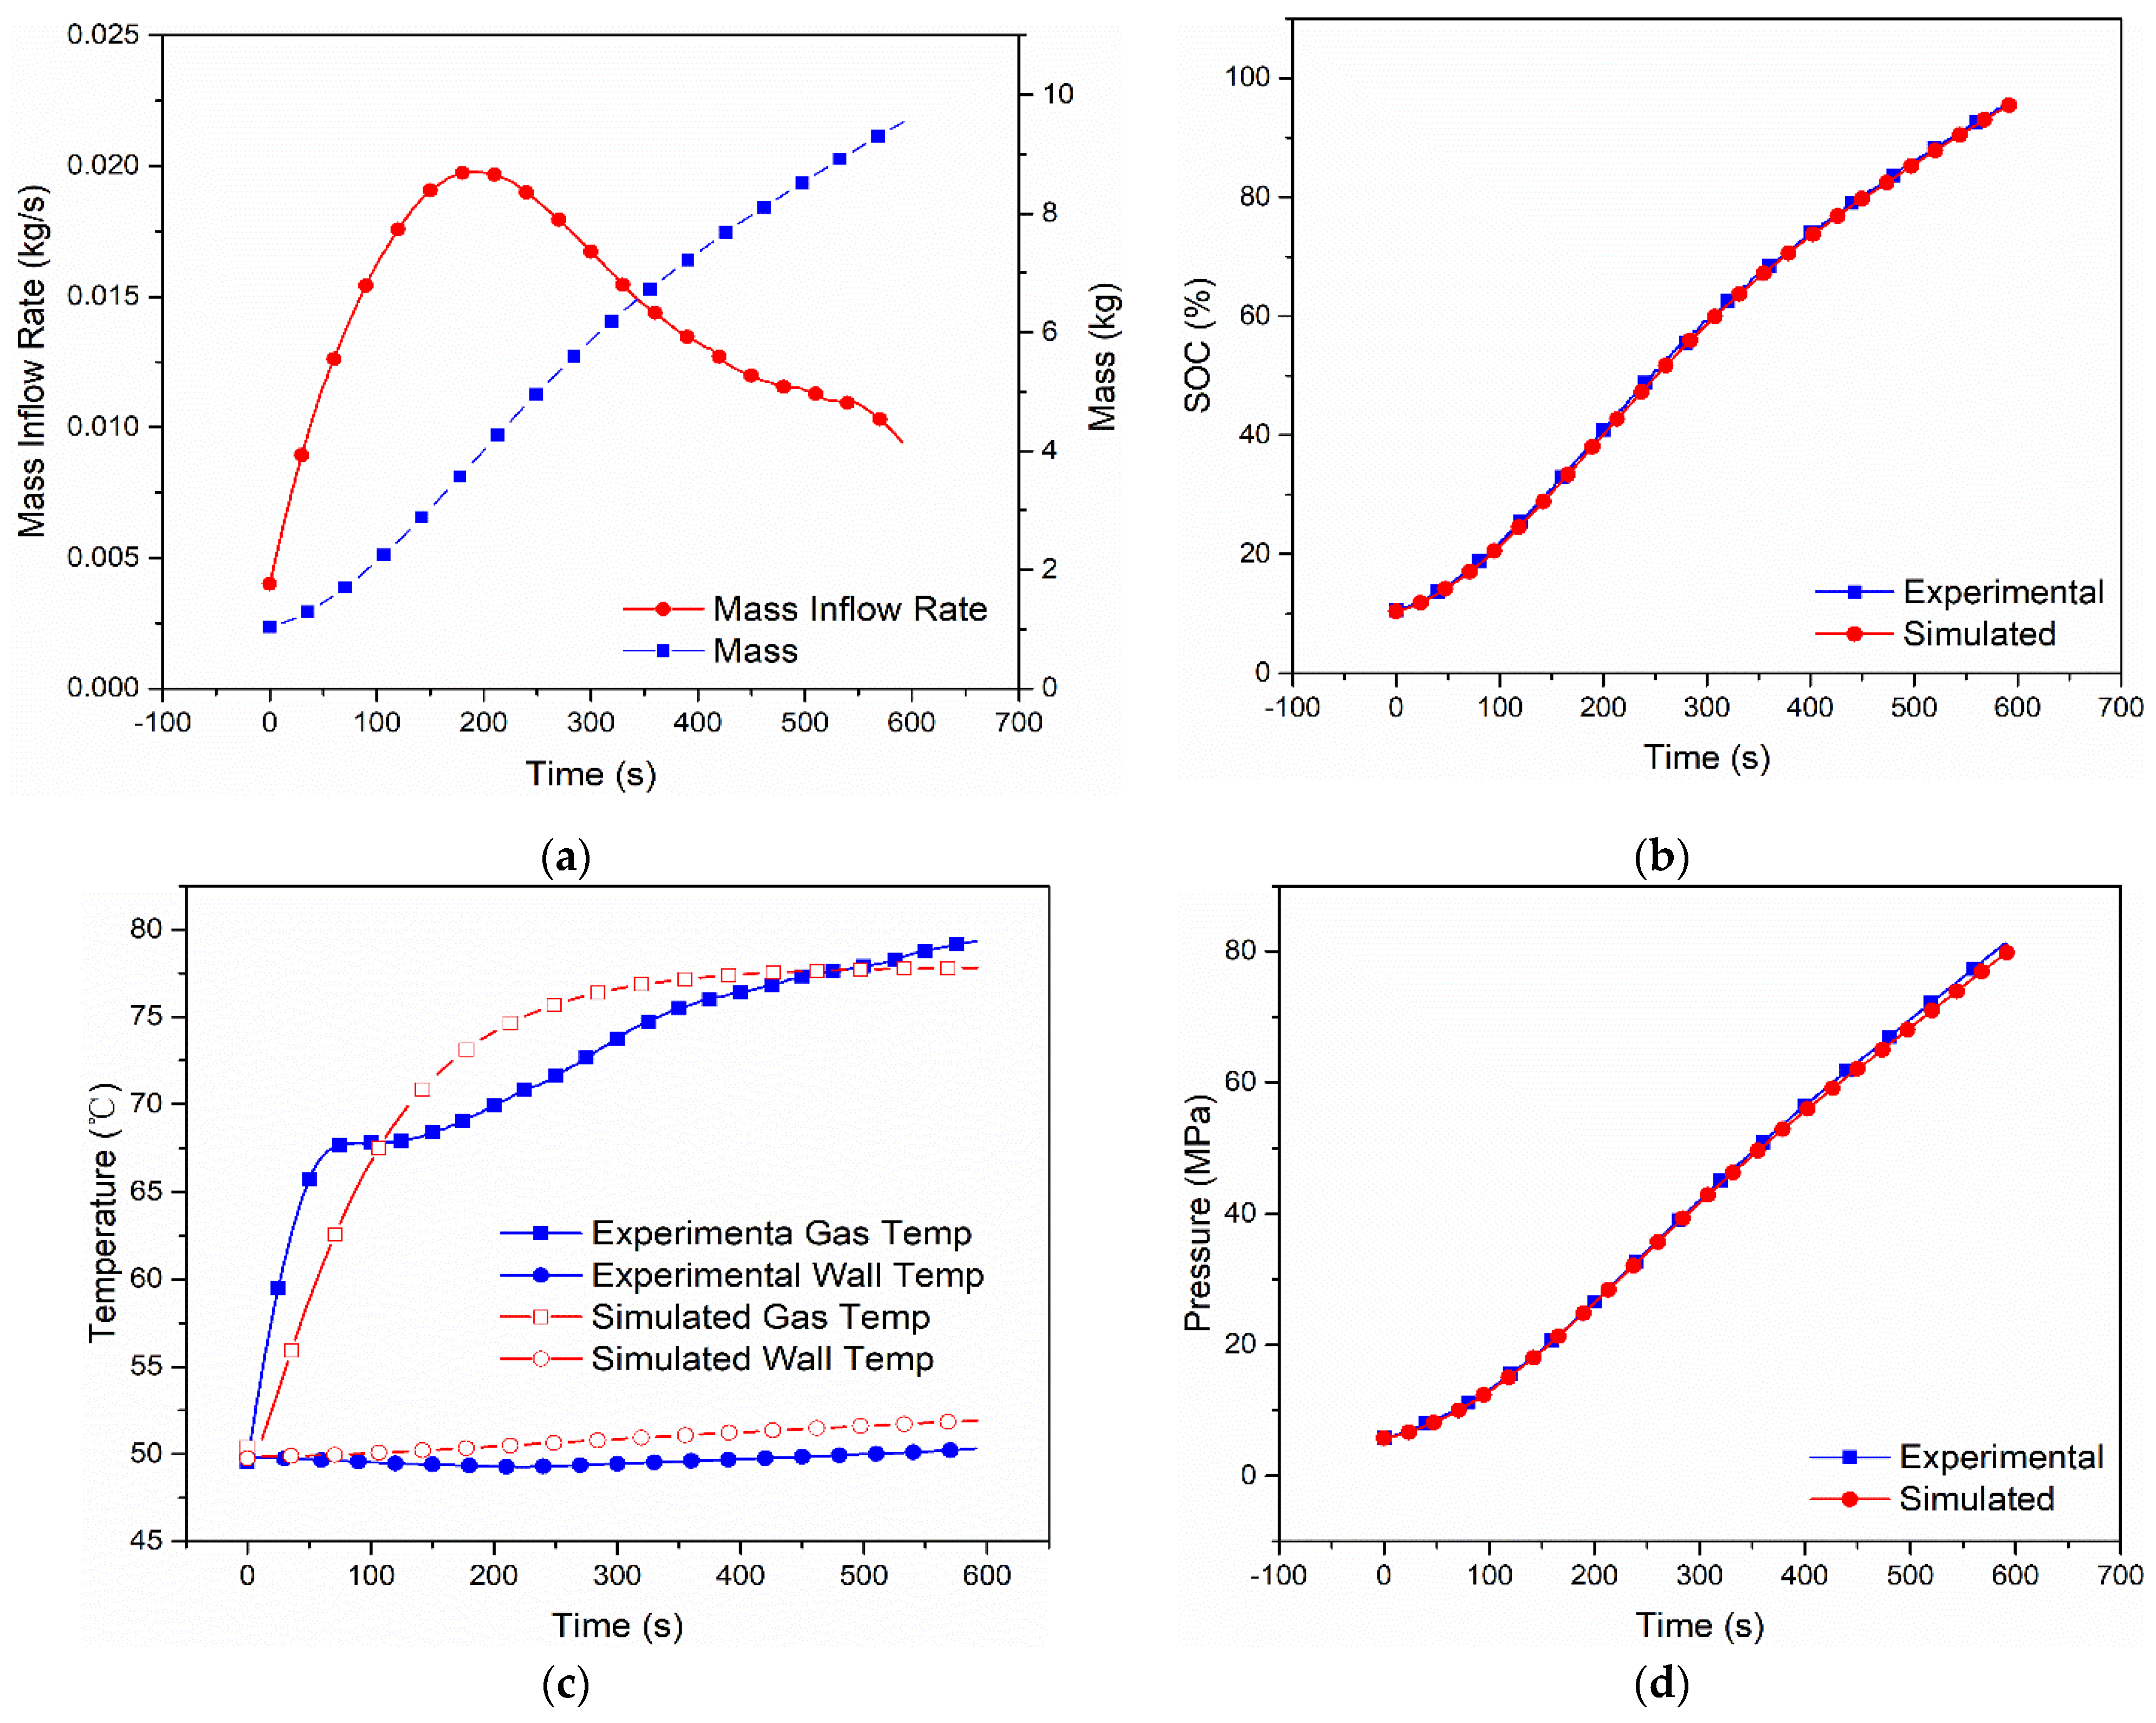
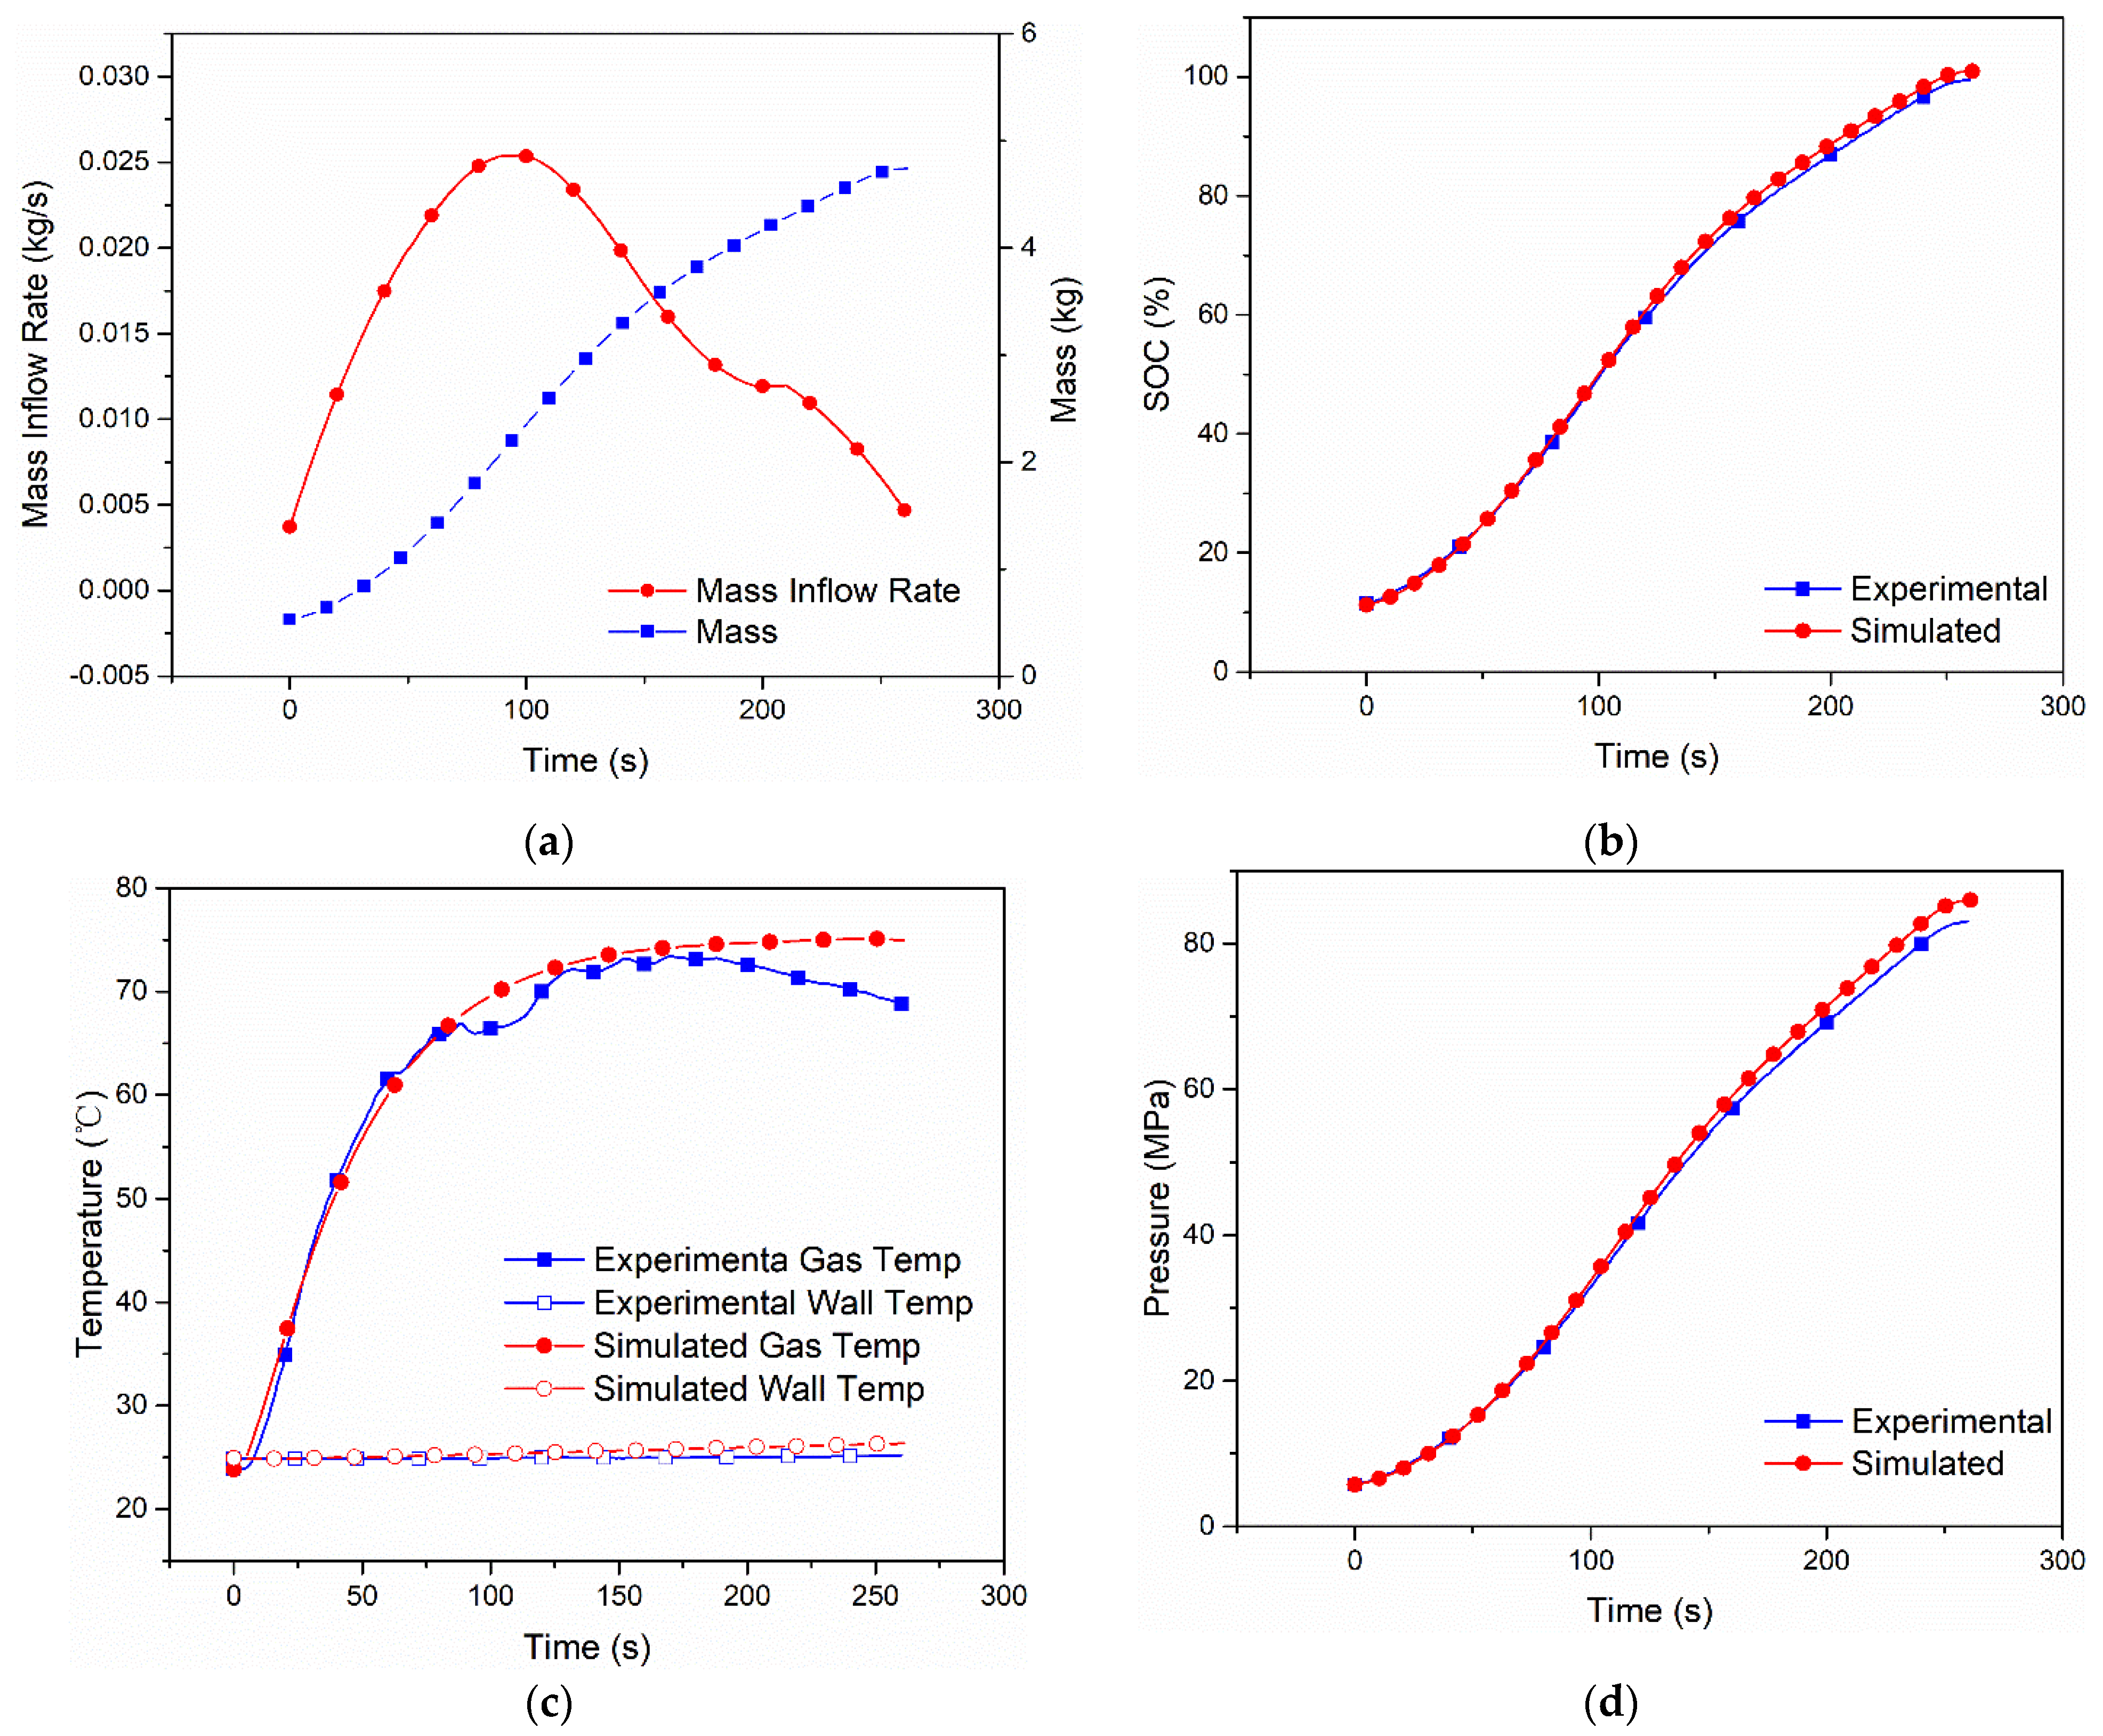
4.2. Results of Simulation of SAE J2601 Hydrogen Refueling Data

The five cases of refueling are simulated and the results are compared with the practical fueling process. The hydrogen mass inflow rate, initial hydrogen temperature, initial wall temperature, initial pressure and ambient temperature are the same as in the fueling experiment [9]. The hydrogen mass inflow rate and hydrogen mass data of the dual-zone model are shown in Figure 2a, Figure 3a, Figure 4a, Figure 5a and Figure 6a. The comparison between the results of hydrogen temperature, tank wall temperature and pressure simulated by the dual-zone model and MC method experiment is shown in Figure 2b–d, Figure 3b–d, Figure 4b–d, Figure 5b–d and Figure 6b–d.
Figure 1. Comparison of gas and wall temperatures (a) and pressure (b) between Lookup table fueling and MC Default fueling with Type IV 249 L tank under initial pressure 5.7 MPa [9].
Sustainability 15 01448 g001
Case 1 and Case 2 used the same Type IV compressed hydrogen tank with a volume of 249 L. For the experiment, Case 1 used the MC method for refueling, and Case 2 used the Lookup table method. Case 3, Case 4 and Case 5 used the Type IV compressed hydrogen tank with a volume of 117 L. All three cases used the MC method for the refueling experiment.
In those five cases, different initial fueling conditions were used with the dual-zone model. In order to compare, all the initial fueling conditions are consistent with the experimental conditions in the reference [9]. The initial temperature in the tank is 286 K to 323 K, the initial pressure in the tank is 0.83 Mpa to 5.76 Mpa and the fueling time is 261 s to 629 s. The gas inflow temperature in the five cases drops from ambient temperature to the pre-cooling temperature and is finally maintained at the pre-cooling temperature. In the simulation process, averaged gas inflow temperature is used, and the value of gas inflow temperature for five cases is around 245 K. These conditions improved the model’s adaptability.
The simulation results of Case 1 are shown in Figure 2. The variations in the mass flow rate and hydrogen mass with filling time are shown in Figure 2a. Since the mass flow rate used in the simulation is the same as that in the experimental data, the simulation result on hydrogen mass reaches a good agreement with the experimental result. The variations in SOC with filling time are shown in Figure 2b. At the end of the charging process, the experimental SOC is 97.2%, while the simulated SOC is 97.48%, so the relative error is 2.8%. The variations of hydrogen gas temperature and wall temperature with filling time are shown in Figure 3c. The hydrogen temperature and wall temperature start with the same initial temperature.
In Case 1, the initial hydrogen temperature and initial wall temperature are set as 48 °C and 49 °C. With filling time, the hydrogen temperature sharply increases, and the wall temperature smoothly increases. The highest hydrogen gas temperature and wall temperature in the simulation are 77.44 °C and 51.82 °C, while the experimental results of the highest hydrogen gas temperature and wall temperature are 79.7 °C and 49.78 °C, the differences are around 2 °C. This difference is caused by the layout of the temperature sensors and the model simplification of the tank wall, and it can be improved by using a more accurate tank wall model, such as a one-dimensional model. The variations in hydrogen pressure with filling time are shown in Figure 2d. The final hydrogen pressure in the simulation is 82.27 Mpa, while the experimental final hydrogen pressure is 83.09 Mpa, which indicates that the two curves have good consistency.
Figure 4. Measured mass inflow rate and calculated cumulative mass (a), comparison of SOC (b), gas and wall temperatures (c) and pressure (d) between the dual-zone model and MC Method experiment [9] of Case 3 with Type IV 117 L tank under initial pressure 5.76 MPa, ambient temperature 297 K.
Sustainability 15 01448 g004
Figure 5. Measured mass inflow rate and calculated cumulative mass (a), comparison of SOC (b), gas and wall temperatures (c) and pressure (d) between the dual-zone model and MC Method experiment [9] of Case 4 with Type IV 117 L tank under initial pressure 0.83 MPa, ambient temperature 286 K.
Sustainability 15 01448 g005
The simulation results of the other cases are shown in Figure 3, Figure 4, Figure 5 and Figure 6. In Case 2, as seen from the simulation shown in Figure 3, the final SOC is 95.39%, the highest hydrogen gas temperatures and wall temperatures are 77.81 °C and 51.91 °C, and the final hydrogen pressure is 79.8 Mpa, while, in the experiment, they are 95.70%, 79.33 °C, 50.32 °C and 81.19 Mpa. As shown in Figure 4, Figure 5 and Figure 6 (for Cases 3–5), as, the relative errors of SOC are 0.5% (Case 3), 2.0% (Case 4) and 0.2% (Case 5), the relative errors of the highest hydrogen gas temperature are 6.79% (Case 3), 2.92% (Case 4) and 7.34% (Case 5), the relative errors of the wall temperature 4.36% (Case 3), 10.55% (Case 4) and 3.47% (Case 5), and the relative error of hydrogen pressure is 3.45% (Case 3), 3.62% (Case 4) and 3.23% (Case 5).

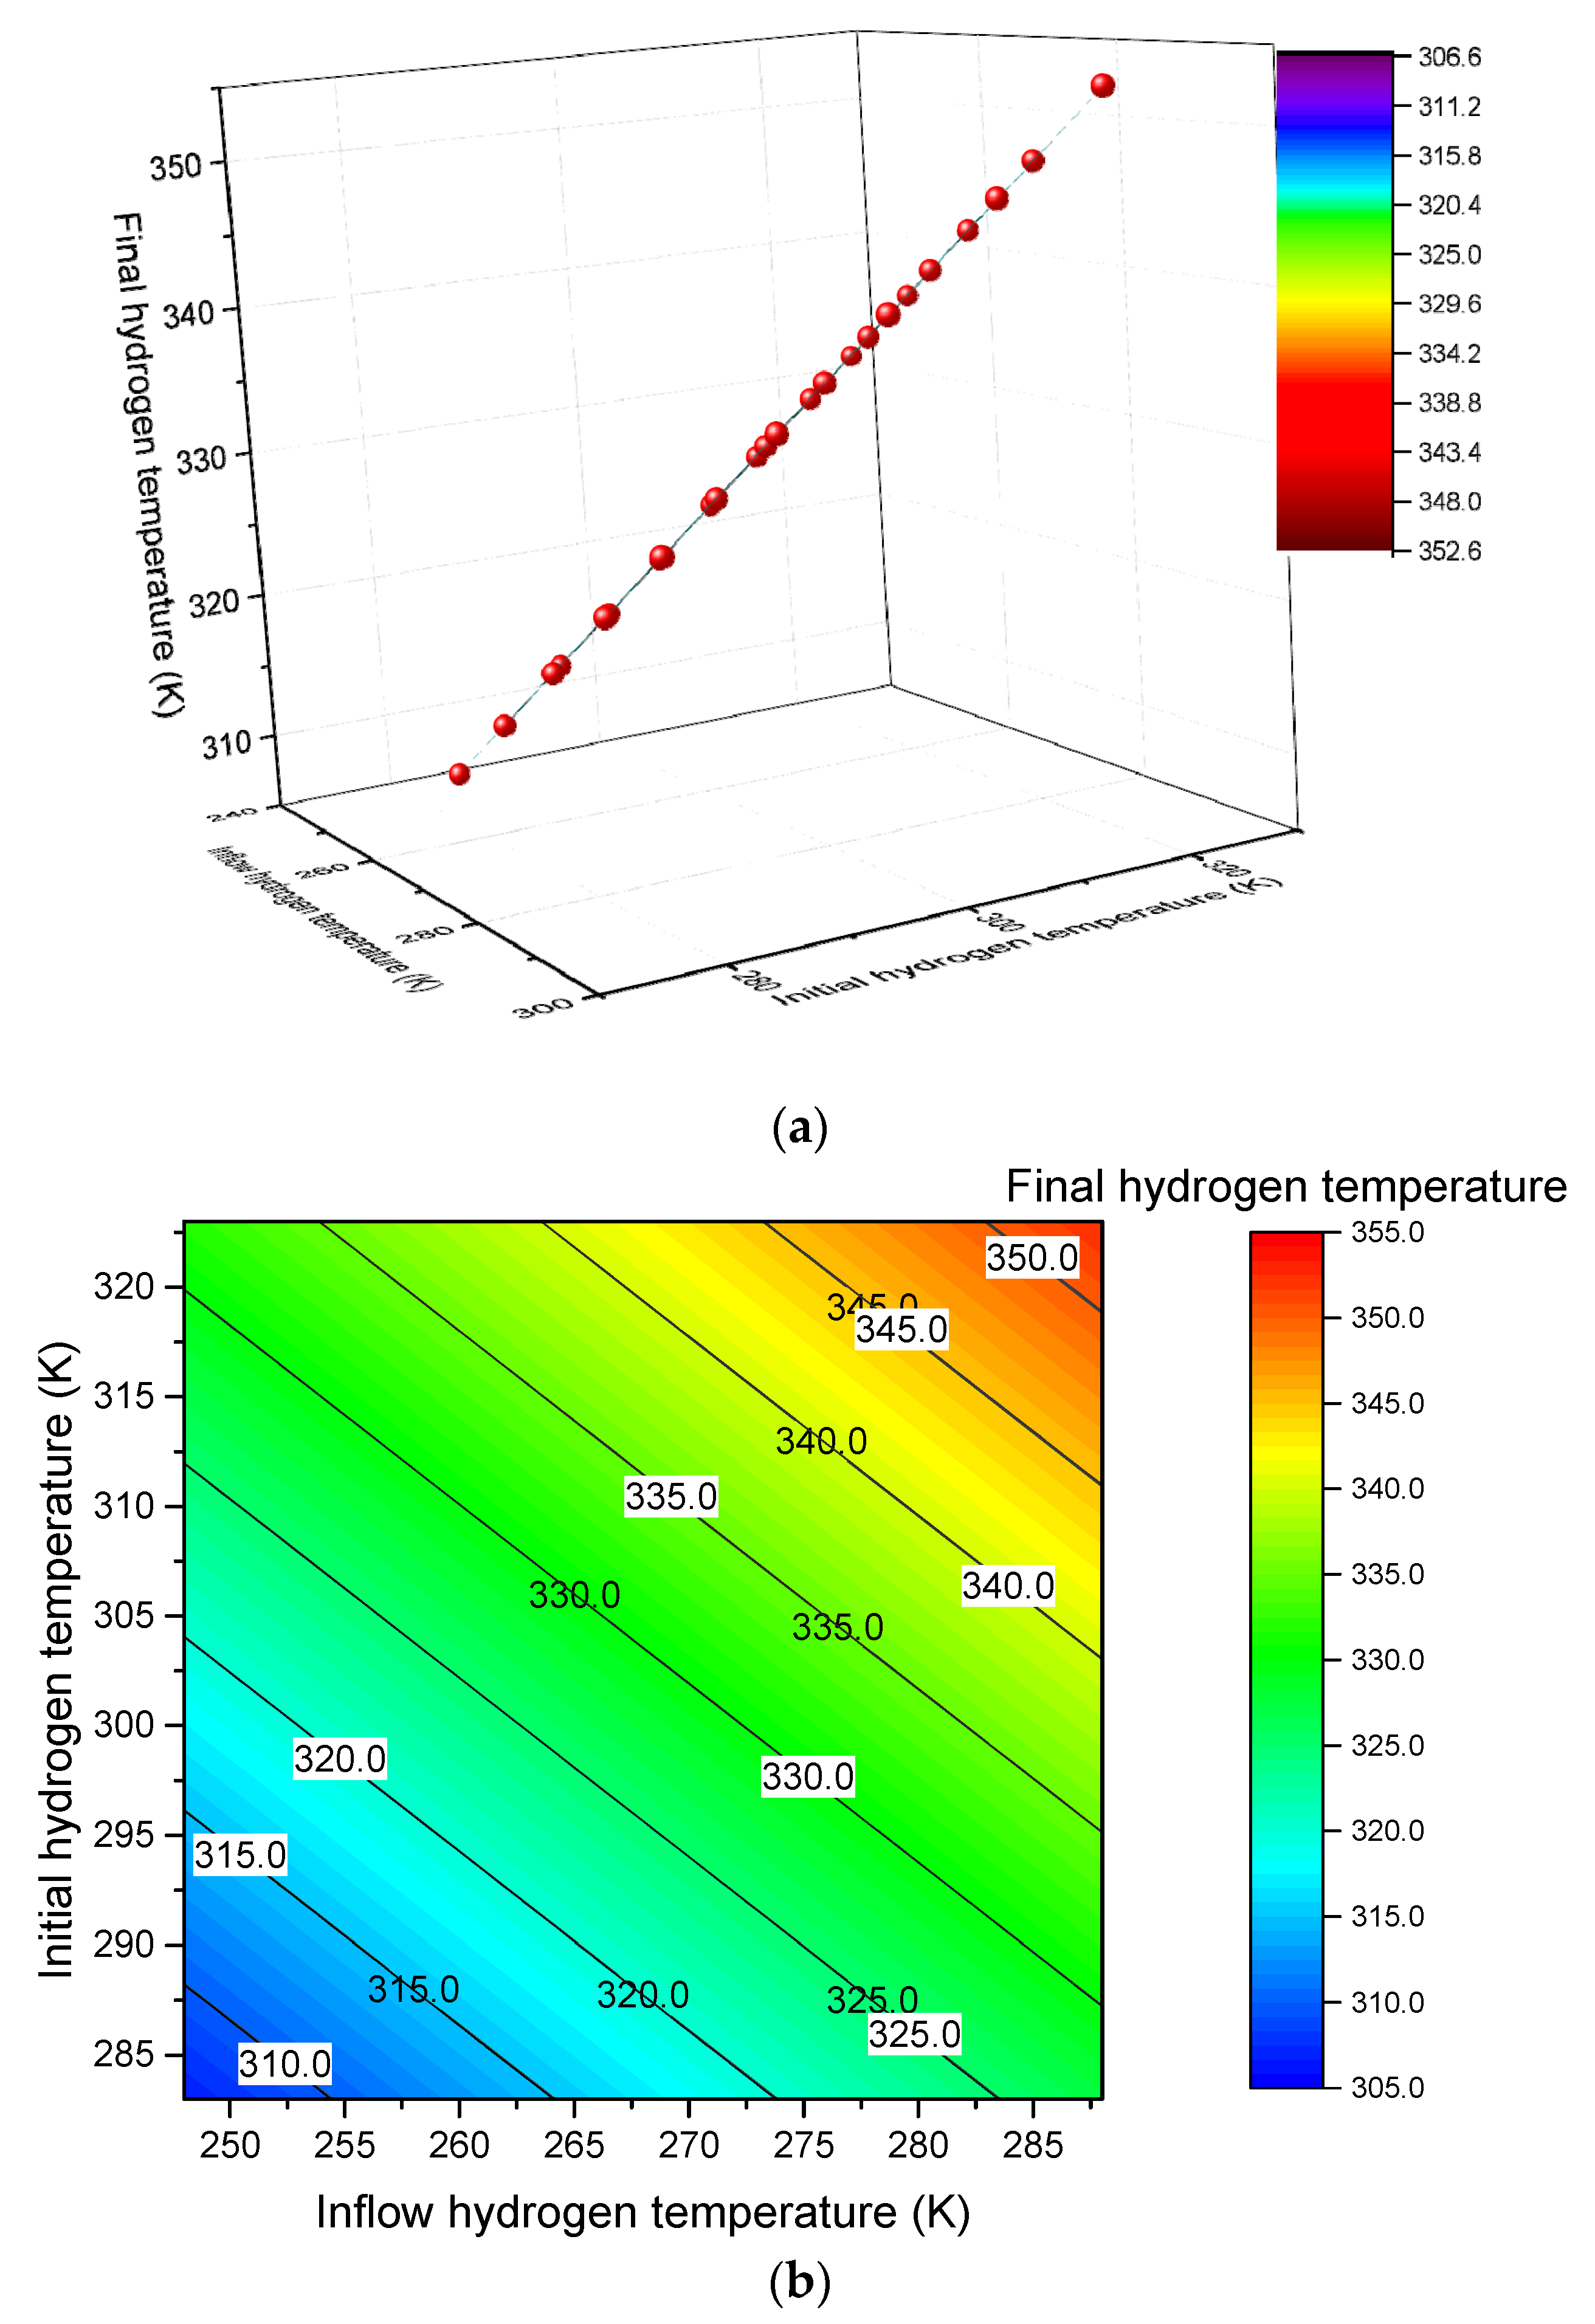
4.3. Determination of Final Hydrogen Temperature by Initial Hydrogen Temperature and Gas Inflow Hydrogen Temperature

Based on the dual-zone lumped parameter model, the simulation results of the 25 different charging cases have been calculated using a type IV tank of 117 L. The physical parameters of the tank are shown in Table 4. The key charge parameters, such as gas inflow hydrogen temperature T i and initial hydrogen temperature T 0 , are set with a certain gradient. The final hydrogen temperatures under the 25 charging cases with different initial and gas inflow hydrogen temperatures can be obtained using these parameters in the simulated model. Table 5 shows the values of the initial hydrogen temperature, the gas inflow temperature and the final hydrogen temperature of the 25 charging cases.
According to the analytical solution of the hydrogen temperature, the hydrogen temperature can be expressed by the initial hydrogen temperature and the gas inflow temperature [29], as shown in Equation (11).
T = μ T 0 + 1 μ 1 + α γ T i + α T 0
where μ = μ 1 + α , μ is initial mass fraction, γ is the ratio of constant-pressure heat capacity to constant-volume heat capacity and α is the dimensionless heat transfer coefficient. Herein, Origin software is utilized to express the function relationship between the final, initial and inlet hydrogen temperatures. Equation (11) acts as the fitting function. μ , γ and α are the fitting parameters. Two kinds of fitting methods are used. One is the three-dimensional curve fitting, and the other is the contour fitting. To simplify the fitting process, the parameter α is fixed as 0. Figure 7 shows the fitting results, where all data points in Figure 7b fall on the plane. Table 6 shows the values of the fitting parameters. According to the values of the fitting parameters from Table 6, the final mathematic expression can be written as follows:
T = 0.63185 T 0 + 0.51566 T
This expression is supposed to control the process of hydrogen refueling into a tank.
Figure 6. Measured mass inflow rate and calculated cumulative mass (a), comparison of SOC (b), gas and wall temperatures (c) and pressure (d) between the dual-zone model and MC Method experiment [9] of Case 5 with Type IV 117 L tank under initial pressure 5.68 MPa, ambient temperature 313 K.
Sustainability 15 01448 g006
Figure 7. Results of the three-dimensional curve fitting (a) and the results of the contour fitting (b).
Sustainability 15 01448 g007

5. Discussion

In Figure 2a, Figure 3a, Figure 4a, Figure 5a and Figure 6a, the mass inflow rates are not constant, and the data are obtained from the actual refueling process to simulate the actual refueling process. The mass inflow rates change during the refueling process. The changing inflow rate is adopted with the actual refueling condition. Hydrogen storage hydrogen quality m regarding the derived function of the refueling time t is mass inflow rate m ˙ . According to the Newton-Leibniz formula, the hydrogen mass can be integrated when the initial hydrogen mass is known, and the refueling time and inflow rate can be given.
The hydrogen mass accumulated in the tank is calculated by integrating the measured mass flow rate. The SOC can be expressed as the ratio of the hydrogen mass to the one in the tank at NWP (nominal working pressure) 70 MPa and the standard temperature of 15 °C. Figure 2b, Figure 3b, Figure 4b, Figure 5b and Figure 6b show good matches between experimental data and simulated data for the tank with 249 L and 117 L. Both curves have the same trend, and the difference between experimental and simulated SOC is small for each refueling. In five cases, the relative error of SOC is between 0.20% and 3.2%, which means the dual-zone model can well calculate the SOC during the refueling process for different tanks.
The simulated hydrogen temperatures using the constant heat transfer coefficient and the averaged hydrogen inflow temperature show good agreement with the experimental hydrogen temperatures. Therefore, the dual-zone lumped parameter model can well predict the hydrogen temperature and further predict the pressure in the tank through the well-predicted hydrogen mass and the hydrogen temperature by using the real gas equation of state. In Figure 2c, Figure 3c, Figure 4c, Figure 5c and Figure 6c, there is a slight difference between experimental gas temperature and simulated gas temperature, and the maximum value of the difference is about 5 °C, and the relative error of the gas temperature is as high as 7.34% and as low as 1.95%. There are two reasons which caused this. (1) Constant heat transfer coefficients used in each model are different from real situations. In the actual refueling process, the heat transfer coefficient is the function of many factors, such as gas inflow rate, pressure, etc. Therefore, it is difficult to calculate the real heat transfer coefficient. Furthermore, the real heat transfer coefficient changes during the process. (2) The gas inflow temperature is not constant for those five cases. They change during the process. At the start of fueling, the gas inflow temperature is almost the same as the environment temperature. As the refueling process continues, the gas inflow temperature gradually cools down and finally reaches the pre-cooling temperature setting. These reasons have an impact on the results of the simulation.
For wall temperature, in Figure 2c, Figure 3c, Figure 4c, Figure 5c and Figure 6c, the simulated wall temperature is higher than the experimental temperature in each case, which is caused by the experimental conditions. In the experiment, the temperatures of four points on the external surface of the tank wrap are measured, and the experimental wall temperatures used in this paper are the average values of those measured data. The heat transfer coefficient between the wrap surface and the environment is large, so the wall temperature slightly changes during the fueling process. The wall temperature represents a mean temperature averaged alone with the radial direction in the dual-zone lumped parameter model. As already known, the wall temperature of the tank gradually decreases from the inside to the outside in the radial direction during the fueling process, and the external surface of the tank wrap has the lowest temperature. Therefore, the simulated data is higher than the experimental data. The pressure in the tank is calculated by gas temperature and hydrogen mass with a real gas equation of state. Figure 2d, Figure 3d, Figure 4d, Figure 5d and Figure 6d show good agreement between experimental data and simulated data using hydrogen temperature and the well-predicted hydrogen mass.

6. Conclusions

The dual-zone lumped parameter model has been used to simulate five SAE J2601 hydrogen refueling tests (cases). The simulation results are compared with experimental data under same fueling condition as the experiment. As seen from the simulated results of the five cases, the following conclusions could be drawn:
(1)
The dual-zone lumped parameter model has good ability to express the reference data, so that the model would be utilized to predict the SOC in other practices.
(2)
The heat transfer between hydrogen and the tank wall is complicated. Accurate modeling of heat transfer coefficients is somewhat difficult, which will be the direction of our future efforts.
(3)
The dual-zone lumped parameter model can also well predict the hydrogen temperature and further predict the pressure in the tank from this hydrogen temperature and the well-predicted hydrogen mass by using the real gas equation of state.
(4)
The maximum difference between simulated and experimental wall temperatures for five cases is around 2 °C. The experimental wall temperatures were measured on the outer tank wrap surface where the thermocouples attach. In the dual-zone lumped parameter model, the simulated wall temperature is representative of a mean temperature averaged alone with the radial direction, which is higher than the external surface temperature of the tank wrap.
(5)
The analytical solution of the hydrogen temperature deduced by the dual-zone lumped parameter model can be used to determine the functional relationship between the final hydrogen temperature with the initial and gas inflow hydrogen temperatures. The three-dimensional surface and the contour fitting can be carried out using Origin software.
(6)
With the fitted results, the mathematical relationship between the final, initial and inlet hydrogen temperatures under certain charge conditions can be obtained, further estimating the final fueling state of the hydrogen. In the future, we will continue to derive the analytical solutions for the inflow temperature, the final SOC and the hydrogen pressure in the tank.
A three-zone lumped parameter model or hydrogen gas lumped parameter model, plus a one-dimensional wall model, will help improve the accuracy of simulated wall temperatures. The lumped parameter modeling of hydrogen storage tanks and the derivation of related analytical solutions are the major contributions of our team in this field. Although compared with the CFD model, the lumped parameter model cannot accurately express the temperature distribution in the tank. However, the filling experiment shows that the hydrogen temperature distribution in the tank is relatively uniform in a short filling time, so our lumped parameter model is sufficient. The lumped parameter model takes less time to calculate, and it is easy to derive an analytical solution, which in turn facilitates integration with other modeling processes.

Author Contributions

Conceptualization, J.X. and T.Y.; methodology, J.X. and S.D.; software, F.L. and F.Y.; validation, F.L. and F.Y.; formal analysis, S.D. and H.L.; investigation, S.D. and H.L.; writing—original draft preparation, S.D. and F.L.; writing—review and editing, J.X., T.Y. and R.C.; supervision, R.C.; project administration, T.Y.; funding acquisition, J.X. All authors have read and agreed to the published version of the manuscript.

Funding

This research was funded by the National Natural Science Foundation of China (52176191, 51476120), the Science and Technology Innovation Project of Jianghan University (2021kjzx005), the Natural Science Foundation of Liaoning Province (2020-CSLH-43), the 111 Project of China (B17034), and the Innovative Research Team Development Program of Ministry of Education of China (IRT_17R83).

Institutional Review Board Statement

Not applicable.

Informed Consent Statement

Not applicable.

Data Availability Statement

The data are contained within the article.

Conflicts of Interest

The authors declare no conflict of interest.

References

  1. Hoel, M.; Kverndokk, S. Depletion of fossil fuels and the impacts of global warming. Resour. Energy Econ. 1996, 18, 115–136. [Google Scholar] [CrossRef]
  2. Gregg, J.S.; Andres, R.J.; Marland, G. China: Emissions pattern of the world leader in CO2 emissions from fossil fuel consumption and cement production. Geophys. Res. Lett. 2008, 35, L08806. [Google Scholar] [CrossRef]
  3. Benton, M.J.; Wills, M.A.; Hitchin, R. Quality of the fossil record through time. Nature 2000, 403, 534. [Google Scholar] [CrossRef] [PubMed]
  4. Suryan, A.; Kim, H.D.; Setoguchi, T. Comparative study of turbulence models performance for refueling of compressed hydrogen tank. Int. J. Hydrogen Energy 2014, 48, 9562–9569. [Google Scholar] [CrossRef]
  5. Dunn, S. Hydrogen futures: Toward a sustainable energy system. Int. J. Hydrogen Energy 2002, 27, 235–264. [Google Scholar] [CrossRef]
  6. Elam, C.C.; Padró, C.E.G.; Sandrock, G. Realizing the hydrogen future: The International Energy Agency’s efforts to advance hydrogen energy technologies. Int. J. Hydrogen Energy 2003, 28, 601–607. [Google Scholar] [CrossRef]
  7. Zheng, J.; Liu, X.; Xu, P. Development of high pressure gaseous hydrogen storage technologies. Int. J. Hydrogen Energy 2012, 37, 1048–1057. [Google Scholar] [CrossRef]
  8. SAE J2601_202005: Fueling Protocols for Light Duty Gaseous Hydrogen Surface Vehicles. Available online: https://www.sae.org/standards/content/j2601_202005/ (accessed on 1 January 2023).
  9. SAE J2601_201407: Fueling Protocols for Light Duty Gaseous Hydrogen Surface Vehicles. Available online: https://www.sae.org/standards/content/j2601_201407/ (accessed on 1 January 2023).
  10. SAE J2601_201612: Fueling Protocols for Light Duty Gaseous Hydrogen Surface Vehicles. Available online: https://www.sae.org/standards/content/j2601_201612/ (accessed on 1 January 2023).
  11. Harty, R.; Mathison, S. Improving hydrogen tank refueling performance through the use of an advanced fueling algorithm-the MC method. In Proceedings of the National Hydrogen Association Conference, Long Beach, CA, USA, 3–6 May 2010. [Google Scholar]
  12. Mathison, S.; Handa, K.; McGuire, T.; Brown, T. Field validation of the MC default fill hydrogen fueling protocol. SAE Int. J. Altern. Powertrains 2015, 4, 140–144. [Google Scholar] [CrossRef]
  13. Schneider, J.; Meadows, G.; Mathison, S.; Veenstra, M. Validation and sensitivity studies for SAE J2601, the light duty vehicle hydrogen fueling standard. SAE Int. J. Altern. Powertrains 2014, 4, 257–409. [Google Scholar] [CrossRef]
  14. Mathison, S.; Harty, R. Application of MC method-based H2 fueling. In Proceedings of the SAE 2012 World Congress & Exhibition, Detroit, MI, USA, 24–26 April 2012. [Google Scholar]
  15. Reddi, K.; Elgowainy, A.; Rustagi, N. Impact of hydrogen SAE J2601 fueling methods on fueling time of light-duty fuel cell electric vehicles. Int. J. Hydrogen Energy 2017, 42, 16675–16685. [Google Scholar] [CrossRef]
  16. Melideo, D.; Baraldi, D. Erratum to “CFD analysis of fast filling strategies for hydrogen tanks and their effects on key-parameters”. Int. J. Hydrogen Energy 2015, 40, 6260–6268. [Google Scholar] [CrossRef]
  17. Striednig, M.; Brandstätter, S.; Sartory, M. Thermodynamic real gas analysis of a tank filling process. Int. J. Hydrogen Energy 2014, 39, 8495–8509. [Google Scholar] [CrossRef]
  18. Galassi, M.C.; Baraldi, D.; Iborra, B.A. CFD analysis of fast filling scenarios for 70 MPa hydrogen type IV tanks. Int. J. Hydrogen Energy 2012, 37, 6886–6892. [Google Scholar] [CrossRef]
  19. Suryan, A.; Kim, H.D.; Setoguchi, T. Numerical analysis on thermo-fluid dynamic behavior of hydrogen gas during fast high pressure filling. J. Mech. Sci. Technol. 2013, 27, 567–573. [Google Scholar] [CrossRef]
  20. The Hydrogen Data-Sharing Site. Available online: http://www.h2protocol.com/h2-fueling-data/ (accessed on 1 January 2023).
  21. Ebru, G.; Mehmet, G.G.; Taner, B. Multi-period planning of hydrogen refuelling stations using flow data: A case study for Istanbul. Int. J. Hydrogen Energy 2022, 47, 40138–40155. [Google Scholar]
  22. Tim, B.; Hilary, K. Analysis of customer queuing at hydrogen stations. Int. J. Hydrogen Energy 2022, 47, 17107–17120. [Google Scholar]
  23. Matteo, G.; David, B.; Michael, D.; Petronilla, F. Hydrogen losses in fueling station operation. J. Clean. Prod. 2020, 248, 119266. [Google Scholar]
  24. Matteo, G.; David, B.; Michael, D.; Petronilla, F. Hydrogen station in situ back-to-back fueling data for design and modeling. J. Clean. Prod. 2021, 329, 129737. [Google Scholar]
  25. Xiao, J.S.; Wang, X.; Benard, P.; Chahine, R. Determining hydrogen pre-cooling temperature from refueling parameters. Int. J. Hydrogen Energy 2016, 41, 16416–16421. [Google Scholar] [CrossRef]
  26. Xiao, J.S.; Benard, P.; Chahine, R. Charge-discharge cycle thermodynamics for compression hydrogen storage system. Int. J. Hydrogen Energy 2016, 41, 5541–5549. [Google Scholar] [CrossRef]
  27. Xiao, J.S.; Wang, X.; Zhou, X.; Bénard, P.; Chahine, R. A dual zone thermodynamic model for refueling hydrogen vehicles. Int. J. Hydrogen Energy 2019, 44, 8780–8790. [Google Scholar] [CrossRef]
  28. National Institute of Standards and Technology (NIST). Reference Fluid Thermodynamic and Transport Properties Database (REFPROP) Version 9.0 [Software]. 2010. Available online: https://www.nist.gov/srd/refprop (accessed on 1 January 2023).
  29. Xiao, J.S.; Benard, P.; Chahine, R. Estimation of final hydrogen temperature from refueling parameters. Int. J. Hydrogen Energy 2017, 42, 7521–7528. [Google Scholar] [CrossRef]
Figure 2. Measured mass inflow rate and calculated cumulative mass (a), comparison of SOC (b), gas and wall temperatures (c) and pressure (d) between the dual-zone model and MC Method experiment [9] of Case 1 with Type IV 249 L tank under initial pressure 5.5 MPa, ambient temperature 323 K.
Sustainability 15 01448 g002
Figure 3. Measured mass inflow rate and calculated cumulative mass (a), comparison of SOC (b), gas and wall temperatures (c) and pressure (d) between the dual-zone model and MC Method experiment [9] of Case 2 with Type IV 249 L tank under initial pressure 5.7 MPa, ambient temperature 323 K.
Sustainability 15 01448 g003
Table 1. Parameters of Type IV 249 L and Type IV 117 L tanks.
ParameterDescriptionType IV 249 LType IV 117 L
NWP (MPa)Nominal working pressure of tank7070
m s (kg)Storage capacity of tank9.84.7
A in (m2)Inner surface area of tank2.21.3
A out (m2)External surface area of tank2.71.6
V (m3)Volume of tank0.2490.117
m w in (kg)Mass of the lining10.15.6
m w out (kg)Mass of the wrap135.682.7
m w (kg)Mass of the wall145.788.1
c w in (J/(kg·K))Heat capacity of the lining21002100
c w out (J/(kg·K))Heat capacity of the wrap11201120
c w (J/(kg·K))Heat capacity of the wall11881185
Table 2. Material properties of hydrogen and heat transfer coefficient.
ParameterDescriptionValue
c p (J/(kg·K))Constant-pressure heat capacity of hydrogen14,700
c v (J/(kg·K))Constant-volume heat capacity of hydrogen10,500
M H 2 (kg/mol)Molecular weight of hydrogen2.0159 × 10−3
a in (W/(m2·K))Heat transfer coefficient between gas and wall80
a out (W/(m2·K))Heat transfer coefficient between wall and environment20
Table 3. Initial fueling conditions for five cases [9].
ParameterDescriptionCase 1Case 2Case 3Case 4Case 5
V (L)Volume of tank249249117117117
p 0 (MPa)Initial pressure in the tank5.55.75.760.835.68
T 0 (K)Initial temperature in the tank323323297286313
t (s)Refueling time629591261268329
T i (K)Gas inflow temperature248243248243240
Table 4. The values of the physical parameter of the tank [9].
ParameterDescriptionType IV
Ain (m2)Inner surface area of tank1.3
Aout (m2)External surface area of tank1.6
V (m3)Volume of tank0.117
mw (kg)Mass of the wall88.1
cw (J/kg/K)Heat capacity of the wall1185
p0 (MPa)Initial pressure in the tank5.76
t (s)Refueling time261
Table 5. The values of the initial hydrogen temperature, the gas inflow temperature and the final hydrogen temperature of the 25 charging cases.
Initial Hydrogen TemperatureInflow Hydrogen Temperature
248 (K)258 (K)268 (K)278 (K)288 (K)
323 (K)331.9487337.1256342.3025347.4795352.6564
313 (K)325.6366330.8094335.9823341.1552346.3281
303 (K)319.3178324.4864329.6549334.8235339.992
293 (K)312.9917318.1557323.3196328.4835333.6474
283 (K)306.6575311.8165316.9755322.1344327.2934
Table 6. The values of the fitting parameter among the three-dimensional curve fitting.
ParameterFitting ValueStandard ErrorR-Square
μ 0.515663.01394 × 10−40.9999
γ 1.304562.65436 × 10−40.9999
Disclaimer/Publisher’s Note: The statements, opinions and data contained in all publications are solely those of the individual author(s) and contributor(s) and not of MDPI and/or the editor(s). MDPI and/or the editor(s) disclaim responsibility for any injury to people or property resulting from any ideas, methods, instructions or products referred to in the content.

